IBL-GML Amalgamation - AXYS Group · Jun-16 2 Rationale IBL’s board recommended the amalgamation...
18
IBL-GML Amalgamation Our View
Transcript of IBL-GML Amalgamation - AXYS Group · Jun-16 2 Rationale IBL’s board recommended the amalgamation...

IBL-GMLAmalgamation
Our View
Jun-16 2
Rationale
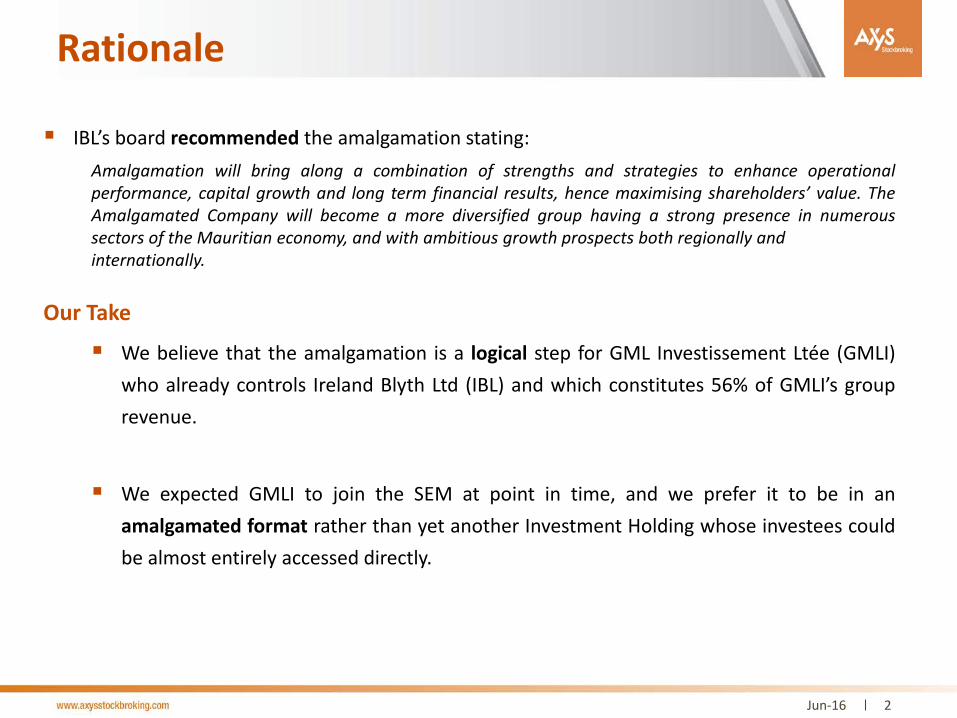
IBL’s board recommended the amalgamation stating:Amalgamation will bring along a combination of strengths and strategies to enhance operationalperformance, capital growth and long term financial results, hence maximising shareholders’ value. TheAmalgamated Company will become a more diversified group having a strong presence in numeroussectors of the Mauritian economy, and with ambitious growth prospects both regionally andinternationally.
Our Take
We believe that the amalgamation is a logical step for GML Investissement Ltée (GMLI)who already controls Ireland Blyth Ltd (IBL) and which constitutes 56% of GMLI’s grouprevenue.
We expected GMLI to join the SEM at point in time, and we prefer it to be in anamalgamated format rather than yet another Investment Holding whose investees couldbe almost entirely accessed directly.

Jun-16 3
Shareholding
Voting Rights
GML Shareholders
SWANLBMHL
Public
74%
7%5%
14%
90%
3%2% 5%
GML Sharehol
dersSWANL
BMHL
Public
48%
14%
11%
27%
IBL Before IBL Ltd After
Economic Rights
Like other large family owned conglomerates before it, the amalgamated IBL Ltd will have a separate class of shares which will carry voting rights thereby making it impregnable to “highly dreaded” hostile takeovers
Jun-16 4
Group Structure
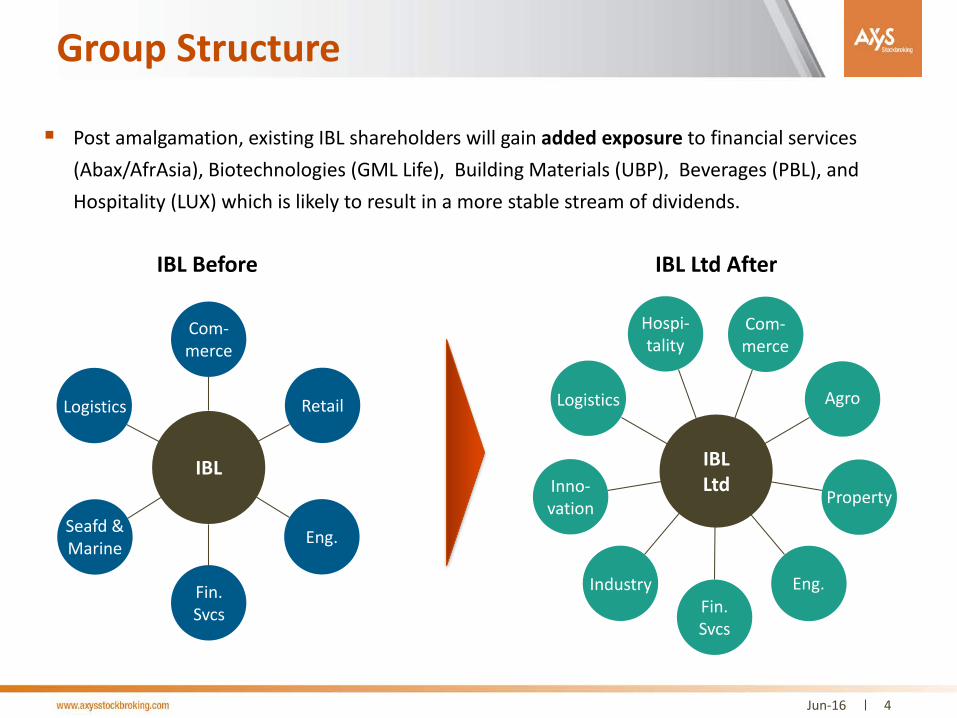
Post amalgamation, existing IBL shareholders will gain added exposure to financial services (Abax/AfrAsia), Biotechnologies (GML Life), Building Materials (UBP), Beverages (PBL), and Hospitality (LUX) which is likely to result in a more stable stream of dividends.
IBL Before IBL Ltd After
Com-merce
Retail
Eng.
Fin.Svcs
Seafd & Marine
Logistics
IBL IBLLtd
Fin.Svcs
Com-merce
Agro
Eng.Industry
Logistics
PropertyInno-vation
Hospi-tality
Jun-16 5
Key Events Timeline
-100
-60
-20
20
60
100
140
180
220
260
75
80
85
90
95
100
105
110
115
120
Serie
s = 1
00 o
n 3
1-M
ay-2
016
MSCI FM SEMDEXALCAPEX-12 IBLBEEP (Uses right y-axis)
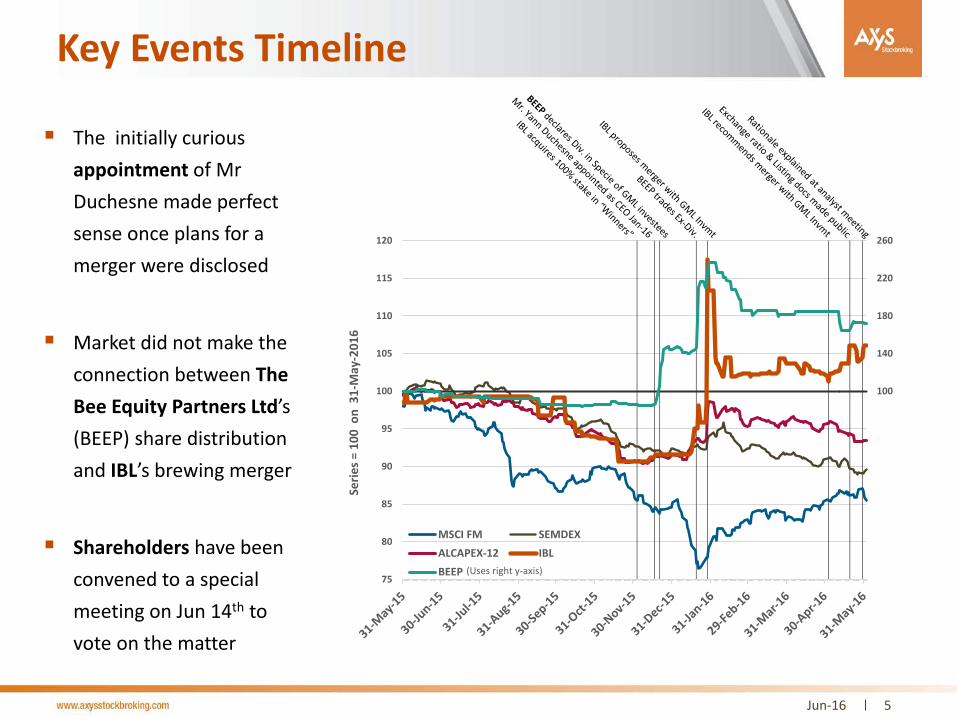
The initially curious appointment of MrDuchesne made perfect sense once plans for a merger were disclosed
Market did not make the connection between The Bee Equity Partners Ltd’s(BEEP) share distribution and IBL’s brewing merger
Shareholders have been convened to a special meeting on Jun 14th to vote on the matter
Investigating Fairness
for IBL minority shareholders
8-Jun-16 6

Jun-16 7
Executive Summary
Having analysed the exchange ratios and valuations – which we mostly disagree with – carriedout for the purpose of amalgamation, we nevertheless conclude that IBL minority shareholdersare being offered quite a fair deal
Although the minority shareholder is being indirectly stripped of his voting rights – which froma big picture perspective does not change much for him given that GMLI already controlled IBL– the boosted exchange ratio provides a generous compensation
We recommend that IBL shareholders vote in favour of the proposed amalgamationat the special shareholder meeting which will be held on June 14th
Our Analysis
In the slides that follow, we will offer our opinion on the determination of the exchangeratio
We take – first and foremost – a “market based” approached because we believe theMauritian Bourse – despite its quirks or tardiness – is generally efficient
Jun-16 8
Market Liquidity
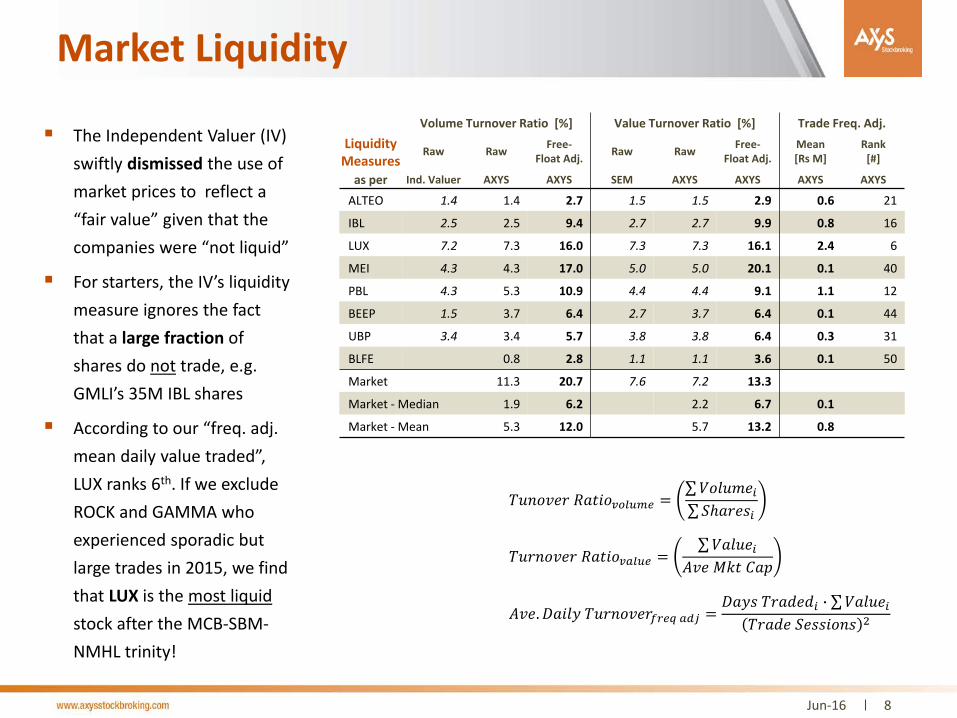
The Independent Valuer (IV) swiftly dismissed the use of market prices to reflect a “fair value” given that the companies were “not liquid”
For starters, the IV’s liquidity measure ignores the fact that a large fraction of shares do not trade, e.g. GMLI’s 35M IBL shares
According to our “freq. adj. mean daily value traded”, LUX ranks 6th. If we exclude ROCK and GAMMA who experienced sporadic but large trades in 2015, we find that LUX is the most liquid stock after the MCB-SBM-NMHL trinity!
Liquidity Measures
Volume Turnover Ratio [%] Value Turnover Ratio [%] Trade Freq. Adj.
Raw Raw Free-Float Adj. Raw Raw Free-
Float Adj.Mean[Rs M]
Rank[#]
as per Ind. Valuer AXYS AXYS SEM AXYS AXYS AXYS AXYS
ALTEO 1.4 1.4 2.7 1.5 1.5 2.9 0.6 21
IBL 2.5 2.5 9.4 2.7 2.7 9.9 0.8 16
LUX 7.2 7.3 16.0 7.3 7.3 16.1 2.4 6
MEI 4.3 4.3 17.0 5.0 5.0 20.1 0.1 40
PBL 4.3 5.3 10.9 4.4 4.4 9.1 1.1 12
BEEP 1.5 3.7 6.4 2.7 3.7 6.4 0.1 44
UBP 3.4 3.4 5.7 3.8 3.8 6.4 0.3 31
BLFE 0.8 2.8 1.1 1.1 3.6 0.1 50
Market 11.3 20.7 7.6 7.2 13.3
Market - Median 1.9 6.2 2.2 6.7 0.1
Market - Mean 5.3 12.0 5.7 13.2 0.8
𝑇𝑇𝑇𝑇𝑇𝑇𝑇𝑇𝑇𝑇𝑇𝑇𝑇𝑇 𝑅𝑅𝑅𝑅𝑅𝑅𝑅𝑅𝑇𝑇𝑣𝑣𝑣𝑣𝑣𝑣𝑣𝑣𝑣𝑣𝑣𝑣 =∑𝑉𝑉𝑇𝑇𝑜𝑜𝑇𝑇𝑜𝑜𝑇𝑇𝑖𝑖∑𝑆𝑆𝑆𝑅𝑅𝑇𝑇𝑇𝑇𝑆𝑆𝑖𝑖
𝑇𝑇𝑇𝑇𝑇𝑇𝑇𝑇𝑇𝑇𝑇𝑇𝑇𝑇𝑇𝑇 𝑅𝑅𝑅𝑅𝑅𝑅𝑅𝑅𝑇𝑇𝑣𝑣𝑣𝑣𝑣𝑣𝑣𝑣𝑣𝑣 =∑𝑉𝑉𝑅𝑅𝑜𝑜𝑇𝑇𝑇𝑇𝑖𝑖
𝐴𝐴𝑇𝑇𝑇𝑇 𝑀𝑀𝑀𝑀𝑅𝑅 𝐶𝐶𝑅𝑅𝐶𝐶
𝐴𝐴𝑇𝑇𝑇𝑇.𝐷𝐷𝑅𝑅𝑅𝑅𝑜𝑜𝐷𝐷 𝑇𝑇𝑇𝑇𝑇𝑇𝑇𝑇𝑇𝑇𝑇𝑇𝑇𝑇𝑇𝑇𝑓𝑓𝑓𝑓𝑣𝑣𝑓𝑓 𝑣𝑣𝑎𝑎𝑎𝑎 =𝐷𝐷𝑅𝑅𝐷𝐷𝑆𝑆 𝑇𝑇𝑇𝑇𝑅𝑅𝑇𝑇𝑇𝑇𝑇𝑇𝑖𝑖 � ∑𝑉𝑉𝑅𝑅𝑜𝑜𝑇𝑇𝑇𝑇𝑖𝑖
𝑇𝑇𝑇𝑇𝑅𝑅𝑇𝑇𝑇𝑇 𝑆𝑆𝑇𝑇𝑆𝑆𝑆𝑆𝑅𝑅𝑇𝑇𝑇𝑇𝑆𝑆 2

Jun-16 9
Market Efficiency & Liquidity
We believe that market prices generally reflects a fair assessment of a company’s value. The fact that:
Market prices of Gaming/Betting companies corrected sharply following budgetary measures,
SBM tumbled in the wake of the BAI Group’s collapse but levelled off despite of re-statements, and
LUX was flat YoY in 2015 while peer’s plunged up to 35%
all show that the market is nimble in adjusting to expected performances
Further, investment holdings who offer diversified but indirect access to quoted/unquoted companies typically trade atsubstantial discounts to NAV reflecting the absence of control and the fact that the company’s income is essentially dividenddriven. Conglomerates have in recent years all espoused the term “Investment Company” to describe their business.
Our Methods
We expect a volume or value based “turnover ratio” (TOR) computation to yield similar results, which is what we saw when wecomputed liquidity using this metric. As a sanity check, we corroborated our calculations with those provided by the StockExchange, and except for BEEP – due most likely to the substantial shift in share price following its div. in specie – wereidentical. We then adjusted this “Raw” figure to account for shares that do not move, i.e. a “Free-Float Adjusted TOR”. Underthis method, we discover that MEI is more liquid than LUX which we consider to be one of the most liquid listed stocks. As acomparison, MCB’s TOR is ~13% and SBM’s 23% which suggests that several of GMLI’s quoted investees are quite liquid.Nevertheless, our preferred method to rank liquidity is using a combination of trade frequency and mean daily value traded.According to this method, we find that several GMLI investees individually constitute 1% or more of daily total market turnover(includes debt) in a market that contains >100 securities. Therefore dismissing market prices altogether due to “illiquidity” is inour opinion not a strong argument.
Jun-16 10
Valuation Alternatives
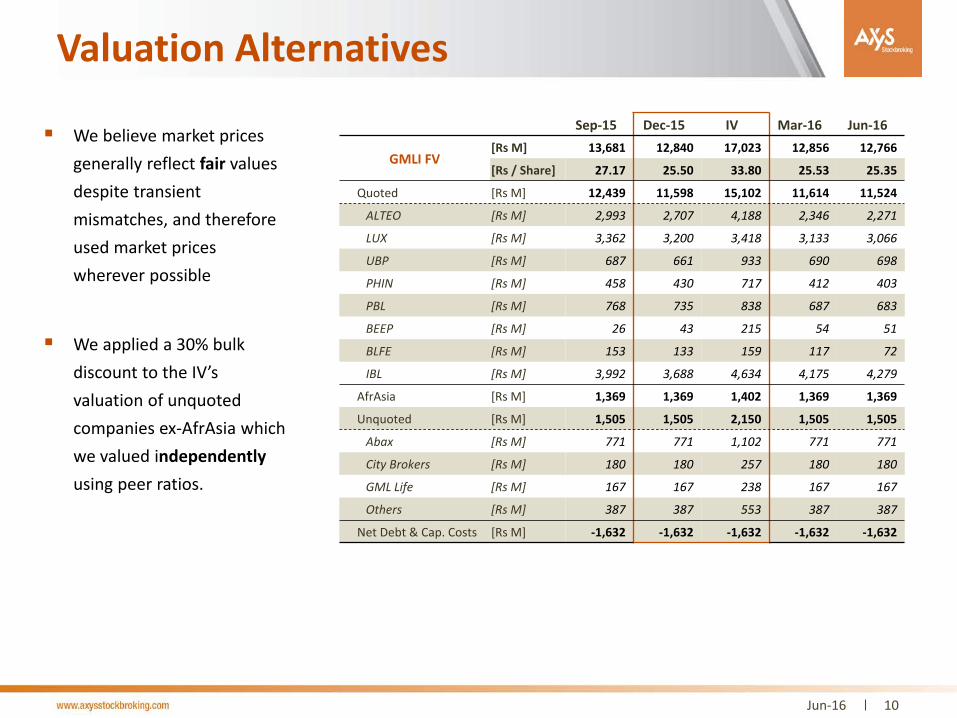
We believe market prices generally reflect fair values despite transient mismatches, and therefore used market prices wherever possible
We applied a 30% bulk discount to the IV’s valuation of unquoted companies ex-AfrAsia which we valued independentlyusing peer ratios.
Sep-15 Dec-15 IV Mar-16 Jun-16
GMLI FV[Rs M] 13,681 12,840 17,023 12,856 12,766
[Rs / Share] 27.17 25.50 33.80 25.53 25.35
Quoted [Rs M] 12,439 11,598 15,102 11,614 11,524
ALTEO [Rs M] 2,993 2,707 4,188 2,346 2,271
LUX [Rs M] 3,362 3,200 3,418 3,133 3,066
UBP [Rs M] 687 661 933 690 698
PHIN [Rs M] 458 430 717 412 403
PBL [Rs M] 768 735 838 687 683
BEEP [Rs M] 26 43 215 54 51
BLFE [Rs M] 153 133 159 117 72
IBL [Rs M] 3,992 3,688 4,634 4,175 4,279
AfrAsia [Rs M] 1,369 1,369 1,402 1,369 1,369
Unquoted [Rs M] 1,505 1,505 2,150 1,505 1,505
Abax [Rs M] 771 771 1,102 771 771
City Brokers [Rs M] 180 180 257 180 180
GML Life [Rs M] 167 167 238 167 167
Others [Rs M] 387 387 553 387 387
Net Debt & Cap. Costs [Rs M] -1,632 -1,632 -1,632 -1,632 -1,632

Jun-16 11
Alternative GMLI Valuation
Our Methods
We choose to assume that market reflects a generally fair value of a company in spite of transient mispricing that may occurfrom time to time and therefore use Mark-to-Market prices where possible
We believe that market prices after the announced merger would not be fair game as IBL’s share price moved substantially inanticipation of the amalgamation
We updated GMLI’s stakes to reflect the BEEP dividend distribution
We independently valued AfrAsia Bank using its listed peer’s ratios
The Independent Valuer (IV) valued GMLI’s listed companies at a combined 30% premium to their market prices on Dec 31st.Based on our view that the market is generally fair, we applied a 30% discount to GMLI’s unquoted portfolio as valued by theIV.
The IV applied 20% discounts to “equity values” to reflect lack of control, a 30% discount for minority shareholder withreduced voting power on the “unquoted” segment therefore did not feel unreasonable.
Our Findings
Based on market prices on Dec 31st 2015, we find that pre-merger GMLI is worth Rs12.8bn v/s Rs17.0bn by IV with the quotedportion worth Rs11.6bn v/s Rs15.1bn by IV.

Jun-16 12
IV’s Valuations – Our take
ALTEO
The IV evaluates ALTEO at ~Rs53 per share which after a 10% discount for “Joint Control” stands at ~Rs48 for GMLI which it corroborateswith a “NAV per Share” Rs70 on Dec 31st 2015. According to its interim results at same date, ALTEO’s NAV per share stood at Rs53 notRs70.
At market, ALTEO’s recurrent R4Q PER on Dec 31st stood at a very high 68x v/s 63x for its peer group (sugars). Using the IV’s valuation forGMLI, ALTEO’s PER would have stood at an even more excessive ~106x. We therefore believe that the Market reflects a fairer value forALTEO.
At market, ALTEO’s discount to NAV on Dec 31st stood at 42% v/s 46% for its peer group further enforcing our view that the Marketreasonably expresses a fair value. Investment companies have typically traded at steep discounts to NAV reflecting the fact that value islocked away; in the case of sugars, we believe this is the discount the market thinks is fair for locked up land banks.
LUX
The IV evaluates LUX at ~Rs63 per share for GMLI which it corroborates with an implied “EV/EBITDA Multiple” of 11x v/s 9x for NMHL andCHSL. We find it curious that SUN was not included in LUX’s peer group. Further, we calculate the average EV/EBITDA multiple for NMHLand CHSL to be 11.3x given that NMHL’s reported “EBITDA” included unusual items such as “Results from Associates”, “Finance Revenue”and “Fair Value gains on properties”.
We estimate LUX’s peer group’s EV/EBITDA multiple to stand at 12.5x which suggests that LUX may have been under-valued by the IV as itjustified the “higher” multiple citing “higher growth prospects for LUX”. With an EV/EBITDA multiple of 12x on Dec 31st, LUX may havebeen a tad bit expensive given that the average EV/EBITDA multiple of international giants (IHG, Hilton, Accor, Marriot) currently stands at~10x.

Jun-16 13
IV’s Valuations – Our take
PBL
The IV evaluates PBL at ~Rs408 including a “minority” discount and includes PBL’s newest acquisition, Edena, a Réunion-based waterbottling company. The IV corroborates the PER of 19x citing African Peers’ 32x. Excluding Nigeria’s “Champion Breweries” whose PERstood at 337x, we calculated the average PER of PBL’s African Peers to be 23.5x on Dec 31st using Bloomberg data.
PBL runs a mature business whose expected annual organic growth is in the low single-digits and remains our top defensive pick. Thecombined PER and PBV of PBL’s defensive peers (INNO & MOR) stood at 13x and 1.04x respectively on Dec 31st. PBL rocketed mid-15 onthe back of strong foreign investor demand for “African Brewers” rather than pure fundamentals. The IV’s implied PER of 19x and PBV ofalmost 2x for PBL is higher than its peers, which is why we believe the market reflects a fairer value.
UBP
The IV evaluates UBP at ~Rs105 including “minority” which it corroborates with an EV/EBITDA multiple of 10.6x for African Peers against9.8x for UBP. We calculated the average EV/EBITDA of UBP’s African Peers, i.e. construction materials companies to be 11.6x on Dec 31st
using Bloomberg data.
We believe that UBP has been depressed by the 5Yr-long contraction for the construction sector and its recent recovery reflects themarket’s anticipation of a pick up of activity – doped by “smart cities in the construction sector. We therefore believe the IV’s valuationreflects a fairer value for UBP.
AfrAsia
The IV evaluates AfrAsia at Rs7.1bn for GMLI which it corroborates with an “implied PBV” of 1.4x v/s 1.3x for MCB and 1.0x for SBM. UsingNAV as at Dec 31st, MCB’s Price to Book Ratio stood at 1.25x and SBM’s at 0.83x.
Banking sector PBV stands at 1.09x and PER at 8.6x which we used in our “back of the envelope” valuation of AfrAsia which yielded a valueof Rs6.9bn and therefore appears to have been reasonably priced.

Jun-16 14
IV’s Valuations – Our take
BEEP
The IV valued BEEP at Rs68 per share, i.e. at a 17% premium to book post dividend in specie. On the SEM, investment companies (INVH)have traded at half-book for years and continue to do so. The combined discount to NAV on Dec 31st was 50% and currently stands at 54%.With a 77% discount to NAV on Dec 31st and the current 71% discount, BEEP’s share price could be higher, but we wish to point out that –adjusted for the share distribution – BEEP is currently trading at 2x higher than immediately before the announced distribution. Wetherefore strongly disagree with the IV’s assessment that the 3x premium reflects “illiquidity of the shares”.
The IV also noted that “post dividend in specie, the share price dropped to Rs14.20 immediately after.” Duh! BEEP’s share price did notdrop, it experienced a very common and normal mechanical price adjustment that every company undergoes on its Ex-Div. date! As amatter of fact, BEEP ex-Div. Reference Price was Rs13.10, and thus at Rs14.20, it gained 8% and shortly thereafter peaked at an Adj. All-Time High of Rs23, i.e. 76% above its ex-Div. Ref. Price.
BLFE
The IV valued GMLI’s <10% stake in BLFE as “Share Price + 20% Premium” which is self-contradictory to the IV’s argument that the marketis not liquid and therefore cannot be used. BLFE ranks 50th in our preferred liquidity ranking method making it GMLI’s most illiquid listedinvestee!
The rationale for a “premium” was not explained which we found odd given that the IV applied discounts for lack of control. BLFE’smarket price reflects its cost overruns and poor performance of its hotels which were valued by the IV but ignored here.

Jun-16 15
Exchange Ratio Alternatives
Based on our valuation, we find that the “uplift”offered to minority shareholders as compensation for loss of voting rights results in a generally fair deal
Applying a slightly higher 5.1x ratio against the actual 4.83x does notmake any significant difference for the minority shareholder’s rights
Fair Value Sep-15 Dec-15 IV Mar-16 Jun-16
GMLI Quoted [Rs Bn] 8.45 7.91 10.47 7.44 7.24
GMLI IBL [Rs Bn] 3.99 3.69 4.63 4.17 4.28
GMLI Unquoted [Rs Bn] 1.24 1.24 1.92 1.24 1.24
Total [Rs Bn] 13.68 12.84 17.02 12.86 12.77
per Share [Rs] 27.17 25.50 33.80 25.53 25.35
Raw Exchange Sep-15 Dec-15 IV Mar-16 Jun-16
GMLI [Rs Bn] 13.68 12.84 17.02 12.86 12.77
IBLL Minority [Rs Bn] 4.21 3.88 4.88 4.40 4.51
Exchange Ratio [x] 4.22 4.16 3.94 4.70 4.85
Mnrty Econ Rights [%] 23.51 23.23 22.28 25.49 26.10
Mnrty Vtg Rights [%] 7.14 7.03 6.69 7.88 8.11
Uplifted Exchange Sep-15 Dec-15 IV Mar-16 Jun-16
GMLI [Rs Bn] 13.68 12.84 17.02 12.86 12.77
IBLL Minority [Rs Bn] 5.17 4.78 6.00 5.41 5.54
Exchange Ratio [x] 5.19 5.11 4.85 5.78 5.97
Mnrty Econ Rights [%] 27.44 27.12 26.07 29.61 30.28
Mnrty Vtg Rights [%] 8.64 8.51 8.10 9.52 9.79
Mnrty Econ = Minority Economic
Mnrty Vtg = Minority Voting
V ≡ Value; N ≡ No. of Shares
𝑋𝑋𝑓𝑓𝑣𝑣𝑟𝑟𝑖𝑖𝑣𝑣 =𝑉𝑉𝐺𝐺𝐺𝐺𝐺𝐺𝐺𝐺𝑉𝑉𝐺𝐺𝐼𝐼𝐺𝐺 𝐺𝐺𝑖𝑖𝑀𝑀
�𝑁𝑁𝐺𝐺𝐼𝐼𝐺𝐺 𝐺𝐺𝑖𝑖𝑀𝑀𝑁𝑁𝐺𝐺𝐺𝐺𝐺𝐺𝐺𝐺

Jun-16 16
Alternative Exchange Ratio
The exchange ratio is determined by computing the “per share” price of GMLI and dividing it from IBL’s “per share” price
On a “Raw” basis, i.e. without any compensation in the form of a premium for minorities, we compute the exchange ratio tobe 4.16x against the independent valuer’s 3.94x. The IV also did a Mark-to-Market cross-check which yielded 3.92x.
The IV proposed an 8% uplift citing “academic research” proposing a premium between 2-10% and French authorities whoapply a premium of ≥5%. In a similar merger not so long ago, the independent valuer for that transaction cited the same“empirical” research to justify that “any premium should therefore not be higher than 5%”
The transaction advisor (TA) when asked to provide a fairness certificate recommend an additional 13% uplift to compensatefor the fact that “IBL generated 70% of GMLI’s cash flow” and “discount for GMLI being a family owned business”
Following negotiations, the original 8% uplift which had been increased to 21% by the TA, was further increased to 23% suchthat 26% of IBL Ltd’s listed shares would sit in public hands. The SEM’s official list free-float criterion is 25%.
On an “uplifted” basis, i.e. with a premium applied to IBL minority shareholders, we compute the exchange ratio to be 5.11xagainst the actual 4.83x.
Our Synthesis
On a raw basis, minorities would have 23% of economic rights and 7% of voting using our methods against 22% and 6.7% usingthe IV’s method.
On an uplifted basis, minorities would have 27% of economic rights and 8.5% of voting using our methods against 26% and8.1% using the actual ratio.
The “uplift” thus increases the minority shareholder’s stake by 400bps which we could consider as a win-win for all partiesinvolved. The end result using our methods or the IV’s is therefore not materially different.

Jun-16 17
Valuation Sanity Check
The merged entity, IBL Ltd, rejoins the SEM with an introductory price of Rs25.65, i.e. equivalent to a Mkt Cap of Rs17.5bn
This implies that if SBM trades below 68cts, IBL Ltd will be the 2nd largest local company by Mkt Cap
Its PBV using Dec-15 NAV would thus stand at 1.09x and PER+1 using mgmt forecasts at 10.5x
Sep-15 Dec-15 IV Mar-16 Jun-16
PER[x]
IBL 14.77 15.54 19.53 16.77 17.23
MSCH 36.02 31.24 29.97 28.91
MSCH ex-Sugar 24.37 20.76 18.75 18.67
PBV[x]
IBL 1.43 1.32 1.66 1.46 1.50
MSCH 0.72 0.68 0.67 0.65
MSCH ex-Sugar 1.07 0.99 1.01 1.00
Our Assessment
Prior to the announcement, IBL traded at a 32% premium to NAV, while itsMulti-Sector peers traded at a 32% discount to NAV, and peers excluding Sugarstraded at near parity with NAV. IBL Ltd’s PBV of 1.09x, therefore does notconstitute an exaggerated over-valuation, IBL’s 66% premium to NAV ascalculated by the IV is in our opinion excessive.
Similarly, from an earnings perspective, IBL traded at 15x while its peers tradedat >30x and excluding sugars, its peers traded with a recurrent R4Q PER of>20x. IBL’s 19.5x PER as per IV valuation is thus in-line with market. Further IBLLtd’s PER+1 of 10.5x suggests the counter is undervalued if the attributable PATtarget of 1.7bn is met in 2017 – perhaps a stretch – knowing that 2015’s att. PATstood at Rs912M.
AXYS Stockbroking Ltd6th Floor, Dias Pier BuildingLe Caudan WaterfrontPort-Louis, 11307Mauritius
Tel:Email:
(230) 405 [email protected]