IAN TESTROW, MANAGING DIRECTOR & CHIEF EXECUTIVE OFFICER ... · 1 2015 full year results 27 august...
28
1 2015 FULL YEAR RESULTS 27 AUGUST 2015 IAN TESTROW, MANAGING DIRECTOR & CHIEF EXECUTIVE OFFICER GREG HAWKINS, EXECUTIVE DIRECTOR, FINANCE
Transcript of IAN TESTROW, MANAGING DIRECTOR & CHIEF EXECUTIVE OFFICER ... · 1 2015 full year results 27 august...

1
2015 FULL YEAR RESULTS27 AUGUST 2015
IAN TESTROW, MANAGING DIRECTOR & CHIEF EXECUTIVE OFFICER
GREG HAWKINS, EXECUTIVE DIRECTOR, FINANCE

Having increased utilisation over FY15, the focus is now on building a more profitable business to drive future growth
Note:1. Excludes non-current assets held for sale
HIGHLIGHTSBuilding a more profitable business
2
Group fleet utilisation currently 74%1, up from 50% at June 2014
Global mining industry experiencing prolonged difficult trading conditions, low commodity price environment
Strategic achievements evident over FY15
Focus now switches to building margins, Project Fit to save $14 million in costs over FY16
Turnaround journey well underway
Rebuild utilisation, stabilise business
Refinanced balance sheet (Bonds, ABL)
Improve margins
Focus on generating free cash flow to deleverage the business
Increased utilisation, improved margins and financing flexibility and tenure, positions us well to evaluate opportunities to participate in sector consolidation

A$million 1H FY15 2H FY15 FY15 FY14 PCP Var $M
Revenue 110.7 132.1 242.8 241.1 1.7
EBITDA 16.2 27.2 43.4 67.3 (23.9)
Operating NPAT (49.6) (45.3) (94.9) (21.6) (73.3)
Statutory NPAT7 (51.7) (71.4) (123.1) (224.2) 101.1
Free cashflow (9.0) (9.5) (18.5) 85.9 (104.4)
Note: 1. Utilisation defined as % of fleet rented to customers (measured by written down value)2. Operating utilisation defined as ratio of operating hours recognised over a month, compared to a target average number of 400 operating hours over a month3. Table represents operating results4. FY14 reported operating EBITDA of $72.1 million and FY14 reported operating EBIT loss of $6.1 million have been restated for comparative purposes. Refer to Emeco’s 2015 Financial Report for more information5. Unrealised FX reclassified below EBIT6. Excludes discontinued operations, free cashflow includes discontinued operations7. FY15 Statutory NPAT includes one-off costs (pre-tax) comprising tangible asset impairments of $30.8 million, project revenue write back of $1.4 million, debt establishment cost write-offs of $1.8 million, corporate costs of $2.8 million and redundancy costs of $2.6 million. Refer to Emeco’s 2015 Financial Report for more information
FINANCIAL PERFORMANCE3,4,5,6
Higher utilisation resulting in revenue uplift over 2H FY15, focus on margin recovery expected to drive improved profitability
Strategic achievements driving stronger 2H FY15
FY15 OVERVIEW
3
OPERATING PERFORMANCE
0%
20%
40%
60%
80%
100%
1Q14 2Q14 3Q14 4Q14 1Q15 2Q15 3Q15 4Q15 Current
Utilisation Operating Utilisation 21
74%
40%

Our quality customer base continues to return to Emeco to resource their rental mining equipment and maintenance needs across all regions
Note:Figures in AUD millionsExcludes assets held for sale
EMECO OPERATIONS
4
Western Regions$57.0M FY15 revenueNumber of fleet: 131Fleet WDV: $83MFY15 Revenue Composition
Queensland$21.3M FY15 revenue
Number of fleet: 62
Fleet WDV: $75MFY15 Revenue Composition
New South Wales$58.7M FY15 revenueNumber of fleet: 117Fleet WDV: $82MFY15 Revenue Composition
Chile$29.6M FY15 revenue
Number of fleet: 35
Fleet WDV: $118MFY15 Revenue Composition
Canada$76.3M FY15 revenue
Number of fleet: 110
Fleet WDV: $136MFY15 Revenue Composition
Coking Coal, 4%
Thermal Coal, 49%
Iron Ore, 1%
Other, 16%
Gold, 30%
Coking Coal, 68%
Thermal Coal, 19%
Other, 13%
Coking Coal, 19%
Iron Ore, 13%
Other, 8%
Gold, 60%
Oilsands, 87%
Thermal Coal, 10%
Iron Ore, 3%
Copper,
100%

OPERATIONAL REVIEW

Emeco continues to provide a safe work environment of the highest standard, invest in employees’ development and support local communities
SUSTAINABILITYHSE, HR & Community
6
Health, Safety & Environment
Safety performance was consistent with the previous year, however TRIFR increased slightly due to a decrease in working hours
Human Resources
Workforce reduced 13% over FY15 as we continued to resize the business to market conditions
Emeco has continued to support employee development despite the challenging operating environment
Community
New community engagement strategy focused on Emeco’s long term strategic partnerships (Lifeline, Women Building Futures) and promoting in kind support activities for employees to engage with the community

0%
20%
40%
60%
80%
100%
Utilisation Operating Utilisation
Defending our presence and building stronger relationships with existing customers
REGIONAL PERFORMANCENew South Wales
7
Utilisation up to 95% from 68% at commencement of FY15. Uplift primarily driven by ramp-up of Maules Creek coal mine and Alkane Tomingley gold mine, plus additional units placed with existing contracts
Emeco Operating System (EOS) successfully implemented at Alkane Tomingley gold mine, reducing customer operating costs
Further opportunity to grow NSW business via increased presence on existing sites (potentially relocating fleet from other regions) and improved operating utilisation of contracted fleet
Utilisation1Revenue EBITDA30 June 15
18.8
26.724.3
34.4
1H FY14 2H FY14 1H FY15 2H FY15
7.6
11.3
5.4
14.0
1H FY14 2H FY14 1H FY15 2H FY15
95%
50%
Note:1. Excludes non-current assets held for sale

0%
20%
40%
60%
80%
100%
Utilisation Operating Utilisation
New management team retaking market share
REGIONAL PERFORMANCEQueensland
8
Utilisation1Revenue EBITDA
Significant improvement in utilisation over FY15, lifting from 10% to 85% with several contract wins in the coal market
New management team engaged with customers to identify rental opportunities and gain significant market share, despite the competitive environment
Tenure of new contract wins expected to underpin the current level of utilisation for the majority of FY16
22.6
8.4 8.6
12.7
1H FY14 2H FY14 1H FY15 2H FY15
8.2
(0.1) (1.5) 0.9
1H FY14 2H FY14 1H FY15 2H FY15
Note:1. Excludes non-current assets held for sale
30 June 15
85%
47%

Focus on identifying opportunities in challenging market conditions
REGIONAL PERFORMANCEWestern Australia
9
Utilisation1Revenue EBITDA
Recent cessation of Saracen rental contract contributed to Western Australia utilisation falling to 28%
Market remains challenging due to low commodity price environment and highly competitive mining services market
Management focused on identifying opportunities across Australia to return the fleet back to work
Guildford workshop closed to reduce costs in difficult market conditions
28.9
24.9
29.2
27.8
1H FY14 2H FY14 1H FY15 2H FY15
10.7
6.67.7
9.0
1H FY14 2H FY14 1H FY15 2H FY15
Note:1. Excludes non-current assets held for sale
0%
20%
40%
60%
80%
100%
Utilisation Operating Utilisation
30 June 15
28%23%
Diversifying rental business away from oilsands industry to reduce cyclicality of earnings
Note:1. Figures in AUD millions2. Excludes non-current assets held for sale
REGIONAL PERFORMANCECanada
10
Utilisation2Revenue EBITDA
Earnings down yoy predominantly as a result of lower operating utilisation compared to prior periods as customers revised mine plans in response to the lower oil price environment. Rental rates were also renegotiated over the winter period
Our strategic achievements over FY15 included diversifying earnings outside oilsands and growing mine site services:
- Rental opportunities identified in coal and iron ore sectors, supporting current utilisation of approximately 60%;
- Completion of Kearl Lake maintenance facility and recently signed fuel and lubricants support contract expected to drive further growth in mine site services business (which grew to 13.6% of revenue in FY15, up from 7.6% in FY14)
37.1
44.3
36.040.3
1H FY14 2H FY14 1H FY15 2H FY15
12.8
15.5
10.7
8.4
1H FY14 2H FY14 1H FY15 2H FY15
0%
20%
40%
60%
80%
100%
Utilisation Operating Utilisation
30 June 15
58%
26%

0%
20%
40%
60%
80%
100%
Utilisation Operating Utilisation
Improved operating performance at Encuentro project driving second half revenue growth
REGIONAL PERFORMANCEChile
11
Utilisation2Revenue EBITDA
FY15 earnings impacted by ramp up issues at Encuentro driving lower than forecasted tonnes moved on site, reducing operational hours of rental fleet
Productivity issues at Encuentro were addressed, driving improved performance over 2H FY15. Further improvement in project profitability is expected in FY16
Commencing 1 July 2015 Emeco entered into a partnership agreement with leading global mining contractor Thiess to complete a four year mining contract for the Encuentro pre-strip operations (replacing previous contracting partner Fe Grande)
Note:1. Figures in AUD millions2. Excludes non-current assets held for sale
12.5 12.6 11.9
17.6
1H FY14 2H FY14 1H FY15 2H FY15
6.8 7.1
2.2
4.3
1H FY14 2H FY14 1H FY15 2H FY15
30 June 15
94%
76%
FINANCIALS
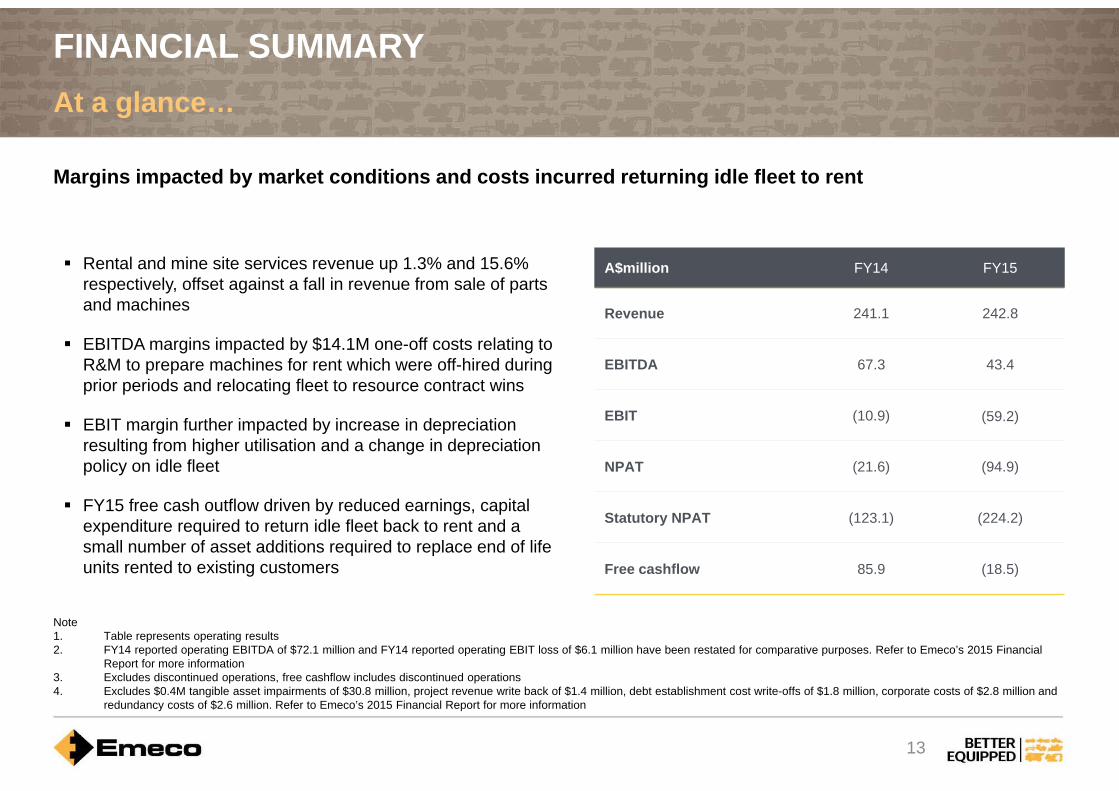
Margins impacted by market conditions and costs incurred returning idle fleet to rent
Note1. Table represents operating results2. FY14 reported operating EBITDA of $72.1 million and FY14 reported operating EBIT loss of $6.1 million have been restated for comparative purposes. Refer to Emeco’s 2015 Financial
Report for more information3. Excludes discontinued operations, free cashflow includes discontinued operations4. Excludes $0.4M tangible asset impairments of $30.8 million, project revenue write back of $1.4 million, debt establishment cost write-offs of $1.8 million, corporate costs of $2.8 million and
redundancy costs of $2.6 million. Refer to Emeco’s 2015 Financial Report for more information
FINANCIAL SUMMARYAt a glance…
13
A$million FY14 FY15
Revenue 241.1 242.8
EBITDA 67.3 43.4
EBIT (10.9) (59.2)
NPAT (21.6) (94.9)
Statutory NPAT (123.1) (224.2)
Free cashflow 85.9 (18.5)
Rental and mine site services revenue up 1.3% and 15.6% respectively, offset against a fall in revenue from sale of parts and machines
EBITDA margins impacted by $14.1M one-off costs relating to R&M to prepare machines for rent which were off-hired during prior periods and relocating fleet to resource contract wins
EBIT margin further impacted by increase in depreciation resulting from higher utilisation and a change in depreciation policy on idle fleet
FY15 free cash outflow driven by reduced earnings, capital expenditure required to return idle fleet back to rent and a small number of asset additions required to replace end of life units rented to existing customers

Utilisation growth combined with reduced prep-for-rent costs improving profitability in 2H FY15
FINANCIAL SUMMARYFinancial metrics trending upward
14
2H FY15 Operating EBITDA of $27.2M up 68% on 1H FY15, revenue up 19.5% to $132.3M
One-off prep-for-rent costs totalling $14.1M impacted 1H FY15 ($9.0M) and 2H FY15 ($5.1M)
On track for improved earnings pcp in 1Q FY16, July 2015 EBITDA margin averaged 31.4% (compared to 14.6% 1Q FY15)
Quarterly revenue Quarterly Operating EBITDA
123.9117.6
110.7
132.3
0
20
40
60
80
100
120
140
1H FY14 2H FY14 1H FY15 2H FY15
36.9
30.2
16.2
27.2
0
5
10
15
20
25
30
35
40
1H FY14 2H FY14 1H FY15 2H FY150%
10%
20%
30%
40%
50%
EBITDA MarginA$millionA$million
Depreciation
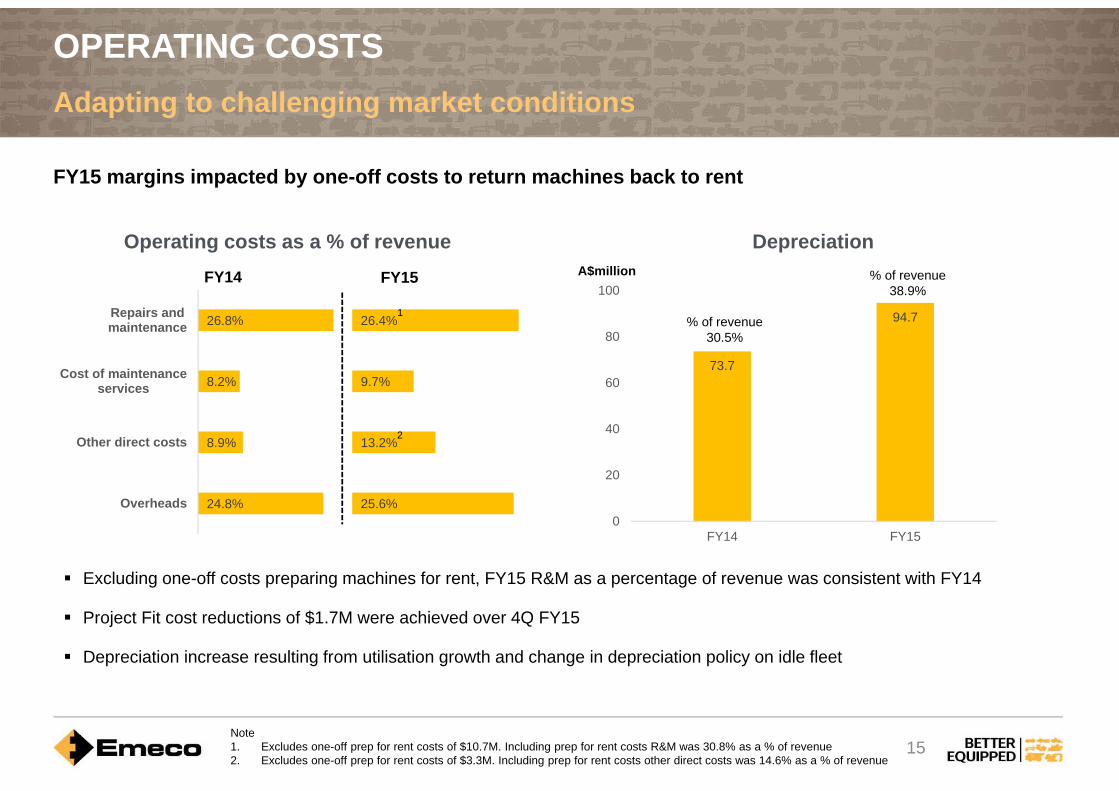
FY15 margins impacted by one-off costs to return machines back to rent
OPERATING COSTSAdapting to challenging market conditions
15
Excluding one-off costs preparing machines for rent, FY15 R&M as a percentage of revenue was consistent with FY14
Project Fit cost reductions of $1.7M were achieved over 4Q FY15
Depreciation increase resulting from utilisation growth and change in depreciation policy on idle fleet
FY14 FY15
Operating costs as a % of revenue
73.7
94.7
0
20
40
60
80
100
FY14 FY15
A$million
26.4%
9.7%
13.2%
25.6%
Note1. Excludes one-off prep for rent costs of $10.7M. Including prep for rent costs R&M was 30.8% as a % of revenue2. Excludes one-off prep for rent costs of $3.3M. Including prep for rent costs other direct costs was 14.6% as a % of revenue
2
1% of revenue
30.5%
% of revenue38.9%
26.8%
8.2%
8.9%
24.8%
Repairs andmaintenance
Cost of maintenanceservices
Other direct costs
Overheads

We continue to right size our fleet to match asset classes to regional demand
Note:1. Excludes non-current assets held for sale2. Sustaining capex includes other PP&E; disposals includes other PP&E disposals3. Includes Indonesia disposals
RENTAL FLEET AND CAPITAL STRATEGYMatching the rental fleet to market demand
16
(17.3) (26.0)
(11.6) (23.5)
28.242.6
15.1 9.7
(30)
(20)
(10)
-
10
20
30
40
50
1H14 2H14 1H15 2H15
Sustaining Capex Disposals Growth Capex
Sustaining capex up in FY15 due to spend required to return idle fleet back to rent
$24.8M generated from asset disposals in FY15 despite the difficult second hand market
$32.3M of non-current assets held for sale recognised at 30 June 2015, scheduled for disposal over FY16
Fleet additions funded by a mix of cash purchases for replacement assets on existing contract sites and operating leases to source non-core assets required to secure recent contract wins
Net capexRental fleet1
568421 412 367
0
100
200
300
400
500
600
1H14 2H14 1H15 2H15
Owned Fleet Finance Lease Operating Lease
Number of fleet
32
A$millionWDV$694M
WDV$613M
WDV$531M WDV
$496M
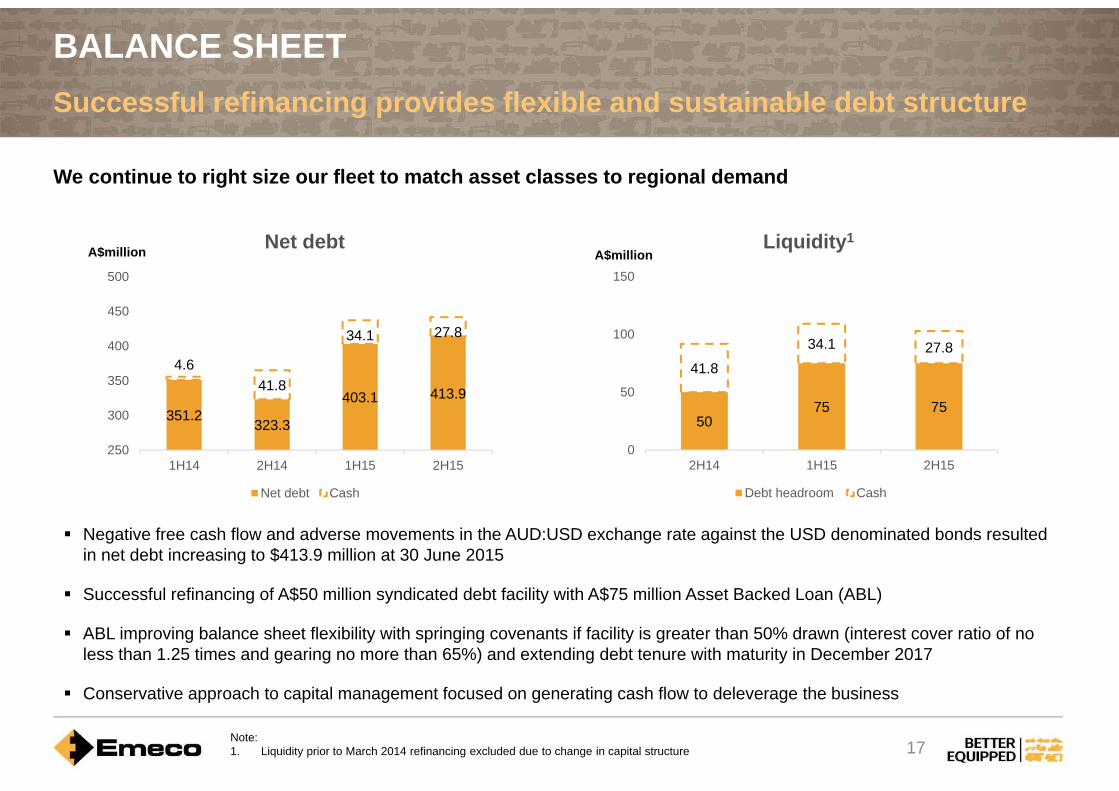
BALANCE SHEETSuccessful refinancing provides flexible and sustainable debt structure
17
Negative free cash flow and adverse movements in the AUD:USD exchange rate against the USD denominated bonds resulted in net debt increasing to $413.9 million at 30 June 2015
Successful refinancing of A$50 million syndicated debt facility with A$75 million Asset Backed Loan (ABL)
ABL improving balance sheet flexibility with springing covenants if facility is greater than 50% drawn (interest cover ratio of no less than 1.25 times and gearing no more than 65%) and extending debt tenure with maturity in December 2017
Conservative approach to capital management focused on generating cash flow to deleverage the business
Liquidity1Net debt
351.2323.3
403.1 413.9
4.641.8
34.1 27.8
250
300
350
400
450
500
1H14 2H14 1H15 2H15
Net debt Cash
5075 75
41.8
34.1 27.8
0
50
100
150
2H14 1H15 2H15
Debt headroom Cash
Note:1. Liquidity prior to March 2014 refinancing excluded due to change in capital structure
We continue to right size our fleet to match asset classes to regional demand
A$millionA$million

STRATEGY & OUTLOOK

SUCCESSFUL STRATEGY IMPLEMENTATIONStrategic achievements over FY15
19
Reshaping the core
Business development focus driving utilisation increase to average 74% over 2H FY15
Diversifying Canada rental away from oilsands industry with growing coal and iron ore opportunities reducing cyclicality of earnings
Building mine site services business in Canada with completion of Kearl Lake maintenance facility and signing five year fuel and lubricant support contract with major oilsands producer
Expanding product offering to wet hire in Chile with recent contract win at AMSA’s Esperanza mine
Project Fit already delivering savings expected to reduce FY16 cost base by $14.0M
Entered partnership with leading global mining contractor, Thiess, to secure four year mining contract at Encuentro mine
Developed Emeco Operating System (EOS) improving efficiency in our maintenance capabilities and providing customers real time access to fleet performance and production data to assist with managing their operations
Innovation and consolidation
Expanding our product offering

Over FY16 we’ll continue to strengthen our core while identifying opportunities to succeed during challenging market conditions
STRATEGIC OUTLOOKContinuing the journey to profitability
20
Group utilisation low point 41%
Getting equipment back to work –Group utilisation at 73%
Differentiating our product offering
Reduce cost base, Project Fit underway
1HFY14 2HFY14 1HFY15 2HFY15 1HFY16 2HFY16
Specialist mine site services which adds value to Emeco’s existing customer relationships, asset management and maintenance capabilities
Improve offering to customers through value add technology
Reduce net debt
Return to profitability
Margin improvement, cash generation
Implemented Emeco’s asset management system (EOS) at Alkane. Exploring implementation with other customers
1HFY17
With increased utilisation, improved margins from cost reductions and financing capacity, flexibility and tenure, Emeco is well positioned to evaluate opportunities to participate in sector consolidation

QUESTIONS

22
FURTHER INFORMATION
Thank you for your interest in Emeco
For further investor enquiries please contact:
Brendan ShaldersGroup Manager, Investor Relations &
Corporate Development +61 (0) 8 9420 0258

APPENDICES

Canada34%
Chile10%NSW
20%
QLD14%
WA22%
FY14
EARNINGS COMPOSITION
24
REVENUE BY COMMODITYREVENUE BY GEOGRAPHY
Canada32%
Chile12%NSW
24%
QLD9%
WA23%
FY15
$242.9m$241.1m
Coking Coal11%
Copper10%
Gold15%
Iron Ore8%
Oilsands29%
Other8%
Thermal Coal19%
FY14
Coking Coal12%
Copper12%
Gold21%
Iron Ore4%
Oilsands27%
Other7%
Thermal Coal17%
FY15
$242.9m$241.1m

DETAILED FINANCIALS
25
Balance Sheet2
Profit & Loss CashflowA$million FY14 FY15 PCP $Revenue 241.1 242.8 1.7
EBITDA 67.3 43.4 (23.9)
Margin(%) 27.9% 17.9% (10.0)%
EBIT (10.9) (59.2) (48.3)
Margin(%) (4.5)% (24.4)% (19.9)%
NPAT (21.6) (94.9) (73.3)
EPS (cps) (3.6) (15.8) (12.2)
R12 ROC(%) (0.8) (9.4) (8.6)%
A$million FY14 FY15
Cash 41.8 27.8
Trade & other receivables 78.9 65.6
Rental plant 530.9 458.5
Intangibles 0.2 1.6
Sales & parts inventory 8.2 20.9
Other assets 88.4 134.4
Trade & other payables (53.1) (45.4)
Total debt (343.8) (424.0)
Other Liabilities (27.5) (17.9)
Net assets 324.0 221.5
A$million FY14 FY15 PCP $Operating cashflow 57.4 32.6 (24.8)General working capital 36.6 7.1 (29.5)
Sales & parts inventory 6.4 0.1 (6.3)
Interest & borrowing costs (34.3) (42.8) (8.5)
Income tax payments 10.2 0.0 (10.2)Cashflow from operating activities 76.3 (3.0) (79.3)
Sustaining capex1 (43.3) (37.8) 5.5
Disposals1 70.8 24.8 (46.0)
Cashflow from investing activities 27.5 (13.0) (40.5)
Cashflow (before growth capex & s/h return) 103.8 (16.0) (119.8)
Growth capex (0.9) 0.0 0.9
Dividends 0.0 0.0 0.0
Other financial activities (17.0) (2.6) 14.4
Net cashflow 85.9 (18.6) (104.5)
Note:1. Sustaining capex includes other PP&E additions, disposals includes other PP&E disposals2. Statutory balance sheet

GEOGRAPHICAL SEGMENTS
26
Western Australia
Canada Chile
QueenslandA$million FY14 FY15 PCP $
Revenue 53.8 57.0 3.2
EBITDA 17.2 16.7 (0.5)
margin (%) 32.0% 29.3% (2.7)%
EBIT (1.4) (8.4) (7.0)
margin (%) (2.6)% (14.7)% (12.1)%
A$million FY14 FY15 PCP $
Revenue 31.1 21.3 (9.8)
EBITDA 8.2 (0.6) (8.8)
margin (%) 26.4% (2.8)% (29.2)%
EBIT (5.0) (13.2) (8.2)
margin (%) (16.1)% (62.0)% (45.9)%
A$million FY14 FY15 PCP $
Revenue 45.5 58.7 13.2
EBITDA 18.8 19.4 0.6
margin (%) 41.3% 33.0% (8.3)%
EBIT 2.3 (4.1) (6.4)
margin (%) 5.1% (7.0)% (12.1)%
New South Wales
A$million FY14 FY15 PCP $
Revenue 81.5 76.3 (5.2)
EBITDA 28.1 19.3 (8.8)
margin (%) 34.5% 25.3% (9.2)%
EBIT 8.6 (5.2) (13.8)
margin (%) 10.6% (6.8)% (17.4)%
A$million FY14 FY15 PCP $
Revenue 25.1 29.6 4.5
EBITDA 14.0 6.6 (7.4)
margin (%) 55.8% 22.3% (33.5)%
EBIT 4.3 (9.8) (14.1)
margin (%) 17.1% (33.1)% (50.2)%
DISCLAIMER
27
Reliance on third party informationThe information and views expressed in this Presentation were prepared by Emeco Holdings Ltd (the Company) and may contain information that has been derived from publicly available sources that have not been independently verified. No representation or warranty is made as to the accuracy, completeness or reliability of the information. No responsibility or liability is accepted by the Company, its officers, employees, agents or contractors for any errors, misstatements in or omissions from this Presentation.
Presentation is a summary onlyThis Presentation is information in a summary form only and does not purport to be complete. It should be read in conjunction with the Company’s 2015 financial report. Any information or opinions expressed in this Presentation are subject to change without notice and the Company is not under any obligation to update or keep current the information contained within this Presentation.
Not investment adviceThis Presentation is not intended and should not be considered to be the giving of investment advice by the Company or any of its shareholders, directors, officers, agents, employees or advisers. The information provided in this Presentation has been prepared without taking into account the recipient’s investment objectives, financial circumstances or particular needs. Each party to whom this Presentation is made available must make its own independent assessment of the Company after making such investigations and taking such advice as may be deemed necessary.
No offer of securitiesNothing in this Presentation should be construed as either an offer to sell or a solicitation of an offer to buy or sell Company securities in any jurisdiction.
Forward looking statementsThis Presentation may include forward-looking statements. Although the Company believes the expectations expressed in such forward-looking statements are based on reasonable assumptions, these statements are not guarantees or predictions of future performance, and involve both known and unknown risks, uncertainties and other factors, many of which are beyond the Company’s control. As a result, actual results or developments may differ materially from those expressed in the statements contained in this Presentation. Investors are cautioned that statements contained in the Presentation are not guarantees or projections of future performance and actual results or developments may differ materially from those projected in forward-looking statements.
No liabilityTo the maximum extent permitted by law, neither the Company nor its related bodies corporate, directors, employees or agents, nor any other person, accepts any liability, including without limitation any liability arising from fault or negligence, for any direct, indirect or consequential loss arising from the use of this Presentation or its contents or otherwise arising in connection with it.

Thank youLearn more about usemecogroup.com