IAEA Proficiency Testing
19
11/4/2014 1 IAEA International Atomic Energy Agency Proficiency test system of the IAEA Terrestrial Environment Laboratory by S. Tarjan (TEL) IAEA Environment Laboratories RMCC Meeting 2014, Amman IAEA Topics • Concept of the PTs and materials • PT evaluation scheme • Sample preparation • Results and their interpretation
Transcript of IAEA Proficiency Testing

11/4/2014
1
IAEAInternational Atomic Energy Agency
Proficiency test system of the IAEA
Terrestrial Environment Laboratory
by S. Tarjan (TEL)
IAEA Environment Laboratories
RMCC Meeting 2014, Amman
IAEA
Topics
• Concept of the PTs and materials
• PT evaluation scheme
• Sample preparation
• Results and their interpretation

11/4/2014
2
IAEA
Concept of the Proficiency Test
• Traditions:• Keeping the Mutual agreement at the second
ALMERA meeting 2005
• Regular sample set: water, biota, soil type material
• Predefined evaluation system
• Both natural and anthropogenic radionuclides
IAEA
Concept of the Proficiency Test
• New elements:• The analytes were not defined in advance (the
participant should select them from a list)
• New PT evaluation scheme (MARB, %
• Bias trend analysis
• QC sample with known activity values
• PT history

11/4/2014
3
IAEA
Proficiency Test Evaluation Method
• Key parameter:
• Maximum Acceptable Relative Bias specified in %
(MARB)
• The MARB value derived from method parameters
considering general laboratory circumstances:
• 30% relative efficiency detector
• 100 cm3 sample volume in cylindrical geometry
• reasonable counting time (10000-80000 sec)
• Typical uncertainty budget (calibration source, efficiency
curve fitting, counting statistics, long term stability, variation
of the background)
IAEA

11/4/2014
4
IAEA
Evaluation scheme
IAEA
Proficiency Test Evaluation Method
• Bias trend analysis
• Master sample, master analytes (Cs-134, Cs-137)
• Master sample: water
• Slave samples: biota, soil
• Rules
• Same radio-analytical method
• Similar activity level
• The activity should be five times higher than the MDA value
(supposing standard laboratory circumstances, ISO 11929)
• Data presentation on the X-Y chart: slave sample versus
master sample

11/4/2014
5
IAEA
Bias trend analysis (Cs-137 water-hay)
World-wide
2012
245 participants
IAEA
Evaluation of Z-scores
The Z-scores were derived by the following equation:
𝑍 =𝑉𝑎𝑙𝑢𝑒𝑅𝑒𝑝𝑜𝑟𝑡𝑒𝑑 − 𝑉𝑎𝑙𝑢𝑒𝑇𝑎𝑟𝑔𝑒𝑡
𝑠∗
Where s* the robust standard deviation without refinement, calculated by the
following formula:
𝑠∗ = 1.483 ∙ 𝑚𝑒𝑑𝑖𝑎𝑛 𝑜𝑓 𝑉𝑎𝑙𝑢𝑒𝑅𝑒𝑝𝑜𝑟𝑡𝑒𝑑 − 𝑉𝑎𝑙𝑢𝑒𝑇𝑎𝑟𝑔𝑒𝑡
It should be emphasized the Z-score is a relative parameter, because the
value of the robust standard deviation used for the calculation is derived from
the reported results influenced by the performance of the participants.

11/4/2014
6
IAEA
The PT samples and analytes in• Water samples
• Sample 01 spiked tap water
• Sample 02 spiked tap water
• Sample 03 (QC) spiked deionised water
(The assigned values of the radionuclides was specified in the
cover letter)
• Biota or Food sample
• Sample 04 (for athropogenic isotopes)
• hay
• flour
• seaweed
• rice
• Mineral matrices• Soil, sediment, ores
IAEA
Sample preparation• Water samples
• From SRM solutions (with low uncertainty) using gravimetric
dilution steps
• All dilution process included into the material balance and the
contingent discrepancy included into the preparation uncertainty
budget
• Control measurement of the sample sets
• Spiked biota sample
• From SRM solutions (with low uncertainty) using gravimetric
dilution steps
• Bulk homogeneity check during the preparation and final
homogeneity check on the bottled samples
• Control measurement
• Dry weight tracking during the preparation steps

11/4/2014
7
IAEA
Sample preparation
General principles for spiked samples• Certified high precision isotope solutions are used
• Material balance (weight tracking) during the entire
preparation steps
• Establishing the traceability chain
• Water• Gravimetric dilution
• Validation by point source preparation
• Checking the final dilution by control measurement
IAEA
Sample preparation
General principles for characterised samples• Results of independent expert laboratories
• Most appropriate and robust mathematical method for deriving
target values and uncertainties
• Establishing the traceability chain
• Homogeneity check using ANOVA pattern

11/4/2014
8
IAEA
Results
(as the participants want to see)
IAEA
Water 01 Cs-137 Target value: 50.3 (0.3) Bq/kg MARB = 15% in 2013
0
10
20
30
40
50
60
70
66
10 7
24
17
29
43
34
18
30 4 5
78
70 6
75
16
36
48
77
51
31
47
58
11 1
38
57
60
68
46
23
39
80
49
42
22
32
72
69
50 2
52
59
74
65
15
37
54
73
44
53
26
79
19
63
76
12
55
21
62
56
33
45
27
14
71
13 9
35
64
67
41
20
28
25
Massic
acti
vit
y,
Bq
/kg
Laboratory code

11/4/2014
9
IAEA
Water 02 Sr-90 Target value: 30.0 (0.1) Bq/kg MARB = 15%
0
20
40
60
80
100
120
79
28 4
58 5
72
63
35
64
20
31
36
59
49
57
50
23
43
62
22
39
41
65
68
75
52
77
26
34
32
19
53
54 9
37
33
13
74
44
71
76 6
48
30 7
12
47 3
Massic
acti
vit
y,
Bq
/kg
Laboratory code
IAEA
Individual performance
of the laboratories
Where is my position?
11/4/2014
10
IAEA
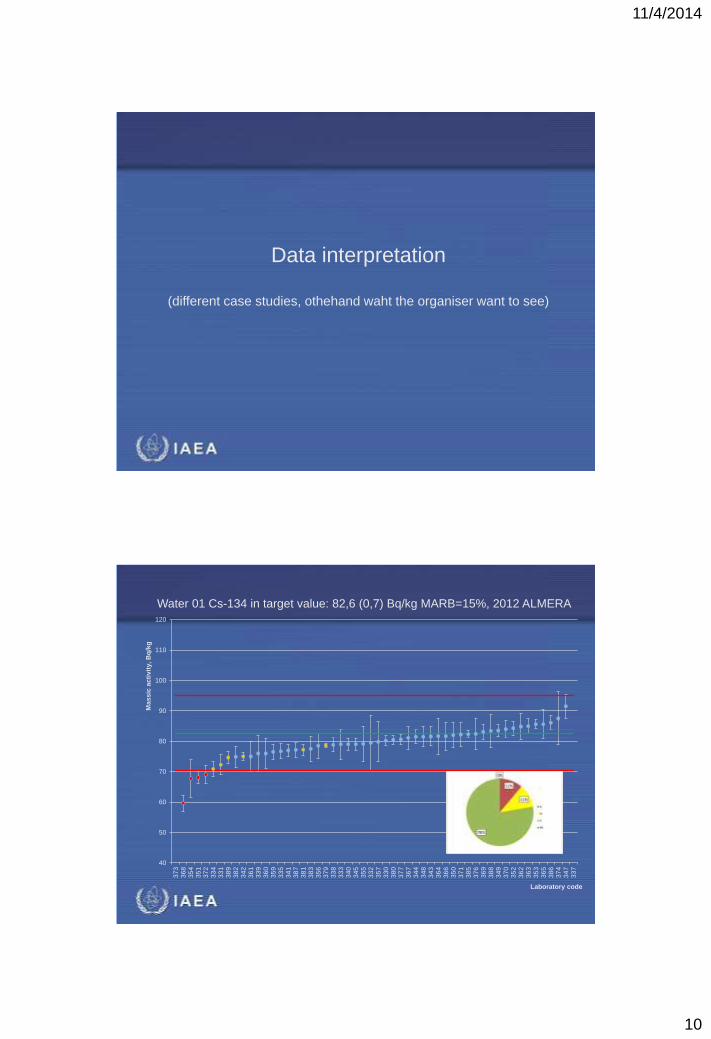
Data interpretation
(different case studies, othehand waht the organiser want to see)
IAEA
40
50
60
70
80
90
100
110
120
37
336
835
435
137
233
433
138
938
234
236
133
936
035
933
534
138
738
138
335
637
933
833
334
034
535
533
235
733
038
037
736
734
434
834
336
436
635
037
138
537
636
938
834
937
035
236
236
335
336
538
637
434
733
7
Massic
acti
vit
y,
Bq
/kg
Laboratory code
Water 01 Cs-134 in target value: 82,6 (0,7) Bq/kg MARB=15%, 2012 ALMERA

11/4/2014
11
IAEA
10
15
20
25
30
3566
67 4
12
58
50
30 5
62
56
64
18
63
21 2
29
52 1
36
43
46
69
23
65
80
75
11
39
70
51
19
20
17
48
79
10
34
73
42
27
38
49
57
78
60
25
28
32
59
68
71 7
16
24
47
72
74
54
22
77
33
26
14
76
31
44
37 9
53 6
13
35
15
55
41
45
Massic
acti
vit
y,
Bq
/kg
Laboratory code
Water 01 Cs-134 Target value: 24.4 (0.2) Bq/kg MARB = 15%, 2013 ALMERA
IAEA
10
15
20
25
30
35
5 8 11 6 74 27 71 18 42 5766 31 40 21 48 30 7 15 39 62 69 10 23 45 70 2 17 32 43 68 35 67 51 52 24 28 59 22 55 1 37 53 61 12 41 47 3 33 9 13 34 16
Massic
acti
vit
y,
Bq
/kg
Laboratory code
Water 01 Cs-134 Target value: 21.4 (0.2) Bq/kg MARB = 15% in 2014 ALMERA

11/4/2014
12
IAEA
10
15
20
25
30
35
25
616
616
926
122
011
768
97
18
919
921
176
12
519
145
38
50
24
213
446
24
715
125
740
19
252
17
316
24
348
66
13
820
612
912
215
14
623
917
712
016
111
325
394
25
191
18
481
20
825
298
23
811
642
23
113
5
Massic
acti
vit
y,
Bq
/kg
Laboratory code
Water 01 Cs-134 Target value: 21.4 (0.2) Bq/kg MARB = 15% in 2014 WW
IAEA
Bias trend analysis (Cs-134 water-hay)
World-wide
2012
245 participants

11/4/2014
13
IAEA
ALMERA
2012
52 participants
Bias trend analysis (Cs-134 water-hay)
IAEA
Japan
2012
47 participants
Bias trend analysis (Cs-134 water-hay)

11/4/2014
14
IAEA
ALMERA
2012
52 participants
Bias trend analysis (Cs-137 water-hay)
IAEA
Japan
2012
47 participants
Bias trend analysis (Cs-137 water-hay)

11/4/2014
15
IAEA
Overall performance including all analytes
IAEA
Gap analysis

11/4/2014
16
IAEA
Response time
IAEA
Performance due to the rapid reporting

11/4/2014
17
IAEA
Conclusions, experiences
• The laboratories pay more attention for the perferct analysis and
corrections if they participating in several consecutive PT
• true coincidence summing effect
• self attenuation of the sample
• dry content (moisture content)
• The proper uncertainty estimation still a challange
• The there is a significant difference in the performance between the
ALMERA a WW group
• The BIAS trend analysis is a powerful tool to demonstrate the
significant analytical difficulties
• The method related performance evaluation definitly shows the areas to
be improved
IAEA
Thank you
for your
attention!

11/4/2014
18
IAEA
U in soil 2011
0
10
20
30
40
50
60
70
80
90
100177
167
11
204
27
173
84
181 9
208
122
166
72
137
52
50
140
231
150
199
17
53
82
80
71
15
157
164
190
48
76
168
216
229
198
226
45
64
158
14 5
98
112
134
142
36
47
117
159
152
86
85
223
68
222
215
54
149
132
30 4
118
191
154
120
57
213
43
74
151
183
184
233
29
197 1
13
94
235
38
73
135
179
25
88
26
51
146
103
113
42
63
155
138
93
125
211 3
Bq
/kg
Laboratory code
IAEA
U in soil 2012
0
5
10
15
20
25
30
35
40
45
387 347 363 340 341 334 339 385 361 332 374 338 386 365 333 344 331 366 376 388 382 348 389 345 349 360 371 356 381 370 342 337
Mas
sic
acti
vity
, Bq
/kg
dry
Laboratory code

11/4/2014
19
IAEA
U in soil 2011 WW
0
10
20
30
40
50
60
70
80
90
100
177
167
11
204
27
173
84
181 9
208
122
166
72
137
52
50
140
231
150
199
17
53
82
80
71
15
157
164
190
48
76
168
216
229
198
226
45
64
158
14 5
98
112
134
142
36
47
117
159
152
86
85
223
68
222
215
54
149
132
30 4
118
191
154
120
57
213
43
74
151
183
184
233
29
197 1
13
94
235
38
73
135
179
25
88
26
51
146
103
113
42
63
155
138
93
125
211 3
Bq
/kg
Laboratory code
Sample-04 Soil, 238U