IaaS Price Performance Analysis: Top 14 Cloud Providers
16
IaaS Performance and Value Analysis A study of performance among the Top 14 public cloud infrastructure providers By Cloud Spectator and the Cloud Advisory Council October 15, 2013
-
Upload
kenny-mu-li -
Category
Documents
-
view
183 -
download
1
description
A study on the performance and pricing of the top 14 IaaS providers in the industry based on CPU, RAM, disk, and network performance.
Transcript of IaaS Price Performance Analysis: Top 14 Cloud Providers

IaaS Performance and Value Analysis A study of performance among the Top 14 public cloud infrastructure providers By Cloud Spectator and the Cloud Advisory Council October 15, 2013

Copyright Cloud Spectator, LLC 2013 | Non-commercial Use Only 1
Table of Contents
Execut ive Summary 2
Overv iew 2
F ind ings 2
Exper iment In format ion 3
Pr ice-Per formance Va lue : The C loudSpecs Score 3
CL IENT Conf igura t ions and Costs 3
SERVER Conf igura t ions and Costs 4
Add i t iona l Server In format ion 4
Notes 4
Genera l Sys tem Per formance 5
About the Test 5
Resu l ts 5
CPU Per formance 7
About the Test 7
Resu l ts 7
RAM Per formance 9
About the Test 9
Resu l ts 9
D isk Per formance 11
About the Test 11
Resu l ts 11
In terna l Network Per formance 13
About the Test 13
Resu l ts 13
Conc lus ion 15
About C loud Specta tor & C loud Adv isory Counc i l 15
Contac t In format ion 15

Copyright Cloud Spectator, LLC 2013 | Non-commercial Use Only 2
Executive Summary
Overv iew Transparency in virtual server performance is a crucial component for vendor selection. As listed on Table 2.3 within the Experiment Information (Additional Server Information) section, hardware varies among providers; thus, performance is not standardized nor guaranteed. This document reports the performance information of 14 of the largest Infrastructure as a Service (IaaS) providers in the United States. While many of the providers serve clients globally with data centers worldwide, Cloud Spectator and the Cloud Advisory Council conducted this study exclusively in each provider’s US data center. Running across a period of 10 consecutive days, the information in this report detail performance results on each provider’s system, including component-level tests measuring CPU, disk, RAM, and internal network. Performance data is related with cost of servers to acquire a price-performance value index, which is used to compare value among providers based on the results. This index is called the CloudSpecs Score. For more information on how the CloudSpecs Score is calculated, please see the section Experiment Information (Price-Performance Value: The CloudSpecs Score).
F ind ings Table 1.1 lists an overview of the top providers from each comparison. Only the top 3 within each category are listed. The Performance Leaders category exclusively ranks IaaS providers from best to worst performance results. The CloudSpecs Leaders category ranks providers based on their CloudSpecs price-performance index, a relational integer from 1-100 (100 is the highest score) used to compare each provider’s value. For general system performance, Virtustream received the highest value score in the CloudSpecs Leaders segment. With performance exclusively, Tier 3 ranks first. The IaaS offerings of HP Cloud, SoftLayer, Tier 3, and Virtustream consistently rank as both Performance Leaders and CloudSpecs Leaders throughout the study. A combination of effective pricing and strong performance places those providers within the top tier of these categories. Savvis is ranked on several of the CloudSpecs Leaders boards, and a Performance Leader of internal network performance. Microsoft Azure emerges as a CloudSpecs Leader in system performance; Dimension Data’s offering ranks as a CloudSpecs Leader for disk performance.
C loudSpecs Leaders Per formance Leaders
Sys tem Virtustream HP Cloud Microsoft Azure
Tier 3 Virtustream HP Cloud
C loudSpecs Leaders Per formance Leaders
CPU Savvis Virtustream HP Cloud
SoftLayer Tier 3 Virtustream
D isk HP Cloud Virtustream Dimension Data’s
Tier 3 HP Cloud Virtustream
RAM HP Cloud Savvis Tier 3
Tier 3 HP Cloud SoftLayer
In terna l Network
Savvis Virtustream Tier 3
Virtustream Tier 3 Savvis
Table 1.1

Copyright Cloud Spectator, LLC 2013 | Non-commercial Use Only 3
Experiment Information
Cloud Spectator monitors the CPU, RAM, storage, and internal network performance of over 20 of the world’s most recognized IaaS services to understand important aspects of virtual server performance. Tests are run three times per day, 365 days per year to capture variability in addition to performance level. Tests are chosen based on reliability and practicality. The goal is to provide a standard for VM performance comparison, giving consumers an indication of which services would be best for their application(s). T ime Frame Tests were run for ten (10) consecutive days on all providers from October 1, 2013 through October 10, 2013
Prov iders Amazon AWS
Dimension Data’s OpSource Fujitsu GoGrid HP Cloud IBM SmartCloud Enterprise+ Joyent
Microsoft Azure Rackspace Savvis SoftLayer (Acquired by IBM) Tier 3 Verizon Terremark Virtustream
Tests Su i tes Unixbench
Phoronix Test Suite
Pr ice-Per formance Va lue: The C loudSpecs Score The CloudSpecs score calculates the relationship between the cost of a virtual server per hour and the performance average seen from each provider. The scores are relational to each other; e.g., if Provider A scores 50 and Provider B scores 100, then Provider B delivers 2x the performance value in terms of cost. The highest value provider will always receive a score of 100, and every additional provider is pegged in relation to that score. The calculation is:
• (Provider Average Performance Score) / (Provider Cost per Hour) = VALUE • The largest VALUE is then taken as the denominator to peg other VALUES. • [(Provider’s VALUE) / (Largest VALUE)] * 100 = CloudSpecs Score (CS Score)
CL IENT Conf igurat ions and Costs The CLIENT virtual machine is used in this study to run all benchmark tests. General Information Client Configuration Provider Offering Name Data Center vCPU(s) RAM (GB) Disk (GB) OS Cost/Hour Amazon AWS EC2 US-east-1a 2 7.5 50 Ubuntu 12.04 $0.25 Dimension Data’s OpSource Public Cloud US East 2 2 4 60 Ubuntu 12.04 $0.19 Fujitsu Cloud IaaS Trusted Public S5 Sunnyvale, CA 2 15 60 CentOS 6.4 $1.00 GoGrid Cloud Hosting US West 1 4* 4 200 Ubuntu 12.04 $0.32 HP Public Cloud US West AZ 2 4 120 Ubuntu 12.04 $0.14 IBM SmartCloud Enterprise+ Raleigh, USA 2 4 60 Red Hat Ent 5.9 $0.19 Joyent Compute Service US-east-1 4* 4 150 Ubuntu 12.04 $0.29 Microsoft Azure Infrastructure Services West US 2 3.5 130 Ubuntu 12.04 $0.12 Rackspace Cloud Servers Dallas (DFW) 2 4 160 Ubuntu 12.04 $0.24 Savvis SavvisDirect Sterling, VA 2 4 50 Ubuntu 12.04 $0.12 SoftLayer CloudLayer Compute Dallas 5 2 4 100 Ubuntu 12.04 $0.22 Tier 3 Enterprise Cloud US East (NYC) 2 4 50 Ubuntu 12.04 $0.35 Verizon Terremark vCloud Express Miami, FL 2 4 54 Ubuntu 10.04 $0.40 Virtustream xStream West Coast (San Francisco) 2 4 50 Ubuntu 12.04 $0.17
Table 2.1 *4 vCPU systems were throttled to 2 vCPUs by cutting the vCPUs from the kernel with cat /proc/cpuinfo -> sudo sh –c “echo 0 > /sys/devices/system/cpu/cpux/online” where x are the third and fourth cores.

Copyright Cloud Spectator, LLC 2013 | Non-commercial Use Only 4
SERVER Conf igurat ions and Costs The SERVER virtual machine is used in this study to transmit data across the internal network for network testing within the data center. General Information Server Configuration Provider Offering Name Data Center vCPU(s) RAM (GB) Disk (GB) OS Cost/Hour Amazon AWS EC2 US-east-1a 1 1.7 50 Ubuntu 12.04 $0.07 Dimension Data OpSource Public Cloud US East 2 1 2 30 Ubuntu 12.04 $0.09 Fujitsu Cloud IaaS Trusted Public S5 Sunnyvale, CA 0.25 1.7 60 CentOS 6.4 $0.13 GoGrid Cloud Hosting US West 1 2 2 100 Ubuntu 12.04 $0.16 HP Public Cloud US West AZ 2 2 60 Ubuntu 12.04 $0.07 IBM SmartCloud Enterprise+ Raleigh, USA 1 2 60 Red Hat Ent 5.9 $0.12 Joyent Compute Service US-east-1 1 2 66 Ubuntu 12.04 $0.06 Microsoft Azure Infrastructure Services West US 1 1.75 139 Ubuntu 12.04 $0.06 Rackspace Cloud Servers Dallas (DFW) 2 4 160 Ubuntu 12.04 $0.24 Savvis SavvisDirect Sterling, VA 1 2 50 Ubuntu 12.04 $0.07 SoftLayer CloudLayer Compute Dallas 5 1 2 100 Ubuntu 12.04 $0.11 Tier 3 Enterprise Cloud US East (NYC) 1 2 50 Ubuntu 12.04 $0.20 Verizon Terremark vCloud Express Miami, FL 1 2 29 Ubuntu 10.04 $0.21
Virtustream xStream West Coast (San Francisco) 1 4 50 Ubuntu 12.04 $0.17 Table 2.2
Add i t iona l Server In format ion Additional server information details the processor, compiler, kernel, and filesystem type used for each virtual machine. Keep in mind that this information may change depending on the location of a virtual machine from data center to physical server. General Information Additional Server Information Provider OS Processor Compiler Kernel Filesystem Amazon AWS Ubuntu 12.04 Intel Xeon E5507 GCC 4.6 3.2.0-48-virtual (x86_64) Ext2/ext3 Dimension Data Ubuntu 12.04 Intel Xeon E5-4650 GCC 4.6 3.2.0-53-generic (x86_64) Ext4 Fujitsu CentOS 6.4 Intel Xeon X5570 GCC 4.4.7 2.6.32-358.18.1.el6.x86_64 (x86_64) Ext3 GoGrid Ubuntu 12.04 Intel Xeon X5650 GCC 4.6 3.2.0-31-virtual (x86_64) Ext3 HP Ubuntu 12.04 QEMU Virtual GCC 4.6 3.2.0-40-virtual (x86_64) Ext2/ext3 IBM Red Hat Ent 5.9 QEMU Virtual GCC 4.1.2 2.6.18-348.18.1el5 (x86_64) Ext3 Joyent Ubuntu 12.04 Intel Xeon E5645 GCC 4.6 3.8.6-joyent-ubuntu-12-opt (x86_64) Ext2/ext3 Microsoft Azure Ubuntu 12.04 AMD Opteron 4171 HE GCC 4.6 3.2.0-40-virtual (x86_64) Ext4 Rackspace Ubuntu 12.04 AMD Opteron 4332 HE GCC 4.6 3.2.0-24-virtual (x86_64) Ext2/ext3 Savvis Ubuntu 12.04 Intel Xeon X5650 GCC 4.6 3.0.0-12-server (x86_64) Ext3 SoftLayer Ubuntu 12.04 Intel Xeon E31270 GCC 4.6 3.2.0-41-virtual (x86_64) Ext3 Tier 3 Ubuntu 12.04 Intel Xeon E5-2680 GCC 4.6 3.2.0-53-generic (x86_64) Ext4 Verizon Terremark Ubuntu 10.04 AMD Opteron 8389 GCC 4.4.3 2.6.32-51-server (x86_64) Ext4 Virtustream Ubuntu 12.04 Intel Xeon X5680 GCC 4.6 3.5.0-23-generic (x86_64) Ext4
Table 2.3
Notes • Out of the 14 providers tested, three did not offer Linux distribution Ubuntu 12.04. These are Fujitsu (using CentOS 6.4), IBM (using Red Hat
Enterprise 5.9), and Verizon’s Terremark (using Ubuntu 10.04). o Terremark’s distribution of Linux Ubuntu ran into some problems with the CloudSpecs benchmark application; as a result, not all data points
were collected on Terremark. The internal network test was not affected. • Configuration of offerings varied. 5 providers could not match the suggested CLIENT configuration: Amazon AWS, Fujitsu, GoGrid, Joyent, and Microsoft
Azure. Under those circumstances, providers were as closely matched as possible to a dual-core configuration. Cloud Spectator provisioned quad-core virtual machines on GoGrid and Joyent to match RAM, and sliced CPU from the kernel to behave as a dual-core system.
• Fujitsu’s CLIENT system is unique; its RAM allocation for a dual-core system is above that of any other provider on the list, at 15GB for two cores. Cost of its servers is reflective of the resources at $1.00 per hour, also above the cost of any other provider on the list.
• Cloud Spectator attempted to include CSC in the performance analysis but could not create an account given the timeframe for this round of testing.
Copyright Cloud Spectator, LLC 2013 | Non-commercial Use Only 5
General System Performance
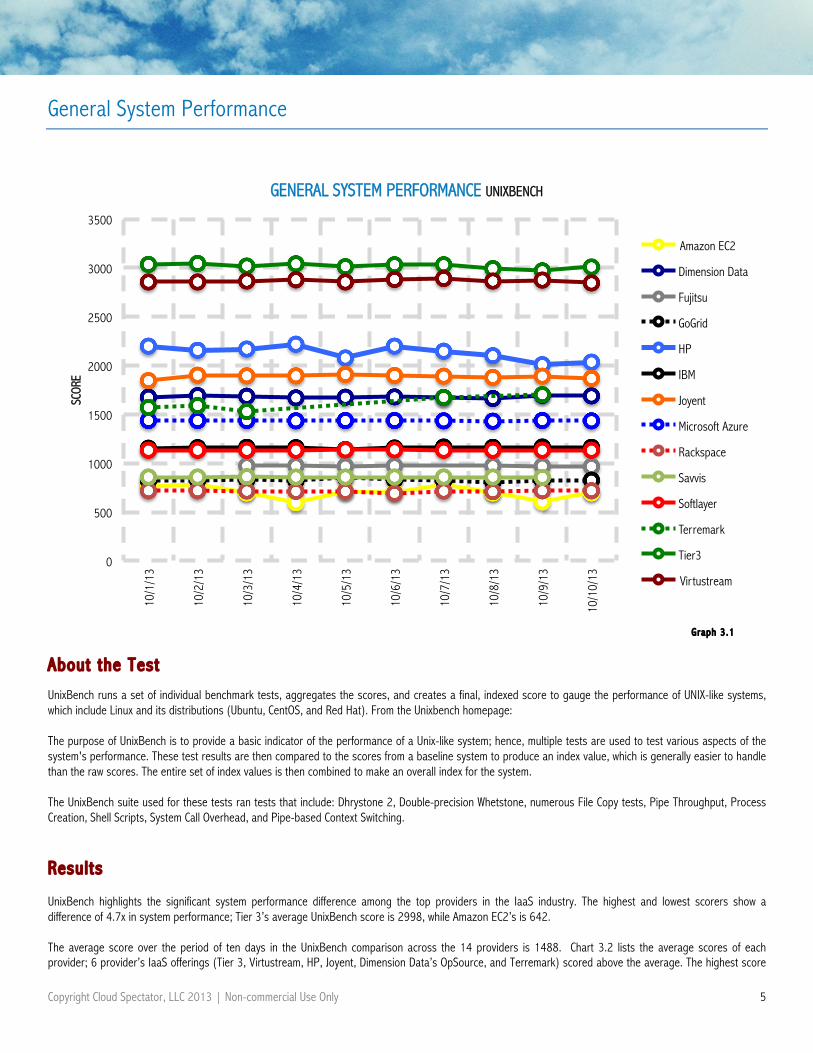
About the Test UnixBench runs a set of individual benchmark tests, aggregates the scores, and creates a final, indexed score to gauge the performance of UNIX-like systems, which include Linux and its distributions (Ubuntu, CentOS, and Red Hat). From the Unixbench homepage: The purpose of UnixBench is to provide a basic indicator of the performance of a Unix-like system; hence, multiple tests are used to test various aspects of the system's performance. These test results are then compared to the scores from a baseline system to produce an index value, which is generally easier to handle than the raw scores. The entire set of index values is then combined to make an overall index for the system. The UnixBench suite used for these tests ran tests that include: Dhrystone 2, Double-precision Whetstone, numerous File Copy tests, Pipe Throughput, Process Creation, Shell Scripts, System Call Overhead, and Pipe-based Context Switching.
Resu l ts UnixBench highlights the significant system performance difference among the top providers in the IaaS industry. The highest and lowest scorers show a difference of 4.7x in system performance; Tier 3’s average UnixBench score is 2998, while Amazon EC2’s is 642. The average score over the period of ten days in the UnixBench comparison across the 14 providers is 1488. Chart 3.2 lists the average scores of each provider; 6 provider’s IaaS offerings (Tier 3, Virtustream, HP, Joyent, Dimension Data’s OpSource, and Terremark) scored above the average. The highest score
0
500
1000
1500
2000
2500
3000
3500
10/1
/13
10/2
/13
10/3
/13
10/4
/13
10/5
/13
10/6
/13
10/7
/13
10/8
/13
10/9
/13
10/1
0/13
SCOR
E
GENERAL SYSTEM PERFORMANCE UNIXBENCH
Amazon EC2
Dimension Data
Fujitsu
GoGrid
HP
IBM
Joyent
Microsoft Azure
Rackspace
Savvis
Softlayer
Terremark
Tier3
Virtustream
Graph 3.1

Copyright Cloud Spectator, LLC 2013 | Non-commercial Use Only 6
achieved across all iterations of tests and providers is 3046, which was received by Tier 3 on October 2, 2013. Virustream scored the next highest score, 2891, on October 7, 2013. Generally, scores are consistent and stable performance can be expected across most providers over time. Using standard deviation as a measurement of performance fluctuation, the provider with the highest amount of variability in scores throughout the test period was Amazon EC2. Expressed as a percentage of the average (i.e., coefficient of variation or CV), Amazon EC2 experiences 10% fluctuation. 7 providers experienced a fluctuation of ≤1% (Fujitsu, Dimension Data’s OpSource, Rackspace, Savvis, SoftLayer, Virustream, and Microsoft Azure).
After applying the cost of each provider (costs can be found in Table 2.1 in Experiment Information – CLIENT Configurations and Costs), a new ranking emerges that compares value of price to performance (for more information on the CloudSpecs Score, see Experiment Information – Price-Performance Value: The CloudSpecs Score). Due to its higher cost, Tier 3 drops to 5TH in value from 1ST in performance. Virtustream’s combination of low cost and high performance results in its ranking as best value provider for system performance. HP Cloud and Microsoft Azure come in second and third, respectively, due to their pricing. While Microsoft Azure’s average performance falls slightly below the overall average (see Chart 3.2), it offers one of the lowest prices for dual-core VMs, which translates to price-performance value in its service. Because of its below-average performance and high price, Fujitsu ranks last in system performance in a CloudSpecs price-performance comparison; in fact, due to its high price of $1.00 per hour, Fujitsu falls in many CloudSpecs score rankings. The high cost is due to the unique configuration of its dual-core IaaS offering, which pairs the CPU with 15GB of RAM, a significantly higher amount of RAM than any other provider’s dual-core offering in the test.
100
90
71
52
51
43
38
36
31
24
18
15
15
6
0 10 20 30 40 50 60 70 80 90 100
Virtustream HP
Microsoft Azure Dimension Data
Tier3 Savvis Joyent
IBM Softlayer
Terremark Rackspace
Amazon EC2 GoGrid Fujitsu
CLOUDSPECS SCORE UNIXBENCH
2998
2846
2110
1869
1667
1630
1434
1151
1133
972
859
809
712
642
0 500 1000 1500 2000 2500 3000
Tier3 Virtustream
HP Joyent
Dimension Data Terremark
Microsoft Azure IBM
Softlayer Fujitsu Savvis GoGrid
Rackspace Amazon EC2
AVERAGE SCORES UNIXBENCH
Chart 3 .1
Chart 3 .2

Copyright Cloud Spectator, LLC 2013 | Non-commercial Use Only 7
CPU Performance
About the Test From the Phoronix Test Suite, the 7-zip File Compression benchmark runs p7zip’s integrated benchmark feature to calculate the number of instructions a CPU can handle per second (measured in millions of instructions per second, or MIPS) when compressing a file.
Resu l ts Similar to system performance, CPU performance also highlights the variability of expected performance across the top IaaS providers in the industry. Table 4.1 lists the processors behind each virtual machine used in the test; a majority of providers use Intel-based processors. SoftLayer (Intel Xeon E31270), which scores the highest MIPS in this period of testing, achieved an average of 6445 MIPS, and Amazon EC2 (Intel Xeon E5507), which scored the lowest MIPS in this period of testing, achieved an average of 2887 MIPS. That is a difference of 2.2x in CPU performance. The average MIPS across the 14 tested providers is 4517. Half of the providers (SoftLayer, Tier 3, Virtustream, Fujitsu, Savvis, HP Cloud, and GoGrid) scored, on average, above that threshold. All of those providers also ran the tested virtual machines on Intel processors. Performance fluctuation remained low for CPU performance as well; the highest percentage of fluctuation
0
1000
2000
3000
4000
5000
6000
7000
10/1
/13
10/2
/13
10/3
/13
10/4
/13
10/5
/13
10/6
/13
10/7
/13
10/8
/13
10/9
/13
10/1
0/13
MIL
LION
S OF
INST
RUCT
IONS
PER
SEC
OND
CPU PERFORMANCE 7ZIP FILE COMPRESSING
Amazon EC2
Fujitsu
GoGrid
HP
IBM
Joyent
Dimension Data
Rackspace
Savvis
Softlayer
Terremark
Tier3
Virtustream
Microsoft Azure
Provider Processor Amazon AWS Intel Xeon E5507 Dimension Data Intel Xeon E5-4650 Fujitsu Intel Xeon X5570 GoGrid Intel Xeon X5650 HP QEMU Virtual IBM QEMU Virtual Joyent Intel Xeon E5645 Microsoft Azure AMD Opteron 4171 HE Rackspace AMD Opteron 4332 HE Savvis Intel Xeon X5650 SoftLayer Intel Xeon E31270 Tier 3 Intel Xeon E5-2680 Verizon Terremark AMD Opteron 8389 Virtustream Intel Xeon X5680 Tab le 4 .1
Graph 4.1

Copyright Cloud Spectator, LLC 2013 | Non-commercial Use Only 8
occurred with Amazon EC2, which scored a CV of 14%. The steadiest performers (those with CV of <2%) were Savvis, SoftLayer, and Virtustream. No provider achieved a CV of less than 1%.
With respect to the CloudSpecs score, SoftLayer falls to 4TH below Savvis, Virtustream, and HP Cloud. Savvis ranked 4TH for average performance, but increased in ranking due to its competitive pricing, equating to a better value for users. Similarly, Virtustream and HP Cloud rose from 3RD and 6TH to 2ND and 3RD, respectively. Once again, Fujitsu falls last due to its high price. When only factoring in performance, its virtual machine achieved a position in the top 5 highest scores.
100
86
85
77
70
61
55
48
45
38
37
30
23
13
0 10 20 30 40 50 60 70 80 90 100
Savvis Virtustream
HP Softlayer
Microsoft Azure Dimension Data
IBM Rackspace
Tier3 Joyent GoGrid
Amazon EC2 Terremark
Fujitsu
CLOUDSPECS SCORE 7-ZIP COMPRESSION
6445
6013
5579
5066
4559
4545
4520
4425
4357
4186
3966
3505
3185
2887
0 1000 2000 3000 4000 5000 6000 7000
Softlayer Tier3
Virtustream Fujitsu Savvis
HP GoGrid
Dimension Data Rackspace
Joyent IBM
Terremark Microsoft Azure
Amazon EC2
AVERAGE MIPS 7-ZIP COMPRESSION
Chart 4 .1
Chart 4 .2

Copyright Cloud Spectator, LLC 2013 | Non-commercial Use Only 9
Disk Performance
About the Test Part of the Phoronix Test Suite, Dbench can be used to stress a filesystem or a server to see which workload it becomes saturated and can also be used for prediction analysis to determine "How many concurrent clients/applications performing this workload can my server handle before response starts to lag?" It is an open source benchmark that contains only file-system calls for testing the disk performance. For the purpose of comparing disk performance, write results are recorded.
Resu l ts Average write speed across the list of tested providers is 328 Mbps. Tier 3, which ranks highest in average performance across the 10-day period, has a disk speed of 2x the average, at 657 Mbps. Savvis’s performance is unique for these results. Falling far below average, Savvis delivers 6 Mbps write speed for the period of the experiment. When first running the test, Cloud Spectator’s development team re-entered Savvis’s virtual machine to cross check the application. Two virtual disks were partitioned for the virtual machine; one for the operating system (xvda) and one for the tests (xvdb). Running manual checks using dd to confirm the results of dbench, xvda was achieving write speeds of 150 MB/s while xvdb was achieving write speeds of only 6 MB/s. Cloud Spectator proceeded to format the filesystem in the case of a possibility that the performance is related to filesystem fragmentation, but the results remained the same after formatting. Following conclusion of this study, the development team continued its investigation on Savvis’s write speed by cloning the
0
100
200
300
400
500
600
700
800
900
10/1
/13
10/2
/13
10/3
/13
10/4
/13
10/5
/13
10/6
/13
10/7
/13
10/8
/13
10/9
/13
10/1
0/13
MEG
ABYT
ES P
ER S
ECON
D
DISK PERFORMANCE DBENCH
Amazon EC2
Dimension Data
Fujitsu
GoGrid
HP
IBM
Joyent
Microsoft Azure
Rackspace
Savvis
Softlayer
Terremark
Tier3
Virtustream
Graph 5.1

Copyright Cloud Spectator, LLC 2013 | Non-commercial Use Only 10
CLIENT server and performing write tests again. The new results showed up significantly higher, around 125 Mb/s. Unfortunately, as the low results were not a result of errors in the experiment, the results are valid and used in this experiment. For stability, 3 providers (Dimension Data, Rackspace, and Savvis) scored a CV of <1%. For this test, the least-stable provider is GoGrid at 27% CV. Tier 3 comes in at a close second with a CV of 25%, despite being the highest-performing provider.
Considering pricing in this instance lowers Tier 3 from top performance provider to 4TH in rank for value. HP, which showed the second best performance, moves quickly to first in value with its competitive pricing. Virtustream also moves up to second due to its low cost.
100
77
67
40
35
24
22
19
19
16
12
12
4
1
0 20 40 60 80 100 120
HP Virtustream
Dimension Data Tier3
Joyent Rackspace
GoGrid Microsoft Azure
Amazon EC2 IBM
Softlayer Terremark
Fujitsu Savvis
CLOUDSPECS SCORE DBENCH
657 650
612 593
478 324
273 224
217 193
140 121
108 7
0 100 200 300 400 500 600 700
Tier3 HP
Virtustream Dimension Data
Joyent GoGrid
Rackspace Amazon EC2
Terremark Fujitsu
IBM Softlayer
Microsoft Azure Savvis
AVERAGE SPEED DBENCH
Chart 5 .1
Chart 5 .2

Copyright Cloud Spectator, LLC 2013 | Non-commercial Use Only 11
RAM Performance
About the Test RAMspeed/SMP is a memory performance benchmark for multi-processor machines running UNIX-like operating systems, which include Linux and its distributions (Ubuntu, CentOS, and Red Hat). Within the RAMspeed/SMP suite, the Phoronix Test Suite conducts benchmarks using a set of Copy, Scale, Add, and Triad tests from the *mem benchmarks (INTmem, FLOATmem, MMXmem, and SSEmem) in BatchRun mode to enable high-precision memory performance measurement through multiple passes with averages calculated per pass and per run.
Resul ts The average RAM performance result across the 10-day study is 9163 mbps. Half of the providers (Tier 3, HP Cloud, SoftLayer, IBM SmartCloud, Joyent, Dimension Data, and Rackspace) score above the average, while the other half fall below. Tier 3’s RAM performs significantly higher than any other provider, with an average of 19 Gbps. HP Cloud and SoftLayer come in 2ND and 3RD, respectively, though their performance scores are far behind at 11 Gbps. Terremark, with the lowest performance results, averages 3.7 Gbps. The difference in performance ranges by 5x between the lowest and highest results. Regarding performance stability, all providers have a CV of <7% except Amazon EC2. Graph 6.1 illustrates the RAM performance fluctuation of Amazon EC2. Its results jump between a low of 5.5 Gbps and a high of15.5 Gbps. Amazon EC2 scores a CV of 51%. The 5 most stable RAM performance providers scored <1% CV (Fujitsu, IBM SmartCloud, Joyent, Savvis, and Microsoft Azure).
0
5000
10000
15000
20000
25000
10/1
/13
10/2
/13
10/3
/13
10/4
/13
10/5
/13
10/6
/13
10/7
/13
10/8
/13
10/9
/13
10/1
0/13
MEG
ABYT
ES P
ER S
ECON
D
RAM PERFORMANCE RAMSPEED SMP
Amazon EC2
Dimension Data
Fujitsu
GoGrid
HP
IBM
Joyent
Microsoft Azure
Rackspace
Savvis
Softlayer
Terremark
Tier3
Virtustream
Graph 6.1

Copyright Cloud Spectator, LLC 2013 | Non-commercial Use Only 12
While Tier 3’s RAM performance scores 1.6x and 1.7x higher than HP and Savvis, respectively, the latter two providers score higher with the CloudSpecs score. HP and Savvis have one of the lowest costs per hour across providers, giving them a strong advantage in value ranking when comparing price with performance. Tier 3’s cost is more than double that of HP and Savvis. The cost actually drops Tier 3’s value (CloudSpecs Score of 64) to a score comparable with Microsoft Azure, (CloudSpecs Score of 62) though when considering performance only, Tier 3 still performs 3x better than Microsoft Azure on average across the study. Terremark and Fujitsu’s combination of low performance and high cost works against them from a value angle, lowering their ranking for the CloudSpecs score. Microsoft Azure, which scores the second lowest performance value for RAM performance at 6361 Mbps, ranks as top 5 for value due to its competitive cost; in fact, it is one of the least expensive providers tested, tied with Savvis’s SavvisDirect offering at $0.12 per hour.
100
75
64
63
62
61
59
56
46
40
32
25
11
8
0 10 20 30 40 50 60 70 80 90 100
HP Savvis Tier3 IBM
Microsoft Azure Softlayer
Dimension Data Virtustream Rackspace
Joyent Amazon EC2
GoGrid Terremark
Fujitsu
CLOUDSPECS SCORE RAMSPEED SMP
19092
11983
11501
10187
9915
9609
9523
8179
7680
6925
6913
6757
6361
3658
0 2000 4000 6000 8000 10000 12000 14000 16000 18000 20000
Tier3 HP
Softlayer IBM
Joyent Dimension Data
Rackspace Virtustream
Savvis GoGrid Fujitsu
Amazon EC2 Microsoft Azure
Terremark
AVERAGE RAM MBPS RAMSPEED SMP
Chart 6 .1
Chart 6 .2

Copyright Cloud Spectator, LLC 2013 | Non-commercial Use Only 13
Internal Network Performance
About the Test Iperf is a benchmark tool used to measure bandwidth performance. For the purpose of this benchmark, Cloud Spectator set up 2 virtual machines within the same availability zone/data center to measure internal network throughput.
Resu l ts As illustrated by Graph 7.1, the type of connection between servers marks a significant difference in throughput of the virtual cloud environments. Providers Virtustream, Tier 3, Terremark, and Savvis deliver a larger bandwidth in their offerings, resulting in higher throughput for the user. Between those providers and the others emerges a large gap in throughput. The average throughput across the 14 tested providers is 2165 Mbit/s. Only 4 providers (Virtustream, Tier 3, Savvis, and Terremark) achieve higher throughput than that average. Virtustream and Tier 3 achieve throughput of more than 6 Gbit/s on average. The significance in internal network throughput variation across providers can be viewed on Chart 7.2. Virtustream, with an average of 6763 Mbit/s, provides over 138x internal network throughput than HP Cloud, which has an average of 49 Mbit/s. The performance stability of internal network fluctuates as well; the highest fluctuation is seen in Virtustream with a CV of 21%. Virtustream’s CV equates to a performance variability with a low of 5.7 Gbit/s to a high of 10.7 Gbit/s. The 10.7 Gbit/s throughput contributes to the high average Virtustream receives. Microsoft Azure, SoftLayer, IBM SmartCloud, and HP Cloud’s network are the most stable, with a CV of less than 1%.
0
2000
4000
6000
8000
10000
12000
10/1
/13
10/2
/13
10/3
/13
10/4
/13
10/5
/13
10/6
/13
10/7
/13
10/8
/13
10/9
/13
10/1
0/13
MEG
ABIT
S PE
R SE
COND
INTERNAL NETWORK IPERF
Amazon EC2
Dimension Data
Fujitsu
GoGrid
HP
IBM
Joyent
Microsoft Azure
Rackspace
Savvis
Softlayer
Terremark
Tier3
Virtustream
Graph 7.1

Copyright Cloud Spectator, LLC 2013 | Non-commercial Use Only 14
9 Providers (IBM, GoGrid, Microsoft Azure, Fujitsu, Joyent, Amazon EC2, SoftLayer, Rackspace, and HP Cloud) have an average throughput of less than 1 Gbit/s.
With respect to value, Savvis receives the highest CloudSpecs score for internal network throughput. Virtustream comes in second. The top 4 performing providers also achieve the Top 4 CloudSpecs scores. Even with the variance in pricing, the significant gap between the throughput results of the Top 4 and the other providers outweighs the effect cost may have on the value. A gap emerges in the CloudSpecs score as well, due to the factored in price; all scores are pegged relatively to the highest-scoring provider (Savvis, in this case), but no provider receives a score between 40 and 60, and only Virtustream receives a score higher than 60. SoftLayer and Rackspace’s low performance combined with expensive cost results in a CloudSpecs score of only 1. Fujitsu receives a score of 1 as well, despite its significantly higher performance, due to the expensive cost of its virtual machines. HP, though one of the lowest-priced providers in this experiment, also received a score of 1 because of its low throughput.
100
64
37
29
23
13
9
5
4
3
1
1
1
1
0 10 20 30 40 50 60 70 80 90 100
Savvis Virtustream
Tier3 Terremark
Dimension Data Microsoft Azure
IBM GoGrid Joyent
Amazon EC2 Fujitsu
Softlayer HP
Rackspace
CLOUDSPECS SCORE IPERF
6763
6306
5946
5497
1977
917
793
759
421
396
289
102
95
49
0 1000 2000 3000 4000 5000 6000 7000
Virtustream Tier3
Savvis Terremark
Dimension Data IBM
GoGrid Microsoft Azure
Fujitsu Joyent
Amazon EC2 Softlayer
Rackspace HP
AVERAGE MBIT/S THROUGHPUT IPERF Chart 7 .2
Chart 7 .1

Copyright Cloud Spectator, LLC 2013 | Non-commercial Use Only 15
Conclusion
With a lack of standardized hardware and virtualization platforms, measuring performance and value of cloud providers is an important step in selecting an IaaS provider. Results in this document have shown the variability in performance from similar dual-core offerings. Cross-provider comparison variability can be expected in different-sized offerings as well. By applying cost to the performance results, a comparison can be made that further exposes the value of each provider’s offering. High price and high performance are not correlated. For example, Fujitsu, which costs $1.00 per hour, offers a lower performance in general than Tier 3, which costs $0.35 per hour; even $0.35 per hour is considered high for the dual-core systems. A provider like Virtustream finds a balance between low cost ($0.17 per hour) and high performance, earning high CloudSpecs scores on most tests. Some providers, like HP Cloud, do not necessarily perform best in any tests, but their competitive pricing preserves their value, making up for the lost performance.
About C loud Spectator Cloud Spectator is the premier, international cloud analyst group focused on infrastructure pricing and server performance. Since 2011, Cloud Spectator has monitored the cloud Infrastructure industry on a global scale and continues to produce research reports for businesses to make informed purchase decisions by leveraging its CloudSpecs utility, an application that automates live server performance tests 3 times a day, 365 days a year with use of open source benchmark tests. Currently, the CloudSpecs system actively tracks 20 of the top IaaS providers around the world.
Contact In format ion Email: [email protected] Phone: +1 (617) 300-0711 Cloud Spectator 800 Boylston Street 16TH Floor Boston, MA 02119
About the C loud Adv isory Counc i l The Cloud Advisory Council is a not-for-profit organization with a mission to develop the next generation cloud architecture, to provide cloud designers and IT managers with the tools needed to enable computing in the cloud, to strengthen the qualification and integration of cloud solutions and to provide best practices. The Cloud Advisory Council is led by a broad coalition of industry practitioners and corporations. Cloud Advisory Council Objectives:
• Definition of the next generation of cloud architecture • Providing open specification for cloud infrastructures • Publications of best practices for optimizing cloud efficiency and utilization • Enable ease-of-use with comprehensive cloud management and tools
Contact In format ion Email: [email protected] or [email protected] Cloud Advisory Council 350 Oakmead PKWY 100 Sunnyvale CA, 94085