![SUPREME COURT OF INDIA ON RECORD DO NOT SEEK … · imran ali khan and ors. abhay kumar[r-1], [r-2] for for exemption from filing o.t. on ia 194450/2019 ia no. 194450/2019 - exemption](https://static.fdocuments.net/doc/165x107/61125566d7c4874e1e53ce93/supreme-court-of-india-on-record-do-not-seek-imran-ali-khan-and-ors-abhay-kumarr-1.jpg)
IA Filing Doc 1.1.2022 Final
136
© Copyright 2021 National Council on Compensation Insurance, Inc. All Rights Reserved. Iowa Advisory Rates, Assigned Risk Rates, and Rating Values Filing Proposed Effective January 1, 2022
Transcript of IA Filing Doc 1.1.2022 Final
© Copyright 2021 National Council on Compensation Insurance, Inc. All Rights Reserved.
Iowa
Advisory Rates,Assigned Risk Rates, and Rating Values Filing
Proposed Effective January 1, 2022

Dan Nelson, MCM, WCPRegulatory Division
(P) 561-893-3784 (F) 561-893-5472 Email: [email protected]
August 4, 2021
901 Peninsula Corporate Circle, Boca Raton, FL 33487 • www.ncci.com
Honorable Doug Ommen Insurance Commissioner Iowa Insurance Division 1963 Bell Avenue Des Moines, IA 50315
Re: Iowa Advisory Rates, Assigned Risk Rates, and Rating Values Filing Proposed Effective January 1, 2022
Dear Commissioner Ommen:
In accordance with the applicable statutes and regulations of the state of Iowa, we are filing for your consideration and approval of prospective rates and rating values for the Iowa voluntary and assigned risk markets to become effective January 1, 2022 for new and renewal policies.
This filing proposes an overall average decrease of –5.5% to the voluntary rate level and an overall average decrease of –9.1% to assigned risk rate level. The advisory prospective rates of the voluntary market are used as a basis for the rates in the assigned risk market.
Reported COVID-19-related claims have been excluded from the data on which this filing is based to better reflect the conditions likely to prevail during the proposed effective period. After an in-depth review and analysis, NCCI has determined that its standard ratemaking methodologies continue to remain appropriate for use in this year’s filing.
This filing is made exclusively on behalf of the companies that have given valid consideration for the express purpose of fulfilling regulatory rate filing requirements and other private use of this information.
In the enclosed appendix is a list of companies which, as of the time this filing is submitted, are eligible to reference this information. The inclusion of a company on this list merely indicates that the company, or the group to which it belongs, is affiliated with NCCI in this state, or has licensed this information as a nonaffiliate, and is not intended to indicate whether the company is currently writing business or is even licensed to write business in this state.
As always, if you should have any questions or need additional information, please do not hesitate to contact Dan Benzshawel at (561) 893-3093 or me at (561) 893-3784.
Sincerely,
Dan Nelson, MCM, WCP State Relations Executive

Copyright 2021 National Council on Compensation Insurance, Inc. All Rights Reserved.
These materials are comprised of NCCI actuarial judgment and proprietary and confidential information which are valuable assets of NCCI and are protected by copyright and other intellectual property laws. Any persons in the legal possession of these materials are required to maintain them in the strictest confidence and shall implement sufficient safeguards to protect the confidentiality of such materials in the same respect as it protects its own intellectual property. NCCI will seek appropriate legal remedies for any unauthorized use, sale, reproduction, distribution, preparation of derivative works, or transfer of this material, or any part thereof in any media. Authorized uses of these materials are governed by one or more agreements between NCCI and an end user. Unless expressly authorized by NCCI, you may not copy, create derivative works (by way of example, create or supplement your own works, or other materials), display, perform, or use the materials, in whole or in part, in any media and in any manner including posting to a web site.
NCCI MAKES NO REPRESENTATIONS OR WARRANTIES RELATING TO THESE MATERIALS, INCLUDING ANY EXPRESS, STATUTORY OR IMPLIED WARRANTIES INCLUDING THE IMPLIED WARRANTY OF MERCHANTABILITY AND FITNESS FOR A PARTICULAR PURPOSE. ADDITIONALLY, AUTHORIZED END USERS ASSUME RESPONSIBILITY FOR THE USE OF, AND FOR ANY AND ALL RESULTS DERIVED OR OBTAINED THROUGH THE USE OF SUCH MATERIALS.

Iowa
Workers Compensation Rate Filing – January 1, 2022
Actuarial Certification
I, Dan Benzshawel, am a Director and Actuary for the National Council on Compensation Insurance, Inc. I am a Fellow of the Casualty Actuarial Society and a member of the American Academy of Actuaries, and I meet the Qualification Standards of the American Academy of Actuaries to provide the actuarial report contained herein.
The information contained in this report has been prepared under my direction in accordance with applicable Actuarial Standards of Practice as promulgated by the Actuarial Standards Board. The Actuarial Standards Board is vested by the U.S.-based actuarial organizations with the responsibility for promulgating Actuarial Standards of Practice for actuaries providing professional services in the United States. Each of these organizations requires its members, through its Code of Professional Conduct, to observe the Actuarial Standards of Practice when practicing in the United States.
________________________ Dan Benzshawel, FCAS, MAAA Director and Actuary Actuarial and Economic Services
© Copyright 2021 National Council on Compensation Insurance, Inc. All Rights Reserved.

Iowa
Workers Compensation Rate Filing – January 1, 2022
Disclosures
Purpose of the Report
The purpose of this report is to provide the proposed voluntary and assigned risk rates for workers compensation policies in Iowa, proposed to be effective January 1, 2022. The intended users of this report are:
The Iowa Insurance Division Affiliated carriers, for their reference in determining workers compensation rates
Scope
The prospective advisory rates for the voluntary market are intended to cover the indemnity and medical benefits provided under the system, the expenses associated with providing these benefits (loss adjustment expenses), and any other costs associated with providing workers compensation insurance (such as commissions, taxes, etc.).
Each insurance company offering workers compensation insurance in Iowa may: a) adopt the advisory rates which include provisions for expenses based on NCCI’scompilation of industry expense data, orb) deviate from the advisory rates.
Employers unable to secure coverage in the voluntary market can apply for such coverage in the assigned risk market. The proposed assigned risk rates are intended to cover the indemnity and medical benefits provided under the system, the expenses associated with providing these benefits (loss adjustment expenses), and any other costs associated with providing workers compensation insurance (such as commissions, taxes, etc.).
Data Sources and Dates
The overall average advisory rate level change is based on a review of Financial Call Data, which is an aggregation of workers compensation data annually reported to NCCI. In this filing, Financial Call Data submissions received after June 1, 2021 were not considered for inclusion in the analysis.
Advisory rate level changes at the classification code level are based on Unit Statistical Plan Data, which is the audited exposure, premium, and loss information reported to NCCI on a policy level. In this filing, Unit Statistical Data submissions received after June 3, 2021 were not considered for inclusion in the analysis.
© Copyright 2021 National Council on Compensation Insurance, Inc. All Rights Reserved.

Iowa
Workers Compensation Rate Filing – January 1, 2022
Disclosures
NCCI categorizes catastrophic events as those that incur aggregate workers compensation losses in excess of $50 million per occurrence. NCCI’s standard ratemaking methodology excludes catastrophe-related losses from the calculation of rates since these events are not considered to be predictive of future experience. NCCI is proposing to treat the COVID-19 pandemic as a catastrophic event and, therefore, the losses from reported COVID-19-related claims have been excluded from the underlying data in this year’s analysis to better reflect the conditions likely to prevail during this filing’s proposed effective period.
In some areas, NCCI’s analysis also relies on other data sources, which are reviewed for reasonableness and are referenced in the filing where applicable.
This filing was prepared as of June 29, 2021. Therefore, events that occurred after this date that may have a material impact on workers compensation costs in this jurisdiction have not been considered in the analysis.
NCCI maintains several data reporting initiatives and programs to assist carriers to report data and to ensure that the data that is reported to NCCI is complete, accurate, and reported in a timely fashion. Occasionally, a carrier’s data submission is not available for use in an NCCI filing either because the data was not reported prior to the filing, had quality issues, or NCCI determined that the data that was reported should not be included in the filing based on NCCI's actuarial judgment.
Data for all carriers writing at least one-tenth of one percent of the Iowa workers compensation written premium volume have been included in the experience period on which this filing is based.
Other exclusions are made for the purposes of analysis, but do not have a material impact on the proposed changes in this filing.
Risks and Uncertainty
This filing includes assumptions and projections concerning the future. As with any prospective analysis, there exists estimation uncertainty in these assumptions and projections. Areas of this analysis subject to estimation uncertainty that could have a material impact on the final results include the following:
Projection of future loss development Selection of loss ratio trends Potential impact of changes to laws and/or regulations
© Copyright 2021 National Council on Compensation Insurance, Inc. All Rights Reserved.

Iowa
Workers Compensation Rate Filing – January 1, 2022
Disclosures
In addition, any future changes to workers compensation law or regulations that apply retroactively to policies or benefit claims on policies in the proposed effective period may have a significant impact on the adequacy of the rates proposed in this filing.
The course of the COVID-19 pandemic and related considerations, such as future economic conditions and the labor market, contribute additional uncertainty when estimating future costs. After an in-depth review and analysis of NCCI’s general ratemaking methodologies, NCCI has determined that those approaches remain appropriate for use in this filing.
© Copyright 2021 National Council on Compensation Insurance, Inc. All Rights Reserved.

Iowa
Workers Compensation Rate Filing – January 1, 2022
Table of Contents
Part 1 Filing Overview
- Executive Summary- Overview of Methodology- Summary of Selections- Selections Underlying the Proposed Changes- Additional Proposed Changes
Part 2 Proposed Values
- Proposed Voluntary Market Advisory Rates and Rating Values- Proposed Assigned Risk Rates and Rating Values- Proposed Values for Inclusion in the Experience Rating Plan Manual- Proposed Values for Inclusion in the Retrospective Rating Plan Manual
Part 3 Supporting Exhibits
- Exhibit I: Determination of the Indicated Advisory Rate Level Change- Exhibit II: Workers Compensation Expense Program- Appendix A: Factors Underlying the Proposed Rate Level Change- Appendix B: Calculations Underlying the Advisory Rate Change by Classification- Appendix C: Memoranda for Laws and Assessments- Appendix D: Internal Rate of Return Analysis- Appendix E: Calculation of Factor to Convert Voluntary Rates to Assigned Risk Rates- Appendix F: Derivation of Experience Rating Values
Part 4 Additional Information
- Definitions- NCCI Affiliate List- Key Contacts
© Copyright 2021 National Council on Compensation Insurance, Inc. All Rights Reserved.

Iowa
Workers Compensation Rate Filing – January 1, 2022
Part 1 Filing Overview
- Executive Summary
- Overview of Methodology
- Summary of Selections
- Selections Underlying the Proposed Changes
- Additional Proposed Changes
© Copyright 2021 National Council on Compensation Insurance, Inc. All Rights Reserved.
Page 9 of 136

Iowa
Workers Compensation Rate Filing – January 1, 2022
Executive Summary
Based on its review of the most recently available data, NCCI has proposed an overall average workers compensation voluntary rate level change of – 5.5% and assigned risk rate level change of – 9.1% to become effective January 1, 2022.
Key Components Percentage Change
Experience, Trend and Benefit Change – 8.2% Production and General Expense Change + 0.6% Taxes & Fee Change 0.0% Loss-based Expense Change + 0.9% Profit & Contingency Change + 1.4% Proposed Change in Overall Voluntary Rate Level – 5.5% Assigned Risk Differential Change – 3.8% Proposed Change in Overall Assigned Risk Rate Level – 9.1%
Key Observations:
The overall rate level change in this filing is based on premium and loss experience for policy years 2018 and 2019, evaluated as of December 31, 2020. The reported claims resulting from COVID-19 have been excluded from the data on which this filing is based.
Iowa’s claim frequency shows a long-term pattern of decline.
The average indemnity cost per lost-time claim figures, adjusted for wage growth, have been fairly level to slightly increasing in recent years, while the average medical cost per lost-time claim figures have been increasing.
The rate change varies by classification code, each of which belongs to one of 5 industry groups. The average change by industry group ranges from –6.5% for Office and Clerical to –4.5% for Contracting.
Additional Notable Change(s) Proposed in the Filing:
Catastrophic Handling of the COVID-19 Pandemic Federal-Classification (F-Class) Ratemaking Calendar Year 2020 Wage Adjustment Expense Constant Removal Factor
© Copyright 2021 National Council on Compensation Insurance, Inc. All Rights Reserved.
Page 10 of 136

Iowa
Workers Compensation Rate Filing – January 1, 2022
Overview of Methodology
Aggregate Ratemaking
NCCI’s approach to determining the proposed overall average advisory rate level change utilizes widely accepted ratemaking methodologies. The approach employed in this filing includes the following steps:
The reported historical premium totals are projected to an ultimate basis and adjusted to the current pure premium level
The excess loss portion of individual large claims are removed from reported aggregate losses, based on an Iowa specific large loss threshold
The reported historical limited indemnity and medical loss totals are projected to an ultimate basis and adjusted to the current benefit level
Ratios of losses to pure premium are projected to the cost levels expected in the rate effective period
Ultimate, trended, limited losses are adjusted to an unlimited basis via a non-catastrophe excess ratio (with excess ratios at limits beyond $50 million set equal to zero)
Proposed benefit level and expense changes are applied to the projected cost ratios
The indicated average advisory rate level change is calculated for the years in the filing’s experience period. If the final projected cost ratios are greater (less) than 1.000, then an increase (decrease) in the average rate level is indicated.
Class Ratemaking
Once the proposed overall average advisory rate level change has been determined, NCCI separately determines rates per $100 of payroll for each workers compensation job classification (class); the advisory rates and year-over-year changes vary by class. Three sets of pure premiums are combined as part of each class code’s advisory rate calculation based on the volume of available data for that job classification. The three sets of pure premiums are:
State-specific payroll and loss experience (“indicated”) Currently-approved pure premium adjusted to the proposed level (“present on rate
level”) Countrywide experience adjusted to state conditions (“national”)
Assigned Risk Rates
The proposed assigned risk rates are then determined for each job classification as the product of the classification’s advisory voluntary rate and an assigned risk differential.
Note: The methodology and assumptions used in this filing may not be applicable to or relevant for another purpose, including but not limited to NCCI filings in other jurisdictions.
© Copyright 2021 National Council on Compensation Insurance, Inc. All Rights Reserved.
Page 11 of 136

Iowa
Workers Compensation Rate Filing – January 1, 2022
Summary of Selections
The following is a summary of selections underlying the voluntary and assigned risk rates proposed to be effective January 1, 2022, along with the selections underlying the filing effective January 1, 2021.
Voluntary and Assigned Risk Rates
Currently Approved January 1, 2021
Proposed Effective January 1, 2022
Experience Period Policy Years 2017 and 2018 Policy Years 2018 and 2019
Premium Development 3-year average 3-year average
Basis of Loss Experience Average of Paid and
Paid+Case losses Average of Paid and
Paid+Case losses
Paid Loss Development 3-year average 3-year average
Paid+Case Loss Development 5-year average 5-year average
Tail Factors Selected Selected
Indemnity Annual Loss Ratio Trend Factor 0.970 0.965
Medical Annual Loss Ratio Trend Factor 0.990 0.985
Loss Adjustment Expense Provision 16.9% 17.9%
Base Threshold for Limiting Losses $7,481,806 $7,421,321
Large Loss Excess Ratio 3.1% 3.0%*
Production and General Expenses 23.8% 24.2%
Premium Taxes and Assessments 2.4% 2.4%
Profit and Contingencies Provision 1.0% 2.0%
Maximum Minimum Premium** $1,000 $1,000
Assigned Risk Differential 1.300 1.250
Classification Swing Limits (applied by Industry Group)
+/-25% +/-25%
* The proposed value reflects the updated hazard group assignment changes as detailed in the approved Item Filing B-1442. ** MMP varies for Farming and Agricultural class codes.
© Copyright 2021 National Council on Compensation Insurance, Inc. All Rights Reserved.
Page 12 of 136

Iowa
Workers Compensation Rate Filing – January 1, 2022
Selections Underlying the Proposed Changes
Experience and Development
NCCI analyzed the emerging experience of Iowa workers compensation policies in recent years. The primary focus of our analysis was on premiums and losses from policy years 2018 and 2019 evaluated as of December 31, 2020. The most recently available full policy year is 2019 since the last policy had an effective date of December 31, 2019 and did not expire until December 31, 2020. During this year’s analysis, which included an assessment of pandemic claim-related impacts, the use of the two most recently available full policy years of data was selected as most appropriate in terms of providing balance between stability and responsiveness.
NCCI performs analysis on different subsets of data including (i) paid losses and (ii) the sum of paid losses plus case reserves. For use in this filing, NCCI utilized loss development factors based on each of these two loss aggregations. This is consistent with NCCI filings made in the past several years in Iowa. Loss development factors are needed since paid losses and case reserve estimates on a given claim change over time until the claim is finally closed. The loss development factors are based on how paid losses and case reserve estimates changed over time for claims from older years. The specific development link ratio selections underlying this filing are shown below:
A three-year average of historical premium development factors A three-year average of historical paid loss development factors through a 19th report A five-year average of historical paid plus case loss development factors through a 19th
report Loss development tail factors from a 19th report to ultimate were selected based on a
review of the 10 most recently available factors
After analysis and consideration of the most recent data, and the assessment of COVID-19 impacts, NCCI has determined that its standard development procedures and methodologies remain appropriate.
Trend
This filing relies primarily on the experience from policy years 2018 and 2019. However, the proposed voluntary and assigned risk rates are intended for use with policies with effective dates starting on January 1, 2022. It is necessary to use trend factors that forecast how much the future Iowa workers compensation experience will differ from the past. These trend factors measure anticipated changes in the amount of indemnity and medical benefits as compared with anticipated changes in the amount of workers’ wages. For example, if benefit costs are expected to grow faster than wages, then a trend factor greater than zero is indicated. Conversely, if wages are expected to grow faster than benefit costs, then a trend factor less than zero is indicated.
© Copyright 2021 National Council on Compensation Insurance, Inc. All Rights Reserved.
Page 13 of 136

Iowa
Workers Compensation Rate Filing – January 1, 2022
Selections Underlying the Proposed Changes
While historical changes in claim frequency and average cost per case were also reviewed, NCCI applies loss ratio trend factors in the determination of the proposed overall average advisory rate level change.
After analysis and consideration of the most recent data, and the assessment of COVID-19 impacts, NCCI has determined that its standard trend procedures and methodologies remain appropriate.
© Copyright 2021 National Council on Compensation Insurance, Inc. All Rights Reserved. Page 14 of 136

Iowa
Workers Compensation Rate Filing – January 1, 2022
Selections Underlying the Proposed Changes
The following few charts show a measure of the number of workplace injuries (claim frequency) and the average cost of each of these injuries (claim severity).
Iowa’s lost-time claim frequency has generally declined for the past several years as shown immediately above. The data in this chart reflects premiums at today’s advisory rate level, and a common wage level.
10
15
20
25
30
2005 2006 2007 2008 2009 2010 2011 2012 2013 2014 2015 2016 2017 2018 2019
Policy Year
Iowa Claim FrequencyPer Million of On-Leveled, Wage-Adjusted Premium
© Copyright 2021 National Council on Compensation Insurance, Inc. All Rights Reserved.
Page 15 of 136

Iowa
Workers Compensation Rate Filing – January 1, 2022
Selections Underlying the Proposed Changes
Iowa’s average indemnity costs per case in excess of wage growth have trended slightly upward over time for the period shown. Iowa’s average medical costs per case in excess of wage growth have generally trended upward over time for the period shown.
15,000
20,000
25,000
30,000
35,000
40,000
45,000
2005 2006 2007 2008 2009 2010 2011 2012 2013 2014 2015 2016 2017 2018 2019
Policy Year
Iowa Indemnity Average Cost Per CaseAdjusted to a Common Wage Level, Based on Average of Paid and Paid+Case Losses
15,000
20,000
25,000
30,000
35,000
40,000
45,000
2005 2006 2007 2008 2009 2010 2011 2012 2013 2014 2015 2016 2017 2018 2019
Policy Year
Iowa Medical Average Cost Per CaseAdjusted to a Common Wage Level, Based on Average of Paid and Paid+Case Losses
© Copyright 2021 National Council on Compensation Insurance, Inc. All Rights Reserved.
Page 16 of 136

Iowa
Workers Compensation Rate Filing – January 1, 2022
Selections Underlying the Proposed Changes
Loss ratios result after combining observed changes in Iowa’s average claim frequency with corresponding changes in Iowa’s average cost per case.
Based on our analysis this year, we are proposing to decrease the annual indemnity loss ratio trend from –3.0% to –3.5% and to decrease the annual medical loss ratio trend –1.0% to –1.5%.
0.00
0.10
0.20
0.30
0.40
0.50
0.60
0.70
0.80
2005 2006 2007 2008 2009 2010 2011 2012 2013 2014 2015 2016 2017 2018 2019
Policy Year
Iowa Indemnity Loss Ratio HistoryBased on Average of Paid and Paid+Case Losses
0.00
0.10
0.20
0.30
0.40
0.50
0.60
0.70
0.80
2005 2006 2007 2008 2009 2010 2011 2012 2013 2014 2015 2016 2017 2018 2019
Policy Year
Iowa Medical Loss Ratio HistoryBased on Average of Paid and Paid+Case Losses
© Copyright 2021 National Council on Compensation Insurance, Inc. All Rights Reserved.
Page 17 of 136
Iowa
Workers Compensation Rate Filing – January 1, 2022
Selections Underlying the Proposed Changes
Expenses
The proposed advisory rates include a provision for workers compensation expenses. The following provides detail on the expense provisions accounted for in the advisory rates.
Loss-Based Expenses
The proposed advisory rates include a provision for loss adjustment expenses (LAE). These are expenses associated with the handling of workers compensation claims. LAE is included in the rates by using a ratio of loss adjustment expense dollars to loss dollars (called the LAE provision). In this filing, NCCI is proposing to increase the current LAE provision from 16.9% to 17.9% of losses. Please see Exhibit II for additional detail.
Production and General Expense
The proposed advisory rates include a provision for production expenses (including commissions) and general expenses.
The current provision in the advisory rates for production expense is 18.3% of premium. This filing proposes no change to the provision of 18.3%.
The current provision in the advisory rates for general expenses is 5.5% of premium. This filing proposes to increase the provision to 5.9%.
The overall advisory rate change due to the proposed production and general expense provisions is an increase of 0.6%.
Premium Taxes and Assessments
The current provision in the rates for taxes and assessments is 2.4% of premium. This filing proposes no change to the provision of 2.4%. The breakdown of the proposed provision is shown below:
Premium Tax 1.0% Second Injury Fund 1.1% Miscellaneous 0.3% Taxes and Assessments 2.4%
Profit and Contingency Provision
By law, Iowa’s advisory rates must be determined such that Iowa’s workers compensation insurers can be expected to earn a return that is adequate, fair, and not excessive. Analysis and determination of a profit and contingency provision is necessary to ensure this premise is maintained.
© Copyright 2021 National Council on Compensation Insurance, Inc. All Rights Reserved.
Page 18 of 136

Iowa
Workers Compensation Rate Filing – January 1, 2022
Selections Underlying the Proposed Changes
Current advisory rates contain a profit and contingency of 1.0%. Based upon the results from its latest internal rate of return model, NCCI is proposing to increase the current profit and contingency provision to 2.0% in this rate filing.
Assigned Risk Market
An overall average decrease of –9.1% to the current assigned risk rate level is being proposed effective January 1, 2022.
A number of Assigned Risk programs have been instituted in Iowa. These programs help to assure that the assigned risk market is self-funding. This means that the premium collected in the assigned risk market should pay for losses generated by employers in that market. These programs also encourage employers in the assigned risk market to seek coverage in the voluntary market. They are listed below:
Assigned Risk Program Effective Date Removal of Assigned Risk Premium Discounts 04/16/1987 Take-out Credit Program 01/01/1992 Assigned Risk Adjustment Program (ARAP) 07/01/1992 Assigned Risk Differential (Decreased to 1.25) 01/01/2022
In this filing, NCCI is proposing to decrease the current Assigned Risk Differential from 1.300 to 1.250. This filing proposes no change to any other current assigned risk pricing programs.
© Copyright 2021 National Council on Compensation Insurance, Inc. All Rights Reserved. Page 19 of 136
Iowa
Workers Compensation Rate Filing – January 1, 2022
Additional Proposed Changes
Catastrophic Handling of the COVID-19 Pandemic Overview NCCI recently reviewed its actuarial catastrophe methodology as a result of the COVID-19 pandemic. Currently, NCCI’s Catastrophe (other than Certified Acts of Terrorism) Provision accounts for single-event losses resulting only from earthquakes, noncertified acts of terrorism, or catastrophic industrial accidents that exceed $50 million in aggregate workers compensation losses. However, the COVID-19 pandemic has shown that there are other perils that can result in catastrophic losses. In the calculation of rates, NCCI is proposing to use data that excludes the impact of the catastrophic COVID-19 event. NCCI is proposing for the Catastrophe (other than Certified Acts of Terrorism) Provision to contemplate the exposure to all events or perils that could result in aggregate workers compensation losses in excess of $50 million (which may include pandemics). At this time, NCCI is proposing no change to the currently approved Miscellaneous Value. Due to the uncertainty surrounding quantifying the impact future pandemics could have on the workers compensation system, it is appropriate to contemplate all catastrophic perils, including pandemics, within the Catastrophe (other than Certified Acts of Terrorism) definition without a change in the advisory value. This handling recognizes that there are additional catastrophic exposures (which may include pandemics) on workers compensation system costs that should be considered in the calculation of rates in adherence with the Actuarial Standards of Practice (ASOPs). Background The COVID-19 pandemic has shown that pandemics have the potential to be a catastrophic peril on workers compensation system costs. In this filing, COVID-19 is being treated as a catastrophe and all reported data from COVID-19 pandemic claims have been excluded from ratemaking to better reflect the conditions likely to prevail in the filing’s proposed effective period beginning on January 1, 2022. Both the definition of catastrophe and the treatment of catastrophe losses in property and casualty ratemaking are addressed in the Actuarial Standards of Practice (ASOP). As defined in ASOP 39 (“Treatment of Catastrophe Losses in Property/Casualty Insurance Ratemaking”), a
© Copyright 2021 National Council on Compensation Insurance, Inc. All Rights Reserved.
Page 20 of 136
Iowa
Workers Compensation Rate Filing – January 1, 2022
Additional Proposed Changes
catastrophe is “a relatively infrequent event or phenomenon that produces unusually large aggregate losses.” ASOP 39 also states that “consideration should be given to the impact of catastrophes and that procedures should be developed to include an allowance for catastrophe exposure in the rate.” In the calculation of rates, NCCI uses ratemaking data that excludes the impact of catastrophes because the full unadjusted impact of the catastrophe experience is not considered predictive on a prospective basis. NCCI’s current advisory Catastrophe (other than Certified Acts of Terrorism) Provision accounts for single-event aggregate workers compensation losses resulting only from earthquakes, noncertified acts of terrorism, or catastrophic industrial accidents that exceed $50 million. This $50 million threshold applies per occurrence, across all states for which claims arise from a single event or peril. In Iowa, the currently approved Catastrophe (other than Certified Acts of Terrorism) Provisions are $0.01 per $100 of payroll and can be found in the Miscellaneous Values in this filing. The COVID-19 pandemic has shown that there are other perils that can result in catastrophic losses and that regardless of the specific peril, any event exceeding $50 million should be removed from the data used in ratemaking. NCCI is proposing to revise the Catastrophe (other than Certified Acts of Terrorism) Provision to contemplate a single event or peril resulting in a group of claims with aggregate workers compensation losses in excess of $50 million. This revision recognizes that there are other potentially catastrophic perils with exposure on workers compensation system costs. NCCI is proposing no change at this time to the currently approved provision of $0.01 per $100 of payroll. Changes to the Catastrophe (Other Than Certified Acts of Terrorism) Premium Endorsement In Item Filing P-1418, NCCI proposes to revise the Catastrophe (Other Than Certified Acts of Terrorism) Premium Endorsement in NCCI’s Forms Manual of Workers Compensation and Employers Liability Insurance (Forms Manual) to define “Catastrophe (other than Certified Acts of Terrorism)” as “[a] single event or peril resulting in a group of claims with aggregate workers compensation losses in excess of $50 million. This $50 million threshold applies per occurrence, across all states for which claims arise from a single event or peril.” This item is to become effective for new and renewal policies effective on and after 12:01 a.m. August 1, 2022. This lead time will provide insurance companies ample time to incorporate the new endorsement into their processes. This revision will not change the currently approved advisory Miscellaneous Value.
© Copyright 2021 National Council on Compensation Insurance, Inc. All Rights Reserved.
Page 21 of 136

Iowa
Workers Compensation Rate Filing – January 1, 2022
Additional Proposed Changes
Federal-Classification (F-Class) Ratemaking
This filing proposes to revise the current approach used to determine the rates for those classification codes that are subject to the benefits provided under the United States Longshore and Harbor Workers Compensation Act (USL&HW Act). The proposed approach has several advantages over the current methodology that has been in effect, without significant changes, for more than 20 years. These advantages include:
Greater year-to-year stability in rates A simplified ratemaking approach Direct recognition that federal act USL&HW benefits are the same across
jurisdictions
For reference, the F-classifications in Iowa have a total of $3 million in payroll in the latest policy period used in the filing; this represents roughly 0.1% of Iowa’s total payroll.
The USL&HW Act is a federal law that provides indemnity and medical benefits to employees such as longshore workers, harbor workers, ship repair workers, shipbuilders, and other employees who perform the loading, unloading, repairing, or building of a vessel or dock. It applies to such employees while working on US navigable waters and while working on any adjoining pier, wharf, dry dock, terminal, building way, marine railway, or other area adjoining such navigable waters customarily used for the loading, unloading, repairing, or building of a vessel. It does not cover masters or members of the crew of a vessel.
An injured F-class worker (or beneficiary) may receive state or federal act benefits, based on the exposure at the time of the accident. While federal and state act losses are reported separately, payroll is reported on a combined basis. Therefore, F-class rates must reflect both state and federal act benefits.
In the past, updates were made to NCCI’s general class ratemaking methodology, which have increased the year-to-year stability for the F-class codes. Even so, relative to the industrial codes, the F-class codes have generally exhibited a higher level of volatility associated with their lower volume of data.
NCCI recently completed a review of the current F-class methodology. The proposed F-class approach incorporates a countrywide pure premium based on 10 policy years of F-class data, state-specific benefit relativities, and F-class code relativities.
The proposed approach recognizes that F-class experience across all jurisdictions consists primarily of federal act benefits. These benefits are based on a federal benefit structure and are subject to a federal medical fee schedule—neither of which vary by individual jurisdiction.
© Copyright 2021 National Council on Compensation Insurance, Inc. All Rights Reserved.
Page 22 of 136

Iowa
Workers Compensation Rate Filing – January 1, 2022
Additional Proposed Changes
Accordingly, the proposed methodology leverages this consistency by combining the data at a countrywide level—rather than relying on smaller volumes of state-specific data during the F-class ratemaking process. This change, alongside the expansion to 10 policy years of data, helps increase the stability of these low volume and unique classifications.
The state act benefits portion of the reported F-class experience is initially adjusted to a countrywide level and then back down to a state level using industrial codes’ data as a proxy. This allows a greater volume of combined data to be used in the F-class ratemaking process as well as retaining the ability to directly reflect state-specific cost differences.
For more details, refer to Appendix B-IV.
© Copyright 2021 National Council on Compensation Insurance, Inc. All Rights Reserved.
Page 23 of 136

Iowa
Workers Compensation Rate Filing – January 1, 2022
Additional Proposed Changes
Calendar Year 2020 Wage Adjustment NCCI’s standard methodology is to adjust frequency and severity values included in its rate filings to a common wage level before analyzing trends that may be present in those values. This practice allows NCCI to analyze trends above and beyond changes that may be due solely to wage inflation. More specifically, in this year’s filing, the frequency and severity adjustments would have incorporated the state’s estimated Calendar Year 2020 average weekly wage (AWW) level using data from the Bureau of Labor Statistics’ Quarterly Census of Employment and Wages (QCEW). In addition to the traditional growth in wages/salaries that may be expected to occur each year, the observed change in the 2019-to-2020 AWW was also impacted by COVID-19-related shifts in employment across industry sectors. While a change in industry-sector mix occurs to a small degree each year, its impact on the 2020 AWW change was unusually large, due to pandemic-related job losses in relatively low wage industries, and ignoring this effect would otherwise distort the intended nature of the adjustment. Therefore, in this year’s ratemaking analysis the 2020 AWW value was adjusted to exclude the estimated impact of the pandemic-related, industry-sector mix change. This adjustment is reflected in the frequency and severity values shown in Appendix A-III Trend Factors. The impact of the AWW adjustment is expected to be immaterial.
© Copyright 2021 National Council on Compensation Insurance, Inc. All Rights Reserved.
Page 24 of 136

Iowa
Workers Compensation Rate Filing – January 1, 2022
Additional Proposed Changes
Expense Constant Removal Factor The premium reported to NCCI, for use in determination of the overall indication, includes premium collected via the charged expense constant. The premium on-level calculation includes year-specific factors that remove the expense constant premium from the total premium reported. Currently, these expense constant removal factors are based on statewide (voluntary plus assigned risk) market data. In this filing, separate voluntary and assigned risk market-specific expense constant removal factors have been calculated for each year. This methodological enhancement recognizes and is more responsive to changes in market-specific average policy sizes that may occur over time. The overall impact of this change is expected to be negligible.
© Copyright 2021 National Council on Compensation Insurance, Inc. All Rights Reserved.
Page 25 of 136

Iowa
Workers Compensation Rate Filing – January 1, 2022
Part 2 Proposed Values
- Proposed Voluntary Market Advisory Rates and Rating Values - Proposed Assigned Risk Rates and Rating Values - Proposed Values for Inclusion in the Experience Rating Plan Manual - Proposed Values for Inclusion in the Retrospective Rating Plan Manual
© Copyright 2021 National Council on Compensation Insurance, Inc. All Rights Reserved.
Page 26 of 136

Iowa
Workers Compensation Rate Filing – January 1, 2022
Proposed Voluntary Market Advisory Rates and Rating Values
The following pages include proposed voluntary market advisory rates and rating values:
Voluntary market advisory rates, minimum premiums, expected loss rates, and d-ratios by class code, along with associated footnotes
Advisory miscellaneous values, such as:
o Maximum and minimum weekly payroll applicable for select class codes o Premium determination for Partners and Sole Proprietors o Catastrophe and Terrorism advisory voluntary rates o United States Longshore and Harbor Workers’ Compensation Coverage
Percentage
Please note the following in connection with this filing:
As a result of Item B-1397, effective January 1, 2008, a single combined rate is still calculated for Class Codes 7710 and 7711 via a payroll-weighted average of the separately indicated rates for these two class codes.
As a result of Item B-1439, effective January 1, 2021: o Class Codes 2683 and 2501 are combined to reflect the final year of a two-year
transition program and Class Code 2683 is discontinued. o Class Codes 3240 and 3257 are combined to reflect the final year of a two-year
transition program, and Class Code 3240 is discontinued. As a result of Item B-1442, effective January 1, 2022, class code hazard group changes
were incorporated.
© Copyright 2021 National Council on Compensation Insurance, Inc. All Rights Reserved.
Page 27 of 136

WORKERS COMPENSATION AND EMPLOYERS LIABILITY IOWA
Effective January 1, 2022
CLASS MIN D CLASS MIN D CLASS MIN D CODE RATE PREM ELR RATIO CODE RATE PREM ELR RATIO CODE RATE PREM ELR RATIO
0005 3.77 575 2.10 0.35 2016 3.48 543 1.94 0.35 2710 9.72 1000 4.74 0.29 0008 3.00 490 1.67 0.35 2021 3.79 577 2.04 0.33 2714 4.82 690 2.69 0.35 0016 5.43 500 2.65 0.29 2039 3.03 493 1.69 0.35 2731 4.70 677 2.62 0.35 0034 4.72 650 2.54 0.33 2041 4.45 650 2.49 0.35 2735 6.87 916 3.83 0.35 0035 2.75 463 1.48 0.33 2065 2.12 393 1.14 0.33 2759 6.62 888 3.69 0.35
0036 3.41 500 1.90 0.35 2070 5.78 796 3.11 0.33 2790 2.04 384 1.20 0.36 0037 4.00 500 1.95 0.29 2081 3.28 521 1.94 0.36 2797 5.86 805 3.46 0.36 0042 6.03 650 3.24 0.33 2089 5.45 760 3.04 0.35 2799 5.90 809 3.18 0.33 0050 7.38 972 3.60 0.29 2095 3.94 593 2.12 0.33 2802 4.92 701 2.64 0.33 0059D 0.41 – 0.10 0.25 2105 4.92 701 2.90 0.36 2835 3.76 574 2.22 0.36
0065D 0.10 – 0.02 0.29 2110 2.65 452 1.48 0.35 2836 3.59 555 2.12 0.36 0066D 0.10 – 0.03 0.33 2111 3.26 519 1.82 0.35 2841 5.23 735 2.91 0.35 0067D 0.10 – 0.03 0.33 2112 4.45 650 2.48 0.35 2881 3.21 513 1.90 0.36 0079 3.47 542 1.86 0.33 2114 3.18 510 1.88 0.36 2883 3.64 560 2.03 0.35 0083 4.94 500 2.66 0.33 2121 1.75 353 1.04 0.36 2913 – – 2.03 0.35
0106 10.15 1000 4.61 0.25 2130 2.25 408 1.21 0.33 2915 3.76 574 1.84 0.29 0113 4.58 664 2.55 0.35 2131 2.04 384 1.14 0.35 2916 3.64 560 1.78 0.29 0170 3.99 599 2.22 0.35 2143 2.90 479 1.71 0.36 2923 2.17 399 1.28 0.36 0251 3.81 579 2.05 0.33 2157 4.35 639 2.43 0.35 2942 – – 0.77 0.36 0400 – – 1.59 0.33 2172 1.87 366 0.91 0.29 2960 5.31 744 2.86 0.33
0401 11.18 A 5.08 0.25 2174 3.53 548 1.97 0.35 3004 1.85 364 0.84 0.25 0771N 0.52 – – – 2211 8.26 1000 4.03 0.29 3018 2.68 455 1.22 0.25 0908P 184.00 344 99.07 0.33 2220 2.96 486 1.60 0.33 3022 4.09 610 2.28 0.35 0913P 490.00 650 263.68 0.33 2286 – – 1.60 0.33 3027 2.45 430 1.20 0.29 0917 3.86 585 2.28 0.36 2288 4.54 659 2.53 0.35 3028 3.06 497 1.50 0.29
1005 6.92 921 2.95 0.25 2300 – – 1.66 0.35 3030 6.26 849 3.06 0.29 1016 16.32 1000 6.96 0.24 2302 2.10 391 1.13 0.33 3040 5.74 791 3.09 0.33 1164D 3.31 524 1.38 0.24 2305 2.83 471 1.38 0.29 3041 5.00 710 2.69 0.33 1165D 3.74 571 1.57 0.24 2361 2.22 404 1.19 0.33 3042 5.36 750 2.89 0.33 1320 1.76 354 0.80 0.25 2362 2.47 432 1.38 0.35 3064 4.55 661 2.45 0.33
1322 8.04 1000 3.43 0.24 2380 2.27 410 1.27 0.35 3076 3.74 571 2.09 0.35 1430 5.03 713 2.46 0.29 2386 – – 1.66 0.35 3081D 7.46 981 3.95 0.33 1438 6.06 827 2.96 0.29 2388 1.82 360 1.08 0.36 3082D 4.35 639 2.10 0.29 1452 2.60 446 1.27 0.29 2402 3.26 519 1.59 0.29 3085D 6.91 920 3.66 0.33 1463 13.66 1000 5.82 0.24 2413 2.76 464 1.49 0.33 3110 5.60 776 3.01 0.33
1472 3.64 560 1.78 0.29 2416 2.58 444 1.44 0.35 3111 3.38 532 1.88 0.35 1624D 3.57 553 1.60 0.25 2417 1.57 333 0.88 0.35 3113 2.25 408 1.21 0.33 1642 2.83 471 1.38 0.29 2501 2.98 488 1.66 0.35 3114 3.76 574 2.02 0.33 1654 4.44 648 2.17 0.29 2503 1.29 302 0.72 0.35 3118 1.75 353 1.04 0.36 1655 – – 1.38 0.29 2534 – – 1.66 0.35 3119 1.09 280 0.67 0.41
1699 3.41 535 1.66 0.29 2570 4.52 657 2.52 0.35 3122 2.27 410 1.34 0.36 1701 3.00 490 1.36 0.25 2585 4.40 644 2.37 0.33 3126 2.27 410 1.22 0.33 1710D 4.39 643 2.12 0.29 2586 3.59 555 2.00 0.35 3131 2.10 391 1.13 0.33 1741 – – 1.36 0.25 2587 2.30 413 1.28 0.35 3132 3.15 507 1.75 0.35 1747 3.16 508 1.55 0.29 2589 2.91 480 1.57 0.33 3145 2.48 433 1.34 0.33
1748 6.37 861 3.11 0.29 2600 4.78 686 2.67 0.35 3146 2.37 421 1.27 0.33 1803D 8.51 1000 3.99 0.29 2623 7.33 966 3.58 0.29 3169 3.16 508 1.76 0.35 1852 – – 0.97 0.24 2651 2.42 426 1.35 0.35 3175 – – 1.76 0.35 1853 – – 1.36 0.25 2660 2.86 475 1.69 0.36 3179 2.48 433 1.39 0.35 1860 – – 1.18 0.29 2670 – – 1.94 0.35 3180 2.43 427 1.36 0.35
1924 2.78 466 1.55 0.35 2683 – – 1.66 0.35 3188 2.52 437 1.35 0.33 1925 5.69 786 3.06 0.33 2688 3.48 543 1.94 0.35 3220 2.22 404 1.19 0.33 2002 3.29 522 1.84 0.35 2701 14.05 1000 6.40 0.25 3223 – – 1.36 0.35 2003 4.47 652 2.41 0.33 2702 23.81 1000 10.14 0.24 3224 4.20 622 2.49 0.36 2014 4.92 701 2.40 0.29 2709 9.03 1000 4.11 0.25 3227 4.22 624 2.35 0.35Refer to the Classification codes section of the Basic Manual for any state specific classification phraseology.* Refer to the Footnotes Page for additional information on this class code.
© Copyright 2021 National Council on Compensation Insurance, Inc. All Rights Reserved. Page 28 of 136

WORKERS COMPENSATION AND EMPLOYERS LIABILITY IOWA
Effective January 1, 2022
CLASS MIN D CLASS MIN D CLASS MIN D CODE RATE PREM ELR RATIO CODE RATE PREM ELR RATIO CODE RATE PREM ELR RATIO
3240 – – 1.73 0.35 4036 3.00 490 1.46 0.29 4670 – – 2.03 0.33 3241 3.23 515 1.80 0.35 4038 2.63 449 1.56 0.36 4683 3.77 575 2.03 0.33 3255 2.86 475 1.69 0.36 4053 – – 1.61 0.33 4686 2.38 422 1.16 0.29 3257 3.10 501 1.73 0.35 4061 – – 1.61 0.33 4692 0.70 237 0.39 0.35 3270 2.75 463 1.53 0.35 4062 3.00 490 1.61 0.33 4693 1.37 311 0.77 0.35
3300 5.45 760 3.21 0.36 4101 3.31 524 1.78 0.33 4703 1.77 355 0.95 0.33 3303 2.70 457 1.51 0.35 4109 0.50 215 0.28 0.35 4717 1.82 360 1.08 0.36 3307 3.39 533 1.83 0.33 4110 0.89 258 0.50 0.35 4720 2.40 424 1.29 0.33 3315 3.49 544 1.95 0.35 4111 2.04 384 1.14 0.35 4740 1.27 300 0.54 0.24 3334 2.70 457 1.45 0.33 4113 – – 1.14 0.35 4741 3.28 521 1.77 0.33
3336 2.95 485 1.59 0.33 4114 2.80 468 1.51 0.33 4751 4.73 680 2.31 0.29 3365 4.89 698 2.22 0.25 4130 3.48 543 1.94 0.35 4771N 2.95 542 1.34 0.25 3372 4.45 650 2.39 0.33 4131 5.73 790 3.19 0.35 4777 3.56 552 1.62 0.25 3373 4.95 705 2.76 0.35 4133 2.58 444 1.52 0.36 4825 0.94 263 0.46 0.29 3383 1.75 353 0.98 0.35 4149 0.86 255 0.51 0.36 4828 2.25 408 1.02 0.25
3385 1.06 277 0.59 0.35 4206 3.46 541 1.93 0.35 4829 1.21 293 0.55 0.25 3400 2.50 435 1.40 0.35 4207 3.31 524 1.51 0.25 4902 2.93 482 1.63 0.35 3507 3.43 537 1.84 0.33 4239 2.71 458 1.24 0.25 4923 1.26 299 0.68 0.33 3515 2.71 458 1.46 0.33 4240 3.61 557 2.13 0.36 5020 5.79 797 2.64 0.25 3548 1.42 316 0.79 0.35 4243 2.23 405 1.20 0.33 5022 8.43 1000 3.59 0.24
3559 4.85 694 2.61 0.33 4244 2.95 485 1.44 0.29 5037 16.38 1000 6.98 0.24 3574 1.42 316 0.79 0.35 4250 2.10 391 1.13 0.33 5040 7.80 1000 3.32 0.24 3581 1.56 332 0.87 0.35 4251 3.44 538 1.92 0.35 5057 5.72 789 2.44 0.24 3612 2.40 424 1.29 0.33 4263 4.04 604 2.17 0.33 5059 19.44 1000 8.28 0.24 3620 3.97 597 1.94 0.29 4273 3.11 502 1.68 0.33 5069 – – 8.28 0.24
3629 2.43 427 1.31 0.33 4279 2.42 426 1.18 0.29 5102 6.43 867 2.93 0.25 3632 3.21 513 1.73 0.33 4282 – – 1.18 0.29 5146 4.37 641 2.14 0.29 3634 1.72 349 0.93 0.33 4283 1.77 355 0.99 0.35 5160 3.99 599 1.70 0.24 3635 2.47 432 1.33 0.33 4299 1.99 379 1.07 0.33 5183 2.97 487 1.35 0.25 3638 2.40 424 1.34 0.35 4304 5.26 739 2.83 0.33 5188 3.38 532 1.54 0.25
3642 2.15 397 1.20 0.35 4307 1.97 377 1.16 0.36 5190 2.57 443 1.17 0.25 3643 2.38 422 1.16 0.29 4351 1.18 290 0.66 0.35 5191 0.99 269 0.48 0.29 3647 3.31 524 1.78 0.33 4352 1.77 355 0.99 0.35 5192 2.92 481 1.57 0.33 3648 1.77 355 1.05 0.36 4360 – – 0.33 0.29 5213 7.30 963 3.11 0.24 3681 0.96 266 0.54 0.35 4361 1.00 270 0.56 0.35 5215 5.35 749 2.62 0.29
3685 1.57 333 0.88 0.35 4410 3.21 513 1.79 0.35 5221 4.71 678 2.14 0.25 3719 1.11 282 0.47 0.24 4420 6.47 872 2.95 0.25 5222 13.10 1000 5.58 0.24 3724 4.66 673 1.99 0.24 4431 1.67 344 0.99 0.36 5223 4.90 699 2.40 0.29 3726 4.12 613 1.75 0.24 4432 1.31 304 0.77 0.36 5348 5.29 742 2.58 0.29 3803 2.88 477 1.61 0.35 4439 – – 1.12 0.33 5402 6.19 841 3.45 0.35
3807 3.54 549 1.98 0.35 4452 3.08 499 1.66 0.33 5403 9.12 1000 4.15 0.25 3808 4.02 602 2.17 0.33 4459 3.48 543 1.70 0.29 5437 5.71 788 2.60 0.25 3821 6.04 824 2.95 0.29 4470 2.50 435 1.35 0.33 5443 3.92 591 2.11 0.33 3822 4.62 668 2.57 0.35 4484 3.53 548 1.97 0.35 5445 5.61 777 2.39 0.24 3824 4.92 701 2.74 0.35 4493 3.00 490 1.61 0.33 5462 6.06 827 2.96 0.29
3826 0.99 269 0.53 0.33 4511 0.68 235 0.37 0.33 5472 6.38 862 2.72 0.24 3827 2.32 415 1.29 0.35 4557 2.48 433 1.21 0.29 5473 8.41 1000 3.58 0.24 3830 1.44 318 0.78 0.33 4558 2.09 390 1.12 0.33 5474 6.62 888 2.82 0.24 3851 3.03 493 1.69 0.35 4568 2.19 401 1.07 0.29 5478 4.28 631 1.95 0.25 3865 2.75 463 1.62 0.36 4581 1.19 291 0.54 0.25 5479 6.06 827 2.96 0.29
3881 4.60 666 2.48 0.33 4583 3.89 588 1.77 0.25 5480 6.75 903 3.07 0.25 4000 4.68 675 2.13 0.25 4611 1.24 296 0.69 0.35 5491 1.95 375 0.88 0.25 4021 5.41 755 2.91 0.33 4635 3.86 585 1.75 0.25 5506 7.20 952 3.28 0.25 4024D 7.22 954 3.50 0.29 4653 1.92 371 1.07 0.35 5507 4.42 646 2.01 0.25 4034 7.20 952 3.52 0.29 4665 8.38 1000 4.09 0.29 5508 – – 2.01 0.25Refer to the Classification codes section of the Basic Manual for any state specific classification phraseology.* Refer to the Footnotes Page for additional information on this class code.
© Copyright 2021 National Council on Compensation Insurance, Inc. All Rights Reserved. Page 29 of 136

WORKERS COMPENSATION AND EMPLOYERS LIABILITY IOWA
Effective January 1, 2022
CLASS MIN D CLASS MIN D CLASS MIN D CODE RATE PREM ELR RATIO CODE RATE PREM ELR RATIO CODE RATE PREM ELR RATIO
5535 6.30 853 2.68 0.24 7050M 7.79 1000 3.17 0.24 7711 46.79 1000 21.29 0.25 5537 4.31 634 2.10 0.29 7090M 6.27 850 2.66 0.24 7720 3.40 534 1.66 0.29 5551 15.07 1000 6.41 0.24 7098M 13.63 1000 5.81 0.24 7855 3.36 530 1.64 0.29 5606 1.37 311 0.58 0.24 7099M 16.94 1000 6.91 0.24 8001 2.59 445 1.44 0.35 5610 4.73 680 2.31 0.29 7133 3.75 573 1.70 0.25 8002 2.34 417 1.31 0.35
5645 9.65 1000 4.11 0.24 7151M 4.56 662 2.07 0.25 8006 2.39 423 1.41 0.36 5703 13.12 1000 6.41 0.29 7152M 6.29 852 2.73 0.25 8008 1.16 288 0.68 0.36 5705 13.88 1000 6.77 0.29 7153M 5.06 717 2.30 0.25 8010 2.08 389 1.16 0.35 5951 0.73 240 0.41 0.35 7219 7.44 978 3.39 0.25 8013 0.40 204 0.21 0.33 6003 5.71 788 2.60 0.25 7222 7.50 985 3.42 0.25 8015 0.79 247 0.43 0.33
6005 3.91 590 1.91 0.29 7225 8.56 1000 4.18 0.29 8017 1.83 361 1.08 0.36 6017 – – 3.11 0.24 7228 – – 3.39 0.25 8018 3.36 530 1.88 0.35 6018 2.52 437 1.24 0.29 7229 – – 3.39 0.25 8021 2.31 414 1.29 0.35 6045 4.86 695 2.37 0.29 7230 8.46 1000 4.56 0.33 8031 2.62 448 1.46 0.35 6204 7.78 1000 3.54 0.25 7231 7.11 942 3.83 0.33 8032 2.08 389 1.16 0.35
6206 2.83 471 1.21 0.24 7232 11.06 1000 5.04 0.25 8033 1.43 317 0.84 0.36 6213 1.74 351 0.74 0.24 7309F 10.83 1000 3.72 0.22 8037 1.83 361 1.12 0.41 6214 1.85 364 0.84 0.25 7313F 4.23 625 1.45 0.22 8039 1.78 356 1.05 0.36 6216 5.63 779 2.40 0.24 7317F 8.20 1000 2.81 0.22 8044 2.65 452 1.48 0.35 6217 4.69 676 2.00 0.24 7327F 22.50 1000 7.73 0.22 8045 0.64 230 0.36 0.35
6229 5.27 740 2.57 0.29 7333M 7.71 1000 3.29 0.25 8046 2.48 433 1.38 0.35 6233 3.38 532 1.44 0.24 7335M 8.57 1000 3.66 0.25 8047 0.94 263 0.53 0.35 6235 5.51 766 2.35 0.24 7337M 10.65 1000 4.36 0.25 8058 2.81 469 1.57 0.35 6236 6.66 893 3.25 0.29 7350F 9.48 1000 3.39 0.23 8072 0.58 224 0.34 0.36 6237 1.51 326 0.69 0.25 7360 4.00 600 1.96 0.29 8102 1.58 334 0.88 0.35
6251D 7.69 1000 3.48 0.26 7370 4.63 669 2.58 0.35 8103 2.95 485 1.59 0.33 6252D 2.92 481 1.23 0.24 7380 5.14 725 2.51 0.29 8105 – – 1.88 0.35 6260 – – 3.48 0.26 7382 4.79 687 2.58 0.33 8106 5.69 786 2.78 0.29 6306 5.24 736 2.38 0.25 7390 4.21 623 2.35 0.35 8107 3.38 532 1.54 0.25 6319 3.46 541 1.47 0.24 7394M 3.89 588 1.66 0.24 8111 2.42 426 1.30 0.33
6325 4.28 631 1.82 0.24 7395M 4.32 635 1.84 0.24 8116 2.56 442 1.37 0.33 6400 5.56 772 2.72 0.29 7398M 5.37 751 2.19 0.24 8203 8.58 1000 4.62 0.33 6503 2.65 452 1.48 0.35 7402 0.27 190 0.15 0.35 8204 5.49 764 2.95 0.33 6504 2.91 480 1.63 0.35 7403 4.36 640 2.44 0.35 8209 4.33 636 2.42 0.35 6702M* 4.08 609 1.99 0.29 7405N 1.24 370 0.70 0.35 8215 3.54 549 1.73 0.29
6703M* 5.64 780 2.64 0.29 7420 6.11 832 2.61 0.25 8227 3.60 556 1.64 0.25 6704M* 4.54 659 2.22 0.29 7421 0.93 262 0.45 0.29 8232 4.64 670 2.27 0.29 6801F 6.11 832 2.27 0.27 7422 1.72 349 0.78 0.25 8233 2.42 426 1.18 0.29 6811 6.52 877 3.18 0.29 7425 2.77 465 1.26 0.25 8235 4.76 684 2.56 0.33 6824F 7.43 977 2.76 0.27 7431N 1.18 360 0.54 0.25 8263 6.54 879 3.52 0.33
6826F 6.56 882 2.44 0.27 7445N 0.67 – – – 8264 6.30 853 3.07 0.29 6834 3.17 509 1.77 0.35 7453N 0.64 – – – 8265 6.48 873 2.94 0.25 6836 4.19 621 2.25 0.33 7502 1.72 349 0.84 0.29 8279 7.54 989 3.43 0.25 6843F 12.38 1000 4.25 0.22 7515 1.13 284 0.48 0.24 8288 7.30 963 3.92 0.33 6845F 5.97 817 2.05 0.22 7520 3.26 519 1.76 0.33 8291 4.44 648 2.39 0.33
6854 5.99 819 2.72 0.25 7538 3.49 544 1.49 0.24 8292 4.35 639 2.43 0.35 6872F 10.60 1000 3.64 0.22 7539 2.08 389 0.95 0.25 8293 8.99 1000 5.02 0.35 6874F 18.33 1000 6.30 0.22 7540 2.88 477 1.23 0.24 8304 6.45 870 2.93 0.25 6882 7.39 973 3.36 0.25 7580 2.57 443 1.25 0.29 8350 5.63 779 2.56 0.25 6884 6.38 862 2.91 0.25 7590 3.45 540 1.68 0.29 8380 2.80 468 1.51 0.33
7016M 6.08 829 2.59 0.24 7600 3.81 579 1.86 0.29 8381 1.90 369 1.02 0.33 7024M 6.76 904 2.88 0.24 7605 2.03 383 0.92 0.25 8385 2.49 434 1.34 0.33 7038M 5.64 780 2.40 0.24 7610 0.67 234 0.33 0.29 8392 2.37 421 1.40 0.36 7046M 12.27 1000 5.23 0.24 7705 5.04 714 2.72 0.33 8393 1.75 353 0.85 0.29 7047M 8.40 1000 3.43 0.24 7710 46.79 1000 21.29 0.25 8500 6.21 843 3.03 0.29Refer to the Classification codes section of the Basic Manual for any state specific classification phraseology.* Refer to the Footnotes Page for additional information on this class code.
© Copyright 2021 National Council on Compensation Insurance, Inc. All Rights Reserved. Page 30 of 136

WORKERS COMPENSATION AND EMPLOYERS LIABILITY IOWA
Effective January 1, 2022
CLASS MIN D CLASS MIN D CLASS MIN D CODE RATE PREM ELR RATIO CODE RATE PREM ELR RATIO CODE RATE PREM ELR RATIO
8601 0.38 202 0.17 0.25 9063 0.87 256 0.51 0.36 8602 1.58 334 0.77 0.29 9077F 6.16 838 2.46 0.34 8603 0.11 172 0.06 0.35 9082 1.23 295 0.76 0.41 8606 1.90 369 0.87 0.25 9083 1.32 305 0.81 0.41 8709F 5.59 775 1.92 0.22 9084 1.28 301 0.75 0.36
8719 2.21 403 1.00 0.25 9088a a a a a 8720 1.22 294 0.55 0.25 9089 1.28 301 0.75 0.36 8721 0.36 200 0.18 0.29 9093 1.37 311 0.81 0.36 8723 0.16 178 0.08 0.33 9101 4.73 680 2.79 0.36 8725 2.97 487 1.45 0.29 9102 3.56 552 1.91 0.33
8726F 2.58 444 0.96 0.27 9154 1.83 361 1.02 0.35 8734M 0.57 223 0.28 0.29 9156 3.53 548 2.08 0.36 8737M 0.51 216 0.25 0.29 9170 12.08 1000 5.48 0.25 8738M 0.70 237 0.34 0.29 9178 5.81 799 3.57 0.41 8742 0.42 206 0.21 0.29 9179 15.02 1000 9.23 0.41
8745 3.79 577 2.04 0.33 9180 6.11 832 3.29 0.33 8748 0.64 230 0.29 0.25 9182 2.60 446 1.45 0.35 8755 0.55 221 0.27 0.29 9186 13.00 1000 5.90 0.25 8799 0.66 233 0.37 0.35 9220 5.11 722 2.75 0.33 8800 1.77 355 0.99 0.35 9402 4.98 708 2.26 0.25
8803 0.06 167 0.03 0.29 9403 9.75 1000 4.44 0.25 8805M 0.27 190 0.15 0.35 9410 2.40 424 1.34 0.35 8810 0.20 182 0.11 0.35 9501 4.24 626 2.07 0.29 8814M 0.24 186 0.13 0.35 9505 4.32 635 2.32 0.33 8815M 0.34 197 0.18 0.35 9516 3.24 516 1.74 0.33
8820 0.19 181 0.09 0.29 9519 3.70 567 1.81 0.29 8824 2.08 389 1.28 0.41 9521 4.02 602 1.96 0.29 8825 – – 1.33 0.36 9522 3.08 499 1.82 0.36 8826 2.25 408 1.33 0.36 9534 3.38 532 1.44 0.24 8829 – – 1.28 0.41 9554 9.31 1000 4.23 0.25
8831 1.35 309 0.83 0.41 9586 0.49 214 0.29 0.36 8832 0.31 194 0.17 0.35 9600 3.08 499 1.72 0.35 8833 0.74 241 0.41 0.35 9620 1.35 309 0.66 0.29 8835 2.16 398 1.21 0.35 8842 2.72 459 1.67 0.41
8855 0.16 178 0.09 0.35 8856 0.77 245 0.43 0.35 8864 1.64 340 0.97 0.36 8868 0.53 218 0.31 0.36 8869 1.11 282 0.66 0.36
8871 0.06 167 0.03 0.35 8901 0.20 182 0.10 0.29 9012 1.46 321 0.71 0.29 9014 3.15 507 1.76 0.35 9015 3.03 493 1.63 0.33
9016 2.59 445 1.44 0.35 9019 2.87 476 1.40 0.29 9033 2.04 384 1.10 0.33 9040 3.41 535 2.01 0.36 9044 1.35 309 0.80 0.36
9052 1.99 379 1.18 0.36 9058 1.81 359 1.11 0.41 9060 1.73 350 1.02 0.36 9061 1.26 299 0.75 0.36 9062 1.37 311 0.81 0.36Refer to the Classification codes section of the Basic Manual for any state specific classification phraseology.* Refer to the Footnotes Page for additional information on this class code.
© Copyright 2021 National Council on Compensation Insurance, Inc. All Rights Reserved. Page 31 of 136

WORKERS COMPENSATION AND EMPLOYERS LIABILITY IOWA
Effective January 1, 2022
FOOTNOTES
a Rate for each individual risk must be obtained from NCCI Customer Service or the Rating Organizationhaving jurisdiction.
A Minimum Premium $100 per ginning location for policy minimum premium computation.
D Rate for classification already includes the specific disease loading shown in the table below. See the Basic Manual rule, Supplemental and supplementary loading.
Code No.Disease Loading Symbol Code No.
Disease Loading Symbol Code No.
Disease Loading Symbol
0059D 0.41 S 1165D 0.05 S 3082D 0.05 S0065D 0.10 S 1624D 0.04 S 3085D 0.11 S0066D 0.10 S 1710D 0.06 S 4024D 0.05 S0067D 0.10 S 1803D 0.33 S 6251D 0.05 S1164D 0.06 S 3081D 0.13 S 6252D 0.03 SS=Silica
F Rate provides for coverage under the United States Longshore and Harbor Workers Compensation Act and itsextensions. Rate includes a provision for USL&HW Assessment.
M Risks are subject to Admiralty Law or Federal Employers Liability Act (FELA). However, the published rate is for risks that voluntarily purchase standard workers compensation and employers liability coverage. A provision for the USL&HW Assessment is included for those classifications under Program II USL Act.
N This code is part of a ratable / non-ratable group shown below. The statistical non-ratable code and correspondingrate are applied in addition to the basic classification when determining premium.
Class Code
477174057431
P Classification is computed on a per capita basis.
* Class Codes with Specific Footnotes
6702 Rate and rating values only appropriate for laying or relaying of tracks or maintenance of way - no work on elevated railroads. Otherwise, assign appropriate construction or erection code rate and elr each x 1.215.
6703 Rate and rating values only appropriate for laying or relaying of tracks or maintenance of way - no work on elevated railroads. Otherwise, assign appropriate construction or erection class rate x 1.678 and elr x 1.607.
6704 Rate and rating values only appropriate for laying or relaying of tracks or maintenance of way - no work onelevated railroads. Otherwise, assign appropriate construction or erection class rate and elr each x 1.35.
74457453
Non-RatableElement Code
0771
© Copyright 2021 National Council on Compensation Insurance, Inc. All Rights Reserved. Page 32 of 136

WORKERS COMPENSATION AND EMPLOYERS LIABILITY IOWA
Effective January 1, 2022
MISCELLANEOUS VALUES
Basis of premium applicable in accordance with the Basic Manual notes for Code 7370 -- "Taxicab Co.":Employee operated vehicle…………………………………………………………………………………… $78,200Leased or rented vehicle……………………………………………………………………………………… $52,100
Catastrophe (other than Certified Acts of Terrorism) - (Voluntary) ………………..…..………………………… 0.01
Expense Constant applicable in accordance with the Basic Manual rule………………………………………… $160
Maximum Minimum Premium…………………………………………………………………………………….….… $1,000Note: Maximum Minimum Premium varies for farming and agricultural class codes
Maximum Weekly Payroll applicable in accordance with the Basic Manual notes for Code 9178 -- "AthleticSports or Park: Noncontact Sports," and Code 9179 -- "Athletic Sports or Park: Contact Sports" ……..………… $4,000
Maximum Weekly Payroll for executive officers including members of limited liability companies andpartners or sole proprietors in accordance with the Basic Manual rules, Rule for premium determinationof executive officers, Rule for premium determination of members of LLCs, and Rule for premiumdetermination for partners or sole proprietors ……..………….………………………………………….……………. $4,000
Minimum Premium Multiplier……………………………………………………………………………………..…..… 110
Minimum Weekly Payroll for executive officers including members of limited liability companies andpartners or sole proprietors in accordance with the Basic Manual rules, Rule for premium determinationof executive officers, Rule for premium determination of members of LLCs, and Rule for premiumdetermination for partners or sole proprietors ……..………….………………………………………….……………. $500
Premium Discount Percentages - (See the Basic Manual rule, Premium discount.) The following premium discounts are applicable to Standard Premiums:
Type A Type BFirst $10,000 - -Next 190,000 9.1% 5.1%Next 1,550,000 11.3% 6.5%Over 1,750,000 12.3% 7.5%
Terrorism (Voluntary) ……..………….………………………………………….…………….………………………… 0.01
United States Longshore and Harbor Workers' Compensation Coverage Percentageapplicable only in connection with the Basic Manual rule, Federal coverages……………...…..….…......…….…
Experience Rating Eligibility
(Multiply a Non-F classification rate by a factor of 1.32 to adjust for differences in benefits and loss-based expenses. This factor is the product of the adjustment for differences in benefits (1.25) and the adjustment for differences in loss-based expenses (1.053).)
32%
A risk qualifies for experience rating on an intrastate basis when it meets the premium eligibility requirements for the state in which it operates. The eligibility amount varies by rating effective date. The Experience Rating Plan Manual should be referenced for the latest approved eligibility amounts by state and by effective date.
© Copyright 2021 National Council on Compensation Insurance, Inc. All Rights Reserved. Page 33 of 136

Iowa
Workers Compensation Rate Filing – January 1, 2022
Proposed Assigned Risk Rates and Rating Values
The following pages include proposed assigned risk rates and rating values:
Assigned risk rates, minimum premium, expected loss rates, and d-ratios by class code, along with associated footnotes
Miscellaneous values, such as:
o Maximum and minimum weekly payroll applicable for select class codes o Premium determination for Partners and Sole Proprietors o Catastrophe and Terrorism assigned risk rates o United States Longshore and Harbor Workers’ Compensation Coverage
Percentage
© Copyright 2021 National Council on Compensation Insurance, Inc. All Rights Reserved.
Page 34 of 136

WORKERS COMPENSATION AND EMPLOYERS LIABILITY IOWA
Effective January 1, 2022APPLICABLE TO ASSIGNED RISK POLICIES ONLY
CLASS MIN D CLASS MIN D CLASS MIN D CODE RATE PREM ELR RATIO CODE RATE PREM ELR RATIO CODE RATE PREM ELR RATIO
0005 4.71 650 2.10 0.35 2016 4.35 639 1.94 0.35 2710 12.15 1000 4.74 0.29 0008 3.75 573 1.67 0.35 2021 4.74 681 2.04 0.33 2714 6.03 823 2.69 0.35 0016 6.79 500 2.65 0.29 2039 3.79 577 1.69 0.35 2731 5.88 807 2.62 0.35 0034 5.90 650 2.54 0.33 2041 5.56 772 2.49 0.35 2735 8.59 1000 3.83 0.35 0035 3.44 538 1.48 0.33 2065 2.65 452 1.14 0.33 2759 8.28 1000 3.69 0.35
0036 4.26 500 1.90 0.35 2070 7.23 955 3.11 0.33 2790 2.55 441 1.20 0.36 0037 5.00 500 1.95 0.29 2081 4.10 611 1.94 0.36 2797 7.33 966 3.46 0.36 0042 7.54 650 3.24 0.33 2089 6.81 909 3.04 0.35 2799 7.38 972 3.18 0.33 0050 9.23 1000 3.60 0.29 2095 4.93 702 2.12 0.33 2802 6.15 837 2.64 0.33 0059D 0.51 – 0.10 0.25 2105 6.15 837 2.90 0.36 2835 4.70 677 2.22 0.36
0065D 0.13 – 0.02 0.29 2110 3.31 524 1.48 0.35 2836 4.49 654 2.12 0.36 0066D 0.13 – 0.03 0.33 2111 4.08 609 1.82 0.35 2841 6.54 879 2.91 0.35 0067D 0.13 – 0.03 0.33 2112 5.56 772 2.48 0.35 2881 4.01 601 1.90 0.36 0079 4.34 637 1.86 0.33 2114 3.98 598 1.88 0.36 2883 4.55 661 2.03 0.35 0083 6.18 500 2.66 0.33 2121 2.19 401 1.04 0.36 2913 – – 2.03 0.35
0106 12.69 1000 4.61 0.25 2130 2.81 469 1.21 0.33 2915 4.70 677 1.84 0.29 0113 5.73 790 2.55 0.35 2131 2.55 441 1.14 0.35 2916 4.55 661 1.78 0.29 0170 4.99 709 2.22 0.35 2143 3.63 559 1.71 0.36 2923 2.71 458 1.28 0.36 0251 4.76 684 2.05 0.33 2157 5.44 758 2.43 0.35 2942 – – 0.77 0.36 0400 – – 1.59 0.33 2172 2.34 417 0.91 0.29 2960 6.64 890 2.86 0.33
0401 13.98 A 5.08 0.25 2174 4.41 645 1.97 0.35 3004 2.31 414 0.84 0.25 0771N 0.65 – – – 2211 10.33 1000 4.03 0.29 3018 3.35 529 1.22 0.25 0908P 230.00 390 99.07 0.33 2220 3.70 567 1.60 0.33 3022 5.11 722 2.28 0.35 0913P 613.00 773 263.68 0.33 2286 – – 1.60 0.33 3027 3.06 497 1.20 0.29 0917 4.83 691 2.28 0.36 2288 5.68 785 2.53 0.35 3028 3.83 581 1.50 0.29
1005 8.65 1000 2.95 0.25 2300 – – 1.66 0.35 3030 7.83 1000 3.06 0.29 1016 20.40 1000 6.96 0.24 2302 2.63 449 1.13 0.33 3040 7.18 950 3.09 0.33 1164D 4.14 615 1.38 0.24 2305 3.54 549 1.38 0.29 3041 6.25 848 2.69 0.33 1165D 4.67 674 1.57 0.24 2361 2.78 466 1.19 0.33 3042 6.70 897 2.89 0.33 1320 2.20 402 0.80 0.25 2362 3.09 500 1.38 0.35 3064 5.69 786 2.45 0.33
1322 10.05 1000 3.43 0.24 2380 2.84 472 1.27 0.35 3076 4.68 675 2.09 0.35 1430 6.29 852 2.46 0.29 2386 – – 1.66 0.35 3081D 9.32 1000 3.95 0.33 1438 7.58 994 2.96 0.29 2388 2.28 411 1.08 0.36 3082D 5.44 758 2.10 0.29 1452 3.25 518 1.27 0.29 2402 4.08 609 1.59 0.29 3085D 8.64 1000 3.66 0.33 1463 17.08 1000 5.82 0.24 2413 3.45 540 1.49 0.33 3110 7.00 930 3.01 0.33
1472 4.55 661 1.78 0.29 2416 3.23 515 1.44 0.35 3111 4.23 625 1.88 0.35 1624D 4.46 651 1.60 0.25 2417 1.96 376 0.88 0.35 3113 2.81 469 1.21 0.33 1642 3.54 549 1.38 0.29 2501 3.73 570 1.66 0.35 3114 4.70 677 2.02 0.33 1654 5.55 771 2.17 0.29 2503 1.61 337 0.72 0.35 3118 2.19 401 1.04 0.36 1655 – – 1.38 0.29 2534 – – 1.66 0.35 3119 1.36 310 0.67 0.41
1699 4.26 629 1.66 0.29 2570 5.65 782 2.52 0.35 3122 2.84 472 1.34 0.36 1701 3.75 573 1.36 0.25 2585 5.50 765 2.37 0.33 3126 2.84 472 1.22 0.33 1710D 5.49 764 2.12 0.29 2586 4.49 654 2.00 0.35 3131 2.63 449 1.13 0.33 1741 – – 1.36 0.25 2587 2.88 477 1.28 0.35 3132 3.94 593 1.75 0.35 1747 3.95 595 1.55 0.29 2589 3.64 560 1.57 0.33 3145 3.10 501 1.34 0.33
1748 7.96 1000 3.11 0.29 2600 5.98 818 2.67 0.35 3146 2.96 486 1.27 0.33 1803D 10.64 1000 3.99 0.29 2623 9.16 1000 3.58 0.29 3169 3.95 595 1.76 0.35 1852 – – 0.97 0.24 2651 3.03 493 1.35 0.35 3175 – – 1.76 0.35 1853 – – 1.36 0.25 2660 3.58 554 1.69 0.36 3179 3.10 501 1.39 0.35 1860 – – 1.18 0.29 2670 – – 1.94 0.35 3180 3.04 494 1.36 0.35
1924 3.48 543 1.55 0.35 2683 – – 1.66 0.35 3188 3.15 507 1.35 0.33 1925 7.11 942 3.06 0.33 2688 4.35 639 1.94 0.35 3220 2.78 466 1.19 0.33 2002 4.11 612 1.84 0.35 2701 17.56 1000 6.40 0.25 3223 – – 1.36 0.35 2003 5.59 775 2.41 0.33 2702 29.76 1000 10.14 0.24 3224 5.25 738 2.49 0.36 2014 6.15 837 2.40 0.29 2709 11.29 1000 4.11 0.25 3227 5.28 741 2.35 0.35Refer to the Classification codes section of the Basic Manual for any state specific classification phraseology.* Refer to the Footnotes Page for additional information on this class code.
© Copyright 2021 National Council on Compensation Insurance, Inc. All Rights Reserved. Page 35 of 136

WORKERS COMPENSATION AND EMPLOYERS LIABILITY IOWA
Effective January 1, 2022APPLICABLE TO ASSIGNED RISK POLICIES ONLY
CLASS MIN D CLASS MIN D CLASS MIN D CODE RATE PREM ELR RATIO CODE RATE PREM ELR RATIO CODE RATE PREM ELR RATIO
3240 – – 1.73 0.35 4036 3.75 573 1.46 0.29 4670 – – 2.03 0.33 3241 4.04 604 1.80 0.35 4038 3.29 522 1.56 0.36 4683 4.71 678 2.03 0.33 3255 3.58 554 1.69 0.36 4053 – – 1.61 0.33 4686 2.98 488 1.16 0.29 3257 3.88 587 1.73 0.35 4061 – – 1.61 0.33 4692 0.88 257 0.39 0.35 3270 3.44 538 1.53 0.35 4062 3.75 573 1.61 0.33 4693 1.71 348 0.77 0.35
3300 6.81 909 3.21 0.36 4101 4.14 615 1.78 0.33 4703 2.21 403 0.95 0.33 3303 3.38 532 1.51 0.35 4109 0.63 229 0.28 0.35 4717 2.28 411 1.08 0.36 3307 4.24 626 1.83 0.33 4110 1.11 282 0.50 0.35 4720 3.00 490 1.29 0.33 3315 4.36 640 1.95 0.35 4111 2.55 441 1.14 0.35 4740 1.59 335 0.54 0.24 3334 3.38 532 1.45 0.33 4113 – – 1.14 0.35 4741 4.10 611 1.77 0.33
3336 3.69 566 1.59 0.33 4114 3.50 545 1.51 0.33 4751 5.91 810 2.31 0.29 3365 6.11 832 2.22 0.25 4130 4.35 639 1.94 0.35 4771N 3.69 637 1.34 0.25 3372 5.56 772 2.39 0.33 4131 7.16 948 3.19 0.35 4777 4.45 650 1.62 0.25 3373 6.19 841 2.76 0.35 4133 3.23 515 1.52 0.36 4825 1.18 290 0.46 0.29 3383 2.19 401 0.98 0.35 4149 1.08 279 0.51 0.36 4828 2.81 469 1.02 0.25
3385 1.33 306 0.59 0.35 4206 4.33 636 1.93 0.35 4829 1.51 326 0.55 0.25 3400 3.13 504 1.40 0.35 4207 4.14 615 1.51 0.25 4902 3.66 563 1.63 0.35 3507 4.29 632 1.84 0.33 4239 3.39 533 1.24 0.25 4923 1.58 334 0.68 0.33 3515 3.39 533 1.46 0.33 4240 4.51 656 2.13 0.36 5020 7.24 956 2.64 0.25 3548 1.78 356 0.79 0.35 4243 2.79 467 1.20 0.33 5022 10.54 1000 3.59 0.24
3559 6.06 827 2.61 0.33 4244 3.69 566 1.44 0.29 5037 20.48 1000 6.98 0.24 3574 1.78 356 0.79 0.35 4250 2.63 449 1.13 0.33 5040 9.75 1000 3.32 0.24 3581 1.95 375 0.87 0.35 4251 4.30 633 1.92 0.35 5057 7.15 947 2.44 0.24 3612 3.00 490 1.29 0.33 4263 5.05 716 2.17 0.33 5059 24.30 1000 8.28 0.24 3620 4.96 706 1.94 0.29 4273 3.89 588 1.68 0.33 5069 – – 8.28 0.24
3629 3.04 494 1.31 0.33 4279 3.03 493 1.18 0.29 5102 8.04 1000 2.93 0.25 3632 4.01 601 1.73 0.33 4282 – – 1.18 0.29 5146 5.46 761 2.14 0.29 3634 2.15 397 0.93 0.33 4283 2.21 403 0.99 0.35 5160 4.99 709 1.70 0.24 3635 3.09 500 1.33 0.33 4299 2.49 434 1.07 0.33 5183 3.71 568 1.35 0.25 3638 3.00 490 1.34 0.35 4304 6.58 884 2.83 0.33 5188 4.23 625 1.54 0.25
3642 2.69 456 1.20 0.35 4307 2.46 431 1.16 0.36 5190 3.21 513 1.17 0.25 3643 2.98 488 1.16 0.29 4351 1.48 323 0.66 0.35 5191 1.24 296 0.48 0.29 3647 4.14 615 1.78 0.33 4352 2.21 403 0.99 0.35 5192 3.65 562 1.57 0.33 3648 2.21 403 1.05 0.36 4360 – – 0.33 0.29 5213 9.13 1000 3.11 0.24 3681 1.20 292 0.54 0.35 4361 1.25 298 0.56 0.35 5215 6.69 896 2.62 0.29
3685 1.96 376 0.88 0.35 4410 4.01 601 1.79 0.35 5221 5.89 808 2.14 0.25 3719 1.39 313 0.47 0.24 4420 8.09 1000 2.95 0.25 5222 16.38 1000 5.58 0.24 3724 5.83 801 1.99 0.24 4431 2.09 390 0.99 0.36 5223 6.13 834 2.40 0.29 3726 5.15 727 1.75 0.24 4432 1.64 340 0.77 0.36 5348 6.61 887 2.58 0.29 3803 3.60 556 1.61 0.35 4439 – – 1.12 0.33 5402 7.74 1000 3.45 0.35
3807 4.43 647 1.98 0.35 4452 3.85 584 1.66 0.33 5403 11.40 1000 4.15 0.25 3808 5.03 713 2.17 0.33 4459 4.35 639 1.70 0.29 5437 7.14 945 2.60 0.25 3821 7.55 991 2.95 0.29 4470 3.13 504 1.35 0.33 5443 4.90 699 2.11 0.33 3822 5.78 796 2.57 0.35 4484 4.41 645 1.97 0.35 5445 7.01 931 2.39 0.24 3824 6.15 837 2.74 0.35 4493 3.75 573 1.61 0.33 5462 7.58 994 2.96 0.29
3826 1.24 296 0.53 0.33 4511 0.85 254 0.37 0.33 5472 7.98 1000 2.72 0.24 3827 2.90 479 1.29 0.35 4557 3.10 501 1.21 0.29 5473 10.51 1000 3.58 0.24 3830 1.80 358 0.78 0.33 4558 2.61 447 1.12 0.33 5474 8.28 1000 2.82 0.24 3851 3.79 577 1.69 0.35 4568 2.74 461 1.07 0.29 5478 5.35 749 1.95 0.25 3865 3.44 538 1.62 0.36 4581 1.49 324 0.54 0.25 5479 7.58 994 2.96 0.29
3881 5.75 793 2.48 0.33 4583 4.86 695 1.77 0.25 5480 8.44 1000 3.07 0.25 4000 5.85 804 2.13 0.25 4611 1.55 331 0.69 0.35 5491 2.44 428 0.88 0.25 4021 6.76 904 2.91 0.33 4635 4.83 691 1.75 0.25 5506 9.00 1000 3.28 0.25 4024D 9.02 1000 3.50 0.29 4653 2.40 424 1.07 0.35 5507 5.53 768 2.01 0.25 4034 9.00 1000 3.52 0.29 4665 10.48 1000 4.09 0.29 5508 – – 2.01 0.25Refer to the Classification codes section of the Basic Manual for any state specific classification phraseology.* Refer to the Footnotes Page for additional information on this class code.
© Copyright 2021 National Council on Compensation Insurance, Inc. All Rights Reserved. Page 36 of 136

WORKERS COMPENSATION AND EMPLOYERS LIABILITY IOWA
Effective January 1, 2022APPLICABLE TO ASSIGNED RISK POLICIES ONLY
CLASS MIN D CLASS MIN D CLASS MIN D CODE RATE PREM ELR RATIO CODE RATE PREM ELR RATIO CODE RATE PREM ELR RATIO
5535 7.88 1000 2.68 0.24 7050M 9.74 1000 3.17 0.24 7711 58.49 1000 21.29 0.25 5537 5.39 753 2.10 0.29 7090M 7.84 1000 2.66 0.24 7720 4.25 628 1.66 0.29 5551 18.84 1000 6.41 0.24 7098M 17.04 1000 5.81 0.24 7855 4.20 622 1.64 0.29 5606 1.71 348 0.58 0.24 7099M 21.18 1000 6.91 0.24 8001 3.24 516 1.44 0.35 5610 5.91 810 2.31 0.29 7133 4.69 676 1.70 0.25 8002 2.93 482 1.31 0.35
5645 12.06 1000 4.11 0.24 7151M 5.70 787 2.07 0.25 8006 2.99 489 1.41 0.36 5703 16.40 1000 6.41 0.29 7152M 7.86 1000 2.73 0.25 8008 1.45 320 0.68 0.36 5705 17.35 1000 6.77 0.29 7153M 6.33 856 2.30 0.25 8010 2.60 446 1.16 0.35 5951 0.91 260 0.41 0.35 7219 9.30 1000 3.39 0.25 8013 0.50 215 0.21 0.33 6003 7.14 945 2.60 0.25 7222 9.38 1000 3.42 0.25 8015 0.99 269 0.43 0.33
6005 4.89 698 1.91 0.29 7225 10.70 1000 4.18 0.29 8017 2.29 412 1.08 0.36 6017 – – 3.11 0.24 7228 – – 3.39 0.25 8018 4.20 622 1.88 0.35 6018 3.15 507 1.24 0.29 7229 – – 3.39 0.25 8021 2.89 478 1.29 0.35 6045 6.08 829 2.37 0.29 7230 10.58 1000 4.56 0.33 8031 3.28 521 1.46 0.35 6204 9.73 1000 3.54 0.25 7231 8.89 1000 3.83 0.33 8032 2.60 446 1.16 0.35
6206 3.54 549 1.21 0.24 7232 13.83 1000 5.04 0.25 8033 1.79 357 0.84 0.36 6213 2.18 400 0.74 0.24 7309F 13.54 1000 3.72 0.22 8037 2.29 412 1.12 0.41 6214 2.31 414 0.84 0.25 7313F 5.29 742 1.45 0.22 8039 2.23 405 1.05 0.36 6216 7.04 934 2.40 0.24 7317F 10.25 1000 2.81 0.22 8044 3.31 524 1.48 0.35 6217 5.86 805 2.00 0.24 7327F 28.13 1000 7.73 0.22 8045 0.80 248 0.36 0.35
6229 6.59 885 2.57 0.29 7333M 9.64 1000 3.29 0.25 8046 3.10 501 1.38 0.35 6233 4.23 625 1.44 0.24 7335M 10.71 1000 3.66 0.25 8047 1.18 290 0.53 0.35 6235 6.89 918 2.35 0.24 7337M 13.31 1000 4.36 0.25 8058 3.51 546 1.57 0.35 6236 8.33 1000 3.25 0.29 7350F 11.85 1000 3.39 0.23 8072 0.73 240 0.34 0.36 6237 1.89 368 0.69 0.25 7360 5.00 710 1.96 0.29 8102 1.98 378 0.88 0.35
6251D 9.61 1000 3.48 0.26 7370 5.79 797 2.58 0.35 8103 3.69 566 1.59 0.33 6252D 3.65 562 1.23 0.24 7380 6.43 867 2.51 0.29 8105 – – 1.88 0.35 6260 – – 3.48 0.26 7382 5.99 819 2.58 0.33 8106 7.11 942 2.78 0.29 6306 6.55 881 2.38 0.25 7390 5.26 739 2.35 0.35 8107 4.23 625 1.54 0.25 6319 4.33 636 1.47 0.24 7394M 4.86 695 1.66 0.24 8111 3.03 493 1.30 0.33
6325 5.35 749 1.82 0.24 7395M 5.40 754 1.84 0.24 8116 3.20 512 1.37 0.33 6400 6.95 925 2.72 0.29 7398M 6.71 898 2.19 0.24 8203 10.73 1000 4.62 0.33 6503 3.31 524 1.48 0.35 7402 0.34 197 0.15 0.35 8204 6.86 915 2.95 0.33 6504 3.64 560 1.63 0.35 7403 5.45 760 2.44 0.35 8209 5.41 755 2.42 0.35 6702M* 5.10 721 1.99 0.29 7405N 1.55 423 0.70 0.35 8215 4.43 647 1.73 0.29
6703M* 7.05 936 2.64 0.29 7420 7.64 1000 2.61 0.25 8227 4.50 655 1.64 0.25 6704M* 5.68 785 2.22 0.29 7421 1.16 288 0.45 0.29 8232 5.80 798 2.27 0.29 6801F 7.64 1000 2.27 0.27 7422 2.15 397 0.78 0.25 8233 3.03 493 1.18 0.29 6811 8.15 1000 3.18 0.29 7425 3.46 541 1.26 0.25 8235 5.95 815 2.56 0.33 6824F 9.29 1000 2.76 0.27 7431N 1.48 411 0.54 0.25 8263 8.18 1000 3.52 0.33
6826F 8.20 1000 2.44 0.27 7445N 0.84 – – – 8264 7.88 1000 3.07 0.29 6834 3.96 596 1.77 0.35 7453N 0.80 – – – 8265 8.10 1000 2.94 0.25 6836 5.24 736 2.25 0.33 7502 2.15 397 0.84 0.29 8279 9.43 1000 3.43 0.25 6843F 15.48 1000 4.25 0.22 7515 1.41 315 0.48 0.24 8288 9.13 1000 3.92 0.33 6845F 7.46 981 2.05 0.22 7520 4.08 609 1.76 0.33 8291 5.55 771 2.39 0.33
6854 7.49 984 2.72 0.25 7538 4.36 640 1.49 0.24 8292 5.44 758 2.43 0.35 6872F 13.25 1000 3.64 0.22 7539 2.60 446 0.95 0.25 8293 11.24 1000 5.02 0.35 6874F 22.91 1000 6.30 0.22 7540 3.60 556 1.23 0.24 8304 8.06 1000 2.93 0.25 6882 9.24 1000 3.36 0.25 7580 3.21 513 1.25 0.29 8350 7.04 934 2.56 0.25 6884 7.98 1000 2.91 0.25 7590 4.31 634 1.68 0.29 8380 3.50 545 1.51 0.33
7016M 7.60 996 2.59 0.24 7600 4.76 684 1.86 0.29 8381 2.38 422 1.02 0.33 7024M 8.45 1000 2.88 0.24 7605 2.54 439 0.92 0.25 8385 3.11 502 1.34 0.33 7038M 7.05 936 2.40 0.24 7610 0.84 252 0.33 0.29 8392 2.96 486 1.40 0.36 7046M 15.34 1000 5.23 0.24 7705 6.30 853 2.72 0.33 8393 2.19 401 0.85 0.29 7047M 10.50 1000 3.43 0.24 7710 58.49 1000 21.29 0.25 8500 7.76 1000 3.03 0.29Refer to the Classification codes section of the Basic Manual for any state specific classification phraseology.* Refer to the Footnotes Page for additional information on this class code.
© Copyright 2021 National Council on Compensation Insurance, Inc. All Rights Reserved. Page 37 of 136

WORKERS COMPENSATION AND EMPLOYERS LIABILITY IOWA
Effective January 1, 2022APPLICABLE TO ASSIGNED RISK POLICIES ONLY
CLASS MIN D CLASS MIN D CLASS MIN D CODE RATE PREM ELR RATIO CODE RATE PREM ELR RATIO CODE RATE PREM ELR RATIO
8601 0.48 213 0.17 0.25 9063 1.09 280 0.51 0.36 8602 1.98 378 0.77 0.29 9077F 7.70 1000 2.46 0.34 8603 0.14 175 0.06 0.35 9082 1.54 329 0.76 0.41 8606 2.38 422 0.87 0.25 9083 1.65 342 0.81 0.41 8709F 6.99 929 1.92 0.22 9084 1.60 336 0.75 0.36
8719 2.76 464 1.00 0.25 9088a a a a a 8720 1.53 328 0.55 0.25 9089 1.60 336 0.75 0.36 8721 0.45 210 0.18 0.29 9093 1.71 348 0.81 0.36 8723 0.20 182 0.08 0.33 9101 5.91 810 2.79 0.36 8725 3.71 568 1.45 0.29 9102 4.45 650 1.91 0.33
8726F 3.23 515 0.96 0.27 9154 2.29 412 1.02 0.35 8734M 0.71 238 0.28 0.29 9156 4.41 645 2.08 0.36 8737M 0.64 230 0.25 0.29 9170 15.10 1000 5.48 0.25 8738M 0.88 257 0.34 0.29 9178 7.26 959 3.57 0.41 8742 0.53 218 0.21 0.29 9179 18.78 1000 9.23 0.41
8745 4.74 681 2.04 0.33 9180 7.64 1000 3.29 0.33 8748 0.80 248 0.29 0.25 9182 3.25 518 1.45 0.35 8755 0.69 236 0.27 0.29 9186 16.25 1000 5.90 0.25 8799 0.83 251 0.37 0.35 9220 6.39 863 2.75 0.33 8800 2.21 403 0.99 0.35 9402 6.23 845 2.26 0.25
8803 0.08 169 0.03 0.29 9403 12.19 1000 4.44 0.25 8805M 0.34 197 0.15 0.35 9410 3.00 490 1.34 0.35 8810 0.25 188 0.11 0.35 9501 5.30 743 2.07 0.29 8814M 0.30 193 0.13 0.35 9505 5.40 754 2.32 0.33 8815M 0.43 207 0.18 0.35 9516 4.05 606 1.74 0.33
8820 0.24 186 0.09 0.29 9519 4.63 669 1.81 0.29 8824 2.60 446 1.28 0.41 9521 5.03 713 1.96 0.29 8825 – – 1.33 0.36 9522 3.85 584 1.82 0.36 8826 2.81 469 1.33 0.36 9534 4.23 625 1.44 0.24 8829 – – 1.28 0.41 9554 11.64 1000 4.23 0.25
8831 1.69 346 0.83 0.41 9586 0.61 227 0.29 0.36 8832 0.39 203 0.17 0.35 9600 3.85 584 1.72 0.35 8833 0.93 262 0.41 0.35 9620 1.69 346 0.66 0.29 8835 2.70 457 1.21 0.35 8842 3.40 534 1.67 0.41
8855 0.20 182 0.09 0.35 8856 0.96 266 0.43 0.35 8864 2.05 386 0.97 0.36 8868 0.66 233 0.31 0.36 8869 1.39 313 0.66 0.36
8871 0.08 169 0.03 0.35 8901 0.25 188 0.10 0.29 9012 1.83 361 0.71 0.29 9014 3.94 593 1.76 0.35 9015 3.79 577 1.63 0.33
9016 3.24 516 1.44 0.35 9019 3.59 555 1.40 0.29 9033 2.55 441 1.10 0.33 9040 4.26 629 2.01 0.36 9044 1.69 346 0.80 0.36
9052 2.49 434 1.18 0.36 9058 2.26 409 1.11 0.41 9060 2.16 398 1.02 0.36 9061 1.58 334 0.75 0.36 9062 1.71 348 0.81 0.36Refer to the Classification codes section of the Basic Manual for any state specific classification phraseology.* Refer to the Footnotes Page for additional information on this class code.
© Copyright 2021 National Council on Compensation Insurance, Inc. All Rights Reserved. Page 38 of 136

WORKERS COMPENSATION AND EMPLOYERS LIABILITY IOWA
Effective January 1, 2022APPLICABLE TO ASSIGNED RISK POLICIES ONLY
FOOTNOTES
a Rate for each individual risk must be obtained from NCCI Customer Service or the Rating Organizationhaving jurisdiction.
A Minimum Premium $100 per ginning location for policy minimum premium computation.
D Rate for classification already includes the specific disease loading shown in the table below.See the Basic Manual rule, Supplemental and supplementary loading.
Code No.Disease Loading Symbol Code No.
Disease Loading Symbol Code No.
Disease Loading Symbol
0059D 0.51 S 1165D 0.06 S 3082D 0.06 S0065D 0.13 S 1624D 0.05 S 3085D 0.14 S0066D 0.13 S 1710D 0.08 S 4024D 0.06 S0067D 0.13 S 1803D 0.41 S 6251D 0.06 S1164D 0.08 S 3081D 0.16 S 6252D 0.04 SS=Silica
F Rate provides for coverage under the United States Longshore and Harbor Workers Compensation Act and itsextensions. Rate includes a provision for USL&HW Assessment.
M Risks are subject to Admiralty Law or Federal Employers Liability Act (FELA). However, the published rate isfor risks that voluntarily purchase standard workers compensation and employers liability coverage. A provisionfor the USL&HW Assessment is included for those classifications under Program II USL Act. For the residual market, coverage under the Federal Employers' Liability Act (FELA) for employees of interstate railroads is not availablefor codes 6702, 6703, 6704, 7151, 7152, 7153, 8734, 8737, 8738, 8805, 8814, and 8815.
N This code is part of a ratable / non-ratable group shown below. The statistical non-ratable code and correspondingrate are applied in addition to the basic classification when determining premium.
Class Code477174057431
P Classification is computed on a per capita basis.
* Class Codes with Specific Footnotes
6702 Rate and rating values only appropriate for laying or relaying of tracks or maintenance of way - no work on elevated railroads. Otherwise, assign appropriate construction or erection code rate and elr each x 1.215.
6703 Rate and rating values only appropriate for laying or relaying of tracks or maintenance of way - no work on elevated railroads. Otherwise, assign appropriate construction or erection class rate x 1.678 and elr x 1.607.
6704 Rate and rating values only appropriate for laying or relaying of tracks or maintenance of way - no work onelevated railroads. Otherwise, assign appropriate construction or erection class rate and elr each x 1.35.
74457453
Non-Ratable Element Code
0771
© Copyright 2021 National Council on Compensation Insurance, Inc. All Rights Reserved. Page 39 of 136

WORKERS COMPENSATION AND EMPLOYERS LIABILITY IOWA
Effective January 1, 2022APPLICABLE TO ASSIGNED RISK POLICIES ONLY
MISCELLANEOUS VALUES
Basis of premium applicable in accordance with the Basic Manual notes for Code 7370 -- "Taxicab Co.":Employee operated vehicle…………………………………………………………………………………… $78,200Leased or rented vehicle……………………………………………………………………………………… $52,100
Catastrophe (other than Certified Acts of Terrorism) - (Assigned Risk)…………………………………………… 0.01
Expense Constant applicable in accordance with the Basic Manual rule………………………………………… $160
Maximum Minimum Premium…………………………………………………………………………………….….…. $1,000Note: Maximum Minimum Premium varies for farming and agricultural class codes
Maximum Weekly Payroll applicable in accordance with the Basic Manual notes for Code 9178 -- "AthleticSports or Park: Noncontact Sports," and Code 9179 -- "Athletic Sports or Park: Contact Sports" ……..………… $4,000
Maximum Weekly Payroll for executive officers including members of limited liability companies andpartners or sole proprietors in accordance with the Basic Manual rules, Rule for premium determinationof executive officers, Rule for premium determination of members of LLCs, and Rule for premiumdetermination for partners or sole proprietors ……..………….………………………………………….…………….… $4,000
Minimum Premium Multiplier……………………………………………………………………………………..…..… 110
Minimum Weekly Payroll for executive officers including members of limited liability companies andpartners or sole proprietors in accordance with the Basic Manual rules, Rule for premium determinationof executive officers, Rule for premium determination of members of LLCs, and Rule for premiumdetermination for partners or sole proprietors ……..………….………………………………………….…………….… $500
Terrorism - (Assigned Risk)………………………………..……………….…………..………………………………… 0.01
United States Longshore and Harbor Workers' Compensation Coverage Percentageapplicable only in connection with the Basic Manual rule, Federal coverages……………...…..….…......…….… 32%
Experience Rating Eligibility
(Multiply a Non-F classification rate by a factor of 1.32 to adjust for differences in benefits and loss-based expenses. This factor is the product of the adjustment for differences in benefits (1.25) and the adjustment for differences in loss-based expenses (1.053).)
A risk qualifies for experience rating on an intrastate basis when it meets the premium eligibility requirements for the state in which it operates. The eligibility amount varies by rating effective date. The Experience Rating Plan Manual should be referenced for the latest approved eligibility amounts by state and by effective date.
© Copyright 2021 National Council on Compensation Insurance, Inc. All Rights Reserved. Page 40 of 136

Iowa
Workers Compensation Rate Filing – January 1, 2022
Proposed Values for Inclusion in the Experience Rating Plan Manual
The following pages include proposed values for the Experience Rating Plan Manual:
Table of Weighting Values Table of Ballast Values Experience Rating Premium Eligibility Amounts
© Copyright 2021 National Council on Compensation Insurance, Inc. All Rights Reserved.
Page 41 of 136

EXPERIENCE RATING PLAN MANUAL IOWA
Effective January 1, 2022 TABLE OF WEIGHTING VALUESAPPLICABLE TO ALL POLICIESExperience Rating Program - ERA
Expected Weighting Expected WeightingLosses Values Losses Values
0 -- 2,575 0.04 1,452,495 -- 1,532,613 0.442,576 -- 10,412 0.05 1,532,614 -- 1,617,371 0.45
10,413 -- 18,417 0.06 1,617,372 -- 1,707,183 0.4618,418 -- 26,594 0.07 1,707,184 -- 1,802,517 0.4726,595 -- 34,950 0.08 1,802,518 -- 1,903,898 0.48
34,951 -- 58,458 0.09 1,903,899 -- 2,011,921 0.4958,459 -- 87,017 0.10 2,011,922 -- 2,127,264 0.5087,018 -- 112,420 0.11 2,127,265 -- 2,250,695 0.51
112,421 -- 137,154 0.12 2,250,696 -- 2,383,099 0.52137,155 -- 161,892 0.13 2,383,100 -- 2,525,491 0.53
161,893 -- 186,933 0.14 2,525,492 -- 2,679,046 0.54186,934 -- 212,450 0.15 2,679,047 -- 2,845,132 0.55212,451 -- 238,556 0.16 2,845,133 -- 3,025,349 0.56238,557 -- 265,338 0.17 3,025,350 -- 3,221,580 0.57265,339 -- 292,868 0.18 3,221,581 -- 3,436,062 0.58
292,869 -- 321,212 0.19 3,436,063 -- 3,671,464 0.59321,213 -- 350,431 0.20 3,671,465 -- 3,931,006 0.60350,432 -- 380,584 0.21 3,931,007 -- 4,218,603 0.61380,585 -- 411,733 0.22 4,218,604 -- 4,539,064 0.62411,734 -- 443,940 0.23 4,539,065 -- 4,898,364 0.63
443,941 -- 477,268 0.24 4,898,365 -- 5,304,021 0.64477,269 -- 511,786 0.25 5,304,022 -- 5,765,627 0.65511,787 -- 547,566 0.26 5,765,628 -- 6,295,614 0.66547,567 -- 584,682 0.27 6,295,615 -- 6,910,395 0.67584,683 -- 623,217 0.28 6,910,396 -- 7,632,090 0.68
623,218 -- 663,258 0.29 7,632,091 -- 8,491,245 0.69663,259 -- 704,899 0.30 8,491,246 -- 9,531,270 0.70704,900 -- 748,240 0.31 9,531,271 -- 10,816,001 0.71748,241 -- 793,392 0.32 10,816,002 -- 12,443,322 0.72793,393 -- 840,471 0.33 12,443,323 -- 14,571,350 0.73
840,472 -- 889,608 0.34 14,571,351 -- 17,473,198 0.74889,609 -- 940,941 0.35 17,473,199 -- 21,664,749 0.75940,942 -- 994,624 0.36 21,664,750 -- 28,251,461 0.76994,625 -- 1,050,823 0.37 28,251,462 -- 40,107,527 0.77
1,050,824 -- 1,109,721 0.38 40,107,528 -- 67,771,660 0.78
1,109,722 -- 1,171,519 0.39 67,771,661 -- 206,092,258 0.791,171,520 -- 1,236,439 0.40 206,092,259 AND OVER 0.801,236,440 -- 1,304,723 0.411,304,724 -- 1,376,641 0.421,376,642 -- 1,452,494 0.43
(a) G . . . . . . . . . . . . . . . . . . . . . . . . . . . . . . . . . . . . . . . . . . . . . . . . . . . . . . . . . . . . . . . . . . . 12.30 (b) State Per Claim Accident Limitation . . . . . . . . . . . . . . . . . . . . . . . . . . . . . . . . . . . . . . . . $307,000(c) State Multiple Claim Accident Limitation . . . . . . . . . . . . . . . . . . . . . . . . . . . . . . . . . . . . . . . . $614,000(d) USL&HW Per Claim Accident Limitation . . . . . . . . . . . . . . . . . . . . . . . . . . . . . . . . . . . . . . . . $625,500(e) USL&HW Multiple Claim Accident Limitation . . . . . . . . . . . . . . . . . . . . . . . . . . . . . . . . . . . . $1,251,000(f) Employers Liability Accident Limitation . . . . . . . . . . . . . . . . . . . . . . . . . . . . . . . . . . . . . . . . $55,000(g) Primary/Excess Loss Split Point . . . . . . . . . . . . . . . . . . . . . . . . . . . . . . . . . . . . . . . . . . . . . . $18,500(h) USL&HW Act -- Expected Loss Factor -- Non-F Classes . . . . . . . . . . . . . . . . . . . . . . . . . . . 1.25(Multiply a Non-F classification ELR by the USL&HW Act - Expected Loss Factor of 1.25.)
© Copyright 2021 National Council on Compensation Insurance, Inc. All Rights Reserved. Page 42 of 136

EXPERIENCE RATING PLAN MANUAL IOWA
Effective January 1, 2022 TABLE OF BALLAST VALUES
APPLICABLE TO ALL POLICIESExperience Rating Plan - ERA
Expected Ballast Expected Ballast Expected BallastLosses Values Losses Values Losses Values
0 -- 66,159 30,750 2,122,993 -- 2,184,457 246,000 4,274,869 -- 4,336,359 461,25066,160 -- 113,866 36,900 2,184,458 -- 2,245,924 252,150 4,336,360 -- 4,397,850 467,400
113,867 -- 168,683 43,050 2,245,925 -- 2,307,393 258,300 4,397,851 -- 4,459,342 473,550168,684 -- 226,510 49,200 2,307,394 -- 2,368,863 264,450 4,459,343 -- 4,520,834 479,700226,511 -- 285,744 55,350 2,368,864 -- 2,430,335 270,600 4,520,835 -- 4,582,326 485,850
285,745 -- 345,722 61,500 2,430,336 -- 2,491,808 276,750 4,582,327 -- 4,643,819 492,000345,723 -- 406,133 67,650 2,491,809 -- 2,553,283 282,900 4,643,820 -- 4,705,311 498,150406,134 -- 466,818 73,800 2,553,284 -- 2,614,759 289,050 4,705,312 -- 4,766,804 504,300466,819 -- 527,686 79,950 2,614,760 -- 2,676,236 295,200 4,766,805 -- 4,828,297 510,450527,687 -- 588,682 86,100 2,676,237 -- 2,737,714 301,350 4,828,298 -- 4,889,790 516,600
588,683 -- 649,771 92,250 2,737,715 -- 2,799,192 307,500 4,889,791 -- 4,951,283 522,750649,772 -- 710,929 98,400 2,799,193 -- 2,860,672 313,650 4,951,284 -- 5,012,777 528,900710,930 -- 772,141 104,550 2,860,673 -- 2,922,153 319,800 5,012,778 -- 5,074,270 535,050772,142 -- 833,394 110,700 2,922,154 -- 2,983,634 325,950 5,074,271 -- 5,135,764 541,200833,395 -- 894,681 116,850 2,983,635 -- 3,045,116 332,100 5,135,765 -- 5,197,258 547,350
894,682 -- 955,994 123,000 3,045,117 -- 3,106,599 338,250 5,197,259 -- 5,258,752 553,500955,995 -- 1,017,330 129,150 3,106,600 -- 3,168,083 344,400 5,258,753 -- 5,320,246 559,650
1,017,331 -- 1,078,685 135,300 3,168,084 -- 3,229,567 350,550 5,320,247 -- 5,381,741 565,8001,078,686 -- 1,140,054 141,450 3,229,568 -- 3,291,052 356,700 5,381,742 -- 5,443,235 571,9501,140,055 -- 1,201,437 147,600 3,291,053 -- 3,352,537 362,850 5,443,236 -- 5,504,730 578,100
1,201,438 -- 1,262,832 153,750 3,352,538 -- 3,414,023 369,000 5,504,731 -- 5,566,224 584,2501,262,833 -- 1,324,236 159,900 3,414,024 -- 3,475,509 375,150 5,566,225 -- 5,627,719 590,4001,324,237 -- 1,385,648 166,050 3,475,510 -- 3,536,996 381,300 5,627,720 -- 5,689,214 596,5501,385,649 -- 1,447,068 172,200 3,536,997 -- 3,598,483 387,450 5,689,215 -- 5,750,709 602,7001,447,069 -- 1,508,495 178,350 3,598,484 -- 3,659,971 393,600 5,750,710 -- 5,812,204 608,850
1,508,496 -- 1,569,927 184,500 3,659,972 -- 3,721,459 399,750 5,812,205 -- 5,873,250 615,0001,569,928 -- 1,631,364 190,650 3,721,460 -- 3,782,948 405,9001,631,365 -- 1,692,806 196,800 3,782,949 -- 3,844,437 412,0501,692,807 -- 1,754,251 202,950 3,844,438 -- 3,905,926 418,2001,754,252 -- 1,815,701 209,100 3,905,927 -- 3,967,415 424,350
1,815,702 -- 1,877,153 215,250 3,967,416 -- 4,028,905 430,5001,877,154 -- 1,938,609 221,400 4,028,906 -- 4,090,395 436,6501,938,610 -- 2,000,068 227,550 4,090,396 -- 4,151,886 442,8002,000,069 -- 2,061,528 233,700 4,151,887 -- 4,213,377 448,9502,061,529 -- 2,122,992 239,850 4,213,378 -- 4,274,868 455,100
For Expected Losses greater than $5,873,250, the Ballast Value can be calculated using the following formula (rounded to the nearest 1):
Ballast = (0.10)(Expected Losses) + 2500(Expected Losses)(12.30) / (Expected Losses + (700)(12.30))
G = 12.30
© Copyright 2021 National Council on Compensation Insurance, Inc. All Rights Reserved. Page 43 of 136

NATIONAL COUNCIL ON COMPENSATION INSURANCE, INC.
2. State Subject Premium Eligibility Amounts
a.
b.
c.
State Rating Effective Date Column A ($) Column B ($)
IA 7/1/22 and after 9,000 4,500
7/1/21 - 6/30/22 8,500 4,250
7/1/20 - 6/30/21 8,500 4,250
A risk qualifies for experience rating if its data within the most recent 24 months of the experience period develops a subject premium of at least the amount shown in Column A.
IOWA—UPDATE TO EXPERIENCE RATING PREMIUM ELIGIBILITY AMOUNTS
EXPERIENCE RATING PLAN MANUAL—2003 EDITIONRULE 2—EXPERIENCE RATING ELEMENTS AND FORMULA
A. PREMIUM ELIGIBILITY
A risk qualifies for experience rating when its subject premium, developed in its experience period, meets or exceeds the minimum eligibility amount shown in the State Table of Subject Premium Eligibility Amounts in Rule 2-A-2-c. Refer to Rule 2-E-1 to determine a risk's experience period.
A risk may not qualify according to Rule 2-A-2-a. If it has more than the amount of experience referenced in Rule 2-A-2-a, then to qualify for experience rating the risk must develop an average annual subject premium of at least the amount shown in Column B. Refer to Rule 2-A-3 to determine average annual subject premium.
A risk's rating effective date determines the applicable Column A and Column B subject premium eligibility amounts required to qualify for experience rating. Refer to Rule 2-B for rating effective date determination.
State Table of Subject Premium Eligibility Amounts
NOTE: This exhibit revises the Iowa experience rating subject premium eligibility amounts shown in the State Table of Subject
Premium Eligibility Amounts in NCCI's Experience Rating Plan Manual national Rule 2-A-2. The content shown in this table is not a complete replacement of the existing State Table of Subject Premium Eligibility Amounts. The premium eligibility amounts are applicable to all policies.
© Copyright 2021 National Council on Compensation Insurance, Inc. All Rights Reserved. Page 44 of 136

Iowa
Workers Compensation Rate Filing – January 1, 2022
Proposed Values for Inclusion in the Retrospective Rating Plan Manual
The following pages include values for inclusion in the Retrospective Rating Plan Manual:
Average Cost per Case Average Cost per Case including ALAE Tax Multipliers Countrywide Expected Loss Ratio Countrywide Expected Loss and Allocated Expense Ratio Table of Expense Ratios Excess Loss Factors Excess Loss and Allocated Expense Factors Retrospective Development Factors
© Copyright 2021 National Council on Compensation Insurance, Inc. All Rights Reserved.
Page 45 of 136

RETROSPECTIVE RATING PLAN MANUAL IOWASTATE SPECIAL RATING VALUES
Effective January 1, 2022
1. Average Cost per Case by Hazard Group A B C D E F G
7,947 10,699 16,138 19,310 27,825 42,912 49,906
Average Cost per Case including ALAE by Hazard Group A B C D E F G
8,686 11,679 17,595 21,040 30,255 46,608 54,179
2. Tax Multipliersa. State (non-F Classes) 1.025b. Federal Classes, or non-F classes where rate is increased by the USL&HW Act Percentage 1.057
Countrywide Expected Loss and3. Allocated Expense Ratio 4. Table of Expense Ratios
0.660
5. Excess Loss Factors (Applicable to New and Renewal Policies)
Per Accident Hazard GroupsLimitation A B C D E F G
$10,000 0.427 0.461 0.487 0.504 0.525 0.543 0.551$15,000 0.395 0.431 0.460 0.479 0.503 0.524 0.534$20,000 0.369 0.407 0.437 0.457 0.485 0.508 0.520$25,000 0.348 0.386 0.417 0.439 0.469 0.493 0.506$30,000 0.330 0.367 0.400 0.422 0.454 0.479 0.494$35,000 0.314 0.351 0.385 0.407 0.440 0.467 0.483$40,000 0.299 0.337 0.371 0.394 0.428 0.456 0.473$50,000 0.275 0.312 0.347 0.370 0.406 0.435 0.454$75,000 0.231 0.266 0.301 0.324 0.364 0.394 0.415
$100,000 0.201 0.234 0.268 0.290 0.332 0.362 0.385$125,000 0.178 0.209 0.243 0.265 0.307 0.337 0.361$150,000 0.161 0.190 0.223 0.244 0.286 0.317 0.340$175,000 0.147 0.175 0.207 0.227 0.269 0.299 0.323$200,000 0.135 0.162 0.193 0.212 0.255 0.284 0.308$225,000 0.125 0.151 0.182 0.200 0.242 0.271 0.295$250,000 0.116 0.141 0.171 0.189 0.231 0.260 0.283$275,000 0.109 0.133 0.162 0.179 0.221 0.249 0.272$300,000 0.102 0.125 0.154 0.171 0.212 0.240 0.263$325,000 0.097 0.119 0.147 0.163 0.204 0.232 0.254$350,000 0.091 0.113 0.141 0.156 0.197 0.224 0.246$375,000 0.087 0.108 0.135 0.150 0.190 0.217 0.239$400,000 0.083 0.103 0.130 0.144 0.184 0.210 0.232$425,000 0.079 0.099 0.125 0.139 0.179 0.204 0.225$450,000 0.076 0.095 0.121 0.134 0.174 0.199 0.219$475,000 0.073 0.091 0.117 0.130 0.169 0.193 0.214$500,000 0.070 0.088 0.113 0.126 0.164 0.189 0.209$600,000 0.060 0.077 0.100 0.112 0.149 0.172 0.191$700,000 0.053 0.069 0.090 0.101 0.137 0.158 0.176$800,000 0.048 0.062 0.083 0.092 0.127 0.147 0.164$900,000 0.043 0.057 0.076 0.085 0.118 0.138 0.154
$1,000,000 0.040 0.052 0.071 0.079 0.111 0.130 0.145$2,000,000 0.022 0.030 0.043 0.048 0.072 0.086 0.096$3,000,000 0.015 0.022 0.032 0.036 0.055 0.066 0.074$4,000,000 0.012 0.017 0.026 0.028 0.045 0.054 0.061$5,000,000 0.009 0.014 0.021 0.024 0.038 0.046 0.052$6,000,000 0.008 0.011 0.018 0.020 0.033 0.040 0.045$7,000,000 0.007 0.010 0.015 0.017 0.028 0.035 0.040$8,000,000 0.006 0.008 0.013 0.015 0.025 0.031 0.036$9,000,000 0.005 0.007 0.012 0.013 0.022 0.028 0.032
$10,000,000 0.004 0.006 0.010 0.012 0.020 0.025 0.029
0.595
CountrywideExpected Loss Ratio
Type A: 2021-01Type B: 2021-01
© Copyright 2021 National Council on Compensation Insurance, Inc. All Rights Reserved. Page 46 of 136

RETROSPECTIVE RATING PLAN MANUAL IOWASTATE SPECIAL RATING VALUES
Effective January 1, 2022
Excess Loss andAllocated Expense Factors
(Applicable to New and Renewal Policies)
Per Accident Hazard GroupsLimitation A B C D E F G
$10,000 0.472 0.507 0.535 0.552 0.574 0.593 0.601$15,000 0.437 0.476 0.506 0.526 0.551 0.573 0.584$20,000 0.410 0.450 0.482 0.504 0.532 0.556 0.568$25,000 0.388 0.428 0.461 0.484 0.515 0.541 0.555$30,000 0.368 0.408 0.443 0.467 0.500 0.526 0.542$35,000 0.351 0.391 0.427 0.451 0.485 0.513 0.530$40,000 0.336 0.376 0.412 0.436 0.473 0.501 0.520$50,000 0.310 0.349 0.386 0.411 0.449 0.480 0.500$75,000 0.262 0.300 0.337 0.362 0.404 0.436 0.459
$100,000 0.230 0.265 0.302 0.326 0.370 0.402 0.427$125,000 0.205 0.239 0.275 0.298 0.343 0.376 0.401$150,000 0.186 0.218 0.253 0.276 0.321 0.353 0.379$175,000 0.170 0.201 0.236 0.257 0.302 0.335 0.360$200,000 0.157 0.187 0.221 0.241 0.286 0.318 0.344$225,000 0.146 0.174 0.208 0.228 0.273 0.304 0.329$250,000 0.137 0.164 0.197 0.216 0.261 0.292 0.317$275,000 0.128 0.155 0.187 0.206 0.250 0.280 0.305$300,000 0.121 0.147 0.178 0.196 0.240 0.270 0.295$325,000 0.115 0.139 0.170 0.188 0.232 0.261 0.285$350,000 0.109 0.133 0.163 0.180 0.224 0.253 0.277$375,000 0.104 0.127 0.157 0.173 0.216 0.245 0.268$400,000 0.099 0.122 0.151 0.167 0.210 0.238 0.261$425,000 0.095 0.117 0.145 0.161 0.203 0.231 0.254$450,000 0.091 0.112 0.140 0.156 0.198 0.225 0.248$475,000 0.087 0.108 0.136 0.151 0.192 0.219 0.242$500,000 0.084 0.104 0.132 0.146 0.187 0.214 0.236$600,000 0.073 0.092 0.117 0.130 0.170 0.195 0.216$700,000 0.065 0.082 0.106 0.118 0.156 0.180 0.200$800,000 0.058 0.074 0.097 0.108 0.145 0.168 0.187$900,000 0.053 0.068 0.090 0.100 0.136 0.157 0.175
$1,000,000 0.048 0.063 0.083 0.093 0.128 0.148 0.166$2,000,000 0.027 0.036 0.051 0.057 0.083 0.098 0.110$3,000,000 0.018 0.026 0.037 0.041 0.063 0.075 0.085$4,000,000 0.014 0.020 0.030 0.033 0.051 0.062 0.070$5,000,000 0.011 0.016 0.024 0.027 0.043 0.052 0.059$6,000,000 0.009 0.013 0.021 0.023 0.037 0.045 0.052$7,000,000 0.008 0.011 0.018 0.020 0.032 0.040 0.045$8,000,000 0.007 0.010 0.016 0.017 0.029 0.035 0.040$9,000,000 0.006 0.009 0.014 0.015 0.025 0.031 0.036
$10,000,000 0.005 0.008 0.012 0.014 0.023 0.028 0.033
6.
With Loss Limit Without Loss Limit 1st 2nd 3rd 1st 2nd 3rd 4th & SubsequentAdj. Adj. Adj. Adj. Adj. Adj. Adjustment0.04 0.02 0.01 0.13 0.08 0.05 0.00
Retrospective Development Factors
© Copyright 2021 National Council on Compensation Insurance, Inc. All Rights Reserved. Page 47 of 136

Table of Expense Ratios - Excluding Taxes andIncluding Profit and Contingencies
Type A: 2021-01
WC Premium Range Expense WC Premium Range Expense WC Premium Range ExpenseFrom To Ratio From To Ratio From To Ratio
0 - 10,055 0.371 21,928 - 22,469 0.323 393,334 - 424,799 0.274
10,056 - 10,167 0.370 22,470 - 23,037 0.322 424,800 - 461,739 0.273
10,168 - 10,282 0.369 23,038 - 23,636 0.321 461,740 - 505,714 0.272
10,283 - 10,399 0.368 23,637 - 24,266 0.320 505,715 - 558,947 0.271
10,400 - 10,520 0.367 24,267 - 24,931 0.319 558,948 - 624,705 0.270
10,521 - 10,643 0.366 24,932 - 25,633 0.318 624,706 - 707,999 0.269
10,644 - 10,769 0.365 25,634 - 26,376 0.317 708,000 - 816,923 0.268
10,770 - 10,898 0.364 26,377 - 27,164 0.316 816,924 - 965,454 0.267
10,899 - 11,030 0.363 27,165 - 27,999 0.315 965,455 - 1,179,999 0.266
11,031 - 11,165 0.362 28,000 - 28,888 0.314 1,180,000 - 1,517,142 0.266
11,166 - 11,304 0.361 28,889 - 29,836 0.313 1,517,143 - 1,824,799 0.265
11,305 - 11,446 0.360 29,837 - 30,847 0.312 1,824,800 - 1,983,478 0.264
11,447 - 11,592 0.359 30,848 - 31,929 0.311 1,983,479 - 2,172,380 0.263
11,593 - 11,741 0.358 31,930 - 33,090 0.310 2,172,381 - 2,401,052 0.262
11,742 - 11,895 0.357 33,091 - 34,339 0.309 2,401,053 - 2,683,529 0.261
11,896 - 12,052 0.356 34,340 - 35,686 0.308 2,683,530 - 3,041,333 0.260
12,053 - 12,214 0.355 35,687 - 37,142 0.307 3,041,334 - 3,509,230 0.259
12,215 - 12,380 0.354 37,143 - 38,723 0.306 3,509,231 - 4,147,272 0.258
12,381 - 12,551 0.353 38,724 - 40,444 0.305 4,147,273 - 5,068,888 0.257
12,552 - 12,727 0.352 40,445 - 42,325 0.304 5,068,889 - 6,517,142 0.256
12,728 - 12,907 0.352 42,326 - 44,390 0.303 6,517,143 - 9,123,999 0.255
12,908 - 13,093 0.351 44,391 - 46,666 0.302 9,124,000 - 15,206,666 0.254
13,094 - 13,284 0.350 46,667 - 49,189 0.301 15,206,667 - 45,619,999 0.253
13,285 - 13,481 0.349 49,190 - 51,999 0.300 45,620,000 - And Above 0.252
13,482 - 13,684 0.348 52,000 - 55,151 0.299
13,685 - 13,893 0.347 55,152 - 58,709 0.298
13,894 - 14,108 0.346 58,710 - 62,758 0.297
14,109 - 14,330 0.345 62,759 - 67,407 0.296
14,331 - 14,559 0.344 67,408 - 72,799 0.295
14,560 - 14,796 0.343 72,800 - 79,130 0.295
14,797 - 15,041 0.342 79,131 - 86,666 0.294
15,042 - 15,294 0.341 86,667 - 95,789 0.293
15,295 - 15,555 0.340 95,790 - 107,058 0.292
15,556 - 15,826 0.339 107,059 - 121,333 0.291
15,827 - 16,106 0.338 121,334 - 139,999 0.290
16,107 - 16,396 0.337 140,000 - 165,454 0.289
16,397 - 16,697 0.336 165,455 - 200,377 0.288
16,698 - 17,009 0.335 200,378 - 208,235 0.287
17,010 - 17,333 0.334 208,236 - 216,734 0.286
17,334 - 17,669 0.333 216,735 - 225,957 0.285
17,670 - 18,019 0.332 225,958 - 235,999 0.284
18,020 - 18,383 0.331 236,000 - 246,976 0.283
18,384 - 18,762 0.330 246,977 - 259,024 0.282
18,763 - 19,157 0.329 259,025 - 272,307 0.281
19,158 - 19,569 0.328 272,308 - 287,027 0.280
19,570 - 19,999 0.327 287,028 - 303,428 0.279
20,000 - 20,449 0.326 303,429 - 321,818 0.278 First - 10,000 0.0%
20,450 - 20,919 0.325 321,819 - 342,580 0.277 Next - 190,000 9.1%
20,920 - 21,411 0.324 342,581 - 366,206 0.276 Next - 1,550,000 11.3%
21,412 - 21,927 0.323 366,207 - 393,333 0.275 Over - 1,750,000 12.3%
Expected Loss Ratio: 0.595
Tax Multiplier: 1.035
© Copyright 2021 National Council on Compensation Insurance, Inc. All Rights Reserved. Page 48 of 136

Table of Expense Ratios - Excluding Taxes and Including Profit and Contingencies
Type B: 2021-01
WC Premium Range Expense WC Premium Range Expense WC Premium Range ExpenseFrom To Ratio From To Ratio From To Ratio
0 - 10,099 0.371 19,246 - 19,999 0.347 213,549 - 228,275 0.323
10,100 - 10,303 0.370 20,000 - 20,816 0.346 228,276 - 245,185 0.322
10,304 - 10,515 0.369 20,817 - 21,702 0.345 245,186 - 264,799 0.321
10,516 - 10,736 0.368 21,703 - 22,666 0.344 264,800 - 287,826 0.320
10,737 - 10,967 0.367 22,667 - 23,720 0.343 287,827 - 315,238 0.319
10,968 - 11,208 0.366 23,721 - 24,878 0.342 315,239 - 348,421 0.318
11,209 - 11,460 0.365 24,879 - 26,153 0.341 348,422 - 389,411 0.317
11,461 - 11,724 0.364 26,154 - 27,567 0.340 389,412 - 441,333 0.316
11,725 - 11,999 0.363 27,568 - 29,142 0.339 441,334 - 509,230 0.315
12,000 - 12,289 0.362 29,143 - 30,909 0.338 509,231 - 601,818 0.314
12,290 - 12,592 0.361 30,910 - 32,903 0.337 601,819 - 735,555 0.313
12,593 - 12,911 0.360 32,904 - 35,172 0.336 735,556 - 945,714 0.312
12,912 - 13,246 0.359 35,173 - 37,777 0.335 945,715 - 1,323,999 0.311
13,247 - 13,599 0.358 37,778 - 40,799 0.334 1,324,000 - 1,809,565 0.310
13,600 - 13,972 0.357 40,800 - 44,347 0.333 1,809,566 - 1,981,904 0.309
13,973 - 14,366 0.356 44,348 - 48,571 0.332 1,981,905 - 2,190,526 0.308
14,367 - 14,782 0.355 48,572 - 53,684 0.331 2,190,527 - 2,448,235 0.307
14,783 - 15,223 0.354 53,685 - 59,999 0.330 2,448,236 - 2,774,666 0.306
15,224 - 15,692 0.353 60,000 - 67,999 0.329 2,774,667 - 3,201,538 0.305
15,693 - 16,190 0.352 68,000 - 78,461 0.328 3,201,539 - 3,783,636 0.304
16,191 - 16,721 0.352 78,462 - 92,727 0.327 3,783,637 - 4,624,444 0.303
16,722 - 17,288 0.351 92,728 - 113,333 0.326 4,624,445 - 5,945,714 0.302
17,289 - 17,894 0.350 113,334 - 145,714 0.325 5,945,715 - 8,323,999 0.301
17,895 - 18,545 0.349 145,715 - 200,606 0.324 8,324,000 - 13,873,333 0.300
18,546 - 19,245 0.348 200,607 - 213,548 0.323 13,873,334 - 41,619,999 0.299
41,620,000 - And Above 0.298
First - 10,000 0.0%
Next - 190,000 5.1%
Next - 1,550,000 6.5%
Over - 1,750,000 7.5%
Expected Loss Ratio: 0.595
Tax Multiplier: 1.035
© Copyright 2021 National Council on Compensation Insurance, Inc. All Rights Reserved. Page 49 of 136

Table of Expense Ratios - Excluding Allocated Loss Adjustment Expense and Taxes and Including Profit and Contingencies
Type A: 2021-01
WC Premium Range Expense WC Premium Range Expense WC Premium Range ExpenseFrom To Ratio From To Ratio From To Ratio
0 - 10,055 0.307 21,928 - 22,469 0.258 393,334 - 424,799 0.210
10,056 - 10,167 0.306 22,470 - 23,037 0.257 424,800 - 461,739 0.209
10,168 - 10,282 0.305 23,038 - 23,636 0.256 461,740 - 505,714 0.208
10,283 - 10,399 0.304 23,637 - 24,266 0.255 505,715 - 558,947 0.207
10,400 - 10,520 0.303 24,267 - 24,931 0.254 558,948 - 624,705 0.206
10,521 - 10,643 0.302 24,932 - 25,633 0.253 624,706 - 707,999 0.205
10,644 - 10,769 0.301 25,634 - 26,376 0.252 708,000 - 816,923 0.204
10,770 - 10,898 0.300 26,377 - 27,164 0.251 816,924 - 965,454 0.203
10,899 - 11,030 0.299 27,165 - 27,999 0.250 965,455 - 1,179,999 0.202
11,031 - 11,165 0.298 28,000 - 28,888 0.250 1,180,000 - 1,517,142 0.201
11,166 - 11,304 0.297 28,889 - 29,836 0.249 1,517,143 - 1,824,799 0.200
11,305 - 11,446 0.296 29,837 - 30,847 0.248 1,824,800 - 1,983,478 0.199
11,447 - 11,592 0.295 30,848 - 31,929 0.247 1,983,479 - 2,172,380 0.198
11,593 - 11,741 0.294 31,930 - 33,090 0.246 2,172,381 - 2,401,052 0.197
11,742 - 11,895 0.293 33,091 - 34,339 0.245 2,401,053 - 2,683,529 0.196
11,896 - 12,052 0.292 34,340 - 35,686 0.244 2,683,530 - 3,041,333 0.195
12,053 - 12,214 0.291 35,687 - 37,142 0.243 3,041,334 - 3,509,230 0.194
12,215 - 12,380 0.290 37,143 - 38,723 0.242 3,509,231 - 4,147,272 0.193
12,381 - 12,551 0.289 38,724 - 40,444 0.241 4,147,273 - 5,068,888 0.193
12,552 - 12,727 0.288 40,445 - 42,325 0.240 5,068,889 - 6,517,142 0.192
12,728 - 12,907 0.287 42,326 - 44,390 0.239 6,517,143 - 9,123,999 0.191
12,908 - 13,093 0.286 44,391 - 46,666 0.238 9,124,000 - 15,206,666 0.190
13,094 - 13,284 0.285 46,667 - 49,189 0.237 15,206,667 - 45,619,999 0.189
13,285 - 13,481 0.284 49,190 - 51,999 0.236 45,620,000 - And Above 0.188
13,482 - 13,684 0.283 52,000 - 55,151 0.235
13,685 - 13,893 0.282 55,152 - 58,709 0.234
13,894 - 14,108 0.281 58,710 - 62,758 0.233
14,109 - 14,330 0.280 62,759 - 67,407 0.232
14,331 - 14,559 0.279 67,408 - 72,799 0.231
14,560 - 14,796 0.279 72,800 - 79,130 0.230
14,797 - 15,041 0.278 79,131 - 86,666 0.229
15,042 - 15,294 0.277 86,667 - 95,789 0.228
15,295 - 15,555 0.276 95,790 - 107,058 0.227
15,556 - 15,826 0.275 107,059 - 121,333 0.226
15,827 - 16,106 0.274 121,334 - 139,999 0.225
16,107 - 16,396 0.273 140,000 - 165,454 0.224
16,397 - 16,697 0.272 165,455 - 200,377 0.223
16,698 - 17,009 0.271 200,378 - 208,235 0.222
17,010 - 17,333 0.270 208,236 - 216,734 0.222
17,334 - 17,669 0.269 216,735 - 225,957 0.221
17,670 - 18,019 0.268 225,958 - 235,999 0.220
18,020 - 18,383 0.267 236,000 - 246,976 0.219
18,384 - 18,762 0.266 246,977 - 259,024 0.218
18,763 - 19,157 0.265 259,025 - 272,307 0.217
19,158 - 19,569 0.264 272,308 - 287,027 0.216
19,570 - 19,999 0.263 287,028 - 303,428 0.215
20,000 - 20,449 0.262 303,429 - 321,818 0.214 First - 10,000 0.0%
20,450 - 20,919 0.261 321,819 - 342,580 0.213 Next - 190,000 9.1%
20,920 - 21,411 0.260 342,581 - 366,206 0.212 Next - 1,550,000 11.3%
21,412 - 21,927 0.259 366,207 - 393,333 0.211 Over - 1,750,000 12.3%
Expected Loss and ALAE Ratio: 0.660
Tax Multiplier: 1.035
© Copyright 2021 National Council on Compensation Insurance, Inc. All Rights Reserved. Page 50 of 136

Table of Expense Ratios - Excluding Allocated Loss Adjustment Expense and Taxes and Including Profit and Contingencies
Type B: 2021-01
WC Premium Range Expense WC Premium Range Expense WC Premium Range ExpenseFrom To Ratio From To Ratio From To Ratio
0 - 10,099 0.307 19,246 - 19,999 0.282 213,549 - 228,275 0.258
10,100 - 10,303 0.306 20,000 - 20,816 0.281 228,276 - 245,185 0.257
10,304 - 10,515 0.305 20,817 - 21,702 0.280 245,186 - 264,799 0.256
10,516 - 10,736 0.304 21,703 - 22,666 0.279 264,800 - 287,826 0.255
10,737 - 10,967 0.303 22,667 - 23,720 0.279 287,827 - 315,238 0.254
10,968 - 11,208 0.302 23,721 - 24,878 0.278 315,239 - 348,421 0.253
11,209 - 11,460 0.301 24,879 - 26,153 0.277 348,422 - 389,411 0.252
11,461 - 11,724 0.300 26,154 - 27,567 0.276 389,412 - 441,333 0.251
11,725 - 11,999 0.299 27,568 - 29,142 0.275 441,334 - 509,230 0.250
12,000 - 12,289 0.298 29,143 - 30,909 0.274 509,231 - 601,818 0.250
12,290 - 12,592 0.297 30,910 - 32,903 0.273 601,819 - 735,555 0.249
12,593 - 12,911 0.296 32,904 - 35,172 0.272 735,556 - 945,714 0.248
12,912 - 13,246 0.295 35,173 - 37,777 0.271 945,715 - 1,323,999 0.247
13,247 - 13,599 0.294 37,778 - 40,799 0.270 1,324,000 - 1,809,565 0.246
13,600 - 13,972 0.293 40,800 - 44,347 0.269 1,809,566 - 1,981,904 0.245
13,973 - 14,366 0.292 44,348 - 48,571 0.268 1,981,905 - 2,190,526 0.244
14,367 - 14,782 0.291 48,572 - 53,684 0.267 2,190,527 - 2,448,235 0.243
14,783 - 15,223 0.290 53,685 - 59,999 0.266 2,448,236 - 2,774,666 0.242
15,224 - 15,692 0.289 60,000 - 67,999 0.265 2,774,667 - 3,201,538 0.241
15,693 - 16,190 0.288 68,000 - 78,461 0.264 3,201,539 - 3,783,636 0.240
16,191 - 16,721 0.287 78,462 - 92,727 0.263 3,783,637 - 4,624,444 0.239
16,722 - 17,288 0.286 92,728 - 113,333 0.262 4,624,445 - 5,945,714 0.238
17,289 - 17,894 0.285 113,334 - 145,714 0.261 5,945,715 - 8,323,999 0.237
17,895 - 18,545 0.284 145,715 - 200,606 0.260 8,324,000 - 13,873,333 0.236
18,546 - 19,245 0.283 200,607 - 213,548 0.259 13,873,334 - 41,619,999 0.235
41,620,000 - And Above 0.234
First 10,000 0.0%
Next 190,000 5.1%
Next 1,550,000 6.5%
Over 1,750,000 7.5%
Expected Loss and ALAE Ratio: 0.660
Tax Multiplier: 1.035
© Copyright 2021 National Council on Compensation Insurance, Inc. All Rights Reserved. Page 51 of 136

Iowa
Workers Compensation Rate Filing – January 1, 2022
Part 3 Supporting Exhibits
- Exhibit I: Determination of the Indicated Advisory Rate Level Change
- Exhibit II: Workers Compensation Expense Program
- Appendix A: Factors Underlying the Proposed Rate Level Change
- Appendix B: Calculations Underlying the Advisory Rate Change by Classification
- Appendix C: Memoranda for Laws and Assessments
- Appendix D: Internal Rate of Return Analysis
- Appendix E: Calculation of Factor to Convert Voluntary Rates to Assigned Risk Rates
- Appendix F: Derivation of Experience Rating Values
© Copyright 2021 National Council on Compensation Insurance, Inc. All Rights Reserved. Page 52 of 136

Iowa
Workers Compensation Rate Filing – January 1, 2022
Exhibit I – Determination of Indicated Advisory Rate Level Change
NCCI uses the following general methodology to determine the indicated change based on experience, trend, and benefits for each of the policy years in the experience period:
1. Standard earned premium at Designated Statistical Reporting (DSR) level is developed to ultimate and on-leveled to the current approved advisory rate level
2. Reported indemnity and medical losses are limited by a large loss threshold, developed to ultimate using limited development factors, and on-leveled to a common benefit level to yield adjusted limited losses
3. Limited indemnity and medical cost ratios excluding trend and benefits changes are calculated as adjusted losses (step 2) divided by premium available for benefit costs (step 1)
4. Trend factors are applied to the indemnity and medical cost ratios to reflect expected differences between the historical experience years and the effective period of the proposed filing
5. Limited losses are adjusted to an unlimited basis via a non-catastrophe excess ratio (with excess ratios at limits beyond $50 million set equal to zero)
6. A factor is applied to reflect the impact of proposed indemnity and medical benefit changes
7. The projected unlimited indemnity and medical cost ratios including benefit changes are added to yield the indicated change based on experience, trend, and benefits
The indicated change based on experience, trend, and benefits for this filing is calculated as the average of the indicated changes for each of the individual policy years in the experience period. Lastly, the impact of the change in loss-based expenses, change in production and general expenses, change in premium taxes and assessments, and change in the profit and contingency provision is applied to determine the indicated overall average advisory rate level change. The detailed calculations can be found on the following pages.
© Copyright 2021 National Council on Compensation Insurance, Inc. All Rights Reserved.
Page 53 of 136

Section A - Policy Year 2019 Experience
Premium:
(1) Standard Earned Premium Developed to Ultimate (Appendix A-II) $631,179,316(2) Premium On-level Factor (Appendix A-I) 0.594(3) Pure Premium Available for Benefit Costs = (1) x (2) $374,920,514
Indemnity Benefit Cost:
(4) Limited Indemnity Losses Developed to Ultimate (Appendix A-II) $147,626,542(5) Indemnity Loss On-level Factor (Appendix A-I) 1.000(6) Adjusted Limited Indemnity Losses = (4) x (5) $147,626,542(7) Adjusted Limited Indemnity Cost Ratio excluding Trend and Benefits = (6) / (3) 0.394(8) Factor to Reflect Indemnity Trend (Appendix A-III) 0.899(9) Projected Limited Indemnity Cost Ratio = (7) x (8) 0.354
(10) Factor to Adjust Indemnity Cost Ratio to an Unlimited Basis (Appendix A-II) 1.031(11) Projected Indemnity Cost Ratio = (9) x (10) 0.365(12) Factor to Reflect Proposed Changes in Indemnity Benefits (Appendix C) 1.000(13) Projected Indemnity Cost Ratio including Benefit Changes = (11) x (12) 0.365
Medical Benefit Cost:
(14) Limited Medical Losses Developed to Ultimate (Appendix A-II) $207,494,298(15) Medical Loss On-level Factor (Appendix A-I) 1.000(16) Adjusted Limited Medical Losses = (14) x (15) $207,494,298(17) Adjusted Limited Medical Cost Ratio excluding Trend and Benefits = (16) / (3) 0.553(18) Factor to Reflect Medical Trend (Appendix A-III) 0.956(19) Projected Limited Medical Cost Ratio = (17) x (18) 0.529(20) Factor to Adjust Medical Cost Ratio to an Unlimited Basis (Appendix A-II) 1.031(21) Projected Medical Cost Ratio = (19) x (20) 0.545(22) Factor to Reflect Proposed Changes in Medical Benefits (Appendix C) 1.000(23) Projected Medical Cost Ratio including Benefit Changes = (21) x (22) 0.545
Total Benefit Cost:
(24) Indicated Change Based on Experience, Trend and Benefits = (13) + (23) 0.910
EXHIBIT I
IOWA
Determination of Indicated Rate Level Change
© Copyright 2021 National Council on Compensation Insurance, Inc. All Rights Reserved.
Page 54 of 136

EXHIBIT I
IOWA
Determination of Indicated Rate Level Change
Section B - Policy Year 2018 Experience
Premium:
(1) Standard Earned Premium Developed to Ultimate (Appendix A-II) $696,009,039(2) Premium On-level Factor (Appendix A-I) 0.524(3) Pure Premium Available for Benefit Costs = (1) x (2) $364,708,736
Indemnity Benefit Cost:
(4) Limited Indemnity Losses Developed to Ultimate (Appendix A-II) $147,815,266(5) Indemnity Loss On-level Factor (Appendix A-I) 1.003(6) Adjusted Limited Indemnity Losses = (4) x (5) $148,258,712(7) Adjusted Limited Indemnity Cost Ratio excluding Trend and Benefits = (6) / (3) 0.407(8) Factor to Reflect Indemnity Trend (Appendix A-III) 0.867(9) Projected Limited Indemnity Cost Ratio = (7) x (8) 0.353
(10) Factor to Adjust Indemnity Cost Ratio to an Unlimited Basis (Appendix A-II) 1.031(11) Projected Indemnity Cost Ratio = (9) x (10) 0.364(12) Factor to Reflect Proposed Changes in Indemnity Benefits (Appendix C) 1.000(13) Projected Indemnity Cost Ratio including Benefit Changes = (11) x (12) 0.364
Medical Benefit Cost:
(14) Limited Medical Losses Developed to Ultimate (Appendix A-II) $211,287,825(15) Medical Loss On-level Factor (Appendix A-I) 1.000(16) Adjusted Limited Medical Losses = (14) x (15) $211,287,825(17) Adjusted Limited Medical Cost Ratio excluding Trend and Benefits = (16) / (3) 0.579(18) Factor to Reflect Medical Trend (Appendix A-III) 0.941(19) Projected Limited Medical Cost Ratio = (17) x (18) 0.545(20) Factor to Adjust Medical Cost Ratio to an Unlimited Basis (Appendix A-II) 1.031(21) Projected Medical Cost Ratio = (19) x (20) 0.562(22) Factor to Reflect Proposed Changes in Medical Benefits (Appendix C) 1.000(23) Projected Medical Cost Ratio including Benefit Changes = (21) x (22) 0.562
Total Benefit Cost:
(24) Indicated Change Based on Experience, Trend and Benefits = (13) + (23) 0.926
© Copyright 2021 National Council on Compensation Insurance, Inc. All Rights Reserved.
Page 55 of 136

Section C - Indicated Change Based on Experience, Trend, and Benefits
(1) Policy Year 2019 Indicated Change Based on Experience, Trend, and Benefits 0.910
(2) Policy Year 2018 Indicated Change Based on Experience, Trend, and Benefits 0.926
(3) Indicated Change Based on Experience, Trend, and Benefits = [(1)+(2)] / 2 0.918
Section D - Application of the Change in Production and General Expenses
(1) Indicated Rate Level Change 0.918
(2) Effect of the Change in Production and General Expenses (Exhibit II) 1.006
(3) Indicated Change Modified to Reflect the Change in Production and General Expenses = (1) x (2) 0.924
Section E - Application of the Change in Taxes
(1) Indicated Rate Level Change 0.924
(2) Effect of the Change in Taxes (Exhibit II) 1.000
(3) Indicated Change Modified to Reflect the Change in Taxes = (1) x (2) 0.924
Section F - Application of the Change in the Profit and Contingency Provision
(1) Indicated Rate Level Change 0.924
(2) Effect of the Change in the Profit and Contingency Provision (Exhibit II) 1.014
(3) Indicated Change Modified to Reflect the Change in the Profit and Contingency Provision = (1) x (2) 0.937
Section G - Application of the Change in Loss-based Expenses
(1) Indicated Rate Level Change 0.937
(2) Effect of the Change in Loss-based Expenses (Exhibit II) 1.009
(3) Indicated Change Modified to Reflect the Change in Loss-based Expenses = (1) x (2) 0.945
IOWA
EXHIBIT I
Determination of Indicated Rate Level Change
© Copyright 2021 National Council on Compensation Insurance, Inc. All Rights Reserved.
Page 56 of 136

IOWA
EXHIBIT I
Determination of Indicated Rate Level Change
Section H - Distribution of Overall Rate Level Change to Industry Groups
Industry Group Differentials (Appendix A-IV):
Manufacturing 0.997Contracting 1.011Office & Clerical 0.989Goods & Services 0.999Miscellaneous 1.001
(1) (2) (3) = (1) x (2)Final Overall Industry Final Rate
Rate Group Level ChangeIndustry Group Level Change Differential by Industry GroupManufacturing 0.945 0.997 0.942 (-5.8%)Contracting 0.945 1.011 0.955 (-4.5%)Office & Clerical 0.945 0.989 0.935 (-6.5%)Goods & Services 0.945 0.999 0.944 (-5.6%)Miscellaneous 0.945 1.001 0.946 (-5.4%)Overall 0.945 1.000 0.945 (-5.5%)
Applying these industry group differentials to the final overall rate level change produces the changes in rate level proposed for each group as shown:
© Copyright 2021 National Council on Compensation Insurance, Inc. All Rights Reserved.
Page 57 of 136

Iowa
Workers Compensation Rate Filing – January 1, 2022
Exhibit II – Workers Compensation Expense Program
Loss Adjustment Expenses
The proposed rates include a provision for loss adjustment expenses (LAE).
LAE is included in the rates by using a ratio of loss adjustment expense dollars to loss dollars (called the LAE provision). These expenses are directly associated with the handling of workers compensation claims. The LAE provision is comprised of two components: Adjusting and Other Expenses (AOE) and Defense and Cost Containment Expenses (DCCE).
Given the nature of AOE, it cannot be allocated to a specific claim, and hence cannot be accurately attributed to specific states. Therefore, the state-specific AOE ratio reflects the latest selected countrywide provision. The countrywide provision was calculated using data obtained from the NCCI Call for Loss Adjustment Expense. The accident year developed AOE ratios displayed in Section A are calculated on a countrywide basis using private carrier-only data after removing the reported COVID-19-related losses.
The reported DCCE and losses from COVID-19-related claims have been excluded from the underlying data in this year’s analysis to better reflect the conditions likely to prevail in the proposed effective period. NCCI used the following general methodology to determine the proposed DCCE provision based on Iowa-specific paid DCCE and losses reported on the NCCI Call for Policy Year Data:
Ratios of reported paid DCCE-to-paid losses by policy year are developed to a 19th report using DCCE ratio development factors.
A 19th-to-ultimate tail factor is applied to reflect expected development beyond a 19th report. The proposed DCCE provision is selected based on the ultimate projected DCCE ratios by
policy year.
The calculation of the loss adjustment expense provision is shown in Section F.
Production and General Expenses, and Taxes
Production costs include commissions, costs of preparing the policy, verifying the correct application of rates and rating plans, billing and collecting premium and the costs of maintaining company branch offices. General expenses are commonly classified into four categories: general administration, audit, boards and bureaus, and inspection.
The proposed expenses are reviewed each year. The annual review relies on actual experience in recent years based on the most recently available data from the Insurance Expense Exhibit, which is reported annually by insurers to state insurance departments.
See Section A for more information.
© Copyright 2021 National Council on Compensation Insurance, Inc. All Rights Reserved.
Page 58 of 136

Iowa
Workers Compensation Rate Filing – January 1, 2022
Exhibit II – Workers Compensation Expense Program
Profit and Contingency Provision
NCCI is proposing to increase the current approved profit and contingency provision of 1.0% to 2.0%. See Appendix D for more information.
© Copyright 2021 National Council on Compensation Insurance, Inc. All Rights Reserved.
Page 59 of 136
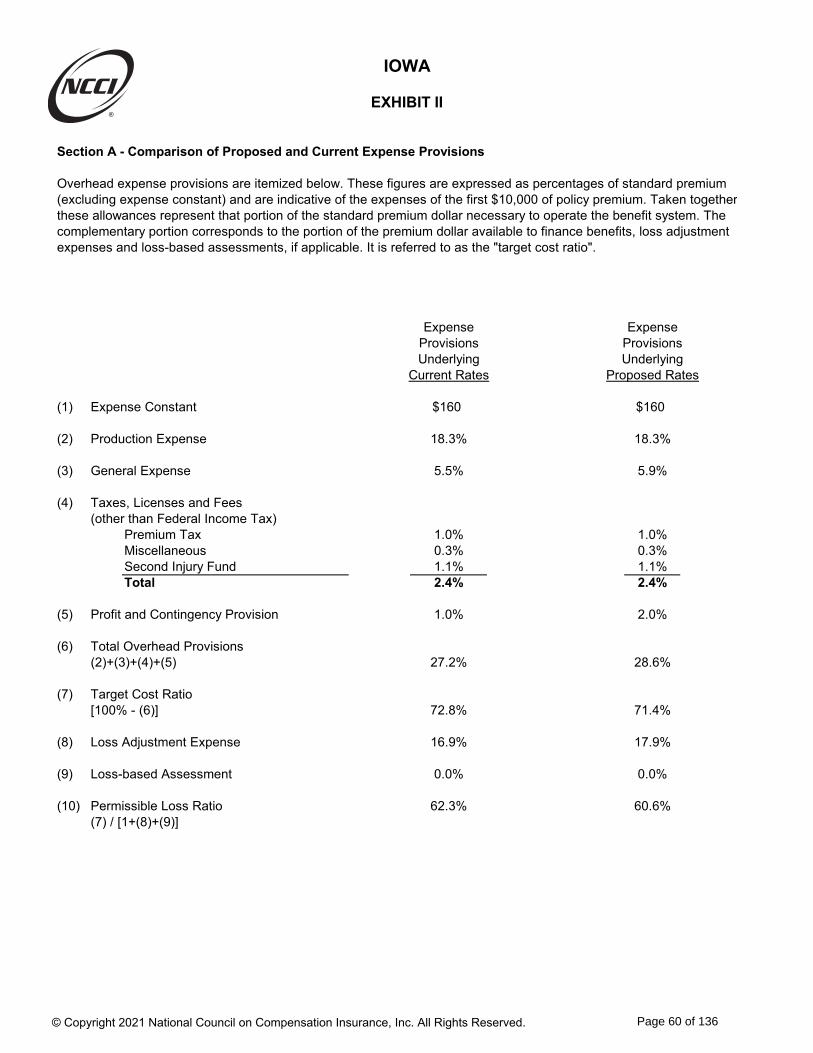
Section A - Comparison of Proposed and Current Expense Provisions
Overhead expense provisions are itemized below. These figures are expressed as percentages of standard premium(excluding expense constant) and are indicative of the expenses of the first $10,000 of policy premium. Taken togetherthese allowances represent that portion of the standard premium dollar necessary to operate the benefit system. The complementary portion corresponds to the portion of the premium dollar available to finance benefits, loss adjustmentexpenses and loss-based assessments, if applicable. It is referred to as the "target cost ratio".
Expense ExpenseProvisions ProvisionsUnderlying Underlying
Current Rates Proposed Rates
(1) Expense Constant $160 $160
(2) Production Expense 18.3% 18.3%
(3) General Expense 5.5% 5.9%
(4) Taxes, Licenses and Fees(other than Federal Income Tax)
Premium Tax 1.0% 1.0%Miscellaneous 0.3% 0.3%Second Injury Fund 1.1% 1.1%Total 2.4% 2.4%
(5) Profit and Contingency Provision 1.0% 2.0%
(6) Total Overhead Provisions(2)+(3)+(4)+(5) 27.2% 28.6%
(7) Target Cost Ratio[100% - (6)] 72.8% 71.4%
(8) Loss Adjustment Expense 16.9% 17.9%
(9) Loss-based Assessment 0.0% 0.0%
(10) Permissible Loss Ratio 62.3% 60.6%(7) / [1+(8)+(9)]
IOWA
EXHIBIT II
© Copyright 2021 National Council on Compensation Insurance, Inc. All Rights Reserved.
Page 60 of 136

Section B - Calculation of Change in Expense Provisions
A B C DCol. A with Col. C with
Current Proposed Prod Col. B with Proposed ProfitExpenses & Gen Exp Proposed Taxes and Contingency
(1) Production Expense 18.3% 18.3% 18.3% 18.3%
(2) General Expense 5.5% 5.9% 5.9% 5.9%
(3) Taxes 2.4% 2.4% 2.4% 2.4%
(4) Profit and Contingency Provision 1.0% 1.0% 1.0% 2.0%
(5) Total Provisions 27.2% 27.6% 27.6% 28.6%(1)+(2)+(3)+(4)
(6) TCR 72.8% 72.4% 72.4% 71.4%(100%-(5))
(7) Loss Based Expenses 16.9% 17.9% 17.9% 17.9%
(8) Change in Production and General Expense 1.006 +0.6%(6A) / (6B)
(9) Change in Taxes and Assessments 1.000 0.0%(6B) / (6C)
(10) Change in Profit and Contingency Provision 1.014 +1.4%(6C) / (6D)
(11) Change in Loss Based Expenses 1.009 +0.9%[1.0 + (7B)]/[1.0 + (7A)]
IOWA
EXHIBIT II
© Copyright 2021 National Council on Compensation Insurance, Inc. All Rights Reserved.
Page 61 of 136
Section C - Countrywide Expense Program
NCCI annually reviews expense provisions underlying workers compensation rates.
This review procedure is based on countrywide expense data. Since a significant portion of
workers compensation insurance is interstate business, it is not practical to allocate expenses
(especially general, other acquisition, and adjusting and other loss adjustment expenses) to particular
states.
The NCCI expense program is designed to ensure equity among employers through a
percentage provision in manual rates, a schedule of premium discounts for risks with standard
premium in excess of $10,000, and the application of an expense constant.
The majority of expenses incurred in workers compensation vary directly by layer of
premium and are accordingly termed variable expenses. An equitable apportionment of variable
expense is achieved through the application of premium discounts. As the premium for a policy
increases, some expenses incurred in handling the insurance coverage become proportionately
less in terms of premium. A fair expense program must, therefore, provide that the larger premium
policies be charged a lower percentage of premium for these expenses than the smaller policies.
Other expenses such as issuing, recording and auditing are common to all policies regardless
of size. These common expenses are called fixed expenses and are addressed by incorporating
an expense constant in the program.
IOWA
EXHIBIT II
© Copyright 2021 National Council on Compensation Insurance, Inc. All Rights Reserved.
Page 62 of 136

Section D - Derivation of General Expense Provisions
The data below (amounts in thousands) illustrates that the combination of a 5.9% general expense provisionin the manual rates, a $160 expense constant, and the premium discount schedule generates general expensepremium dollars that are consistent with historical actual general expenses as reported in the Insurance Expense Exhibit. All figures below obtained from the Insurance Expense Exhibit (IEE) include data for stock andmutual companies.
2018 2019 2020
(1) Direct Earned Premium 50,055,106 48,715,850 44,697,279 (NAIC Insurance Expense Exhibit Data)(1a) Effect of Premium Discounts 0.9283 0.9287 0.9287(1b) Effect of Schedule Rating 0.9519 0.9542 0.9563(1c) Effect of Carrier Deviations 1.0361 1.0603 1.0736(1d) Effect of Deductibles 0.7341 0.7479 0.7615(1e) Expense Constant Offset 0.9914 0.9906 0.9906
(2) Gross Adjusted Premium 73,834,736 68,672,278 60,981,401(STD Premium @ NCCI Level Excl. Expense Constant){(1) / [(1a) x (1b) x (1c) x (1d)]} x (1e)
(3) Direct General Expenses Incurred 3,291,102 3,444,654 3,322,341 (NAIC Insurance Expense Exhibit Data)
(3a) Proportion of Expense Constant Attributable to General Expenses 0.4063 0.4063 0.4063
(4) General Expenses Incurred 3,030,872 3,179,891 3,087,230(Excluding Expense Constant Revenue)(3) - (2) x [1-(1e)]/(1e) x (3a)
(5) Ratio of General Expense to Premium 4.10% 4.63% 5.06%(Excluding Expense Constant Revenue)(4)/(2)
(6) General Expense Gradations 1.27% 1.25% 1.23%(General Expenses in Average Premium Discount)
(7) General Expense Provision 5.37% 5.88% 6.29%(5)+(6)
(8) Selected General Expense Provision 5.9%
IOWA
EXHIBIT II
© Copyright 2021 National Council on Compensation Insurance, Inc. All Rights Reserved.
Page 63 of 136

Section E - Derivation of Production Expense Provisions
The data below (amounts in thousands) illustrates that the combination of a 18.3% production expense provisionin the manual rates, a $160 expense constant, and the premium discount schedule generates production expensepremium dollars that are consistent with historical actual production expenses as reported for combined stock andmutual companies' voluntary business. All figures below obtained from the Insurance Expense Exhibit (IEE) includedata for stock and mutual companies.
2018 2019 2020
(1) Direct Written Premium 49,778,219 48,542,793 44,395,749 (NAIC Insurance Expense Exhibit Data)(1a) Effect of Premium Discounts 0.9286 0.9287 0.9287(1b) Effect of Schedule Rating 0.9532 0.9550 0.9573(1c) Effect of Carrier Deviations 1.0461 1.0706 1.0758(1d) Effect of Deductibles 0.7348 0.7615 0.7615 (1e) Expense Constant Offset 0.9911 0.9900 0.9900
(2) Pool Written Premium 1,096,491 973,698 900,966 (Summary of NCCI Managed Pools -Combined Stock and Mutual Company Data)
(3) Adjusted Direct Written Premium 51,958,282 50,708,952 46,365,710(STD Premium Excl. Pool Written Premium)[(1)-(2)] / (1a) x (1e)
(4) Gross Direct Written Premium 72,510,645 66,463,620 60,346,437(STD Premium @ NCCI Level Incl. Pool Written Premium){(1) / [(1a) x (1b) x (1c) x (1d)]} x (1e)
(5) Direct Commission & Brokerage Incurred 4,460,371 4,366,984 3,982,263 (NAIC Insurance Expense Exhibit Data)
(6) Pool Producer Fees 39,215 33,836 29,463 (Summary of NCCI Managed Pools -Combined Stock and Mutual Company Data)
(7) Direct Other Acquisition Expenses Incurred 2,580,093 2,417,343 2,212,876 (NAIC Insurance Expense Exhibit Data)
(7a) Proportion of Expense Constant Attributable to 0.5313 0.5313 0.5313 Production Expenses
(8) Other Acquisition Expenses Incurred 2,234,142 2,060,655 1,889,017 (Excluding Expense Constant Revenue)(7) - (4) x [1-(1e)]/(1e) x (7a)
(9) Ratio of Other Acq. Expenses to Premium 3.08% 3.10% 3.13%(Excluding Expense Constant Revenue)(8)/(4)
(10) Direct Commission & Brokerage Provision 8.51% 8.55% 8.53%[(5)-(6)]/(3)
(11) Production Expense Gradations 6.74% 6.65% 6.65%(Production Expenses in Average Premium Discount)
(12) Production Expense Provision 18.33% 18.30% 18.31%(9)+(10)+(11)
(13) Selected Production Expense Provision 18.3%
IOWA
EXHIBIT II
© Copyright 2021 National Council on Compensation Insurance, Inc. All Rights Reserved.
Page 64 of 136

Section F (a) - Determination of Loss Adjustment Expense Provision
In this filing, NCCI proposes a 17.9% loss adjustment expense allowance as a percentage of losses.The DCCE provision is based on Iowa-specific data reported to NCCI on the Policy Year Call for Experience.The AOE provision is based on countrywide data reported to NCCI on the Call for Loss Adjustment Expense.
Developed DevelopedPolicy Year DCCE Ratio Accident Year AOE Ratio
2015 7.5% 2016 8.5%2016 8.2% 2017 9.1%2017 8.1% 2018 9.1%2018 8.8% 2019 9.4%2019 8.7% 2020 9.8%
Countrywide selected: 9.4%
Iowa selected: 8.5% + 9.4% = 17.9%
Section F (b) - Defense and Cost Containment Expense (DCCE) Ratio
(1) (2) (3) (4) = (2) x (3)Reported Ratio of Age-to-Ultimate
Policy Paid DCCE to Development UltimateYear Paid Losses Factor DCCE Ratio2015 7.7% 0.971 7.5%2016 8.4% 0.981 8.2%2017 8.0% 1.008 8.1%2018 7.9% 1.111 8.8%2019 6.7% 1.295 8.7%
Iowa selected: 8.5%
Section F (c) - Proposed Change in the Iowa Loss Adjustment Expense (LAE) Provision
(5) (6)Current Proposed
Iowa LAE Provision 16.9% 17.9%
Proposed Change in LAE Provision 1.009 = [1.000 + (6)] / [1.000 + (5)] - 1 (+0.9%)
IOWA
EXHIBIT II
Workers Compensation Loss Adjustment Expense Provision
© Copyright 2021 National Council on Compensation Insurance, Inc. All Rights Reserved.
Page 65 of 136

Section G - Table of Premium Discounts
Type A Type BDivision of Standard Premium Discounts Discounts
First $10,000 --- ---Next1 $190,000 9.1% 5.1%Next2 $1,550,000 11.3% 6.5%Over $1,750,000 12.3% 7.5%
Application of the appropriate discount schedule to the standard premium produces a dollar discountthat is subtracted from the standard premium.
IOWA
EXHIBIT II
© Copyright 2021 National Council on Compensation Insurance, Inc. All Rights Reserved.
Page 66 of 136

Section H - Average Expense Provisions
Reproduced below are the gradated expense provisions by policy size.
Gradation of Standard PremiumExpense Gradations
Division of Type A *Premium Production* General DiscountsFirst $10,000 18.3% 5.9% ---Next1 $190,000 10.8% 4.9% 9.1%Next2 $1,550,000 9.3% 4.3% 11.3%Over $1,750,000 9.3% 3.4% 12.3%Proposed Average: 11.6% 4.6%
Proposed Average Expense Gradation: 6.7% 1.3%(Expense for 1st $10,000 - Avg Expense)
Average Premium Discount:[Avg Exp Grad] / [1-Taxes-P&C] = [6.7%+1.3%] / [1-2.4% - 2.0%] = 8.4%
Composition of Standard Premium:
Benefit & Production General Profit TaxesLoss Adj. (18.3%) (5.9%) (2.0%) (2.4%)Cost
Premium Standard Premium71.4% 11.6% 4.6% 1.8% 2.2% -- After -- Excluding Expense Constant
Discounts (100.0%)(91.6%)
6.7% 1.3% 0.2% 0.2% -- Discount (8.4%)
0.6% 0.4% 0.0% 0.0% -- Premium from $160 expense constant.(1.0% = 1/0.990 - 1)^
Notes
* The production expense gradations shown are based on Type A gradations.^ The 0.990 offset is for the $160 expense constant.
IOWA
EXHIBIT II
© Copyright 2021 National Council on Compensation Insurance, Inc. All Rights Reserved.
Page 67 of 136

Section I - Iowa Expense Provisions as a Percentage of Net Premium at NCCI Level
The exhibit below illustrates the allocation of the final premium dollar after the application of premiumdiscounts and expense constants based on IOWA expense provisions.
Notes
Benefit & Loss Adjustment Costs 77.0% = (71.4%) / 92.6%Production Expense 13.2% = (11.6% + 0.6%) / 92.6%General Expense 5.4% = (4.6% + 0.4%) / 92.6%Profit 2.0% = (1.8% + 0.0%) / 92.6%Taxes 2.4% = (2.2% + 0.0%) / 92.6%
Total 100.0%
IOWA
EXHIBIT II
77.0%
13.2%
5.4%
2.0%
2.4%
Benefit & Loss Adjustment Costs
Production Expense
General Expense
Profit
Taxes
Components of Premium
© Copyright 2021 National Council on Compensation Insurance, Inc. All Rights Reserved.
Page 68 of 136

Iowa
Workers Compensation Rate Filing – January 1, 2022
Appendix A – Factors Underlying the Proposed Rate Level Change
Appendix A-I Determination of Policy Year On-level Factors
NCCI uses premium and loss on-level factors to adjust historical policy year experience to current rate and benefit levels, respectively.
Premium on-level factors are adjustment factors that reflect the cumulative impact of all premium level changes that have occurred during and after the individual year being on-leveled. To calculate a weighted average, NCCI utilizes a monthly premium distribution for Iowa based on an analysis of policies reported in the Unit Statistical Data. Additional adjustments applied as part of the premium on-level factor calculation include:
Adjustment for Expense Constant Removal: This factor removes premium collected via the charged expense constant.
Adjustment for Expense Removal: This factor is applied to remove expenses from the reported assigned risk and voluntary DSR level premium totals—serving to make the separate market premiums more comparable.
Experience Rating Off-Balance Adjustment Factor: This factor reflects the relative difference between the average experience rating modification for the historical year being on-leveled and the average experience rating modification targeted in the filing.
Loss on-level factors are adjustment factors that reflect the cumulative impact of all benefit level changes that have occurred during and after the individual year of data being on-leveled.
Note: For NCCI ratemaking purposes, proposed benefit level changes that (i) do not impact the experience period of the filing and (ii) have not yet been approved are included in Exhibit I, rather than in the loss on-level calculation.
© Copyright 2021 National Council on Compensation Insurance, Inc. All Rights Reserved.
Page 69 of 136

IOWA
APPENDIX A-I
Determination of Policy Year On-level Factors
Section A - Factor Adjusting 2019 Policy Year Assigned Risk Premium to Present Assigned Risk Level
(1) (2) (3) (4) (5) (6) (7) (8) Adj. For Premium
Rate Adj. Factor Expense Adj. For AdjustmentLevel Cumulative Product Present Index/ Constant Expense Factor
Date Change Index Weight (2)x(3) Sum Column (4) Removal @ Removal (5)x(6)x(7)
NR 01/01/19 Base 1.000 1.000 1.000 0.973 0.976 0.623 0.592NR 01/01/20 0.970 0.970NR 01/01/21 1.003 0.973
1.000
Section B - Factor Adjusting 2019 Policy Year Voluntary Premium to Present Voluntary Level
(1) (2) (3) (4) (5) (6) (7) (8)Adj. For Premium
Rate Adj. Factor Expense Adj. For AdjustmentLevel Cumulative Product Present Index/ Constant Expense Factor
Date Change Index Weight (2)x(3) Sum Column (4) Removal @ Removal (5)x(6)x(7)
NR 01/01/19 Base 1.000 1.000 1.000 0.973 0.987 0.623 0.598NR 01/01/20 0.970 0.970NR 01/01/21 1.003 0.973
1.000
Section C - Factor Adjusting 2019 Policy Year Assigned Risk Premium and Voluntary Premium to Present Statewide Level
(1) Assigned Risk Market Share PY 2019 0.040(2) Voluntary Market Share PY 2019 0.960(3) Assigned Risk Standard Premium Adjustment Factor (See Sec. A) 0.592(4) Voluntary Standard Premium Adjustment Factor (See Sec. B) 0.598(5) Premium Adjustment Factor = [(1)x(3)]/1.398+(2)x(4) # 0.591(6) Experience Rating Off-balance Adjustment Factor* 1.005(7) Final Premium Adjustment Factor = (5)x(6) 0.594
NR New and renewal business.@ Eliminates premium derived from expense constants.# Current premium index (assigned risk-to-voluntary) = 1.398* = 1.005 = 0.948 / 0.943 = (Targeted Off-balance) / (Off-balance for Policy Year 2019)
© Copyright 2021 National Council on Compensation Insurance, Inc. All Rights Reserved.
Page 70 of 136

IOWA
APPENDIX A-I
Determination of Policy Year On-level Factors
Section D - Factor Adjusting 2019 Policy Year Indemnity Losses to Present Benefit Level
(1) (2) (3) (4) (5)
Benefit Adj. FactorLevel Cumulative Product Present Index/
Date Change Index Weight (2)x(3) Sum Column (4)
01/01/19 Base 1.000 1.000 1.000 1.0001.000
Section E - Factor Adjusting 2019 Policy Year Medical Losses to Present Benefit Level
(1) (2) (3) (4) (5)
Benefit Adj. FactorLevel Cumulative Product Present Index/
Date Change Index Weight (2)x(3) Sum Column (4)
01/01/19 Base 1.000 1.000 1.000 1.0001.000
© Copyright 2021 National Council on Compensation Insurance, Inc. All Rights Reserved.
Page 71 of 136

IOWA
APPENDIX A-I
Determination of Policy Year On-level Factors
Section F - Factor Adjusting 2018 Policy Year Assigned Risk Premium to Present Assigned Risk Level
(1) (2) (3) (4) (5) (6) (7) (8) Adj. For Premium
Rate Adj. Factor Expense Adj. For AdjustmentLevel Cumulative Product Present Index/ Constant Expense Factor
Date Change Index Weight (2)x(3) Sum Column (4) Removal @ Removal (5)x(6)x(7)
NR 01/01/18 Base 1.000 0.467 0.467 0.854 0.977 0.623 0.520NR 06/01/18 0.981 0.981 0.533 0.523NR 01/01/19 0.885 0.868NR 01/01/20 0.970 0.842NR 01/01/21 1.003 0.845
0.990
Section G - Factor Adjusting 2018 Policy Year Voluntary Premium to Present Voluntary Level
(1) (2) (3) (4) (5) (6) (7) (8)Adj. For Premium
Rate Adj. Factor Expense Adj. For AdjustmentLevel Cumulative Product Present Index/ Constant Expense Factor
Date Change Index Weight (2)x(3) Sum Column (4) Removal @ Removal (5)x(6)x(7)
NR 01/01/18 Base 1.000 0.467 0.467 0.854 0.987 0.623 0.525NR 06/01/18 0.981 0.981 0.533 0.523NR 01/01/19 0.885 0.868NR 01/01/20 0.970 0.842NR 01/01/21 1.003 0.845
0.990
Section H - Factor Adjusting 2018 Policy Year Assigned Risk Premium and Voluntary Premium to Present Statewide Level
(1) Assigned Risk Market Share PY 2018 0.039(2) Voluntary Market Share PY 2018 0.961(3) Assigned Risk Standard Premium Adjustment Factor (See Sec. F) 0.520(4) Voluntary Standard Premium Adjustment Factor (See Sec. G) 0.525(5) Premium Adjustment Factor = [(1)x(3)]/1.398+(2)x(4) # 0.519(6) Experience Rating Off-balance Adjustment Factor* 1.009(7) Final Premium Adjustment Factor = (5)x(6) 0.524
NR New and renewal business.@ Eliminates premium derived from expense constants.# Current premium index (assigned risk-to-voluntary) = 1.398* = 1.009 = 0.948 / 0.940 = (Targeted Off-balance) / (Off-balance for Policy Year 2018)
© Copyright 2021 National Council on Compensation Insurance, Inc. All Rights Reserved.
Page 72 of 136

IOWA
APPENDIX A-I
Determination of Policy Year On-level Factors
Section I - Factor Adjusting 2018 Policy Year Indemnity Losses to Present Benefit Level
(1) (2) (3) (4) (5)
Benefit Adj. FactorLevel Cumulative Product Present Index/
Date Change Index Weight (2)x(3) Sum Column (4)
01/01/18 Base 1.000 0.589 0.589 1.00301/01/19 1.005 1.005 0.411 0.413
1.002
Section J - Factor Adjusting 2018 Policy Year Medical Losses to Present Benefit Level
(1) (2) (3) (4) (5)
Benefit Adj. FactorLevel Cumulative Product Present Index/
Date Change Index Weight (2)x(3) Sum Column (4)
01/01/18 Base 1.000 0.589 0.589 1.00001/01/19 1.000 1.000 0.411 0.411
1.000
© Copyright 2021 National Council on Compensation Insurance, Inc. All Rights Reserved.
Page 73 of 136

Iowa
Workers Compensation Rate Filing – January 1, 2022
Appendix A – Factors Underlying the Proposed Rate Level Change
Appendix A-II Determination of Premium and Losses Developed to an Ultimate Report
Development factors are used to project premium and limited losses to an ultimate report. In general, the ultimate development factors are based on a chain-ladder approach that utilizes average link ratios for several maturities and the application of a tail factor, as shown in Appendix A-II Sections A through J.
Limited Large Loss Methodology
In order to limit volatility on the rate indications due to the impact of extraordinary large losses, a limited large loss methodology is used in Iowa. A base threshold for the large loss limitation is determined by the volume of premium in the state as well as the number of years used in the experience period. The base threshold proposed in this filing is $7,421,321, based on the volume of premium in policy years 2017 and 2018 underlying the currently approved filing that utilizes data valued as of 12/31/2019. The base threshold is detrended by policy year to reflect the inflationary impact on claim costs due to wage inflation. The wage index used as a basis for these calculations is the Iowa average weekly wages from the Quarterly Census of Employment and Wages (QCEW). Detrended thresholds are used in the experience period, trend period, and loss development period. Indemnity and medical losses are limited at the detrended large loss threshold corresponding to their policy year, as shown in Appendix A-II Section L.
Limited indemnity and medical losses used to calculate the ultimate losses are shown in Appendix A-II Section A.
After developing limited indemnity and medical losses to an ultimate report, a statewide, non-catastrophe excess ratio at the base threshold is used to adjust the limited losses to an unlimited basis. The excess ratios are non-catastrophe because excess ratios at limits beyond $50 million are set equal to zero. The proposed excess ratio in this filing is 3.0%, as shown in Appendix A-II Section K.
Development Factors
For premium development, link ratios are used from 1st report through 5th report. It is assumed that no further development occurs after the 5th report.
For indemnity and medical loss development, link ratios calculated from limited losses are used from 1st report through the 19th report.
For indemnity and medical loss development past the 19th report, a “tail” factor is used to reflect all future expected emergence. The calculation of indemnity and medical paid + case 19th-to-ultimate tail factors utilize all available experience for the years prior to the tail attachment point.
© Copyright 2021 National Council on Compensation Insurance, Inc. All Rights Reserved.
Page 74 of 136

Iowa
Workers Compensation Rate Filing – January 1, 2022
Appendix A – Factors Underlying the Proposed Rate Level Change
Tail factors are calculated for the most recent ten available policy years, each relying on losses in older policy years as well as a growth factor to adjust for the differences in the volume of losses between the policy years. Tail factors are calculated separately for indemnity and medical losses by comparing the changes in the volume of policy year losses that occur on policy years reported after a nineteenth report to the volume of policy year losses at the nineteenth report, along with the application of the growth adjustment factor.
Since unlimited losses are used for the tail factor, they are adjusted to a limited basis as shown in Appendix A-II Section H.
© Copyright 2021 National Council on Compensation Insurance, Inc. All Rights Reserved.
Page 75 of 136

Section A - Premium and Loss Summary Valued as of 12/31/2020
Policy Year 2019
(1) Standard Earned Premium $628,039,120(2) Factor to Develop Premium to Ultimate 1.005(3) Standard Earned Premium Developed to Ultimate = (1)x(2) $631,179,316
(4) Limited Indemnity Paid Losses $42,650,651(5) Limited Indemnity Paid Development Factor to Ultimate 3.519(6) Limited Indemnity Paid Losses Developed to Ultimate = (4)x(5) $150,087,641
(7) Limited Indemnity Paid+Case Losses $110,475,983(8) Limited Indemnity Paid+Case Development Factor to Ultimate 1.314(9) Limited Indemnity Paid+Case Losses Developed to Ultimate = (7)x(8) $145,165,442
(10) Policy Year 2019 Limited Indemnity Losses Developed to Ultimate = [(6)+(9)]/2 $147,626,542
(11) Limited Medical Paid Losses $136,912,710(12) Limited Medical Paid Development Factor to Ultimate 1.504(13) Limited Medical Paid Losses Developed to Ultimate = (11)x(12) $205,916,716
(14) Limited Medical Paid+Case Losses $206,388,824(15) Limited Medical Paid+Case Development Factor to Ultimate 1.013(16) Limited Medical Paid+Case Losses Developed to Ultimate = (14)x(15) $209,071,879
(17) Policy Year 2019 Limited Medical Losses Developed to Ultimate = [(13)+(16)]/2 $207,494,298
APPENDIX A-II
IOWA
Determination of Premium and Losses Developed to an Ultimate Report
© Copyright 2021 National Council on Compensation Insurance, Inc. All Rights Reserved.
Page 76 of 136

Section A - Premium and Loss Summary Valued as of 12/31/2020
APPENDIX A-II
IOWA
Determination of Premium and Losses Developed to an Ultimate Report
Policy Year 2018
(1) Standard Earned Premium $696,705,745(2) Factor to Develop Premium to Ultimate 0.999(3) Standard Earned Premium Developed to Ultimate = (1)x(2) $696,009,039
(4) Limited Indemnity Paid Losses $81,668,265(5) Limited Indemnity Paid Development Factor to Ultimate 1.848(6) Limited Indemnity Paid Losses Developed to Ultimate = (4)x(5) $150,922,954
(7) Limited Indemnity Paid+Case Losses $126,382,164(8) Limited Indemnity Paid+Case Development Factor to Ultimate 1.145(9) Limited Indemnity Paid+Case Losses Developed to Ultimate = (7)x(8) $144,707,578
(10) Policy Year 2018 Limited Indemnity Losses Developed to Ultimate = [(6)+(9)]/2 $147,815,266
(11) Limited Medical Paid Losses $175,284,572(12) Limited Medical Paid Development Factor to Ultimate 1.236(13) Limited Medical Paid Losses Developed to Ultimate = (11)x(12) $216,651,731
(14) Limited Medical Paid+Case Losses $204,087,135(15) Limited Medical Paid+Case Development Factor to Ultimate 1.009(16) Limited Medical Paid+Case Losses Developed to Ultimate = (14)x(15) $205,923,919
(17) Policy Year 2018 Limited Medical Losses Developed to Ultimate = [(13)+(16)]/2 $211,287,825
© Copyright 2021 National Council on Compensation Insurance, Inc. All Rights Reserved.
Page 77 of 136

Section B - Premium Development Factors
Policy Policy Policy PolicyYear 1st/2nd Year 2nd/3rd Year 3rd/4th Year 4th/5th
2016 1.005 2015 0.999 2014 1.000 2013 1.0002017 1.007 2016 1.000 2015 1.000 2014 1.0002018 1.006 2017 0.999 2016 1.000 2015 1.000
Average 1.006 Average 0.999 Average 1.000 Average 1.000
1st/5th 2nd/5th 3rd/5th 4th/5th1.005 0.999 1.000 1.000
IOWA
APPENDIX A-II
Summary of Premium Development Factors
Determination of Premium and Losses Developed to an Ultimate Report
© Copyright 2021 National Council on Compensation Insurance, Inc. All Rights Reserved.
Page 78 of 136

Section C - Limited Indemnity Paid Loss Development Factors
Policy Policy Policy PolicyYear 1st/2nd Year 2nd/3rd Year 3rd/4th Year 4th/5th
2016 1.888 2015 1.379 2014 1.161 2013 1.0712017 1.867 2016 1.331 2015 1.127 2014 1.0492018 1.958 2017 1.350 2016 1.126 2015 1.051
Average 1.904 Average 1.353 Average 1.138 Average 1.057
Policy Policy Policy PolicyYear 5th/6th Year 6th/7th Year 7th/8th Year 8th/9th
2012 1.031 2011 1.019 2010 1.010 2009 1.0092013 1.027 2012 1.016 2011 1.010 2010 1.0102014 1.027 2013 1.013 2012 1.010 2011 1.003
Average 1.028 Average 1.016 Average 1.010 Average 1.007
Policy Policy Policy PolicyYear 9th/10th Year 10th/11th Year 11th/12th Year 12th/13th
2008 1.006 2007 1.005 2006 1.010 2005 1.0072009 1.008 2008 1.004 2007 1.005 2006 1.0092010 1.007 2009 1.002 2008 1.008 2007 1.002
Average 1.007 Average 1.004 Average 1.008 Average 1.006
Policy Policy Policy PolicyYear 13th/14th Year 14th/15th Year 15th/16th Year 16th/17th
2004 1.011 2003 1.003 2002 1.002 2001 1.0042005 1.005 2004 1.002 2003 1.001 2002 1.0022006 1.005 2005 1.002 2004 1.005 2003 1.004
Average 1.007 Average 1.002 Average 1.003 Average 1.003
Policy PolicyYear 17th/18th Year 18th/19th
2000 1.003 1999 1.0052001 1.005 2000 1.0032002 1.002 2001 1.004
Average 1.003 Average 1.004
Determination of Premium and Losses Developed to an Ultimate Report
IOWA
APPENDIX A-II
© Copyright 2021 National Council on Compensation Insurance, Inc. All Rights Reserved.
Page 79 of 136
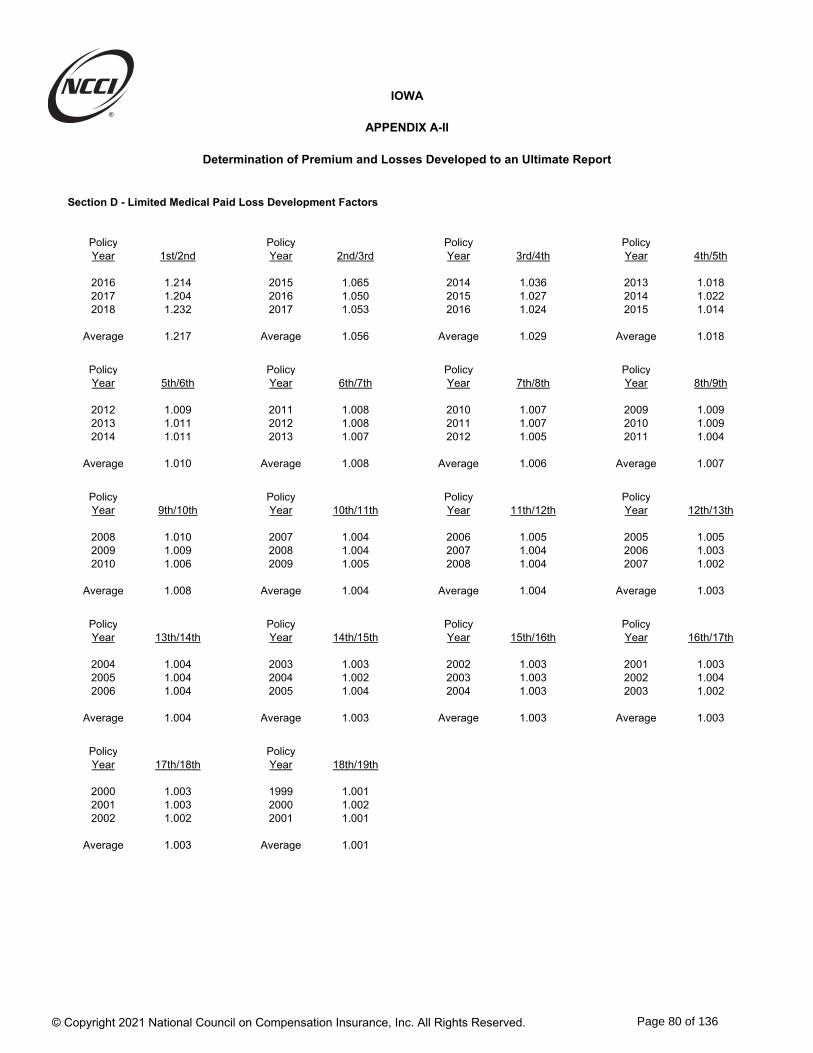
Determination of Premium and Losses Developed to an Ultimate Report
IOWA
APPENDIX A-II
Section D - Limited Medical Paid Loss Development Factors
Policy Policy Policy PolicyYear 1st/2nd Year 2nd/3rd Year 3rd/4th Year 4th/5th
2016 1.214 2015 1.065 2014 1.036 2013 1.0182017 1.204 2016 1.050 2015 1.027 2014 1.0222018 1.232 2017 1.053 2016 1.024 2015 1.014
Average 1.217 Average 1.056 Average 1.029 Average 1.018
Policy Policy Policy PolicyYear 5th/6th Year 6th/7th Year 7th/8th Year 8th/9th
2012 1.009 2011 1.008 2010 1.007 2009 1.0092013 1.011 2012 1.008 2011 1.007 2010 1.0092014 1.011 2013 1.007 2012 1.005 2011 1.004
Average 1.010 Average 1.008 Average 1.006 Average 1.007
Policy Policy Policy PolicyYear 9th/10th Year 10th/11th Year 11th/12th Year 12th/13th
2008 1.010 2007 1.004 2006 1.005 2005 1.0052009 1.009 2008 1.004 2007 1.004 2006 1.0032010 1.006 2009 1.005 2008 1.004 2007 1.002
Average 1.008 Average 1.004 Average 1.004 Average 1.003
Policy Policy Policy PolicyYear 13th/14th Year 14th/15th Year 15th/16th Year 16th/17th
2004 1.004 2003 1.003 2002 1.003 2001 1.0032005 1.004 2004 1.002 2003 1.003 2002 1.0042006 1.004 2005 1.004 2004 1.003 2003 1.002
Average 1.004 Average 1.003 Average 1.003 Average 1.003
Policy PolicyYear 17th/18th Year 18th/19th
2000 1.003 1999 1.0012001 1.003 2000 1.0022002 1.002 2001 1.001
Average 1.003 Average 1.001
© Copyright 2021 National Council on Compensation Insurance, Inc. All Rights Reserved.
Page 80 of 136

Section E - Limited Indemnity Paid + Case Loss Development Factors
Policy Policy Policy PolicyYear 1st/2nd Year 2nd/3rd Year 3rd/4th Year 4th/5th
2014 1.203 2013 1.075 2012 1.023 2011 1.0242015 1.165 2014 1.102 2013 1.055 2012 1.0222016 1.118 2015 1.062 2014 1.013 2013 1.0172017 1.100 2016 1.069 2015 1.000 2014 1.0132018 1.156 2017 1.050 2016 1.029 2015 1.013
Average 1.148 Average 1.072 Average 1.024 Average 1.018
Policy Policy Policy PolicyYear 5th/6th Year 6th/7th Year 7th/8th Year 8th/9th
2010 1.007 2009 1.004 2008 1.006 2007 0.9992011 1.006 2010 1.001 2009 0.996 2008 1.0002012 1.000 2011 0.993 2010 1.002 2009 1.0102013 0.996 2012 1.019 2011 1.002 2010 1.0012014 1.000 2013 1.002 2012 1.002 2011 1.000
Average 1.002 Average 1.004 Average 1.002 Average 1.002
Policy Policy Policy PolicyYear 9th/10th Year 10th/11th Year 11th/12th Year 12th/13th
2006 1.010 2005 1.003 2004 1.001 2003 1.0002007 0.999 2006 1.006 2005 0.999 2004 0.9992008 1.005 2007 1.001 2006 1.000 2005 1.0012009 0.997 2008 0.998 2007 0.998 2006 0.9972010 1.001 2009 1.003 2008 1.006 2007 1.000
Average 1.002 Average 1.002 Average 1.001 Average 0.999
Policy Policy Policy PolicyYear 13th/14th Year 14th/15th Year 15th/16th Year 16th/17th
2002 0.999 2001 0.999 2000 1.001 1999 1.0022003 1.001 2002 1.001 2001 1.000 2000 1.0002004 0.997 2003 1.002 2002 1.001 2001 0.9982005 1.001 2004 1.003 2003 0.999 2002 1.0012006 1.014 2005 1.001 2004 0.997 2003 1.001
Average 1.002 Average 1.001 Average 1.000 Average 1.000
Policy PolicyYear 17th/18th Year 18th/19th
1998 1.002 1997 0.9991999 1.002 1998 1.0002000 0.999 1999 1.0002001 1.001 2000 1.0012002 1.000 2001 1.001
Average 1.001 Average 1.000
Determination of Premium and Losses Developed to an Ultimate Report
IOWA
APPENDIX A-II
© Copyright 2021 National Council on Compensation Insurance, Inc. All Rights Reserved.
Page 81 of 136

Determination of Premium and Losses Developed to an Ultimate Report
IOWA
APPENDIX A-II
Section F - Limited Medical Paid + Case Loss Development Factors
Policy Policy Policy PolicyYear 1st/2nd Year 2nd/3rd Year 3rd/4th Year 4th/5th
2014 1.006 2013 0.989 2012 0.985 2011 0.9852015 1.022 2014 1.000 2013 0.999 2012 0.9972016 1.013 2015 0.982 2014 1.010 2013 1.0042017 1.000 2016 0.992 2015 0.992 2014 1.0042018 0.980 2017 0.967 2016 0.984 2015 1.003
Average 1.004 Average 0.986 Average 0.994 Average 0.999
Policy Policy Policy PolicyYear 5th/6th Year 6th/7th Year 7th/8th Year 8th/9th
2010 0.994 2009 1.008 2008 1.003 2007 0.9982011 0.998 2010 1.007 2009 1.011 2008 1.0052012 0.996 2011 1.008 2010 1.009 2009 1.0032013 1.002 2012 1.012 2011 1.005 2010 1.0032014 1.005 2013 0.999 2012 1.004 2011 1.002
Average 0.999 Average 1.007 Average 1.006 Average 1.002
Policy Policy Policy PolicyYear 9th/10th Year 10th/11th Year 11th/12th Year 12th/13th
2006 1.003 2005 1.003 2004 1.001 2003 0.9942007 0.997 2006 1.002 2005 1.003 2004 1.0052008 1.001 2007 0.999 2006 0.999 2005 0.9982009 0.998 2008 0.997 2007 1.003 2006 1.0012010 0.998 2009 0.996 2008 0.994 2007 1.000
Average 0.999 Average 0.999 Average 1.000 Average 1.000
Policy Policy Policy PolicyYear 13th/14th Year 14th/15th Year 15th/16th Year 16th/17th
2002 1.002 2001 1.005 2000 1.005 1999 1.0052003 1.004 2002 0.995 2001 1.000 2000 1.0002004 1.003 2003 0.998 2002 0.997 2001 1.0002005 1.001 2004 1.001 2003 1.001 2002 1.0032006 1.002 2005 0.999 2004 1.004 2003 0.993
Average 1.002 Average 1.000 Average 1.001 Average 1.000
Policy PolicyYear 17th/18th Year 18th/19th
1998 1.008 1997 1.0011999 0.998 1998 1.0002000 1.001 1999 0.9952001 1.002 2000 0.9982002 1.002 2001 1.001
Average 1.002 Average 0.999
© Copyright 2021 National Council on Compensation Insurance, Inc. All Rights Reserved.
Page 82 of 136

Section G - Determination of Policy Year Loss Development Factors (19th-to-Ultimate Report)
(1) (2) (3) (4) (5) (6) (7)Factor to Indicated
Policy Adjust Losses 19th-to-Ult DevelopmentYear 19th Report 20th Report Previous Current for Prior Policy Years for Policy Year
1991 98,530,504 98,529,633 1,217,327,833 1,217,908,047 0.834 1.0071992 93,450,493 93,536,604 1,312,544,349 1,313,061,621 0.926 1.0071993 87,319,062 87,107,611 1,406,598,225 1,406,819,743 1.030 1.0001994 82,099,375 82,128,016 1,483,588,317 1,484,308,890 1.112 1.0081995 85,221,368 85,310,286 1,568,473,892 1,569,599,936 1.100 1.0131996 95,346,516 95,386,308 1,654,509,644 1,655,835,393 0.995 1.0141997 92,843,300 92,888,304 1,748,307,509 1,749,276,465 1.035 1.0111998 102,372,363 102,538,741 1,842,164,769 1,842,881,714 0.934 1.0091999 105,122,707 105,137,626 1,911,291,201 1,911,609,430 0.892 1.0042000 110,603,320 110,534,374 2,016,747,056 2,017,835,597 0.836 1.011
Selected Indemnity 19th-to-Ultimate Loss Development Factor 1.010
(8) (9) (10) (11) (12) (13) (14)Factor to Indicated
Policy Adjust Losses 19th-to-Ult DevelopmentYear 19th Report 20th Report Previous Current for Prior Policy Years for Policy Year
1991 89,375,740 89,378,456 805,168,756 805,273,671 0.629 1.0021992 93,622,396 94,627,214 890,780,497 894,165,426 0.661 1.0651993 81,422,582 81,357,885 988,792,640 987,065,646 0.834 0.9741994 87,981,179 88,426,279 1,060,976,600 1,063,783,871 0.810 1.0441995 84,860,040 84,924,354 1,155,011,907 1,157,821,436 0.899 1.0381996 107,031,423 107,131,340 1,242,481,684 1,249,363,852 0.752 1.0861997 91,737,394 91,544,484 1,353,980,947 1,347,106,215 0.938 0.9181998 92,403,946 92,596,429 1,438,650,699 1,441,337,176 0.962 1.0321999 100,831,692 100,541,259 1,499,121,113 1,496,394,765 0.888 0.9672000 109,409,124 109,018,981 1,596,936,024 1,595,300,991 0.830 0.978
Selected Medical 19th-to-Ultimate Loss Development Factor 1.020
(7) = 1 + [ (3)-(2) + ((5)-(4)) / (6) ] / (2)(14) = 1 + [ (10)-(9) + ((12)-(11)) / (13) ] / (9)Columns (4) and (11) are valued as of the date at which the given policy year is at a 19th report.Columns (5) and (12) are valued as of the date at which the given policy year is at a 20th report.
Losses for Policy Year Losses for All Prior Policy Years
Determination of Premium and Losses Developed to an Ultimate Report
APPENDIX A-II
IOWA
Medical Paid+Case Data for Matching Companies
Indemnity Paid+Case Data for Matching Companies
Losses for Policy Year Losses for All Prior Policy Years
© Copyright 2021 National Council on Compensation Insurance, Inc. All Rights Reserved.
Page 83 of 136

Section H - Derivation of Policy Year Limited 19th-to-Ultimate Loss Development Factors
Indemnity Paid-to- Medical Paid-to-Policy Paid + Case Ratio Paid + Case RatioYear 19th Report 19th Report
1997 0.985 0.9441998 0.974 0.9721999 0.983 0.9822000 0.984 0.9752001 0.989 0.985
Selected 0.985 0.970
Indemnity Medical(1) Paid+Case 19th-to-Ultimate Loss Development Factor (Section G) 1.010 1.020(2) Factor to Adjust 19th-to-Ultimate Development Factor to a Limited Basis 0.683 0.683(3) Limited Paid+Case 19th-to-Ultimate Loss Development Factor = [(1)-1]x(2)+1 1.007 1.014(4) Limited Paid-to-Paid+Case Ratio (Section H) 0.985 0.970(5) Limited Paid 19th-to-Ultimate Loss Development Factor = (3) / (4) 1.022 1.045
Section I - Summary of Limited Paid Loss Development Factors
(1) (2) (3) (4)Indemnity Paid Loss Development Medical Paid Loss Development
Report to Next Report to Ultimate Report to Next Report to Ultimate1st 1.904 3.519 1st 1.217 1.504
2nd 1.353 1.848 2nd 1.056 1.2363rd 1.138 1.366 3rd 1.029 1.1704th 1.057 1.200 4th 1.018 1.1375th 1.028 1.135 5th 1.010 1.1176th 1.016 1.104 6th 1.008 1.1067th 1.010 1.087 7th 1.006 1.0978th 1.007 1.076 8th 1.007 1.0909th 1.007 1.069 9th 1.008 1.082
10th 1.004 1.062 10th 1.004 1.07311th 1.008 1.058 11th 1.004 1.06912th 1.006 1.050 12th 1.003 1.06513th 1.007 1.044 13th 1.004 1.06214th 1.002 1.037 14th 1.003 1.05815th 1.003 1.035 15th 1.003 1.05516th 1.003 1.032 16th 1.003 1.05217th 1.003 1.029 17th 1.003 1.04918th 1.004 1.026 18th 1.001 1.04619th 1.022 19th 1.045
(2) = Cumulative upward product of column (1).(4) = Cumulative upward product of column (3).
IOWA
APPENDIX A-II
Determination of Premium and Losses Developed to an Ultimate Report
© Copyright 2021 National Council on Compensation Insurance, Inc. All Rights Reserved.
Page 84 of 136

IOWA
APPENDIX A-II
Determination of Premium and Losses Developed to an Ultimate Report
Section J - Summary of Limited Paid+Case Loss Development Factors
(1) (2) (3) (4)Indemnity Paid+Case Loss Development Medical Paid+Case Loss Development
Report to Next Report to Ultimate Report to Next Report to Ultimate1st 1.148 1.314 1st 1.004 1.013
2nd 1.072 1.145 2nd 0.986 1.0093rd 1.024 1.068 3rd 0.994 1.0234th 1.018 1.043 4th 0.999 1.0295th 1.002 1.025 5th 0.999 1.0306th 1.004 1.023 6th 1.007 1.0317th 1.002 1.019 7th 1.006 1.0248th 1.002 1.017 8th 1.002 1.0189th 1.002 1.015 9th 0.999 1.016
10th 1.002 1.013 10th 0.999 1.01711th 1.001 1.011 11th 1.000 1.01812th 0.999 1.010 12th 1.000 1.01813th 1.002 1.011 13th 1.002 1.01814th 1.001 1.009 14th 1.000 1.01615th 1.000 1.008 15th 1.001 1.01616th 1.000 1.008 16th 1.000 1.01517th 1.001 1.008 17th 1.002 1.01518th 1.000 1.007 18th 0.999 1.01319th 1.007 19th 1.014
(2) = Cumulative upward product of column (1).(4) = Cumulative upward product of column (3).
© Copyright 2021 National Council on Compensation Insurance, Inc. All Rights Reserved.
Page 85 of 136

Section K - Factor to Adjust Limited Losses to an Unlimited Basis
(1) Threshold at the Midpoint of the Rate Effective Period* 7,421,321(2) Statewide Excess Ratio for (1) 0.030(3) Market Share for Carriers Missing from Large Loss and Catastrophe Call 0.000(4) Factor to Adjust Limited Losses to an Unlimited Basis = 1.0 / {1.0 - [(2) x (1.0 - (3))]} 1.031
Section L - Policy Year Large Loss Limits
Policy YearExperience Detrended
Year Limit2019 6,576,4292018 6,336,5642017 6,149,0982016 5,972,8702015 5,842,4402014 5,675,3402013 5,475,9092012 5,339,8712011 5,203,8482010 5,051,0352009 4,900,3782008 4,839,6172007 4,755,8622006 4,589,6472005 4,418,0492004 4,273,0682003 4,105,4852002 3,943,6572001 3,825,9802000 3,714,8801999 3,593,6241998 3,464,3391997 3,312,231
* November 28, 2022 is the midpoint of the effective period for which the revised rates are being proposed.
APPENDIX A-II
IOWA
Determination of Premium and Losses Developed to an Ultimate Report
© Copyright 2021 National Council on Compensation Insurance, Inc. All Rights Reserved.
Page 86 of 136

Iowa
Workers Compensation Rate Filing – January 1, 2022
Appendix A – Factors Underlying the Proposed Rate Level Change
Appendix A-III Trend Factors
NCCI separately analyzes a measure of the number of workplace injuries (claim frequency) and the average indemnity and medical costs of each of these injuries (claim severity). Premium, lost-time claim counts, and losses used in these frequency and severity calculations are developed to ultimate and adjusted for changes in the level of workers’ wages over time using the United States Bureau of Labor Statistics Quarterly Census of Employment and Wages for Iowa. Note that medical-only claim counts are excluded from the claim frequency and severity calculations, but the losses associated with medical-only claims are included.
While claim frequency and average costs per case are reviewed separately, NCCI selects annual indemnity and medical loss ratio trend factors based on an analysis of historical indemnity and medical loss ratios, along with other pertinent considerations, including, but not limited to, changes in system benefits and administration, economic environment, credibility of state data, and prior trend approach and selection.
The lost-time claim frequency, average costs per case, and loss ratios for Policy Years 2005 through 2019 are shown in Appendix A-III, along with the impact of the trend selection for each policy year in the experience period. The trend lengths displayed in Section B(3) are calculated by comparing the average accident date for the effective period of the proposed advisory rates to each of the policy years in the experience period. The average accident dates are based on an Iowa distribution of policy writings by month and assume a uniform probability of loss over the coverage period.
© Copyright 2021 National Council on Compensation Insurance, Inc. All Rights Reserved.
Page 87 of 136

Section A - Summary of Policy Year Data
(1) (2) (3) (4) (5) (6)
Lost-TimePolicy Claim Avg Cost Loss Avg Cost LossYear Frequency* Per Case*^ Ratio^ Per Case*^ Ratio^
2005 23.569 23,697 0.559 26,253 0.6192006 23.274 24,297 0.579 28,399 0.6602007 23.382 26,045 0.610 29,638 0.6942008 22.429 27,012 0.604 32,191 0.7212009 21.532 28,214 0.608 35,579 0.7662010 21.816 27,713 0.605 33,886 0.7392011 20.169 26,410 0.532 32,542 0.6562012 19.649 26,463 0.520 34,103 0.6712013 19.818 27,770 0.550 34,330 0.6802014 18.612 27,129 0.505 33,900 0.6312015 17.133 27,706 0.475 36,132 0.6192016 15.897 24,551 0.390 33,956 0.5392017 15.539 26,177 0.407 38,451 0.5982018 15.381 26,446 0.407 37,692 0.5792019 14.568 27,028 0.394 37,989 0.553
* Figures have been adjusted to the common wage level.^ Based on an average of paid and paid+case losses.
Section B - Summary of Annual Trend FactorsIndemnity Medical
(1) Current Approved Annual Loss Ratio Trend Factor 0.970 0.990
(2) Selected Annual Loss Ratio Trend Factor 0.965 0.985
(3) Length of Trend Period from Midpoint of Policy Year to Midpoint of Effective Period:
YearsPolicy Year 2018 3.998Policy Year 2019 2.998
(4) Trend Factor Applied to Experience Year = (2) ^ (3) Indemnity Medical
Policy Year 2018 0.867 0.941Policy Year 2019 0.899 0.956
Indemnity Medical
IOWA
APPENDIX A-III
Policy Year Trend Factors
© Copyright 2021 National Council on Compensation Insurance, Inc. All Rights Reserved.
Page 88 of 136

IOWA
APPENDIX A-IV
Derivation of Industry Group Differentials
Industry group differentials are used to more equitably distribute the overall rate level change based on the individual experience of each industry group. The payroll, losses and claim counts used in the calculations below are from NCCI’s Workers Compensation Statistical Plan (WCSP) data.
I. Expected Losses
The current expected losses (columns (1) and (2)) are the payroll extended by the pure premiums underlying the latest approved rates. The proposed expected losses (3) are the current expected losses adjusted to the proposed level. These adjustments include the proposed experience, trend, benefit and, if applicable, loss-based expense changes as well as any miscellaneous premium adjustments.
Industry Group
(1) Latest Year
Current Expected Losses Prior to Adjustment for
Change in Off-Balance
(2) Five Year
Current Expected Losses Prior to Adjustment for
Change in Off-Balance
(3) Five Year
Proposed Expected Losses Prior to Adjustment for
Change in Off-Balance
(4)
Current Ratio of
Manual to Standard Premium
(5)
Proposed Ratio of
Manual to Standard Premium
Manufacturing 148,465,426 676,947,719 626,853,588 1.177 1.182
Contracting 120,050,568 570,796,995 528,558,018 1.147 1.148
Office & Clerical 64,652,559 303,152,496 280,719,212 1.110 1.119
Goods & Services 208,452,784 983,118,178 910,367,432 1.077 1.086
Miscellaneous 107,615,553 486,625,101 450,614,843 1.117 1.125
Statewide 649,236,891 3,020,640,489 2,797,113,093
Industry Group
(6) Latest Year
Current Expected Losses Adjusted
for Change in Off-Balance (1)x(4)/(5)
(7) Five Year
Current Expected Losses Adjusted
for Change in Off-Balance (2)x(4)/(5)
(8) Five Year
Proposed Expected Losses Adjusted
for Change in Off-Balance (3)x(4)/(5)
(9)
Current/ Proposed
(7)/(8)
(10)
Adjustment to Proposed for
Current Relativity
(9)IG/(9)SW
Manufacturing 147,837,399 674,084,150 624,201,923 1.080 1.000
Contracting 119,945,995 570,299,785 528,097,601 1.080 1.000
Office & Clerical 64,132,565 300,714,273 278,461,416 1.080 1.000
Goods & Services 206,725,275 974,970,789 902,822,951 1.080 1.000
Miscellaneous 106,850,287 483,164,656 447,410,471 1.080 1.000
Statewide 645,491,521 3,003,233,653 2,780,994,362 1.080
© Copyright 2021 National Council on Compensation Insurance, Inc. All Rights Reserved.
Page 89 of 136

IOWA
APPENDIX A-IV
II. Industry Group Differentials
To calculate the converted indicated balanced losses (11) the reported losses are limited to $500,000 for a single claim occurrence and $1,500,000 for each multiple claim occurrence. After the application of limited development, trend and benefit factors, the limited losses are brought to an unlimited level through the application of the expected excess provision. The expected excess loss provisions are non-catastrophe and the excess ratios at a loss limit of $50 million are set equal to zero. The proposed experience change, applicable loss-based expenses and any miscellaneous premium adjustments are applied to calculate the indicated losses. These indicated losses are then balanced to the expected losses using the factors shown in Appendix B-I, Section A-3.
Industry Group
(11) Converted Indicated
Balanced Losses
(12) Indicated/
Expected Ratio (11)/[(8)x(10)]
(13) Indicated
Differential (12)IG/(12)SW
(14)
Lost-Time Claim Counts
Manufacturing 621,482,246 0.996 0.997 11,867
Contracting 535,518,697 1.014 1.015 6,548
Office & Clerical 273,544,884 0.982 0.983 4,699
Goods & Services 901,085,855 0.998 0.999 20,034
Miscellaneous 447,913,209 1.001 1.002 6,423
Statewide 2,779,544,891 0.999
Industry Group
(15)
Full Credibility Standard
for Lost-Time Claim Counts
(16)
Credibility Minimum of 1.000 and
((14)/(15))^0.5
(17) Credibility Weighted Indicated/Expected
Ratio [(16)IGx(12)IG] +
[1-(16)IG]x(12)SW*
(18)
Final Industry Group
Differential (17)IG/(17)SW
Manufacturing 12,000 0.99 0.996 0.997
Contracting 12,000 0.74 1.010 1.011
Office & Clerical 12,000 0.63 0.988 0.989
Goods & Services 12,000 1.00 0.998 0.999
Miscellaneous 12,000 0.73 1.000 1.001
Statewide 0.999 1.000
*Statewide ratio (column 17) = IG[(6)x(17)] ÷ IG(6)
© Copyright 2021 National Council on Compensation Insurance, Inc. All Rights Reserved.
Page 90 of 136

Iowa
Workers Compensation Rate Filing – January 1, 2022
Appendix B – Calculations Underlying the Advisory Rate Change by Classification
NCCI separately determines voluntary rates for each workers compensation classification. The proposed change from the current rate will vary depending on the classification. The following are the general steps utilized to determine the individual classification rates:
1. Calculate industry group differentials, which are used to more equitably distribute the proposed overall average advisory rate level change based on the individual experience of each industry group
2. For each classification, determine the indicated pure premiums based on the most recently-available five policy periods of Iowa payroll and loss experience
3. Indicated pure premiums are credibility-weighted with present on rate level pure premiums and national pure premiums to generate derived by formula pure premiums
4. Final adjustments include the application of a test correction factor, the ratio of manual-to-standard premium, and swing limits.
© Copyright 2021 National Council on Compensation Insurance, Inc. All Rights Reserved.
Page 91 of 136
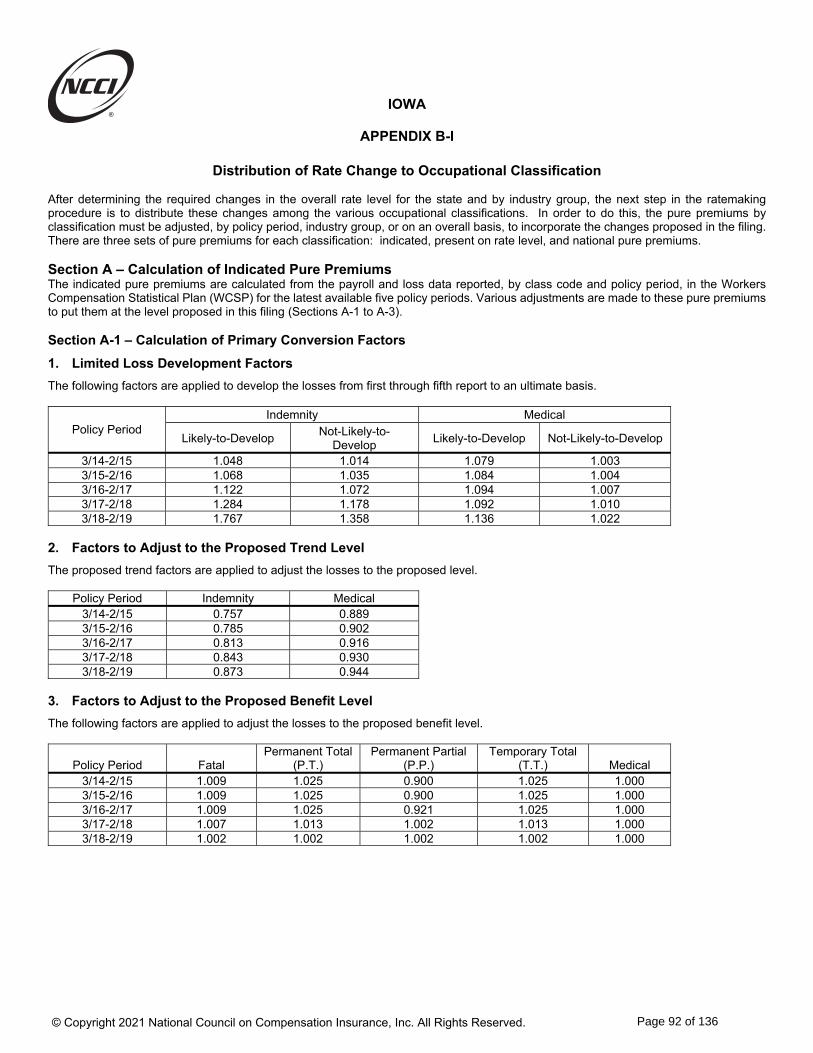
IOWA
APPENDIX B-I
Distribution of Rate Change to Occupational Classification After determining the required changes in the overall rate level for the state and by industry group, the next step in the ratemaking procedure is to distribute these changes among the various occupational classifications. In order to do this, the pure premiums by classification must be adjusted, by policy period, industry group, or on an overall basis, to incorporate the changes proposed in the filing. There are three sets of pure premiums for each classification: indicated, present on rate level, and national pure premiums. Section A – Calculation of Indicated Pure Premiums The indicated pure premiums are calculated from the payroll and loss data reported, by class code and policy period, in the Workers Compensation Statistical Plan (WCSP) for the latest available five policy periods. Various adjustments are made to these pure premiums to put them at the level proposed in this filing (Sections A-1 to A-3). Section A-1 – Calculation of Primary Conversion Factors
1. Limited Loss Development Factors
The following factors are applied to develop the losses from first through fifth report to an ultimate basis.
Policy Period Indemnity Medical
Likely-to-Develop Not-Likely-to-
Develop Likely-to-Develop Not-Likely-to-Develop
3/14-2/15 1.048 1.014 1.079 1.003 3/15-2/16 1.068 1.035 1.084 1.004 3/16-2/17 1.122 1.072 1.094 1.007 3/17-2/18 1.284 1.178 1.092 1.010 3/18-2/19 1.767 1.358 1.136 1.022
2. Factors to Adjust to the Proposed Trend Level
The proposed trend factors are applied to adjust the losses to the proposed level.
Policy Period Indemnity Medical 3/14-2/15 0.757 0.889 3/15-2/16 0.785 0.902 3/16-2/17 0.813 0.916 3/17-2/18 0.843 0.930 3/18-2/19 0.873 0.944
3. Factors to Adjust to the Proposed Benefit Level
The following factors are applied to adjust the losses to the proposed benefit level.
Policy Period Fatal Permanent Total
(P.T.) Permanent Partial
(P.P.) Temporary Total
(T.T.) Medical 3/14-2/15 1.009 1.025 0.900 1.025 1.000 3/15-2/16 1.009 1.025 0.900 1.025 1.000 3/16-2/17 1.009 1.025 0.921 1.025 1.000 3/17-2/18 1.007 1.013 1.002 1.013 1.000 3/18-2/19 1.002 1.002 1.002 1.002 1.000
© Copyright 2021 National Council on Compensation Insurance, Inc. All Rights Reserved.
Page 92 of 136

IOWA
APPENDIX B-I
4. Primary Conversion Factors: Indicated Pure Premiums
The factors above, contained within Section A-1, are combined multiplicatively, resulting in the following factors for the Likely-to-Develop (L) and Not-Likely-to-Develop (NL) groupings.
Policy Period Fatal (L) Fatal (NL)
P.T.* P.P. (L) P.P. (NL) T.T. (L) T.T. (NL) Medical (L) Medical
(NL) 3/14-2/15 0.800 0.775 0.813 0.714 0.691 0.813 0.787 0.959 0.892 3/15-2/16 0.846 0.820 0.859 0.755 0.731 0.859 0.833 0.978 0.906 3/16-2/17 0.920 0.879 0.935 0.840 0.803 0.935 0.893 1.002 0.922 3/17-2/18 1.090 1.000 1.096 1.085 0.995 1.096 1.006 1.016 0.939 3/18-2/19 1.546 1.188 1.546 1.546 1.188 1.546 1.188 1.072 0.965
* Permanent total losses are always assigned to the Likely-to-Develop grouping. Section A-2 – Expected Excess Provision and Redistribution
After the application of the primary conversion factors, the limited losses are brought to an expected unlimited level through the application of excess loss factors by hazard group. The expected excess loss provisions are non-catastrophe and the excess ratios at a loss limit of $50 million are set equal to zero. These factors are shown below.
Hazard Group
A B C D E F G
(1) Excess Ratios
0.108 0.138 0.179 0.201 0.265 0.305 0.339
(2) Excess Factors 1/(1-(1))
1.121 1.160 1.218 1.252 1.361 1.439 1.513
As the excess loss factors are on a combined (indemnity and medical) basis, a portion (40%) of the indemnity expected excess losses are redistributed to medical in order to more accurately allocate expected excess losses. Since a portion of the expected excess losses are redistributed in an additive manner, the expected excess factors shown above cannot be combined multiplicatively with either the primary or secondary loss conversion factors.
© Copyright 2021 National Council on Compensation Insurance, Inc. All Rights Reserved.
Page 93 of 136

IOWA
APPENDIX B-I
Section A-3 – Calculation of Secondary Conversion Factors
1. Factors to Adjust for Proposed Industry Group Differentials
The following factors are applied to adjust the indicated industry group differentials for the effects of credibility weighting the industry group differentials and weighting the differentials by the latest year expected losses.
Manufacturing Contracting
Office and Clerical
Goods and Services Miscellaneous
(1) Indicated Differentials* 0.997 1.015 0.983 0.999 1.002
(2) Final Differentials** 0.997 1.011 0.989 0.999 1.001
(3) Adjustment (2)/(1) 1.000 0.996 1.006 1.000 0.999 *See Appendix A-IV, column (13). **See Appendix A-IV, column (18). 2. Factors to Balance Indicated to Expected Losses
The expected losses are calculated as the pure premium underlying the current rates, adjusted to the proposed level and adjusted for the Experience Rating Plan off-balance. The indicated losses are balanced to the expected losses by applying the following factors.
Policy Period
(1) Adjustment of
Indicated Losses to Pure Premium
at Proposed Level
(2) Current Ratio of
Manual to Standard Premium
(3) Proposed Ratio of
Manual to Standard Premium
(4)
Off-balance Adjustment
(2)/(3)
(5) Balancing
Indicated to Expected Losses
(1)x(4) 3/14-2/15 0.813 1.122 1.129 0.994 0.808 3/15-2/16 0.856 1.122 1.131 0.992 0.849 3/16-2/17 0.912 1.122 1.127 0.996 0.908 3/17-2/18 0.874 1.122 1.125 0.997 0.871 3/18-2/19 0.848 1.123 1.133 0.991 0.840
3. Adjustment for Experience Change
A factor of 0.935 is applied to adjust for the experience change in the proposed rate level. 4. Factor to Reflect the Proposed Loss-Based Expense Provisions
A factor of 1.179 is applied to include the proposed loss-based expense provisions. 5. Secondary Conversion Factors: Indicated Pure Premiums
The factors above, contained within section A-3, are combined multiplicatively, resulting in the following factors:
Policy Period Manufacturing Contracting Office and Clerical Goods and Services Miscellaneous
3/14-2/15 0.891 0.887 0.896 0.891 0.890 3/15-2/16 0.936 0.932 0.942 0.936 0.935 3/16-2/17 1.001 0.997 1.007 1.001 1.000 3/17-2/18 0.960 0.956 0.966 0.960 0.959 3/18-2/19 0.926 0.922 0.932 0.926 0.925
© Copyright 2021 National Council on Compensation Insurance, Inc. All Rights Reserved.
Page 94 of 136

IOWA
APPENDIX B-I
Section B – Calculation of Present on Rate Level Pure Premiums The present on rate level pure premiums are the pure premiums underlying the current rates, adjusted to the proposed level. The data sources for the above-captioned pure premiums are the partial pure premiums underlying the current rates. 1. Adjustment for Experience Change
A factor of 0.935 is applied to adjust for the experience change in the proposed rate level. 2. Factors to Adjust to the Proposed Trend Level
The pure premiums underlying the current rates contain the current trend. The change in trend factors, 0.982 and 0.982, for indemnity and medical, respectively, are applied to adjust to the proposed trend level. 3. Factors to Adjust to the Proposed Benefit Level
The following factors are applied to adjust the pure premiums underlying the current rates to the proposed benefit level.
Indemnity Medical Benefit Adjustment 1.000 1.000
4. Factors to Include the Proposed Loss-Based Expense Provisions
The pure premiums underlying the current rates include the current loss-based expense provisions and must be adjusted to the proposed level.
(a) Current (b) Proposed Indemnity Medical Indemnity Medical
(1) Loss Adjustment Expense 1.169 1.169 1.179 1.179 (2) Loss-based Assessment 1.000 1.000 1.000 1.000 (3) = (1) + (2) – 1.000 1.169 1.169 1.179 1.179 (4) Overall Change (3b)/(3a) 1.009 1.009
5. Adjustment to Obtain Expected Losses
The pure premiums underlying the current rates reflect the current Experience Rating Plan off-balance. The change in off-balance must be applied.
Industry Group
(1) Current Ratio of
Manual to Standard Premium
(2) Proposed Ratio of
Manual to Standard Premium
(3) Off-balance Adjustment
(1)/(2) Manufacturing 1.177 1.182 0.996 Contracting 1.147 1.148 0.999 Office & Clerical 1.110 1.119 0.992 Goods & Services 1.077 1.086 0.992 Miscellaneous 1.117 1.125 0.993
© Copyright 2021 National Council on Compensation Insurance, Inc. All Rights Reserved.
Page 95 of 136

IOWA
APPENDIX B-I
6. Factors to Adjust for Proposed Industry Group Differentials
The pure premiums underlying the current rates are adjusted by the proposed industry group differentials.
Industry Group
(1) Final
Differential*
(2) Adjustment to Proposed for
Current Relativities**
(3) Adjusted Differential
(1)x(2) Manufacturing 0.997 1.000 0.997 Contracting 1.011 1.000 1.011 Office & Clerical 0.989 1.000 0.989 Goods & Services 0.999 1.000 0.999 Miscellaneous 1.001 1.000 1.001
*See Appendix A-IV, column (18). **See Appendix A-IV, column (10). 7. Combined Conversion Factors
The factors above, contained within Section B, are combined multiplicatively, resulting in the following factors.
Industry Group Indemnity Medical Manufacturing 0.920 0.920 Contracting 0.935 0.935 Office & Clerical 0.908 0.908 Goods & Services 0.918 0.918 Miscellaneous 0.920 0.920
© Copyright 2021 National Council on Compensation Insurance, Inc. All Rights Reserved.
Page 96 of 136

IOWA
APPENDIX B-I
Section C – Calculation of National Pure Premiums Finally, there are the national pure premiums, which reflect the countrywide experience for each classification adjusted to state conditions. These pure premiums reflect the countrywide experience for each classification as indicated by the latest available individual classification experience for all states for which the National Council on Compensation Insurance compiles workers compensation data. Countrywide data is adjusted to Iowa conditions in four steps. First, statewide indicated pure premiums are determined for Iowa. Second, using Iowa payrolls as weights, corresponding statewide-average pure premiums are computed for each remaining state. Third, the ratios of Iowa statewide pure premiums to those for other states are used as adjustment factors to convert losses for other states to a basis that is consistent with the Iowa indicated pure premiums. The quotient of the countrywide total of such adjusted losses divided by the total countrywide payroll for the classification is the initial pure premium indicated by national relativity. Finally, national pure premiums are balanced to the level of the state indicated pure premiums to ensure unbiased derived by formula pure premiums. Indemnity and medical pure premiums are computed separately. Section D – Calculation of Derived by Formula Pure Premiums The indicated, present on rate level and national pure premiums are credibility weighted, and the resulting derived by formula pure premiums are used to determine the final class rates. As for the preceding pure premiums, separate computations are performed for each partial pure premium: indemnity and medical. Each partial formula pure premium is derived by the weighting of the indicated, present on rate level and national partial pure premiums. The weight assigned to the policy year indicated pure premium varies in one-percent intervals from zero percent to one hundred percent, depending upon the volume of expected losses (i.e. the product of the underlying pure premiums and the payroll in hundreds). To achieve full state credibility, a classification must have expected losses of at least: $36,640,644 for indemnity and $27,911,472 for medical. The partial credibilities formula is: z = [ (expected losses) / (full credibility standard) ]0.5 For the national pure premiums, credibility is determined from the number of lost-time claims. Full credibility standards are: 2,300 lost-time claims for indemnity and 2,000 lost-time claims for medical. Partial credibilities are assigned using a credibility formula similar to that used for indicated pure premiums but based on the number of national cases. In no case is the national credibility permitted to exceed 50% of the complement of the state credibility. National Credibility equals the smaller of:
[ (national cases)/(full credibility standard) ]0.5 and [ (1 – state credibility)/2 ] The residual credibility (100% minus the sum of the state and national credibilities) is assigned to the present on rate level pure premium.
For example, if the state credibility is 40%, the national pure premium is assigned a maximum credibility of 30% ((100-40) / 2). The remainder is assigned to the present on rate level pure premium.
The total pure premium shown on the attached Appendix B-III is obtained by adding the indemnity and medical partial pure premiums obtained above and rounding the sum to two decimal places.
© Copyright 2021 National Council on Compensation Insurance, Inc. All Rights Reserved.
Page 97 of 136

IOWA
APPENDIX B-II
Adjustments to Obtain Rates
The following items are combined with the derived by formula pure premium to obtain the proposed rate:
1. Test Correction Factor
The payrolls are now extended by the rates presently in effect and by the indicated rates to determine if the required change in manual premium level as calculated in Exhibit I has been achieved. Since at first this calculation may not yield the required results, an iterative process is initiated which continuously tests the proposed rates including tentative test correction factors until the required change in manual premium level is obtained. The test correction factor is applied to the derived by formula pure premiums.
The factors referred to above are set out as follows:
Test Correction Factor
Manufacturing 0.9938 Contracting 1.0031 Office & Clerical 0.9978 Goods & Services 1.0015 Miscellaneous 1.0128
2. Ratios of Manual to Standard Premiums
The ratios of manual to standard premiums by industry group have also been excluded from the classification experience, and it is necessary to apply these factors to the derived by formula pure premiums.
Ratio of Manual
to Standard Premiums
Manufacturing 1.182 Contracting 1.148 Office & Clerical 1.119 Goods & Services 1.086 Miscellaneous 1.125
3. Expense Allowance
The expense allowance is introduced into the rate by dividing the product of the proposed pure premium and the appropriate factors above by the proposed target cost ratio of 0.714 (see Exhibit II-A for derivation of this factor). This operation produces the proposed rate prior to the addition of a disease loading, if any.
4. Disease Loadings
The proposed manual rates shown in this filing include specific disease loadings for those classifications where they apply. The proposed specific disease loadings are shown on the footnotes page.
© Copyright 2021 National Council on Compensation Insurance, Inc. All Rights Reserved.
Page 98 of 136
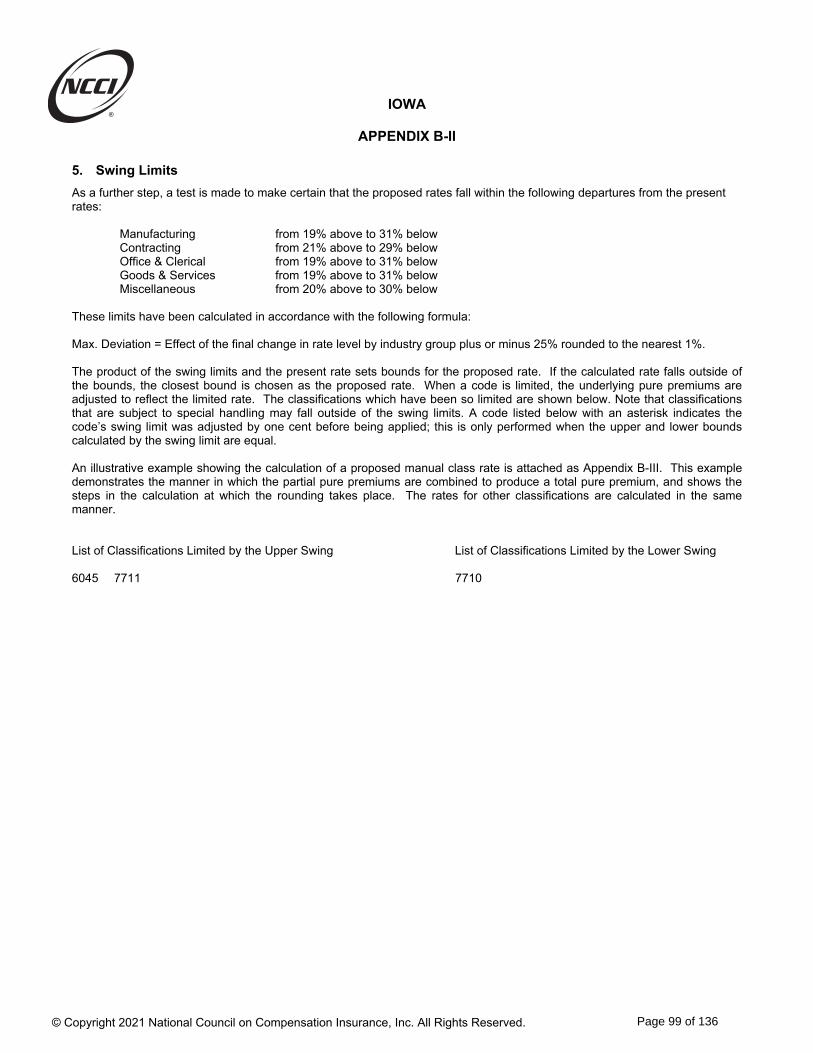
IOWA
APPENDIX B-II
5. Swing Limits
As a further step, a test is made to make certain that the proposed rates fall within the following departures from the present rates:
Manufacturing from 19% above to 31% below Contracting from 21% above to 29% below Office & Clerical from 19% above to 31% below Goods & Services from 19% above to 31% below Miscellaneous from 20% above to 30% below
These limits have been calculated in accordance with the following formula: Max. Deviation = Effect of the final change in rate level by industry group plus or minus 25% rounded to the nearest 1%. The product of the swing limits and the present rate sets bounds for the proposed rate. If the calculated rate falls outside of the bounds, the closest bound is chosen as the proposed rate. When a code is limited, the underlying pure premiums are adjusted to reflect the limited rate. The classifications which have been so limited are shown below. Note that classifications that are subject to special handling may fall outside of the swing limits. A code listed below with an asterisk indicates the code’s swing limit was adjusted by one cent before being applied; this is only performed when the upper and lower bounds calculated by the swing limit are equal. An illustrative example showing the calculation of a proposed manual class rate is attached as Appendix B-III. This example demonstrates the manner in which the partial pure premiums are combined to produce a total pure premium, and shows the steps in the calculation at which the rounding takes place. The rates for other classifications are calculated in the same manner. List of Classifications Limited by the Upper Swing List of Classifications Limited by the Lower Swing
6045 7711 7710
© Copyright 2021 National Council on Compensation Insurance, Inc. All Rights Reserved.
Page 99 of 136

IOWA
APPENDIX B-III
Derivation of Proposed Rate - Code 8810
As previously explained in Appendix B-I, the indicated pure premiums are developed by adjusting the limited losses by a set of conversionfactors. The converted losses are then summarized into indemnity and medical and then divided by payroll (in hundreds). The derivationof the indicated pure premium for the above-captioned classification follows:
LIMITED LOSSES (Workers Compensation Statistical Plan)
Permanent Permanent Temporary TemporaryFatal Fatal Permanent Partial Partial Total Total Medical Medical
Policy Period Likely Not-Likely Total Likely Not-Likely Likely Not-Likely Likely Not-Likely03/01/14 - 02/28/15 0 181,412 0 928,772 2,612,524 763,517 641,874 2,211,735 5,379,48803/01/15 - 02/29/16 0 500,000 0 1,180,509 1,901,612 374,962 424,530 945,333 5,327,83503/01/16 - 02/28/17 0 0 0 993,601 1,886,724 297,532 776,338 1,350,798 5,134,63303/01/17 - 02/28/18 0 0 0 681,220 1,692,915 416,587 1,045,508 1,346,765 7,417,00203/01/18 - 02/28/19 0 0 0 551,789 1,701,894 826,214 1,016,316 2,574,201 7,439,382
PRIMARY CONVERSION FACTORS (Appendix B-I, Section A-1)
Permanent Permanent Temporary TemporaryFatal Fatal Permanent Partial Partial Total Total Medical Medical
Policy Period Likely Not-Likely Total Likely Not-Likely Likely Not-Likely Likely Not-Likely03/01/14 - 02/28/15 0.800 0.775 0.813 0.714 0.691 0.813 0.787 0.959 0.89203/01/15 - 02/29/16 0.846 0.820 0.859 0.755 0.731 0.859 0.833 0.978 0.90603/01/16 - 02/28/17 0.920 0.879 0.935 0.840 0.803 0.935 0.893 1.002 0.92203/01/17 - 02/28/18 1.090 1.000 1.096 1.085 0.995 1.096 1.006 1.016 0.93903/01/18 - 02/28/19 1.546 1.188 1.546 1.546 1.188 1.546 1.188 1.072 0.965
EXPECTED EXCESS PROVISION AND REDISTRIBUTION (Appendix B-I, Section A-2)
After the application of the primary conversion factors, the limited losses are brought to an expected unlimited level through the application of a hazard group-specific excess loss factor. The factor is shown below:
HAZARD GROUP: CExcess Factor 1.218
As the excess loss factor is on a combined (indemnity and medical) basis, the following portion of the indemnity expected excess losses are redistributed to medical in order to more accurately allocate expected excess losses:
Redistribution % 40%
© Copyright 2021 National Council on Compensation Insurance, Inc. All Rights Reserved.
Page 100 of 136
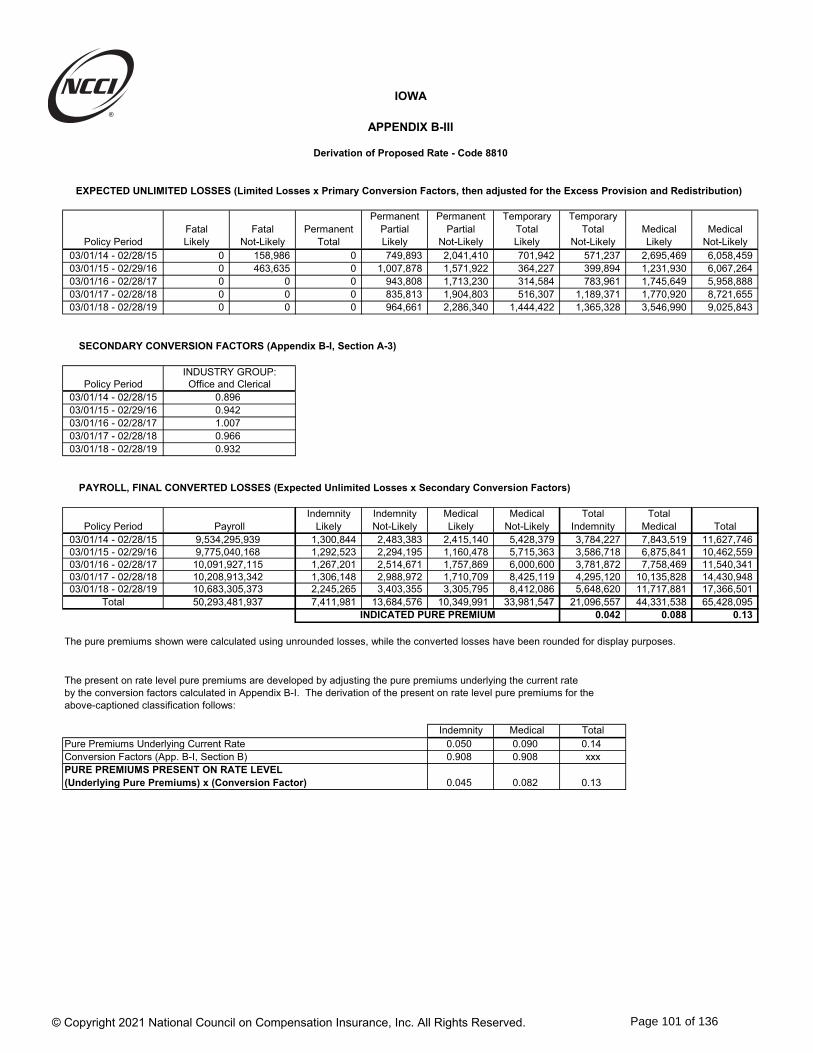
IOWA
APPENDIX B-III
Derivation of Proposed Rate - Code 8810
EXPECTED UNLIMITED LOSSES (Limited Losses x Primary Conversion Factors, then adjusted for the Excess Provision and Redistribution)
Permanent Permanent Temporary TemporaryFatal Fatal Permanent Partial Partial Total Total Medical Medical
Policy Period Likely Not-Likely Total Likely Not-Likely Likely Not-Likely Likely Not-Likely03/01/14 - 02/28/15 0 158,986 0 749,893 2,041,410 701,942 571,237 2,695,469 6,058,45903/01/15 - 02/29/16 0 463,635 0 1,007,878 1,571,922 364,227 399,894 1,231,930 6,067,26403/01/16 - 02/28/17 0 0 0 943,808 1,713,230 314,584 783,961 1,745,649 5,958,88803/01/17 - 02/28/18 0 0 0 835,813 1,904,803 516,307 1,189,371 1,770,920 8,721,65503/01/18 - 02/28/19 0 0 0 964,661 2,286,340 1,444,422 1,365,328 3,546,990 9,025,843
SECONDARY CONVERSION FACTORS (Appendix B-I, Section A-3)
INDUSTRY GROUP:Policy Period Office and Clerical
03/01/14 - 02/28/15 0.89603/01/15 - 02/29/16 0.94203/01/16 - 02/28/17 1.00703/01/17 - 02/28/18 0.96603/01/18 - 02/28/19 0.932
PAYROLL, FINAL CONVERTED LOSSES (Expected Unlimited Losses x Secondary Conversion Factors)
Indemnity Indemnity Medical Medical Total TotalPolicy Period Payroll Likely Not-Likely Likely Not-Likely Indemnity Medical Total
03/01/14 - 02/28/15 9,534,295,939 1,300,844 2,483,383 2,415,140 5,428,379 3,784,227 7,843,519 11,627,74603/01/15 - 02/29/16 9,775,040,168 1,292,523 2,294,195 1,160,478 5,715,363 3,586,718 6,875,841 10,462,55903/01/16 - 02/28/17 10,091,927,115 1,267,201 2,514,671 1,757,869 6,000,600 3,781,872 7,758,469 11,540,34103/01/17 - 02/28/18 10,208,913,342 1,306,148 2,988,972 1,710,709 8,425,119 4,295,120 10,135,828 14,430,94803/01/18 - 02/28/19 10,683,305,373 2,245,265 3,403,355 3,305,795 8,412,086 5,648,620 11,717,881 17,366,501
Total 50,293,481,937 7,411,981 13,684,576 10,349,991 33,981,547 21,096,557 44,331,538 65,428,095INDICATED PURE PREMIUM 0.042 0.088 0.13
The pure premiums shown were calculated using unrounded losses, while the converted losses have been rounded for display purposes.
The present on rate level pure premiums are developed by adjusting the pure premiums underlying the current rateby the conversion factors calculated in Appendix B-I. The derivation of the present on rate level pure premiums for theabove-captioned classification follows:
Indemnity Medical TotalPure Premiums Underlying Current Rate 0.050 0.090 0.14Conversion Factors (App. B-I, Section B) 0.908 0.908 xxxPURE PREMIUMS PRESENT ON RATE LEVEL(Underlying Pure Premiums) x (Conversion Factor) 0.045 0.082 0.13
© Copyright 2021 National Council on Compensation Insurance, Inc. All Rights Reserved.
Page 101 of 136

IOWA
APPENDIX B-III
Derivation of Proposed Rate - Code 8810Industry Group - Office and Clerical, Hazard Group - C
The rate for the above-captioned classification is derived as follows:
Indemnity Medical Total
1. Indicated Pure Premium 0.042 0.088 0.13
2. Pure Premium Indicated by National Relativity 0.036 0.067 0.10
3. Pure Premium Present on Rate Level 0.045 0.082 0.13
4. State Credibilities 80% 100% xxx
5. National Credibilities 10% 0% xxx
6. Residual Credibilities = 100% - (4) - (5) 10% 0% xxx
7. Derived by Formula Pure Premiums= (1) x (4) + (2) x (5) + (3) x (6) 0.042 0.088 0.13
8. Test Correction Factor 0.9978 0.9978 xxx
9. Underlying Pure Premiums = (7) x (8) * 0.042 0.088 0.13
10. Ratio of Manual to Standard Premium 1.119
11. Target Cost Ratio 0.714
12. Rate = (9) x (10) / (11) 0.20
13. Rate Within Swing Limits 0.20
Current Rate x Swing Limitsa) Lower bound = 0.21 x 0.690 = 0.15b) Upper bound = 0.21 x 1.190 = 0.24
14. Pure Premiums Underlying Proposed Rate* 0.042 0.088 0.13 = ((14TOT) / (9TOT)) x (9) ; (14TOT) = (13) x (11) / (10)
15. Disease, Catastrophe and/or Miscellaneous Loadings 0.00
16. Final Loaded Rate 0.20
* Indemnity pure premium is adjusted for the rounded total pure premium:Indemnity Pure Premium = Total Pure Premium - Medical Pure Premium
© Copyright 2021 National Council on Compensation Insurance, Inc. All Rights Reserved.
Page 102 of 136

IOWA
APPENDIX B-IV
Ten years of Workers Compensation Statistical Plan (WCSP) data is used to determine the F-classification (F-class) rates. An F-class countrywidepure premium is brought to Iowa's proposed level, and F-class code countrywide relativities are applied to determine indicated rates.The latest year of payroll is extended by both the current and proposed rates. Based on $2,810,087 of payroll, the overall indicated rate change in Iowa is -25.0%.
I. Calculation of F-Class Countrywide Pure Premium and F-Class Code RelativitiesTen years of F-class losses* across all states for which the National Council on Compensation Insurance compiles workers compensation ratemaking data are converted and adjusted to a countrywide level and used with ten years of F-class countrywide payroll to determine the F-class countrywide pure premiums at both an overall and individual classification level. The F-class code countrywide relativities are then calculated using these purepremiums.
*Losses are limited to $500,000 for a single claim occurrence and $1,500,000 for each multiple claim occurrence. Note: Texas data is included for policies effective 1/1/2013 and subsequent.
A. Calculation of Primary Conversion FactorsEach state’s losses are adjusted by its state-specific benefit and trend factors and countrywide development. Below are the adjustments made toIowa’s losses:
1. Factors to Adjust to a Current Benefit LevelThe state and federal losses are adjusted to the current state and federal benefit levels, respectively.
State ActPolicy Period Fatal
Permanent Total (P.T.)
Permanent Partial (P.P.)
Temporary Total (T.T.) Medical
1/08 - 12/08 1.009 1.025 0.900 1.025 1.0001/09 - 12/09 1.009 1.025 0.900 1.025 1.0001/10 - 12/10 1.009 1.025 0.900 1.025 1.0001/11 - 12/11 1.009 1.025 0.900 1.025 1.0001/12 - 12/12 1.009 1.025 0.900 1.025 1.0001/13 - 12/13 1.009 1.025 0.900 1.025 1.0001/14 - 12/14 1.009 1.025 0.900 1.025 1.0001/15 - 12/15 1.009 1.025 0.900 1.025 1.0001/16 - 12/16 1.009 1.025 0.910 1.025 1.0001/17 - 12/17 1.007 1.016 0.993 1.016 1.000
Federal ActPolicy Period Fatal
Permanent Total (P.T.)
Permanent Partial (P.P.)
Temporary Total (T.T.) Medical
1/08 - 12/08 1.000 1.000 1.000 1.000 1.0001/09 - 12/09 1.000 1.000 1.000 1.000 1.0001/10 - 12/10 1.000 1.000 1.000 1.000 1.0001/11 - 12/11 1.000 1.000 1.000 1.000 1.0001/12 - 12/12 1.000 1.000 1.000 1.000 1.0001/13 - 12/13 1.000 1.000 1.000 1.000 1.0001/14 - 12/14 1.000 1.000 1.000 1.000 1.0001/15 - 12/15 1.000 1.000 1.000 1.000 1.0001/16 - 12/16 1.000 1.000 1.000 1.000 1.0001/17 - 12/17 1.000 1.000 1.000 1.000 1.000
2. Factors to Trend to 1/1/2022The losses are trended from the midpoint of each policy year to 1/1/2022 using the current annual trends of 0.970 and 0.990 for indemnityand medical, respectively.
Policy Period Indemnity Medical
1/08 - 12/08 0.671 0.8771/09 - 12/09 0.692 0.8861/10 - 12/10 0.713 0.8951/11 - 12/11 0.735 0.9041/12 - 12/12 0.758 0.9131/13 - 12/13 0.782 0.9221/14 - 12/14 0.806 0.9311/15 - 12/15 0.831 0.9411/16 - 12/16 0.856 0.9501/17 - 12/17 0.883 0.960
© Copyright 2021 National Council on Compensation Insurance, Inc. All Rights Reserved.
Page 103 of 136

IOWA
APPENDIX B-IV
3. Limited Loss Development FactorsThe losses are developed to an ultimate basis using loss development factors based on countrywide data.*
Indemnity MedicalPolicy Period
Likely-to-Develop
Not-Likely-to-Develop
Likely-to-Develop
Not-Likely-to-Develop
1/08 - 12/08 1.045 1.006 1.111 1.0121/09 - 12/09 1.048 1.013 1.119 1.0281/10 - 12/10 1.057 1.020 1.128 1.0271/11 - 12/11 1.067 1.031 1.127 1.0201/12 - 12/12 1.058 1.029 1.132 1.0101/13 - 12/13 1.088 1.040 1.134 1.0241/14 - 12/14 1.113 1.054 1.176 1.0231/15 - 12/15 1.281 1.109 1.250 1.0241/16 - 12/16 1.481 1.254 1.316 1.0601/17 - 12/17 2.325 1.810 1.527 1.135
*Excludes Texas.
4. Primary Conversion Factors = (1) x (2) x (3)The factors above, contained within Section A, are combined multiplicatively, resulting in the following Likely-to-Develop (L) and Not-Likely-to-Develop (NL) factors:
Policy Period Fatal (L) Fatal (NL) P.T.* P.P. (L) P.P. (NL) T.T. (L) T.T. (NL) Medical (L)
Medical (NL)
1/08 - 12/08 0.708 0.681 0.719 0.631 0.608 0.719 0.692 0.974 0.8881/09 - 12/09 0.732 0.707 0.743 0.653 0.631 0.743 0.719 0.991 0.9111/10 - 12/10 0.760 0.734 0.772 0.678 0.655 0.772 0.745 1.010 0.9191/11 - 12/11 0.791 0.765 0.804 0.706 0.682 0.804 0.777 1.019 0.9221/12 - 12/12 0.809 0.787 0.822 0.722 0.702 0.822 0.799 1.034 0.9221/13 - 12/13 0.858 0.821 0.872 0.766 0.732 0.872 0.834 1.046 0.9441/14 - 12/14 0.905 0.857 0.920 0.807 0.765 0.920 0.871 1.095 0.9521/15 - 12/15 1.074 0.930 1.091 0.958 0.829 1.091 0.945 1.176 0.9641/16 - 12/16 1.279 1.083 1.299 1.154 0.977 1.299 1.100 1.250 1.0071/17 - 12/17 2.067 1.609 2.086 2.039 1.587 2.086 1.624 1.466 1.090
Policy Period Fatal (L) Fatal (NL) P.T.* P.P. (L) P.P. (NL) T.T. (L) T.T. (NL) Medical (L)
Medical (NL)
1/08 - 12/08 0.701 0.675 0.701 0.701 0.675 0.701 0.675 0.974 0.8881/09 - 12/09 0.725 0.701 0.725 0.725 0.701 0.725 0.701 0.991 0.9111/10 - 12/10 0.754 0.727 0.754 0.754 0.727 0.754 0.727 1.010 0.9191/11 - 12/11 0.784 0.758 0.784 0.784 0.758 0.784 0.758 1.019 0.9221/12 - 12/12 0.802 0.780 0.802 0.802 0.780 0.802 0.780 1.034 0.9221/13 - 12/13 0.851 0.813 0.851 0.851 0.813 0.851 0.813 1.046 0.9441/14 - 12/14 0.897 0.850 0.897 0.897 0.850 0.897 0.850 1.095 0.9521/15 - 12/15 1.065 0.922 1.065 1.065 0.922 1.065 0.922 1.176 0.9641/16 - 12/16 1.268 1.073 1.268 1.268 1.073 1.268 1.073 1.250 1.0071/17 - 12/17 2.053 1.598 2.053 2.053 1.598 2.053 1.598 1.466 1.090
*Permanent Total losses are always assigned to the Likely-to-Develop grouping.
B. Expected Excess Provision and RedistributionAfter the application of the primary conversion factors, each state's limited losses are brought to an expected unlimited level through the applicationof countrywide excess loss factors by hazard group. The expected excess loss provisions are non-catastrophe and the excess ratios at a loss limitof $50 million are set equal to zero. The countrywide excess loss factors are shown below:
Hazard Group A B C D E F G
(1) Excess Ratios
0.079 0.101 0.134 0.151 0.207 0.240 0.274
(2) = 1/(1-(1))Excess Factors
1.086 1.112 1.155 1.178 1.261 1.316 1.377
As the excess loss factors are on a combined (indemnity and medical) basis, a portion (40%) of the indemnity expected excess losses are redistributed to medical in order to more accurately allocate expected excess losses. Since a portion of the expected excess losses are redistributedin an additive manner, the expected excess factors shown above cannot be combined multiplicatively with the primary loss conversion factors.
State Act
Federal Act
© Copyright 2021 National Council on Compensation Insurance, Inc. All Rights Reserved.
Page 104 of 136

IOWA
APPENDIX B-IV
C. Calculation of Total Expected Unlimited LossesUsing expected unlimited losses, each state’s total losses at the countrywide level are a combination of its federal act losses and its state act losses adjusted to the countrywide level.
State act losses are adjusted to a common countrywide level for each state using its state-specific index to countrywide factor by using the steps below:
1. Each state’s Hazard Group E average pure premium is calculated by payroll weighting the pure premiums of the industrial codes in Hazard Group E. The average pure premium for Hazard Groups F and G are calculated in a similar manner.2. Each state’s industrial average pure premium is calculated by weighting together the state’s hazard group average pure premiums (step 1) by the F-class countrywide payroll distribution of Hazard Groups E, F, and G.3. The countrywide industrial average pure premium is calculated by payroll weighting each state’s industrial average pure premium (step 2) by its respective F-class payroll. 4. Each state’s index to countrywide factor is the ratio of the industrial countrywide average pure premium (step 3) to its respective industrial average pure premium (step 2). 5. The adjusted state act losses for each state are calculated by applying the state-specific index to countrywide factor to its state act expected unlimited losses. Iowa’s index to countrywide factor is 0.798.
D. F-Class Countrywide Pure Premium and F-Class Code RelativitiesAll states’ expected unlimited losses at the countrywide level are summed to determine the F-class overall countrywide pure premium, F-class code countrywide pure premiums, and F-class code countrywide relativities.
(1) (2) (3) (4)= (2) / ((1)/100) = (3) / (3)CW
10-Year Expected
10-Year UnlimitedClass Countrywide Countrywide Countrywide CountrywideCode Payroll Losses Pure Premium Relativity6006 285,475,380 13,842,243 4.85 1.4106801* 24,801,350 385,828 1.56 1.0006824 474,818,380 18,772,950 3.95 1.1486825 289,698,605 3,107,916 1.07 0.3116826 130,250,844 2,914,882 2.24 0.6516828* 42,894,518 577,268 1.35 1.0006829* 17,179,079 557,027 3.24 1.0006843 1,356,336,819 64,095,958 4.73 1.3756845 248,031,406 6,194,045 2.50 0.7276872 1,556,953,017 70,722,752 4.54 1.3206873* 33,450,087 1,693,252 5.06 1.0006874 113,627,635 6,175,783 5.44 1.5817309 901,526,126 37,208,286 4.13 1.2017313 670,874,776 11,325,737 1.69 0.4917317 1,159,322,995 36,038,706 3.11 0.9047327 55,654,194 5,073,036 9.12 2.6517350 644,701,195 20,158,860 3.13 0.9108709 381,840,788 5,825,272 1.53 0.4458726 678,866,423 6,787,249 1.00 0.2919077* 1,120,828 436,201 38.92 1.000
Overall 9,067,424,445 311,893,251 3.44*Relativities for class codes with a limited amount of data are set to 1.000.
© Copyright 2021 National Council on Compensation Insurance, Inc. All Rights Reserved.
Page 105 of 136

IOWA
APPENDIX B-IV
II. Calculation of Iowa's F-Class Base Pure Premiums and RateIowa's primary and secondary base pure premiums and final base rate are calculated to bring the F-class overall countrywide pure premium toIowa's proposed level.
A. Primary Base Pure Premium FactorsUsing the factors below, Iowa's primary base pure premium is calculated to bring the F-class overall countrywide pure premium toIowa's level:
1. State Act Pure Premium Relativity Factor 1.253Calculated as 1 / Iowa's index to countrywide factor (Section I.C)
2. Countrywide State and Federal WeightsCountrywide state and federal losses are used to determine the weights.
i. State Act Weight (St%) 24% ii. Federal Act Weight (Fed%) 76%
B. Secondary Base Pure Premium FactorsUsing the factors below, Iowa's secondary base pure premium is calculated to incorporate Iowa’s proposed trends,benefits, and loss-based expenses on an indemnity and medical basis:
1. Countrywide Indemnity and Medical WeightsCountrywide indemnity and medical losses are used to determine the weights.
i. Indemnity Weight 49% ii. Medical Weight 51%
2. Indemnity and Medical Trend FactorsIowa's primary base pure premium is trended from 1/1/2022 to the midpoint of the proposed period using the proposed annualtrends of 0.965 and 0.985 for indemnity and medical, respectively.
i. Indemnity Trend Factor 0.968 ii. Medical Trend Factor 0.986
3. Indemnity and Medical BenefitsIowa's primary base pure premium is adjusted to proposed state and federal benefit levels using countrywide state and federalweights (Section A.2).
Indemnity Medical(a) State Benefits 1.000 1.000(b) Federal Benefits 1.000 1.000
Weighted Benefits 1.000 1.000 = [(a) x St%] + [(b) x Fed%]
4. Loss-Based ExpensesIowa's primary base pure premium is adjusted by the weighted impact of the proposed state and federal loss-based expenses.The countrywide state and federal weights (Section A.2) are used to determine the weighted effects.
Indemnity Medical(a) State Act Loss Adjustment Expense 1.179 1.179(b) State Act Loss-Based Assessment 1.000 1.000(c) Federal Act Loss Adjustment Expense 1.179 1.179(d) Federal Act Loss-Based Assessment 1.115 1.000(e) State Act Total = (a) + (b) - 1 1.179 1.179(f) Federal Act Total = (c) +(d) - 1 1.294 1.179
Weighted Loss-Based Expenses 1.266 1.179 = [(e) x St%] + [(f) x Fed%]
C. Final Base Rate FactorsThe following factors are applied to determine Iowa’s final base rate:
1. Additional Offsets 1.000There are no additional offsets applicable in Iowa.
2. Expense Allowance 0.714The expense allowance (Exhibit II-A) is introduced into the rate by dividing the product of the proposed base pure premiums and the appropriatefactors above by the proposed target cost ratio.
© Copyright 2021 National Council on Compensation Insurance, Inc. All Rights Reserved.
Page 106 of 136

IOWA
APPENDIX B-IV
III. Calculation of Iowa's Proposed Rates by Class CodeThe proposed rates are calculated by applying the items below to Iowa’s final base rate.
A. Application of F-Class Code RelativitiesRates are calculated for each of Iowa’s F-class codes by applying the respective F-class code countrywide relativity factor(Section I.D) to Iowa’s final base rate.
B. Class Code 9077Class Code 9077 is calculated as described in Sections I and II but using non-appropriated benefit changes and federal loss-based expenses.
C. Swing LimitsThe proposed rates are limited to the swing limits based on 25% above and 25% below the current rates.
Classifications Limited by the Upper Swing Classifications Limited by the Lower SwingNone 6824 6826 6843 6845 6872 6874 7309
7313 7317 7327 7350 8709 8726
© Copyright 2021 National Council on Compensation Insurance, Inc. All Rights Reserved.
Page 107 of 136

Indemnity Medical Total
1. Overall Countrywide Pure Premium (Section I.D) 3.44
2. State Act Pure Premium Relativity Factor (Section II.A.1) 1.253
3. Countrywide State Act Weight (Section II.A.2) 24%
4. Primary Base Pure Premium 3.65=[(1) x (2) x (3)] + [(1) x (1 - (3))]
5. Countrywide Weights (Section II.B.1) 49% 51% 100%
6. Trend Factors (Section II.B.2) 0.968 0.986 xx
7. Weighted Benefits (Section II.B.3) 1.000 1.000 xx
8. Weighted Loss-Based Expenses (Section II.B.4) 1.266 1.179 xx
9. Secondary Base Pure Premium 2.192 2.164 4.36= (4tot) x (5) x (6) x (7) x (8)
10. Additional Offsets (Section II.C.1) 1.000
11. Expense Allowance (Section II.C.2) 0.714
12. Final Base Rate 6.11= (9) x (10) / (11)
IOWA
APPENDIX B-IV
Derivation of State Base Rate
© Copyright 2021 National Council on Compensation Insurance, Inc. All Rights Reserved.
Page 108 of 136

IOWA
APPENDIX B-IV
Derivation of Proposed Rate - Code 6872Industry Group - F-Class, Hazard Group - G
The rate for the above-captioned classification is derived as follows:
1. Iowa's Final Base Rate 6.11
2. Countrywide Class Code 6872 Relativity (Section I.D) 1.320
3. Rate= (1) x (2) 8.07
4. Rate Within Swing Limits 10.60
Current Rate x Swing Limitsa) Lower bound = 14.13 x 0.75 = 10.60a) Upper bound = 14.13 x 1.25 = 17.66
5. Disease, Catastrophe and/or Miscellaneous Loadings 0.00
6. Final Loaded Rate 10.60
© Copyright 2021 National Council on Compensation Insurance, Inc. All Rights Reserved.
Page 109 of 136

Iowa
Workers Compensation Rate Filing – January 1, 2022
Appendix C – Memoranda for Laws and Assessments
Appendix C provides details on changes affecting workers compensation benefit costs that are not yet reflected in the on-level factors shown in Appendix A-I. Such changes may result from annual updates in medical reimbursement levels or other changes that directly affect worker compensation benefit levels. In addition, changes to the administration of the workers compensation system, including benefit levels, may result from specific regulatory, legislative, or judicial action. The overall effect of benefit changes displayed in Appendix C is calculated as of the benefit effective date, which may differ from the overall impact on the filing as shown in the Executive Summary.
The following changes affecting Iowa benefit levels are detailed in this section of the filing:
Longshore and Harbor Workers’ Compensation Act Annual Assessment
© Copyright 2021 National Council on Compensation Insurance, Inc. All Rights Reserved.
Page 110 of 136

1.) Estimated Total Expense Needed for 2020 * 94,000,000
2.) Compensation Payments Reported (on indemnity only) in 2019 * 820,509,290
3.) Assessment Rate on Indemnity Losses (1) / (2) 11.5%
4.) Indemnity Losses (Combination of 1st through 3rd reports) # 39,408,883
5.) Medical Losses (Combination of 1st through 3rd reports) # 33,568,865
6.) Total Losses (4) + (5) 72,977,748
7.) Assessment Rate on Total Losses { (3) x (4) } / (6) 6.2%
* Source: U.S. Department of Labor
# Source: On-leveled and developed USL&HW losses - statistical plan data
Breakdown of Losses Under the Longshore and Harbor Workers Act
IOWA
APPENDIX C-I
U.S. Longshore and Harbor Workers' Compensation Act Assessment
The F-class and Program II, Option II maritime class voluntary rates
and assigned risk rates include the following provision for the federal assessment:
© Copyright 2021 National Council on Compensation Insurance, Inc. All Rights Reserved.
Page 111 of 136

Iowa
Workers Compensation Rate Filing – January 1, 2022
Appendix D – Internal Rate of Return Analysis
Appendix D provides details of the calculation of the profit and contingency provision in the Internal Rate of Return (IRR) Model.
© Copyright 2021 National Council on Compensation Insurance, Inc. All Rights Reserved.
Page 112 of 136
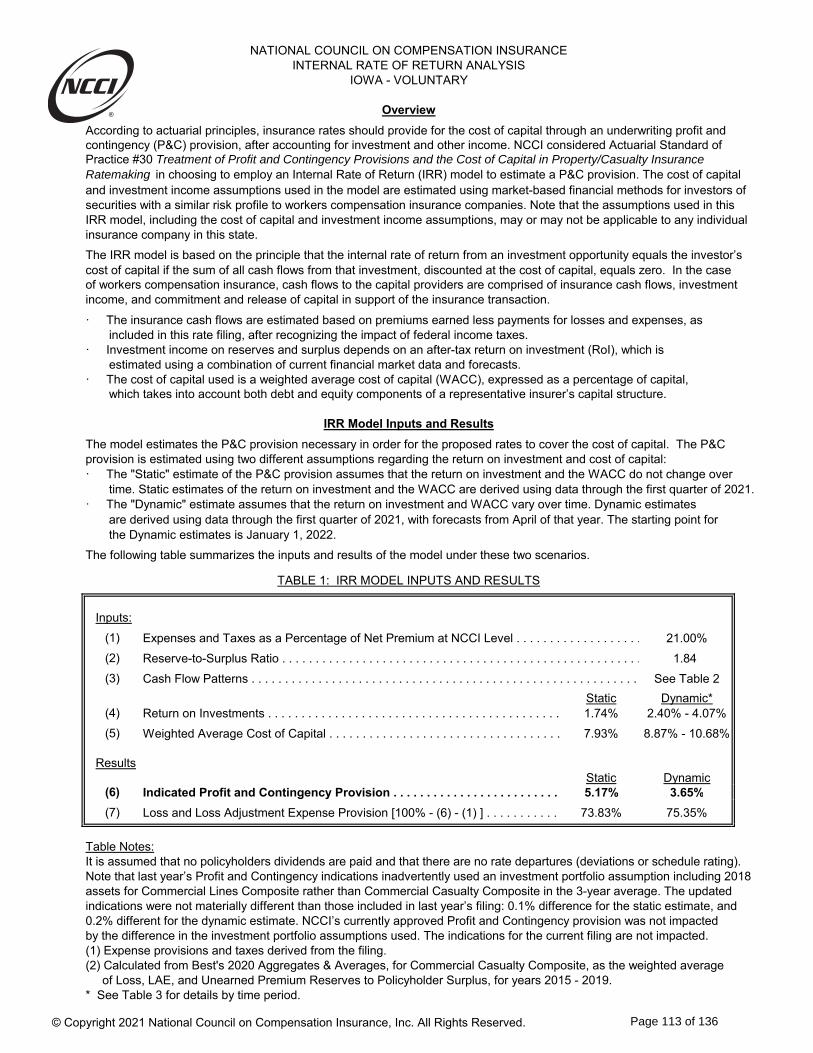
According to actuarial principles, insurance rates should provide for the cost of capital through an underwriting profit and contingency (P&C) provision, after accounting for investment and other income. NCCI considered Actuarial Standard of Practice #30 Treatment of Profit and Contingency Provisions and the Cost of Capital in Property/Casualty Insurance Ratemaking in choosing to employ an Internal Rate of Return (IRR) model to estimate a P&C provision. The cost of capitaland investment income assumptions used in the model are estimated using market-based financial methods for investors of securities with a similar risk profile to workers compensation insurance companies. Note that the assumptions used in this IRR model, including the cost of capital and investment income assumptions, may or may not be applicable to any individual insurance company in this state.
The IRR model is based on the principle that the internal rate of return from an investment opportunity equals the investor’s cost of capital if the sum of all cash flows from that investment, discounted at the cost of capital, equals zero. In the case of workers compensation insurance, cash flows to the capital providers are comprised of insurance cash flows, investment income, and commitment and release of capital in support of the insurance transaction.
ꞏ The insurance cash flows are estimated based on premiums earned less payments for losses and expenses, as included in this rate filing, after recognizing the impact of federal income taxes.ꞏ Investment income on reserves and surplus depends on an after-tax return on investment (RoI), which is estimated using a combination of current financial market data and forecasts.ꞏ The cost of capital used is a weighted average cost of capital (WACC), expressed as a percentage of capital, which takes into account both debt and equity components of a representative insurer’s capital structure.
The model estimates the P&C provision necessary in order for the proposed rates to cover the cost of capital. The P&C provision is estimated using two different assumptions regarding the return on investment and cost of capital:ꞏ The "Static" estimate of the P&C provision assumes that the return on investment and the WACC do not change over time. Static estimates of the return on investment and the WACC are derived using data through the first quarter of 2021.ꞏ The "Dynamic" estimate assumes that the return on investment and WACC vary over time. Dynamic estimates are derived using data through the first quarter of 2021, with forecasts from April of that year. The starting point for the Dynamic estimates is January 1, 2022.
The following table summarizes the inputs and results of the model under these two scenarios.
Inputs:
(1) Expenses and Taxes as a Percentage of Net Premium at NCCI Level . . . . . . . . . . . . . . . . . . . 21.00%
(2) Reserve-to-Surplus Ratio . . . . . . . . . . . . . . . . . . . . . . . . . . . . . . . . . . . . . . . . . . . . . . . . . . . . . . 1.84
(3) Cash Flow Patterns . . . . . . . . . . . . . . . . . . . . . . . . . . . . . . . . . . . . . . . . . . . . . . . . . . . . . . . . . . See Table 2
Static Dynamic*(4) Return on Investments . . . . . . . . . . . . . . . . . . . . . . . . . . . . . . . . . . . . . . . . . . . . 1.74% 2.40% - 4.07%
(5) Weighted Average Cost of Capital . . . . . . . . . . . . . . . . . . . . . . . . . . . . . . . . . . . 7.93% 8.87% - 10.68%
ResultsStatic Dynamic
(6) Indicated Profit and Contingency Provision . . . . . . . . . . . . . . . . . . . . . . . . . 5.17% 3.65%
(7) Loss and Loss Adjustment Expense Provision [100% - (6) - (1) ] . . . . . . . . . . . . 73.83% 75.35%
Table Notes:It is assumed that no policyholders dividends are paid and that there are no rate departures (deviations or schedule rating).Note that last year’s Profit and Contingency indications inadvertently used an investment portfolio assumption including 2018assets for Commercial Lines Composite rather than Commercial Casualty Composite in the 3-year average. The updatedindications were not materially different than those included in last year’s filing: 0.1% difference for the static estimate, and0.2% different for the dynamic estimate. NCCI’s currently approved Profit and Contingency provision was not impactedby the difference in the investment portfolio assumptions used. The indications for the current filing are not impacted.(1) Expense provisions and taxes derived from the filing.(2) Calculated from Best's 2020 Aggregates & Averages, for Commercial Casualty Composite, as the weighted average of Loss, LAE, and Unearned Premium Reserves to Policyholder Surplus, for years 2015 - 2019.* See Table 3 for details by time period.
TABLE 1: IRR MODEL INPUTS AND RESULTS
NATIONAL COUNCIL ON COMPENSATION INSURANCEINTERNAL RATE OF RETURN ANALYSIS
IOWA - VOLUNTARY
IRR Model Inputs and Results
Overview
© Copyright 2021 National Council on Compensation Insurance, Inc. All Rights Reserved.
Page 113 of 136

(1) (2) (3) (4) (5) (1) (2)Policy-Year Paid WeightedCollected Earned Written Expenses Losses Return on Average Cost
Time Premium Premium Premium and Taxes and LAE Time Investments of Capital0.00 - - - - - 0.00 - - 0.25 12.46% 3.53% 28.20% 12.56% 0.87% 0.25 2.40% 8.87%0.50 29.35% 13.73% 53.40% 28.96% 3.40% 0.50 2.41% 8.93%0.75 52.65% 30.38% 79.80% 51.19% 7.53% 0.75 2.43% 9.03%1.00 75.98% 52.85% 100.00% 73.14% 13.10% 1.00 2.44% 9.07%1.25 89.39% 74.33% 100.00% 85.21% 22.35% 1.25 2.46% 9.19%1.50 97.13% 89.13% 100.00% 92.18% 31.60% 1.50 2.49% 9.38%1.75 100.00% 97.48% 100.00% 100.00% 40.85% 1.75 2.55% 9.59%2.00 100.00% 100.00% 100.00% 100.00% 50.10% 2.00 2.57% 9.75%2.25 100.00% 100.00% 100.00% 100.00% 54.88% 2.25 2.63% 9.92%2.50 100.00% 100.00% 100.00% 100.00% 59.65% 2.50 2.66% 10.06%2.75 100.00% 100.00% 100.00% 100.00% 64.43% 2.75 3.11% 10.20%3.00 100.00% 100.00% 100.00% 100.00% 69.20% 3.00 3.14% 10.33%3.25 100.00% 100.00% 100.00% 100.00% 71.78% 3.25 3.19% 10.44%3.50 100.00% 100.00% 100.00% 100.00% 74.35% 3.50 3.21% 10.54%3.75 100.00% 100.00% 100.00% 100.00% 76.93% 3.75 3.25% 10.62%4.00 100.00% 100.00% 100.00% 100.00% 79.50% 4.00 3.26% 10.69%4.25 100.00% 100.00% 100.00% 100.00% 80.88% 4.25 3.27% 10.75%4.50 100.00% 100.00% 100.00% 100.00% 82.25% 4.50 3.28% 10.79%4.75 100.00% 100.00% 100.00% 100.00% 83.63% 4.75 3.28% 10.83%5.00 100.00% 100.00% 100.00% 100.00% 85.00% 5.00 3.28% 10.87%6.00 100.00% 100.00% 100.00% 100.00% 87.90% 6.00 3.50% 10.89%7.00 100.00% 100.00% 100.00% 100.00% 89.40% 7.00 3.49% 10.86%8.00 100.00% 100.00% 100.00% 100.00% 90.40% 8.00 3.67% 10.80%9.00 100.00% 100.00% 100.00% 100.00% 91.10% 9.00 3.86% 10.75%
10.00 100.00% 100.00% 100.00% 100.00% 91.90% 10.00 3.86% 10.73%11.00 100.00% 100.00% 100.00% 100.00% 92.70% 11.00 3.86% 10.72%12.00 100.00% 100.00% 100.00% 100.00% 93.00% 12.00 3.86% 10.71%13.00 100.00% 100.00% 100.00% 100.00% 93.70% 13.00 3.87% 10.71%14.00 100.00% 100.00% 100.00% 100.00% 94.00% 14.00 3.88% 10.70%15.00 100.00% 100.00% 100.00% 100.00% 94.60% 15.00 3.88% 10.70%16.00 100.00% 100.00% 100.00% 100.00% 94.90% 16.00 4.01% 10.70%17.00 100.00% 100.00% 100.00% 100.00% 95.20% 17.00 4.01% 10.69%18.00 100.00% 100.00% 100.00% 100.00% 95.40% 18.00 4.01% 10.69%19.00 100.00% 100.00% 100.00% 100.00% 95.80% 19.00 4.01% 10.70%20.00 100.00% 100.00% 100.00% 100.00% 96.10% 20.00 4.02% 10.71%21.00 100.00% 100.00% 100.00% 100.00% 96.50% 21.00 4.09% 10.72%22.00 100.00% 100.00% 100.00% 100.00% 96.60% 22.00 4.09% 10.71%23.00 100.00% 100.00% 100.00% 100.00% 97.00% 23.00 4.09% 10.70%24.00 100.00% 100.00% 100.00% 100.00% 97.10% 24.00 4.08% 10.70%25.00 100.00% 100.00% 100.00% 100.00% 97.60% 25.00 4.08% 10.69%26.00 100.00% 100.00% 100.00% 100.00% 97.70% 26.00 4.08% 10.69%27.00 100.00% 100.00% 100.00% 100.00% 98.00% 27.00 4.08% 10.68%28.00 100.00% 100.00% 100.00% 100.00% 98.20% 28.00 4.07% 10.68%29.00 100.00% 100.00% 100.00% 100.00% 98.30% 29.00 4.07% 10.68%30.00 100.00% 100.00% 100.00% 100.00% 98.40% 30.00 4.07% 10.68%31.00 100.00% 100.00% 100.00% 100.00% 98.70% 31.00 4.07% 10.68%32.00 100.00% 100.00% 100.00% 100.00% 99.08% 32.00 4.07% 10.68%33.00 100.00% 100.00% 100.00% 100.00% 99.42% 33.00 4.07% 10.68%34.00 100.00% 100.00% 100.00% 100.00% 99.72% 34.00 4.07% 10.68%35.00 100.00% 100.00% 100.00% 100.00% 100.00% 35.00 4.07% 10.68%
Table 2 Notes:Table 2 shows cumulative cash flows. For ease of reading no additional numbers are shown after a column reaches 100% cumulative cash flow.(1) Derived from estimates of premium distribution and payment terms by size of policy.(2) Based on written premium pattern assuming uniform writings within quarters and standard quarterly earning pattern.(3) Based on this jurisdiction’s premium writings by quarter.(4) Expenses assumed paid as premium is collected; timing of taxes based on NCCI's Tax and Assessment Directory.(5) Derived from loss development data underlying this rate filing. Payouts for the first 31 years are based upon the ratio of paid losses to incurred losses from the most recent 31 policy years for which data is available. For the following years, loss payouts are assumed to trail off geometrically, with an adjustment so that the payout will be complete at 35 years.
NATIONAL COUNCIL ON COMPENSATION INSURANCEINTERNAL RATE OF RETURN ANALYSIS
IOWA - VOLUNTARY
TABLE 3: DYNAMIC ESTIMATE INPUTS
TABLE 2: CASH FLOW PATTERNS (CUMULATIVE)
© Copyright 2021 National Council on Compensation Insurance, Inc. All Rights Reserved.
Page 114 of 136

NATIONAL COUNCIL ON COMPENSATION INSURANCEINTERNAL RATE OF RETURN ANALYSIS
IOWA - VOLUNTARY
Calculation Details
The tables in the following pages show the detailed calculations of the IRR model.
List of Tables
Static Estimate
Table 4: Derivation of Insurance Cash Flows
Table 5: Derivation of Cash Flows to the Capital Providers
Dynamic Estimate
Table 6: Derivation of Insurance Cash Flows
Table 7: Derivation of Cash Flows to the Capital Providers
Appendices
Appendix A: Calculation of Weighted Average Cost of Capital and Return on Investments
Table A.1: Calculation of Weighted Average Cost of CapitalTable A.2: Calculation of Return on Investments
Appendix B: Federal Income Tax Incurred from Insurance Operations
Table B.1: Federal Income Tax Calculation (Static Estimate)Table B.2: Federal Income Tax Calculation (Dynamic Estimate)
Appendix C: Reserve-to-Surplus Ratio
Note: Although values are displayed to 4 decimal places in the following tables, the calculations themselves are carried to the full precision of the computer.
© Copyright 2021 National Council on Compensation Insurance, Inc. All Rights Reserved.
Page 115 of 136

(1) (2) (3) (4) (5)Collected Expense Paid Losses Federal InsurancePremium and Taxes and LAE Income Tax Cash flow
Time Factor Factor Factor Factor Factor0.00 - - - - - 0.25 0.1246 0.0264 0.0065 0.0070 0.0847 0.50 0.2935 0.0608 0.0251 0.0141 0.1935 0.75 0.5265 0.1075 0.0556 0.0211 0.3423 1.00 0.7598 0.1536 0.0967 0.0281 0.4814 1.25 0.8939 0.1789 0.1650 0.0263 0.5236 1.50 0.9713 0.1936 0.2333 0.0245 0.5199 1.75 1.0000 0.2100 0.3016 0.0227 0.4657 2.00 1.0000 0.2100 0.3699 0.0209 0.3992 2.25 1.0000 0.2100 0.4051 0.0202 0.3647 2.50 1.0000 0.2100 0.4404 0.0194 0.3302 2.75 1.0000 0.2100 0.4756 0.0186 0.2958 3.00 1.0000 0.2100 0.5109 0.0178 0.2613 3.25 1.0000 0.2100 0.5299 0.0173 0.2428 3.50 1.0000 0.2100 0.5489 0.0168 0.2242 3.75 1.0000 0.2100 0.5679 0.0164 0.2057 4.00 1.0000 0.2100 0.5869 0.0159 0.1872 4.25 1.0000 0.2100 0.5971 0.0156 0.1773 4.50 1.0000 0.2100 0.6072 0.0153 0.1674 4.75 1.0000 0.2100 0.6174 0.0151 0.1575 5.00 1.0000 0.2100 0.6275 0.0148 0.1476 6.00 1.0000 0.2100 0.6490 0.0141 0.1269 7.00 1.0000 0.2100 0.6600 0.0138 0.1162 8.00 1.0000 0.2100 0.6674 0.0134 0.1092 9.00 1.0000 0.2100 0.6726 0.0131 0.1043
10.00 1.0000 0.2100 0.6785 0.0127 0.0988 11.00 1.0000 0.2100 0.6844 0.0124 0.0932 12.00 1.0000 0.2100 0.6866 0.0122 0.0912 13.00 1.0000 0.2100 0.6918 0.0119 0.0863 14.00 1.0000 0.2100 0.6940 0.0117 0.0843 15.00 1.0000 0.2100 0.6984 0.0115 0.0800 16.00 1.0000 0.2100 0.7006 0.0114 0.0780 17.00 1.0000 0.2100 0.7029 0.0113 0.0759 18.00 1.0000 0.2100 0.7043 0.0111 0.0745 19.00 1.0000 0.2100 0.7073 0.0110 0.0717 20.00 1.0000 0.2100 0.7095 0.0110 0.0695 21.00 1.0000 0.2100 0.7125 0.0109 0.0666 22.00 1.0000 0.2100 0.7132 0.0109 0.0659 23.00 1.0000 0.2100 0.7161 0.0109 0.0629 24.00 1.0000 0.2100 0.7169 0.0109 0.0622 25.00 1.0000 0.2100 0.7206 0.0109 0.0585 26.00 1.0000 0.2100 0.7213 0.0109 0.0578 27.00 1.0000 0.2100 0.7235 0.0109 0.0556 28.00 1.0000 0.2100 0.7250 0.0109 0.0541 29.00 1.0000 0.2100 0.7257 0.0109 0.0534 30.00 1.0000 0.2100 0.7265 0.0109 0.0526 31.00 1.0000 0.2100 0.7287 0.0109 0.0504 32.00 1.0000 0.2100 0.7315 0.0109 0.0476 33.00 1.0000 0.2100 0.7340 0.0109 0.0451 34.00 1.0000 0.2100 0.7363 0.0109 0.0429 35.00 1.0000 0.2100 0.7383 0.0109 0.0408
Column Notes:(1) is Collected Premium by time period, expressed as a factor, = Table 2 col (1)(2) is Expenses and Taxes by time period, expressed as a factor, = Table 1 row (1) x Table 2 col (4)(3) is Paid Losses and LAE by time period, expressed as a factor, = Table 1 row (7, Static) x Table 2 col (5)(4) per the Tax Cuts and Jobs Act of 2017, federal income taxes are computed as the tax rate (21%) times the adjusted underwriting income calculated per IRS rules. See Appendix B for details.(5) is the Total Insurance Cash Flow by time period, expressed as a factor, = (1) - [(2) + (3) + (4)]
NATIONAL COUNCIL ON COMPENSATION INSURANCEINTERNAL RATE OF RETURN ANALYSIS
IOWA - VOLUNTARY
TABLE 4: DERIVATION OF INSURANCE CASH FLOW (STATIC ESTIMATE)
Calculation Details - Static Estimate
© Copyright 2021 National Council on Compensation Insurance, Inc. All Rights Reserved.
Page 116 of 136
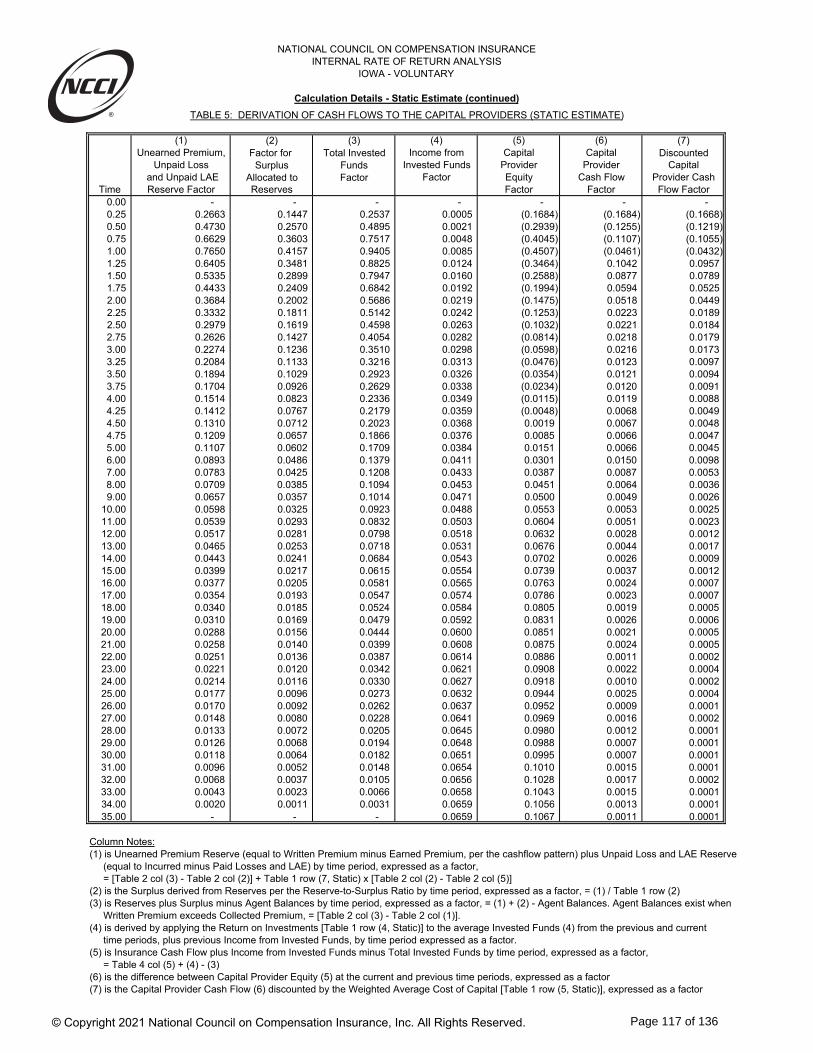
(1) (2) (3) (4) (5) (6) (7)Unearned Premium, Factor for Total Invested Income from Capital Capital Discounted
Unpaid Loss Surplus Funds Invested Funds Provider Provider Capital and Unpaid LAE Allocated to Factor Factor Equity Cash Flow Provider Cash
Time Reserve Factor Reserves Factor Factor Flow Factor0.00 - - - - - - - 0.25 0.2663 0.1447 0.2537 0.0005 (0.1684) (0.1684) (0.1668) 0.50 0.4730 0.2570 0.4895 0.0021 (0.2939) (0.1255) (0.1219) 0.75 0.6629 0.3603 0.7517 0.0048 (0.4045) (0.1107) (0.1055) 1.00 0.7650 0.4157 0.9405 0.0085 (0.4507) (0.0461) (0.0432) 1.25 0.6405 0.3481 0.8825 0.0124 (0.3464) 0.1042 0.0957 1.50 0.5335 0.2899 0.7947 0.0160 (0.2588) 0.0877 0.0789 1.75 0.4433 0.2409 0.6842 0.0192 (0.1994) 0.0594 0.0525 2.00 0.3684 0.2002 0.5686 0.0219 (0.1475) 0.0518 0.0449 2.25 0.3332 0.1811 0.5142 0.0242 (0.1253) 0.0223 0.0189 2.50 0.2979 0.1619 0.4598 0.0263 (0.1032) 0.0221 0.0184 2.75 0.2626 0.1427 0.4054 0.0282 (0.0814) 0.0218 0.0179 3.00 0.2274 0.1236 0.3510 0.0298 (0.0598) 0.0216 0.0173 3.25 0.2084 0.1133 0.3216 0.0313 (0.0476) 0.0123 0.0097 3.50 0.1894 0.1029 0.2923 0.0326 (0.0354) 0.0121 0.0094 3.75 0.1704 0.0926 0.2629 0.0338 (0.0234) 0.0120 0.0091 4.00 0.1514 0.0823 0.2336 0.0349 (0.0115) 0.0119 0.0088 4.25 0.1412 0.0767 0.2179 0.0359 (0.0048) 0.0068 0.0049 4.50 0.1310 0.0712 0.2023 0.0368 0.0019 0.0067 0.0048 4.75 0.1209 0.0657 0.1866 0.0376 0.0085 0.0066 0.0047 5.00 0.1107 0.0602 0.1709 0.0384 0.0151 0.0066 0.0045 6.00 0.0893 0.0486 0.1379 0.0411 0.0301 0.0150 0.0098 7.00 0.0783 0.0425 0.1208 0.0433 0.0387 0.0087 0.0053 8.00 0.0709 0.0385 0.1094 0.0453 0.0451 0.0064 0.0036 9.00 0.0657 0.0357 0.1014 0.0471 0.0500 0.0049 0.0026
10.00 0.0598 0.0325 0.0923 0.0488 0.0553 0.0053 0.0025 11.00 0.0539 0.0293 0.0832 0.0503 0.0604 0.0051 0.0023 12.00 0.0517 0.0281 0.0798 0.0518 0.0632 0.0028 0.0012 13.00 0.0465 0.0253 0.0718 0.0531 0.0676 0.0044 0.0017 14.00 0.0443 0.0241 0.0684 0.0543 0.0702 0.0026 0.0009 15.00 0.0399 0.0217 0.0615 0.0554 0.0739 0.0037 0.0012 16.00 0.0377 0.0205 0.0581 0.0565 0.0763 0.0024 0.0007 17.00 0.0354 0.0193 0.0547 0.0574 0.0786 0.0023 0.0007 18.00 0.0340 0.0185 0.0524 0.0584 0.0805 0.0019 0.0005 19.00 0.0310 0.0169 0.0479 0.0592 0.0831 0.0026 0.0006 20.00 0.0288 0.0156 0.0444 0.0600 0.0851 0.0021 0.0005 21.00 0.0258 0.0140 0.0399 0.0608 0.0875 0.0024 0.0005 22.00 0.0251 0.0136 0.0387 0.0614 0.0886 0.0011 0.0002 23.00 0.0221 0.0120 0.0342 0.0621 0.0908 0.0022 0.0004 24.00 0.0214 0.0116 0.0330 0.0627 0.0918 0.0010 0.0002 25.00 0.0177 0.0096 0.0273 0.0632 0.0944 0.0025 0.0004 26.00 0.0170 0.0092 0.0262 0.0637 0.0952 0.0009 0.0001 27.00 0.0148 0.0080 0.0228 0.0641 0.0969 0.0016 0.0002 28.00 0.0133 0.0072 0.0205 0.0645 0.0980 0.0012 0.0001 29.00 0.0126 0.0068 0.0194 0.0648 0.0988 0.0007 0.0001 30.00 0.0118 0.0064 0.0182 0.0651 0.0995 0.0007 0.0001 31.00 0.0096 0.0052 0.0148 0.0654 0.1010 0.0015 0.0001 32.00 0.0068 0.0037 0.0105 0.0656 0.1028 0.0017 0.0002 33.00 0.0043 0.0023 0.0066 0.0658 0.1043 0.0015 0.0001 34.00 0.0020 0.0011 0.0031 0.0659 0.1056 0.0013 0.0001 35.00 - - - 0.0659 0.1067 0.0011 0.0001
Column Notes:(1) is Unearned Premium Reserve (equal to Written Premium minus Earned Premium, per the cashflow pattern) plus Unpaid Loss and LAE Reserve (equal to Incurred minus Paid Losses and LAE) by time period, expressed as a factor, = [Table 2 col (3) - Table 2 col (2)] + Table 1 row (7, Static) x [Table 2 col (2) - Table 2 col (5)](2) is the Surplus derived from Reserves per the Reserve-to-Surplus Ratio by time period, expressed as a factor, = (1) / Table 1 row (2)(3) is Reserves plus Surplus minus Agent Balances by time period, expressed as a factor, = (1) + (2) - Agent Balances. Agent Balances exist when Written Premium exceeds Collected Premium, = [Table 2 col (3) - Table 2 col (1)].(4) is derived by applying the Return on Investments [Table 1 row (4, Static)] to the average Invested Funds (4) from the previous and current time periods, plus previous Income from Invested Funds, by time period expressed as a factor.(5) is Insurance Cash Flow plus Income from Invested Funds minus Total Invested Funds by time period, expressed as a factor, = Table 4 col (5) + (4) - (3)(6) is the difference between Capital Provider Equity (5) at the current and previous time periods, expressed as a factor(7) is the Capital Provider Cash Flow (6) discounted by the Weighted Average Cost of Capital [Table 1 row (5, Static)], expressed as a factor
NATIONAL COUNCIL ON COMPENSATION INSURANCEINTERNAL RATE OF RETURN ANALYSIS
IOWA - VOLUNTARY
TABLE 5: DERIVATION OF CASH FLOWS TO THE CAPITAL PROVIDERS (STATIC ESTIMATE)
Calculation Details - Static Estimate (continued)
© Copyright 2021 National Council on Compensation Insurance, Inc. All Rights Reserved.
Page 117 of 136

(1) (2) (3) (4) (5)Collected Expense Paid Losses Federal InsurancePremium and Taxes and LAE Income Tax Cash flow
Time Factor Factor Factor Factor Factor0.00 - - - - - 0.25 0.1246 0.0264 0.0066 0.0067 0.0850 0.50 0.2935 0.0608 0.0256 0.0133 0.1937 0.75 0.5265 0.1075 0.0567 0.0200 0.3423 1.00 0.7598 0.1536 0.0987 0.0267 0.4808 1.25 0.8939 0.1789 0.1684 0.0245 0.5220 1.50 0.9713 0.1936 0.2381 0.0223 0.5173 1.75 1.0000 0.2100 0.3078 0.0201 0.4620 2.00 1.0000 0.2100 0.3775 0.0180 0.3945 2.25 1.0000 0.2100 0.4135 0.0171 0.3593 2.50 1.0000 0.2100 0.4495 0.0163 0.3242 2.75 1.0000 0.2100 0.4855 0.0155 0.2890 3.00 1.0000 0.2100 0.5215 0.0147 0.2538 3.25 1.0000 0.2100 0.5409 0.0142 0.2349 3.50 1.0000 0.2100 0.5603 0.0137 0.2160 3.75 1.0000 0.2100 0.5797 0.0133 0.1971 4.00 1.0000 0.2100 0.5991 0.0128 0.1782 4.25 1.0000 0.2100 0.6094 0.0125 0.1681 4.50 1.0000 0.2100 0.6198 0.0122 0.1580 4.75 1.0000 0.2100 0.6302 0.0120 0.1479 5.00 1.0000 0.2100 0.6405 0.0117 0.1378 6.00 1.0000 0.2100 0.6624 0.0110 0.1166 7.00 1.0000 0.2100 0.6737 0.0106 0.1057 8.00 1.0000 0.2100 0.6812 0.0102 0.0986 9.00 1.0000 0.2100 0.6865 0.0099 0.0936
10.00 1.0000 0.2100 0.6925 0.0096 0.0879 11.00 1.0000 0.2100 0.6985 0.0092 0.0823 12.00 1.0000 0.2100 0.7008 0.0090 0.0802 13.00 1.0000 0.2100 0.7061 0.0087 0.0752 14.00 1.0000 0.2100 0.7083 0.0086 0.0731 15.00 1.0000 0.2100 0.7129 0.0084 0.0688 16.00 1.0000 0.2100 0.7151 0.0082 0.0667 17.00 1.0000 0.2100 0.7174 0.0081 0.0646 18.00 1.0000 0.2100 0.7189 0.0079 0.0632 19.00 1.0000 0.2100 0.7219 0.0078 0.0603 20.00 1.0000 0.2100 0.7242 0.0078 0.0581 21.00 1.0000 0.2100 0.7272 0.0077 0.0551 22.00 1.0000 0.2100 0.7279 0.0077 0.0543 23.00 1.0000 0.2100 0.7309 0.0077 0.0513 24.00 1.0000 0.2100 0.7317 0.0077 0.0506 25.00 1.0000 0.2100 0.7355 0.0077 0.0468 26.00 1.0000 0.2100 0.7362 0.0077 0.0461 27.00 1.0000 0.2100 0.7385 0.0077 0.0438 28.00 1.0000 0.2100 0.7400 0.0077 0.0423 29.00 1.0000 0.2100 0.7407 0.0077 0.0416 30.00 1.0000 0.2100 0.7415 0.0077 0.0408 31.00 1.0000 0.2100 0.7437 0.0077 0.0386 32.00 1.0000 0.2100 0.7466 0.0077 0.0357 33.00 1.0000 0.2100 0.7492 0.0077 0.0332 34.00 1.0000 0.2100 0.7515 0.0077 0.0309 35.00 1.0000 0.2100 0.7535 0.0077 0.0288
Column Notes:(1) is Collected Premium by time period, expressed as a factor, = Table 2 col (1)(2) is Expenses and Taxes by time period, expressed as a factor, = Table 1 row (1) x Table 2 col (4)(3) is Paid Losses and LAE by time period, expressed as a factor, = Table 1 row (7, Dynamic) x Table 2 col (5)(4) per the Tax Cuts and Jobs Act of 2017, federal income taxes are computed as the tax rate (21%) times the adjusted underwriting income calculated per IRS rules. See Appendix B for details.(5) is the Total Insurance Cash Flow by time period, expressed as a factor, = (1) - [(2) + (3) + (4)]
NATIONAL COUNCIL ON COMPENSATION INSURANCEINTERNAL RATE OF RETURN ANALYSIS
IOWA - VOLUNTARY
TABLE 6: DERIVATION OF INSURANCE CASH FLOW (DYNAMIC ESTIMATE)
Calculation Details - Dynamic Estimate
© Copyright 2021 National Council on Compensation Insurance, Inc. All Rights Reserved.
Page 118 of 136

(1) (2) (3) (4) (5) (6) (7) (8)Unearned Premium, Factor for Total Income from Capital Capital Cumulative Discounted
Unpaid Loss Surplus Invested Invested Provider Provider Discount Capital and Unpaid LAE Allocated to Funds Funds Equity Cash Flow Factor Provider Cash
Time Reserve Factor Reserves Factor Factor Factor Factor Flow Factor0.00 - - - - - - - - 0.25 0.2667 0.1450 0.2543 0.0008 (0.1686) (0.1686) 0.9894 (0.1668) 0.50 0.4745 0.2579 0.4919 0.0030 (0.2952) (0.1267) 0.9685 (0.1227) 0.75 0.6664 0.3622 0.7571 0.0067 (0.4081) (0.1128) 0.9478 (0.1069) 1.00 0.7710 0.4190 0.9499 0.0119 (0.4572) (0.0491) 0.9274 (0.0455) 1.25 0.6484 0.3524 0.8947 0.0175 (0.3551) 0.1020 0.9073 0.0926 1.50 0.5422 0.2947 0.8082 0.0228 (0.2682) 0.0870 0.8872 0.0772 1.75 0.4519 0.2456 0.6976 0.0275 (0.2080) 0.0602 0.8671 0.0522 2.00 0.3760 0.2044 0.5804 0.0316 (0.1543) 0.0537 0.8472 0.0455 2.25 0.3400 0.1848 0.5248 0.0352 (0.1303) 0.0240 0.8274 0.0198 2.50 0.3041 0.1652 0.4693 0.0385 (0.1067) 0.0236 0.8078 0.0191 2.75 0.2681 0.1457 0.4138 0.0419 (0.0829) 0.0238 0.7884 0.0187 3.00 0.2321 0.1261 0.3582 0.0449 (0.0595) 0.0234 0.7693 0.0180 3.25 0.2127 0.1156 0.3283 0.0476 (0.0458) 0.0137 0.7504 0.0103 3.50 0.1933 0.1050 0.2983 0.0500 (0.0323) 0.0135 0.7318 0.0099 3.75 0.1739 0.0945 0.2684 0.0523 (0.0190) 0.0133 0.7136 0.0095 4.00 0.1545 0.0840 0.2384 0.0544 (0.0059) 0.0131 0.6957 0.0091 4.25 0.1441 0.0783 0.2224 0.0562 0.0019 0.0078 0.6782 0.0053 4.50 0.1338 0.0727 0.2064 0.0580 0.0095 0.0076 0.6610 0.0051 4.75 0.1234 0.0671 0.1905 0.0596 0.0170 0.0075 0.6442 0.0048 5.00 0.1130 0.0614 0.1745 0.0611 0.0244 0.0074 0.6278 0.0046 6.00 0.0912 0.0496 0.1407 0.0666 0.0425 0.0181 0.5885 0.0106 7.00 0.0799 0.0434 0.1233 0.0712 0.0536 0.0112 0.5309 0.0059 8.00 0.0723 0.0393 0.1117 0.0755 0.0624 0.0088 0.4791 0.0042 9.00 0.0671 0.0364 0.1035 0.0796 0.0697 0.0073 0.4326 0.0032
10.00 0.0610 0.0332 0.0942 0.0835 0.0772 0.0075 0.3907 0.0029 11.00 0.0550 0.0299 0.0849 0.0869 0.0843 0.0071 0.3529 0.0025 12.00 0.0527 0.0287 0.0814 0.0901 0.0889 0.0046 0.3187 0.0015 13.00 0.0475 0.0258 0.0733 0.0931 0.0950 0.0061 0.2879 0.0018 14.00 0.0452 0.0246 0.0698 0.0959 0.0992 0.0042 0.2601 0.0011 15.00 0.0407 0.0221 0.0628 0.0985 0.1045 0.0052 0.2349 0.0012 16.00 0.0384 0.0209 0.0593 0.1009 0.1083 0.0038 0.2122 0.0008 17.00 0.0362 0.0197 0.0558 0.1032 0.1120 0.0037 0.1917 0.0007 18.00 0.0347 0.0188 0.0535 0.1054 0.1151 0.0031 0.1732 0.0005 19.00 0.0316 0.0172 0.0488 0.1075 0.1189 0.0038 0.1565 0.0006 20.00 0.0294 0.0160 0.0454 0.1094 0.1221 0.0032 0.1413 0.0005 21.00 0.0264 0.0143 0.0407 0.1111 0.1255 0.0034 0.1276 0.0004 22.00 0.0256 0.0139 0.0395 0.1128 0.1276 0.0021 0.1153 0.0002 23.00 0.0226 0.0123 0.0349 0.1143 0.1307 0.0032 0.1041 0.0003 24.00 0.0219 0.0119 0.0337 0.1157 0.1325 0.0018 0.0941 0.0002 25.00 0.0181 0.0098 0.0279 0.1170 0.1359 0.0033 0.0850 0.0003 26.00 0.0173 0.0094 0.0268 0.1181 0.1374 0.0015 0.0768 0.0001 27.00 0.0151 0.0082 0.0233 0.1191 0.1396 0.0023 0.0694 0.0002 28.00 0.0136 0.0074 0.0209 0.1200 0.1414 0.0017 0.0627 0.0001 29.00 0.0128 0.0070 0.0198 0.1208 0.1426 0.0012 0.0566 0.0001 30.00 0.0121 0.0066 0.0186 0.1216 0.1438 0.0012 0.0512 0.0001 31.00 0.0098 0.0053 0.0151 0.1223 0.1457 0.0019 0.0462 0.0001 32.00 0.0069 0.0038 0.0107 0.1228 0.1478 0.0021 0.0418 0.0001 33.00 0.0044 0.0024 0.0068 0.1232 0.1496 0.0018 0.0377 0.0001 34.00 0.0021 0.0011 0.0032 0.1234 0.1510 0.0015 0.0341 0.0000 35.00 - - - 0.1234 0.1522 0.0012 0.0308 0.0000
Column Notes:(1) is Unearned Premium Reserve (equal to Written Premium minus Earned Premium, per the cashflow pattern) plus Unpaid Loss and LAE Reserve (equal to Incurred minus Paid Losses and LAE) by time period, expressed as a factor, = [Table 2 col (3) - Table 2 col (2)] + Table 1 row (7, Dynamic) x [Table 2 col (2) - Table 2 col (5)](2) is the Surplus derived from Reserves per the Reserve-to-Surplus Ratio by time period, expressed as a factor, = (1) / Table 1 row (2)(3) is Reserves plus Surplus minus Agent Balances by time period, expressed as a factor, = (1) + (2) - Agent Balances. Agent Balances exist when Written Premium exceeds Collected Premium, = [Table 2 col (3) - Table 2 col (1)].(4) is derived by applying the Return on Investments [Table 3 col (1)] to the average Invested Funds (4) from the previous and current time periods, plus previous Income from Invested Funds, by time period expressed as a factor.(5) is Insurance Cash Flow plus Income from Invested Funds minus Total Invested Funds by time period, expressed as a factor, = Table 6 col (5) + (4) - (3)(6) is the difference between Capital Provider Equity (5) at the current and previous time periods, expressed as a factor(7) is derived from the respective Weighted Average Cost of Capital [Table 3 col (2)] for each time period, expressed as a factor(8) is the Capital Provider Cash Flow (6) discounted by the Cumulative Discount Factor (7), expressed as a factor
NATIONAL COUNCIL ON COMPENSATION INSURANCEINTERNAL RATE OF RETURN ANALYSIS
IOWA - VOLUNTARY
TABLE 7: DERIVATION OF CASH FLOWS TO THE CAPITAL PROVIDERS (DYNAMIC ESTIMATE)
Calculation Details - Dynamic Estimate (continued)
© Copyright 2021 National Council on Compensation Insurance, Inc. All Rights Reserved.
Page 119 of 136

The calculation of the Weighted Average Cost of Capital (WACC) is shown in Table A.1, and the calculation of the Return on
Investments (RoI) is shown in Table A.2. The calculation for the Static estimate is shown in each. Calculations of the WACC and
RoI under the Dynamic estimate for time periods 1, 2, and 5 are also provided for illustrative purposes. Note that the IRR model
under the Dynamic estimate includes estimates of the WACC and RoI on a quarterly basis for the first five years and annually
thereafter.
Static 1.00 2.00 5.00(1) 5 year US T-note Yield 0.62% 1.82% 2.52% 3.70%
(2) US Equity Market Risk Premium 8.50%
(3) Beta for Property/Casualty (P/C) Insurers 0.99
(4) Equity Cost of Capital for P/C Insurers 9.03% 10.24% 10.93% 12.11%
(5) Share of Equity Capital for P/C Insurers 84%
(6) Debt Cost of Capital for P/C Insurers 2.16% 2.95% 3.52% 4.33%
(7) Weighted Average Cost of Capital (WACC) 7.93% 9.07% 9.75% 10.87%
Column Notes:
(1) Forward estimates of US Treasury yields are from Moody's forecasts and apply only to
the Dynamic estimate of the WACC. Time periods provided are illustrative; the full model includes
estimates on a quarterly basis for the first five years and annually thereafter.
(3) & (5) P/C beta and share of equity capital are estimated from historical data for a collection of insurers
with publicly traded equity and debt.
(4) = (1) + (2) x (3)
(6) P/C debt cost of capital is the sum of the 10-year US T-note yield plus the historical corporate
spread, net of income tax.
(7) = (4) x (5) + (6) x [1 - (5)]
IRR Model Time (yrs)
NATIONAL COUNCIL ON COMPENSATION INSURANCEINTERNAL RATE OF RETURN ANALYSIS
IOWA - VOLUNTARY
APPENDIX A: CALCULATION OF WEIGHTED AVERAGE COST OF CAPITAL AND RETURN ON INVESTMENTS
TABLE A.1: CALCULATION OF WEIGHTED AVERAGE COST OF CAPITAL
© Copyright 2021 National Council on Compensation Insurance, Inc. All Rights Reserved.
Page 120 of 136

(2) (3) (4) (5) (6) (7) (8) (9)
Investment Roll-over Income
Portfolio Yield Curve, Maturity and Spread Period Tax Rate
Bonds, of which 74.3%
Government Direct Obligations 6.7% Static 1.00 2.00 5.00
< 1yr 2.0% 6 mo US T-bill 0.50 yrs 21.00% 0.05% 0.29% 0.72% 2.11%
1 ‒ 5 yrs 2.9% 2.5 yr US T-note 2.50 yrs 21.00% 0.15% 0.81% 0.81% 2.01%
5 ‒ 10 yrs 1.1% 7.5 yr US T-note 7.50 yrs 21.00% 0.84% 1.57% 1.57% 1.57%
10 ‒ 20 yrs 0.2% 15 yr US T-note 15.00 yrs 21.00% 1.29% 1.98% 1.98% 1.98%
> 20 yrs 0.4% 20 yr US T-note 20.00 yrs 21.00% 1.53% 2.28% 2.28% 2.28%
Collateralized Securities 8.0%
< 1yr 1.0% 6 mo US T-bill + 50 basis points 0.50 yrs 21.00% 0.45% 0.68% 1.12% 2.51%
1 ‒ 5 yrs 2.9% 2.5 yr US T-note + 50 basis points 2.50 yrs 21.00% 0.55% 1.20% 1.20% 2.41%
5 ‒ 10 yrs 2.3% 7.5 yr US T-note + 50 basis points 7.50 yrs 21.00% 1.23% 1.97% 1.97% 1.97%
10 ‒ 20 yrs 1.4% 15 yr US T-note + 50 basis points 15.00 yrs 21.00% 1.69% 2.37% 2.37% 2.37%
> 20 yrs 0.4% 20 yr US T-note + 50 basis points 20.00 yrs 21.00% 1.93% 2.67% 2.67% 2.67%
Tax-exempt Bonds 22.0%
< 1yr 1.4% 6 mo US T-bill + Tax-exempt spread 0.50 yrs 5.25% 0.21% 0.49% 1.02% 2.69%
1 ‒ 5 yrs 6.3% 2.5 yr US T-note + Tax-exempt spread 2.50 yrs 5.25% 0.37% 1.16% 1.16% 2.61%
5 ‒ 10 yrs 6.8% 7.5 yr US T-note + Tax-exempt spread 7.50 yrs 5.25% 1.20% 2.08% 2.08% 2.08%
10 ‒ 20 yrs 5.8% 15 yr US T-note + Tax-exempt spread 15.00 yrs 5.25% 1.86% 2.68% 2.68% 2.68%
> 20 yrs 1.7% 20 yr US T-note + Tax-exempt spread 20.00 yrs 5.25% 2.26% 3.14% 3.14% 3.14%
Industrial and Hybrid Securities (unaffiliated) 37.4%
< 1yr 4.0% 6 mo US T-bill + Corp spread 0.50 yrs 21.00% 0.57% 0.80% 1.24% 2.63%
1 ‒ 5 yrs 16.1% 2.5 yr US T-note + Corp spread 2.50 yrs 21.00% 0.90% 1.56% 1.56% 2.77%
5 ‒ 10 yrs 13.5% 7.5 yr US T-note + Corp spread 7.50 yrs 21.00% 1.89% 2.62% 2.62% 2.62%
10 ‒ 20 yrs 2.1% 15 yr US T-note + Corp spread 15.00 yrs 21.00% 2.45% 3.13% 3.13% 3.13%
> 20 yrs 1.7% 20 yr US T-note + Corp spread 20.00 yrs 21.00% 2.70% 3.43% 3.43% 3.43%
Industrial and Hybrid Securities (affiliated) 0.2%
< 1yr 0.0% 6 mo US T-bill + Corp spread 0.50 yrs 5.25% 0.68% 0.97% 1.49% 3.16%
1 ‒ 5 yrs 0.1% 2.5 yr US T-note + Corp spread 2.50 yrs 5.25% 1.08% 1.87% 1.87% 3.32%
5 ‒ 10 yrs 0.0% 7.5 yr US T-note + Corp spread 7.50 yrs 5.25% 2.26% 3.15% 3.15% 3.15%
10 ‒ 20 yrs 0.0% 15 yr US T-note + Corp spread 15.00 yrs 5.25% 2.94% 3.76% 3.76% 3.76%
> 20 yrs 0.0% 20 yr US T-note + Corp spread 20.00 yrs 5.25% 3.23% 4.11% 4.11% 4.11%
Stocks, of which 11.4%
Preferred Stock 0.5% 5 year US T-note + 425 basis points 0.25 yrs 13.13% 4.23% 5.28% 5.88% 6.91%
Common Stock 10.9% 5 year US T-note + 850 basis points 0.25 yrs 18.42% 7.44% 8.42% 8.99% 9.95%
Mortgage Loans 2.4%
Real Estate 0.5%
Cash & Short-Term Investment 3.7% 3 month US T-bill 0.25 yrs 21.00% 0.04% 0.20% 0.75% 2.00%
All Other Assets* 7.6%
Post-Tax Return on Invested Funds, pre-Expense: 1.92% 2.62% 2.75% 3.46%
Investment Expense**: -0.18% -0.18% -0.18% -0.18%
Post-Tax Return on Invested Funds: 1.74% 2.44% 2.57% 3.28%
Table Notes:
(1) Government Direct Obligations include US Government Issuer Obligations and Non-US Government Issuer Obligations.
Collateralized Securities include Mortgage Backed, Loan Backed, or Structured Securities.
Tax-exempt Bonds include Issuer Obligations of US States, Territories, and Possessions, US Political Subdivisions of States, Territories, and Possessions,
and US Special Revenue and Special Assessment Obligations.
Industrial and Hybrid Securities (unaffiliated) include Industrial and Miscellaneous and Hybrid Securities.
Industrial and Hybrid Securities (affiliated) include Parents, Subsidiaries, and Affiliates.
(2) Bond and total portfolio distributions are 3-year averages for 2017-2019, calculated from annual editions of Best's Aggregates & Averages (Property-Casualty), Assets for Commercial Casualty
Composite, page number varies by edition, Column 3, Net Admitted Assets.
For each year 2017-2019, the maturity distribution pertains to all bonds owned as of December 31 at book/adjusted carrying value for Commercial Casualty Composite, Schedule D, Part 1A, Section 2.
(3) Spread to US treasury yields are either constant or varying by maturity (tax-exempt or corporate) as applicable.
The tax-exempt spread is a term structure of average historical spreads in forward rates at different maturities between US municipal bonds and US Treasuries.
Data on historical yields to US municipal bonds are from Bloomberg.
The corporate spread is a term structure of average historical spreads in forward rates at different maturities between US corporate bonds and US Treasuries.
Historical data on yields to US corporate bonds are from the US Department of Treasury.
(4) Applies only to the Dynamic estimate of the return on invested funds.
The roll-over period is the time interval at which the estimated yield is updated for the given security in the investment portfolio.
For bonds, the roll-over period is the bond's term to maturity. Forward yields for common and preferred stocks are updated quarterly.
(5) It is assumed that investment returns, except dividends and tax exempt municipal bond income, are taxed at 21%.
It is assumed that 50% of dividends received are tax exempt. In accordance with the "pro-ration" provision, it is assumed that
25% of otherwise exempt municipal bond income and dividends are taxed at 21%. For common stock, the portion of income attributable to capital appreciation is
assumed to equal 67.0% while the income portion is 33.0%. The percentages are obtained from Morningstar's Analyst Research Center,
SBBI Summary Statistics of Annual Returns: large company stocks, arithmetic mean.
(6) Static estimates of US Treasury yields are constant maturity yields from the first quarter of 2021.
(7)-(9) Applies only to the dynamic estimate of the return on invested funds. Forward estimates of US Treasury yields at various maturities are from Moody's.
* Yields to mortgage loans, real estate, and all other assets are not directly estimated, but are assumed to equal the weighted average portfolio yield net of these categories.
** Investment expense calculated from Annual Statement data for the Commercial Casualty Composite by dividing Total Investment Expense by Cash and Invested Assets.
Total investment expense for 2019 is from the Annual Statement, Exhibit of Net Investment Income.
Average cash and invested assets for 2018 and 2019 are from Best's Aggregates and Averages (Property-Casualty), Assets for Commercial Casualty Composite.
(1)
Post-tax Return
IRR Model Time (yrs)
Security Description
APPENDIX A: CALCULATION OF WEIGHTED AVERAGE COST OF CAPITAL AND RETURN ON INVESTMENTS (CONTINUED)
NATIONAL COUNCIL ON COMPENSATION INSURANCEINTERNAL RATE OF RETURN ANALYSIS
IOWA - VOLUNTARY
TABLE A.2 CALCULATION OF RETURN ON INVESTMENTS
© Copyright 2021 National Council on Compensation Insurance, Inc. All Rights Reserved.
Page 121 of 136

NATIONAL COUNCIL ON COMPENSATION INSURANCEINTERNAL RATE OF RETURN ANALYSIS
IOWA - VOLUNTARY
APPENDIX B: FEDERAL INCOME TAX INCURRED FROM INSURANCE OPERATIONS
Federal taxes on underwriting income, based on the Tax Cuts and Jobs Act of 2017, are calculated in the following tables on an annualbasis. Columns (1) through (4) are the same under both the Static and Dynamic Estimates; the paid losses and LAE factors (col (5)) varyby Estimate. Note that investment taxes are accounted for in Appendix A. Annual tax is prorated when quarterly amounts are required.
(1) (2) (3) (4) (5) (6) (7) (8) (9) (10)Written Unearned Expense Discount Paid AY1 Paid AY2 Paid Discounted Discounted Federal
Premium Premium and Taxes Factor Losses Losses Losses AY1 Unpaid AY2 Unpaid IncomeFactor Factor Factor and LAE and LAE and LAE Losses & LAE Losses & LAE Tax
Time Factor Factor Factor Factor Factor Factor0.00 - - - - - - - - - - 1.00 1.0000 0.4715 0.1536 0.8756 0.0967 0.0967 - 0.2385 - 0.0281 2.00 1.0000 - 0.2100 0.8600 0.3699 0.2291 0.1408 0.1205 0.1999 0.0209 3.00 1.0000 - 0.2100 0.8487 0.5109 0.2686 0.2423 0.0853 0.1091 0.0178 4.00 1.0000 - 0.2100 0.8332 0.5869 0.3059 0.2811 0.0527 0.0748 0.0159 5.00 1.0000 - 0.2100 0.8274 0.6275 0.3177 0.3098 0.0425 0.0494 0.0148 6.00 1.0000 - 0.2100 0.8219 0.6490 0.3279 0.3211 0.0339 0.0398 0.0141 7.00 1.0000 - 0.2100 0.8256 0.6600 0.3311 0.3289 0.0314 0.0330 0.0138 8.00 1.0000 - 0.2100 0.8344 0.6674 0.3350 0.3324 0.0285 0.0303 0.0134 9.00 1.0000 - 0.2100 0.8407 0.6726 0.3369 0.3357 0.0271 0.0279 0.0131
10.00 1.0000 - 0.2100 0.8602 0.6785 0.3404 0.3381 0.0247 0.0261 0.0127 11.00 1.0000 - 0.2100 0.8728 0.6844 0.3431 0.3413 0.0227 0.0240 0.0124 12.00 1.0000 - 0.2100 0.8856 0.6866 0.3434 0.3432 0.0228 0.0226 0.0122 13.00 1.0000 - 0.2100 0.8987 0.6918 0.3471 0.3447 0.0198 0.0217 0.0119 14.00 1.0000 - 0.2100 0.9121 0.6940 0.3469 0.3471 0.0203 0.0198 0.0117 15.00 1.0000 - 0.2100 0.9257 0.6984 0.3504 0.3481 0.0174 0.0192 0.0115 16.00 1.0000 - 0.2100 0.9395 0.7006 0.3503 0.3503 0.0177 0.0174 0.0114 17.00 1.0000 - 0.2100 0.9536 0.7029 0.3520 0.3509 0.0164 0.0172 0.0113 18.00 1.0000 - 0.2100 0.9679 0.7043 0.3523 0.3521 0.0164 0.0163 0.0111 19.00 1.0000 - 0.2100 0.9821 0.7073 0.3543 0.3529 0.0145 0.0157 0.0110 20.00 1.0000 - 0.2100 0.9848 0.7095 0.3550 0.3545 0.0140 0.0143 0.0110 21.00 1.0000 - 0.2100 0.9848 0.7125 0.3569 0.3556 0.0121 0.0133 0.0109 22.00 1.0000 - 0.2100 0.9848 0.7132 0.3565 0.3567 0.0125 0.0122 0.0109 23.00 1.0000 - 0.2100 0.9848 0.7161 0.3589 0.3573 0.0101 0.0117 0.0109 24.00 1.0000 - 0.2100 0.9848 0.7169 0.3582 0.3587 0.0108 0.0103 0.0109 25.00 1.0000 - 0.2100 0.9848 0.7206 0.3613 0.3593 0.0077 0.0097 0.0109 26.00 1.0000 - 0.2100 0.9848 0.7213 0.3603 0.3610 0.0087 0.0080 0.0109 27.00 1.0000 - 0.2100 0.9848 0.7235 0.3625 0.3610 0.0066 0.0080 0.0109 28.00 1.0000 - 0.2100 0.9848 0.7250 0.3625 0.3625 0.0065 0.0066 0.0109 29.00 1.0000 - 0.2100 0.9848 0.7257 0.3631 0.3627 0.0060 0.0064 0.0109 30.00 1.0000 - 0.2100 0.9848 0.7265 0.3633 0.3631 0.0057 0.0059 0.0109 31.00 1.0000 - 0.2100 0.9848 0.7287 0.3649 0.3638 0.0042 0.0052 0.0109 32.00 1.0000 - 0.2100 0.9848 0.7315 0.3662 0.3653 0.0029 0.0038 0.0109 33.00 1.0000 - 0.2100 0.9848 0.7340 0.3674 0.3666 0.0017 0.0025 0.0109 34.00 1.0000 - 0.2100 0.9848 0.7363 0.3685 0.3678 0.0006 0.0014 0.0109 35.00 1.0000 - 0.2100 0.9848 0.7383 0.3691 0.3691 - - 0.0109
Column Notes:(1) is Written Premium by time period, expressed as a factor, = Table 2 col (3)(2) is Written Premium minus Earned Premium by time period, expressed as a factor, = Table 2 col (3) - Table 2 col (2)(3) is Expenses and Taxes by time period, expressed as a factor, = Table 1 row (1) x Table 2 col (4)(4) is from Internal Revenue Bulletin 2020-49, Rev. Proc. 2020-48, dated November 30, 2020(5) is Paid Losses and LAE by time period, expressed as a factor, = Table 1 row (7, Static) x Table 2 col (5)(6) and (7) split the payments between the accident year coincident with the policy year ("AY1"), and the following accident year ("AY2"). Assuming that the payout pattern is linear between integer times, and that the average accident date for AY2 is two-thirds of a year later than the average accident date for AY1 , columns (6) and (7) are determined by solving these two equations simultaneously: Col (6) + Col (7) = Col (5) Col (7) = (2/3) * Col (6, previous row) + (1/3) * Col (6) with Col (6, Time 1) = Col (5, Time 1) and Col (6, Time 35) = Col (7, Time 35)(8) is the discounted difference between AY1 Losses and LAE that will ultimately be paid, and the amount already paid, = [col (6, Time 35) - (6)] x (4)(9) is the discounted difference between AY2 Losses and LAE that will ultimately be paid, and the amount already paid, = [col (7, Time 35) - (7)] x col (4, previous row)(10) Per IRS rules, federal income tax equals the tax rate (21%) times the adjusted underwriting income = 21% * { (1) - 0.8 * (2) - [ (3) + (5) + (8) + (9) ]}
TABLE B.1: FEDERAL INCOME TAX CALCULATION (STATIC ESTIMATE)
© Copyright 2021 National Council on Compensation Insurance, Inc. All Rights Reserved.
Page 122 of 136

NATIONAL COUNCIL ON COMPENSATION INSURANCEINTERNAL RATE OF RETURN ANALYSIS
IOWA - VOLUNTARY
APPENDIX B: FEDERAL INCOME TAX INCURRED FROM INSURANCE OPERATIONS (CONTINUED)
(1) (2) (3) (4) (5) (6) (7) (8) (9) (10)Written Unearned Expense Discount Paid AY1 Paid AY2 Paid Discounted Discounted Federal
Premium Premium and Taxes Factor Losses Losses Losses AY1 Unpaid AY2 Unpaid IncomeFactor Factor Factor and LAE and LAE and LAE Losses & LAE Losses & LAE Tax
Time Factor Factor Factor Factor Factor Factor0.00 - - - - - - - - - - 1.00 1.0000 0.4715 0.1536 0.8756 0.0987 0.0987 - 0.2435 - 0.0267 2.00 1.0000 - 0.2100 0.8600 0.3775 0.2338 0.1437 0.1230 0.2040 0.0180 3.00 1.0000 - 0.2100 0.8487 0.5215 0.2742 0.2473 0.0871 0.1114 0.0147 4.00 1.0000 - 0.2100 0.8332 0.5991 0.3122 0.2869 0.0538 0.0763 0.0128 5.00 1.0000 - 0.2100 0.8274 0.6405 0.3243 0.3162 0.0434 0.0504 0.0117 6.00 1.0000 - 0.2100 0.8219 0.6624 0.3346 0.3277 0.0346 0.0406 0.0110 7.00 1.0000 - 0.2100 0.8256 0.6737 0.3379 0.3357 0.0321 0.0337 0.0106 8.00 1.0000 - 0.2100 0.8344 0.6812 0.3419 0.3393 0.0291 0.0310 0.0102 9.00 1.0000 - 0.2100 0.8407 0.6865 0.3439 0.3426 0.0276 0.0285 0.0099
10.00 1.0000 - 0.2100 0.8602 0.6925 0.3474 0.3451 0.0252 0.0266 0.0096 11.00 1.0000 - 0.2100 0.8728 0.6985 0.3502 0.3484 0.0232 0.0244 0.0092 12.00 1.0000 - 0.2100 0.8856 0.7008 0.3505 0.3503 0.0233 0.0231 0.0090 13.00 1.0000 - 0.2100 0.8987 0.7061 0.3543 0.3518 0.0202 0.0221 0.0087 14.00 1.0000 - 0.2100 0.9121 0.7083 0.3541 0.3542 0.0207 0.0203 0.0086 15.00 1.0000 - 0.2100 0.9257 0.7129 0.3576 0.3553 0.0178 0.0196 0.0084 16.00 1.0000 - 0.2100 0.9395 0.7151 0.3575 0.3576 0.0181 0.0178 0.0082 17.00 1.0000 - 0.2100 0.9536 0.7174 0.3593 0.3581 0.0167 0.0175 0.0081 18.00 1.0000 - 0.2100 0.9679 0.7189 0.3595 0.3594 0.0167 0.0166 0.0079 19.00 1.0000 - 0.2100 0.9821 0.7219 0.3617 0.3602 0.0148 0.0160 0.0078 20.00 1.0000 - 0.2100 0.9848 0.7242 0.3623 0.3619 0.0143 0.0146 0.0078 21.00 1.0000 - 0.2100 0.9848 0.7272 0.3642 0.3629 0.0123 0.0136 0.0077 22.00 1.0000 - 0.2100 0.9848 0.7279 0.3638 0.3641 0.0127 0.0125 0.0077 23.00 1.0000 - 0.2100 0.9848 0.7309 0.3663 0.3646 0.0103 0.0119 0.0077 24.00 1.0000 - 0.2100 0.9848 0.7317 0.3656 0.3661 0.0110 0.0105 0.0077 25.00 1.0000 - 0.2100 0.9848 0.7355 0.3688 0.3667 0.0079 0.0099 0.0077 26.00 1.0000 - 0.2100 0.9848 0.7362 0.3678 0.3684 0.0089 0.0082 0.0077 27.00 1.0000 - 0.2100 0.9848 0.7385 0.3700 0.3685 0.0067 0.0081 0.0077 28.00 1.0000 - 0.2100 0.9848 0.7400 0.3700 0.3700 0.0067 0.0067 0.0077 29.00 1.0000 - 0.2100 0.9848 0.7407 0.3706 0.3702 0.0061 0.0065 0.0077 30.00 1.0000 - 0.2100 0.9848 0.7415 0.3708 0.3706 0.0058 0.0060 0.0077 31.00 1.0000 - 0.2100 0.9848 0.7437 0.3724 0.3714 0.0043 0.0053 0.0077 32.00 1.0000 - 0.2100 0.9848 0.7466 0.3738 0.3728 0.0030 0.0039 0.0077 33.00 1.0000 - 0.2100 0.9848 0.7492 0.3750 0.3742 0.0017 0.0026 0.0077 34.00 1.0000 - 0.2100 0.9848 0.7515 0.3761 0.3754 0.0007 0.0014 0.0077 35.00 1.0000 - 0.2100 0.9848 0.7535 0.3768 0.3768 - - 0.0077
Column Notes:(1) is Written Premium by time period, expressed as a factor, = Table 2 col (3)(2) is Written Premium minus Earned Premium by time period, expressed as a factor, = Table 2 col (3) - Table 2 col (2)(3) is Expenses and Taxes by time period, expressed as a factor, = Table 1 row (1) x Table 2 col (4)(4) is from Internal Revenue Bulletin 2020-49, Rev. Proc. 2020-48, dated November 30, 2020(5) is Paid Losses and LAE by time period, expressed as a factor, = Table 1 row (7, Dynamic) x Table 2 col (5)(6) and (7) split the payments between the accident year coincident with the policy year ("AY1"), and the following accident year ("AY2"). Assuming that the payout pattern is linear between integer times, and that the average accident date for AY2 is two-thirds of a year later than the average accident date for AY1 , columns (6) and (7) are determined by solving these two equations simultaneously: Col (6) + Col (7) = Col (5) Col (7) = (2/3) * Col (6, previous row) + (1/3) * Col (6) with Col (6, Time 1) = Col (5, Time 1) and Col (6, Time 35) = Col (7, Time 35)(8) is the discounted difference between AY1 Losses and LAE that will ultimately be paid, and the amount already paid, = [col (6, Time 35) - (6)] x (4)(9) is the discounted difference between AY2 Losses and LAE that will ultimately be paid, and the amount already paid, = [col (7, Time 35) - (7)] x col (4, previous row)(10) Per IRS rules, federal income tax equals the tax rate (21%) times the adjusted underwriting income = 21% * { (1) - 0.8 * (2) - [ (3) + (5) + (8) + (9) ]}
TABLE B.2: FEDERAL INCOME TAX CALCULATION (DYNAMIC ESTIMATE)
© Copyright 2021 National Council on Compensation Insurance, Inc. All Rights Reserved.
Page 123 of 136

NATIONAL COUNCIL ON COMPENSATION INSURANCEINTERNAL RATE OF RETURN ANALYSIS
IOWA - VOLUNTARY
APPENDIX C: RESERVE-TO-SURPLUS RATIO
(1) (2) (3) (4) (5) (6)Ratio excl. Ratio incl.Unearned Unearned
Unpaid Loss Premium PremiumYear Unpaid Adjustment Unearned Policyholder {(1)+(2)} {(1)+(2)End Losses Expense Premium Surplus /(4) +(3)}/(4)2019 201,634,477 45,253,873 88,025,958 177,424,154 1.39 1.892018 198,071,343 43,050,172 84,424,740 169,657,802 1.42 1.922017 194,692,095 42,696,647 77,537,150 171,664,964 1.38 1.832016 186,424,236 41,741,053 72,716,997 169,831,305 1.34 1.772015 185,919,427 42,816,231 73,469,477 169,017,203 1.35 1.79
2015 - 2019 966,741,578 215,557,976 396,174,322 857,595,428 1.38 1.84
Source: Columns (1) - (4) for the latest year are taken from Liabilities, Surplus and Other Fundsin Best's 2020 Aggregates & Averages, for Commercial Casualty Composite.
in 000's
Selected Ratio including Unearned Premium: 1.84
© Copyright 2021 National Council on Compensation Insurance, Inc. All Rights Reserved.
Page 124 of 136
Iowa
Workers Compensation Rate Filing – January 1, 2022
Appendix E – Calculation of Factor to Convert Voluntary Rates to Assigned Risk Rates
A factor of 1.250 is applied to the voluntary rates in order to convert to assigned risk rates. This factor is the proposed assigned risk differential in Iowa.
© Copyright 2021 National Council on Compensation Insurance, Inc. All Rights Reserved.
Page 125 of 136
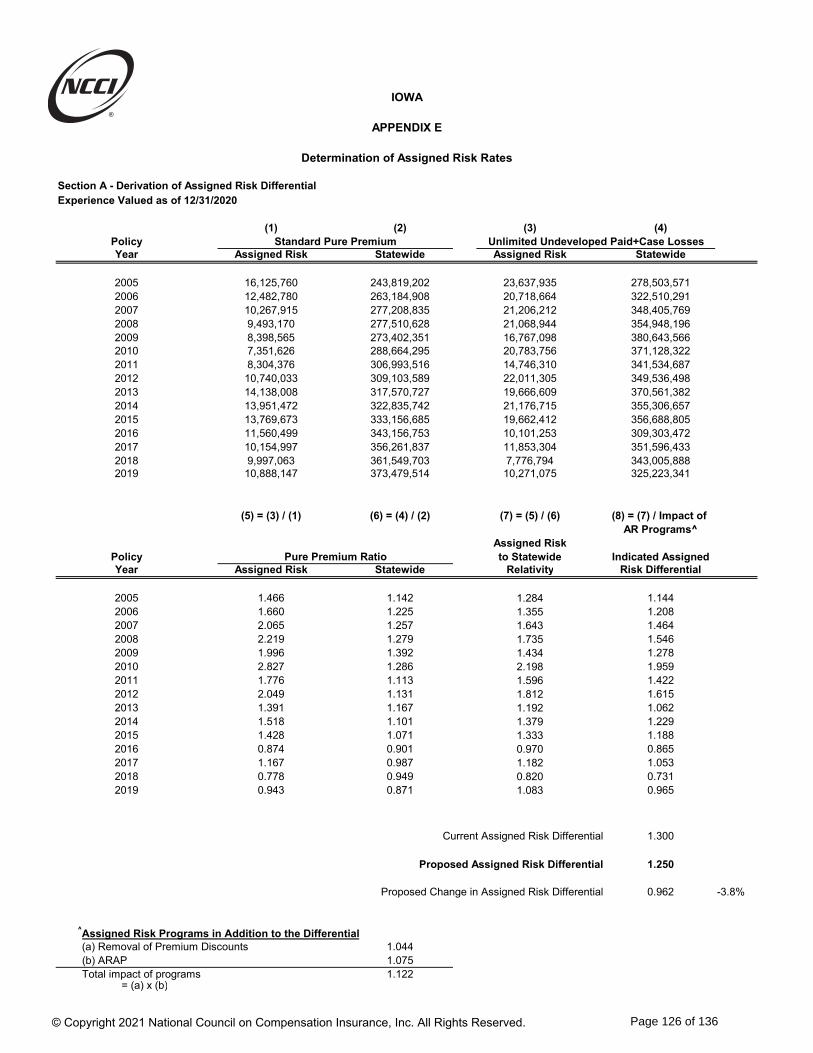
Section A - Derivation of Assigned Risk DifferentialExperience Valued as of 12/31/2020
(1) (2) (3) (4)PolicyYear Assigned Risk Statewide Assigned Risk Statewide
2005 16,125,760 243,819,202 23,637,935 278,503,5712006 12,482,780 263,184,908 20,718,664 322,510,2912007 10,267,915 277,208,835 21,206,212 348,405,7692008 9,493,170 277,510,628 21,068,944 354,948,1962009 8,398,565 273,402,351 16,767,098 380,643,5662010 7,351,626 288,664,295 20,783,756 371,128,3222011 8,304,376 306,993,516 14,746,310 341,534,6872012 10,740,033 309,103,589 22,011,305 349,536,4982013 14,138,008 317,570,727 19,666,609 370,561,3822014 13,951,472 322,835,742 21,176,715 355,306,6572015 13,769,673 333,156,685 19,662,412 356,688,8052016 11,560,499 343,156,753 10,101,253 309,303,4722017 10,154,997 356,261,837 11,853,304 351,596,4332018 9,997,063 361,549,703 7,776,794 343,005,8882019 10,888,147 373,479,514 10,271,075 325,223,341
(5) = (3) / (1) (6) = (4) / (2) (7) = (5) / (6) (8) = (7) / Impact ofAR Programs^
Assigned RiskPolicy to Statewide Indicated AssignedYear Assigned Risk Statewide Relativity Risk Differential
2005 1.466 1.142 1.284 1.1442006 1.660 1.225 1.355 1.2082007 2.065 1.257 1.643 1.4642008 2.219 1.279 1.735 1.5462009 1.996 1.392 1.434 1.2782010 2.827 1.286 2.198 1.9592011 1.776 1.113 1.596 1.4222012 2.049 1.131 1.812 1.6152013 1.391 1.167 1.192 1.0622014 1.518 1.101 1.379 1.2292015 1.428 1.071 1.333 1.1882016 0.874 0.901 0.970 0.8652017 1.167 0.987 1.182 1.0532018 0.778 0.949 0.820 0.7312019 0.943 0.871 1.083 0.965
Current Assigned Risk Differential 1.300
Proposed Assigned Risk Differential 1.250
Proposed Change in Assigned Risk Differential 0.962 -3.8%
^Assigned Risk Programs in Addition to the Differential(a) Removal of Premium Discounts 1.044(b) ARAP 1.075
Total impact of programs 1.122= (a) x (b)
Pure Premium Ratio
Standard Pure Premium Unlimited Undeveloped Paid+Case Losses
APPENDIX E
Determination of Assigned Risk Rates
IOWA
© Copyright 2021 National Council on Compensation Insurance, Inc. All Rights Reserved.
Page 126 of 136

Iowa
Workers Compensation Rate Filing – January 1, 2022
Appendix F – Derivation of Experience Rating Values
1. Expected Loss Rate (ELR) factors
An expected loss rate for a classification is used to estimate the expected losses per $100 of payroll during the experience rating period for risks within that classification. These expected losses are then compared with the actual losses of a risk during the experience rating period to determine the experience modification (mod).
The actual losses reflect the loss data during the experience rating period. Expected losses and actual losses must be at the same level to enable an appropriate comparison for purposes of the experience mod calculation. As such, the pure premiums underlying the proposed rates are adjusted to reflect the average loss levels of the proposed experience rating period. This is accomplished through the application of ELR factors to the proposed underlying pure premiums. These ELR factors, calculated by hazard group, remove the effects of the following: loss development, expected losses above the State Accident Limit, a portion of medical-only losses, benefit changes, trend, loss-based expenses, experience, and assigned risk programs.
An adjustment is made to the ELR factors so that the resulting ELRs produce an expected experience rating off-balance that equals the targeted experience rating off-balance used in the calculation of the overall rate level change for the state (Appendix A–I). Although considered, no explicit adjustment was applied to account for possible indirect effects of the COVID-19 pandemic.
The final ELR for each classification is calculated as follows:
ELR = {(Hazard Group indemnity ELR factor) x (indemnity pure premium) +
(Hazard Group medical ELR factor) x (medical pure premium)} x Manual/Standard Ratio
2. Discount Ratio (D-Ratio) factors
In experience rating, losses are divided into primary and excess portions. For each claim, losses below the split point are primary losses, while losses above the split point are excess losses. The D-ratio represents the estimated ratio of expected primary losses to expected total losses for a classification. The D-ratio is used to determine the expected primary losses to be used in the experience mod calculation.
D-ratio factors are calculated separately for indemnity and medical losses by hazard group and are based on the latest three years of Unit Statistical data. A comparison of the resulting D-ratio factors across hazard groups is done to ensure that the factors monotonically decrease from
© Copyright 2021 National Council on Compensation Insurance, Inc. All Rights Reserved.
Page 127 of 136

Iowa
Workers Compensation Rate Filing – January 1, 2022
Appendix F – Derivation of Experience Rating Values
hazard group A to hazard group G. If they do not, an adjustment is made by averaging the D-ratios over adjacent hazard groups.
The final D-ratio for each classification is calculated as follows:
D-ratio = {(HG indemnity D-ratio factor) x (indemnity pure premium) +
(HG medical D-ratio factor) x (medical pure premium)} / total pure premium
3. Additional experience rating values
Table of Weighting Values
The Weighting Value (W) determines how much actual excess and expected excess losses will enter the experience modification formula. The weighting value increases as expected losses increase with larger insureds receiving a larger weighting value. The weighting value for various levels of expected losses is provided in the Table of Weighting Values. The table is updated based on the state reference point, which is updated with Unit Statistical data each experience filing.
The state reference point is calculated as the state average cost per case for the experience rating period multiplied by 250. The state reference point serves to determine how much credibility to give to the losses of an individual risk and as an index of claim cost differences by state. The state per claim accident limitation shown on the Table of Weighting Values is 10% of the state reference point.
Table of Ballast Values
The Ballast Value (B) is a stabilizing value designed to limit the effect of any actual loss experience on the experience rating modification. It is added to both the numerator and denominator of the mod calculation and increases as expected losses increase. The ballast value for various levels of expected loss ranges is provided in the Table of Ballast Values. The table is updated based on the state reference point, which is updated with Unit Statistical data.
The G value used in the ballast formula is the state reference point / 250,000, rounded to the nearest 0.05.
© Copyright 2021 National Council on Compensation Insurance, Inc. All Rights Reserved.
Page 128 of 136

Iowa
Workers Compensation Rate Filing – January 1, 2022
Part 4 Additional Information
- Definitions
- NCCI Affiliate List - Key Contacts
© Copyright 2021 National Council on Compensation Insurance, Inc. All Rights Reserved.
Page 129 of 136

Iowa
Workers Compensation Rate Filing – January 1, 2022
Definitions
Accident Year (AY): A loss accounting definition in which experience is summarized by the calendar year in which an accident occurred. Calendar Year (CY):
1. The 12-month period beginning January 1 and ending December 31. 2. Method of accounting for all financial transactions occurring during a specific year.
Case Reserves: Reserves that an insurance company establishes for specific (known) claims. DSR Level Premium: The standard earned premium that would result if business were written at NCCI state-approved loss costs or rates instead of at the company rates. It is the common benchmark level at which carriers report premium on the Financial Calls. Frequency: The number of lost-time claims per million dollars of on-leveled, wage-adjusted premium. Incurred Claim Count: The total of all claims reported, whether open or closed, as of a given valuation date. An indemnity claim is associated with a payment or case reserve for an indemnity loss (i.e., lost work time-related benefits) and excludes claims closed without an indemnity payment. Lost-time Claims: Claims where an injured employee has received wage replacement benefits due to a compensable workplace injury. Limited Losses: Losses that result after the application of NCCI's large loss procedure—in which individual large claims are limited to jurisdiction and year-specific large loss thresholds. On-Level Factor: Applied to historical premiums and losses to adjust the historical experience to reflect approved loss cost/rate level changes as well as statutory benefit level changes implemented since that time. Paid+Case Losses: The sum of paid losses and case reserves. Also known as “case incurred losses.” Paid Losses: Losses that an insurance company has paid as a result of claim activity. Policy Year:
The one-year period beginning with the effective date or anniversary of a policy. A premium and loss accounting definition in which experience is summarized for all
policies with effective dates in a given calendar year period. Severity: The average cost per case (claim) calculated as ultimate losses divided by ultimate lost-time claim counts.
© Copyright 2021 National Council on Compensation Insurance, Inc. All Rights Reserved.
Page 130 of 136

Iowa
Workers Compensation Rate Filing – January 1, 2022
Definitions
Ultimate Development Factor: For an aggregation of data, an estimate of the development that will occur between the data's current valuation date and the time when all claims are closed. Unlimited Losses: Losses that have not been limited to jurisdiction and year-specific large loss thresholds as part of NCCI's large loss procedure. Valuation Date: The date that premiums and losses are evaluated for reporting purposes. Premiums and losses may change over time from initial estimates to final values. Therefore, interim snapshots have associated valuation dates. Wage Level Adjustment Factor: The ratio of the average workers’ wages during the most recent time period to the average workers’ wages during a historical time period.
© Copyright 2021 National Council on Compensation Insurance, Inc. All Rights Reserved.
Page 131 of 136

Iowa
Workers Compensation Rate Filing – January 1, 2022
NCCI Affiliate List
A M C O INSURANCE COMPANY BEARING MIDWEST CASUALTY COMPANY
ACADIA INSURANCE COMPANY BENCHMARK INSURANCE COMPANY
ACCIDENT FUND GENERAL INS CO BERKLEY CASUALTY COMPANY
ACCIDENT FUND INS CO OF AMERICA BERKLEY INSURANCE COMPANY
ACCIDENT FUND NATIONAL INS CO BERKLEY NATIONAL INSURANCE COMPANY
ACCREDITED SURETY AND CASUALTY CO INC BERKLEY REGIONAL INS CO
ACE AMERICAN INSURANCE COMPANY BERKSHIRE HATHAWAY DIRECT INSURANCE COMPANY
ACE FIRE UNDERWRITERS INSURANCE COMPANY BERKSHIRE HATHAWAY HOMESTATE INS CO
ACE PROPERTY & CASUALTY INSURANCE COMPANY BITCO GENERAL INSURANCE CORPORATION
ACIG INS CO BITCO NATIONAL INSURANCE COMPANY
ACUITY A MUTUAL INS COMPANY BLACKBOARD INSURANCE COMPANY
ADDISON INSURANCE COMPANY BRICKSTREET MUTUAL INS CO
AIG ASSURANCE COMPANY BROTHERHOOD MUTUAL INS CO
AIG PROPERTY CASUALTY COMPANY CALIFORNIA INSURANCE COMPANY
AIU INSURANCE CO (NATIONAL UNION FIRE OF PITTS PA) CAPITOL INDEMNITY CORP
AK NATIONAL INS CO CAROLINA CASUALTY INS CO
ALLIED EASTERN IND CO CELINA MUTUAL INS CO
ALLIED INSURANCE COMPANY OF AMERICA CHARTER OAK FIRE INS CO
ALLIED PROPERTY AND CASUALTY INS CO CHEROKEE INS CO
ALLMERICA FINANCIAL ALLIANCE INS CO CHIRON INSURANCE COMPANY
ALLMERICA FINANCIAL BENEFIT INS CO CHUBB INDEMNITY INS CO
AMERICAN ALTERNATIVE INSURANCE CORPORATION CHUBB NATIONAL INS CO
AMERICAN AUTOMOBILE INSURANCE CO CHURCH MUTUAL INS CO, S.I.
AMERICAN BUSINESS AND MERCANTILE INS MUTUAL INC CIMARRON INSURANCE COMPANY INC
AMERICAN CASUALTY COMPANY OF READING P A CINCINNATI CASUALTY COMPANY
AMERICAN COMPENSATION INS CO CINCINNATI INDEMNITY COMPANY
AMERICAN ECONOMY INS CO CINCINNATI INS CO
AMERICAN FAMILY HOME INS CO CITIZENS INS CO OF AMERICA
AMERICAN FAMILY INS CO CLARENDON NATIONAL INSURANCE CO (SUSSEX INS CO)
AMERICAN FAMILY MUTUAL INSURANCE COMPANY, S.I. CLEAR SPRING PROPERTY AND CASUALTY COMPANY
AMERICAN FIRE AND CASUALTY CO CLERMONT INS CO
AMERICAN GUARANTEE AND LIABILITY INS CO COLONIAL AMERICAN CASUALTY & SURETY CO
AMERICAN HOME ASSUR CO-NATIONAL UNION FIRE OF PIT COLUMBIA MUTUAL INSURANCE CO
AMERICAN INS CO COLUMBIA NATIONAL INS CO
AMERICAN INTERSTATE INS CO COMMERCE AND INDUSTRY INS CO
AMERICAN LIBERTY INSURANCE CO CONSOLIDATED INS CO
AMERICAN MODERN HOME INS CO CONTINENTAL CASUALTY CO
AMERICAN NATIONAL PROPERTY AND CASUALTY CO CONTINENTAL INDEMNITY CO
AMERICAN SELECT INS CO CONTINENTAL INS CO
AMERICAN STATES INS CO A SAFECO COMPANY CONTINENTAL WESTERN INSURANCE COMPANY
AMERICAN ZURICH INS CO COREPOINTE INSURANCE COMPANY
AMERISURE INS CO CRESTBROOK INS CO
AMERISURE MUTUAL INS CO CRUM AND FORSTER INDEMNITY CO
AMERISURE PARTNERS INS CO DAKOTA TRUCK UNDERWRITERS
AMGUARD INS CO DEPOSITORS INS CO
AMTRUST INSURANCE CO DIAMOND INS CO
ARCH INDEMNITY INSURANCE COMPANY DISCOVER PROPERTY & CASUALTY INS CO
ARCH INSURANCE COMPANY DONEGAL MUTUAL INS CO
ARCH PROPERTY CASUALTY INS CO EASTERN ADVANTAGE ASSURANCE COMPANY
ARGONAUT GREAT CENTRAL INS CO EASTERN ALLIANCE INSURANCE COMPANY
ARGONAUT INS CO EASTGUARD INS CO
ARGONAUT MIDWEST INS CO ELECTRIC INS CO
ASSOCIATED INDEMNITY CORP EMC PROPERTY & CASUALTY COMPANY
ASSOCIATION CASUALTY INS CO EMCASCO INS CO
ATLANTIC SPECIALTY INS CO (INTACT ) EMPLOYERS ASSURANCE COMPANY
ATLANTIC STATES INS CO EMPLOYERS COMPENSATION INS CO
AUSTIN MUTUAL INSURANCE COMPANY EMPLOYERS INS CO OF WAUSAU
AUTO OWNERS INS CO EMPLOYERS INSURANCE COMPANY OF NEVADA
BADGER MUTUAL INS CO EMPLOYERS MUTUAL CASUALTY CO
BANKERS STANDARD INS CO EMPLOYERS PREFERRED INS CO
© Copyright 2021 National Council on Compensation Insurance, Inc. All Rights Reserved.
Page 132 of 136

Iowa
Workers Compensation Rate Filing – January 1, 2022
NCCI Affiliate List
ENDURANCE AMERICAN INS CO HARLEYSVILLE PREFERRED INSURANCE CO
ENDURANCE ASSURANCE CORPORATION HARLEYSVILLE WORCESTER INSURANCE CO
EVEREST DENALI INSURANCE COMPANY HARTFORD ACCIDENT AND INDEMNITY CO
EVEREST NATIONAL INS CO HARTFORD CASUALTY INS CO
EVEREST PREMIER INSURANCE COMPANY HARTFORD FIRE INSURANCE CO
EVEREST REINSURANCE CO DIRECT HARTFORD INS CO OF IL
EXECUTIVE RISK INDEMNITY INC HARTFORD INS CO OF MIDWEST
EXPLORER INS CO HARTFORD INS CO OF THE SOUTHEAST
FALLS LAKE NATIONAL INSURANCE CO HARTFORD UNDERWRITERS INS CO
FARM BUREAU PROPERTY & CASUALTY INS CO HASTINGS MUTUAL INS CO
FARMERS AUTOMOBILE INS ASSN HAWKEYE-SECURITY INS CO
FARMERS INSURANCE EXCHANGE HDI GLOBAL INSURANCE COMPANY
FARMINGTON CASUALTY COMPANY HORIZON MIDWEST CASUALTY COMPANY
FEDERAL INSURANCE COMPANY IA AMERICAN INS CO
FEDERATED MUTUAL INS CO IA LONG TERM CARE RISK MGMT ASSN
FEDERATED RESERVE INSURANCE CO IA MUTUAL INS CO
FEDERATED RURAL ELECTRIC INS EXCHANGE IL EMCASCO INS CO
FEDERATED SERVICE INS CO ILLINOIS CASUALTY COMPANY
FIDELITY & DEPOSIT COMPANY OF MARYLAND ILLINOIS INSURANCE COMPANY
FIDELITY & GUARANTY INS UNDERWRITERS ILLINOIS NATIONAL INSURANCE COMPANY
FIDELITY & GUARANTY INSURANCE CO IMPERIUM INSURANCE COMPANY
FIRE INS EXCHANGE IMT INS CO
FIREMANS FUND INSURANCE CO INCLINE CASUALTY COMPANY
FIREMENS INS CO OF WASHINGTON DC INDEMNITY INS CO OF N AMERICA (INA INS) (CT GEN)
FIRST DAKOTA INDEMNITY CO INDIANA INSURANCE COMPANY
FIRST LIBERTY INS CORP INS CO OF NORTH AMERICA
FIRST NATIONAL INS CO OF AMERICA INS CO OF THE STATE PA
FIRSTCOMP INSURANCE CO INS CO OF THE WEST
FLORISTS MUTUAL INSURANCE CO INTEGRITY INSURANCE COMPANY
FOREMOST INS CO GRAND RAPIDS MICHIGAN INTEGRITY PROPERTY & CASUALTY INS CO
FOREMOST PROPERTY & CAS INS INTEGRITY SELECT INSURANCE COMPANY
FOREMOST SIGNATURE INS CO INTREPID INSURANCE COMPANY
FRANK WINSTON CRUM INSURANCE CO KEY RISK INS CO
GENERAL CASUALTY COMPANY OF WISCONSIN LACKAWANNA AMERICAN INS CO
GENERAL CASUALTY INSURANCE COMPANY LACKAWANNA CASUALTY CO
GENERAL INS CO OF AMERICA LACKAWANNA NATIONAL INS CO
GENESIS INS CO LAFAYETTE INS CO
GRANITE STATE INSURANCE COMPANY LIBERTY INS CORP
GRAPHIC ARTS MUTUAL INS CO LIBERTY INSURANCE UNDERWRITERS INC
GRAY INSURANCE COMPANY LIBERTY MUTUAL FIRE INS CO
GREAT AMERICAN ALLIANCE INS CO LIBERTY MUTUAL INS CO
GREAT AMERICAN ASSURANCE COMPANY LM INS CORP
GREAT AMERICAN INS CO OF NY MA BAY INS CO
GREAT AMERICAN INSURANCE COMPANY MAG MUTUAL INS CO
GREAT AMERICAN SPIRIT INS CO MANUFACTURERS ALLIANCE INS CO
GREAT DIVIDE INSURANCE COMPANY MARKEL AMERICAN INSURANCE CO
GREAT MIDWEST INS CO MARKEL INSURANCE CO
GREAT NORTHERN INS CO MEMIC INDEMNITY CO
GREAT WEST CASUALTY COMPANY MERIDIAN SECURITY INSURANCE COMPANY
GREATER NY MUTUAL INS CO MID CENTURY INS CO
GREENWICH INS CO MIDDLESEX INS CO
GRINNELL MUTUAL REINSURANCE CO MIDVALE INDEMNITY COMPANY
GRINNELL SELECT INS CO MIDWEST BUILDERS CASUALTY MUTUAL COMPANY
GUIDEONE ELITE INS CO MIDWEST EMPLOYERS CASUALTY CO
GUIDEONE INSURANCE COMPANY MIDWEST FAMILY ADVANTAGE INSURANCE CO
GUIDEONE SPECIALTY INSURANCE COMPANY MIDWEST FAMILY MUTUAL INS CO
HANOVER AMERICAN INS CO MIDWEST INS CO
HANOVER INS CO MIDWESTERN INDEMNITY CO
HARLEYSVILLE INSURANCE COMPANY MILBANK INSURANCE COMPANY
HARLEYSVILLE LAKE STATES INSURANCE COMPANY MILFORD CASUALTY INSURANCE CO
© Copyright 2021 National Council on Compensation Insurance, Inc. All Rights Reserved.
Page 133 of 136

Iowa
Workers Compensation Rate Filing – January 1, 2022
NCCI Affiliate List
MITSUI SUMITOMO INS CO OF AMERICA PREFERRED EMPLOYERS INS CO
MITSUI SUMITOMO INS USA INC PREFERRED PROFESSIONAL INSURANCE COMPANY
MOTORISTS COMMERCIAL MUTUAL INSURANCE COMPANY PREVISOR INSURANCE COMPANY
NATIONAL AMERICAN INS CO PROPERTY AND CASUALTY INS CO OF HARTFORD
NATIONAL CASUALTY CO PROSELECT INSURANCE COMPANY
NATIONAL FIRE INS CO OF HARTFORD PROTECTIVE INS CO
NATIONAL INTERSTATE INS CO QBE INSURANCE CORPORATION
NATIONAL LIABILITY & FIRE INSURANCE CO REDWOOD FIRE & CASUALTY INS CO
NATIONAL SPECIALTY INS CO REGENT INSURANCE COMPANY
NATIONAL SURETY CORP REPUBLIC INDEMNITY COMPANY OF AMERICA
NATIONAL UNION FIRE INS CO OF PITTSBURGH PA RIVERPORT INSURANCE COMPANY
NATIONWIDE AGRIBUSINESS INS CO RLI INSURANCE COMPANY
NATIONWIDE ASSURANCE CO ROCKWOOD CASUALTY INS CO
NATIONWIDE GENERAL INSURANCE CO RURAL TRUST INSURANCE COMPANY
NATIONWIDE INS CO OF AMERICA SAFECO INS CO OF AMERICA
NATIONWIDE MUTUAL FIRE INS CO SAFETY FIRST INS CO
NATIONWIDE MUTUAL INS CO SAFETY NATIONAL CASUALTY CORP
NATIONWIDE PROPERTY AND CASUALTY INS CO SAGAMORE INSURANCE CO
NETHERLANDS INSURANCE COMPANY SAMSUNG FIRE AND MARINE INS CO LTD USB
NEW HAMPSHIRE INSURANCE COMPANY SECURA INSURANCE COMPANY
NEW YORK MARINE AND GENERAL INSURANCE CO SECURA SUPREME INS CO
NHRMA MUTUAL INSURANCE COMPANY SECURITY NATIONAL INS CO (AMTRUST GROUP)
NORGUARD INS CO SELECTIVE INS CO OF SC
NORTH AMERICAN ELITE INSURANCE CO SELECTIVE INS CO OF THE SOUTHEAST
NORTH AMERICAN SPECIALTY INS CO SELECTIVE INSURANCE COMPANY OF AMERICA
NORTH POINTE INS CO SELECTIVE WAY INS CO
NORTH RIVER INS CO SENTINEL INS CO
NORTHSTONE INSURANCE COMPANY SENTRY CASUALTY CO
NOVA CASUALTY COMPANY SENTRY INS CO
OAK RIVER INSURANCE COMPANY SENTRY SELECT INSURANCE COMPANY
OBI AMERICA INSURANCE COMPANY SEQUOIA INSURANCE CO
OBI NATIONAL INSURANCE COMPANY SERVICE AMERICAN INDEMNITY COMPANY
OH CASUALTY INS CO SERVICE LLOYDS INSURANCE CO
OH FARMERS INS CO SFM MUTUAL INS CO
OHIO SECURITY INS CO SFM SAFE INSURANCE COMPANY
OLD GUARD INSURANCE COMPANY SFM SELECT INSURANCE COMPANY
OLD REPUBLIC GENERAL INSURANCE CORPORATION SIRIUS AMERICA INSURANCE COMPANY
OLD REPUBLIC INS CO SOCIETY INSURANCE A MUTUAL COMPANY
OWNERS INSURANCE COMPANY SOMPO AMERICA FIRE & MARINE INSURANCE COMPANY
PA MANUFACTURERS ASSN INS CO SOMPO AMERICA INSURANCE COMPANY
PA MANUFACTURERS INDEMNITY CO SOUTHERN INS CO
PA NATIONAL MUTUAL CAS INS CO SPARTA INSURANCE COMPANY
PACIFIC EMPLOYERS INS CO ST PAUL FIRE AND MARINE INS CO
PACIFIC INDEMNITY CO ST PAUL GUARDIAN INS CO
PACIFIC INS CO LTD ST PAUL MERCURY INS CO
PARTNERS MUTUAL INS CO ST PAUL PROTECTIVE INS CO
PATRONS MUTUAL INS CO OF CT STANDARD FIRE INSURANCE COMPANY
PEERLESS INDEMNITY INS CO STAR INS CO
PEERLESS INSURANCE COMPANY STARNET INSURANCE COMPANY
PEKIN INS CO STARR INDEMNITY AND LIABILITY CO
PENN MILLERS INS CO STARR SPECIALTY INSURANCE COMPANY
PENNSYLVANIA INSURANCE COMPANY STARSTONE NATIONAL INSURANCE COMPANY
PETROLEUM CASUALTY CO STATE AUTO PROPERTY AND CASUALTY INS CO
PHARMACISTS MUTUAL INS CO STATE AUTOMOBILE MUTUAL INS CO
PHOENIX INS CO STATE FARM FIRE AND CASUALTY CO
PINNACLE NATIONAL INSURANCE COMPANY STATE NATIONAL INSURANCE COMPANY
PINNACLEPOINT INSURANCE COMPANY STONINGTON INS CO
PIONEER SPECIALTY INSURANCE COMPANY SUMMITPOINT INSURANCE COMPANY
PLAZA INSURANCE CO SUNZ INSURANCE COMPANY
PRAETORIAN INSURANCE COMPANY T H E INSURANCE COMPANY
© Copyright 2021 National Council on Compensation Insurance, Inc. All Rights Reserved.
Page 134 of 136

Iowa
Workers Compensation Rate Filing – January 1, 2022
NCCI Affiliate List
TECHNOLOGY INSURANCE CO ZNAT INS CO
THE TRAVELERS CASUALTY COMPANY ZURICH AMERICAN INS CO
TNUS INSURANCE CO ZURICH AMERICAN INS CO OF IL
TOKIO MARINE AMERICA INSURANCE CO
TRANS PACIFIC INS CO
TRANSGUARD INS CO OF AMERICA INC
TRANSPORTATION INS CO
TRAVELERS CASUALTY AND SURETY CO
TRAVELERS CASUALTY INS CO OF AMERICA
TRAVELERS INDEMNITY CO
TRAVELERS INDEMNITY CO OF AMERICA
TRAVELERS INDEMNITY CO OF CT
TRAVELERS INSURANCE CO
TRAVELERS PROPERTY CASUALTY CO OF AMERICA
TRI STATE INSURANCE COMPANY OF MINNESOTA
TRIANGLE INSURANCE COMPANY INC
TRIUMPHE CASUALTY COMPANY
TRUCK INSURANCE EXCHANGE
TRUMBULL INS CO
TWIN CITY FIRE INS CO
UNION INS CO OF PROVIDENCE
UNION INSURANCE COMPANY
UNITED FIRE AND CASUALTY CO
UNITED STATES FIDELITY AND GUARANTY CO
UNITED WI INS CO
UNIVERSAL UNDERWRITERS INS CO
US FIRE INS CO
UTICA MUTUAL INS CO
VALLEY FORGE INS CO
VANLINER INS CO
VANTAPRO SPECIALTY INS CO
VICTORIA FIRE & CASUALTY COMPANY
VIGILANT INS CO
WADENA INSURANCE COMPANY
WASHINGTON INTERNATIONAL INSURANCE COMPANY
WAUSAU BUSINESS INSURANCE COMPANY
WAUSAU UNDERWRITERS INSURANCE COMPANY
WCF NATIONAL INSURANCE COMPANY
WELLFLEET INSURANCE COMPANY
WELLFLEET NEW YORK INSURANCE COMPANY
WESCO INSURANCE COMPANY (AMTRUST GROUP)
WEST AMERICAN INS CO
WEST BEND MUTUAL INS CO
WESTCHESTER FIRE INSURANCE COMPANY
WESTERN AGRICULTURAL INS CO
WESTERN NATIONAL ASSURANCE CO
WESTERN NATIONAL MUTUAL INS CO
WESTFIELD CHAMPION INSURANCE COMPANY
WESTFIELD INS CO
WESTFIELD NATIONAL INS CO
WESTFIELD PREMIER INSURANCE COMPANY
WESTFIELD SUPERIOR INSURANCE COMPANY
WESTFIELD TOUCHSTONE INSURANCE COMPANY
WESTPORT INSURANCE CORPORATION
WILLIAMSBURG NATIONAL INS CO
WORK FIRST CASUALTY CO
XL INS CO OF NY INC
XL INSURANCE AMERICA INC
XL SPECIALTY INS CO
ZENITH INS CO
© Copyright 2021 National Council on Compensation Insurance, Inc. All Rights Reserved.
Page 135 of 136

Iowa
Workers Compensation Rate Filing – January 1, 2022
Key Contacts
Dan Nelson, MCM, WCPState Relations Executive
Regulatory Division National Council on Compensation Insurance, Inc. (NCCI)
901 Peninsula Corporate Circle Boca Raton, FL 33487-1362
Phone: (561) 893-3784 Fax (561) 893-5472
Dan Benzshawel, FCAS, MAAA Director and Actuary
Actuarial and Economic Services Division National Council on Compensation Insurance, Inc. (NCCI)
901 Peninsula Corporate Circle Boca Raton, FL 33487-1362
Phone (561) 893-3093 Fax (561) 893-5310
All NCCI employees can be contacted via e-mail using the following format:
First Name_Last [email protected]
© Copyright 2021 National Council on Compensation Insurance, Inc. All Rights Reserved. Page 136 of 136


![[FRESH (FOR ADMISSION) - CIVIL CASES] · arun kumar ia no.72426/2020-condonation of delay in filing and ia no.72427/2020-exemption from filing o.t. 12 slp(crl) no. 2737/2020 ii-b](https://static.fdocuments.net/doc/165x107/6088662c54d3d346bd45aad2/fresh-for-admission-civil-cases-arun-kumar-ia-no724262020-condonation-of.jpg)


![[FRESH (FOR ADMISSION) - CIVIL CASES]for admission and i.r. and ia no.10896/2021-exemption from filing c/c of the impugned judgment and ia no.10897/2021-exemption from filing o.t.](https://static.fdocuments.net/doc/165x107/611520adeda38d66b853cc34/fresh-for-admission-civil-cases-for-admission-and-ir-and-ia-no108962021-exemption.jpg)


