
I41 Dofwmc nadonae - Crypto Museum
71
AD-A266 481 4 Nadonal Wefen I41 Dofwmc nadonae EMP HARDENING INVESTIGATION OF THE PRC-77 RADIO SET by J.S. Seregelyi, C. Gardner, J.A. Walsh and 1L Apps JUL 0 6 1993 lk 93-15159 DEFENCE RESEARCH ESTABLISHMENT OTTAWA REPORT NO. 1167 February 1993 Canadg Ottawa
Transcript of I41 Dofwmc nadonae - Crypto Museum
AD-A266 481 4Nadonal WefenI41 Dofwmc nadonae
EMP HARDENING INVESTIGATIONOF THE PRC-77 RADIO SET
by
J.S. Seregelyi, C. Gardner, J.A. Walsh and 1L Apps
JUL 0 6 1993 lk
93-15159
DEFENCE RESEARCH ESTABLISHMENT OTTAWAREPORT NO. 1167
February 1993Canadg Ottawa

National D496,190Defence naonale
EMP HARDENING INVESTIGATIONOF THE PRC-77 RADIO SET
by
J.S. Seregelyi, C. Gardner, J.A Walsh and R. AppsRadiation Effects Section
Electronics Division
DEFENCE RESEARCH ESTABLISHMENT OTTAWAREPORT NO. 1167
PCN Februar 1993041 LT Ottwa
ABSTRACT
The susceptibility of a PRC-77 Radio to a simulated nuclear electromagnetic pulse (EMP) wasinvestigated. Detailed evaluation procedures and results are presented. It is shown that under normaloperating conditions, with either the 72-cm or 2.9-m antenna, it is very unlikely that there will be any damageto the radio in the event of an EMP. It should be noted that this was one of the first evaluations performedin the Defence Riesearch Electrom._agnetic Pulse _$imulator (DREMPS) and the investigation was viewedprimarily as a means of optimizing general analysis techniques.
RtSUME
Ce rapport analyse la susceptibilit6 du radio PRC-77 aux impulsions 6lectromagn6tiques (IEM)simul6es. Une 6tude d6taill6e des proc~dures d'6valuation et des r6sultats est pr~sent6e. II est d6montreque sous des conditions normales d'op6ration, avec une antenne de 72 cm ou de 2.9 m, ii est peu probableque le radio soft endommag6 par les impulsions. Cette 6valuation a 6t6 l'une des premieres A utiliser lesimulateur d'IEM de 10 m duCRDO et elle doit aussi 6tre consid6rde comme un exercice pour optimiserles techniques d'analyse.
AOeession For
NTTS GRA&IDTIC TAB C3Uran!'an c ed C1Just Ifficzer I on-
Dist specalon

EXECUTIVE SUMMARY
The purpose of this investigation was to determine the susceptibility of the PRC-77 Radio to theelectromagnetic fields produced by a nuclear electromagnetic pulse (EMP). In addition, this was one of thefirst evaluations performed in the Qefence Research Electromagnetic Pulse ._imulator (DREMPS) and wasviewed as a means of optimizing general analysis techniques. As a result, procedural simplifications in theradio analysis were considered acceptable in so far as no serious compromise was made in the validity orconclusions of the investigation.
The results of the radiated susceptibility investigation indicate that the radio, when equipped witheither the 72-cm or the 2.9-m antenna, will survive exposure to an EMP with negligible changes to theoperating system. In general, the work performed for this report has been an excellent opportunity to explorethe dynamics of the field interaction both with the radio (and its antennae) and within the EMP simulator.The results have gone a long way in helping to understand the behaviour of these systems and. by usingthis knowledge, many of the minor difficulties encountered in this evaluation can easily be avoided orcorrected in future testing.
V
TABLE OF CONTENTS
ABSTRACT ...............................................................
EXECUTIVE SUMMARY ........................................................ v
TABLE OF CONTENTS ..................................................... vii
1.0 INTRODUCTION ........................................................ 1
2.0 UNIT DESCRIPTION ....................................................... 1
3.0 DESCRIPTION OF FACILITIES ........................................ .. 4
4.0 RADIATED SUSCEPTIBIUTY SET-UP AND PROCEDURE ............................ 44.1 Installation of the Units ............................ 44.2 Unit Configurations .......................................... 7
4.2.1 Phase O ne ....................................... .......... 74.2.2 Phase Two ......... ................ ... ................ 7
4.3 Unit O rientations ......... ............... .......................... . 74.3.1 Phase One ................................................ 74.3.2 Phase Two ............................................. .... 7
4.4 Equipment Status ................................................... 74.4.1 Phase One ................................................. 74.4.2 Phase Two ................................................ 11
4.5 Susceptibility Criteria ................................................ 114.6 General Procedure ................................................. 11
5.0 DESCRIPTION OF INSTRUMENTATION ........................................ 125.1 Phase O ne ......................................................... 125.2 Phase Two ....................................................... 12
6.0 OBSERVATIONS AND CONCLUSIONS ............................. ........ 136.1 RS05 Results .......................................... ........... 13
6.1.1 Phase One ................................................. 136.1.2 Phase Tw o ................................................. 13
6.2 Procedural Difficulties ............................................... 176.2.1 Phase One ........................................ ........ 176.2.2 Phase Tw o ................................................ 17
6.3 Conclusions ....................................... ............ 17
7.0 REFERENCES ........................................................... 19
ANNEX A: Modelling of a Top Plate Monopole Antenna .............................. 20
ANNEX B: Measurement and Analysis ............................................ 30
ANNEX C: Calibration and Performance Check of Radio .............................. 35
vii
Radio Set PRC-77 EMP Hardening Investigation
1.0 INTRODUCTION
The purpose of this investigation was to determine the susceptibility of the PRC-77 Radio to theelectromagnetic fields produced by a nuclear ele, tromagnetic pulse (EMP). The characteristics of the EMPare to be defined by the RS05 requirement as specified in MIL-STD-461C, Part 4, and the RS05 test metnudsas specified in MIL-STD-462, Notice 5.
It should be noted that this was one of the first EMP evaluations performed in the Defence ResearchElectromagneticPulse Simulator (DREMPS) and there are no clients requesting specific results with respectto this unit. The investigation was viewed primarily as a means of optimizing the facility and establishinganalysis techniques. As a result, procedural simplifications were considered acceptable in so far as noserious compromise was made in the validity or conclusions of the investigation.
The evaluation proceeded in two phases: the first occurred in the spring of 1991 and involvedexposure of the radio in a 1-meter parallel-plate simulator. The latter was performed in November of 1992and took place in the 10-meter parallel-plate simulator (DREMPS). The schedule was executed in this fashionsimply because the radio and its antennae were physically too large to be fully exposed in the smallersimulator and the larger facility was not available earlier.
2.0 UNIT DESCRIPTION
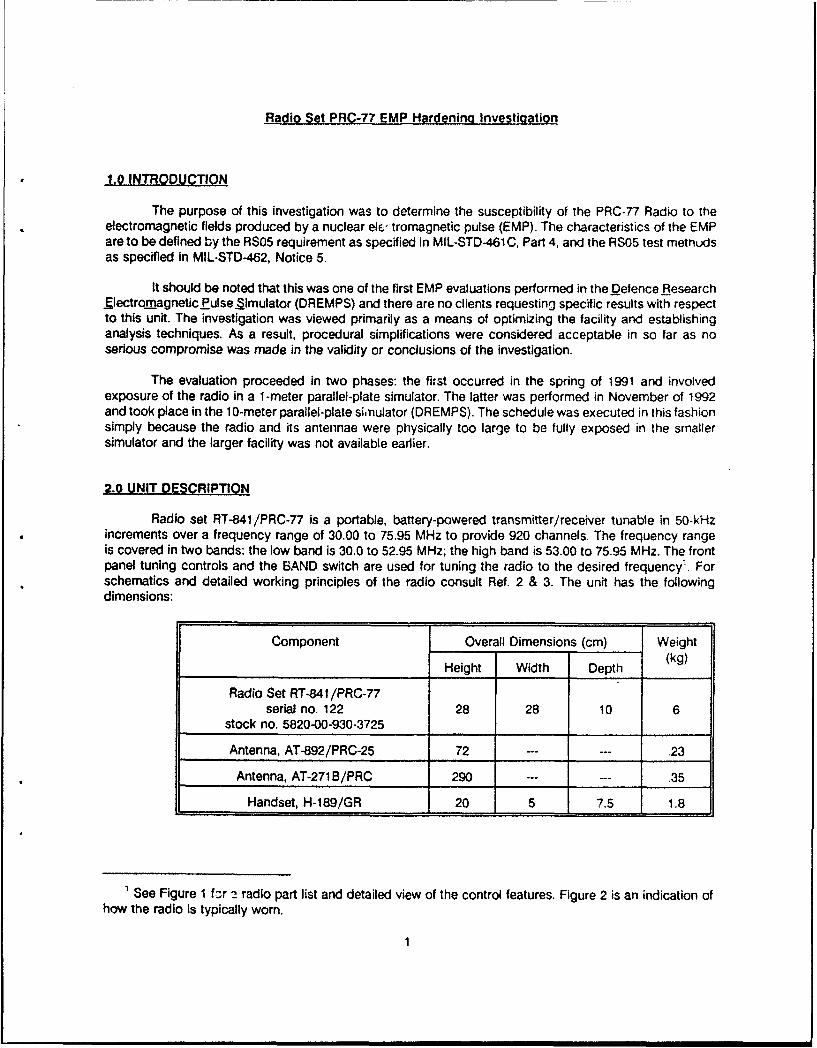
Radio set RT-841 /PRC-77 is a portable, battery-powered transmitter/receiver tunable in 50-kHzincrements over a frequency range of 30.00 to 75.95 MHz to provide 920 channels. The frequency rangeis covered in two bands: the low band is 30.0 to 52.95 MHz; the high band is 53.00 to 75.95 MHz. The frontpanel tuning controls and the BAND switch are used for tuning the radio to the desired frequency'. Forschematics and detailed working principles of the radio consult Ref. 2 & 3. The unit has the followingdimensions:
Component Overall Dimensions (cm) Weight
Height Width Depth (kg)
Radio Set RT-841/PRC-77serial no. 122 28 28 10 6
stock no. 5820-00-930-3725
Antenna, AT-892/PRC-25 72 --- --- .23
Antenna, AT-271 B/PRC 290 --- . .35
Handset, H-189/GR 20 5 7.5 1.8
1 See Figure 1 fbr 2 radio part list and detailed view of the control features. Figure 2 is an indication of
how the radio Is typically worn.
1

A"II N
ANTENNA DRAIN MHZ CHANNEL KHZ FUNCTIONMOUNT HOLE TUNING DIAL TUNING SWITCH
a TRANSMITTER
RT-941/PRC-77
____________________BATTERY BOX
ANTENNA AT-27111/PRC
SUPPORT ANTENNA AS.591AIPRC
ANTENNA AT-B92/PRC-25
Figure 1: Control panel detail and parts list for the PRC-77 radio. Only the PRC-25 antenna is tested tkith the
RS05 method.
2

Figure 2: PRC-77 radio as typically worn in the field. Ideally the EMP testing should be performcd with the
antenna and handset in a similar configuration. Also, the soldier's body and the fact that the r:idio
is approx. 1.5 meters above the ground should also be simulated.
3
It should be noted that the PRC-77 has been in service for several years and a number of designmodifications have been implemented. Apparently, all these changes have not been made to each unit and,therefore, the investigation may be influenced by the status of the radio. The serial number of the unit usedin this evaluation is recorded above so that its repair history may be consulted.
3.0 DESCRIPTION OF FACILITIES
The radio evaluation was carried out In the Defence Research Establishment Ottawa (DREO) EMPLaboratory. The facilities used for radiated susceptibility (RS05) include:
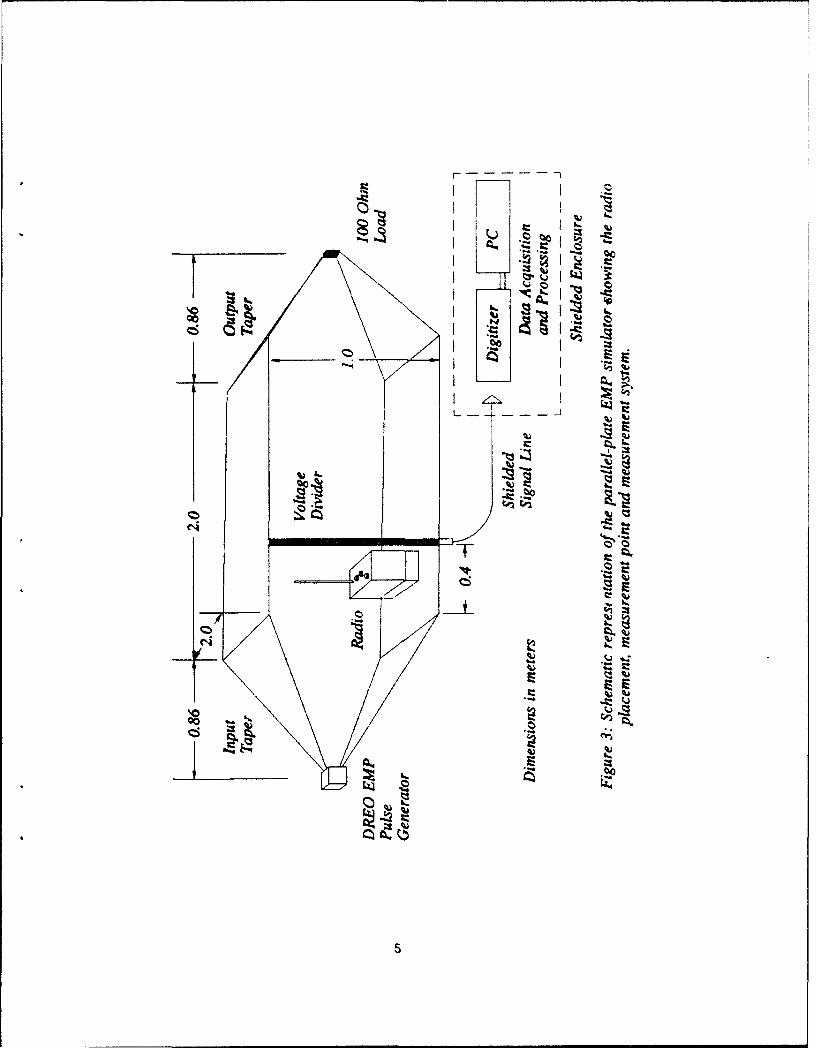
* a 1-meter, parallel-plate EMP simulator (Fig .3)* the DREO, 50-kV, EMP generator• the DREO 10-meter, parallel-plate EMP simulator DREMPS (Fig .4)* a Maxwell, 600-kV EMP generator• shielded enclosures* various electric and magnetic field sensors* data acquisition and signal processing equipment and software.
4.0 RADIATED SUSCEPTIBILITY SET-UP AND PROCEDURE
It was postulated that the major threat to the radio would come from coupling f the EMP field tothe antenna and the handset. Direct field penetration into the equipment case would not )e a problem sinceit is made of metal and the apertures are very small (an examination of the set showed it to be wellconstructed with individually screened interior compartments within the metal case). These assumptionswere verified during the RS05 exposure.
In phase one of the evaluation it was apparent that a problem existed. The heights of the radioantennae were too large for the 1 -m simulator2. As a result, the 72-cm antenna was modified by reducingits height to 50-cm and capping it with a 20-cm top plate (an empirically derived substitution which wasexperimentally shown to produce the same EMP response. The details are presented in Annex A).Unfortunately, the 2.9-m antenna could not be altered in a similar fashion.
Phase two was performed in the 10-m parallel plate simulator DREMPS. This facility could easilyaccommodate either the 72-cm or 2.9-m antennae. Since portions of the full radio evaluation would havebeen redundant given the efforts of phase one, an effort was made to concentrate on results which couldnot be obtained earlier. Measurements of the magnetic field, antenna currents and handset currents weremade and recorded. Details are available in Annex B.
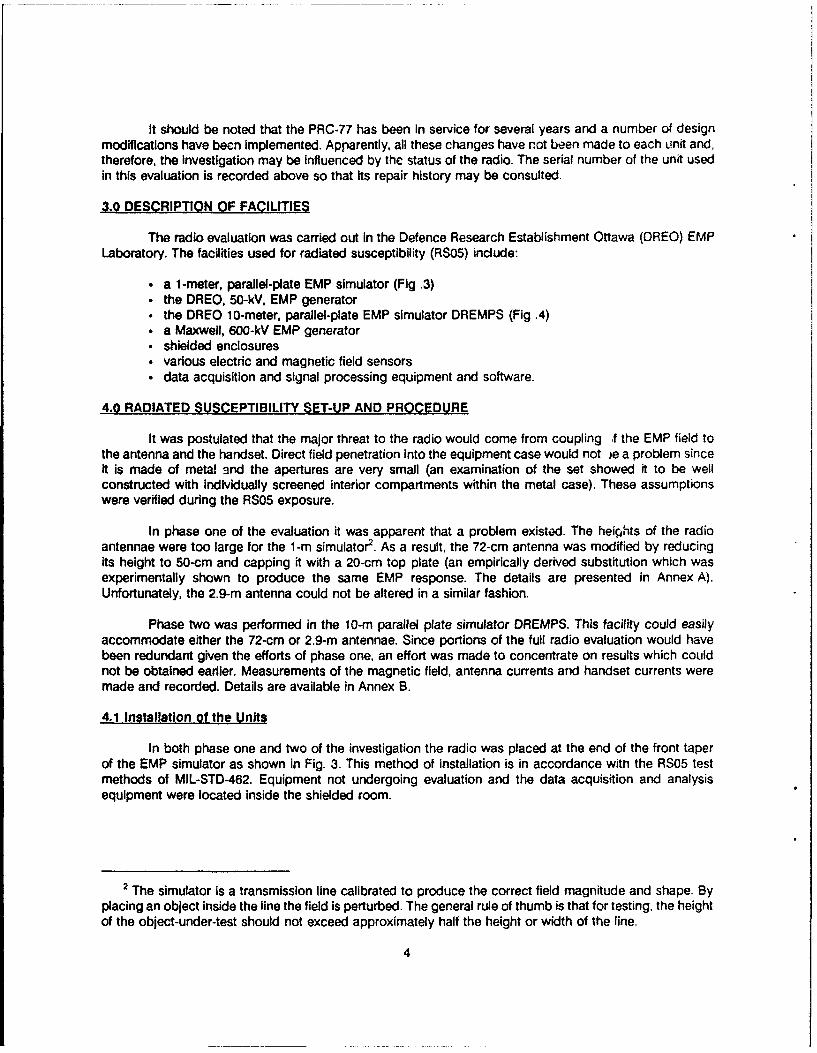
4.1 Installation of the Units
In both phase one and two of the investigation the radio was placed at the end of the front taperof the EMP simulator as shown in Fig. 3. This method of installation is in accordance witlh the RS05 testmethods of MIL-STD-462. Equipment not undergoing evaluation and the data acquisition and analysisequipment were located inside the shielded room.
2 The simulator is a transmission line calibrated to produce the correct field magnitude and shape. By
placing an object inside the line the field is perturbed. The general rule of thumb is that for testing, the heightof the object-under-test should not exceed approximately half the height or width of the line.
4
-7-
00
00
00-
~0CL
z 0 u
c0~
o0
Cl 0)00
0:
0
w
0 X C0D
0.0 0.
"0 CLM
0
00
0o 04
ýoE '5
0. 00.
a):L 0

4.2 Unit Configurations
4.2.1 Phase One
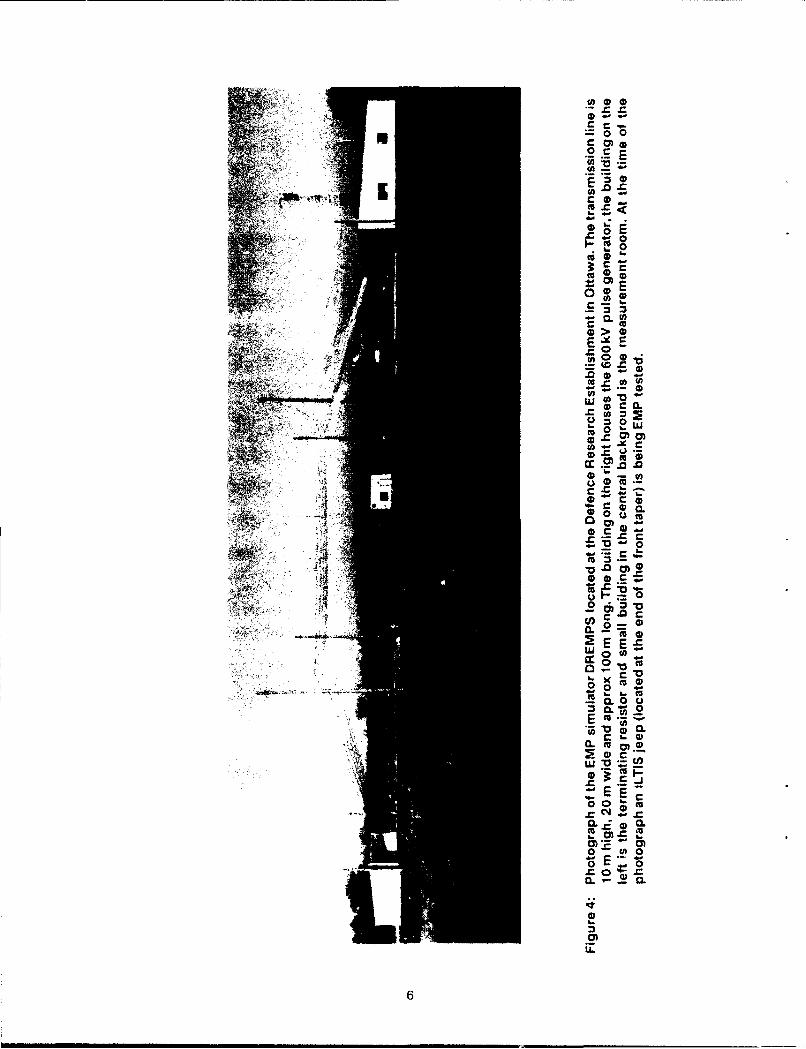
The radiated susceptibility (RS05) evaluation wes carried out in the following configurations:
1) The radio in the 1-rn simulator with no antenna attached (Fig. 5a)2) The radio approximately ,r-m outside of the simulator with a fully extended 72-cm antenna
(Fig. 5b). This location produces a sub-threat level field o, approx. 20 kV/m.3) The radio in the simulator with a modified plate antenna (Fig. 5c) (see Annex A).
4.2.2 Phae Tw
Raolated susceptibility was only carried out with the radio centrally placed at the end of the inputtaper of the 10-m simulator in a configuration sim;,1ar to that of Fig. 5c. This location provides the optimalEMP wave shape.
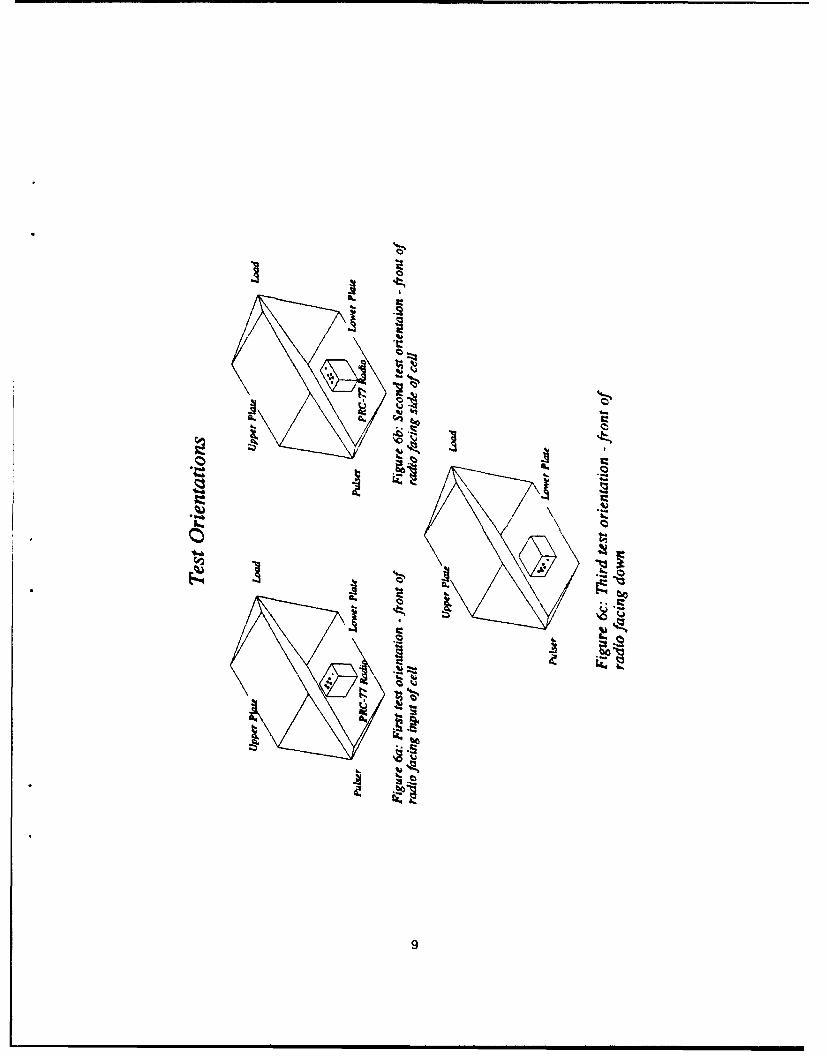
4.3 Unit Orientations
4.3.1 Phase One
Radiated susceptibility was also done in three different orientations:
1) With the front3 of the radio facing theinput of the parallel-plate cell (Fig. 6a)2) With the front ot the radio facing the side of the parallel-plate cell (Fig. 6b)3) With the front of the horizontally inclined radio facing down (Fig. 6c).
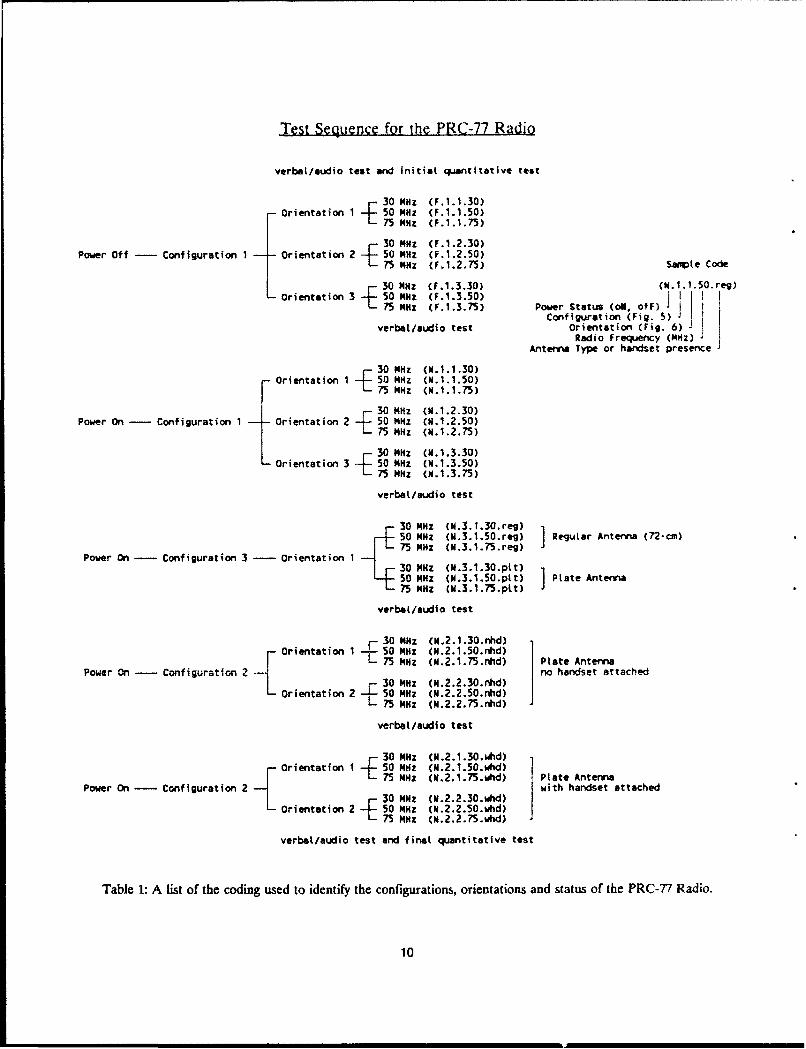
However, not all orientations were exposed in each configuration. A detaiied plan showing the configurationsand orientations used (in chronological order) is presented in Table 1.
4.3.2 Phase Two
Since the vast majority of the pick-up is through the antenna and not the radio case, orientations 1and 2 are clearly equivalent and worst-case scenarios. As a result, the RS05 evaluation in th's phase wasonly done with the front ol the radio facing the source and the antenna vertically extended.
4.4 Equipment Statuc
4.4,1 Phase One
The radio was examined in both powcr on and off state in configuration 1 but only in the power onstate in the other cinfigurations. As a procedural simplification the transmit mode was not investigated. Theevaluation was done at 3 different receiving frequencies (30, 50 and 75 MHz) in all configurations andorientations. The spenific values chosen represent the highest, lowest and middle frequencies of theoperating band and are an attempt to maximize th'e coupling between the induced antenna currents andthe radio. The handset was al' o incorporated into tiq system after the antenna analysis was complete. Thiswas done so that if damage had occurred there would e some possibility of isolating problems introducedby the antenna and handset.
3 The front of the radio is defined such that the antenna of the unit is perpendicular to the ground and
the labels on the radio controls are legible.
7
IthL.
oz
1k:ag
.- -
Test Sequence for the PRC-77 Radio
verbal/audio test and Initial quantitative test
+.30 MHz (F.1.1.30)Orientation 1 50 MHz (F.1.1.50)
75 M4Hz (F.1.1.75)
30 M1z (F.1.2.30)Power Off - Configuration 1 Orientation 2 50 MHz (F.1.2.50)
75 MHz (F.1.2.75) Sample Code
30 M1z (F.1.3.30) (14.1.1.5O.reg)orientation 3 50 MHz (P.1.3.50)]
75 MHz (F.1.3.75) Power Status (oN, off)Configuration (Fig 5) 1
verbalt/audio test Orientation (Fig. 6) |Radio Frequency (MHz)
Antenna Type or handset presence
• 30 MHz (1.1.1.30)- Orientation 1 50 MHz (N.1.1.50)-E 75 MHz (N1.1.1.75)
30 MHz (1N.1.2.30)Power On - Configuration 1 Orientation 2 50 MHz (M.1.2.50)
75 MHz (N.1.2.75)
30 MHz (M.1.3.30)Orientation 3 50 MHz (M.1.3.50)
75 MHz (M.1.3.75)
verbal/audio test
30 MHz (N.3.1.30.reg). t 50 MHz (M.3.1.50.reg) Regular Antenna (72-cm)
75 Mxz (9.3.1.75.reg)
Power On - Configuration 3 - Orientation 130 MHz (M.3.1.30.ptt)50 MHz (N.3.1.50.ptt) ] Plate Antenna75 MHz (m.3.1.75.pit)
verbat/audio test
30 MHz (N.2.1.30.nhd)Orientation 1 50 MHz (N.2.1.50.nhd)
-E 75 MHz (N.2.1.75.nhd) Plate AntennaPower On - Configuration 2 no handset attached
30 MHz (N.2.2.30.nhd)Orientation 2 50 MHz (N.2.2.50.nhd)
75 MHz (N.2.2.75.nhd)
verbal/audio test
+ 30 MHz (N.2.1.30.whd)Orientation 1 50 MHz (M.2.1.SO.whd)
75 MHz (M.2.1.75.whd) Plate AntennaPower On Configuration 2 with handset attached
30 MHz (N.2.2.30.whd)Orientation 2 50 MHz (M.2.2.50.whd)-E 75 MHz (N.2.2.75.whd)
verbal/audio test and final quantitative test
Table 1: A list of the coding used to identify the configurations, orientations and status of the PRC-77 Radio.
10
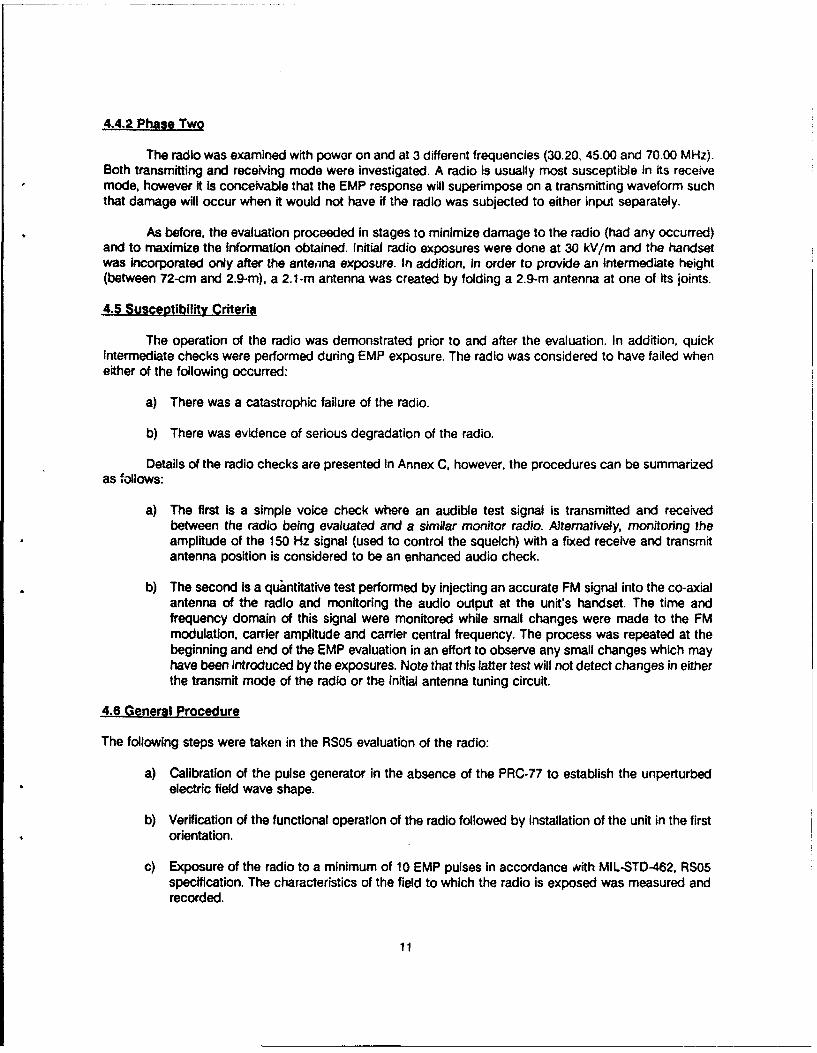
4.4.2 Phase Two
The radio was examined with power on and at 3 different frequencies (30.20, 45.00 and 70.00 MHz).Both transmitting and receiving mode were investigated. A radio is usually most susceptible in its receivemode, however it Is conceivable that the EMP response will superimpose on a transmitting waveform suchthat damage will occur when it would not have if the radio was subjected to either input separately.
As before, the evaluation proceeded In stages to minimize damage to the radio (had any occurred)and to maximize the Information obtained. Initial radio exposures were done at 30 kV/m and the handsetwas Incorporated only after the antenna exposure. In addition, in order to provide an Intermediate height(between 72-cm and 2.9-m), a 2.1i-m antenna was created by folding a 2.9-m antenna at one of its joints.
4.5 Susceptibility Criteria
The operation of the radio was demonstrated prior to and after the evaluation. In addition, quickintermediate checks were performed during EMP exposure. The radio was considered to have failed wheneither of the following occurred:
a) There was a catastrophic failure of the radio.
b) There was evidence of serious degradation of the radio.
Details of the radio checks are presented in Annex C, however, the procedures can be summarizedas follows:
a) The first is a simple voice check where an audible test signal is transmitted and receivedbetween the radio being evaluated and a similar monitor radio. Alternatively, monitoring theamplitude of the 150 Hz signal (used to control the squelch) with a fixed receive and transmitantenna position is considered to be an enhanced audio check.
b) The second is a quantitative test performed by injecting an accurate FM signal into the co-axialantenna of the radio and monitoring the audio output at the unit's handset. The time andfrequency domain of this signal were monitored while small changes were made to the FMmodulation, carrier amplitude and carrier central frequency. The process was repeated at thebeginning and end of the EMP evaluation in an effort to observe any small changes which mayhave been introduced by the exposures. Note that this latter test will not detect changes In eitherthe transmit mode of the radio or the initial antenna tuning circuit.
4.6 General Procedure
The following steps were taken in the RS05 evaluation of the radio:
a) Calibration of the pulse generator in the absence of the PRC-77 to establish the unperturbedelectric field wave shape.
b) Verification of the functional operation of the radio followed by Installation of the unit in the firstorientation.
c) Exposure of the radio to a minimum of 10 EMP pulses in accordance with MIL-STD-462, RS05specification. The characteristics of the field to which the radio Is exposed was measured andrecorded.
11
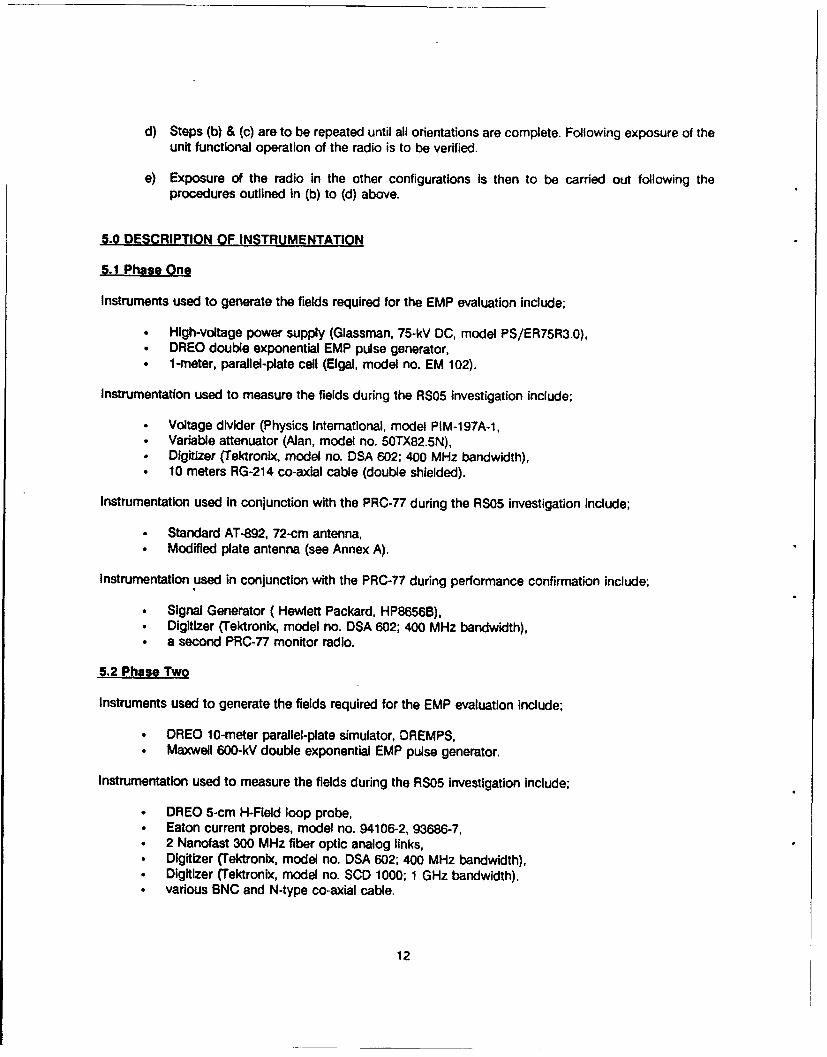
d) Steps (b) & (c) are to be repeated until all orientations are complete. Following exposure of theunit functional operation of the radio is to be verified.
e) Exposure of the radio in the other configurations Is then to be carried out following theprocedures outlined in (b) to (d) above.
5.0 DESCRIPTION OF INSTRUMENTATION
5.1 Phase One
Instruments used to generate the fields required for the EMP evaluation include;
* High-voltage power supply (Glassman, 75-kV DC, model PS/ER75R3.0),• DREO double exponential EMP pulse generator,* 1-meter, parallel-plate cell (Elgal, model no. EM 102).
Instrumentation used to measure the fields during the RS05 investigation include;
* Voltage divider (Physics International, model PIM-197A-1,* Variable attenuator (Alan, model no. 50TX82.5N),• Digitizer (Tektronix, model no. DSA 602; 400 MHz bandwidth),* 10 meters RG-214 co-axial cable (double shielded).
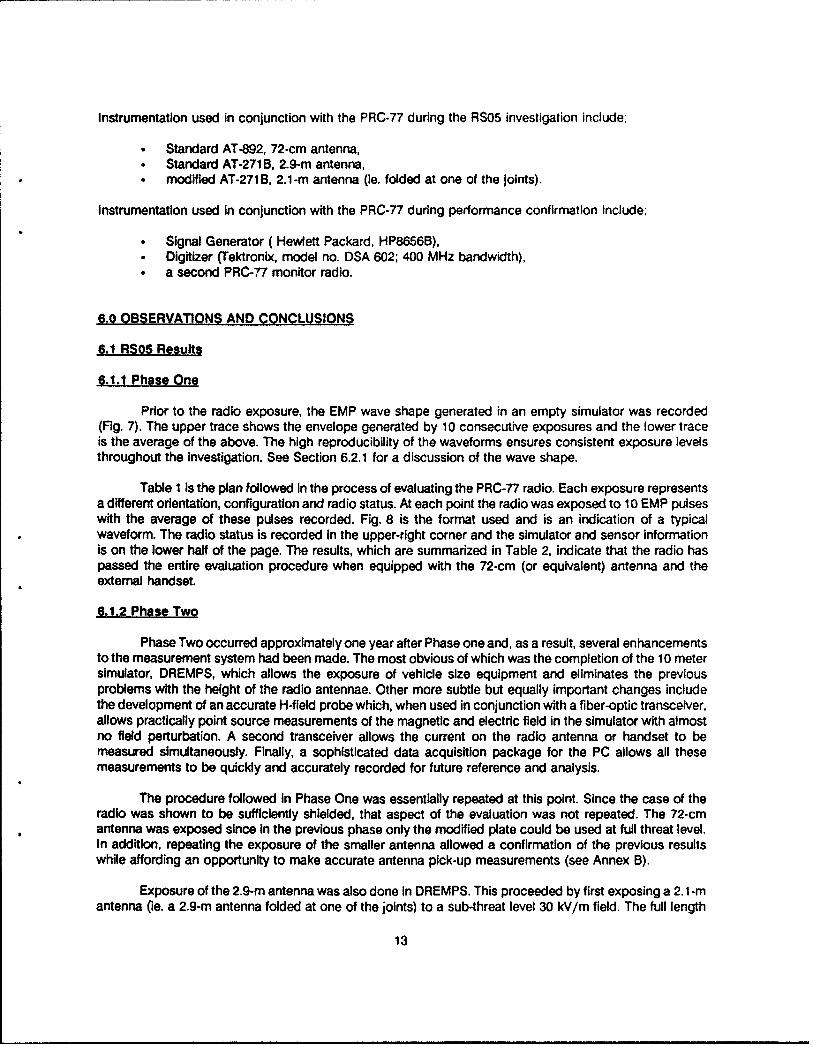
Instrumentation used in conjunction with the PRC-77 during the RS05 investigation include;
* Standard AT-892, 72-cm antenna,* Modified plate antenna (see Annex A).
Instrumentation used in conjunction with the PRC-77 during performance confirmation include;
• Signal Generator ( Hewlett Packard, HP8656B),* Digitizer (Tektronix, model no. DSA 602; 400 MHz bandwidth),• a second PRC-77 monitor radio.
5.2 Phase Two
Instruments used to generate the fields required for the EMP evaluation include;
* DREO 10-meter parallel-plate simulator, DREMPS,* Maxwell 600-kV double exponential EMP pulse generator.
Instrumentation used to measure the fields during the RS05 investigation include;
• DREO 5-cm H-Field loop probe,* Eaton current probes, model no. 94106-2, 93686-7,* 2 Nanofast 300 MHz fiber optic analog links,* Digitizer (Tektronix, model no. DSA 602; 400 MHz bandwidth),* Digitizer (Tektronix, model no. SCD 1000; 1 GHz bandwidth),* various BNC and N-type co-axial cable.
12
Instrumentation used in conjunction with the PRC-77 during the RS05 investigation include;
* Standard AT-892, 72-cm antenna,* Standard AT-271 B, 2.9-m antenna,* modified AT-271B, 2.1-m antenna (le. folded at one of the joints).
Instrumentation used in conjunction with the PRC-77 during performance confirmation include,
* Signal Generator ( Hewlett Packard, HP8656B),* Digitizer (Tektronix, model no. DSA 602; 400 MHz bandwidth),• a second PRC-77 monitor radio.
6.0 OBSERVATiONS AND CQNCLUSIONS
6.1 RS05 Results
6.1.1 Phase One
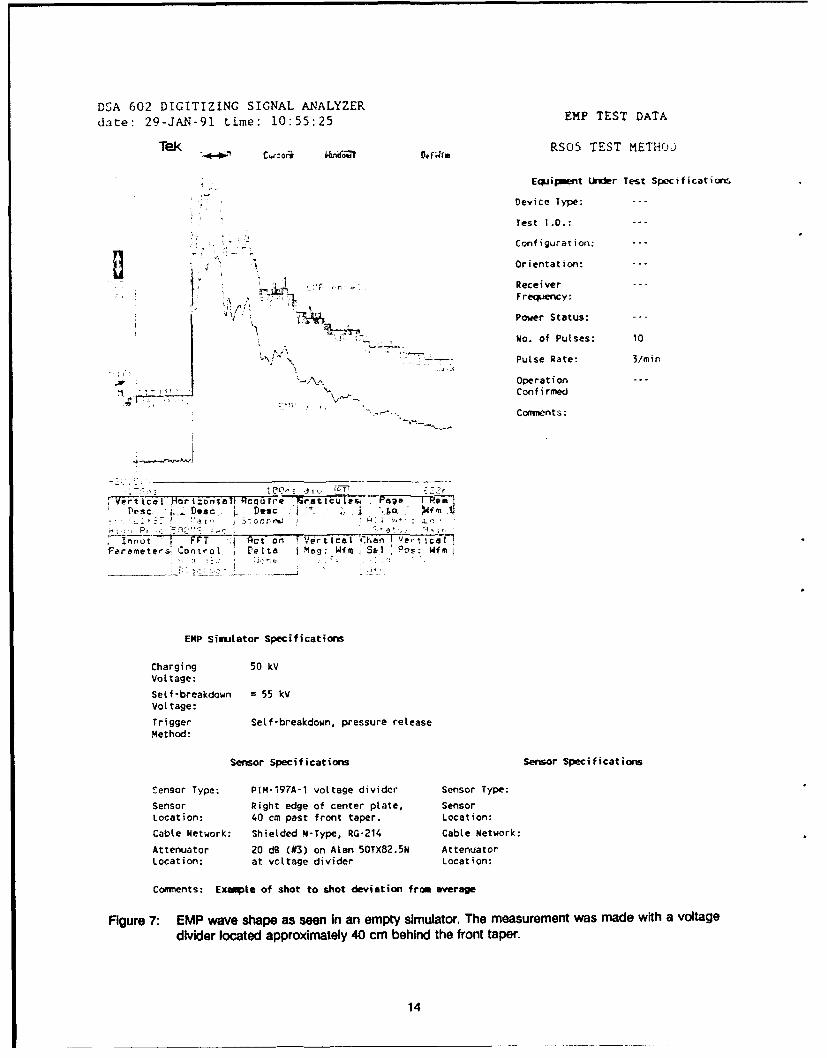
Prior to the radio exposure, the EMP wave shape generated in an empty simulator was recorded(Fig. 7). The upper trace shows the envelope generated by 10 consecutive exposures and the lower traceis the average of the above. The high reproducibility of the waveforms ensures consistent exposure levelsthroughout the investigation. See Section 6.2.1 for a discussion of the wave shape.
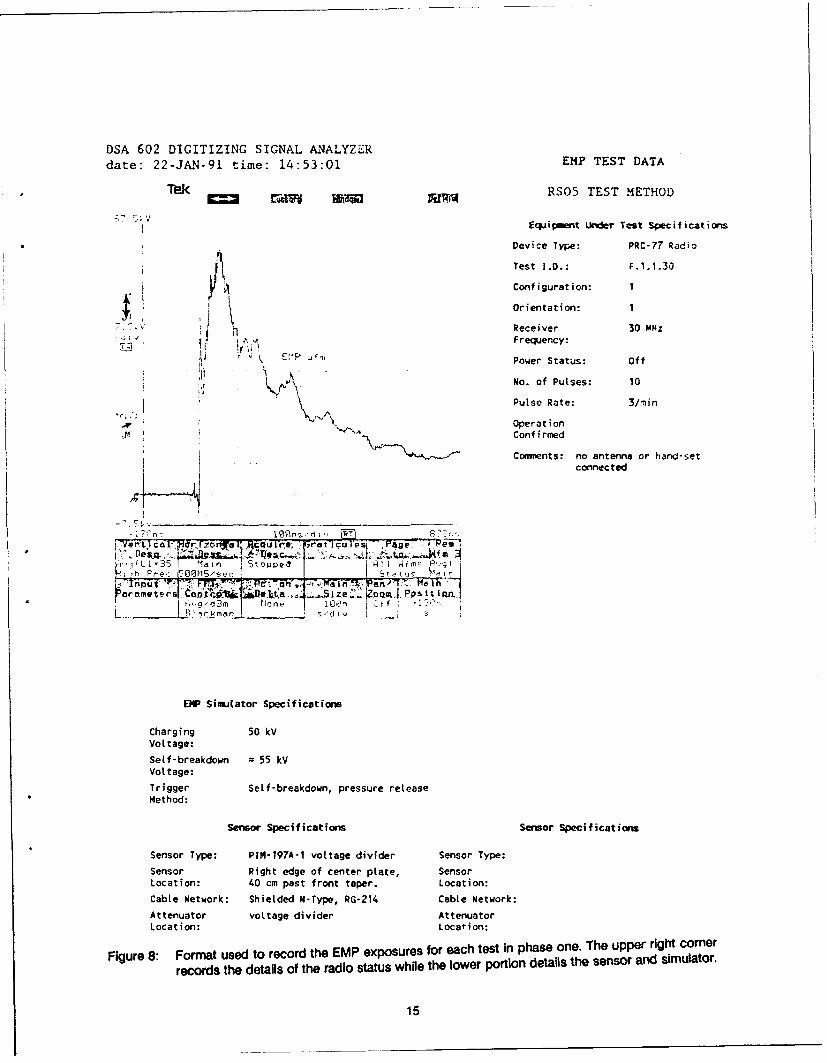
Table 1 is the plan followed in the process of evaluating the PRC-77 radio. Each exposure representsa different orientation, configuration and radio status. At each point the radio was exposed to 10 EMP pulseswith the average of these pulses recorded. Fig. 8 is the format used and is an indication of a typicalwaveform. The radio status is recorded In the upper-right corner and the simulator and sensor informationis on the lower half of the page. The results, which are summarized in Table 2, indicate that the radio haspassed the entire evaluation procedure when equipped with the 72-cm (or equivalent) antenna and theexternal handset.
6.1.2 Phase Two
Phase Two occurred approximately one year after Phase one and, as a result, several enhancementsto the measurement system had been made. The most obvious of which was the completion of the 10 metersimulator, DREMPS, which allows the exposure of vehicle size equipment and eliminates the previousproblems with the height of the radio antennae. Other more subtle but equally important changes includethe development of an accurate H-field probe which, when used in conjunction with a fiber-optic transceiver,allows practically point source measurements of the magnetic and electric field in the simulator with almostno field perturbation. A second transceiver allows the current on the radio antenna or handset to bemeasured simultaneously. Finally, a sophisticated data acquisition package for the PC allows all thesemeasurements to be quickly and accurately recorded for future reference and analysis.
The procedure followed in Phase One was essentially repeated at this point. Since the case of theradio was shown to be sufficiently shielded, that aspect of the evaluation was not repeated. The 72-cmantenna was exposed since in the previous phase only the modified plate could be used at full threat level.In addition, repeating the exposure of the smaller antenna allowed a confirmation of the previous resultswhile affording an opportunity to make accurate antenna pick-up measurements (see Annex B).
Exposure of the 2.9-m antenna was also done In DREMPS. This proceeded by first exposing a 2. 1-mantenna (ie. a 2.9-m antenna folded at one of the joints) to a sub-threat level 30 kV/m field. The full length
13
DSA 602 DIGITIZING SIGNAL ANALYZERdate: 29-JAN-91 time: 10:55:25 EMP TEST DATA
Tek Cur:oa knd? NfWo RS05 TEST METHOD
Equipment Under Test Specifications
Device Type: ---
Test I.D.: ...
Configuration: -
"[1 Orientation: --.
.. " r*, •Receiver --
:1'• "17,Frequency:
Power Status: ---
I *.*.-. IdNo. of Pulses: 10
I\-" *---- Pulse Rate: 3/min
j "-4%A Operation - - -
Confirmed
-' •'Comments:
:-:.t•l t?,,: ,j1• T' -.:2
z' Vertcel Horizzon'aelI Rcqurre tr-atttulerr. g Paq Pim_Pesc Disc _ Desc b .o• fm1
Innut FFT Act- on V "'Ort cal h•'an I ne,' fl :1ca7Fereameter.s• Control rel".t I ?1g: Wfl Sea PC's: Wfm
EDP SinuLator Specifications
Charging 50 kV
Voltage:
Self-breakdown = 55 kVVoltage:
Trigger Setf-breakdown, pressure releaseMethod:
Sensor Specifications Sensor Specifications
Sensor Type: PIM-197A-1 voltage divider Sensor Type:Sensor Right edge of center plate, SensorLocation: 40 cm past front taper. Location:
Cable Network: Shielded N-Type, RG-214 Cable Network:
Attenuator 20 dc (#3) on Alan 50TX82.5N AttenuatorLocation: at vottage divider Location:
Comments: Example of shot to shot deviation from average
Figure 7: EMP wave shape as seen in an empty simulator. The measurement was made with a voltage
divider located approximately 40 cm behind the front taper.
14
DSA 602 DIGITIZING SIGNAL ANALYZERdate: 22-JAN-91 time: 14:53:01 EMP TEST DATA
Tek RS05 TEST METHOD
Equipment Under Test Specifications
Device Type: PRC-77 Radio
Test I.D.: F.1.1.30
SConfiguration: 1
IOrientation: I
7. N hReceiver 30 MHzFrequency:
Y . E P, W Power Status: Off
No. of Pulses: 10
Pulse Rate: 3/min
Operation;,M ,Confirmed
"C" omments: no antenna or hand-setconnected
H.
,,
-
rnp. , "- /dFTTIm1 No' i n'n an' '. c m1];______m_____a____________________ Jge, e
L I M-1 ,mTn h H! i W
EMP Simulator Specifications
Charging 50 kVVoltage:
Self-breakdown 55 kVVoltage:
Trigger Self-breakdown, pressure releaseMethod:
Sensor Specifications Sensor Specifications
Sensor Type: PIM-197A-1 voltage divider Sensor Type:
Sensor Right edge of center plate, SensorLocation: 40 cm past front taper. Location:
Cable Network: Shielded N-Type, RG-214 Cable Network:
Attenuator voltage divider AttenuatorLocation: Location:
Figure 8: Format used to record the EMP exposures for each test in phase one. The upper right comer
records the details of the radio status while the lower portion details the sensor and simulator.
15

Field Radio Config. Orient. Radio Antenna hand- Code EMP(kV/m) Power _ Freq. set Status& Pot. I (Hz)
50 (pos) off 1 1 30 (Rx) none off F.1.1.30 pass
50 (pos) off 1 1 50 (Rx) none off F.1.1.50 pass
50 (pos) off 1 1 75 (Rx) none off F.1.1.75 pass
50 (pos) off 1 2 30 (Rx) none off F.1.230 pass
50 (pos) off 1 2 50 (Rx) none off F.1.2.30 pass
50 (pos) off 1 2 75 (Rx) none off F.1.2.75 pass
50 (pos) off 1 3 30 (Rx) none off F.1.3.30 pass
50 (pMs) off 1 3 50 (Rx) none off F.1.3.50 pass
50 (pos) off 1 3 75 (Rx) none off F.1.3.75 pass
50 (pos) on 1 1 30 (Rx) none off N.1.1.30 pass
50 (pos) on 1 1 50 (Rx) none off N.1.1.50 pass
50 (pos) on 1 1 75 (Rx) none off N.1.1.75 pass
50 (pos) on 1 2 30 (Rx) none off N.1.2.30 pass
50 (pos) on 1 2 50 (Rx) none off N.1.2.50 pass
50 (pos) on 1 2 75 (Rx) none off N.1.2.75 pass
50 (pos) on 1 3 30 (Rx) none off N.1.3.30 pass
50 (pos) on 1 3 50 (Rx) none off N.1.3.50 pass
50 (pos) on 1 3 75 (Rx) none off N.1.3.75 pass
50 (pos) on 3 1 30 (Rx) 72-cm off N.3.1.30.reg pass
50 (pos) on 3 1 50 (Rx) 72-cm off N.3.1.50.reg pass
50 (pos) on 3 1 75 (Rx) 72-cm off N.3.1.75.reg pass
50 (Pos) on 3 1 30 (Rx) 50-cm pit off M.3.1.75.reg pass
50 (pos) on 3 1 50 (Rx) 50-cm pit off N.3.1.S0.ptt pass
50 (pOS) on 3 1 75 (Rx) 50-cm pit off N.3.1.75.ptt pass
50 (pos) on 2 1 30 (Rx) 50-cm pit off N.2.1.30.nhd pass
50 (pos) on 2 1 50 (Rx) 50-cm pit off N.2.1.50.nhd pass
50 (pos) on 2 1 75 (Rx) 50-cm pit off N.2.1.75.nhd pass
50 (pos) on 2 2 30 (Rx) 50-cm pit off N.22.3O.nhd pass
50 (pos) on 2 2 50 (Rx) 50-cm pit off N.2.2.50.nhd pass
50 (Pos) on 2 2 75 (Rx) 50-cm pit off N.2.2.T0.nhd pass
50 (pos) on 2 1 30 (Rx) 50-cm ptt on W.2.1.30.whd pass
50 (pos) on 2 1 50 (Rx) 50-cm pit on W.2.1.30.whd pass
50 (pos) on 2 1 75 (Rx) 50-cm ptt on M.2.1.75.whd pass
50 (pos) on 2 2 30 (Rx) 50-cm pit on N.2.2.30.whd pass
50 (pos) on 2 2 50 (Rx) 50-cm pit on N.2.2.50.whd pass
50 (pos) on 2 2 75 (Rx) 50-cm ptt on ..2.75.whd pass
Table 2: Results from Phase One of the EMP assessment of PRC-77 Radio. The radio showed nosignificant degradation as a result of the exposures.
16
antenna was then exposed to the same field. Finally, the above was repeated at a full-threat level field both
with positive and negative polarity. The radio survived all exposures as indicated in Table 3.
6.2 Procedural Difficulties
6.2.1 Phase One
The front and back taper of the 1-m parallel-plate simulator are too abrupt. This creates animpedance mismatch at the cell transitions which generates a 10-15% reflection. This reflection issuperimposed on the initial pulse and results In a corruption of the rise time. As a result, the electric fieldhas a small downward dip, Fig. 7, and the magnetic field is increased by a similar factor (not shown) [Ref.5]. The corrupted waveform doesn't have the ideal EMP wave shape, however, the frequency content of thispulse is similar to the MIL-STD-461C wave shape and, hence, this problem is considered negligible. Someof the oscillations in the above figure are a result of the relatively invasive voltage probe/cable combinationand are strictly a manifestation of the measurement system, not an indication of a corrupted waveform.
The antenna provided with the PRC-77 radio Is 72-cm. When this height is added to the height ofthe radio, the total exceeds the simulator plate separation (1 meter). Therefore, some compromise had tobe made in order to expose the radio inside the simulator. One alternative is to replace the 72-cm antennaby a shorter antenna with a capacitive top plate. In Annex A it has been empirically established that a 50-cmmonopole with a 20-cm top plate is a reasonable match for the original antenna and the investigationproceeded with this substitution.
Both the calibration tests and the EMP exposures where done only in the receive mode of the radio.A more thorough EMP evaluation involving both the receive and transmit modes was done in DREMPS,however, quantitative testing of the radio performance was only recorded for the receive mode. See AnnexC for more detail.
Finally, the radio was placed directly on the ground plane of the simulator. In reality, during an EMPthe radio would probably be worn on the back of a soldier. A more accurate evaluation should be done withthe radio suspended as in normal use, however space limitations prohibit this.
6.2.2 Phase Two
In DREMPS many of the problems mentioned above are eliminated because of the superior taperdesign and the larger physical dimensions of the working volume. For example, the radio, with a 3-mantenna, placed one meter above the ground still do not exceed half the height of the simulator.
One difficulty encountered was the erratic behaviour of one of the AT-892 (72-cm) antennae. Thesignal generated by this antenna was not reproducible and it was speculated that since it is constructed byriveting a series of anodized layers together, it is possible that a poor contact between two of these layerswould periodically arc. Unfortunately, the problem only manifested itself for one day, therefore, the abovehypothesis could not be confirmed. During the same time period all other antennas behaved normally.
6.3 Conclusions
The evaluation proceeded in stages such that each addition would add a greater degree ofsusceptibility to the radio. This procedure was followed In an attempt to isolate a particular fault if there hadbeen a system failure. An effort was also made to vary the radio operating frequency, physical orientationetc. in order to ensure that the unit would be exposed to a worst-case scenario.
17
30 kV/m Testing of PRC-77 Radio
Poi. Field Ant. handset Radio Radio Measurement EMP(kV/m) length Freq. Status Status
(cm) (MHz)
neg 30 72 neutral 30.2 Rx antenna pass
neg 30 72 down 30.2 Rx handset pass
neg 30 72 up 30.2 Rx handset pass
neg 30 2.09 neutral 30.2 Rx antenna pass
neg 30 2.9 neutral 30.2 off antenna pass
neg 30 2.9 neutral 30.2 Rx antenna pass
neg 30 72 neutral 30.2 Tx field only pass
neg 30 2.09 neutral 30.2 Tx field only pass
neg 30 2.9 neutral 30.2 Tx field only pass
50 kV/m Testing of PRC-77 Radio
Pol. Field Ant. handset Radio Radio Measurement EMP
(kV/m) length Freq. Status Status(cm) (MHz) I
neg 50 2.9 neutral 30.2 Tx field only pass
neg 50 2.9 down 30.2 Tx field only pass
neg 50 2.9 up 30.2 Tx field only pass
neg 50 2.9 neutral 45.0 Tx field only pass
neg 50 2.9 neutral 70.0 Tx field only pass
neg 50 2.9 neutral 30.2 Tx field only pass
neg 50 2.9 neutral 30.2 Rx field only pass
neg 50 2.9 down 30.2 ,x field only pass
neg 50 2.9 up 30.2 Rx field only pass
neg 50 2.9 down 45.0 Rx field only pass
neg s0 2.9 down 70.0 Rx field only pass
pos 50 2.09 down 30.2 Rx field only pass
pos 50 2.9 down 30.2 Rx field only pass
pos 50 2.09 down 30.2 Tx field only pass
pos 50 2,9 down 30.2 Tx field only pass
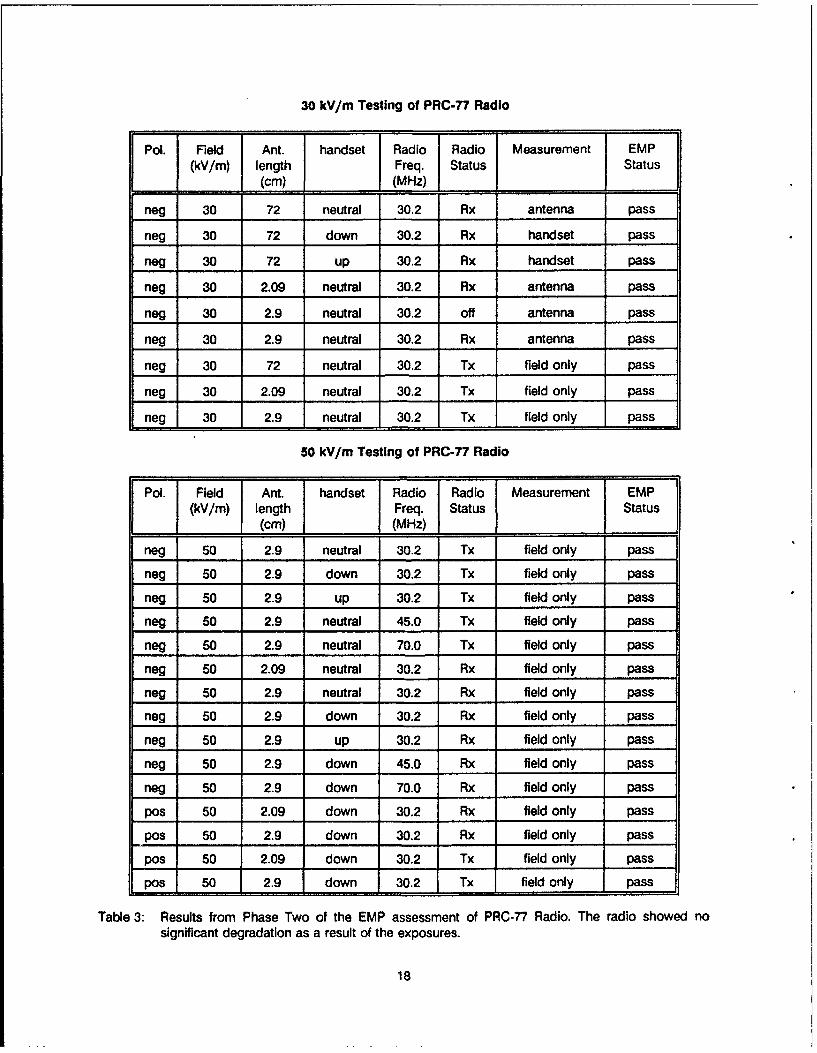
Table 3: Results from Phase Two of the EMP assessment of PRC-77 Radio. The radio showed nosignificant degradation as a result of the exposures.
18
This particular EMP as' 3ssment was performed in two phases because development of the 10-msimulator dictated that large-object exposure could not be performed prior to the fall of 1992. However,earlier results in a 1-m simulator showed the radio to have sufficient protection in the followingcircumstances;
"* penetration of the EMP into the case of the radio,"* 72-cm antenna to a sub-threat level (20 kV/m) field,"• plate antenna to a threat-level field,"* plate antenna and extended handset to a threat-level field.
In the second phase the evaluation confirmed survival under the additional circumstances of;
"* 72-cm antenna to a threat level field,"* 72-cm antenna and extended handset to threat-level field,"* 2.1-m antenna to threat-level field,"• 2.1--m antenna and extended handset to threat-level field,"* 2.9-m antenna to threat-level field,"* 2.9-m antenna and extended handset to threat-level field.
In summary, the results of the radiated susceptibility investigation indicate that the radio, whenequipped with either the 72-cm, ANT-892 or the 2.9-m, ANT-271 B antenna, will survive exposure to an EMPwith negligible changes to the operating system. In general, the work performed for this report has been anexcellent opportunity to explore the dynamics of the field interaction both with the radio (and its antennae)and within the EMP simulator. The results have gone a long way in helping to understand the behaviour ofthese systems and, by using this knowledge, many of the minor difficulties encountered in this evaluationcan easily be avoided or corrected in future testing.
7.0 REFERENCES
1) MIL-STD-451C/462
2) TM 11-5820-667-35, Radio Set AN/PRC-77 Maintenance Manual, 1987
3) C-53-328-AOO/MN-000, Receiver-Transmitter RT-841/PRC-77 Maintenance Manual.
4) TM 11-5820-667-12, Radio Set AN/PRC-77 Maintenance Manual, 1987
5) S. Kashyap, J.S. Seregelyi, M. Dion, Measurement of EMP Transients using a Small. Parallel PlateSimulator, Conference on Precision Electromagnetic Measurements 1990, pg. 194.
19

ANNEX A: Modelling of a Top-Plate Monopole Antenna.
ABSTRACT:
A design criteria is established which allows an antenna that is too high to fit inside the one meterEMP simulator to be replaced by a shorter antenna with the same eiectrical characteristics. Measurementsare made to confirm compatibility.
INTRODUCTION:
Prior to the construction of the 10-m simulator DREMPS, the size of an object which could beexposed to an EMP was limited because of the one meter plate separation in the Elgal simulator. Excessivelylarge equipment created a local impedance mismatch and could also induce arcing. Monopoles or whipantennae are particulary susceptible to the latter and, as a result, it was necessary to devise a method whichallowed the height of such a structure to be reduced without altering its electrical properties.
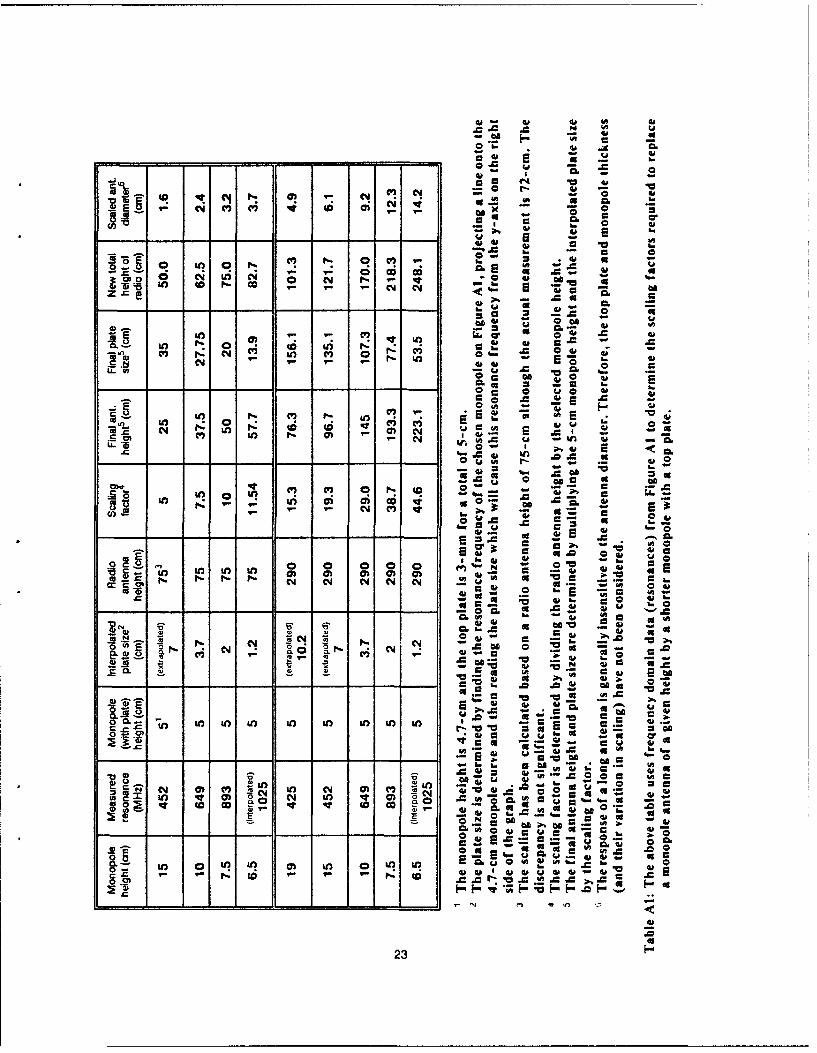
Placing a circular top plate on a short monopole capacitively loads the structure and simulates alonger antenna length. The procedure used to establish the correct dimensions is as follows:
. The resonances of 2.5-cm to 19-cm monopoles were determined and compared to theresonances of a 4.7-cm monopole with 2, 4 and 6-cm top plates. All monopoles were located ona 30-cm by 30-cm ground plane and responses were measured to 1.5 GHz.
. By comparing the above values, an empirical relationship between tha apparent change in amonopole's height and the top plate diameter was established. These relationships will bemaintained when the monopoles are simultaneously scaled in height and frequency response.
• Once suitable dimensions have been calculated, the twc antennae are experimentally tested forcompatibility.
EXPERIMENTAL RESULTS:
Frequency domain modelling:
The compatible antenna dimensions were established in the frequency domain. The comparison wasmade primarily by matching the resonances of the various monopoles with no compensation for themagnitude of the response at that resonance, hence, the selection criteria matches only the reactance ofthe monopoles.
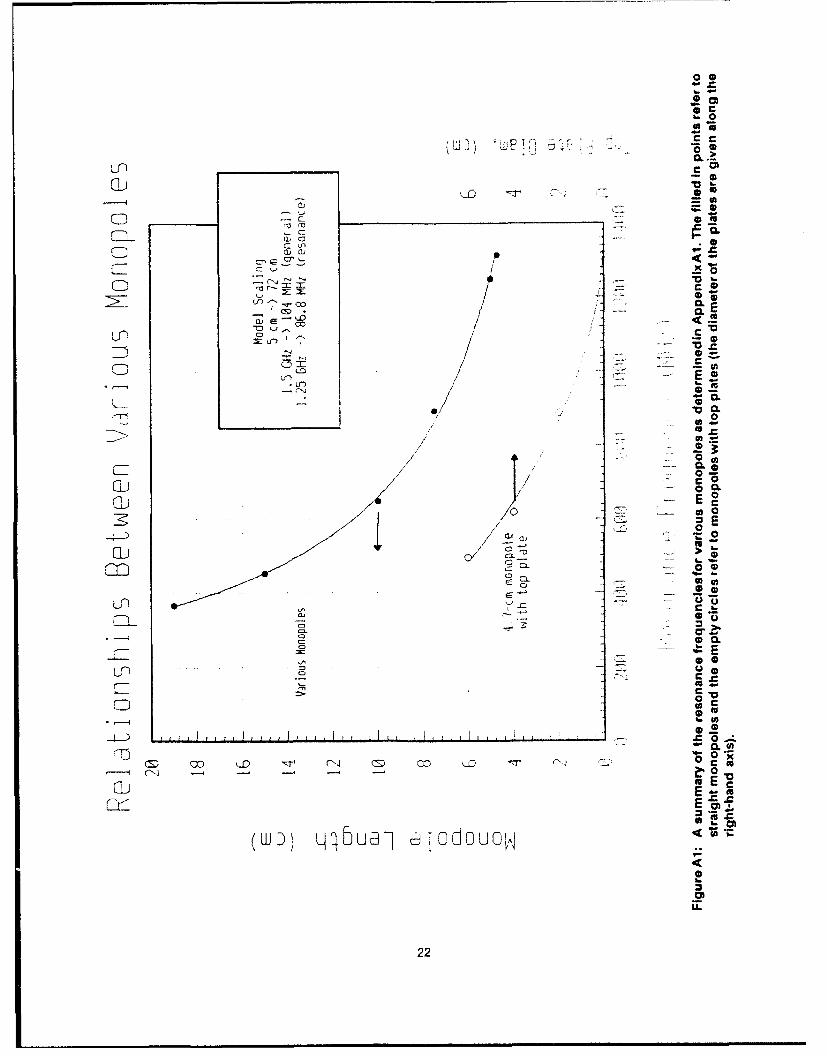
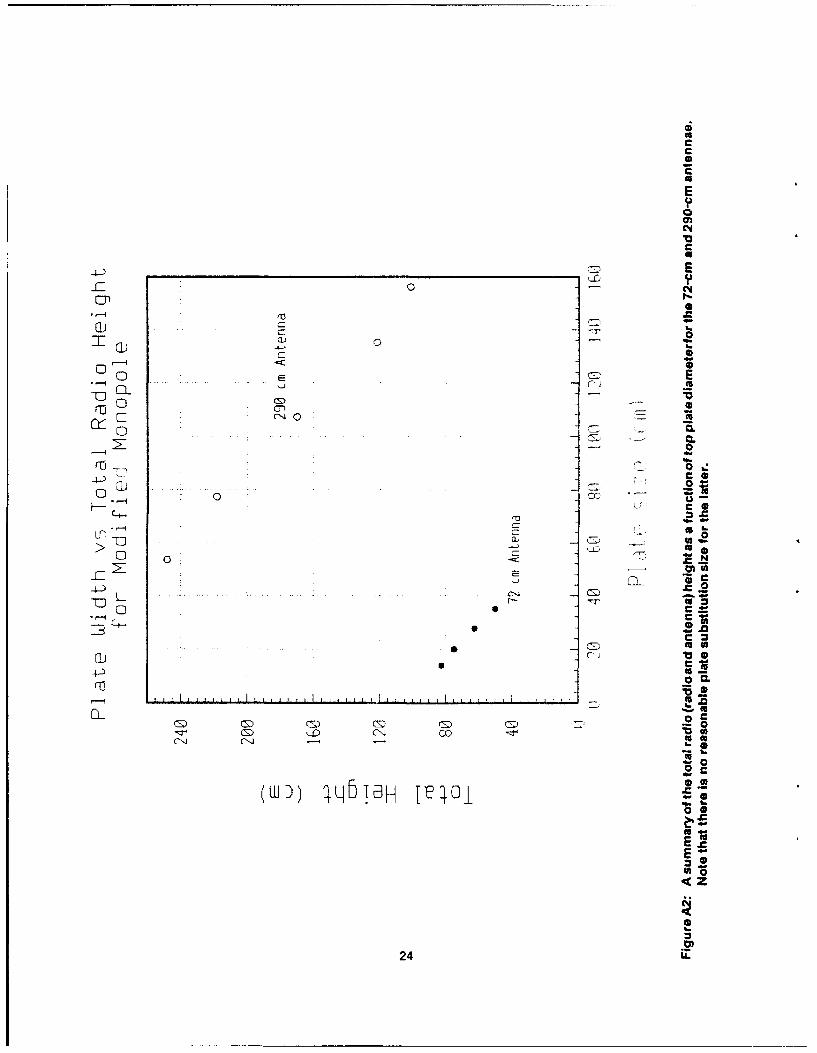
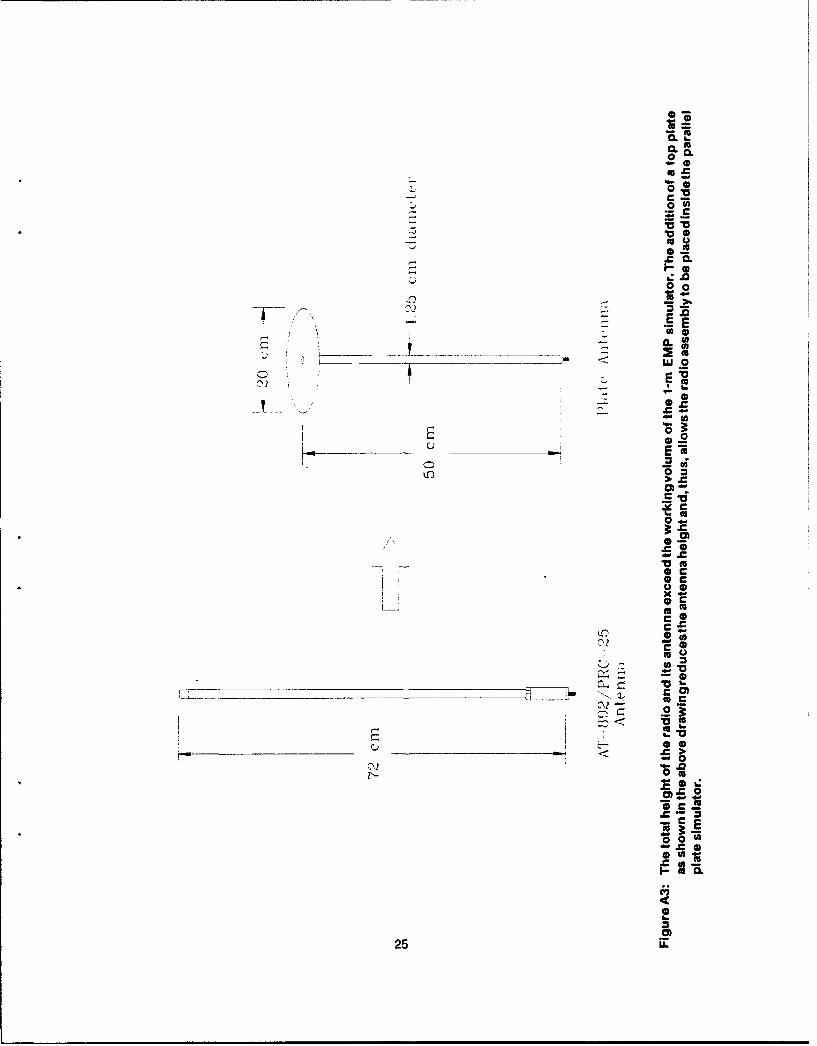
The frequency domain measurements, made with a HP 8753B Network Analyzer, are summarizeaIn Table Al and Figures Al-A2. The results indicate how the dimensions of a top plate change theresonances of a monopole and also established the scaling factors for the conversion from centimeter-longto meter-long monopoles. From Table Ai it is determined that a 50-cm monopole with a 20-cm top plateIs a reasonable substitute for a 72-cm monopole, see Figure A3. Unfortunately, there is no realistic top-platediameter which will create a suitable alternative to the 2.9-m monopole.
20
Time Domain Confirmation:
In simulator:
Measurements were made of the response of the whip antenna and the plate antenna inorder to confirm that the modifications result in a viable substitute for an EMP evaluation, seeFig. A4. The experiments were done with the antennae connected at the base plate of the EMPsimulator and terminated into a 100 ohm load (50 ohm resistor in series with a 50 ohm cable) Thereis good agreement between the currents induced on the two antennae with the small deviations inthe peak values being due to a minor scaling problem in the extrapolation'.
The choice of termination impedance is somewhat arbitrary as long as the same value isused for all compatibility measurements. However, since it was originally thought that currentinjection may be necessary to complete the radio evaluation and that an antenna response wouldbe required as an input for the current injection equipment, a 100 ohm value was chosen. This valueis compatible with the current injection system (IRT Corp.; PINS-250), hence, it is possible toconfirm the antenna compatibility and obtain a current injection waveform simultaneously. Inretrospect, because portions of the evaluation were delayed until after the completion of DREMPS,the entire investiqation could be completed using radiated susceptibility (RS) methods and currentinjection was not required.
In addition to the measured values, the theoretical response of a 72-cm. monopoleterminated into a 100 a load was determined, see Fig. A5, using a Numerical Electromagneticý Code(NEC)2. A very good agreement is obtained between the eyperimental and theoretical response.
On Radio:
In addition to measuring the antennae response as independent units, they were alsoevaluated while being mounted on the PRC-77 radio. The current injected into the radio via theantenna port was measured during an - 20% (magnitude) EMAP exposure and, 3s can be seen bycomparing Figs. A6 and A7, the waveforms generated by the regular 72-cm antenna and the 50-cmplate antenna are very similar.
CONCLUSIONS:
It was been determined that a 50-cm monopole with a 20-cm top-plate is a reasonable substitutefor the 72-cm whip antenna on •he PRC-77 radio. It has also been established that there .o reasonablediameter top plate which will allow the 2.9 m antenna to be replaced.
1The scaling problem is due to the fact that the thickness of the top plate was substantial compared
to the antenna height and diameter. Therefore, the exact height of the monopole was not clear. In addition,the original extrapolations were erroneously based on an a projected antenna height of 75-cm, not therequired 72-cm.
2 G.J. Burke et al., 'Numerical Electric Code (NEC) - Method of Moments", iidval 0 ean Systems Centre,
Technical Doc. 116, 1977.
21
0 0
L-n c
00__ _ CL~
aL 0~00 CL(Ea
0 0,
10 >
0
0 C
a I/0 ~r 0iI~ C
>0
-- S 0
Eq -Ac h
cm(W~~ D)o0o,,
O 22
4' x 0.a
v- -0 0o cLO a0 1- -cm
z. N7 N Doi G
-l -e 0) a
LL ) - C6 0
2L 0
a N 0 07 ,0- 4'
-I' CY f. W rN N 40 0 0M M
2c .A C
01 Gd00
-2 man 1 07 io U 04'0
_0 U) a~
04 N N an 0 N 07w 04' i
Cg 41 0 4'___ 2.A 2 Z &A a -o 02 0 UO
07 40 - w ~- S A
10 cm <2.0
-t .u.ZUI CL V
N) U) -n in I4t'n94 W
01.0).4 c 4'4
a5 2 6.0 0 01
ann on an ana SG
.0 16.
-02. t c a Aa 4'4'au
-2 - 2N* eN A0 0 ta -
c~u07 4' 2 E- 0
02 an an an? an an an an an0
C I- t- to - T- T- -- ~ uj~ 1 6o1* C
= C- 1% 0 ~Gd3.
~ N 073 n N Q~ ~ 4'an ±n 4 u :~A02
G~u a .~ 4 ' .0*~~uOa0 e'i an q, ~ N A0 gU23
NM
CjC
C:C
00
CL
0-
0(
o~ CLCo 0
~~24
01 =
* .0
cvc
0 c
.C 0
00
-04
OC
m C
4w 0
J2
E (U -
____ ____ ____ CA Oc 0
C''Ainb.
25 U.

.. >.
(v) juai*1
260

4=4
Coo
27

DSA 602 DIGITIZING SIGNAL ANALYZERdate: 25-JAN-91 time: 14:22:35 EMP TEST DATA
L Tk DefWrm RS05 TEST METHOD3ov
Equipment Under Test Specifications
5v I Device Type: PRC-77 RadioClIU
Test l.D.: N.3.1.75.reg
Configuration: 3
.V Orientation: I
Receiver 75 MHz-20V Frequency:
-172ns 100ns,'di,' F_,SCiwir D)fWri Power Status: On
No. of Pulses: 10
SPulse Rate: 3/min
OperationConfirmed
Comments: - no hand-set connected- regular antenna
-25V-9. 9ns 5ns/d i,, FR.1 Tt
FVrftldce or"zontal°4i lialre -- • FT- * ! . -ago Rem:h.gt l~ rJ Window `:)tooved P11 IWfr,' vc,9
-Himh Prec 2GS.'sec Status 11 ndInpt T `-it'orn~ ortzontal ein'l orzintall
.. h'dBm None 5 On I
IP Blckman _____ x
E1IP Simulator Specifications
Charging 50 kVVoltage:Self-breakdown 55 kVVoltage:Trigger Self-breakdown, pressure releaseMethod:
Sensor Specifications Sensor Specifications
Sensor Type: Eaton Current Probe, 94106-2 Sensor Type:Sensor 10 cm from base of antenna SensorLocation: Location:
Cable Network: Shielded N-Type (RG-214), BNC Cable Network:Attenuator 20 d8, Alan 50HT42 N at AttenuatorLocation: Current Probe Location:
Figure A6: Current Induced 10-cm from the base of a 72-cm antenna mounted on the PRC-77 radio.
28

DSA 602 DIGITIZING SIGNAL ANALYZER
date: 25-JAN-91 time: 14:32:38 EMP TEST DATA
Tek U-r-' mufidori&Wt 2 D W•W RSO5 TEST METHOD
Eqaipment Under rest Specifications
Device Type: PRC-77 Radio
" Test I.D.: N.2.1.30.whd
SConfiguration: 2t r iq'dSOrientation: 1
Receiver 30 MHzFrequency:
- -.', i ETI 7' In Power Status: OnDef~frn* No. of Pulses: 10
Pulse Rate: 3/min
Operation verbal/audio testConfirmed
Comwments: - no handset connected- modified plate antenna
!.r iq ,: A ,
-'9 9ns 5ns /d i n -lVertical "ortzontalZ Rcdure L upper ]- Page I Reme
Dese vesa.L- a ~MefJt k M oi n / t0r•p d HI I I Ifm
S--nput 1VT t an Ve i hen ert'icalParamete-r.sControl o 1 De ta s f tag at•f :Se I Pos; Wm 1
Av'g IdBM N~one 5 ac -,f.Blkmn V a V
EMP Simulator Specifications
Charging 50 kVVoltage:Self-breakdown z 55 kVVoltage:Trigger Self-breakdown, pressure releaseMethod:
Sensor Specifications Sensor Specifications
Sensor Type: Eaton Current Probe, 94106-2 Sensor Type:Sensor 10 cm from base of antenna SensorLocation: Location:Cable Network: Shielded N-Type (RG-214), BNC Cable Network:Attenuator 20 dB, Alan 50HT42 N at AttenuatorLocation: Current Probe Location:
Figure A7: Current Induced 10-cm from the base of a 50-cm plate antenna mounted on the PRC-77 radio.
29
ANNEX B: Measurement and Analysis
ABSTRACT:
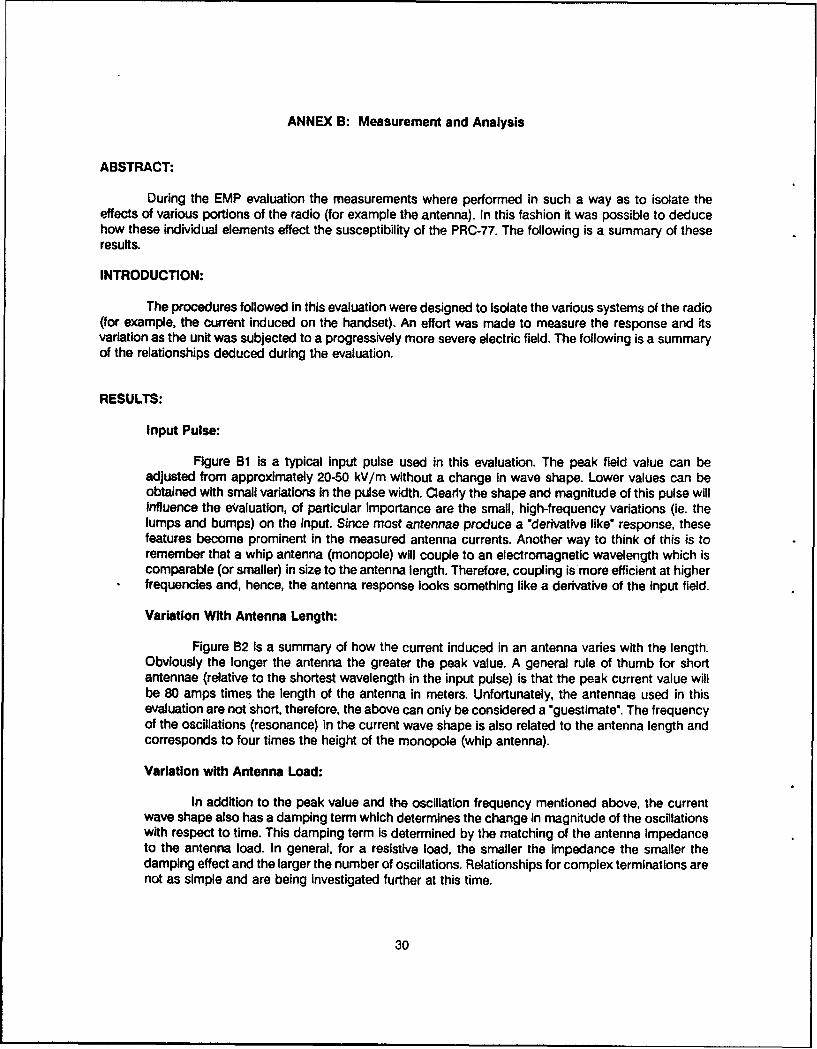
During the EMP evaluation the measurements where performed in such a way as to isolate theeffects of various portions of the radio (for example the antenna). In this fashion it was possible to deducehow these individual elements effect the susceptibility of the PRC-77. The following is a summary of theseresults.
INTRODUCTION:
The procedures followed in this evaluation were designed to isolate the various systems of the radio(for example, the current induced on the handset). An effort was made to measure the response and itsvariation as the unit was subjected to a progressively more severe electric field. The following is a summaryof the relationships deduced during the evaluation.
RESULTS:
Input Pulse:
Figure 81 Is a typical input pulse used in this evaluation. The peak field value can beadjusted from approximately 20-50 kV/m without a change In wave shape. Lower values can beobtained with small variations in the pulse width. Clearly the shape and magnitude of this pulse willInfluence the evaluation, of particular importance are the small, high-frequency variations (ie. thelumps and bumps) on the Input. Since most antennae produce a "derivative like" response, thesefeatures become prominent in the measured antenna currents. Another way to think of this is toremember that a whip antenna (monopole) will couple to an electromagnetic wavelength which iscomparable (or smaller) in size to the antenna length. Therefore, coupling is more efficient at higherfrequencies and, hence, the antenna response looks something like a derivative of the input field.
Variation With Antenna Length:
Figure B2 is a summary of how the current induced in an antenna varies with the length.Obviously the longer the antenna the greater the peak value. A general rule of thumb for shortantennae (relative to the shortest wavelength in the input pulse) is that the peak current value willbe 80 amps times the length of the antenna in meters. Unfortunately, the antennae used in thisevaluation are not short, therefore, the above can only be considered a "guestimate". The frequencyof the oscillations (resonance) in the current wave shape is also related to the antenna length andcorresponds to four times the height of the monopole (whip antenna).
Variation with Antenna Load:
In addition to the peak value and the oscillation frequency mentioned above, the currentwave shape also has a damping term which determines the change in magnitude of the oscillationswith respect to time. This damping term is determined by the matching of the antenna impedanceto the antenna load. In general, for a resistive load, the smaller the impedance the smaller thedamping effect and the larger the number of oscillations. Relationships for complex terminations arenot as simple and are being investigated further at this time.
30

60
$0
~40
2 20
- 0
30 50.0 100 150 200 250
77me (ns)
Figure BI: A typical Electric field wave form generated in the working volume of DREMPS.
500
- 72 cm Antenna
. 300 - 209 cm Antenna
.................................290 cm Antenna
1Wo. A ! " -.
h..
.100.
5, 100 5 0 200 250
Figure B2: Current induced in 72-cm, 209-cm and 290-cm antennae by an EMP (Figure B1). Both the
peak current value and antenna resonance frequency increase with the antenna length.
31
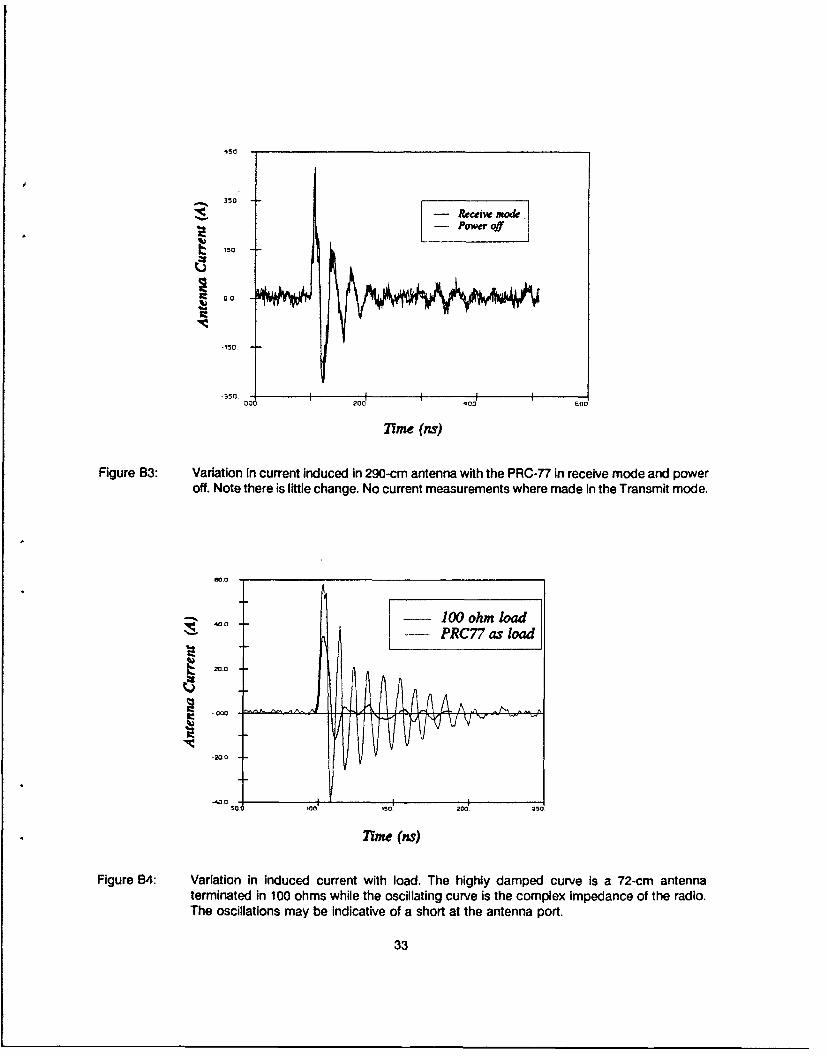
The peak values of the Induced current will also be influenced by the antenna termination.This can be understood by thinking of the antenna and the load as two coupled circuits. Themaximum power transfer will occur when the impedance of the two are matched, hence, variationsIn coupling current are expected as the termination value is varied. Alternatively, :he antenna canbe thought of as a non-linear transmission line with the antenna load acting as a termination. Thismodel will also produce a variation in the measured current with respect to the load impedance.
Figure B3 is the current induced in a 72-cm monopole with both a 100 ohm resistance andthe PRC-77 acting as the antenna load. Note the variation in the peak values and damping term. Thelarge number of oscillations In the radio response indicates a low termination value. This may bea result of a matched complex impedance in the radio tuner (which is not unreasonable consideringthis Is consistent with the radio operation) or a short circuit resulting from an electrical arc at or nearthe antenna port. Further experimentation would be necessary to resolve the situation, however, theformer solution seems to be the most probable.
Variation with Radio Status:
In order to establish how the induced current varies with the status of the radio, currentmeasurements where made with the unit in power off mode and in the receive mode. The transmitmode was not measured because the radio emissions would saturate the ferrite core of the currentprobes used on the antenna and lead to erroneous results (and possibly damage the fiber optic linkused to transmit the measured sigr~al to the shielded enclosure where it was recorded). As can beseen form Figure B4 there is no difference between the two measured results. This is reasonablesince the front end of the radio is essentially composed of passive elements, hence, the loadimpedance should not vary with the power status.
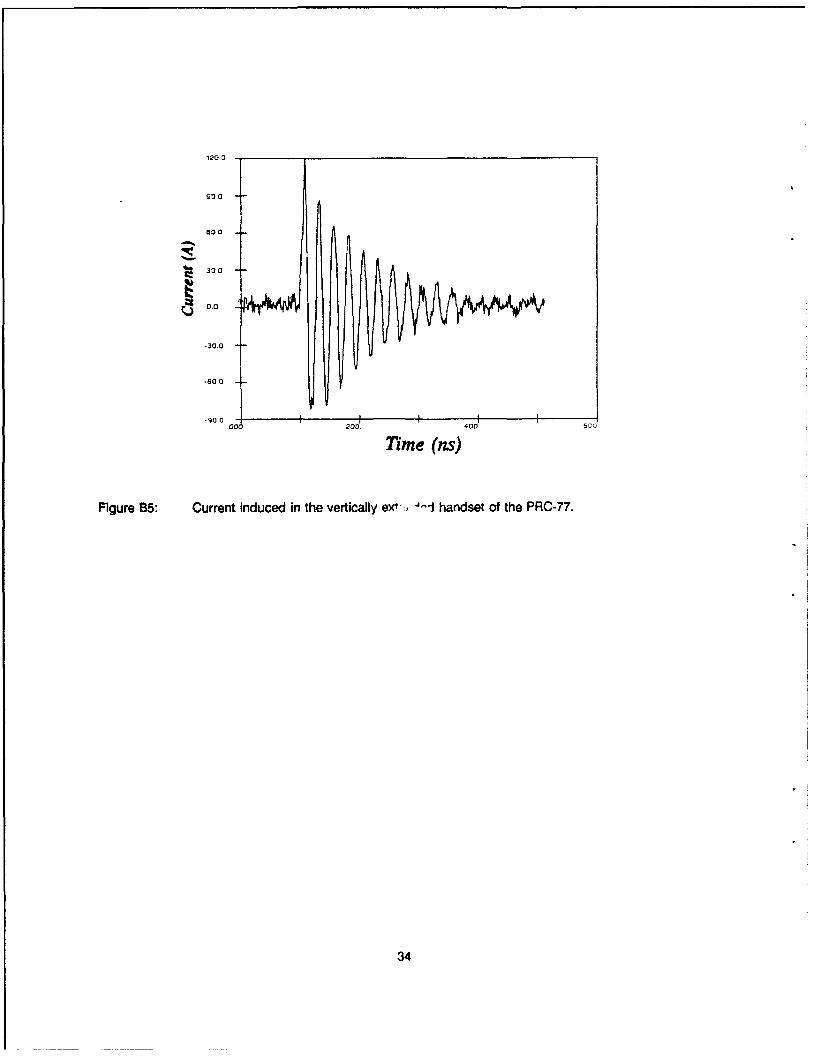
Current Induced in Handset:
Although the antenna is often the primary source for external pick-up, the handset Is alsocapable of coupling a substantial current into the radio. In the worst-case situation (which is whatwas used in the evaluation) the handset is fully extended vertically in either the up or down position.In either case (and experimentation shows they produce similar responses), the handset and itscable can simply be considered to be a monopole as discussed above. The current typicallyInduced is shown if Figure B5. Note that the peak values exceed those of the 72-cm whip antennabut not those of the longer antennae.
32
450
- Receie mode- POWr Off
150
-35000 200 400 600
77me (ns)
Figure B3: Variation in current induced in 290-cm antenna with the PRC-77 in receive mode and poweroff. Note there is little change. No current measurements where made in the Transmit mode.
,100 ohm load
I. 20.0
-200
-425050 '00 150 200 2•50
71me (ns)
Figure 84: Variation in induced current with load. The highly damped curve is a 72-cm antennaterminated in 100 ohms while the oscillating curve is the complex impedance of the radio.The oscillations may be indicative of a short at the antenna port.
33
1200 - _____
900
600
30ý0
0.0
-300
-600
.900 - I I I000 200. 400 500
Time (ns)
Figure B5: Current induced in the vertically ext-:, -- 1 handset of the PRC-77.
34

ANNEX C: Calibration and Perfo,. nce Check of Radio
ABSTRACT:
Details of the calibration procedure and performance checks used during the EMP evaluation arediscussed. Results of the radio monitoring are presented and it is shown that the PRC-77 survived the EMPexposures with .lnly minor degradation in performance.
INTRODUCTION:
In order to evaluate how the PRC-77 was effected by EMP exposure, a performance check of theradio prior to and after the evaluation was required. In addition, since the investigation proceeded in anincremental fashion with each step providing an additional degree of susceptibility, it is possible to performa series of intermediate tests on tne radio to establish when (and if) damage occurs. This techniqueminimizes the damage induced on the unit while maximizing the information obtained from the evaluation.
It should be noted that the procedures used to monitor the radio were far from optimal. Forexample, an extensive analytical test was performed only for the receive mode (the transmit mode wastested but in a simpler fashion). In addition, since only changes in the radio performance were of interest,little effort was made to calibrate the radio against an absolute standard. Finally, the method used to recordthe SNR is questionable and will be changed in future eva;uations.
MONITORING PROCEDURES:
The operation of the radio was checked using a number of procedures, depending on the statusof the EMP evaluation. T'he procedures are as follows:
1) The first is a simple voice check between the radir' being evaluated and a similar monitor radio.Although this appears to be an overly simple and highly subjective criteria, it is sufficient forthe relatively simple "go/no-go" criteria established fu,r the EMP evaluotion. The advantage ofth~s test is that it is very quick and both the transmit and receive mode can jasily be checkedbetween series of EMP exposures (between changes in orientation etc. for example).
2) The second performance check is a more quantitative version of the above and was primarilyperformed in the second phase of the EMP evaluation. In this case the receive mode wasmonitorod by placing a second radio at a fixed location approximately 30 m from the i.est radio.This scn.ond radio was set to transmit it's 150 Hz internal tone (used for the squelch control)or alternatively an externally induced 1 kHz tone. The test radio was set to receive mode andthe audio signal from the handset was monitored on an oscilloscope. With it's whip antennaremoved, the vwlume control on the test radio was then adjusted such that the amplitude ofthe received signal was only a factor of 2-3 above the ambient r ise level. This was done sothat the Automatic Volume Control inherent in the radio could not compensate for anydegradation which may occur. The signals received above formed the baseline for periodicchecks during the EMP evaluation which confirmed the radio's continued performance. Notethat the radios were returned to their calibration locations for these performance tests.
In order to monitor the transmit mode, the test radio was placed at a fixed locationapproxlniately 30 m from a shielded enclosure. A monopole was placed on this enclosure andthe induced signal (basically the carrier) was viewed on an oscilloscope. By recording the signalstrength at the beginning of a test sequence and repeating the measurement at the end, anysignifica;it changes to the radio would be detected.
35
As with the voice check above, this procedure is not intended to be an exhaustive test of theradio but a quick check to ensure it has passed the "go/no-go* criteria of the EMP evaluation.
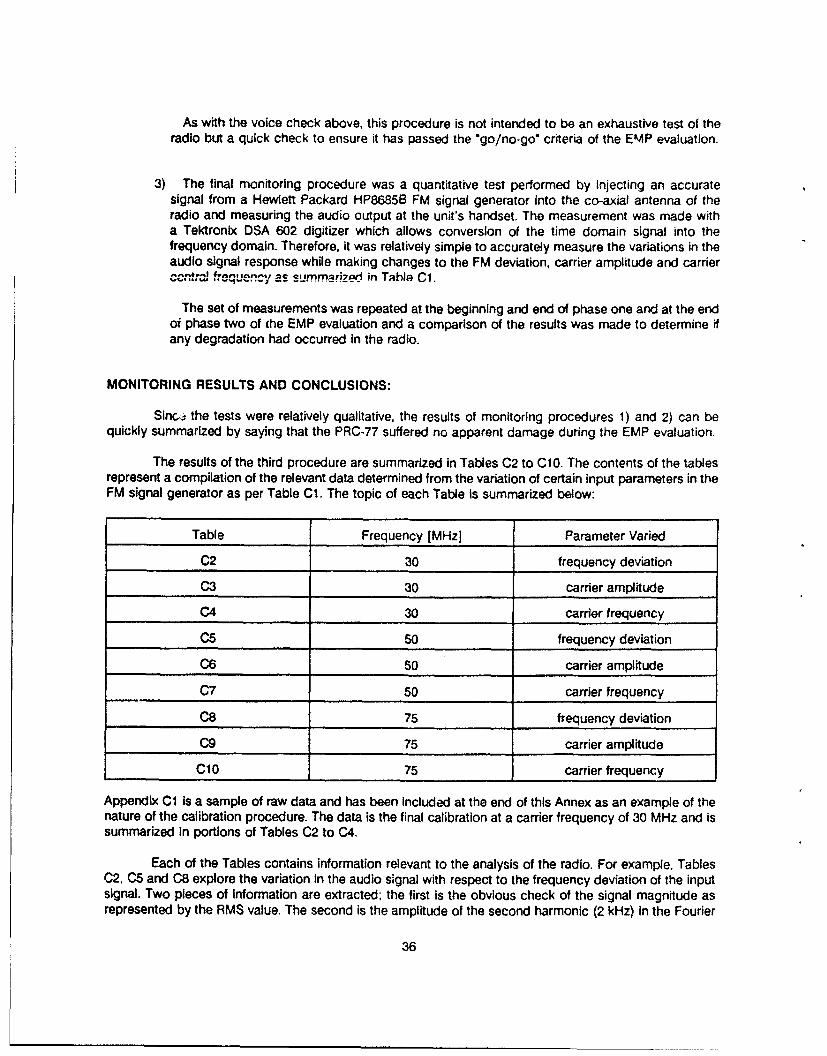
3) The final monitoring procedure was a quantitative test performed by Injecting an accuratesignal from a Hewlett Packard HP86858 FM signal generator into the co-axial antenna of theradio and measuring the audio output at the unit's handset. The measurement was made witha Tektronix DSA 602 digitizer which allows conversion of the time domain signal into thefrequency domain. Therefore, it was relatively simple to accurately measure the variations in theaudio signal response while making changes to the FM deviation, carrier amplitude and carrier
,.,. ,, C .m.m3ri in Tahle C1.
The set of measurements was repeated at the beginning and end of phase one and at the endof phase two of che EMP evaluation and a comparison of the results was made to determine ifany degradation had occurred in the radio.
MONITORING RESULTS AND CONCLUSIONS:
Sinc.4 the tests were relatively qualitative, the results of monitoring procedures 1) and 2) can bequickly summarized by saying that the PRC-77 suffered no apparent damage during the EMP evaluation.
The results of the third procedure are summarized In Tables C2 to C10. The contents of the tablesrepresent a compilation of the relevant data determined from the variation of certain input parameters in theFM signal generator as per Table C1. The topic of each Table is summarized below:
Table Frequency [MHz] Parameter Varied
C2 30 frequency deviation
C3 30 carrier amplitude
C4 30 carrier frequency
C5 50 frequency deviation
C6 50 carrier amplitude
C7 50 carrier frequency
C8 75 frequency deviation
09 75 carrier amplitude
C10 75 carrier frequency
Appendix C1 is a sample of raw data and has been Included at the end of this Annex as an example of thenature of the calibration procedure. The data is the final calibration at a carrier frequency of 30 MHz and issummarized in portions of Tables C2 to C4.
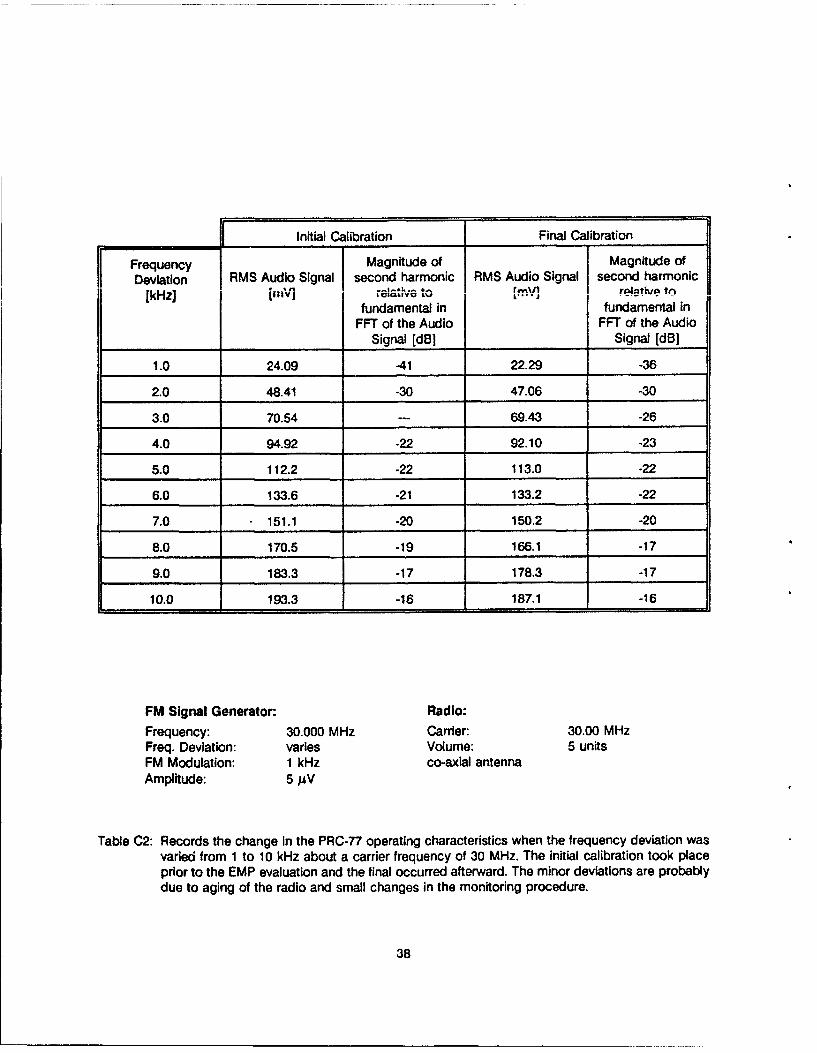
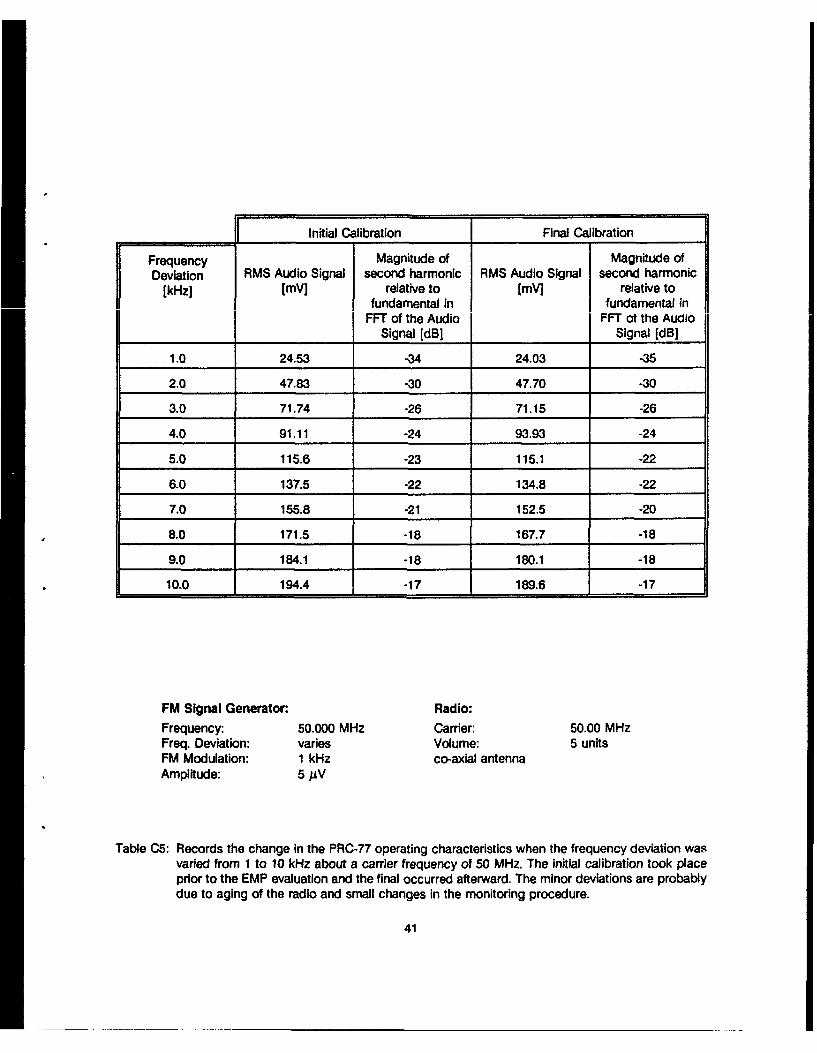
Each of the Tables contains information relevant to the analysis of the radio. For example, TablesC2, C5 and C8 explore the variation in the audio signal with respect to the frequency deviation of the inputsignal. Two pieces of information are extracted; the first is the obvious check of the signal magnitude asrepresented by the RMS value. The second is the amplitude of the second harmonic (2 kHz) in the Fourier
36

Transform of the signal relative to the fundamental (1 kHz). This value is a measure of the sinusoidaldistortion of the signal as the frequency deviation increases. There are only small deviations between theinitial and final data which could be attributed to measurement error.
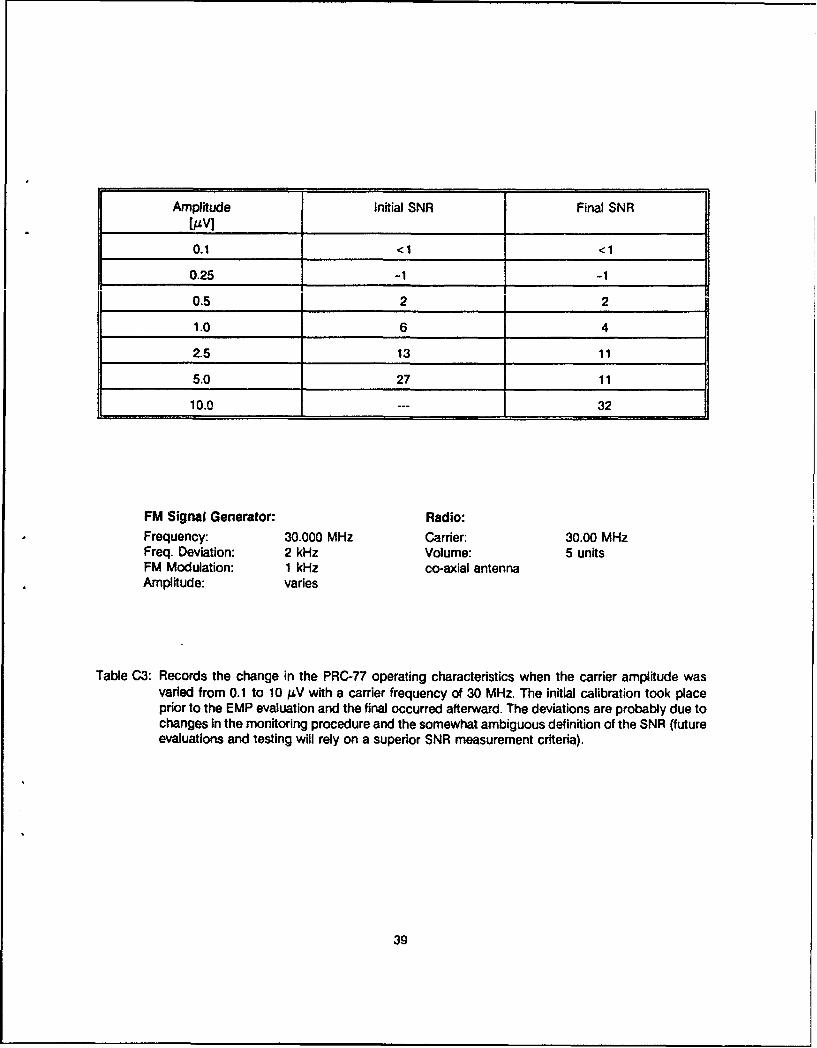
Tables C3, C6 and C9 measure the variation with respect to input signal amplitude expressed asa signal to noise ratio (SNR). The value was obtained by measuring the peak value of the fundamental andcomparing this to the noise baseline determined at approximately 8-9 kHz. This method is not optimal sinceit is prone to errors induced by the sampling rate and window size in the FFT, etc. and as a result some ofthe SNR values are questionable. Other methods will be used in future evaluatiors.
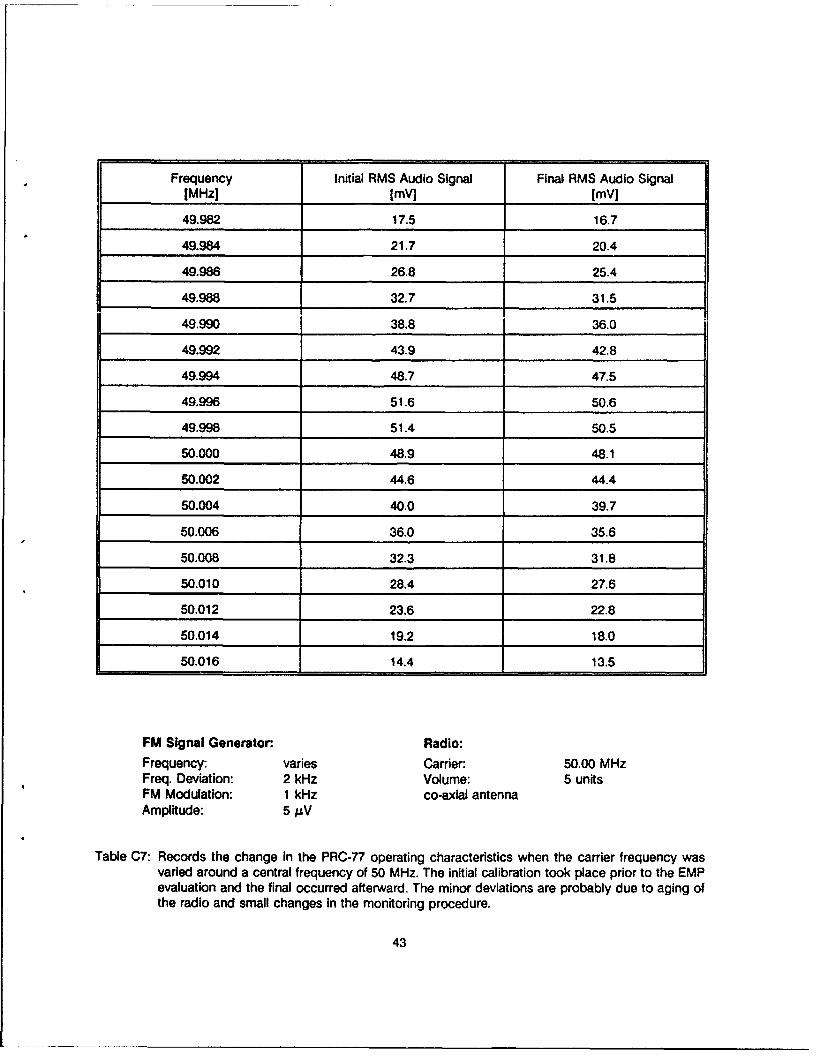
Table C4, C7 and C10 explore the results of varying the central frequency of the carrier by variousamounts. The RMS values obtained from the audio signai are cunsit oitiily a few percent lower after the ,.,exposures, however such small changes are well within measurement error and are not consideredimportant.
In conclusion, although this final monitoring procedure is a more detailed check and, hence,provides more Information about the radio, it is still reasonable to summarize the results by stating that thePRC-77 suffered no significant damage as a result of the EMP exposures. There are a number of faults inthe monitoring process, for example the transmit mode of the radio was not extensively tested. Also, sincethe initial and final calibration were performed almost 2 years apart, the minor changes in the radioperformance may be attributed to aging of the unit, small changes in the evaluation procedures, etc. Clearly,if a criteria more stringent than the 'go/no-go" requirement were set for the radio, then a more exhaustivemonitoring procedure with more caution in its implementation would have been justified and used. Asmentioned previously at various stages of this report, this entire evaluation was one of the first performedat DREO and there are no clients requesting specific Information. As a result, these simplifications wereconsidered acceptable since no serious compromise has been made in the evaluation validity orconclusions.
FM Signal Generator: Radio:
Frequency: 30, 50 or 75 MHz Carrier: to match FM generatorFrequency Deviation: 1 to 10 kHz Volume: 5 unitsFM Modulation: 1 kHz co-axial antennaAmplitude: 0.1 to 10.0 )IV
Table C1: Input parameters (bold) used in the monitoring procedure of the PRC-77 radio. Each value wasvaried individually while the audio output at the handset of the radio was recorded. The valuesobtained at the end of the EMP evaluation were compared to those obtained in the initialcalibration to establish if any radio degradation had occurred.
37
Initial Calibration Final Calibration
Frequency Magnitude of Magnitude of
Deviation RMS Audio Signal second harmonic RMS Audio Signal second harmonickmi1 rdaftiva tn
[kHz] mW]nfundamental in fundamental in
FFT of the Audio FFT of the AudioSignal [dB1 Signal [dBj
1.0 24.09 A41 22.29 .36
2.0 48.41 -30 47.06 -30
3.0 70.54 -- 69.43 -26
4.0 94.92 -22 92.10 -23
5.0 112.2 -22 113.0 -22
6.0 133.6 -21 133.2 -22
7.0 151.1 -20 150.2 -20
8.0 170.5 -19 166.1 -17
9.0 183.3 -17 178.3 -17
10.0 193.3 -16 187.1 -16
FM Signal Generator: Radio:
Frequency: 30.000 MHz Carrier: 30.00 MHzFreq. Deviation: varies Volume: 5 unitsFM Modulation: 1 kHz co-axial antennaAmplitude: 5 /4V
Table C2: Records the change In the PRC-77 operating characteristics when the frequency deviation wasvaried from 1 to 10 kHz about a carrier frequency of 30 MHz. The initial calibration took placeprior to the EMP evaluation and the final occurred afterward. The minor deviations are probablydue to aging of the radio and small changes in the monitoring procedure.
38
Amplitude Initial SNR Final SNR[.. V]__0.1 <1 <1
0.25 -1 -1
0.5 2 2
1.0 6 4
2.5 13 11
5.0 27 11
10.0 --- 32
FM Signal Generator: Radio:
Frequency: 30.000 MHz Carrier: 30.00 MHzFreq. Deviation: 2 kHz Volume: 5 unitsFM Modulation: 1 kHz co-axial antennaAmplitude: varies
Table C3: Records the change in the PRC-77 operating characteristics when the carrier amplitude wasvaried from 0.1 to 10 /V with a carrier frequency of 30 MHz. The initial calibration took placeprior to the EMP evaluation and the final occurred afterward. The deviations are probably due tochanges in the monitoring procedure and the somewhat ambiguous definition of the SNR (futureevaluations and testing will rely on a superior SNR measurement criteria).
39

Frequency Initial RMS Audio Signal Final RMS Audio Signal
[MHz] [mV] ImV]
29.982 17.6 15.6
29.984 21.6 19.6
29.986 26.6 23.0
29.988 32.3 32.1
29.990 38.3 36.7
29.992 43.9 42.0
29.994 48.2 47.1
29.996 51.3 49.1
29.998 50.3 47.5
30.000 47.7 45.5
30.002 43.7 44.6
30.004 39.2 37.0
30.006 35.4 33.5
30.008 31.4 30.7
30.010 27.8 26.5
30.012 22.9 22.5
30.014 18.7 18.1
30.016 14.1 14.5
FM Signal Generator: Radio:
Frequency: varies Carrier. 30.00 MHzFreq. Deviation: 2 kHz Volume: 5 unitsFM Modulation: 1 kHz co-axial antennaAmplitude: 5 AV
Table C4: Records the change in the PRC-77 operating characteristics when the carrier frequency wasvaried around a central frequency of 30 MHz. The initial calibration took place prior to the EMPevaluation and the final occurred afterward. The minor deviations are probably due to aging ofthe radio and small changes in the monitoring procedure.
40
Initial Calibration Final Calibration
Frequency Magnitude of Magnitude ofDeviation RMS Audio Signal second harmonic RMS Audio Signal second harmonic
[kHz] [mV] relative to [mV] relative tofundamental in fundamental in
FFT of the Audio FFT of the AudioSignal [dBI Signal [dBj
1.0 24.53 -34 24.03 -35
2.0 47.83 -30 47.70 -30
3.0 71.74 -26 71.15 -26
4.0 91.11 -24 93.93 -24
5.0 115.6 -23 115.1 -22
6.0 137.5 -22 134.8 -.22
7.0 155.8 -21 152.5 -20
8.0 171.5 -18 167.7 -18
9.0 184.1 -18 180.1 -18
10.0 194.4 -17 189.6 -17
FM Signal Generator: Radio:
Frequency: 50.000 MHz Carrier: 50.00 MHzFreq. Deviation: varies Volume: 5 unitsFM Modulation: 1 kHz co-axial antennaAmplitude: 5 AV
Table C5: Records the change in the PRC-77 operating characteristics when the frequency deviation wasvaried from 1 to 10 kHz about a carrier frequency of 50 MHz. The initial calibration took placeprior to the EMP evaluation and the final occurred afterward. The minor deviations are probablydue to aging of the radio and small changes in the monitoring procedure.
41

Amplitude Initial SNR Final SNR
0.1 <1 <1
0.25 -1 -1
0.5 4 2
1.0 7 6
2.5 13 12
5.0 32 13
10.0 45 1
FM Signal Generator: Radio:
Frequency: 50.000 MHz Carrier: 50.00 MHzFreq. Deviation: 2 kHz Volume: 5 unitsFM Modulation: 1 kHz co-axial antennaAmplitude: varies
Table C6: Records the change In the PRC-77 operating characteristics when the carrier amplitude wasvaried from 0.1 to 10 ,V with a carrier frequency of 50 MHz. The Initial calibration took placeprior to the EMP evaluation and the final occurred afterward. The deviations are probably due tochanges in the monitoring procedure and the somewhat ambiguous definition of the SNR (futureevaluations and testing will rely on a superior SNR measurement criteria).
42
Frequency Initial RMS Audio Signal Final RMS Audio Signal
[MHz] [mV] [mV]
49.982 17.5 16.7
49.984 21.7 20.4
49.986 26.8 25.4
49.988 32.7 31.5
49.990 38.8 36.0
49.992 43.9 42.8
49.994 48.7 47.5
49.996 51.6 50.6
49.998 51.4 50.5
50.000 48.9 48.1
50.002 44.6 44.4
50.004 40.0 39.7
50.006 36.0 35.6
50.008 32.3 31.8
50.010 28.4 27.6
50.012 23.6 22.8
50.014 19.2 18.0
50.016 14.4 13.5
FM Signal Generator: Radio:
Frequency: varies Carrier: 50.00 MHzFreq. Deviation: 2 kHz Volume: 5 unitsFM Modulation: 1 kHz co-axial antennaAmplitude: 5 /V
Table C7: Records the change In the PRC-77 operating characteristics when the carrier frequency wasvaried around a central frequency of 50 MHz. The initial calibration took place prior to the EMPevaluation and the final occurred afterward. The minor deviations are probably due to aging ofthe radio and small changes in the monitoring procedure.
43
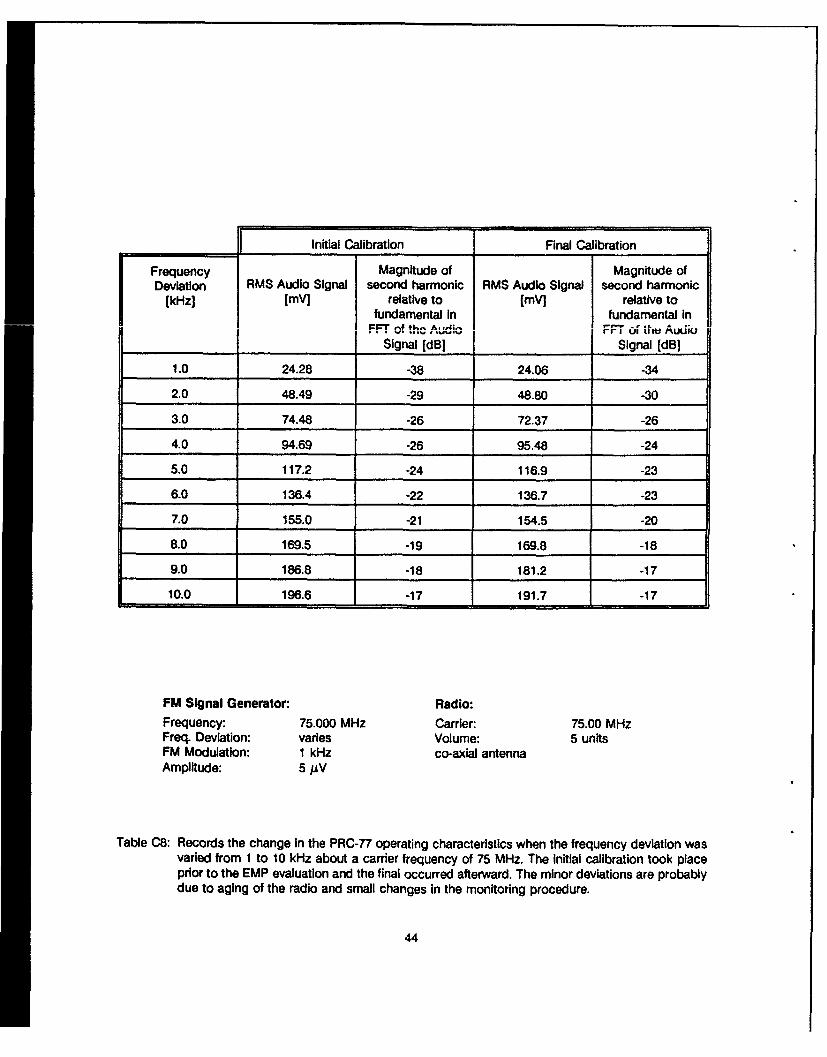
Initial Calibration Final Calibration
Frequency Magnitude of Magnitude ofDeviation RMS Audio Signal second harmonic RMS Audio Signal second harmonic
[kHz] [mV] relative to [mVj relative tofundamental In fundamental inFFT' of th.e, A-~4;.- d- - h. ,,
Signal [dBI _ _ _ Signal [dB]
1.0 24.28 -38 24.06 -34
2.0 48.49 -29 48.80 -30
3.0 74.48 -26 72.37 -26
4.0 94.69 -26 95.48 -24
5.0 117.2 -24 116.9 -23
6.0 136.4 -22 136.7 -23
7.0 155.0 -21 154.5 -20
8.0 169.5 -19 169.8 -18
9.0 186.8 -18 181.2 -17
10.0 196.6 -17 191.7 -17
FM Signal Generator: Radio:Frequency: 75.000 MHz Carrier: 75.00 MHzFreq. Deviation: varies Volume: 5 unitsFM Modulation: I kHz co-axial antennaAmplitude: 5 /&V
Table C8: Records the change In the PRC-77 operating characteristics when the frequency deviation wasvaried from 1 to 10 kHz about a carrier frequency of 75 MHz. The initial calibration took placeprior to the EMP evaluation and the final occurred afterward. The minor deviations are probablydue to aging of the radio and small changes in the monitoring procedure.
44
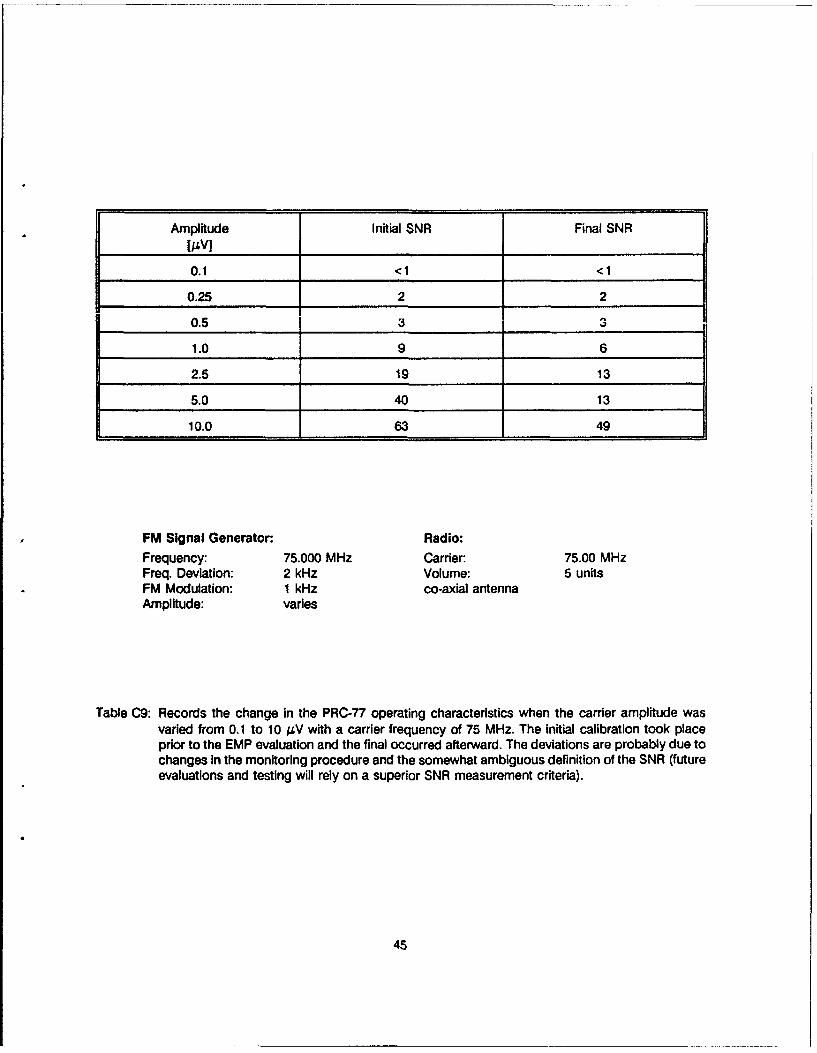
Amplitude Initial SNR Final SNR
0.1 <1 <1
0.25 2 2
0.5 3
1.0 9 6
2.5 19 13
5.0 40 13
10.0 63 49
FM Signal Generator: Radio:
Frequency: 75.000 MHz Carrier: 75.00 MHzFreq. Deviation: 2 kHz Volume: 5 unitsFM Modulation: 1 kHz co-axial antennaAmplitude: varies
Table C9: Records the change in the PRC-77 operating characteristics when the carrier amplitude wasvaried from 0.1 to 10 /V with a carrier frequency of 75 MHz. The initial calibration took placeprior to the EMP evaluation and the final occurred afterward. The deviations are probably due tochanges in the monitoring procedure and the somewhat ambiguous definition of the SNR (futureevaluations and testing will rely on a superior SNR measurement criteria).
45
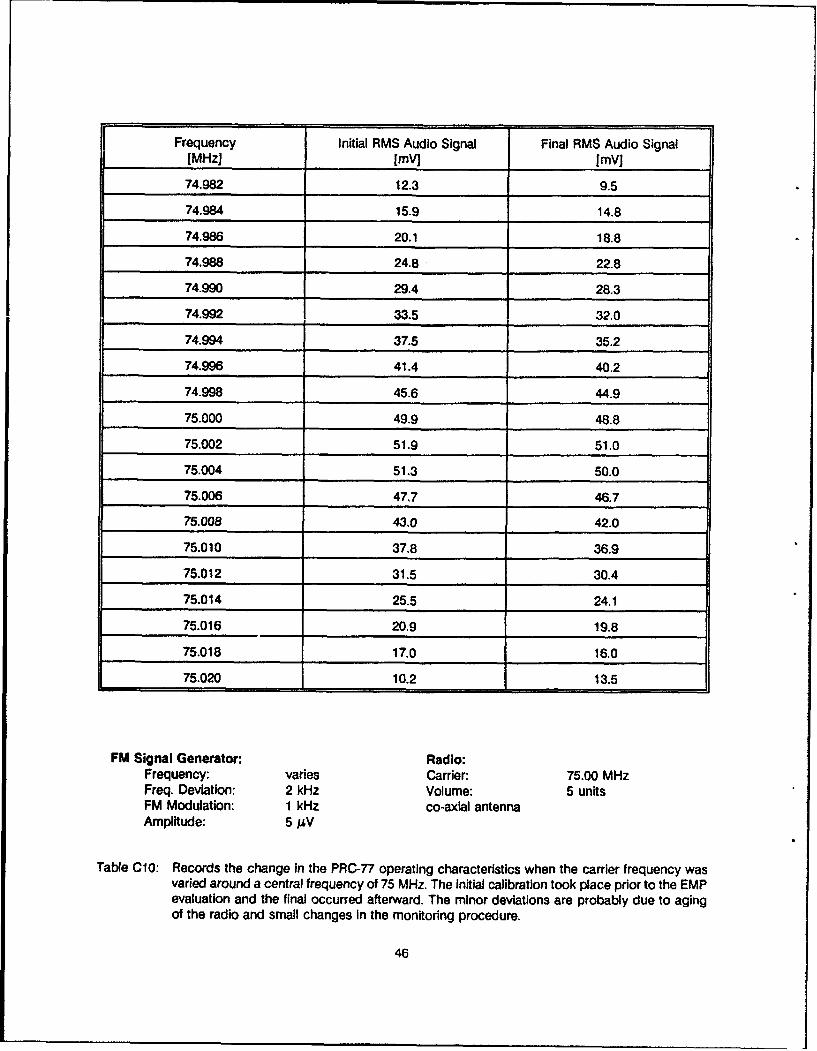
Frequency Initial RMS Audio Signal Final RMS Audio Signal
[MHz] [mV] [mV]
74.982 12.3 9.5
74.984 15.9 14.8
74.986 20.1 18.8
74.988 24.8 22.8
74.990 29.4 28.3
74.992 33.5 32:0
74.994 37.5 35.2
74.996 41.4 40.2
74.998 45.6 44.9
75.000 49.9 48.8
75.002 51.9 51.0
75.004 51.3 50.0
75.006 47,7 46.7
75.008 43.0 42.0
75.010 37,8 36.9
75.012 31.5 30.4
75.014 25.5 24.1
75.016 20.9 19.8
75.018 17.0 16.0
75.020 10.2 13.5
FM Signal Generator: Radio:Frequency: varies Carrier: 75.00 MHzFreq. Deviation: 2 kHz Volume: 5 unitsFM Modulation: 1 kHz co-axial antennaAmplitude: 5 /V
Table C10: Records the change In the PRC-77 operating characteristics when the carrier frequency wasvaried around a central frequency of 75 MHz. The initial caiibration took place prior to the EMPevaluation and the final occurred afterward. The minor deviations are probably due to agingof the radio and small changes In the monitoring procedure.
46

Appendix C1
Raw Data From PRC-77 Calibration
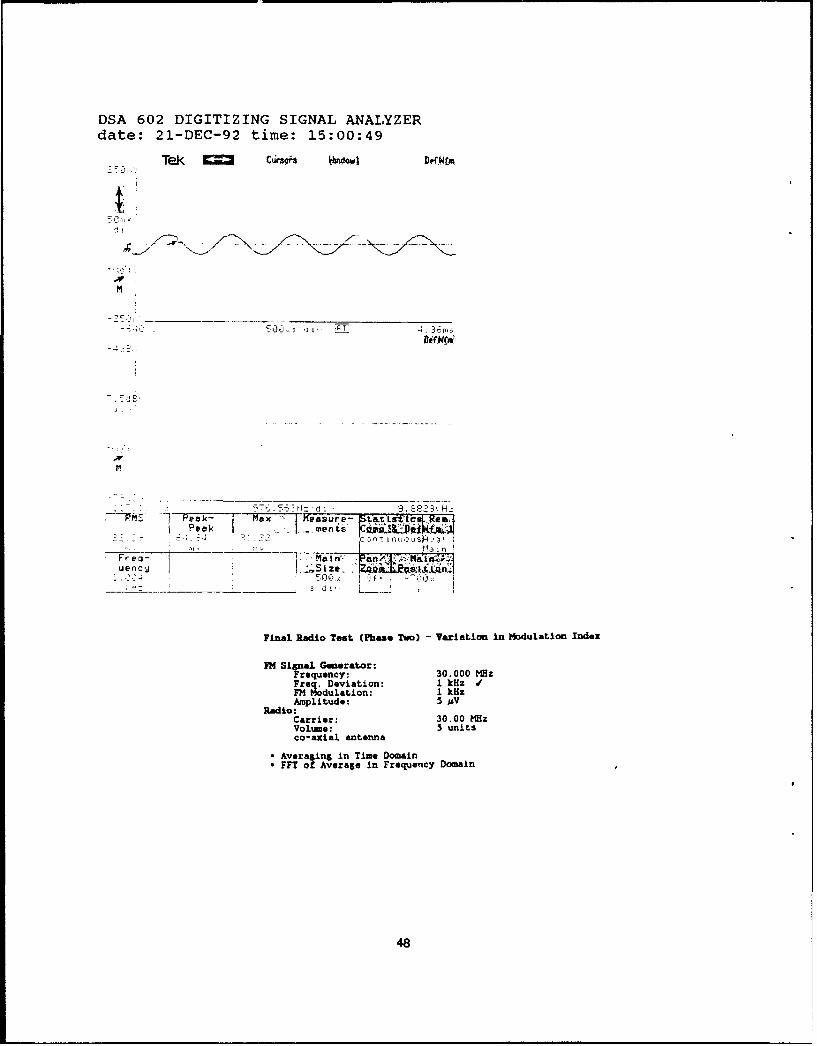
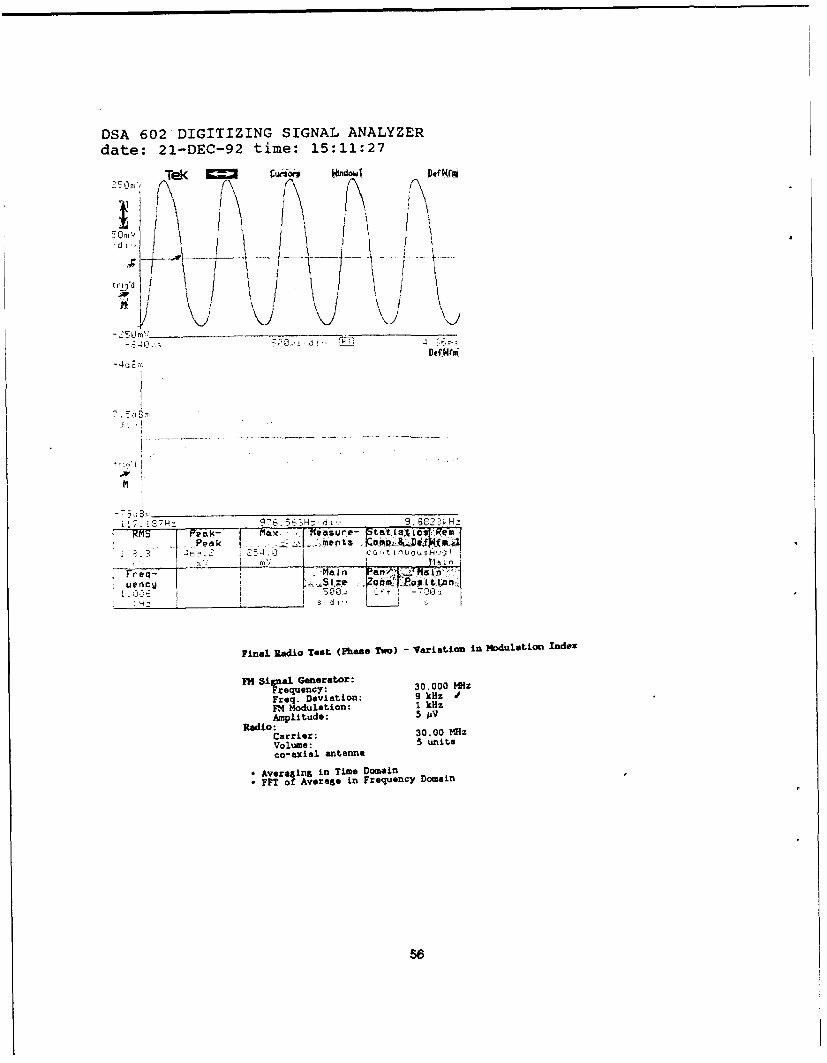
Pages 48 to 64 are an indication of the format used for the calibration data. The data shown onpages 48 to 57 is the variation in the frequency deviation during the final radio test (at the end of the EMPexposures of Phase Two). The top curve In the plot is the time-domain response of the audio signal receivedat the handset The lower curve is the FFT of this signal and was Included as a means of quantifying theharmonic distortion displayed as the frequency deviation of the FM Input signal was increased from 1 to9 kHz. This distortion Is represented by the magnitude of the second harmonic relative to the first in TablesC2, C5 and C8 (summaries of this and similar data sets). The RMS values of the time domain signals werealso included in the table summary.
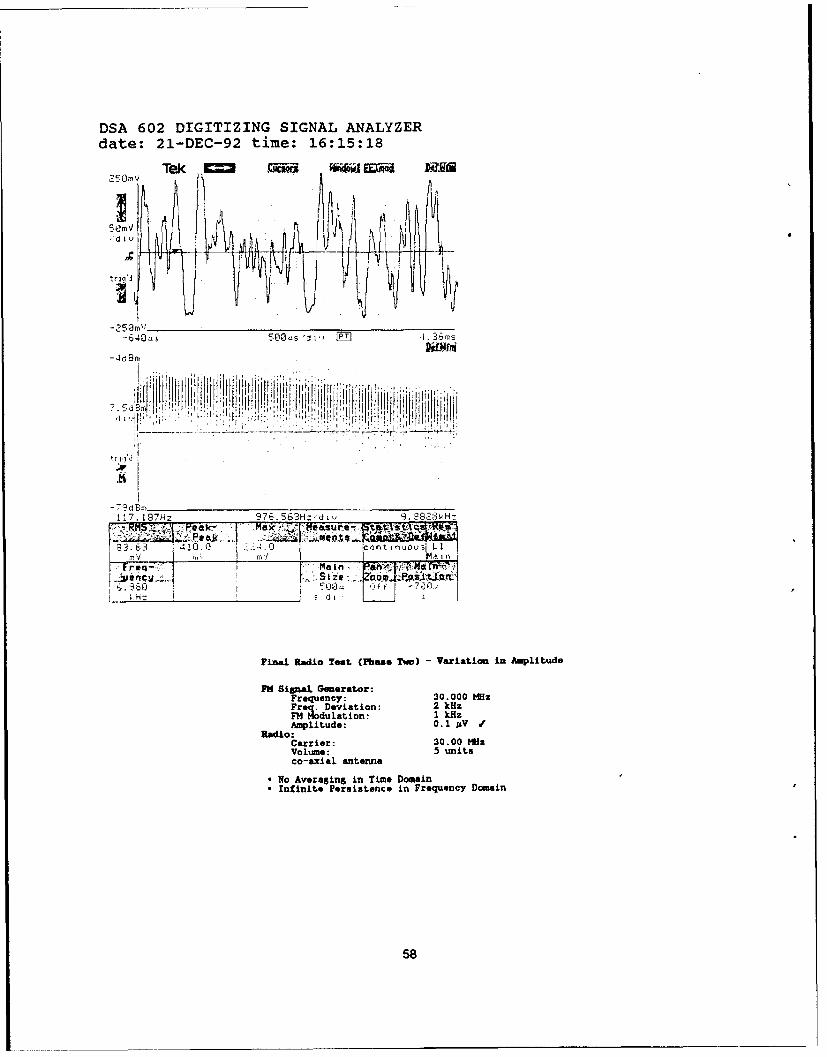
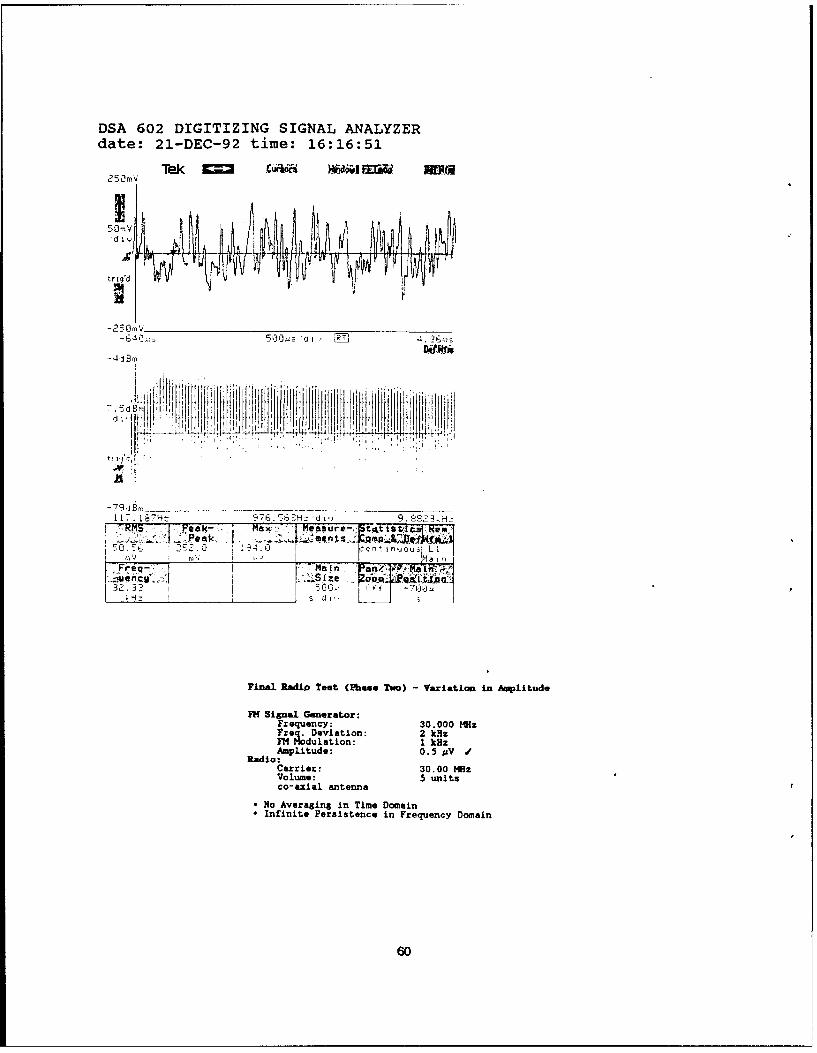
The data shown on pages 58 to 64 is again the audio response of the radio but this time theamplitude of the FM Input signal was varied from 0.1 to 10.0 /V. This data is summarized in Tables C3, C6and C9 as a signal-to-noise ratio (SNR). The measurement of this ratio proved to be difficult with themethods used in this analysis and other techniques means will be used in the future.
47
DSA 602 DIGITIZING SIGNAL ANALYZERdate: 21-DEC-92 time: 15:00:49
Tek C urCdMOS Wdows1 De$Wm
t:1
M
M
;7
1~tI~ 1~eak- Max Fissure- S&~tCLe,-- Peak ., .. mns jp
FeaMW- L -u eCU . Sile. l7S.. , -d t.
I:Z ,'U'!
Final Radio Test (Pthase Two) Variation in ModulatLio Index
IM Signal Generator:requency: 30.000 'Mz
Freq. Deviation: I kHz WFM Modulation: I kHzAmplitude: 5 AV
Radio:Carrier: 30.00 MHzVolume: 5 unitsco-axial antenna
* Averasing in Time Domain* FFT of Averase in Frequency Domain
48
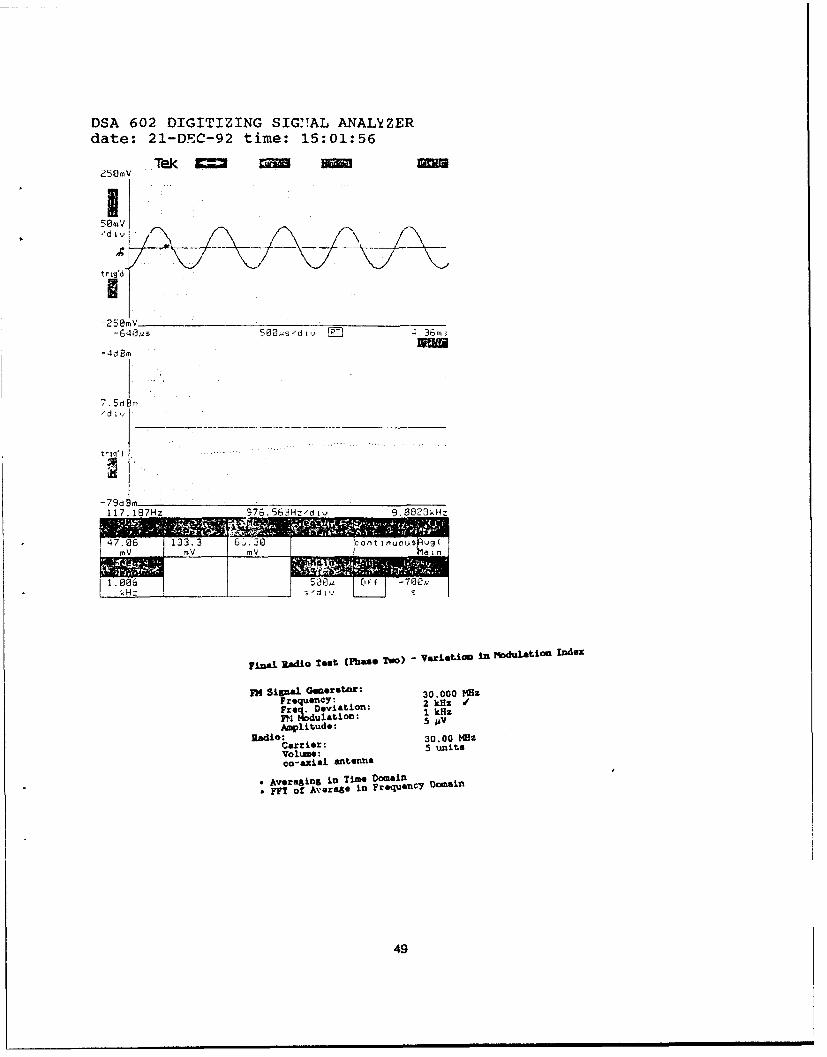
DSA 602 DIGITIZING SIG:TAL ANALYZERdate: 21-DEC-92 time: 15:01:56
25fV Tek X= a Ma
/divIA;
tr ig'd
-25OmV-640us 500ýs-div KT 4 36m.3
-4dBm
7. 5dBmI y
-79dBni117.187Hz 976.563Hz/div 9.0828kHz
47.06 133.3 6&.30
73. 30 1cv ty i nuotts
Filnal adio Test. (Ph"m* Two) - Variatio inm 4 Id ltLon Inder
PH Sipal Guzenst~oz: 30.000 M5zFrequency: 2 k z W
q. Dvition: kHzFN MdulatiOn: 5 AVAmpLitude: 5jV
Radio: 30.00 MOZCarrier: 5 uni tsVol.me :Go-axha antennarn
- Averagins in Time Domain. FFT of Average In Frequen Dcmailn
49

DSA 602 DIGITIZING SIGNAL ANALYZERdate: 21-DEC-92 time: 15:02:52
Tek = cýiOi lndoldj Defirm
;f
M.
RMS peak-, max Me&:Urp-A~ta.151tLcst Rem
*ueocuSie o.0atn
Final Radio Test (Phase Two) -Variation in Modulation Index
PH4 Signal Generator:Frequency: 30.000 M~zFreq Diation: 3 kHzFN Hodu~lvatio: 1 kHzAmpLitude 5 14V
Radio:Carrier: 30.00 MIz"Volume: 5 unit.co-axial antenna
*Averaging in Time Domain*-FFT of Average in Frequency Doma'in
50
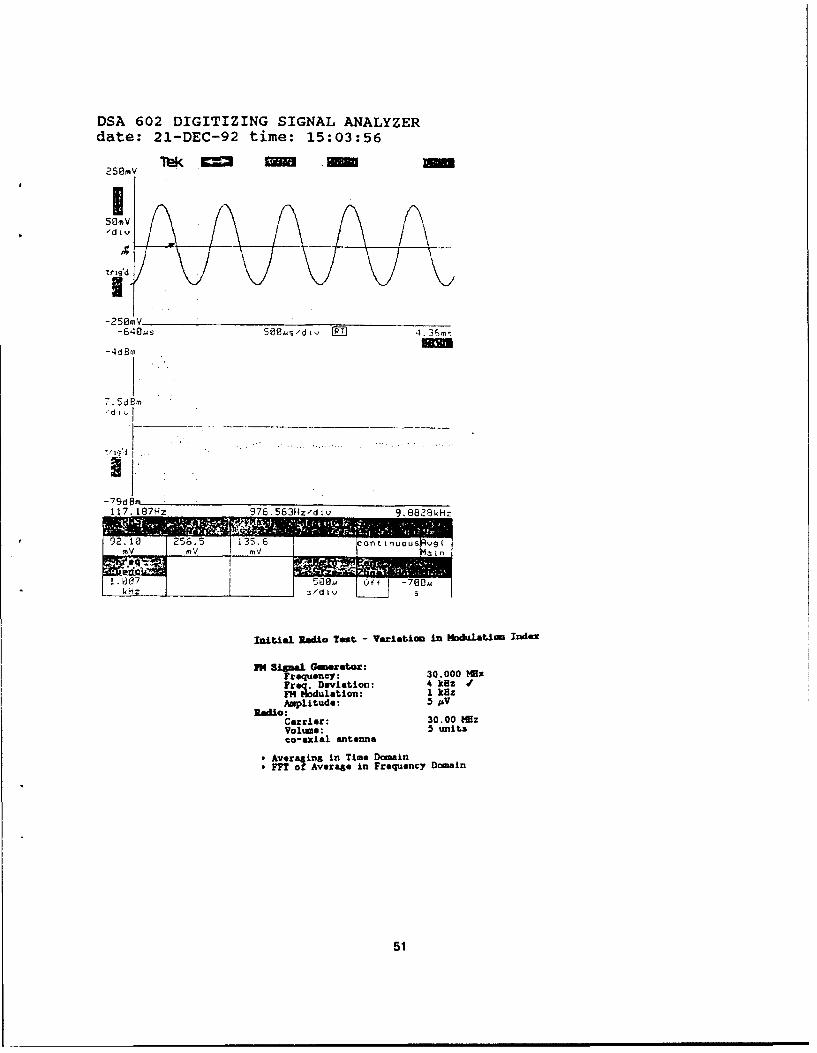
DSA 602 DIGITIZING SIGNAL ANALYZERdate: 21-DEC-92 time: 15:03:56
258mV
/dlv
"trig'd
-258mV-64gs 500S/djv i -T 4. 3,ms
-4d Brn
7. 5d em
-79d~m117.187Hz 976.563Hz/div 9.8829kHz
Init~ ~ ~ alRao .t- aainIn I~d~to na
=I SizI Gmzat o:*requnny: 30. 000 MM
Freq. Deviation: 4 kHz oEM Modulation: 1 RBzAmplitude: 5 IsVRadio:
Carrier: 30.00 #zVolume: 5 unitsco-axIal antenna
"* Averaging in Time Domain"* FFT of Average in Frequency Domain
51
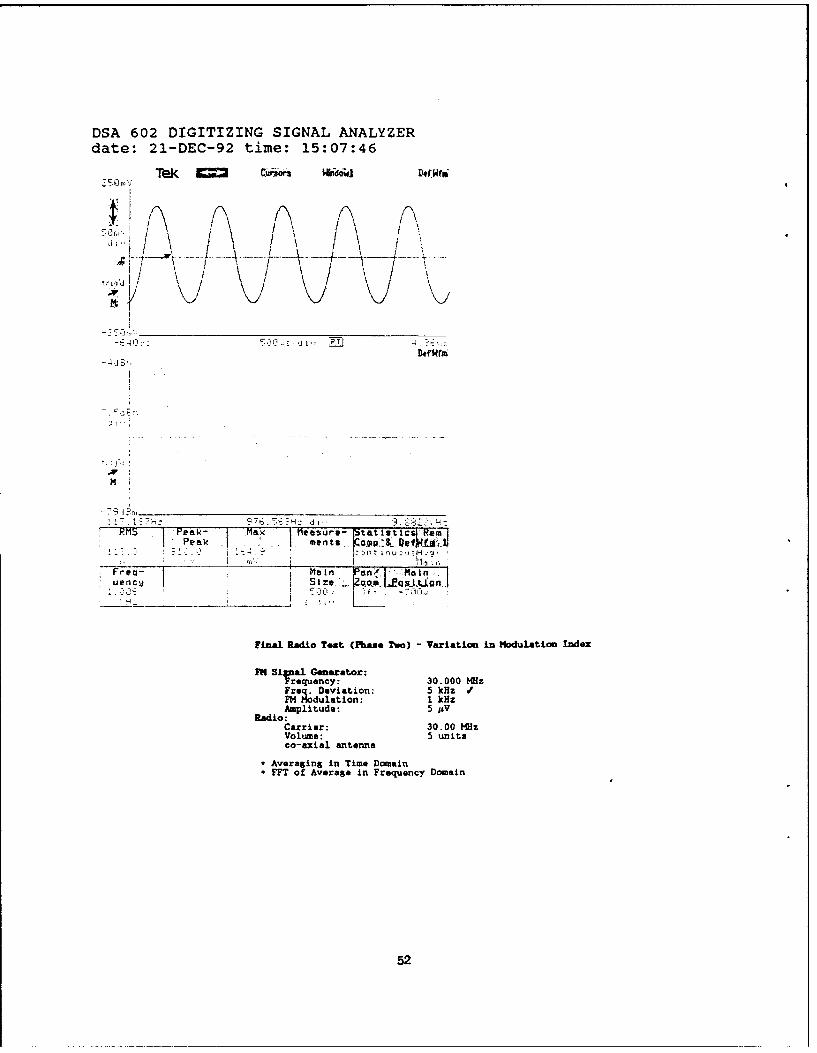
DSA 602 DIGITIZING SIGNAL ANALYZERdate: 21-DEC-92 time: 15:07:46
Tuilr Wd wl De•fwm.
I
-p 're -Q ai
F.Dao5z
Ri
ii
ax axa ante~uennIsatitis u
*- -9,:iB r,. . .. .
- . .. -""P Ik Ha: :rel-r-' •l t l l ~ l___ eak I .1 ,t •o,: e~l~
AvergingM•In Tinm DoMain-- •-,ec I -.i , . o~~ :i~~in.
Finll Radio I..t (Phama Two) - i-ariation i n Modulation hidex
iFM Signal Geneator:Frequency: 30.000 mHzMModulation, 5 kHz 5
Amplitude: 5 j#VRadio:
Carrier: 30.00 MHzVolume: 5 unitsco-axial antenna
• Averaging in Tine Domain* FFT of Average in Frequency Domain
52
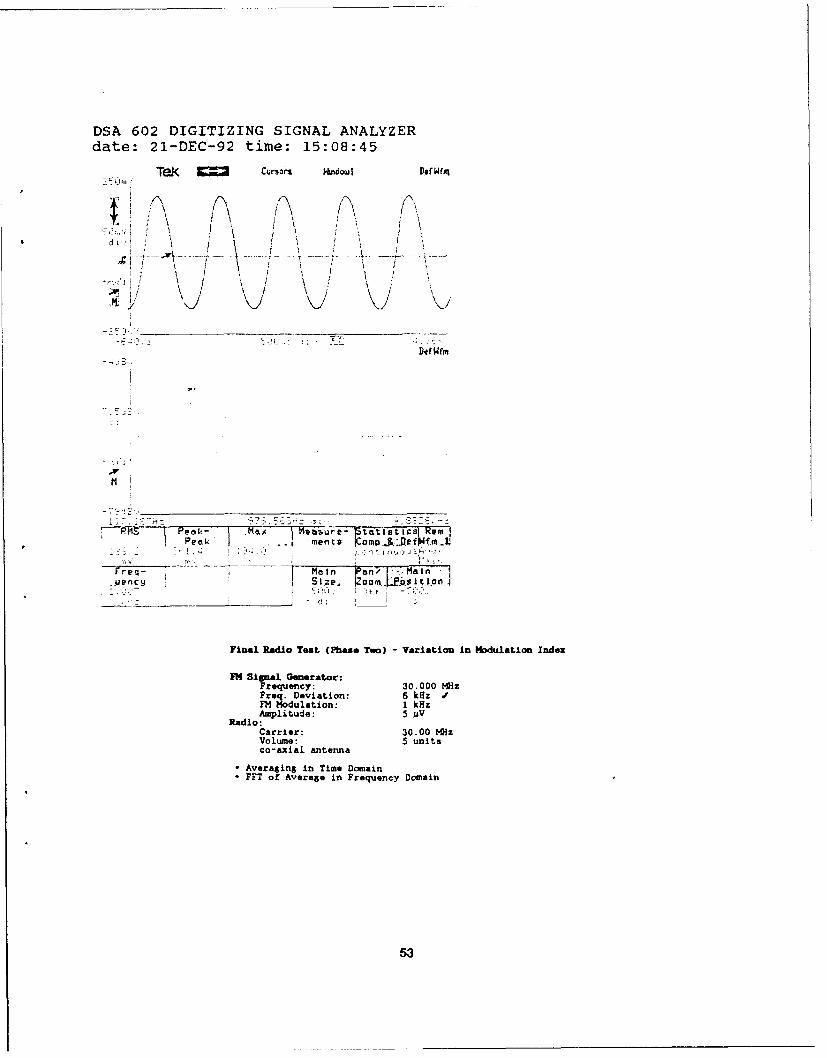
DSA 602 DIGITIZING SIGNAL ANALYZERdate: 21-DEC-92 time: 15:08:45
Tek(C Cursors kndow I DOfWNm
De Wr
A tA / -%A ,
Si/ \ / \ ,i \
""17. T.M' I 17EK isr t CR* enr'-ta"st S "
Peek . .. ments jomj:1,...f1WPIm.J-~e - 4 I4.. Ml e>l.a,•
Irq matI n an M i.uenc! Size. rZoom_. - .- •.oun
* '-: 00-4 :T' ,'
Final Radio Test (Phase Two) - Variation in Modulation Index
FM Signal Generator:Frequency: 30.000 MHzFreq. Deviation: 6 kHz VFM Modulation: I kHzAmplitude: 5 )AV
Radio:Carrier: 30.00 MHzVolume: 5 unitsco-axial antenna
* Averaging in Time Domain* FFT of Average in Frequency Domain
53

DSA 602 DIGITIZING SIGNAL ANALYZERdate: 21-DEC-92 time: 15:09:36
Tek C= cursor kIndowl Offg
. . . . . .. , __.I
I
Decwrm.-,4' ,:i E, .R
M
peak J.y. ments.3 i,:a*mt jDq ,
Suencjj ". .ze... som ., _.• p6' 1t.n,
.2.
Final Radio Test (Phase Two) - Variation in Moudulation Index
FM Signal Generator:Frequency: 30.000 MzFreq, Deviation: 7 kHz fFM Modulatoion: 1 kHzAmd plitude: 5 JAVR adio:
Carrier: 30.00 M4zVolume: 5 unitsco-axial antenna
"* Averaging in Time Domain"* FFT of Average in Frequency Domain
54

DSA 602 DIGITIZING SIGNAL ANALYZERdate: 21-DEC-92 time: 15:10:20
Tek 1= C("O kidow t••D~fIfr
Def Wr•-4,J Br
M
1 z I
Final Radio Test (Phase Two) -Variation in Modulation 1ndex
PH Signal Generator:Frequency: 30. 000 M~dzFr Devition: 8 kHz
FM Godulat on: 1 kHzAmplitude : 5 JAV
Radio:Carrier: 30.,00 M.•zvolume: 5 units
co-ax lal antenna
Averaging in Time DomainFFT of Averae e in Frequency Domain
55
DSA 602 DIGITIZING SIGNAL ANALYZERdate: 21-DEC-92 time: 15:11:27
Tek C Ogior* kndowl 4n
t r g'd
Mi
C.f I) t I O] J
""ia Radio T " '
EN Signal Generator:Frequency: 30. 000 MHzFreq. Deviation: 9 kHz WFM Modulation: 1 kHzAmplitude: 5 JAV
RaJdo:Carrier: 30.00 M•zVol~ume: 5 unit~sco- axial, ant enna
"• Averaging in Time Domain"" FT of Average in Frequency Domain
se
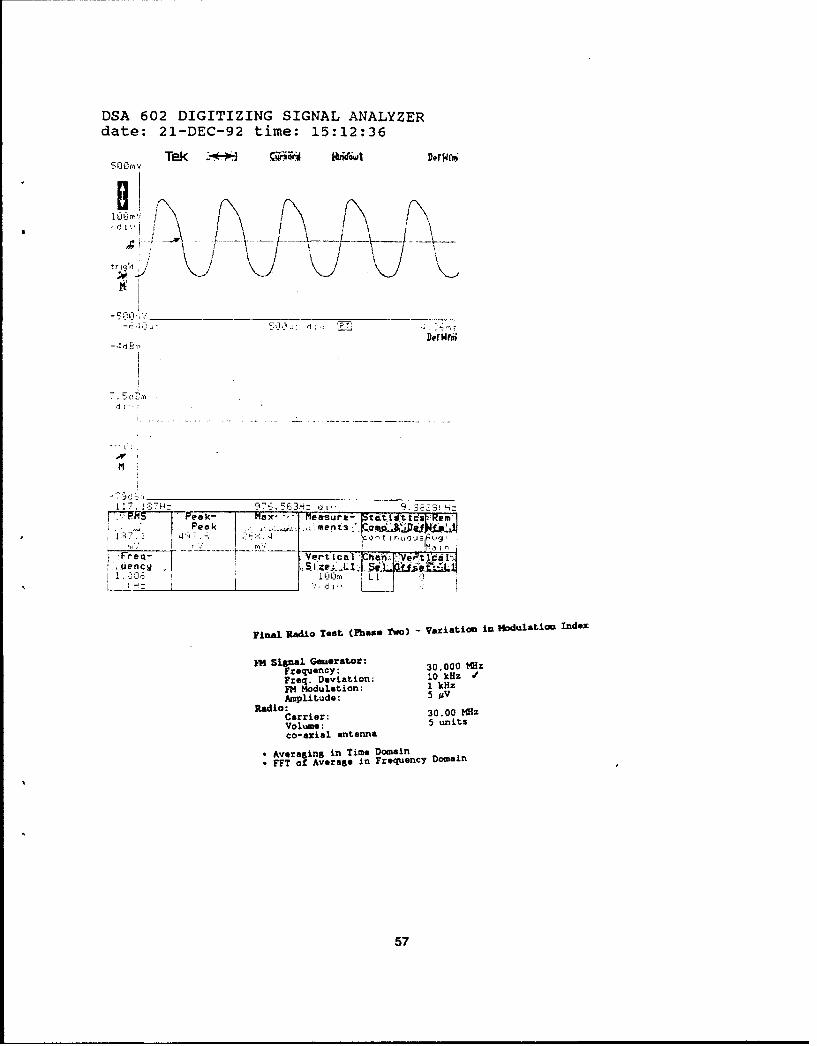
DSA 602 DIGITIZING SIGNAL ANALYZERdate: 21-DEC-92 time: 15:12:36
Tek Cir-*It kiW46 Def WAi500rnV
5 00(AiU /d I
Defwfý-4 ,.i Q4,
S1"
uenvFinl e Ma di -- TMeasutpas tatinnol o Re m:
!I,_•7 . • 4,,-men_;•. c ,',t njusg,,f Lp [
Frec'/- rt Vetca an.
* .O• !I 100;, 1 L•I n
Final Radio Test, (Phase Two) - Vari~atiJoml in 14odlatiom Indel
FM Signal Generato3:0Frequency: 30,000 Mz
Freq. Deviation; 10 kHz S
Im Modulation: I kHzAmplitude: 5 MV
Radio: 30.00 MHzCarrier:Volume: 5 unitsco-axial antenna
"* Averaging in Time Domain"* FFT of Average in Frequency Domain
57
DSA 602 DIGITIZING SIGNAL ANALYZERdate: 21-DEC-92 time: 16:15:18
d IV
- - 0fd 3m
I 40ý
£7197 3Hz '976.5b3H= di 9 2S 1H:
RM5~ eak- xtk 't433 t 4100 13 - - cnt in uo Lii
~~uew~~u fize L7 Pa~tL~
Final Radio Test (Phase Two) - Variation in Amplitude
PH Signal. Generator:Fre'quency 30.000 MHzFreq Dviation: 2 iFM Modulation: 1 kHzAmplitude: 0. 1 ;AV f
Radio:Carrier: 30.00 M~zVolume: 5 unitsco-axiaL, antenna
"* No Averaging in Tine Domain"* Infinite Persistenc, in Frequency Domain
58

DSA 602 DIGITIZING SIGNAL ANALYZERdate: 21-DEC-92 time: 16:15:58
lb = Cur-To WK9W1 EEUM DURM
d IV
trOc•d
C- 0s I V ET
-4,J~m
17. 13H- 9-1. 5 .3Hz' A. S. H:
- 3.0 I __ _ __ _ _ __ _ _ I Li
-i . .. . .• n t J I nu , ?,
Final Radio Test (Phase Too) -Variation in Amplitude
Flh Signal Generator:Frequency 30.000 MHzFreq. ,eiation: 2 kHzFM Modulation: 1 k~zAmplitude 0.25 jpV
Radio:Carrier: 30.00 MHzVolume: 5 unitsco-axial antenna
No Averaging in Time Domain
Infinite Persistence in Frequency Domain
59
DSA 602 DIGITIZING SIGNAL ANALYZERdate: 21-DEC-92 time: 16:16:51
Tek C= cli id '-f MWl 9M
-250mV
- '40d , 0. -Ama14 t
,!l T ; IB I "
11. 187H -,'H, d j9 S 3 -:Fe--a• it '; 4 1244t .I " 4i, .
•J .......
117 I;T~z '9 6 MO- .. . ti_ , .: I ,.• BkHz
inlRd Ts (lhoTw)-V ato nAmplitude:05A
Radio,Carrie• : 30.0O0 M•zVolume: 5 unitsco-axial antenna
•No Averaging in Time Domain•Infinite Persistence in Frequency Domain
60
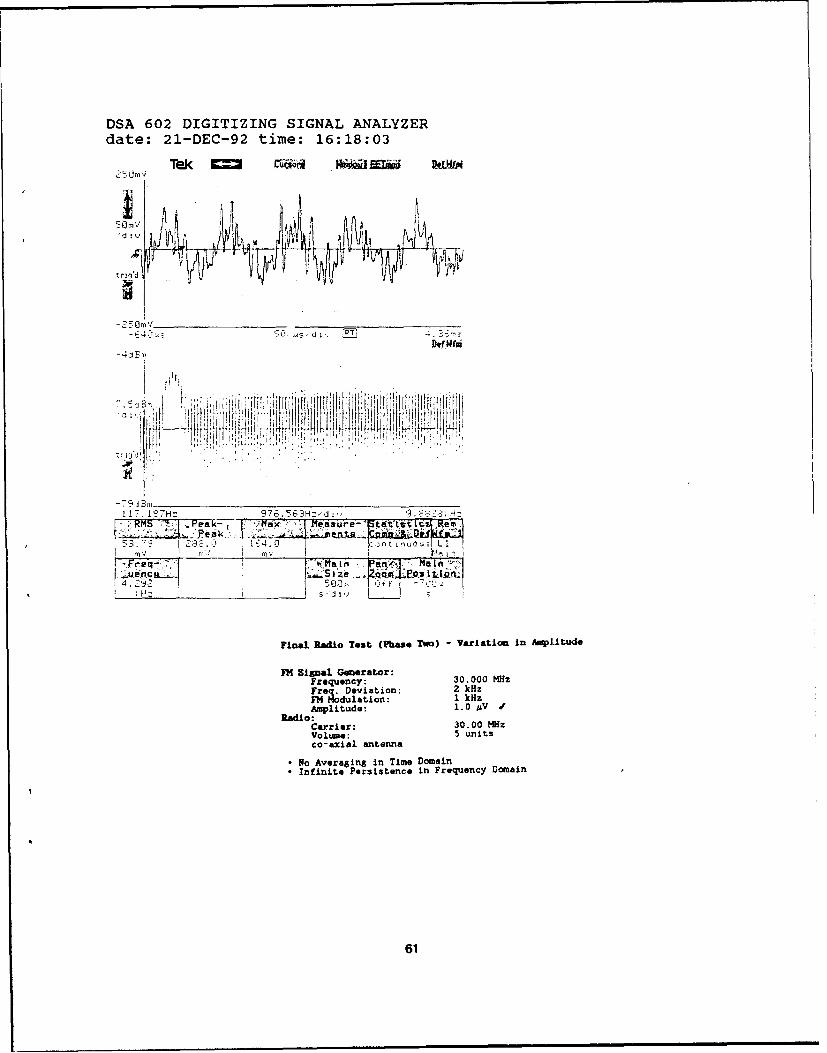
DSA 602 DIGITIZING SIGNAL ANALYZERdate: 21-DEC-92 time: 16:18:03
Tei C= CF6 9WA
,d IV
0?? Bs •,, 7
117. 19'7H= 97-L HtH Z H
MS7 i Fak- 1 Mn.Md fesure7 ~t&t'LtLN,amez3. 5 . '3 8, -:'.. 0 -•. [,Donti•nu-u, L[. l
Ms•- I n .41 M- h
4. j'IL.r .:CMý2UI~
Final Radio Test (Phase Two) - Variation in Amplitude
FM Signal Generator:Frequency: 30.000 MhzFrWe. Deviation: 2 kHzFM Moduleation: 1 kHzAmplitude: 1.0 ;Iy V
Radio:Carrier: 30.00 MHzVolume: 5 unitsco-axial antenna
N 14o Averaging in Time DomainInfinite Persistence in Frequency Domain
61
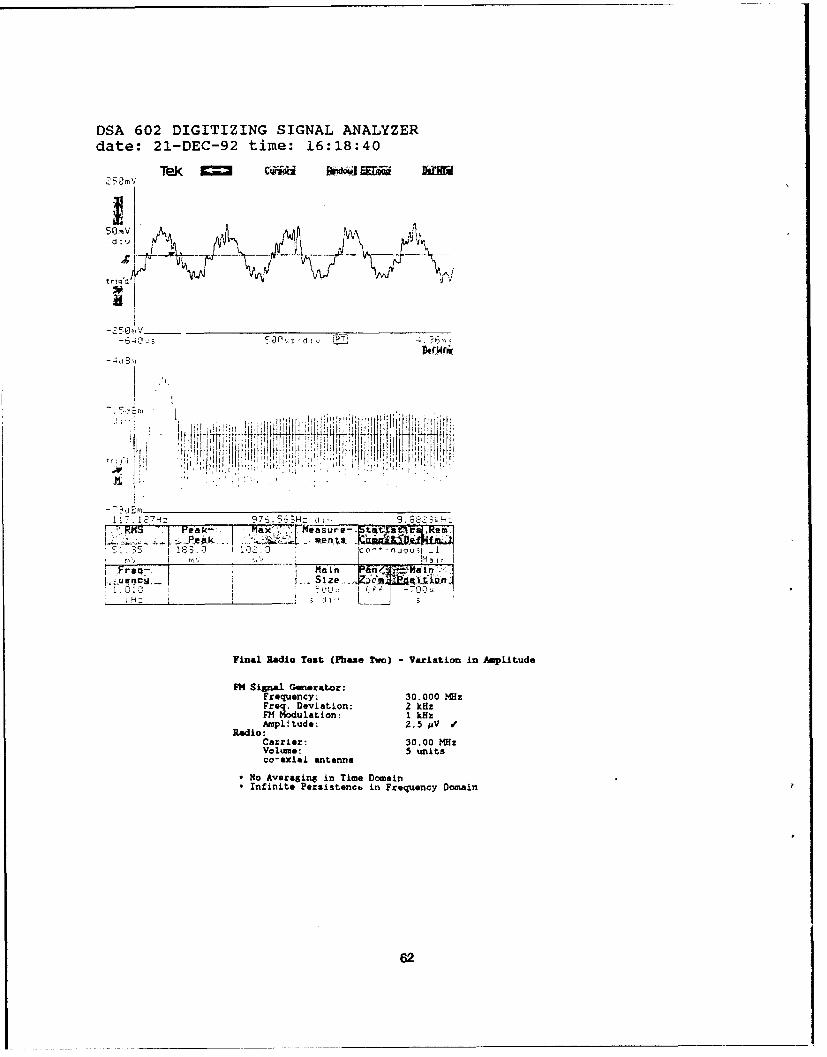
DSA 602 DIGITIZING SIGNAL ANALYZERdate: 21-DEC-92 time: 16:18:40
TPJ '=_= Wikk WO Dir
~OkV
trig d
I
w!
Stlit
-ýRM ea-Measure-.tt~'T i
1 aiq-n . at"Iu, e nc. Sizee "
...... .i n I k
H: I ___ ____ __ _ _ I ! II • I • • • •
.i.al !ado Test (Phas T ) V i
Radio:Carrier: 30.00 MHzVolume: 5 unitsco-axial antenna
N o Averaging in Time Domain*RInfinite Persist"nc- in Frequency Domain
62
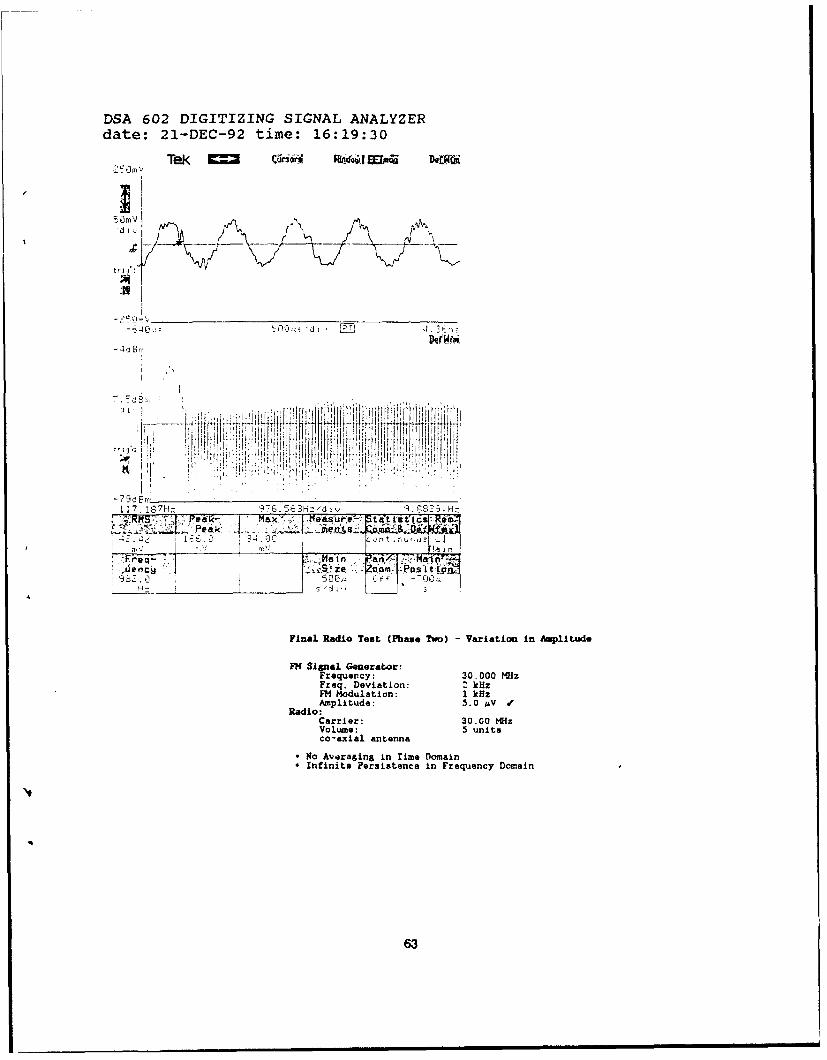
DSA 602 DIGITIZING SIGNAL ANALYZERdate: 21-DEC-92 time: 16:19:30
Te C= c-Ni WAMQ D~
d i. v A
IP 1
Pe- Imaxý ItleO&'U r 0 it ?tis US m~RNS { Peak~ . un 4~aJ~.NJ
nn i ,uru
Final Radio Test (Phase Two) -Variation in Amplitude
FM Signal Generator-Frequency: 30.000 M~UzFreq. Deviation: '- kizFM Modulation: 1 kHzAmplitude: 5. 0 )AV 0
Radio:Carrier: 30.00 MHzVolume: 5 unitsco-axial antenna
N to Aviaraging in Time Domain*Infinite Persistence in Frequency Domain
63

DSA 602 DIGITIZING SIGNAL ANALYZERdate: 21-DEC-92 time: 16:20:22
Tek C= Cirvowl Wudi6;j F3SCa Def WfmY
W eW~
nts -~amp A Detfem.1
-- ~ ~ I.
Fr eq 1 Main Van/ I Ma In;.Uencu Sjz Zg:_1ooma Posit.I Lon
Final Radio Test (pheaie Two) -. Variation in Amplitude
jF4 Signal Generator-Frequency: 30.000 M~zFreq. Deviation: 2 kHzFM Modulation: 1 kHzAmplit~ude: 10.0 jiV
Radio:Carrier: 30.00 MHzVol.ume: 5 unitsco-ax ial anltennia
*No Averaging in Tine Dom~ain*Infinite Persistence in Frequency Domain
64
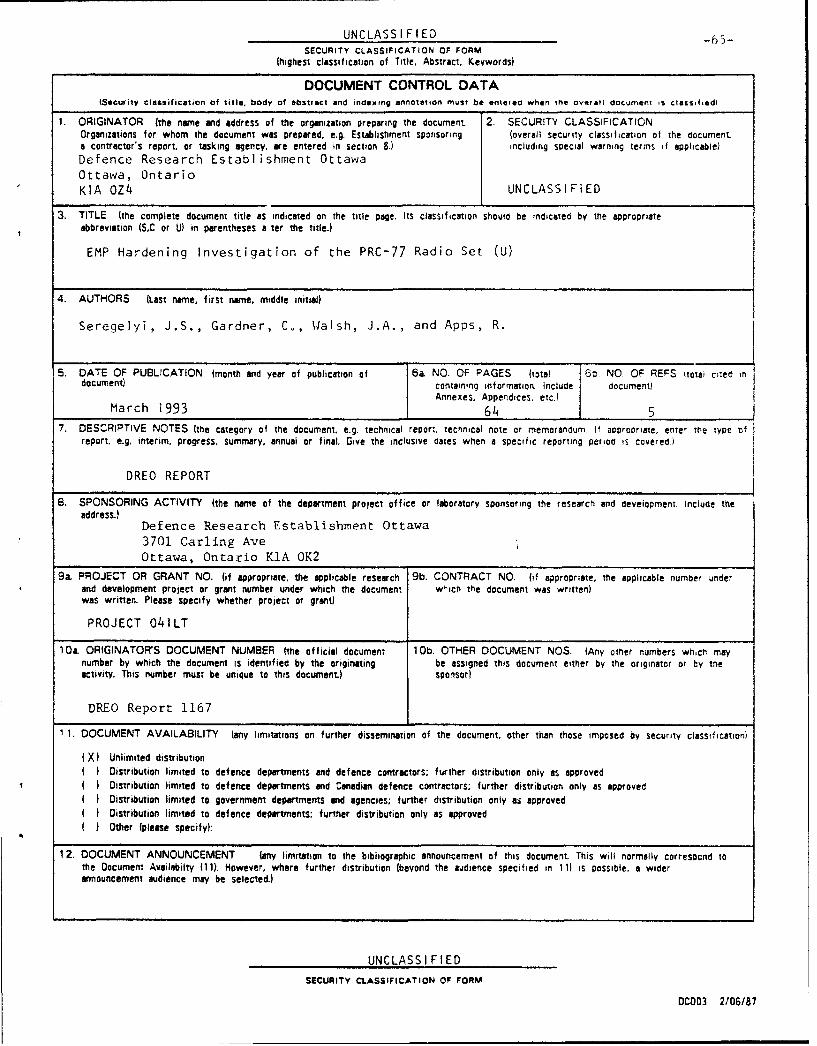
UNCLASSI FIED -65-SECURITY CLASSIFICATION OF FORM
(highest classification of Title. Abstract, Keywords)
DOCUMENT CONTROL DATA(Security classification of title, body of abstract and indexing annotation must be entered when the Overeii document is classifiedi
1. ORIGINATOR (the name and address of the organization preparing the document 2- SECURITY CLASSIFICATIONOrganizations for whom the document was prepared, e.g- Establishment sponsoring (overall security classification of the documenta contractor's report, or tasking agency, are entered in section 8.) including special warning terms if applicable)Defence Research Establishment OttawaOttawa, OntarioKIA OZ4 UNCLASSIFiED
3. TITLE (the complete document title as indicated on the title page. Its classification should be indicated by the appropriateabbreviation (SC or U) in parentheses a ter the title.)
EMP Hardening Investigation of the PRC-77 Radio Set (U)
4. AUTHORS (Last name, first name, middle initial)
Seregelyi, J.S., Gardner, C., Walsh, J.A., and Apps, R.
5. DATE OF PUBLICATION (month and year of publication of 6a NO. OF PAGES (total 6b. NO OF REFS Itotai cied indocument) containing information. Include document)
Annexes. Appendices. etc.)March 1993 64 5
7. DESCRIPTIVE NOTES (the category of the document, e.g. technical report. technical note or memorandum. If acoropriaie, enter me type "freport, e.g. interim, progress, summary, annual or final. Give the inclusive dates when a specific reporting period is covered )
DREC REPORT
8. SPONSORING ACTIVITY (the name of the department project office or laboratory sponsoring the research and development. Include theaddress.)
Defence Research Establishment Ottawa3701 Carling AveOttawa, Ontario KiA OK2
9a. PROJECT OR GRANT NO. (if appropriate, the applicable research 9b. CONTRACT NO. (if appropriate, the applicable number underand development project or grant number under which the document w'iichI the document was written)was written. Please specify whether project or grant)
PROJECT 041LT
10a. ORIGINATOR'S DOCUMENT NUMBER (the official document 10b. OTHER DOCUMENT NOS. (Any other numbers wh,ch maynumber by which the document is identified by the originating be assigned this document either by the originator or by theactivity. This number must be unique to this document.) sponsor)
DREO Report 1167
1 1. DOCUMENT AVAILABILITY (any limitations on further dissemination of the document, other than those imposed by security classification)
(X) Unlimited distributionI Distribution limited to defence departments and defence contractors; further distribution only as approvedI I Distribution limited to defence departments and Canadian defence contractors; further distribution only as approved
Distribution limited to government departments and agencies; further distribution only as approved
Distribution limited to defence departments; further distribution only as approvedOther (please specify):
12. DOCUMENT ANNOUNCEMENT (any limitation to the bibliographic announcement of this document This will normally corresocnd tothe Document Availabilty (11). However, where further distribution (beyond the audience specified in 11) is possible, a widerannouncement audience may be selected.)
UNCLASSIFIED
SECURITY CLASSIFICATION OF FORM
DCDO3 2/06/87

-66- UNCLASSI FlEDSECURITY CLASSIFICATION OF FORM
13. ABSTRACT ( a brief and factual summary of the document It may slso appear elsewhere in the body of the document itself, It is highiydesirable that the abstract of classified documents be unclassified. Each paragraph of the abstract Shall begin with an indication of thesecurity classification of the information in the paragraph (unless the document itself is unclassifiedl represented as IS). (CL or (Ul.It is not necessary to include here abstracts in both offical languages unless the text is bilingual).
(U) The susceptibility of a PRC-77 Radio to a simulated nuclear electromagneticpulse (EMP) was investigated. Detailed evaluation procedures and results arepresented. It is shown that under normal operating conditions, with either the72-cm or 2.9-m antenna, it is very unlikely that there will be any damage to theradio in the event of an EMP. It should be noted that this was one of the firstevaluations performed in the Defence Research Electromagnetic Pulse Simulator (DREMPS)and the investigation was viewed primarily as a means of optimizing generalanalysis techniques.
14. KEYWORDS, DESCRIPTORS or IDENTIFIERS (technically meaningful terms or short phrases that characterize a document and could behelpful in cataloguing the document They should be selected so that no security classification iS required. Identifiers, such as equipmentmodel designation, trade name. military project code name. geographic location may also be included- if possible keywords should be selectedfrom a published thesaurus. e.g. Thesaurus of Engineering and Scientific Terms (TEST) and that thesaurus- identi fled. If it Is not Dossible toselect indexing terms which are Unclassified. the classification of each should be indicated as with the title.)
Electromagnetic Pulse (EMP)HardeningPRC-77 Radio Set
UNCLASSIFIED
SECURITY CLASSIFICATION OF FORM