I WILL BE THERE - Draeger · 90 70 411 ANNUAL REPORT 2015 Drägerwerk AG & Co. KGaA Moislinger...
242
I WILL BE THERE ANNUAL REPORT 2015
Transcript of I WILL BE THERE - Draeger · 90 70 411 ANNUAL REPORT 2015 Drägerwerk AG & Co. KGaA Moislinger...

AN
NU
AL
RE
PO
RT
2015
90 7
0 41
1
Drägerwerk AG & Co. KGaAMoislinger Allee 53 – 5523558 Lübeck, Germanywww.draeger.com
Corporate CommunicationsTel. + 49 451 882 – 3998Fax + 49 451 882 – 3944
Investor RelationsTel. + 49 451 882 – 2685Fax + 49 451 882 – 3296
FINANCIAL CALENDAR 2016
Annual accounts press conference March 9, 2016
Analysts’ meeting March 9, 2016
Report for the fi rst quarter 2016, Conference call April 26, 2016
Annual shareholders’ meeting, Lübeck April 27, 2016
Half-yearly report for 2016, Conference call July 28, 2016
Report for the third quarter 2016, Conference call November 3, 2016
I WILL BE THERE
ANNUAL REPORT 2015
TEC
HN
OLO
GY
FOR
LIF
E /
MA
RK
ETS
SE
LEC
TET
KE
Y FI
GU
RE
S /
DR
ÄG
ER
WO
RLD
WID
E
DIV
ISIO
NS
OVE
R T
HE
PA
ST
FIVE
YE
AR
S
THE
DR
ÄG
ER
GR
OU
P O
VER
TH
E P
AS
T FI
VE Y
EA
RS
TECHNOLOGY FOR LIFE

Dräger is an international leader in the fi elds of medical and safety tech-nology. The family-run company was founded in Lübeck, Germany, in 1889. Over the past fi ve generations, Dräger has evolved into a publicly traded, worldwide group. The company’s long-term success is based on the four key strengths of its value-driven corporate culture: customer intimacy, professional employees, continuous innovation and a commit-ment to outstanding quality.
“Technology for Life” is the guiding philosophy of the company. Whe-ther in the operating room, in intensive care or in fi re and emergency res-ponse services, Dräger products protect, support and save lives.
Dräger consists of two divisions: the medical division and the safety divi-sion. It has more than 13,000 employees worldwide and is currently represented in over 190 countries. Dräger has sales and service subsi-diaries in more than 50 countries. Its development and production facilities are based in Germany, the United Kingdom, Norway, Sweden, the Czech Republic, South Africa, the United States, Brazil, Chile and China.
Technology for Life
COMPANY PROFILE
DRÄGER WORLDWIDE
Headquarters, sales and service organizations, production plants, logistic centers
Headquarters Sales and service organizations Production plants Logistic centers1 Closure over the course of 2016
Americas Pittsburgh1
TelfordAndoverSão PauloSantiago de Chile
Europe PlymouthBlythOsloHagenLübeckSvenljungaChomutov / Klášterec
Africa King William’s Town
Asia Bejing Shanghai
Dräger off ers its hospital customers anesthesia workstations, ventilators for intensive and emergency care, patient monitoring solutions as well as neonatal care equipment for premature babies and newborns. With its ceiling supply units, operating room IT solutions and gas management systems, Dräger is at the customer’s side throughout the entire hospital.
In the safety division, fi re services, emergency response services, law and regulatory enforcement and industry customers all place their trust in Dräger’s integrated hazard management systems, in particular for per-sonal protection and plant safety. This includes respiratory protection equipment, stationary and mobile gas detection systems, professional diving equipment and systems as well as alcohol and drug testing devices. Dräger also develops customized solutions, such as entire fi re training systems, training concepts and workshops, in collaboration with its cus-tomers.
MARKETS
Hospital Fire services Oil and gas industry
Mining Chemical industry Application-driven markets
THE DRÄGER GROUP OVER THE PAST FIVE YEARS
Twelve months
2011 2012 2013 2014 2015
Order intake € million 2,293.2 2,405.5 2,384.6 2,415.5 2,532.2
Net sales € million 2,255.8 2,373.5 2,374.2 2,434.7 2,608.9
EBITDA 1, 2 € million 274.6 296.0 270.3 255.6 150.9
EBIT 3 € million 213.8 230.3 200.8 178.6 66.7
in % of net sales (EBIT margin) % 9.5 9.7 8.5 7.3 2.6
Interest result € million –33.0 –32.8 –23.5 –25.0 –17.2
Income taxes € million –55.7 –61.8 –57.5 –48.9 –16.2
Net profi t € million 125.1 135.7 119.9 104.7 33.3
Earnings attributable to shareholders € million 120.7 127.0 114.6 96.6 32.7
Earnings per share 4
per preferred share € 7.35 7.73 6.94 5.73 1.89
per common share € 7.29 7.67 6.88 5.67 1.83
Earnings per share on full distribution 5
per preferred share € 4.60 5.90 5.30 4.58 1.46
per common share € 4.54 5.84 5.24 4.52 1.40
Equity 6 € million 731.6 729.7 816.0 896.6 945.9
Equity ratio 6 % 34.6 34.7 39.5 40.1 40.9
Capital employed 6, 7 € million 880.0 901.9 1,052.9 1,107.2 1,269.3
EBIT 3, 8/Capital employed 6, 7 (ROCE) % 24.3 25.5 19.1 16.1 5.3
Net fi nancial debt 6 € million 39.8 56.8 110.0 10.7 145.3
DVA 9 € million 134.6 150.0 113.9 81.6 –46.3
Headcount on 31. December 11,924 12,516 13,334 13,737 13,936
Drägerwerk AG & Co. KGaA dividends
Preferred shares € 0.19 0.92 0.83 1.39 0.19
Common shares € 0.13 0.86 0.77 1.33 0.13
1 EBITDA = Earnings before net interest result, income taxes, depreciation and amortization2 Equipment leased out is recognized in property, plant and equipment since 2012. The fi gures for 2011 were adjusted accordingly.3 EBIT = earnings before interest and taxes4 On the basis of the proposed dividend5 Based on an imputed actual full distribution of earnings attributable to shareholders6 Value at end of period7 Capital employed = total assets less deferred tax assets, current securities, cash and cash equivalents and non-interest-bearing liabilities8 Value of the last twelve months9 Dräger Value Added = EBIT less cost of capital
DIVISIONS OVER THE PAST FIVE YEARS 1
Twelve months
2011 2012 2013 2014 2015
Medical division
Net sales € million 1,484.5 1,558.4 1,545.2 1,577.2 1,698.8
EBIT 2 € million 155.8 151.0 126.1 107.6 46.2
in % of net sales (EBIT margin) % 10.5 9.7 8.2 6.8 2.7
Safety division
Net sales € million 771.3 815.1 829.0 857.5 910.1
EBIT 2 € million 58.0 79.2 74.7 71.0 20.5
in % of net sales (EBIT margin) % 7.5 9.7 9.0 8.3 2.2
1 The years 2011 to 2013 were adjusted pro forma due to the change in segment reporting. Regarding the adjustments for 2014 we refer to Note 3 in the notes.2 EBIT = earnings before interest and taxes
SELECTED KEY FIGURES DRÄGER GROUP
Twelve months
2015 2014 Changes in %
Order intake € million 2,532.2 2,415.5 +4.8
Net sales € million 2,608.9 2,434.7 +7.2
EBIT 1 € million 66.7 178.6 –62.7
in % of net sales % 2.6 7.3
Earnings after income taxes € million 33.3 104.7 –68.2
Earnings per share 2
per preferred share € 1.89 5.73 –67.0
per common share € 1.83 5.67 –67.7
Earnings per share on full distribution 3
per preferred share € 1.46 4.58 –68.2
per common share € 1.40 4.52 –69.1
Cash fl ow from operating activities € million 39.9 188.0 –78.8
Net fi nancial debt 4 / EBITDA 5, 6 0.96 0.04
Equity ratio 4 % 40.9 40.1
DVA 7 € million –46.3 81.6 –156.7
Headcount on 31. December 13,936 13,737 +1.4
1 EBIT = earnings before interest and taxes2 On the basis of the expected dividend3 Based on an imputed actual full distribution of earnings attributable to shareholders4 Value at end of period5 EBITDA = Earnings before net interest result, income taxes, depreciation and amortization6 Value of the last twelve months7 Dräger Value Added = EBIT less cost of capital


I WILL BE THERE
FREDERIK VERCRUYSSE
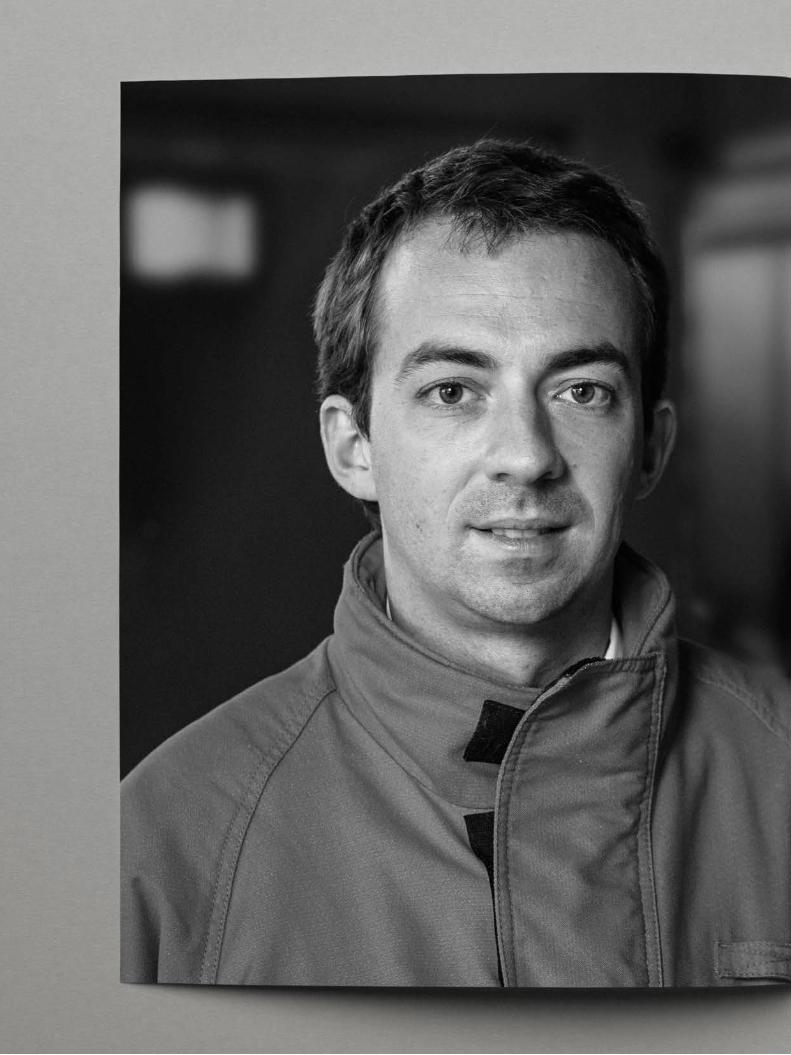
“In many cases, once the fire has been extinguished and the initial fright has worn off, we return – firefighters, in full uniform. A sign posted in the neighborhood an-nounces: ‘The firefighters wish to speak with you’ – with people, many of whom have just suffered the shock of their lives. We show up again and use the overall high awareness on topics such as fire prevention to give use-ful information. The turnout is tremendous.” Such work is also part of a firefighter’s job here in Antwerp, says Frederik Vercruysse, father of a little daughter, chemical and environmental engineer, and firefighter in Belgium’s most important seaport.
BRANDWEER ANTWERPEN
700 EMERGENCY
RESPONDERSare on the job around the clock, spread among seven fire stations.
The port and the Flemish center of trade have gone hand in hand for centuries. For the firefighters, it poses a wide range of challenges, with its 538,000 inhabi-tants, 82 hotels, 21 museums, 15 theaters, almost 350 schools and universities, and countless priceless histor-ical buildings. The port is one of the most important transshipment hubs in Europe, with 200 million metric tons of goods of every kind coming through here each year. It also happens to border on the largest petrochem-ical cluster in Europe, featuring a variety of combustible, corrosive and environmentally hazardous substances, as well as pipelines, power stations and access to five busy
freeways. It is the perfect environment for a fire chief who appreciates complex challenges.
Frederik Vercruysse is a ‘hazmat’ specialist, which means that when it comes to combustible, toxic and explosive substances, he lends his expertise so the risks remain manageable. “My challenge for every intervention is en-suring that we enter in good health, get through the dangerous situation and leave in the same robust con-dition,” he says. In his view, this not only requires clear rules on the ground, but also continuously expanding one’s knowledge. It certainly involves a great deal of desk work, since plans on tactics, topography and in-dividual buildings have to be made and updated, and future risks analyzed. Another priority is evaluating the quality of previous interventions. “Intervention, the de-ployment – namely the thing that people associate with the fire department – is actually the fourth step in the logic guiding our actions,” Vercruysse says. “Before that point, we start by drawing up proactive risk analyses for all of Antwerp. Then there is prevention work so that accidents don’t occur in the first place. And the third step is preparation.” Firefighters can get a sense of this strategy’s success whenever longtime veterans celebrate their retirement from the force: “You often hear things like, ‘We still used to see plenty of big fires 30, 40 years ago! But now? Far fewer big blazes!’” This is great news for a city fire department that has promised to actively protect its home.
“The job has changed, of course,” Frederik Vercruysse says. “When I go to work in the morning, there’s a desk full of papers waiting for me. Just like millions of other people across Europe who are headed to work at around
I WILL BE THERE6
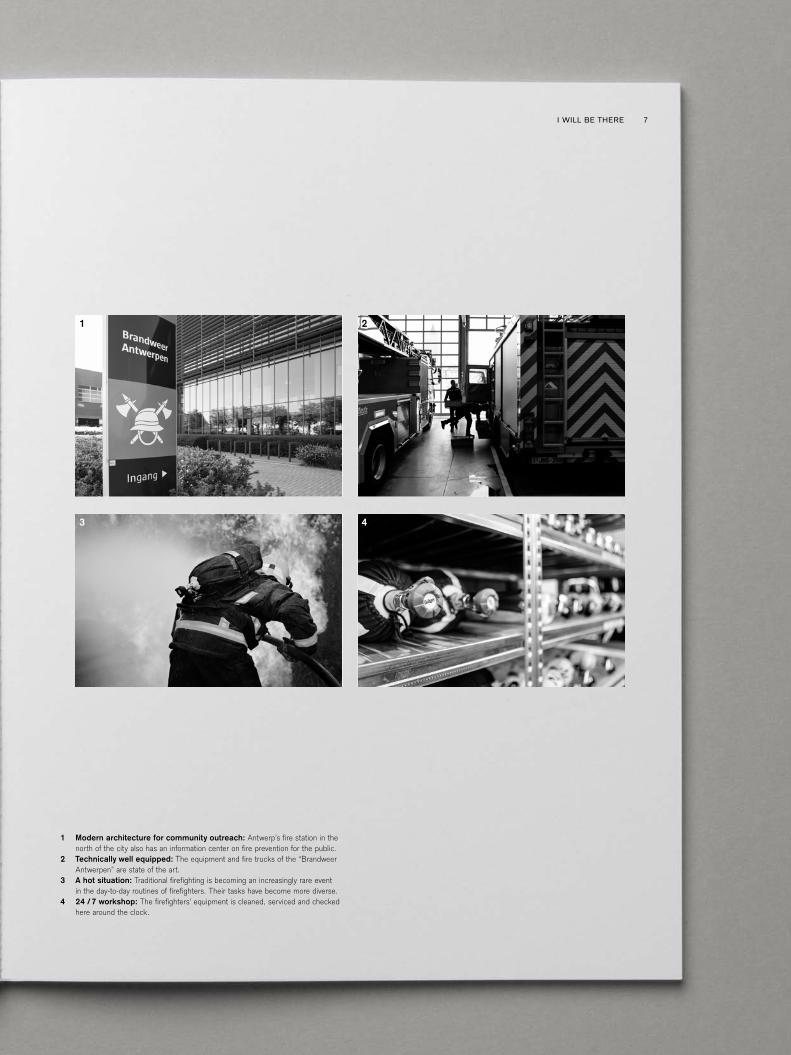
1 Modern architecture for community outreach: Antwerp’s fire station in the north of the city also has an information center on fire prevention for the public.
2 Technically well equipped: The equipment and fire trucks of the “Brandweer Antwerpen” are state of the art.
3 A hot situation: Traditional firefighting is becoming an increasingly rare event in the day-to-day routines of firefighters. Their tasks have become more diverse.
4 24 /7 workshop: The firefighters’ equipment is cleaned, serviced and checked here around the clock.
1
3 4
2
7I WILL BE THERE

the same time.” But there is a difference – one that ultimately drove the young engineer to join the fire de-partment six years ago: “When a call comes, it comes. And the fire chiefs are a part of the action, implementing the plans we drew up based on good practice.” This in-cludes, for example, the skillful integration of tactics and technology, which has undergone radical modernization since the days of the veterans and their legendary blazes.
Consider imaging processes: cameras with electronic sensors that detect both visible light and thermal radia-tion have become an indispensable tool for firefighters, Frederik Vercruysse says. “When we began equipping our vehicles with new cameras in 2014, I set clear re-quirements.” This was because the deployment philoso-phy that he and his colleagues follow calls for two differ-ent application profiles: “When the first members of our team enter a danger zone, they have to have lightweight and robust cameras that can live up to the demanding work. They need thermal images to be able to detect smoldering fires, excessive heat and also people who are trapped.”
And once the danger is gone? “As commanding officer, we need precise documentation of the scene of the blaze,” Vercruysse says. Detailed images and videos then serve as an important basis for analyzing the deployment. “Of course, we hoped to find a single camera that combined all of the necessary features instead of equipping each truck with two different devices.” The “Dräger UCF 9000” came out on top in the selection process for the Antwerp fire department. “We have purchased 23 cameras since spring 2014, and they are on hand for every deployment,” Vercruysse says. The flexibility of the new universal cam-era – along with its tremendous robustness – has won
him over. “Equipment falls down, gets shaken and bumped every day in a fire department. And it goes without say-ing that the equipment has to withstand it all. But one ‘Dräger UCF 9000’ underwent a very unusual endurance test when it fell down in such an unfortunate position that a fire truck drove over it with its full weight. We thought, ‘Well, that’s that. What a shame.’ But guess what? Only the display had to be replaced. Nothing else. The camera continued doing its duty.”
Despite the utmost reliability of modern technology, Frederik Vercruysse stresses other firefighters to have always a backup plan. “If a plan no longer works, some-thing breaks down or the situation develops in unfore-seen ways, your life can be dependant on your backup plan. We aren’t becoming more careless just because we have better technology. Rather, we have more op-tions.” Vercruysse approaches his major personal passion – climbing and skiing in the Alps – with the same ap-proach, consisting of the right amount of equipment and knowledge. “A GPS device is enough. And an idea of how to find your way back without it,” he says. Mountains set this Belgian’s heart racing: “Sometimes I dream of being a firefighter in the Austrian mountains and shoul-dering the responsibility for everything that happens there. But, even if it might sound strange to people who aren’t engineers, I’d miss some things a lot: the port, the complex technology and my chemical industry.”
I WILL BE THERE8

LIFESAVERDRÄGER UCF 9000 RESOLUTION
0.035°Cthermal resolution. It also allows users to maintain a sense of orientation in environments with uniform thermal condi-tions (such as tunnels or basements).
PRODUCT FEATURES
Thanks to its ergonomic, one-hand-ed operation, users can operate all of the Dräger UCF 9000’s func- tions with the hand they hold the thermal imaging camera in. The cam- era can also be used in environ-ments where there is the threat of an explosive atmosphere.
– 74 ° diagonal viewing angle for scanning spaces quickly and safely
– Long-wave infrared wavelength sensitivity range of 7 to 14 micrometers – objects at room temperature emit the strongest thermal radiation within this spectral range
– 9 different image modes depending on the applica-tion – from fighting fires and searching for smoldering embers to looking for people outdoors
– Up to 4 hours of battery life– Digital temperature display from − 40 ° to 1,000 ° C.
LIMITING DAMAGE TIME SAVED DURING RESCUE EFFORTS (IN %)
EUR 400,000Insurance experts have proved that the use of a thermal imaging camera during a fire con-siderably increases how effective the efforts to extinguish the blaze are. On average, it reduces the damage of a fire by EUR 14,000, or 10%. Over its entire service life, a ther-mal imaging camera can prevent almost EUR 400,000 in damage on average.
Firefighters who use a thermal imaging camera when fighting fires indoors find people more than twice as fast as they do without such a camera.
ROBUST
2 METERSAs a sign of how robust it is, the camera must withstand being dropped onto a concrete floor from a height of two meters.
100
80
60
40
20
0
Source: The Use of Thermal Imaging Cameras to Search for People during Firefighting Operations, Marcus Reichard, Cologne 2013
Source: Versicherungskammer Bayern, schadenprisma 4/2003
Search time without a thermal imaging camera
Search time with a thermal imaging camera
9I WILL BE THERE


I WILL BE THERE

DR. JÖRG BRAUN
ments. Once a call comes in, the helicopter is in the air two minutes at the latest.
“Christoph 51” is also equipped for transporting critical-ly ill patients. Apart from traditional emergency rescue operations, such transports are now one of the most important duties of Germany’s nationwide air rescue network. “We deploy around 1,100 times a year with ‘Christoph 51’. Some 500 of these flights are intensive care transports,” Braun says. State-of-the-art medicine is concentrated at specialized centers, which possess the expertise for difficult cases. These hospitals are often lo-cated far away from each other. “My farthest flight was to a specialist hospital beyond Dresden,” Jörg Braun says, which would be a five-and-a-half hour drive. A helicopter can cut down on taxing transport times for patients so it only takes a third as long as it would otherwise.
But “Christoph 51” stays mostly “at home” in Baden-Würt-temberg. Dr. Braun says that 90 percent of the deploy-ments take his team to places within the state, which is where the helicopter does mostly operate. Whether in Heilbronn or on the Swabian Alb, it needs a landing surface of just 30 meters by 30 meters. “Imagine an accident on the eastbound A8 freeway at the Kirchheim junction. I can make it to Tübingen from there in ten minutes. It takes us eight minutes to fly to Klinikum Stutt-gart, ten minutes to Ludwigsburg and twelve minutes to Ulm, where there is a university and a military hospital,” the emergency physician says.
Jörg Braun also enjoys a regional advantage, since he hails from here. “Even if you can’t always tell by the way I talk, I’m a Swabian, born and bred. During a rescue, say on the Swabian Alb, it can come in handy to speak the
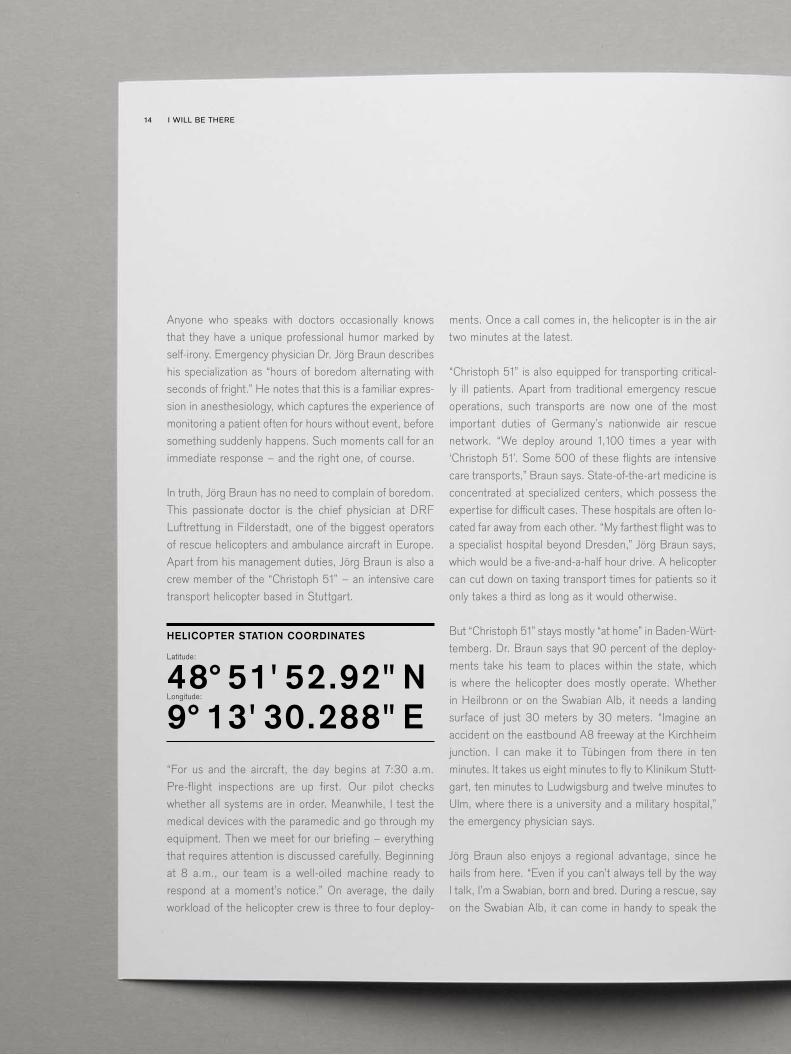
Anyone who speaks with doctors occasionally knows that they have a unique professional humor marked by self-irony. Emergency physician Dr. Jörg Braun describes his specialization as “hours of boredom alternating with seconds of fright.” He notes that this is a familiar expres-sion in anesthesiology, which captures the experience of monitoring a patient often for hours without event, before something suddenly happens. Such moments call for an immediate response – and the right one, of course.
In truth, Jörg Braun has no need to complain of boredom. This passionate doctor is the chief physician at DRF Luftrettung in Filderstadt, one of the biggest operators of rescue helicopters and ambulance aircraft in Europe. Apart from his management duties, Jörg Braun is also a crew member of the “Christoph 51” – an intensive care transport helicopter based in Stuttgart.
HELICOPTER STATION COORDINATES
Latitude:
48° 51' 52.92" N Longitude:
9° 13' 30.288" E“For us and the aircraft, the day begins at 7:30 a.m. Pre-flight inspections are up first. Our pilot checks whether all systems are in order. Meanwhile, I test the medical devices with the paramedic and go through my equipment. Then we meet for our briefing – everything that requires attention is discussed carefully. Beginning at 8 a.m., our team is a well-oiled machine ready to respond at a moment’s notice.” On average, the daily workload of the helicopter crew is three to four deploy-
I WILL BE THERE14
1
3 4
2
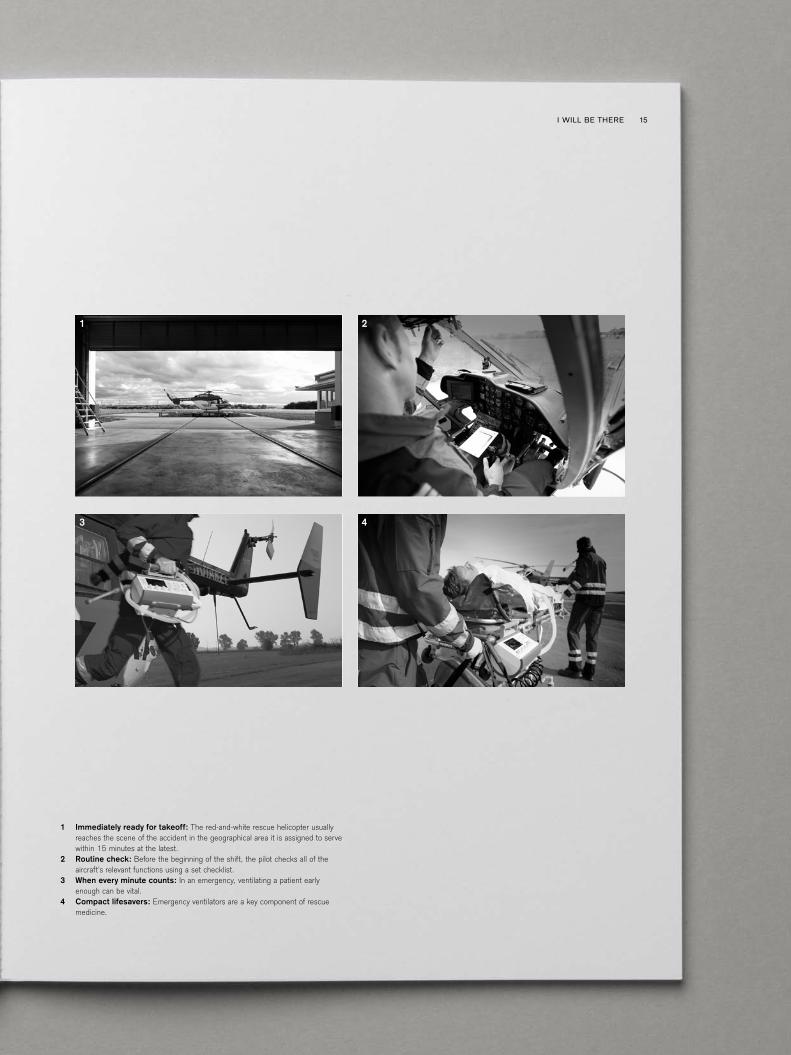
1 Immediately ready for takeoff: The red-and-white rescue helicopter usually reaches the scene of the accident in the geographical area it is assigned to serve within 15 minutes at the latest.
2 Routine check: Before the beginning of the shift, the pilot checks all of the aircraft’s relevant functions using a set checklist.
3 When every minute counts: In an emergency, ventilating a patient early enough can be vital.
4 Compact lifesavers: Emergency ventilators are a key component of rescue medicine.
15I WILL BE THERE

dialect. It creates intimacy with the people who need our help.” Braun served in the German Armed Forces for two decades as a medical officer. He first wanted to become a surgeon, but then became interested in anesthesia. “I quickly knew that it suited – as if tailor-made to my interests.” The young doctor was fascinated by the ability to quickly relieve people from even the worst pain. Braun studied advanced medicine at the military hospital and learned how to practice conventional general medicine at a NATO location with 80 families. He then started going on foreign missions in the mid-1990s to places where medical facilities had to be set up “out of nothing”: Sara-jevo, where Jörg Braun was one of the first on the scene, then Kosovo and – by special order of the then German chancellor – the West Bank and Gaza, from where Braun brought Palestinian children to Germany for treatment during the Second Intifada. His last deployment was in 2002 to Afghanistan. “It taught me life lessons,” Braun says, “the art of improvising, how to achieve something as a team under difficult circumstances, practicing good medicine with the bare essentials, and developing a keen sight for what really matters.” He has honed the latter in his leisure time as an extreme mountain climber on top of the world’s high mountains.
The ideal situation for finding a demanding civilian pro-fession – or rather, being found. When Braun left the military in 2003, the Armed Forces had just received an inquiry from DRF Luftrettung. In a nutshell, they were looking for Jörg Braun. Many of the skills he brought proved to be the perfect fit for the flying ICU, the de-cision-making processes, the management role and his passion for helping people in need.
And the technology? It has a tough life on board. Even if it is thumbs-up during all of the morning checks, the medical devices are put to the test every minute during a deployment. “We fly in the rain, at 10 below zero and 30 degrees Celsius, and in the mountains where the air pressure can fluctuate as much as the tempera-ture. There are constant bumps that you can’t compare with the conditions in an ambulance,” Braun says. The “Oxylog 3000 plus” – Dräger’s mobile high-performance ventilator – also defies these adversities. Already stan-dard in emergency rooms and for transport ventilation, it is also the first choice for rescue flights. “Two sugges-tions for improvement came from us,” Jörg Braun says, “specifically due to the great mechanical stress in flight.” Both were swiftly implemented and contributed to the proven technology’s continuous improvement in Lübeck.
What is his wish? That the helicopter workstation might be integrated even more seamlessly in the future, with an interior made from a single mold, where today a mix of various components from different origins is used. “To this day, we convert all-purpose helicopters into rescue units, and that requires making compromises,” Jörg Braun says. Talking with the engineers who make heli-copters and those who develop and produce monitoring and ventilation technology is crucial, the doctor says. Even the people who are not on site during a deploy-ment, but who are working remotely on the flying ICU’s devices and procedures, are part of the team.
I WILL BE THERE16
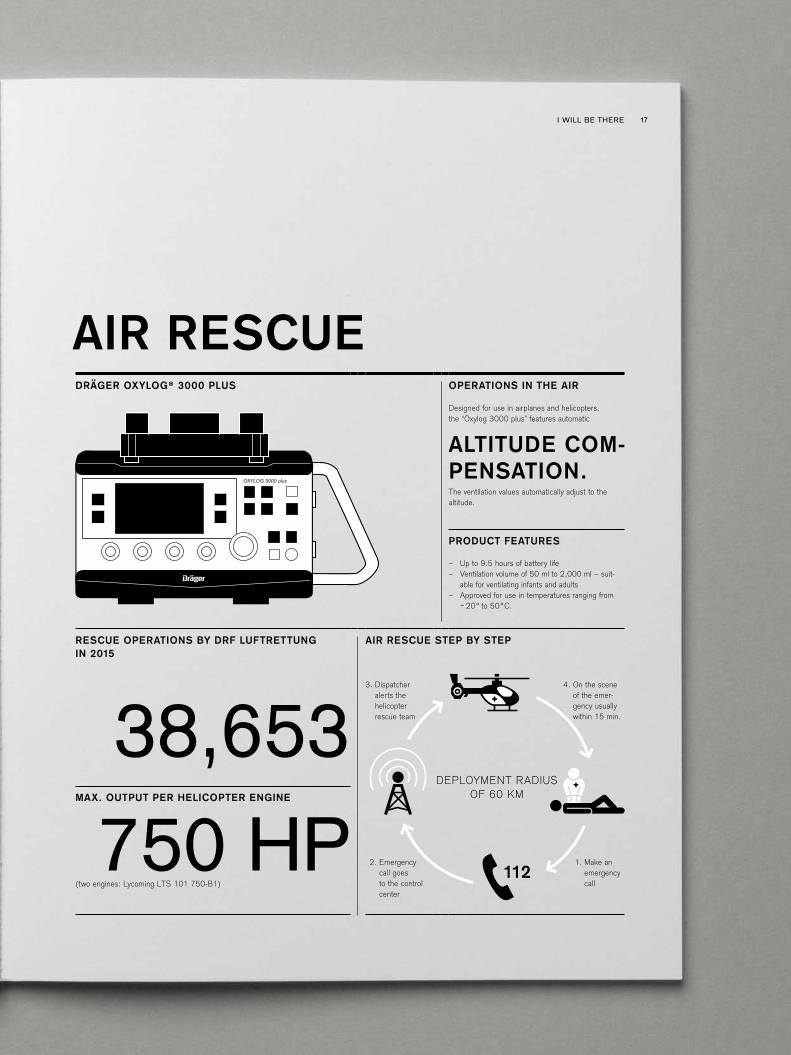
AIR RESCUEDRÄGER OXYLOG® 3000 PLUS OPERATIONS IN THE AIR
Designed for use in airplanes and helicopters, the “Oxylog 3000 plus” features automatic
ALTITUDE COM-PENSATION.The ventilation values automatically adjust to the altitude.
PRODUCT FEATURES
– Up to 9.5 hours of battery life– Ventilation volume of 50 ml to 2,000 ml – suit-
able for ventilating infants and adults– Approved for use in temperatures ranging from
− 20 ° to 50 ° C.
RESCUE OPERATIONS BY DRF LUFTRETTUNG IN 2015
AIR RESCUE STEP BY STEP
38,653 MAX. OUTPUT PER HELICOPTER ENGINE
750 HP(two engines: Lycoming LTS 101 750-B1)
1122. Emergency
call goes to the control center
1. Make an emergency call
4. On the scene of the emer-gency usually within 15 min.
3. Dispatcher alerts the helicopter rescue team
DEPLOYMENT RADIUS OF 60 KM
17I WILL BE THERE

I WILL BE THERE
CAROLINE WALLACE
“Working here means that everything can change in the span of an hour. An almost empty ward can fill up quickly. And a day of simple routines can turn into a rapid suc-cession of highly concentrated tasks at the very limits of medicine. I like that, and I like children, which is why I’m here.” Caroline Wallace is a pediatric nurse specialized in neonatal intensive care. “Here” is the city of Karlstad, located in the center of southern Sweden. Everywhere you look in this city of 90,000 inhabitants, you see the symbol of Karlstad: a smiling sun. In fact, the city is located in one of the country’s sunniest areas, right on the banks of Vänern, Sweden’s largest lake. Karlstad is the center of the region, and therefore also its hub for medical care. The name of “Centralsjukhuset” – the cen-tral hospital – where Caroline Wallace works, says it all.
CENTRALSJUKHUSET KARLSTAD
Each year, around 410 children are born at the maternity clinic. Of those, around
25 ARE BORN PREMATURELY.The history of the hospital stretches back to the late 18th century, though it combines its long tradition with sys-tematic modernization measures. Beginning in 2011, the hospital rebuilt its neonatal intensive care unit (NICU) from the ground up. In terms of its architecture, technol-ogy and the quality of medical treatment, the NICU is one of the most cutting-edge in Europe. Austerity plans were not the driving force behind the change. Quite the opposite: the process included new hires, so that a big-ger team has been able to care for these tiny patients at Centralsjukhuset with even more space available to them
since the NICU reopened in March 2013. “We designed it completely around the needs of the families,” Caroline Wallace says. “Each family has its own room where the parents and the baby can be together in privacy. That’s why in addition to a large, special and adjustable bed for the mother and the child, there is also one for the father, so that he can stay here round the clock as well.” In Swe-den, parents continue receiving pay to ensure financial security if they have to stay with their child at the hospital because the child requires medical attention.
Using detailed 3D images, the project team from the hospital in Karlstad worked together with Dräger experts in Lübeck and on site in Karlstad to plan and design the NICU. It was equipped for premature babies from the 26th week as well as for providing initial medical care to even smaller premature babies who can then be transferred to larger neonatal intensive care centers. The needs of the families and those of the intensive care providers did not prove to be at odds with each other with regard to this redesign. In fact, they came together in the best interest of the babies. Since the infants are each housed in separate rooms by family, they enjoy optimum protection against drug-resistant pathogens. “But they receive all the intimacy they need: the heartbeat of the mother, the warmth of the family, physical contact and affection. All of these things help the children to thrive,” Caroline Wallace says. The technology integrates and adapts to the space, such as the accessible incubator that precisely controls temperature and humidity and movable ventilators. It is also possible to perform all ex-aminations – even taking X-rays – in the family’s room. Top ergonomics and standardized workstations relieve the burden on nursing staff, doctors and aides. As a result, they can give their full concentration to the fam-
I WILL BE THERE22

I WILL BE THERE
1
3 4
2
1 A hospital with a long history: The first documented reference to Karlstad’s central hospital dates back to 1752.
2 Modern design and getting around quickly: The concept and design of the neonatal intensive care unit in Karlstad are among the most cutting-edge in Europe.
3 Teamwork: A well-coordinated team of specialized physicians and nurses cares for the tiny patients around the clock.
4 Family-centered care: Parents are systematically included in caring for and looking after their frail children.
23
ilies and the tiny patients. The days are often long and challenging enough as it is.
“I have five children of my own,” Caroline Wallace says. “I’m sometimes asked if I’m able to relax when I come home. But I don’t find family life together to be a burden. It’s a reward.” Caring for children – both one’s own and the most frail and fragile babies from the region on top of that – what kind of mark does that make? “I can clearly recall the unexpected birth of a premature baby in its 23rd week,” the nurse says. “It was exciting, demanding, and also somehow upsetting. The team worked like a well-oiled machine. Everything happened fast, precisely and with care. The doctors, nursing staff and aides – everyone worked together: Heartbeat? ‘Yes.’ Breathing? ‘Starting to.’ Do we need to intubate? ‘We intubate.’ We manage to stabilize the baby. It’s okay. We were then later able to
transfer it to Akademiska Hospital in Uppsala, one of the neonatal centers in Sweden that provides the highest level of care. Everything went well. The job is done – and you are left feeling like we did everything right!”
Those are the highs. What about lows? Yes, the team has them as well. Working at the limits of medicine also means that there will be cases that go beyond what can be done. When it is clear that there will be no happy ending, and the only thing you can do is provide comfort. It is sometimes difficult to say goodbye to those patients and their families who successfully gained help on the ward. “Everything went well, but since they have spent weeks living here with us, you really got to know them. Then they leave. But for them, it is the start of the life together that they have imagined. And that is wonderful.”
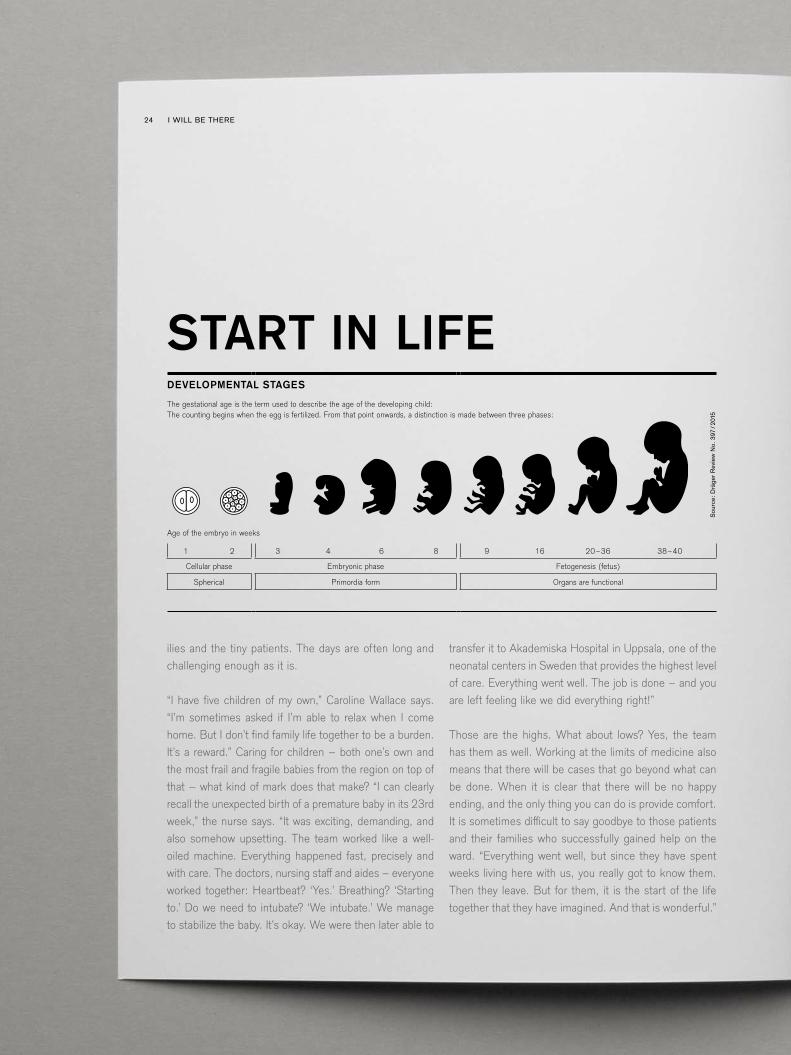
START IN LIFEDEVELOPMENTAL STAGES
The gestational age is the term used to describe the age of the developing child: The counting begins when the egg is fertilized. From that point onwards, a distinction is made between three phases:
Age of the embryo in weeks
1 2 3 4 6 8 9 16 20–36 38–40
Cellular phase Embryonic phase Fetogenesis (fetus)
Spherical Primordia form Organs are functional
Sour
ce: D
räge
r Rev
iew
No.
397
/201
5
I WILL BE THERE24

DRÄGER CALEO® HUMIDITY STANDARD SET VALUE RANGE
30 – 99 %PRODUCT FEATURES
– Low operating noise inside the hood– The “auto-humidity mode” automatically regulates
the humidity level with respect to the programmed air temperature.
– The interior incubator is very spacious. There is even enough room for twins.
– Cleaning the device is simple as there are only 11 parts in total.
TEMPERATURE
37 ° CAt this temperature, babies stay nice and warm in the womb. The “Caleo” also provides a constant 37 ° C environment so that the tiny patients can develop to the best possible extent outside of the womb.
GENTLE CARE:Doors and drawers that open quietly as well as soundless electronic controls for adjusting the bed incline ensure a low noise level in the incubator. When the baby is laid back down in the “Caleo” after skin-to-skin contact on the mother’s or father’s chest, the “kangaroo” mode additionally ensures the ideal environmental conditions inside the incubator.
FREQUENCY OF OCCURRENCE
According to the WHO, 10 out of every 100 children are born prematurely.
10 %
25I WILL BE THERE
We would like to dedicate our thanks to Frederik Vercruysse, Dr. Jörg Braun and Caroline Wallace for their support in the preparation of this management report. As representatives of many Dräger customers all over the world, they are there with full of passion for those who require help – under quite different circumstances and at different locations, but with “Technology for Life” from Dräger always at their side.
“I will be there” – this is a promise that inspires trust. Trust that in an emergency, help will be there. This help might come from a professional firefighter who is well equipped to handle the complex challenges of a seaport. It might come from an emergency phy- sician who is on site in a matter of minutes thanks to helicopter trans- port. Or from a pediatric nurse in a neonatal intensive care unit who provides her fragile patients with tender care. People trust these helpers. And they in turn place their trust in “Technology for Life” from Dräger, because “I will be there” is also a promise that we give to our customers – every day, around the clock and across the world.

27
INH
ALT
Reference to figures and tables
Reference to text passages and notes
Reference to the internet
Possible rounding differences may lead to slight discrepancies.
Content
1 I WILL BE THERE
Frederik Vercruysse 2
Dr. Jörg Braun 10
Caroline Wallace 18
29 SHAREHOLDER INFORMATION
Letter to the Shareholders 31
Executive Board 41
Report of the Supervisory Board 44
Report of the Joint Committee 47
49 COMBINED MANAGEMENT REPORT
The Dräger Shares 51
Principles of the Group 56
Business performance 64
Functional areas 83
Sustainability 89
Corporate Governance Report 96
Potential 111
Business performance of Drägerwerk AG & CO KGaA 134
133 ANNUAL FINANCIAL STATEMENTS
Annual Financial Statements 2015 of the Dräger Group 135
Notes of the Dräger Group for 2015 141
Management compliance statement 229
Auditor’s report 230
The Company’s Boards 232
234 FURTHER INFORMATION
Imprint 234
Financial calendar U5
Divisions over the past five years U6
The Dräger Group over the past five years U7

DRÄGER ANNUAL REPORT 201528
PAGE 29 – 47
SHAREHOLDER INFORMATION
SH
AR
EH
OLD
ER
INFO
RM
ATIO
N
29 SHAREHOLDER INFORMATION
Letter to our Shareholders 31
Executive Board 41
Report of the Supervisory Board 44
Report of the Joint Committee 47

I WILL BE THERE

Fiscal year 2015 was disappointing overall. We had to adjust our guid-
ance on two occasions. After a strong finish to the year in the fourth
quarter, our net sales rose by roughly 7 percent in nominal terms
in the reporting year, but only by roughly 3 percent net of currency
effects. Our EBIT margin declined further to under 3 percent. There
are a number of reasons for this: Many exchange rates did not devel-
op in our favor. The strong US dollar, for instance, increased the cost
base for our production activities, while the euro increased in value
against many other currencies. As we invoice our services in local
currencies and our costs in said currencies are low, this has a corre-
sponding negative impact on our earnings. In addition, there were
a number of one-off effects last year that hit our earnings, but there
were also structural effects such as increased price competition.
All in all, our costs rose more quickly than our net sales in 2015. We
must respond to this trend, as our Dräger Value Added indicator that
also takes cost of capital into account was negative. In other words,
we did not create any value in fiscal year 2015 – quite the contrary.

STEFAN DRÄGER

The global economic environment took a turn for the worse. The
International Monetary Fund withdrew its forecasts on global eco-
nomic growth on three occasions last year. Many indicators suggest
that growth rates in 2015 were considerably lower than they were
in the previous year. Although industrialized countries – including
the eurozone by now – are reporting slight growth, emerging econo-
mies, which are responsible for the majority of the growth momen-
tum, are falling significantly short of the growth figures they have
recorded in the past. China, the heavyweight among emerging econ-
omies, is in the middle of a difficult transitional phase from export-
and investment-driven growth to a stronger focus on consumption
and recorded its lowest growth figures for 25 years in 2015. Brazil
and Russia are in the midst of recession. The decline in commodity
prices, particularly of the price of oil, is also hitting many smaller
commodity exporters hard.
Emerging economies have also provided significant growth momen-
tum to Dräger in the past, but this momentum faded in 2014 and
declined more significantly in 2015. Currency fluctuations, and the
effects thereof, have also increased sharply across the globe. This
economic uncertainty is exacerbated by the spread of geopolitical
risks and conflict hotspots. This is also expressed in the high levels
of migration facing Europe in particular at the moment. On balance,
we are confronted with worse overall conditions than in previous
years.
Dear Shareholders, dear Employees, we are rising to meet the chang-
ing circumstances challenges of the future. We want to shape the
future of our Company ourselves and improve our earnings over the
long term. That is why we have decided to intensify our “Fit for
Growth” efficiency program, which we launched in 2014. Through
medium-term structural and process improvements, particularly
when it comes to administration and sales, we aim to cut materi-
als and personnel costs in the short term. Aside from a strict cost
management strategy, this also means job losses – both at regional
organizations and at the headquarters in Lübeck. We will ensure
that redundancies will be structured in a socially acceptable man-
ner and are currently involved in constructive talks with employee
representatives. In relation to this, we will also be adjusting our div-
idend policy. Apart from the minimum dividend, we propose retain-
ing profits. By doing so, we can increase our scope of action in an
environment that has become more uncertain. This will allow you,
our shareholders, will also be able to make a contribution given the
tense economic situation.
Our business model remains valid, as the medical and safety markets
remain on course for growth. We are developing our organizational
structure so that we can seize opportunities in these markets more
effectively. Country organizations, which act within the framework
of the corporate strategy, will be responsible for operating activities
in the future. Each country and region is managed by a member of
the Executive Board, which takes on this regional role in addition
to his or her functional tasks. In future, the Company headquarters
will concentrate on strategic management and defining standards.
These allow operating units to become a networked, worldwide orga-
nization. As a result, we will create clear responsibilities and greater
customer intimacy, reinforce the entrepreneurial approach and re-
spond quicker to market trends. Backed by an effective organization
and a low cost base, we will be able to generate sustained positive
results even in a difficult environment.
At this point I would like to thank our employees for their commit-
ment and loyalty. You have paved the way for growth in a problemat-
ic environment and achieved a record-breaking quarter at the end
of the year. However, there is no way past our rise in costs and the
negative earnings trend, even if this may mean that some difficult
decisions will have to be made. I have absolute confidence that we
will be able to make Dräger financially successful again together. We

anticipate an improvement in earnings in fiscal year 2016, which is
set to continue in 2017 following the systematic implementation of
our cost and efficiency measures.
Dear Shareholders, Dräger products protect, support and save lives.
This year, the title of our annual report is “I will be there.” Three
customers, users of our “Technology for Life,” have their say in the
editorial part of the report. In their areas of responsibility, they are
there when needed, for the people they are committed to. “I will
be there” is also a promise that I make for myself, just as all other
Dräger employees do – day for day and all over the world.
Best regards, Stefan Dräger


SHAREHOLDER INFORMATIONExecutive Board
41
Executive Board
Forward-looking, responsible leadership has been fundamental to Dräger’s corporate culture for more than 125 years. Stefan Dräger and his Executive Board team are dedicated to realizing a sustainable increase in corporate value, pursuing that objective with openness, passion and high standards.

DRÄGER ANNUAL REPORT 201542
Gert-Hartwig LescowGert-Hartwig Lescow is responsible for the Company’s finance function and has been Vice-Chairman of the Executive Board since April 2015. He has been with Dräger since 2008, and his term runs until the end of March 2021.
Stefan DrägerStefan Dräger is the fifth generation of the Dräger family to lead the Company, and his term runs until the end of February 2020. He joined the Company in 1992 and has been Chairman of the Executive Board since 2005.
SHAREHOLDER INFORMATIONExecutive Board
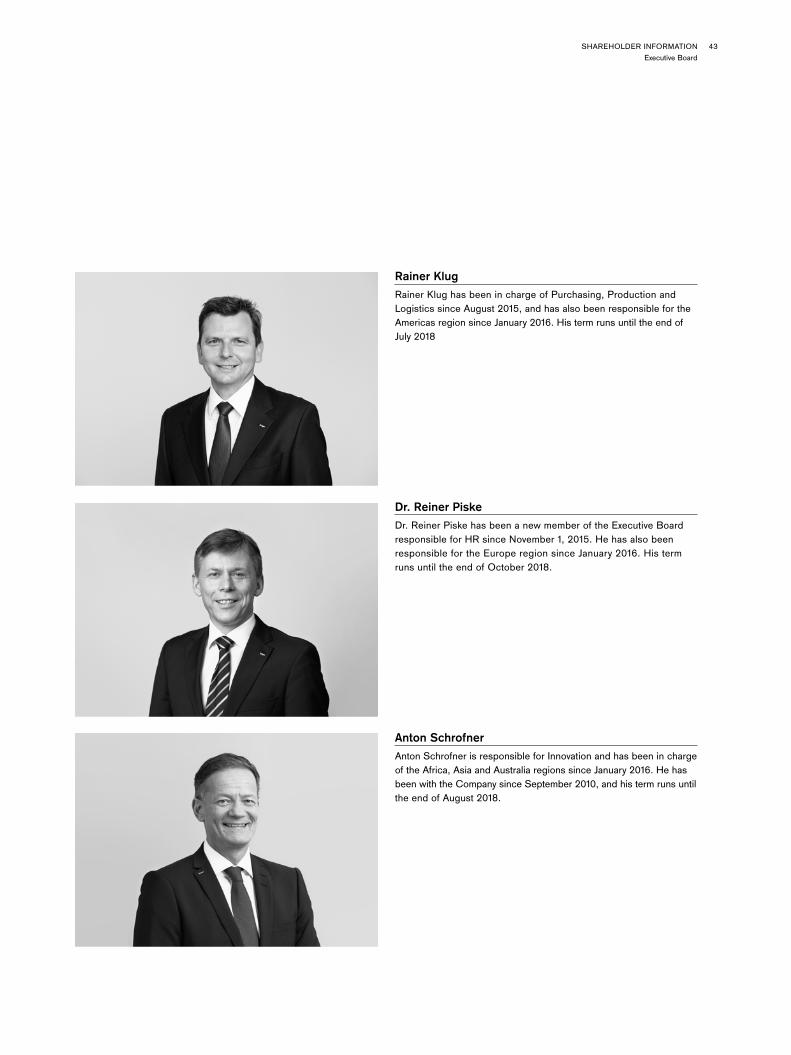
43
Dr. Reiner PiskeDr. Reiner Piske has been a new member of the Executive Board responsible for HR since November 1, 2015. He has also been responsible for the Europe region since January 2016. His term runs until the end of October 2018.
Anton SchrofnerAnton Schrofner is responsible for Innovation and has been in charge of the Africa, Asia and Australia regions since January 2016. He has been with the Company since September 2010, and his term runs until the end of August 2018.
Rainer KlugRainer Klug has been in charge of Purchasing, Production and Logistics since August 2015, and has also been responsible for the Americas region since January 2016. His term runs until the end of July 2018
DRÄGER ANNUAL REPORT 201544
Report of the Supervisory Board
Dräger looks back on a mixed fiscal year 2015, which proved to be more difficult than we expected. The Supervisory Board continued its trusting working relationship with the Executive Board, dealing in detail with the Company’s economic situation and prospects. The Supervisory Board was promptly and directly involved in all decisions.
Dear Shareholders,
Your Company did not perform satisfactorily in fiscal year 2015 from the perspective of the Supervisory Board. A slow-down in demand, particularly in emerging economies in the Asia/Pacific and Latin America regions, has proven problematic for the Company in the past year. Alongside a whole host of one-off costs, exchange rate development also had a negative impact. The strong US dollar increased production costs for the Company, while the increase in the value of the euro against many emerging economy currencies impacted margins. The earnings target issued at the start of the year had to be lowered considerably. In response, the Executive Board decided in conjunction with the Supervisory Board to intensify the “Fit for Growth” effi-ciency program. Besides stricter cost management, the Ex-ecutive Board also plans to reduce the number of employees in Lübeck by 200 by the end of fiscal year 2016. Strict cost reduction targets have also been set for Dräger’s regional organization. The EBIT margin of 2.6 percent generated in fiscal year 2015 already included provisions for correspond-ing personnel measures.
The Executive Board has set a currency-adjusted net sales growth target of zero to three percent and a target EBIT margin of between 3.5 and 5.5 percent for 2016. It also in-tends to invest further in Dräger’s future potential in 2016. Further expenses for the efficiency program are therefore anticipated in this respect. The Executive Board is also tar-geting net sales growth in 2017 and, following the imple-
mentation of the measures from the efficiency program, a further improvement in profitability. The Supervisory Board considers the expectations of the Executive Board regarding net sales and earnings development on the basis of a significant reduction in costs in fiscal years 2016 and 2017 to be realistic.
In fiscal year 2015, the Supervisory Board carefully and regularly monitored the work of the Executive Board of the general partner in accordance with the law and the articles of association, and provided advice on the strategic develop-ment of the Company as well as all major measures. The Su-pervisory Board was involved in all decisions of importance to the Company. The extensive written and oral reports by the Executive Board formed the basis for these decisions. Also outside of the Supervisory Board meetings, the Chair-man of the Supervisory Board was regularly informed by the Chairman of the Executive Board about current busi-ness developments and major transactions.
MEETINGS
In four regular meetings, the Supervisory Board dealt in detail with the business and strategic development of the Dräger Group, the divisions and their German and foreign subsidiaries, and intensively advised the Executive Board on such matters. It was not deemed necessary to discuss meetings or individual points on the agenda without the Executive Board. Aside from Klaus-Dieter Fett, who only attended two meetings due to health issues, all Superviso-

SHAREHOLDER INFORMATIONReport of the Supervisory Board
45
ry Board members attended more than half of the general meetings and committee meetings they were to attend.
FOCAL POINTS OF THE SUPERVISORY BOARD
DELIBERATIONS
In the past fiscal year, discussion focused on the Company’s organizational structure, its long-term strategic targets and its regional growth options. Additional focal points of de-liberations remained Research and Development and the legal structure in Germany.
The plan for fiscal year 2016 was presented to the Super-visory Board in a meeting held on 11 December 2015 and approved by the Joint Committee, which is responsible for resolutions concerning transactions requiring approval. Discussions were focused in this meeting on the future or-ganization of the Company and cost development.
In its meeting on 11 December 2015, the Supervisory Board also covered the German Corporate Governance Code in the version dated 5 May 2015. The Company fully complies with the recommendations of the German Corporate Gov-ernance Code. The declaration of conformity from the Supervisory Board and Executive Board pursuant to Sec. 161 German Stock Corporation Act (AktG) is permanently available on the Company website and in the corporate gov-ernance report.
ACTIVITIES OF THE AUDIT COMMITTEE
The Audit Committee held three meetings and three con-ference calls in the year under review. The CFO, the man-ager of the Accounting department, the manager of the in-ternal audit department and representatives of the auditor took part in all meetings.
At its meetings, the Audit Committee reviewed the single en-tity and Group financial statements, the quarterly reports, the half-yearly report as well as the profit appropriation proposal. In addition, the Committee audited and assessed the financial reporting process, the risk reporting system as well as the audit activities of the internal audit depart-ment and the auditors. The organization of Compliance and its activities as well as the risk management system in IT and Purchasing were also discussed at the meetings. The Chairman of the Audit Committee also informed the plenary Supervisory Board of the results of its deliberations.
ACTIVITIES OF THE NOMINATION COMMITTEE
The nomination committee did not meet in the year under review.
CORPORATE GOVERNANCE AND EFFICIENCY AUDIT
The Supervisory Board regularly deals with the application and enhancement of corporate governance principles with-in the Dräger Group. The declaration of conformity has been reproduced on page 99 et seq. of this annual report. It also evaluated its Supervisory Board activities in fiscal year 2015 and conducted an internal efficiency audit.
Prof. Dr. Nikolaus Schweickart
DRÄGER ANNUAL REPORT 201546
SINGLE ENTITY AND GROUP FINANCIAL STATEMENTS
The Supervisory Board appointed the statutory auditor elected by the annual shareholders’ meeting, Frank-furt-based PricewaterhouseCoopers Aktiengesellschaft, Wirtschaftsprüfungsgesellschaft, to audit the single entity and Group financial statements for fiscal year 2015. Sub-ject of the audit were the single entity financial statements of Drägerwerk AG & Co. KGaA, prepared in accordance with the German Commercial Code (HGB), as well as the Group financial statements, prepared in accordance with the International Financing Reporting Standards (IFRS), and the combined management report of Drägerwerk AG & Co. KGaA and the Dräger Group.
The auditors examined the single entity financial state-ments of Drägerwerk AG & Co. KGaA, prepared in accor-dance with the provisions of the German Commercial Code, the Group financial statements, prepared in accor-dance with IFRS, as well as the combined management report of both Drägerwerk AG & Co. KGaA and the Group, and issued an unqualified audit opinion. The auditors con-firmed that the Group financial statements prepared in accordance with IFRS and the Group management report conform with IFRS as adopted by the EU.
The members of the Supervisory Board carefully examined the single entity and Group financial statements and ac-companying combined management report as well as the audit reports. Representatives of the statutory auditor at-tended the Audit Committee’s meeting on March 2, 2016, during which Dräger’s single entity and group financial statements were deliberated on, as well as the Supervisory Board’s meeting on March 3, 2016, to discuss the financial statements. These representatives reported on the perfor-mance of the audit and were available to provide addition-al information. At these meetings, the Executive Board explained the single entity financial statements of Dräger-werk AG & Co. KGaA and the Group financial statements along with the risk management system. On the basis of the audit reports on the single entity and Group financial statements and the combined management report, the
Audit Committee came to the conclusion that both sets of financial statements with their respective management re-ports give a true and fair view of the net assets, financial position and results of operations in accordance with the applicable financial reporting framework. To do so, the Au-dit Committee deliberated on significant asset and liability items and their valuation as well as the presentation of the earnings position and the development of certain key fig-ures. The Chairman of the Audit Committee reported on the discussions to the Supervisory Board. Further questions by members of the Supervisory Board led to a more detailed discussion of the results. The Supervisory Board intensively discussed the adjustment to the dividend policy. The Super-visory Board was convinced that the dividend proposed by the general partner was appropriate considering the net assets, financial position and results of operations, and ap-proved it. The liquidity of the Company and the interests of the shareholders were taken into account in equal mea-sure. There were no reservations concerning the economic efficiency of the Executive Board’s actions.
After the preliminary review by the Audit Committee, the Supervisory Board reviewed and approved the single entity and Group financial statements of Drägerwerk AG & Co. KGaA as well as the combined management report. The financial statements of Drägerwerk AG & Co. KGaA must be approved by the annual shareholders’ meeting. The Su-pervisory Board agreed with the recommendation made by the general partner to approve the single entity financial statements of Drägerwerk AG & Co. KGaA and supports the proposed appropriation of net earnings.
CHANGES IN THE EXECUTIVE BOARD
Stefan Drager was appointed member and Chairman of the Executive Board of Drägerwerk Verwaltungs AG for a further five years from March 1, 2015 until February 29, 2020 by Supervisory Board resolution in January 2015. Dr. Herbert Fehrecke, Vice Chairman of the Executive Board and re-sponsible for Production, Purchasing and Quality as well as the Europe region, left the Executive Board as of March

SHAREHOLDER INFORMATIONReport of the Joint Committee
47
31, 2015 and retired. The Supervisory Board of Drägerwerk Verwaltungs AG, which is solely responsible for decisions concerning Executive Board appointments, appointed Gert-Hartwig Lescow as Vice Chairman of the Executive Board as of April 1, 2015 in its meeting on March 4, 2015. The Supervisory Board of Drägerwerk Verwaltungs AG also ap-pointed Rainer Klug as a member of the Executive Board in its meeting on March 4, 2015. Mr. Klug began his term on August 1, 2015 and is responsible for Production, Purchas-ing, Quality and Logistics (Supply Chain). In its meeting on June 26, 2015, the Supervisory Board of Drägerwerk Verwaltungs AG appointed Dr. Reiner Piske as a member of the Executive Board responsible for HR. Dr. Piske began his term on November 1, 2015.
CHANGES IN THE SUPERVISORY BOARD
There were no changes in the Supervisory Board in the year under review. Unfortunately we received news on February 23, 2016 that Supervisory Board member Klaus-Dieter Fett has passed away far too early after a serious illness.
CONFLICTS OF INTEREST
There were no conflicts of interests involving members of the Executive and Supervisory Boards, which must be dis-closed to the Supervisory Board without delay and about which the annual shareholders’ meeting must be informed.
The Supervisory Board would like to express its recognition of the Executive Board for its performance commitment and in this fiscal year. Furthermore, it thanks management and all employees, including employee representatives, for their hard work in fiscal year 2015.
Lübeck, March 3, 2016
Prof. Dr. Nikolaus SchweickartChairman of the Supervisory Board
Report of the Joint Committee
Dear Shareholders,
Since the change in legal form to a partnership limited by shares in 2007, the Company has had a Joint Committee as an additional voluntary body which comprises four mem-bers of the Supervisory Board of the general partner, two shareholder and two employee representatives from the Supervisory Board of Drägerwerk AG & Co. KGaA.
The Chairman of the Supervisory Board, Prof. Dr. Niko-laus Schweickart, is the Chairman of the Joint Committee. This Committee is responsible for transactions requiring approval (pursuant to Sec. 111 (4) Sentence 2 AktG). The Joint Committee held four regular meetings in the report-ing year, dealing in detail with the business and strategic development of the Dräger Group. The Joint Committee decided on transactions requiring approval after careful consideration of the documents provided by the Executive Board. It approved all transactions.
Lübeck, March 3, 2016
Prof. Dr. Nikolaus SchweickartChairman of the Joint Committee

DRÄGER ANNUAL REPORT 201548
CO
MB
INE
D M
AN
AG
EM
EN
T R
EP
OR
TCOMBINED MANAGEMENT REPORT
PAGE 49 – 132

49 COMBINED MANAGEMENT REPORT
The Dräger Shares 51
Principles of the Group 56
Important changes in fiscal year 2015 56
Group structure and control system 58
Strategy and goals 61
Business performance 64
General economic conditions 64
Business performance of the Dräger Group 66
Cash flow statement 71
Financial management 73
Business performance of the medical division 76
Business performance of the safety division 79
Functional areas 83
Research and Development 83
Purchasing, Production and Logistics 85
Quality 86
Marketing, Sales and Service 87
Sustainability 89
Employees 89
Environment 92
Corporate Social Responsibility 94
Corporate Governance Report 96
Remuneration report 100
Subsequent events 110
Potential 111
Risks and opportunities for the future development of the Dräger Group and of Drägerwerk AG & Co. KGaA 111
Internal control and risk management system in respect of the (Group) accounting process 111
Recognizing opportunities 119
Disclosures pursuant to Secs. 298 (4) and 315 (4) of the German Commercial Code (HGB) and explanations of the general partner 122
Outlook 125
Business performance of Drägerwerk AG & CO KGaA 134
COMBINED MANAGEMENT REPORTThe Dräger Shares
51
DEVELOPMENT ON STOCK MARKETS 1
Prices on the German stock market initially rose further at the start of 2015. The DAX began the year at 9,765 points, before reaching new highs in the following weeks and push-ing to an all-time high at 12,391 points on April 10. After this, the crisis in Greece and fears of an escalation in the political situation in Ukraine (among other factors) had a negative impact on the index, causing the DAX to lose ground again. Prices recovered somewhat in July, but the negative trend accelerated once more in the second half of the third quarter. One key factor in this was the stuttering Chinese economy, while concerns of decline in growth in other emerging economies and uncertainty concerning a forthcoming interest rate hike by the US Federal Reserve also played a role. The Volkswagen emissions scandal hit the DAX hard, particularly in September. October saw a turnaround in sentiment, with a positive mood sweeping the stock market and causing prices to rise once again. However, worries over economic development pushed the DAX back into the red towards the end of the year. The TecDAX was able to escape this negative trend for the most part. It had been matching DAX performance in the first half of the year, but in the second half of the year, it trad-ed at a much higher level. The DAX ended 2015 at 10,743 points, equating to overall performance for the year of 9.6 percent. With an increase over the course of the year of
1 Stock market prices and index levels at daily closing rates on the XETRA trading system of Deutsche Börse AG.
33.5 percent, the TecDAX performed much better, closing in December at 1,831 points.
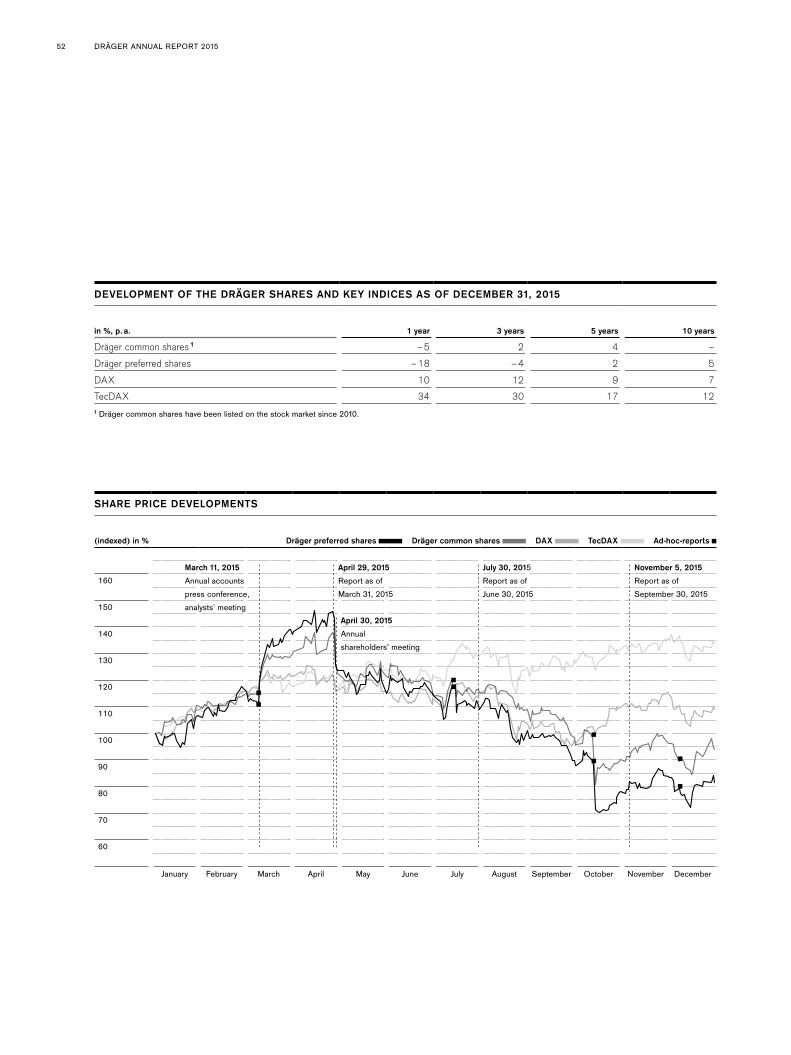
DEVELOPMENT OF THE DRÄGER SHARES
The Dräger shares made gains in the first few weeks of the year on the back of a positive market environment. They then responded to the publication of our new medium-term forecast on March 11 with further significant price increas-es. Preferred shares closed the subsequent day’s trading at over EUR 100, before reaching a new all-time high at EUR 122.00 on April 15. However, the share price declined again on the back of the first-quarter results and those for the first half of 2015. Subsequent weeks also saw prices fall in line with the DAX’s performance. The revision of the full-year targets in October saw Dräger share prices tumble, a situ-ation from which they were only able to partially recover over subsequent weeks.
Common shares closed the year at EUR 60.60, which equates to a decline of 5.0 percent compared to the end of the prior year. Preferred shares declined by 18.2 percent in 2015, closing the year at EUR 68.61.
Please refer chart “Share price developments”
The Dräger Shares
The stock markets were extremely volatile in 2015. The DAX reached a new all-time high, but ended the year significantly down on this mark. The Tec-DAX performed more favorably, closing the year only just short of its all-time high. Dräger shares failed to match this positive performance: The price of Dräger common shares fell by 5 percent over the course of the year, while the price of Dräger preferred shares declined by 18 percent.
DRÄGER ANNUAL REPORT 201552
DEVELOPMENT OF THE DRÄGER SHARES AND KEY INDICES AS OF DECEMBER 31, 2015
in %, p. a. 1 year 3 years 5 years 10 years
Dräger common shares 1 –5 2 4 –
Dräger preferred shares –18 –4 2 5
DAX 10 12 9 7
TecDAX 34 30 17 121 Dräger common shares have been listed on the stock market since 2010.
SHARE PRICE DEVELOPMENTS
(indexed) in % Dräger preferred shares Dräger common shares DAX TecDAX Ad-hoc-reports
160
150
140
130
120
110
100
90
80
70
60
January February March April May June July August September October November December
April 30, 2015 Annualshareholders’ meeting
March 11, 2015 Annual accountspress conference,analysts’ meeting
July 30, 2015 Report as ofJune 30, 2015
November 5, 2015 Report as ofSeptember 30, 2015
April 29, 2015 Report as ofMarch 31, 2015
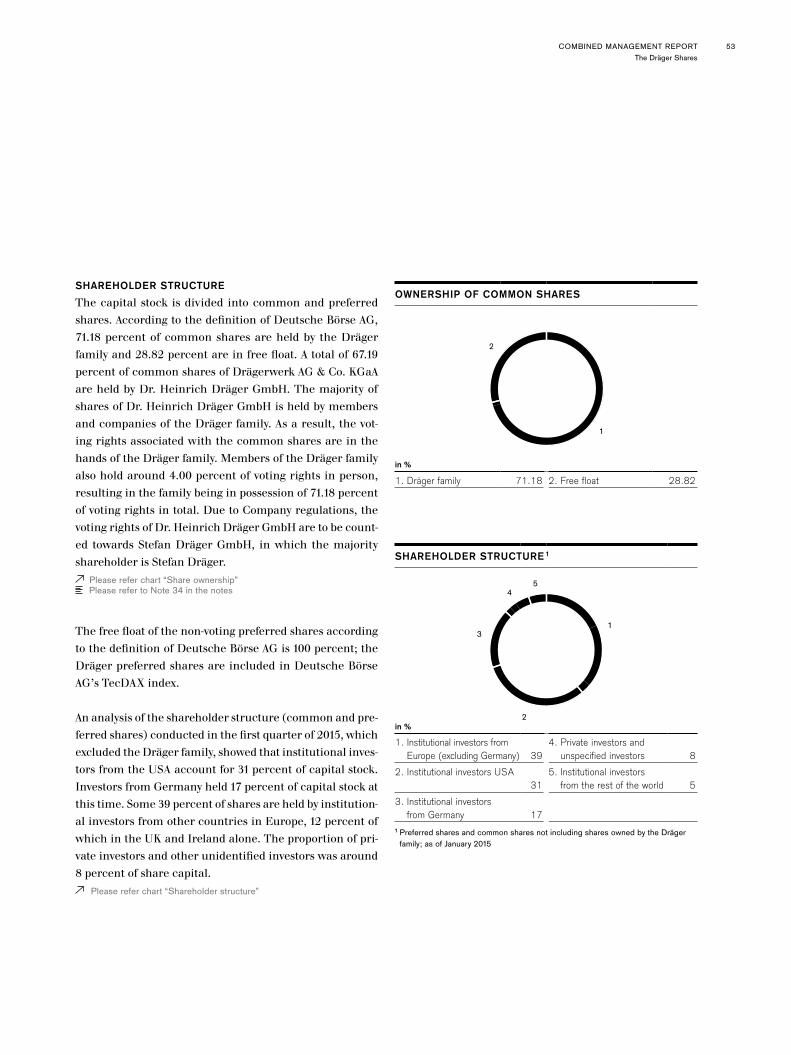
COMBINED MANAGEMENT REPORTThe Dräger Shares
53
SHAREHOLDER STRUCTURE
The capital stock is divided into common and preferred shares. According to the definition of Deutsche Börse AG, 71.18 percent of common shares are held by the Dräger family and 28.82 percent are in free float. A total of 67.19 percent of common shares of Drägerwerk AG & Co. KGaA are held by Dr. Heinrich Dräger GmbH. The majority of shares of Dr. Heinrich Dräger GmbH is held by members and companies of the Dräger family. As a result, the vot-ing rights associated with the common shares are in the hands of the Dräger family. Members of the Dräger family also hold around 4.00 percent of voting rights in person, resulting in the family being in possession of 71.18 percent of voting rights in total. Due to Company regulations, the voting rights of Dr. Heinrich Dräger GmbH are to be count-ed towards Stefan Dräger GmbH, in which the majority shareholder is Stefan Dräger.
Please refer chart “Share ownership” Please refer to Note 34 in the notes
The free float of the non-voting preferred shares according to the definition of Deutsche Börse AG is 100 percent; the Dräger preferred shares are included in Deutsche Börse AG’s TecDAX index.
An analysis of the shareholder structure (common and pre-ferred shares) conducted in the first quarter of 2015, which excluded the Dräger family, showed that institutional inves-tors from the USA account for 31 percent of capital stock. Investors from Germany held 17 percent of capital stock at this time. Some 39 percent of shares are held by institution-al investors from other countries in Europe, 12 percent of which in the UK and Ireland alone. The proportion of pri-vate investors and other unidentified investors was around 8 percent of share capital.
Please refer chart “Shareholder structure”
OWNERSHIP OF COMMON SHARES
in %
1. Dräger family 71.18 2. Free float 28.82
1
2
SHAREHOLDER STRUCTURE 1
in %
1. Institutional investors from Europe (excluding Germany) 39
4. Private investors and unspecified investors 8
2. Institutional investors USA31
5. Institutional investors from the rest of the world 5
3. Institutional investors from Germany 17
1 Preferred shares and common shares not including shares owned by the Dräger family; as of January 2015
1
2
3
45
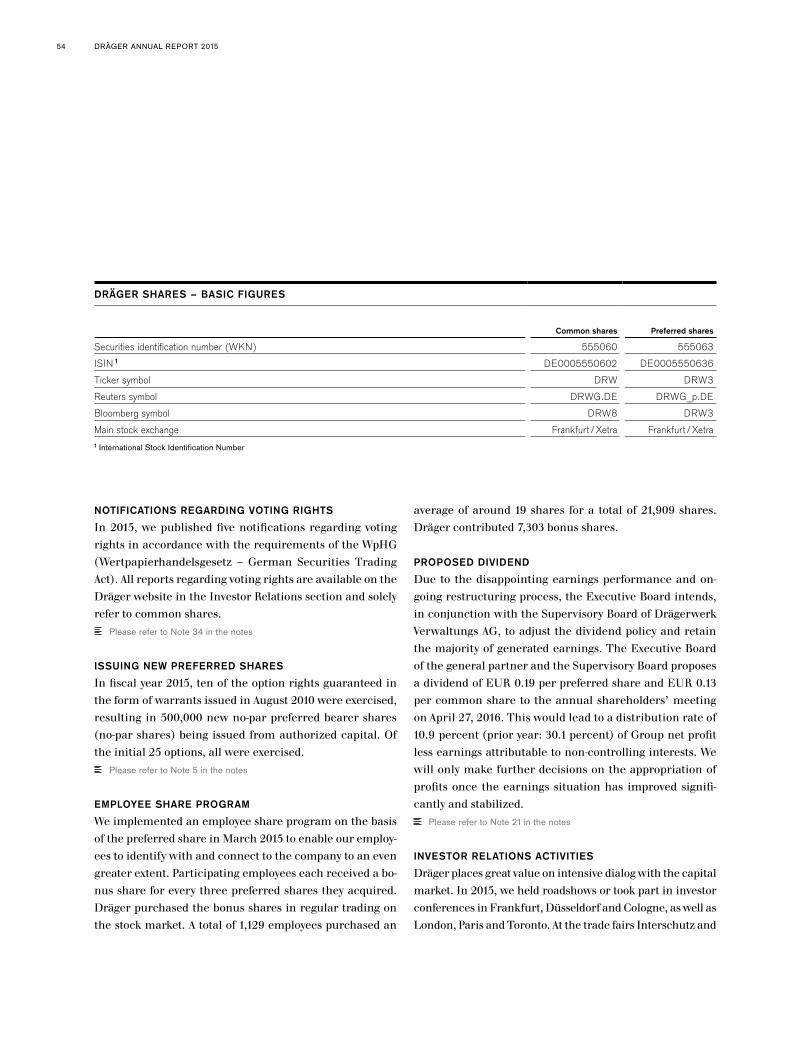
DRÄGER ANNUAL REPORT 201554
NOTIFICATIONS REGARDING VOTING RIGHTS
In 2015, we published five notifications regarding voting rights in accordance with the requirements of the WpHG (Wertpapierhandelsgesetz – German Securities Trading Act). All reports regarding voting rights are available on the Dräger website in the Investor Relations section and solely refer to common shares.
Please refer to Note 34 in the notes
ISSUING NEW PREFERRED SHARES
In fiscal year 2015, ten of the option rights guaranteed in the form of warrants issued in August 2010 were exercised, resulting in 500,000 new no-par preferred bearer shares (no-par shares) being issued from authorized capital. Of the initial 25 options, all were exercised.
Please refer to Note 5 in the notes
EMPLOYEE SHARE PROGRAM
We implemented an employee share program on the basis of the preferred share in March 2015 to enable our employ-ees to identify with and connect to the company to an even greater extent. Participating employees each received a bo-nus share for every three preferred shares they acquired. Dräger purchased the bonus shares in regular trading on the stock market. A total of 1,129 employees purchased an
average of around 19 shares for a total of 21,909 shares. Dräger contributed 7,303 bonus shares.
PROPOSED DIVIDEND
Due to the disappointing earnings performance and on-going restructuring process, the Executive Board intends, in conjunction with the Supervisory Board of Drägerwerk Verwaltungs AG, to adjust the dividend policy and retain the majority of generated earnings. The Executive Board of the general partner and the Supervisory Board proposes a dividend of EUR 0.19 per preferred share and EUR 0.13 per common share to the annual shareholders’ meeting on April 27, 2016. This would lead to a distribution rate of 10.9 percent (prior year: 30.1 percent) of Group net profit less earnings attributable to non-controlling interests. We will only make further decisions on the appropriation of profits once the earnings situation has improved signifi-cantly and stabilized.
Please refer to Note 21 in the notes
INVESTOR RELATIONS ACTIVITIES
Dräger places great value on intensive dialog with the capital market. In 2015, we held roadshows or took part in investor conferences in Frankfurt, Düsseldorf and Cologne, as well as London, Paris and Toronto. At the trade fairs Interschutz and
DRÄGER SHARES – BASIC FIGURES
Common shares Preferred shares
Securities identification number (WKN) 555060 555063
ISIN 1 DE0005550602 DE0005550636
Ticker symbol DRW DRW3
Reuters symbol DRWG.DE DRWG_p.DE
Bloomberg symbol DRW8 DRW3
Main stock exchange Frankfurt / Xetra Frankfurt / Xetra1 International Stock Identification Number
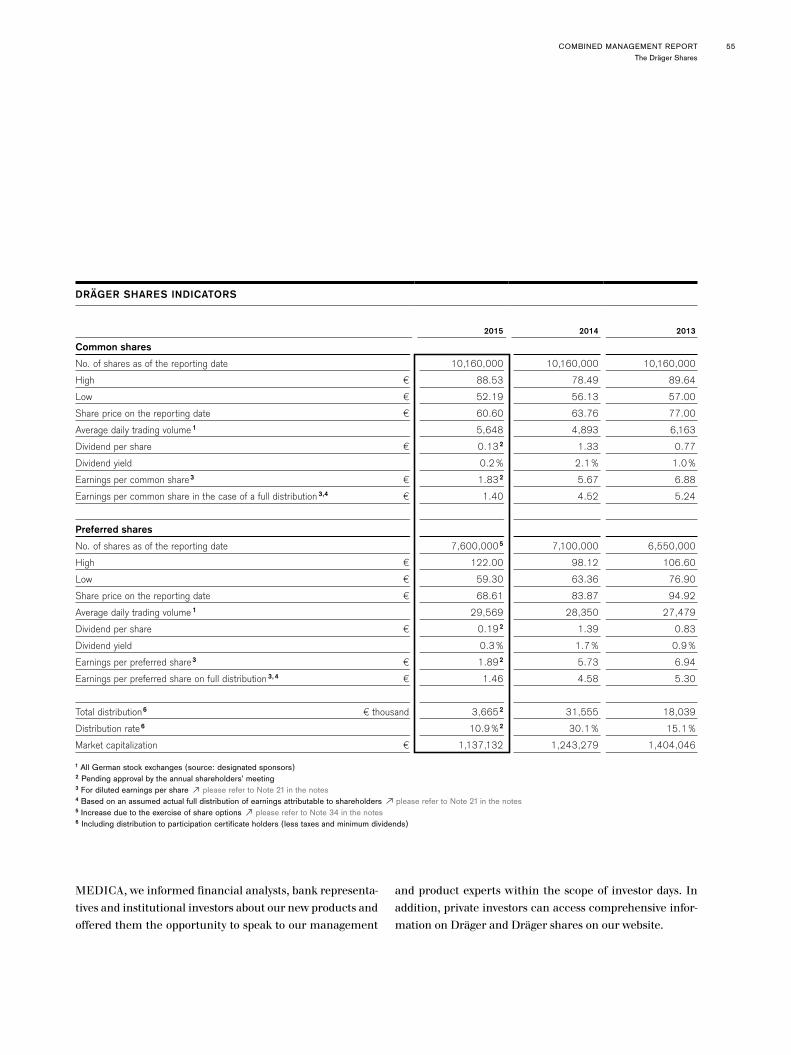
COMBINED MANAGEMENT REPORTThe Dräger Shares
55
MEDICA, we informed financial analysts, bank representa-tives and institutional investors about our new products and offered them the opportunity to speak to our management
and product experts within the scope of investor days. In addition, private investors can access comprehensive infor-mation on Dräger and Dräger shares on our website.
DRÄGER SHARES INDICATORS
2015 2014 2013
Common shares
No. of shares as of the reporting date 10,160,000 10,160,000 10,160,000
High € 88.53 78.49 89.64
Low € 52.19 56.13 57.00
Share price on the reporting date € 60.60 63.76 77.00
Average daily trading volume 1 5,648 4,893 6,163
Dividend per share € 0.13 2 1.33 0.77
Dividend yield 0.2% 2.1% 1.0%
Earnings per common share 3 € 1.83 2 5.67 6.88
Earnings per common share in the case of a full distribution 3,4 € 1.40 4.52 5.24
Preferred shares
No. of shares as of the reporting date 7,600,000 5 7,100,000 6,550,000
High € 122.00 98.12 106.60
Low € 59.30 63.36 76.90
Share price on the reporting date € 68.61 83.87 94.92
Average daily trading volume 1 29,569 28,350 27,479
Dividend per share € 0.19 2 1.39 0.83
Dividend yield 0.3% 1.7% 0.9%
Earnings per preferred share 3 € 1.89 2 5.73 6.94
Earnings per preferred share on full distribution 3, 4 € 1.46 4.58 5.30
Total distribution 6 € thousand 3,665 2 31,555 18,039
Distribution rate 6 10.9% 2 30.1% 15.1%
Market capitalization € 1,137,132 1,243,279 1,404,046
1 All German stock exchanges (source: designated sponsors)2 Pending approval by the annual shareholders’ meeting3 For diluted earnings per share please refer to Note 21 in the notes4 Based on an assumed actual full distribution of earnings attributable to shareholders please refer to Note 21 in the notes 5 Increase due to the exercise of share options please refer to Note 34 in the notes6 Including distribution to participation certificate holders (less taxes and minimum dividends)

DRÄGER ANNUAL REPORT 201556
ANALYSTS
In the course of 2015, 16 analysts from a variety of insti-tutions regularly assessed Dräger’s business performance (2014: 14): Bankhaus Metzler, Berenberg Bank, Commerz- bank, Deutsche Bank, DZ Bank, equinet, Hauck & Auf-häuser, HSBC, Independent Research, Kepler Cheuvreux, LBBW, M.M. Warburg & Co., Main First Bank, Montega, NORD/LB and ODDO Seydler Bank.
Principles of the Group
Important changes in fiscal year 2015
DECISION TO CLOSE THE SITE IN PITTSBURGH (USA)
In July 2016 we will close our safety division site in Pitts-burgh (USA). As part of this consolidation measure, all cus-tomer activities such as sales and service are to be moved to the existing Dräger site in Houston, Texas. This site will be home to global strategy and business developments for customers in the oil and gas industry. This decision sees Dräger reinforce its access to the most important markets for its safety division in the US. The administrative duties currently carried out in Pittsburgh have, for the most part, already been moved to other Dräger sites. A total of 150 em-ployees are affected by the closure of the Pittsburgh site. We are offering some of these employees the opportunity to move to another Dräger site.
ACQUISITION OF GASSECURE AS (NORWAY)
We have added a pivotal technology of the future to our gas detection portfolio, which allowed us to strengthen our strategic position as a systems provider to the oil and gas industry and the chemicals industry. Through Dräger Hold-ing International GmbH, a subsidiary of Drägerwerk AG & Co. KGaA, Dräger acquired a 100 percent stake in Gas-Secure AS, based in Oslo (Norway). The start-up, founded in 2008 and financed through venture capital since 2010, has developed a technology for a wireless optical gas sensor that detects hydrocarbons and has developed a marketable product on this basis.
CHANGES TO THE EXECUTIVE BOARD OF DRÄGERWERK
VERWALTUNGS AG
Dr. Herbert Fehrecke retired as of March 31, 2015 as planned. Gert-Hartwig Lescow was appointed new Vice Chairman of the Executive Board. Rainer Klug began his role as new Chief Supply Chain Officer (CSCO) at Dräger on August 1, 2015. Dr. Reiner Piske was appointed as a new member of the Executive Board responsible for HR. He be-gan his role at Dräger on November 1, 2015.
ANALYST RECOMMENDATIONS 1
1. Hold 11 3. Buy 1
2. Sell 41 At the end of 2015
12
3
COMBINED MANAGEMENT REPORTPrinciples of the Group
57
INTENSIFYING THE EFFICIENCY PROGRAM
On December 7, 2015, the Executive Board resolved to re-duce staff numbers both in the regional organizations and at the headquarters in Lübeck as part of the intensification of the “Fit for Growth” efficiency program. Under this pro-gram, roughly 200 jobs will be reduced at the Lübeck site by the end of 2016.
AMENDMENTS TO SEGMENT REPORTING
Dräger manages its operating business development through two segments, the medical division and the safe-ty division. This structure is based on the same model as the company’s strategic development. Until 2014, Dräger’s corporate structures were also largely set up in line with these two segments, meaning that separate legal entities usually existed for the safety division and the medical divi-sion. These separate structures are being merged together as part of the mission to create a standardized corporate structure, the aim of the “One Dräger” project. This is a logical step as it allows us to reduce complexity and costs in many countries. We are now systematically pursuing this process. In Switzerland, Austria, the Netherlands and South Africa, this consolidation has already been completed. In Germany, Dräger Medical GmbH was merged into Dräger-werk AG & Co. KGaA. Further mergers in Germany and abroad are set to follow.
The merger of the previously separate legal entities of the safety division and of the medical division required amend-ments to the previous segment reporting: From the first quarter of 2015, the results of the medical and safety divi-sions are calculated on the basis of product attribution to the medical or safety division instead of on the basis of the legal entities as had been the case previously.
This results in the following changes to our reporting in the income and loss statement:
– Net sales are no longer based on the consolidated net sales of the sub-groups (including internal Group net sales); instead reporting is now based solely on third-party net sales. This means that it is no longer necessary to elim-inate intersegment net sales during the consolidation process, for example.
– Non-product-related costs, including headquarter costs, previously recognized in the Drägerwerk AG & Co. KGaA/Other Companies segment, are now allocated to the two divisions on the basis of the planned net sales.
– The Drägerwerk AG & Co. KGaA/Other Companies seg-ment, as well as the need for consolidation in the report-ing process, therefore no longer applies.
In the balance sheet, only items that can be attributed to the products of the medical or safety divisions or their cus-tomers are reported for each segment:
– Balance sheet items not allocated to products in the medi-cal and safety divisions or to their customers are now only reported at Group level.
– Reporting capital employed in segment reporting is based on the key influencing factors of net working capital (trade receivables, inventories including prepayments received). Long-term capital such as property, plant and equipment is no longer included in segment reporting, as it can no longer be allocated to the segments following the merger of the legal units.
Please find below a list of the differences in figures between the old and new reporting systems in fiscal year 2014 for the segments.
Please refer table “Effects on Segment Reporting” For further details please refer to Note 3.
OTHER CHANGES TO REPORTING
The way in which marketing and selling expenses and gen-eral administrative expenses are reported has changed. Un-til now, administrative expenses at the sales companies in

DRÄGER ANNUAL REPORT 201558
the regions have been charged as a lump sum to marketing and selling expenses. Following the successful introduction of our new reporting system with a corporate chart of ac-counts applicable throughout the Group, these costs will now also be reported in the regions as administrative ex-penses. This does not affect the sum total of marketing and selling expenses and administrative expenses.
Please refer table “Effects on Functional Costs”
Group structure and control system
The parent company of the Dräger Group and the medical division is Drägerwerk AG & Co. KGaA. It holds all shares in the parent company of the safety division (Dräger Safety AG & Co. KGaA). All the shareholdings which form part of the global operations of the two divisions are either directly or indirectly owned by the respective parent. In addition, Drägerwerk AG & Co. KGaA also holds some equity invest-ments which do not form part of the two divisions’ opera-tions. Central functions and jointly used services are pooled at Drägerwerk AG & Co. KGaA.
Please refer to Note 55 in the notes
Dräger is represented in more than 190 countries on all continents. It has its own sales and service companies in
more than 50 countries. The Group operates development and production sites in Germany (Lübeck), China (Shang-hai and Beijing), Great Britain (Blyth), Norway (Oslo) and the US (Andover, Pittsburgh – set to close in 2016 – and Telford) as well as production sites in Germany (Hagen), Brazil (São Paulo), Chile (Santiago de Chile), Great Brit-ain (Plymouth), Sweden (Svenljunga), South Africa (King William’s Town) and the Czech Republic (Chomutov and Klášterec).
As of December 31, 2015, 13,936 people were employed worldwide, of whom 52.9 percent work in sales, marketing and service, 25.4 percent in production, quality assurance, logistics and purchasing, 10.2 percent in research and de-velopment and 11.5 % in administration.
OPERATING ACTIVITIES OF THE MEDICAL DIVISION
In the medical division, Dräger develops, produces, and markets system solutions, equipment and services for acute point of care (APOC): for perioperative care (products and services connected to the operating room), intensive care and neonatal care, as well as emergency care. Our portfolio comprises products for therapy, monitoring, information management and process support. We are one of the glob-al market leaders with our products for ventilation, anes-thetics and warming therapy as well as related accessories
EFFECTS ON SEGMENT REPORTING
Twelve months 2014 Dräger medical division Dräger safety divisionDrägerwerk AG & Co. KGaA/
Other companies Consolidation Dräger Group
in € million old new old new old new old new old new
Net sales 1,585.4 1,577.2 890.9 857.5 13.4 – –55.1 – 2,434.7 2,434.7
EBIT 128.9 107.6 88.4 71.0 121.6 – –160.3 – 178.6 178.6
Depreciation /amortization 28.3 49.8 29.2 27.2 19.5 – – – 77.0 77.0
Capital Employed 1 679.5 721.5 256.3 292.1 804.9 – –633.5 – 1,107.2 1,107.2
DVA 69.2 47.2 66.1 47.6 – – – – 81.6 81.6
1 Capital employed in segments = trade receivables, inventories incl. prepayments received; Capital employed Group = total assets less deferred tax assets, current securities, cash and cash equivalents and non-interest-bearing liabilities
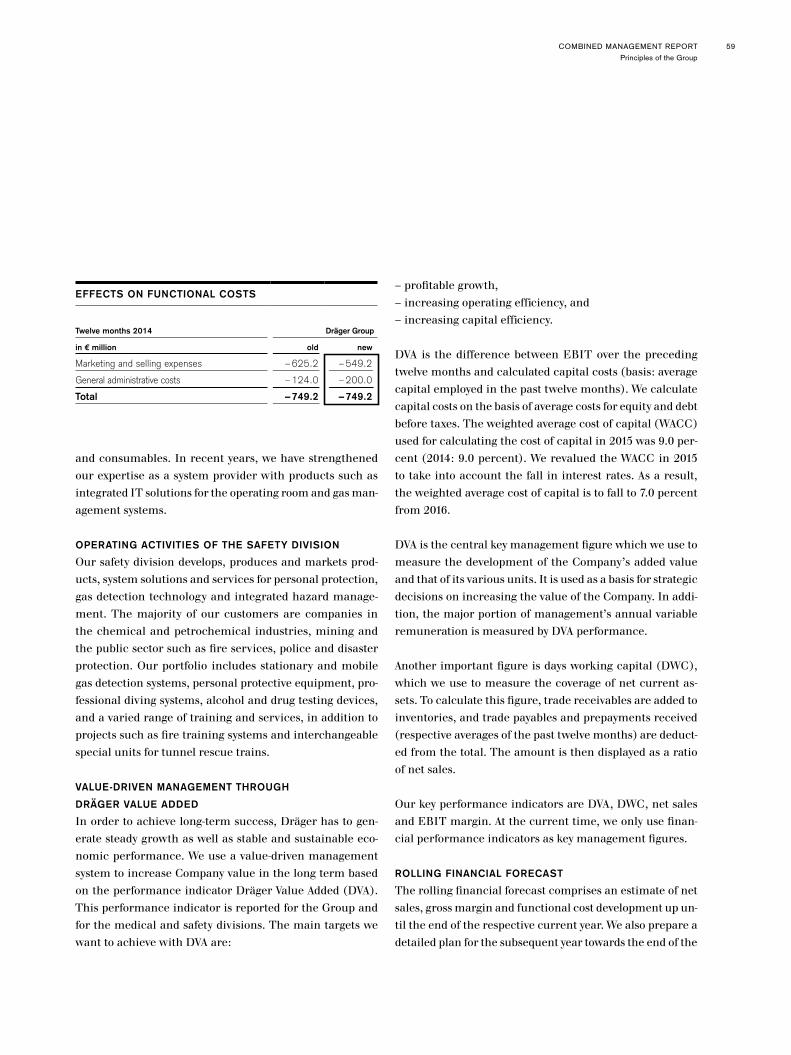
COMBINED MANAGEMENT REPORTPrinciples of the Group
59
and consumables. In recent years, we have strengthened our expertise as a system provider with products such as integrated IT solutions for the operating room and gas man-agement systems.
OPERATING ACTIVITIES OF THE SAFETY DIVISION
Our safety division develops, produces and markets prod-ucts, system solutions and services for personal protection, gas detection technology and integrated hazard manage-ment. The majority of our customers are companies in the chemical and petrochemical industries, mining and the public sector such as fire services, police and disaster protection. Our portfolio includes stationary and mobile gas detection systems, personal protective equipment, pro-fessional diving systems, alcohol and drug testing devices, and a varied range of training and services, in addition to projects such as fire training systems and interchangeable special units for tunnel rescue trains.
VALUE-DRIVEN MANAGEMENT THROUGH
DRÄGER VALUE ADDED
In order to achieve long-term success, Dräger has to gen-erate steady growth as well as stable and sustainable eco-nomic performance. We use a value-driven management system to increase Company value in the long term based on the performance indicator Dräger Value Added (DVA). This performance indicator is reported for the Group and for the medical and safety divisions. The main targets we want to achieve with DVA are:
– profitable growth,– increasing operating efficiency, and – increasing capital efficiency.
DVA is the difference between EBIT over the preceding twelve months and calculated capital costs (basis: average capital employed in the past twelve months). We calculate capital costs on the basis of average costs for equity and debt before taxes. The weighted average cost of capital (WACC) used for calculating the cost of capital in 2015 was 9.0 per-cent (2014: 9.0 percent). We revalued the WACC in 2015 to take into account the fall in interest rates. As a result, the weighted average cost of capital is to fall to 7.0 percent from 2016.
DVA is the central key management figure which we use to measure the development of the Company’s added value and that of its various units. It is used as a basis for strategic decisions on increasing the value of the Company. In addi-tion, the major portion of management’s annual variable remuneration is measured by DVA performance.
Another important figure is days working capital (DWC), which we use to measure the coverage of net current as-sets. To calculate this figure, trade receivables are added to inventories, and trade payables and prepayments received (respective averages of the past twelve months) are deduct-ed from the total. The amount is then displayed as a ratio of net sales.
Our key performance indicators are DVA, DWC, net sales and EBIT margin. At the current time, we only use finan-cial performance indicators as key management figures.
ROLLING FINANCIAL FORECAST
The rolling financial forecast comprises an estimate of net sales, gross margin and functional cost development up un-til the end of the respective current year. We also prepare a detailed plan for the subsequent year towards the end of the
EFFECTS ON FUNCTIONAL COSTS
Twelve months 2014 Dräger Group
in € million old new
Marketing and selling expenses –625.2 –549.2
General administrative costs –124.0 –200.0
Total –749.2 –749.2

DRÄGER ANNUAL REPORT 201560
third quarter. Current business performance is analyzed based on this forecast. Appropriate countermeasures are taken whenever performance remains behind expectations.
NEW MANAGEMENT SYSTEM FROM FISCAL YEAR 2016
Until the end of fiscal year 2015, the Company was man-aged through the two divisions: the medical division and the safety division. An expanded functional Executive Man-agement Team (EMT) was responsible for the operating management of the two divisions.
We are realigning our organizational and management sys-tem to put the spotlight on the customer even more and make our internal decision-making processes more effi-cient. At the start of fiscal year 2016, the Executive Board replaced the EMT as the central management body. Three Executive Board members are each responsible for busi-ness performance in countries and regions; they assume regional responsibility in addition to their functional tasks. In future, the Company headquarters will concentrate on strategic management and defining standards. The coun-tries themselves are responsible overall for operative busi-ness. In each country with Dräger subsidiaries, a manag-
EXECUTIVE BOARD RESPONSIBILITIES AS OF JANUARY 1, 2016
Stefan Dräger Chairman of the Executive Board
Gert-Hartwig LescowVice-Chairman of the
Executive Board
Dr. Reiner Piske Anton Schrofner Rainer Klug
Regional responsibilities
Functional responsibilities
Americas Europe Africa, Asia, Australia
Accounting
Controlling
Customs and Export Control
Insurances
Investor Relations
IT
Risk Management
Taxes
Treasury
Corporate Auditing
Corporate Communications
Corporate Strategy and Business Development
Legal, Compliance and Data Protection
Real Estate
Custom Project Business
Logistics
Manufacturing
Purchasing
Human Resources Intellectual Property
Product Management
Quality
Research and Development

COMBINED MANAGEMENT REPORTPrinciples of the Group
61
er makes decisions on site as a Managing Director on all aspects of business and in all functions within the scope of the corporate strategy. The Managing Director usually reports directly to the regional organization.
Segment reporting will change from 2016 with the change to the management approach. Future segment reporting will be aligned with the responsibilities for business of the three Executive Board members with regional responsibility.
Regional responsibilities were restructured for fiscal year 2016. Rainer Klug is now responsible for the Americas re-gion, Dr. Reiner Piske for Europe and Anton Schrofner for the Middle East, Africa and Asia/Pacific regions. Until the end of 2015, Gert-Hartwig Lescow was responsible for the Americas region while Dr. Herbert Fehrecke, and Stefan Dräger following Dr. Fehrecke’s departure, held responsi-bility for Europe. The Executive Board member with re-gional responsibility maintains contact to customers and bridges the gap between thinking globally and acting lo-cally. What’s more, this structure also provides cross-func-tional balance.
This ensures the clearer allocation of tasks and responsi-bilities, the promotion of an entrepreneurial attitude and the acceleration of decision-making processes. This all goes hand in hand with our aim of reducing costs and stream-lining our administrative structures.
Please refer to chart “Executive Board responsibilities as of January 1, 2016”
Strategy and goals
We have been committed to turning technology into “Tech-nology for Life” for over 125 years now – it is a vital part of our corporate identity. Our products protect, support and save lives. This is the basis from which Dräger has grown in the past and on which we will also build moving forward. To ensure our successful longevity, we will continue to con-
solidate the interests of our target groups: our customers, suppliers, employees, shareholders, banks and those in our direct vicinity.
The Company’s principles are and remain our guidance. They determine a key part of our decisions. We will remain an independent, self-determining, pioneering, value-creat-ing and attractive Company.
Our four Corporate Aspirations represent our vision of Dräger in ten years’ time.
CORPORATE ASPIRATIONS
We are first choice for our customersAcross all functions we have a joint focus on our customers who have a positive experience at all
Dräger touch points. Customer satisfaction and loyalty is high.
We have a truly global footprintWe offer a high level of service to our customers wherever they are located in the world. To serve
our global markets, work with our suppliers, and support our sales channel partners in an optimal way, we have im-plemented the right organization and processes. We en-courage our people to bring out their talent wherever they are and in whatever function they operate. Our balanced sales and expenses across the geographies make us more resilient. We think globally and act locally.
We are networking across borders as entrepreneursWe see the big picture, share our knowledge and
expertise, support and collaborate with each other, and learn from each other. We are all part of a highly profession-al and social network working across departmental, legal entity, and country borders. This goes beyond our compa-ny and includes customers, suppliers, and sales channel
DRÄGER ANNUAL REPORT 201562
partners. We manage the challenge to be connected. Our entrepreneurial spirit is based on our individual judgment and common sense.
We get things doneWe get things done with an entrepreneurial cul-ture in a lean organization. For our customers, we
have offerings that no other supplier can match, whether these are innovative products, integrated systems or cus-tom-built solutions. With our innovations, we are the first to fulfill customer needs. Dräger’s culture empowers our people to make decisions each and every day.
MEDICAL DIVISION
In the medical division, we support our customers with products and solutions for optimal acute care in a hospital environment.
More-effective workflows With our workstation concepts and the expertise of our em-ployees, we improve our customers’ workflows in operating rooms and on hospital wards; all of our products are closely coordinated with the individual customer’s requirements. We help them to become more efficient. At the same time, we increase patient safety and the satisfaction of hospital staff.
Improving clinical results We want to show our customers the benefits of our innova-tive hospital solutions and improve treatment results. We always keep an eye on external factors, such as the char-acteristics of our customers’ remuneration systems (key term: flat rate per case).
Appealing to price-conscious customers Our approach of meeting customer desires and require-ments across the board enables us to work more efficiently.
This puts us in a position to offer solutions to price-con-scious customers, too.
SAFETY DIVISION
We orient the Company and our portfolio specifically to-wards the requirements of various markets and optimize our sales channels. In doing so, we can improve access to our customers. We are systematically developing the Dräger brand and will become a global partner to our customers for integrated system solutions. Internationality is the key to meeting customer requirements and ensuring our suc-cess as a Company, especially in industries such as oil and gas, chemicals and mining.
Oil and gasWe act as a trusted partner for our customers in their infrastructure projects. We are constantly
working on expanding our range of solutions and services to cement this position. The focus remains firmly on provid-ing strategic services to major global customers.
Chemical industryWe provide a holistic support model for all occupa-tional health and safety processes at our custom-
ers’ sites. Our intention moving forward is to become the sole port of call for our customers. We can achieve this by expanding our equipment rental business, on-site services and management of production stops. Our worldwide sales network enables us to provide services to multinational chemical corporations and global infrastructure projects.
MiningWith a wealth of experience in mine rescue, we have a key role to play in establishing and ex-
panding emergency management systems, particularly in emerging markets. Our occupational safety and safety man-agement solutions help our customers to guarantee that their mines are running safely over the long term.
COMBINED MANAGEMENT REPORTPrinciples of the Group
63
Fire servicesWe know what counts in day-to-day firefighting. Equipped with our considerable expertise and
experience, we are our customers’ side as a trusted part-ner. We provide products and services whenever they are required by fire services, including before and after the job such as in training situations and for maintenance purpos-es.
Application-driven marketsBy focusing on a handful of industries, we coun-teract the heterogeneity of our customers outside
of the aforementioned market segments. Here, the priority is on efficient market cultivation, the selection of optimal sales channels and the provision of solutions for specific customer applications.
MEDIUM-TERM COMPANY GOALS
Our medium-term Company goals are geared towards both financial and non-financial key figures. They are based on our corporate aspirations. In the medium term, we focus on the following areas:
Net sales growth, regional and industry focusOur medical and safety technology markets constitute growth markets. The North and South America and Asia/Pacific regions are the drivers of our growth. These regions’ share of net sales is set to increase significantly in the me-dium term. We want to outperform market growth here, particularly in the safety market. In mining, the chemical industry and the oil & gas sector, our aim is to boost our market share significantly in the medium term.
EBIT and DVA The strategic initiatives and efficiency programs, which we launched at Dräger in 2014 and 2015, are aimed at putting us in the position to increase the EBIT margin significantly and over the long term in an increasingly competitive mar-
ket. One consequence of this will be a major rise in Dräger Value Added.
Net Promoter ScoreThe Net Promoter Score (NPS) system is being used for the first time as a measure of customer loyalty (intention to rec-ommend Dräger). In addition to measures for specific cus-tomer segments, a specially developed internal program is also aimed at helping us to improve customers’ experiences with Dräger across all points of contact. We are aiming to improve the NPS system accordingly.
Time to marketWe want to improve our innovation while keeping the costs of research and development in check. Shorter innovation and market-entry cycles strengthen our competitiveness.
For fiscal year 2016 we have also defined quantified targets for a range of these indicators.
Please see the “Outlook” section on pages 125 et seq. of this manage-ment report for more details on this and a more precise forecast.

DRÄGER ANNUAL REPORT 201564
Business performance
General economic conditions
WEAK DEVELOPMENT IN EMERGING ECONOMIES SLOWS
DOWN GLOBAL ECONOMY
The Organization for Economic Cooperation and Develop-ment (OECD) expects global economic growth to continue to decline and has adjusted its forecasts accordingly. Ac-cording to the OECD, development in important emerg-ing markets is a particular factor in the bleak outlook. The OECD believes that the slowdown in global trade should be seen as a warning sign. The Institute for the World Econo-my (IfW) also agrees with this assessment: It believes that global economic development will be dampened by weak development in emerging economies, particularly in Chi-na. The driving forces behind economic growth are moving more towards developed economies in which loose mone-tary policy continues to have a stimulating effect. According to the IfW’s analysis, the global economy’s rate of expansion in 2015 is likely to have fallen slightly compared to prior years to 3.3 percent; slightly higher growth of 3.7 percent is expected in 2016. By contrast, moderate recovery is con-tinuing in the eurozone and the upturn is spreading across the continent. Here, the IfW is forecasting rises in gross domestic product of 1.5 percent and 1.7 percent in 2015 and 2016 respectively. So far, Germany has defied the unsettled global economic climate and, according to the IfW, is on course for a boom in economic development. Growth of 1.8 percent is expected in 2015, while 2016 could see this figure rise to 2.1 percent.
ECB STICKS TO STRATEGY, FED HERALDS INTEREST
TURNAROUND
The European Central Bank (ECB) had lowered its bench-mark interest rate to a record-breaking low of 0.05 percent in early September 2014. It also increased the penalty rate it charges banks to deposit excess liquidity from 0.2 percent to 0.3 percent in 2015. In addition, the ECB announced that it would be extending its quantitative easing program, in which it acquires bonds from public issuers worth EUR
60 billion per month, by a further six months to March 2017. By contrast, the US Federal Reserve (Fed) ended its monthly bond-buying program in October 2014 and has since been preparing the market for an interest rate hike. Following the Fed’s decision in September to postpone the planned interest rate hike due to the latest developments in the global economy, particularly concerning the uncer-tainty in China, it raised its benchmark rates marginally in mid-December – marking the first rise since the financial crisis.
EXTREMELY LOW INFLATION, EURO WEAK AGAINST
THE US DOLLAR BUT STRONG AGAINST EMERGING
ECONOMY CURRENCIES
Bolstered by low energy costs, rates of inflation remained extremely low in 2015. In Germany, prices only rose by 0.3 percent year on year in 2015; in certain months, the eurozone even saw negative month-on-month inflation. The rate of inflation in the eurozone came to 0.0 percent in the reporting year. The euro lost a considerable amount of ground against the US dollar once again: The euro had traded at approximately USD 1.21 at the end of the prior year, but it fell to under USD 1.10 by the end of 2015. How- ever, the euro did increase in value against several emerg-ing market currencies over the course of the year – in some cases significantly.
MEDICAL DIVISION – INDUSTRY PERFORMANCE
The medical technology industry performed well overall in 2015. Sales volumes in the US market rose slightly in spite of huge cost-cutting measures in the healthcare sector, largely thanks to an increase in population and an ageing society. Moderate growth also continued in emerging economies, even though development slowed considerably in the sec-ond half of the year. Demand for medical technology in the Chinese market remained high and was boosted by numer-ous investments in the restructuring and expansion of the Chinese health care sector. However, not all manufacturers were able to profit from Chinese market growth to the same

COMBINED MANAGEMENT REPORTBusiness performance
65
extent, as new government regulations favored domestic producers over international manufacturers. Demand in Northern and Southern Europe developed positively once again, as was the case in the Middle East, where – as in China – major investment was made in the expansion of the healthcare sector. By contrast, growth in Central and South America stagnated.
SAFETY DIVISION – INDUSTRY PERFORMANCE
The relevant sectors for the safety division also experienced slight positive development in 2015. Growth in the US stag-nated, with the oil and gas industry suffering from falling returns in the wake of a sharp fall in crude oil prices. As a result, investment in new projects was sluggish and crude oil production lost significant momentum in the second half of the year. Another issue was the strength of the US dollar, which impacted exports of US industrial firms and had an effect on demand for safety technology. In China, however, the market for safety technology products expe-rienced moderate growth. Industrial production in China may have seen a substantial slowdown in growth compared to 2014, but sales of safety technology products were still able to benefit from the growth trend. Sales in Northern and Southern Europe also experienced slightly positive growth. Growth in Central and South America stagnated, while sales in the Middle East rose sharply once again.
TRENDS WITH AN INFLUENCE ON OUR
BUSINESS PERFORMANCE
We constantly monitor and analyze the most important factors that influence our business. Aside from economic aspects, these factors include the three most important megatrends at the current time: globalization, health and connectivity.
Globalization Globalization refers to the ever-closer linkage of markets across the world. Manufacturers offer their goods and ser-vices globally and are constantly tapping into new sales
markets. As a result, not only are sales markets shifting from industrialized nations to emerging economies, pro-duction locations are too, not least due to intensive global competition and rising cost pressure in companies. The general shift towards emerging markets is also stimulating local economies and generating a growth spurt; the stan-dard of living in these countries is rising. More and more people are gaining access to medical services, while occu-pational health and safety standards are also rising in line with prosperity. On balance, globalization is leading to a long-term increase in the demand for medical and safety products.
Health Nowadays, health is not just about avoiding illness; the term now describes a state of physical, mental and social well-being. This is fueled by the realization that quality of life into old age depends on daily well-being. The desire to maintain good health, coupled with population growth and issues of aging populations in many societies, is also boost-ing demand for medical care. Given that health as a trend is not simply limited to people’s private lives, but encom-passes the working world too, statutory health and safety standards for dangerous workplaces are also rising. In view of these influences, the outlook for the medical and safety technology industries remains good over the medium and long term.
ConnectivityA growing state of digital connectivity has been shaping the economy for years. The widespread use of connected devic-es and the availability of rapid internet connections open up a wealth of opportunities for businesses, but also pose a number of challenges in terms of innovation and competi-tiveness. In hospitals, for example, demand for connected medical technology devices and IT systems to simplify and enhance clinical processes and their management is rising; in the safety technology industry, the wireless transfer of

DRÄGER ANNUAL REPORT 201566
safety-relevant data from measurement equipment to IT systems is becoming increasingly important.
OVERALL ASSESSMENT OF FRAMEWORK CONDITIONS
Global economic growth fell short of expectations in 2015. A certain degree of economic recovery was observed in indus-trialized economies, particularly the eurozone. However, many emerging economies have recorded a slowdown in growth momentum, meaning that many emerging mar-kets’ currencies lost value – some substantially – over the course of the year. At the same time, the recent divergence in monetary policy in the US and Europe has resulted in the euro losing a significant amount of its value against the US dollar. In 2015, this meant that fluctuations in exchange rates had a positive impact on our net sales but a negative overall effect on earnings development.
see table “Major currency changes sorted by their impact on Dräger’s earnings”
Business performance of the Dräger Group
see table “Business performance of the Dräger Group” on page 69
OVERALL MANAGEMENT ASSESSMENT OF
BUSINESS PERFORMANCE
The year 2015 was marked by slower global economic growth than expected. Growth rates in industrialized econ-
omies rose slightly, whereas declines in growth were re-corded in emerging economies such as in China and Brazil. Once again, there were major changes in commodity prices and exchange rates in 2015. The devaluation of the euro against the US dollar continued, while the euro increased in value against many emerging economy currencies, con-siderably in some cases.
Against this backdrop, order intake rose year on year by 4.8 percent. Our net sales rose somewhat more sharply by 7.2 percent and reached a new record level of EUR 2.6 billion. Exchange rate development also had an impact on our business performance in fiscal year 2015. Order intake only rose slightly by 0.8 percent net of currency effects, while net sales increased by 2.9 percent net of currency effects. Net sales growth in the medical division outper-formed growth in the safety division.
In terms of earnings, we recorded a decline in earnings before interest and taxes (EBIT) in fiscal year 2015 of 62.7 percent to EUR 66.7 million (2014: EUR 178.6 mil-lion). As a result, our EBIT margin fell from 7.3 percent to 2.6 percent. Besides negative currency effects, the increase in functional costs and one-off effects, including one-off ex-penses for our “Fit for Growth” efficiency program, also played a role here. Dräger Value Added (DVA), the most im-portant key management figure, declined significantly in
MAJOR CURRENCY CHANGES SORTED BY THEIR IMPACT ON DRÄGER’S EARNINGS
Average rates compared to the euro12 months 2014 12 months 2015 Changes Dräger exposure Earnings effects for
Dräger (EBIT)
US dollar 1.32 1.10 –16.4% Short
Chinese yuan 8.16 6.95 –14.9% Long
Saudi riyal 4.96 4.15 –16.4% Long
Russian ruble 52.01 68.77 32.2% Long
Brazilian real 3.11 3.74 20.3% Long
COMBINED MANAGEMENT REPORTBusiness performance
67
fiscal year 2015. As of December 31, we had generated a DVA of EUR –46.3 million (2014: EUR 81.6 million).
In light of the reliability of our forecast, the following con-clusions can be drawn when comparing forecast figures with actual figures:
We were forced to adjust our forecasts midway through the year due to demand failing to meet expectations and the weak earnings trend. In terms of net sales development, we were able to wrap up 2015 within the originally fore-cast range and at the upper end of the range by posting an increase of 2.9 percent net of currency effects, thanks to an extremely strong final quarter. We also had to lower our EBIT margin forecast during the year. This was due to negative currency effects from the devaluation of the US dollar and the devaluation of a range of emerging economy currencies. Our rise in costs also impacted EBIT. What is more, the third quarter also saw the Company incur one-off expenses. Our EBIT margin in fiscal year 2015 came within the corrected range and also already included expenses for our efficiency program from the fourth quarter, which were not yet able to be determined when the forecast was correct-ed. The fall in EBIT did not result in the anticipated slight improvement in DVA; in fact, DVA declined considerably as a consequence.
Our other forecast figures developed as follows:
At 44.9 percent, our gross margin was down on the pri-or-year figure in accordance with the corrected forecast. A less-favorable product mix, weaker price performance and negative currency effects had an impact here. Our R & D expenses in 2015 came in at EUR 231.1 million, slight-ly above the originally anticipated figure. The somewhat higher expenses were due to exchange rate developments. We also had to adjust the forecast operating cash flow as a percentage of EBIT due to a disproportionately high rise in working capital over the course of the year. The acquisition
of Norwegian company GasSecure AS in spring 2015 also had an impact on our forecasts for investment volume and net financial debt, which we adjusted accordingly. What is more, the fall in earnings also contributed to the rise in net financial debt. The interest result, the effective tax rate and the equity ratio all developed as expected in fiscal year 2015.
see table “Comparison of forecast figures and actual figures”
The development of Dräger’s business is considered in de-tail as follows.
ORDER INTAKE
In fiscal year 2015, Dräger’s order intake increased year on year by 0.8 percent (net of currency effects) to EUR 2,532.2 million (2014: EUR 2,415.5 million). Both the medical di-vision and the safety division achieved slight increases in order intake, net of currency effects.
In Group-wide terms, order intake only increased in Eu-rope including Germany by 2.2 percent. In Germany itself order intake actually rose by 4.2 %. However, orders in all other regions declined slightly net of currency effects.
see table “Order intake” on page 70
NET SALES
In fiscal year 2015, Dräger net sales increased by 2.9 per-cent (net of currency effects) to EUR 2,608.9 million (2014: EUR 2,434.7 million). Net sales rose in all regions apart from the Americas region. Net sales growth in the Middle East, Africa and Other Countries region was above aver-age, as it was in Europe and Germany. The Asia/Pacific region recorded slight growth net of currency effects. In the medical division net sales climbed by 3.1 percent net of cur-rency effects, while in the safety division they increased by 2.7 percent net of currency effects.
see table “Net sales” on page 70

DRÄGER ANNUAL REPORT 201568
EARNINGS
Our gross profit rose by EUR 33.6 million in fiscal year 2015 to EUR 1,171.7 million, and thereby less than net sales. At 44.9 percent, our gross margin was 1.8 percentage points lower than in the prior year. Both divisions contributed to this drop in margin. The decline was due to lower pricing in several areas, particularly in business with government agencies and in major projects in the medical division. Higher quality costs continued to have an impact on earn-ings. What is more, the US dollar remained strong, while currencies in emerging economies devalued further. All in all, currency effects had a negative impact on the develop-ment of our gross margin.
Our functional costs increased by 13.5 percent in the fiscal year. One-off expenses for our “Fit for Growth” efficiency program, which were mostly incurred in the fourth quar-
ter, impacted earnings in the amount of EUR 34.8 million. Changes in exchange rates also resulted in a rise in func-tional costs. Net of these effects, functional costs rose by 5.4 percent. Net of currency effects, sales and marketing costs were up year on year (+6.6 percent). The increase was the result of the full-year effect of the 2014 headcount increase and the recruitment in 2015. In addition, risk pro-visions and running costs for the acquired company Gas-Secure AS were also responsible for the rise. Research and development (R & D) costs climbed by 3.7 percent as antic-ipated net of the change in exchange rates (+9.0 percent in nominal terms). The ratio of R & D costs to net sales (R & D ratio) therefore stood at 8.9 percent (2014: 8.7 percent). Net of currency effects and one-off expenses for our efficiency program, our administration costs rose by 4.5 percent. The lower allocation of IT costs into the regions’ selling costs also led to higher administration costs. Personnel expenses
COMPARISON OF FORECAST FIGURES AND ACTUAL FIGURES
Forecast 2015See AR 2014
Forecast 2015 Last published
Fiscal year 2015 Results achieved
Net salesGrowth of between 2 and 5%
(net of currency effects) Growth of between 1 and 3%
(net of currency effects)Growth of 2.9%
(net of currency effects)
EBIT margin Between 6 and 8% Between 2.5 and 4.5%1 2.6%2
DVAModerate improvement
(2014: EUR 81.6 million) Decline EUR –46.3 million
Other forecast figures:
Gross margin On a par with prior year (2014: 46.7%) Down on prior year 44.9%
Research and develop-ment costs EUR 220 million to EUR 230 million EUR 220 million to EUR 230 million EUR 231.1 million
Interest result Slight improvement (2014: EUR –25.0 million) Slight improvement EUR –17.2 million
Effective tax rate Between 30 and 33% Between 30 and 33% 32.8%
Operating cash flow > 70% of EBIT > 50% of EBIT 59.8% of EBIT
Investment volume EUR 110 million to EUR 130 million EUR 170 million to EUR 190 million EUR 196.8 million
Equity ratio > 40% > 40% 40.9%
Net financial debt Slight improvement (2014: EUR 10.7 million) Decline EUR 145.3 million
1 Excluding expenses for the efficiency program in Q42 After the recognition of expenses for the efficiency program in Q4
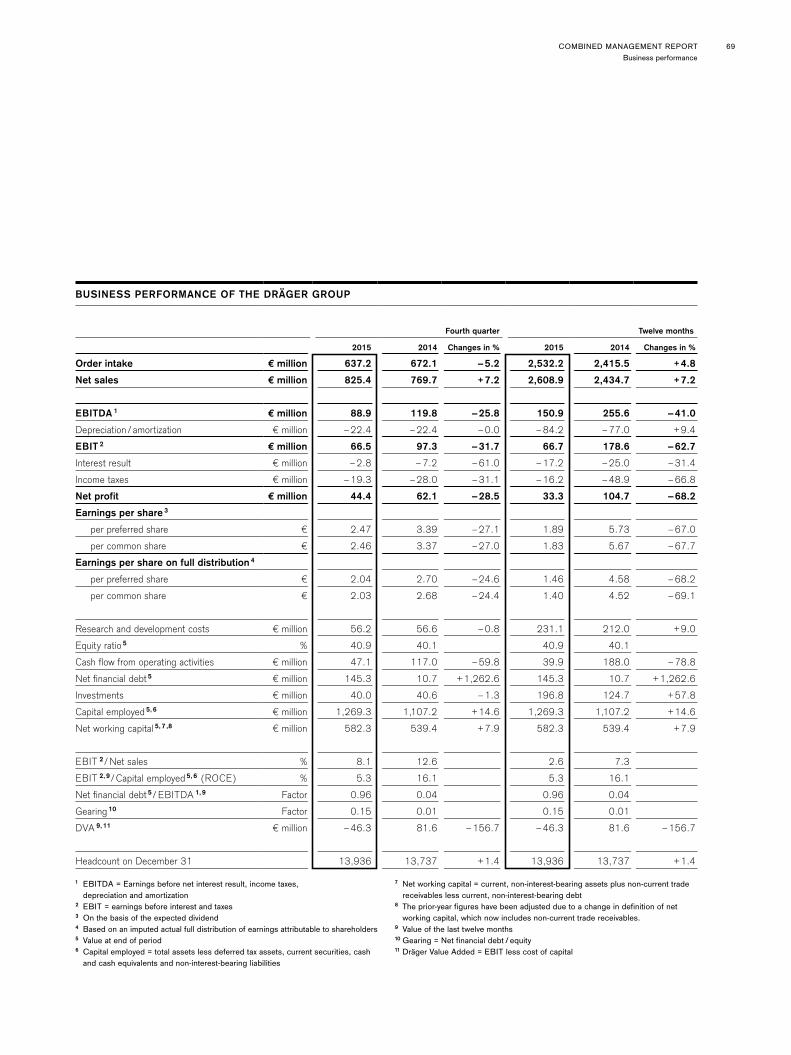
COMBINED MANAGEMENT REPORTBusiness performance
69
1 EBITDA = Earnings before net interest result, income taxes, depreciation and amortization
2 EBIT = earnings before interest and taxes3 On the basis of the expected dividend4 Based on an imputed actual full distribution of earnings attributable to shareholders5 Value at end of period 6 Capital employed = total assets less deferred tax assets, current securities, cash
and cash equivalents and non-interest-bearing liabilities
7 Net working capital = current, non-interest-bearing assets plus non-current trade receivables less current, non-interest-bearing debt
8 The prior-year figures have been adjusted due to a change in definition of net working capital, which now includes non-current trade receivables.
9 Value of the last twelve months10 Gearing = Net financial debt /equity11 Dräger Value Added = EBIT less cost of capital
BUSINESS PERFORMANCE OF THE DRÄGER GROUP
Fourth quarter Twelve months
2015 2014 Changes in % 2015 2014 Changes in %
Order intake € million 637.2 672.1 –5.2 2,532.2 2,415.5 +4.8
Net sales € million 825.4 769.7 +7.2 2,608.9 2,434.7 +7.2
EBITDA 1 € million 88.9 119.8 –25.8 150.9 255.6 –41.0
Depreciation / amortization € million –22.4 –22.4 –0.0 –84.2 –77.0 +9.4
EBIT 2 € million 66.5 97.3 –31.7 66.7 178.6 –62.7
Interest result € million –2.8 –7.2 –61.0 –17.2 –25.0 –31.4
Income taxes € million –19.3 –28.0 –31.1 –16.2 –48.9 –66.8
Net profit € million 44.4 62.1 –28.5 33.3 104.7 –68.2
Earnings per share 3
per preferred share € 2.47 3.39 –27.1 1.89 5.73 –67.0
per common share € 2.46 3.37 –27.0 1.83 5.67 –67.7
Earnings per share on full distribution 4
per preferred share € 2.04 2.70 –24.6 1.46 4.58 –68.2
per common share € 2.03 2.68 –24.4 1.40 4.52 –69.1
Research and development costs € million 56.2 56.6 –0.8 231.1 212.0 +9.0
Equity ratio 5 % 40.9 40.1 40.9 40.1
Cash flow from operating activities € million 47.1 117.0 –59.8 39.9 188.0 –78.8
Net financial debt 5 € million 145.3 10.7 +1,262.6 145.3 10.7 +1,262.6
Investments € million 40.0 40.6 –1.3 196.8 124.7 +57.8
Capital employed 5, 6 € million 1,269.3 1,107.2 +14.6 1,269.3 1,107.2 +14.6
Net working capital 5, 7 ,8 € million 582.3 539.4 +7.9 582.3 539.4 +7.9
EBIT 2/ Net sales % 8.1 12.6 2.6 7.3
EBIT 2, 9/Capital employed 5, 6 (ROCE) % 5.3 16.1 5.3 16.1
Net financial debt 5/ EBITDA 1, 9 Factor 0.96 0.04 0.96 0.04
Gearing 10 Factor 0.15 0.01 0.15 0.01
DVA 9, 11 € million –46.3 81.6 –156.7 –46.3 81.6 –156.7
Headcount on December 31 13,936 13,737 +1.4 13,936 13,737 +1.4
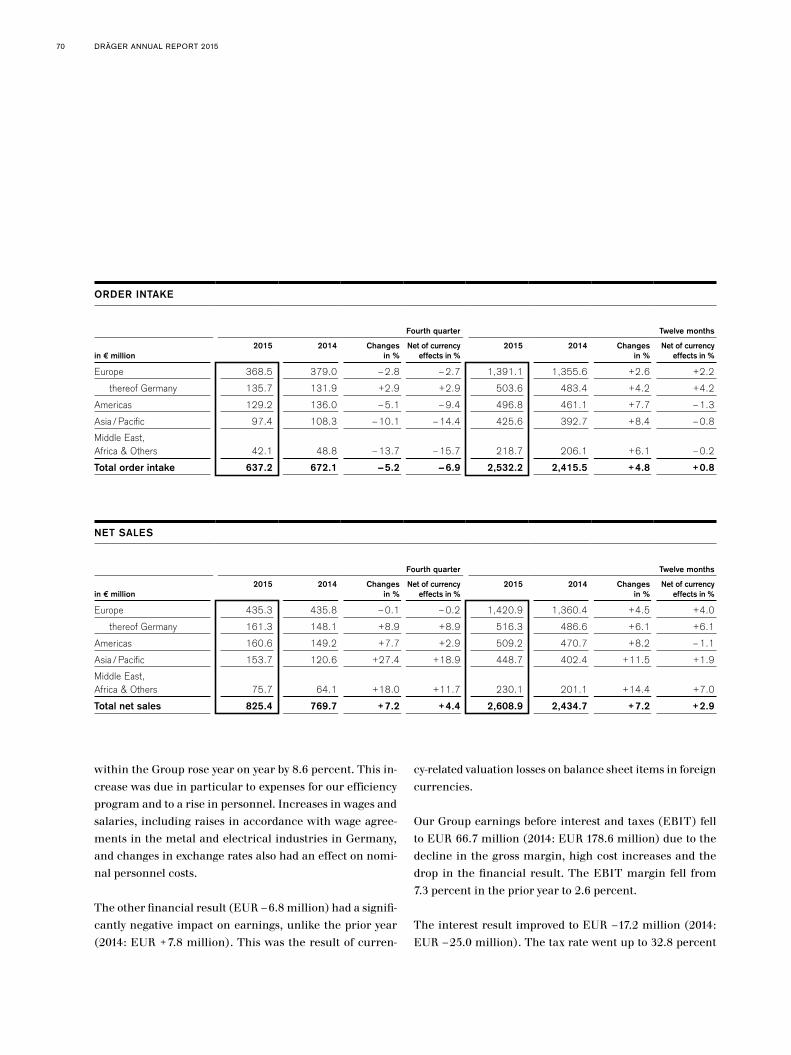
DRÄGER ANNUAL REPORT 201570
within the Group rose year on year by 8.6 percent. This in-crease was due in particular to expenses for our efficiency program and to a rise in personnel. Increases in wages and salaries, including raises in accordance with wage agree-ments in the metal and electrical industries in Germany, and changes in exchange rates also had an effect on nomi-nal personnel costs.
The other financial result (EUR –6.8 million) had a signifi-cantly negative impact on earnings, unlike the prior year (2014: EUR +7.8 million). This was the result of curren-
cy-related valuation losses on balance sheet items in foreign currencies.
Our Group earnings before interest and taxes (EBIT) fell to EUR 66.7 million (2014: EUR 178.6 million) due to the decline in the gross margin, high cost increases and the drop in the financial result. The EBIT margin fell from 7.3 percent in the prior year to 2.6 percent.
The interest result improved to EUR –17.2 million (2014: EUR –25.0 million). The tax rate went up to 32.8 percent
ORDER INTAKE
Fourth quarter Twelve months
in € million2015 2014 Changes
in %Net of currency
effects in %2015 2014 Changes
in %Net of currency
effects in %
Europe 368.5 379.0 –2.8 –2.7 1,391.1 1,355.6 +2.6 +2.2
thereof Germany 135.7 131.9 +2.9 +2.9 503.6 483.4 +4.2 +4.2
Americas 129.2 136.0 –5.1 –9.4 496.8 461.1 +7.7 –1.3
Asia /Pacific 97.4 108.3 –10.1 –14.4 425.6 392.7 +8.4 –0.8
Middle East, Africa & Others 42.1 48.8 –13.7 –15.7 218.7 206.1 +6.1 –0.2
Total order intake 637.2 672.1 –5.2 –6.9 2,532.2 2,415.5 +4.8 +0.8
NET SALES
Fourth quarter Twelve months
in € million2015 2014 Changes
in %Net of currency
effects in %2015 2014 Changes
in %Net of currency
effects in %
Europe 435.3 435.8 –0.1 –0.2 1,420.9 1,360.4 +4.5 +4.0
thereof Germany 161.3 148.1 +8.9 +8.9 516.3 486.6 +6.1 +6.1
Americas 160.6 149.2 +7.7 +2.9 509.2 470.7 +8.2 –1.1
Asia /Pacific 153.7 120.6 +27.4 +18.9 448.7 402.4 +11.5 +1.9
Middle East, Africa & Others 75.7 64.1 +18.0 +11.7 230.1 201.1 +14.4 +7.0
Total net sales 825.4 769.7 +7.2 +4.4 2,608.9 2,434.7 +7.2 +2.9
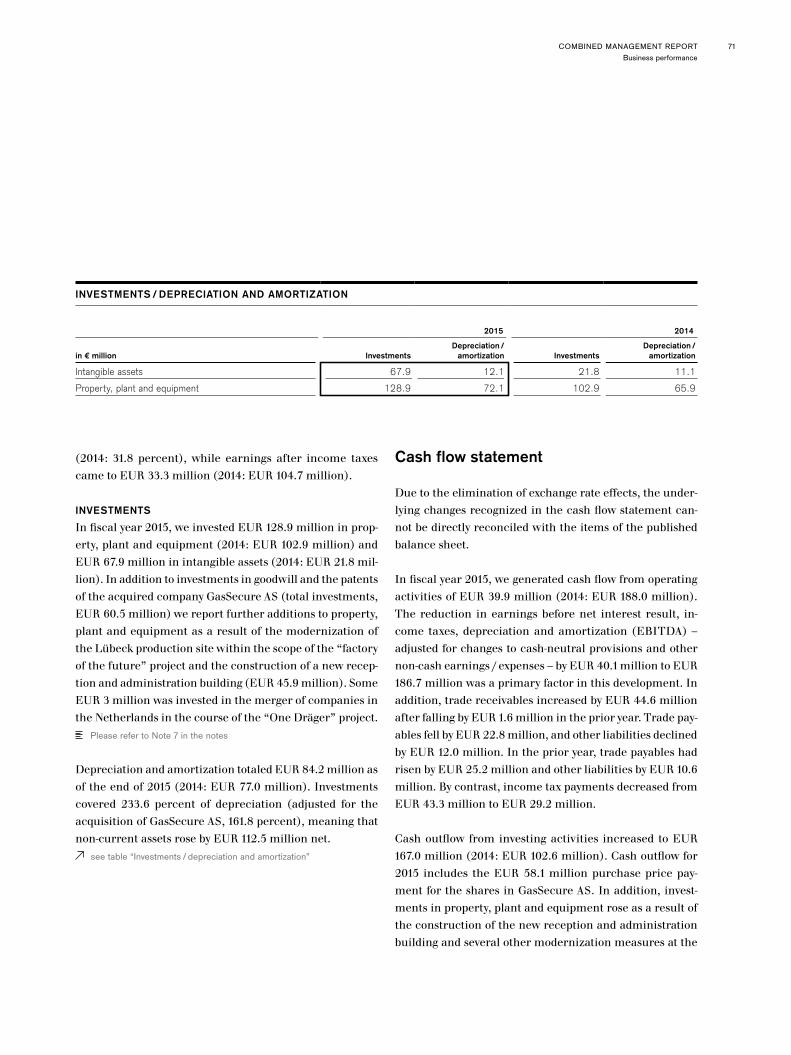
COMBINED MANAGEMENT REPORTBusiness performance
71
(2014: 31.8 percent), while earnings after income taxes came to EUR 33.3 million (2014: EUR 104.7 million).
INVESTMENTS
In fiscal year 2015, we invested EUR 128.9 million in prop-erty, plant and equipment (2014: EUR 102.9 million) and EUR 67.9 million in intangible assets (2014: EUR 21.8 mil-lion). In addition to investments in goodwill and the patents of the acquired company GasSecure AS (total investments, EUR 60.5 million) we report further additions to property, plant and equipment as a result of the modernization of the Lübeck production site within the scope of the “factory of the future” project and the construction of a new recep-tion and administration building (EUR 45.9 million). Some EUR 3 million was invested in the merger of companies in the Netherlands in the course of the “One Dräger” project.
Please refer to Note 7 in the notes
Depreciation and amortization totaled EUR 84.2 million as of the end of 2015 (2014: EUR 77.0 million). Investments covered 233.6 percent of depreciation (adjusted for the acquisition of GasSecure AS, 161.8 percent), meaning that non-current assets rose by EUR 112.5 million net.
see table “Investments /depreciation and amortization”
Cash flow statement
Due to the elimination of exchange rate effects, the under-lying changes recognized in the cash flow statement can-not be directly reconciled with the items of the published balance sheet.
In fiscal year 2015, we generated cash flow from operating activities of EUR 39.9 million (2014: EUR 188.0 million). The reduction in earnings before net interest result, in-come taxes, depreciation and amortization (EBITDA) – adjusted for changes to cash-neutral provisions and other non-cash earnings/expenses – by EUR 40.1 million to EUR 186.7 million was a primary factor in this development. In addition, trade receivables increased by EUR 44.6 million after falling by EUR 1.6 million in the prior year. Trade pay-ables fell by EUR 22.8 million, and other liabilities declined by EUR 12.0 million. In the prior year, trade payables had risen by EUR 25.2 million and other liabilities by EUR 10.6 million. By contrast, income tax payments decreased from EUR 43.3 million to EUR 29.2 million.
Cash outflow from investing activities increased to EUR 167.0 million (2014: EUR 102.6 million). Cash outflow for 2015 includes the EUR 58.1 million purchase price pay-ment for the shares in GasSecure AS. In addition, invest-ments in property, plant and equipment rose as a result of the construction of the new reception and administration building and several other modernization measures at the
INVESTMENTS/ DEPRECIATION AND AMORTIZATION
2015 2014
in € million InvestmentsDepreciation/
amortization InvestmentsDepreciation/
amortization
Intangible assets 67.9 12.1 21.8 11.1
Property, plant and equipment 128.9 72.1 102.9 65.9
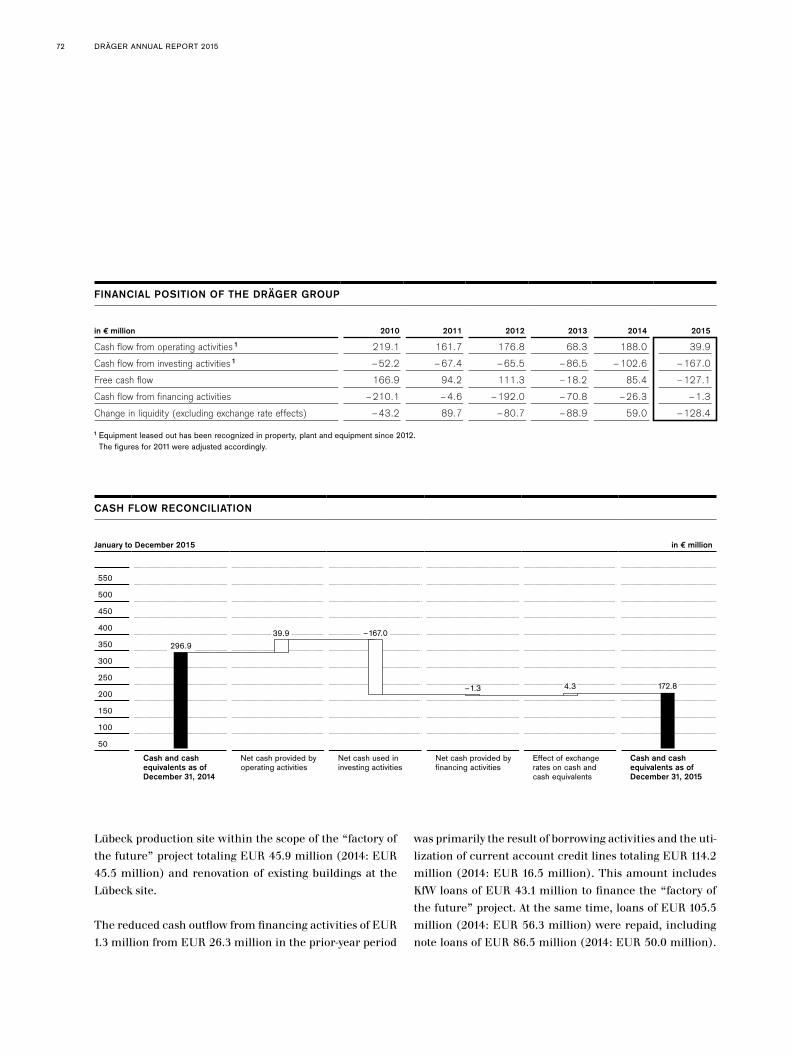
DRÄGER ANNUAL REPORT 201572
Lübeck production site within the scope of the “factory of the future” project totaling EUR 45.9 million (2014: EUR 45.5 million) and renovation of existing buildings at the Lübeck site.
The reduced cash outflow from financing activities of EUR 1.3 million from EUR 26.3 million in the prior-year period
was primarily the result of borrowing activities and the uti-lization of current account credit lines totaling EUR 114.2 million (2014: EUR 16.5 million). This amount includes KfW loans of EUR 43.1 million to finance the “factory of the future” project. At the same time, loans of EUR 105.5 million (2014: EUR 56.3 million) were repaid, including note loans of EUR 86.5 million (2014: EUR 50.0 million).
CASH FLOW RECONCILIATION
January to December 2015 in € million
550
500
450
400
350
300
250
200
150
100
50
Cash and cashequivalents as ofDecember 31, 2014
Net cash provided byoperating activities
Net cash used ininvesting activities
Net cash provided byfinancing activities
Effect of exchangerates on cash andcash equivalents
Cash and cashequivalents as ofDecember 31, 2015
39.9 –167.0
–1.3 4.3 172.8
296.9
FINANCIAL POSITION OF THE DRÄGER GROUP
in € million 2010 2011 2012 2013 2014 2015
Cash flow from operating activities 1 219.1 161.7 176.8 68.3 188.0 39.9
Cash flow from investing activities 1 –52.2 –67.4 –65.5 –86.5 –102.6 –167.0
Free cash flow 166.9 94.2 111.3 –18.2 85.4 –127.1
Cash flow from financing activities –210.1 –4.6 –192.0 –70.8 –26.3 –1.3
Change in liquidity (excluding exchange rate effects) –43.2 89.7 –80.7 –88.9 59.0 –128.4
1 Equipment leased out has been recognized in property, plant and equipment since 2012. The figures for 2011 were adjusted accordingly.
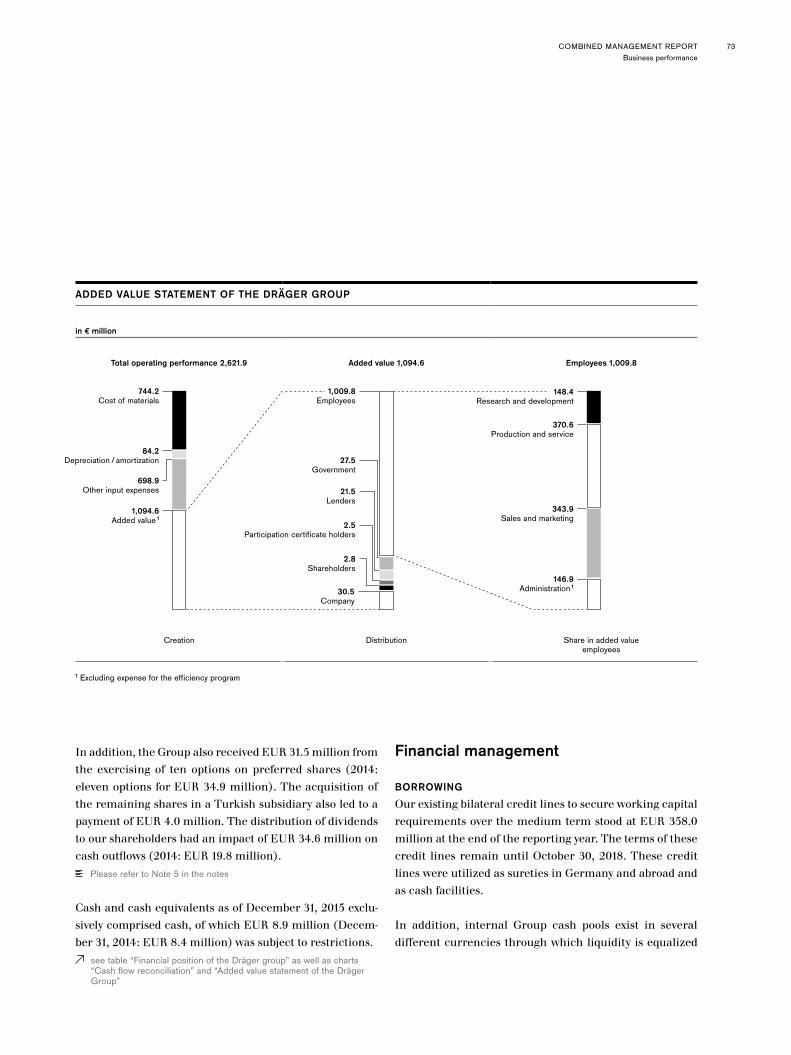
COMBINED MANAGEMENT REPORTBusiness performance
73
In addition, the Group also received EUR 31.5 million from the exercising of ten options on preferred shares (2014: eleven options for EUR 34.9 million). The acquisition of the remaining shares in a Turkish subsidiary also led to a payment of EUR 4.0 million. The distribution of dividends to our shareholders had an impact of EUR 34.6 million on cash outflows (2014: EUR 19.8 million).
Please refer to Note 5 in the notes
Cash and cash equivalents as of December 31, 2015 exclu-sively comprised cash, of which EUR 8.9 million (Decem-ber 31, 2014: EUR 8.4 million) was subject to restrictions.
see table “Financial position of the Dräger group” as well as charts “Cash flow reconciliation” and “Added value statement of the Dräger Group”
Financial management
BORROWING
Our existing bilateral credit lines to secure working capital requirements over the medium term stood at EUR 358.0 million at the end of the reporting year. The terms of these credit lines remain until October 30, 2018. These credit lines were utilized as sureties in Germany and abroad and as cash facilities.
In addition, internal Group cash pools exist in several different currencies through which liquidity is equalized
ADDED VALUE STATEMENT OF THE DRÄGER GROUP
in € million
Total operating performance 2,621.9 Added value 1,094.6 Employees 1,009.8
Creation Distribution Share in added valueemployees
1 Excluding expense for the efficiency program
744.2 Cost of materials
148.4Research and development
370.6Production and service
343.9Sales and marketing
1,094.6 Added value 1
84.2 Depreciation/amortization
698.9 Other input expenses
1,009.8Employees
27.5Government
21.5Lenders
2.5Participation certificate holders
2.8Shareholders
30.5Company
146.9Administration 1
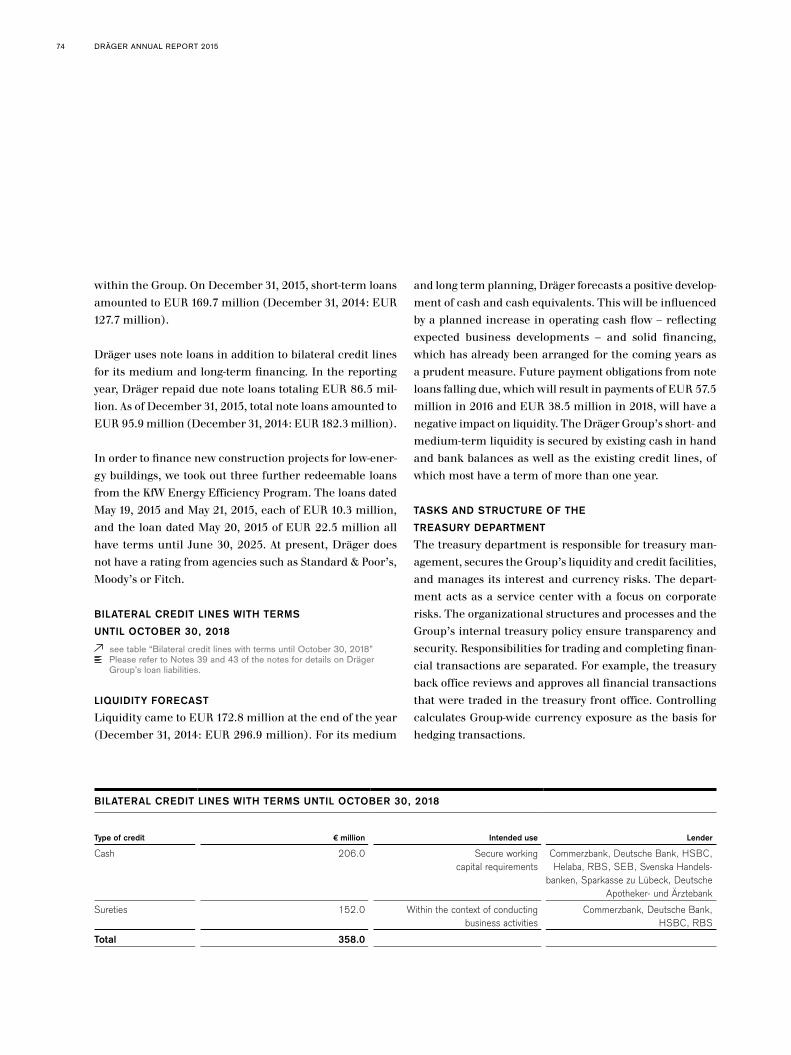
DRÄGER ANNUAL REPORT 201574
within the Group. On December 31, 2015, short-term loans amounted to EUR 169.7 million (December 31, 2014: EUR 127.7 million).
Dräger uses note loans in addition to bilateral credit lines for its medium and long-term financing. In the reporting year, Dräger repaid due note loans totaling EUR 86.5 mil-lion. As of December 31, 2015, total note loans amounted to EUR 95.9 million (December 31, 2014: EUR 182.3 million).
In order to finance new construction projects for low-ener-gy buildings, we took out three further redeemable loans from the KfW Energy Efficiency Program. The loans dated May 19, 2015 and May 21, 2015, each of EUR 10.3 million, and the loan dated May 20, 2015 of EUR 22.5 million all have terms until June 30, 2025. At present, Dräger does not have a rating from agencies such as Standard & Poor’s, Moody’s or Fitch.
BILATERAL CREDIT LINES WITH TERMS
UNTIL OCTOBER 30, 2018
see table “Bilateral credit lines with terms until October 30, 2018” Please refer to Notes 39 and 43 of the notes for details on Dräger
Group’s loan liabilities.
LIQUIDITY FORECAST
Liquidity came to EUR 172.8 million at the end of the year (December 31, 2014: EUR 296.9 million). For its medium
and long term planning, Dräger forecasts a positive develop-ment of cash and cash equivalents. This will be influenced by a planned increase in operating cash flow – reflecting expected business developments – and solid financing, which has already been arranged for the coming years as a prudent measure. Future payment obligations from note loans falling due, which will result in payments of EUR 57.5 million in 2016 and EUR 38.5 million in 2018, will have a negative impact on liquidity. The Dräger Group’s short- and medium-term liquidity is secured by existing cash in hand and bank balances as well as the existing credit lines, of which most have a term of more than one year.
TASKS AND STRUCTURE OF THE
TREASURY DEPARTMENT
The treasury department is responsible for treasury man-agement, secures the Group’s liquidity and credit facilities, and manages its interest and currency risks. The depart-ment acts as a service center with a focus on corporate risks. The organizational structures and processes and the Group’s internal treasury policy ensure transparency and security. Responsibilities for trading and completing finan-cial transactions are separated. For example, the treasury back office reviews and approves all financial transactions that were traded in the treasury front office. Controlling calculates Group-wide currency exposure as the basis for hedging transactions.
BILATERAL CREDIT LINES WITH TERMS UNTIL OCTOBER 30, 2018
Type of credit € million Intended use Lender
Cash 206.0 Secure working capital requirements
Commerzbank, Deutsche Bank, HSBC, Helaba, RBS, SEB, Svenska Handels-
banken, Sparkasse zu Lübeck, Deutsche Apotheker- und Ärztebank
Sureties 152.0 Within the context of conducting business activities
Commerzbank, Deutsche Bank, HSBC, RBS
Total 358.0

COMBINED MANAGEMENT REPORTBusiness performance
75
DERIVATIVE FINANCIAL INSTRUMENTS
We generally use financial instruments for hedging purpos-es only and not to optimize earnings, although the princi-ples of economic efficiency are also applied to such deci-sions. Transactions of this type are selected and concluded in a uniform manner throughout the Group.
Please refer to Note 46 of the notes for detailed information on the derivatives used by the Company.
NET ASSETS
In fiscal year 2015, equity rose by EUR 49.3 million to EUR 945.9 million. The equity ratio came to 40.9 percent as of December 31, 2015, slightly up on the figure as of Decem-ber 31, 2014 (40.1 percent). Ten options (500,000 preferred shares) were exercised in the second quarter of the year. This resulted in a total increase in equity of EUR 31.5 mil-lion (of which capital stock EUR 1.3 million). Equity also rose as a result of currency translation effects. Dividend payments for shares and participation certificates reduced equity.
see tables “Net assets of the Dräger Group” as well as “Financial figures”
NET ASSETS OF THE DRÄGER GROUP
2010 2011 2012 2013 2014 2015
Non-current assets € million 681.0 690.2 710.4 717.2 781.5 907.2
Current assets € million 1,295.9 1,425.0 1,389.8 1,347.8 1,452.6 1,400.9
thereof cash and cash equivalents € million 320.0 412.3 332.4 232.1 296.9 172.8
Equity € million 636.6 729.6 729.7 816.0 896.6 945.9
Debt € million 1,340.3 1,385.6 1,370.4 1,249.0 1,337.5 1,365.5
thereof liabilitiesto banks € million 407.5 449.8 387.2 332.8 296.2 307.8
Total assets € million 1,976.9 2,115.2 2,100.1 2,065.0 2,234.1 2,311.4
Long-term equity-to-fixed-assets ratio 1, 2 % 254.5 249.2 239.2 233.7 230.4 196.8
1 Long-term equity-to-fixed-assets ratio = total equity and long-term debt divided by intangible assets and property, plant and equipment2 Equipment leased out has been recognized in property, plant and equipment since 2012. The figures for 2011 were adjusted accordingly.
FINANCIAL FIGURES
in € millionDecember 31, 2015 December 31, 2014 Changes
in %
Total assets 2,311.4 2,234.1 +3.5
Equity 945.9 896.6 +5.5
Equity ratio 40.9% 40.1%
Capital employed 1,269.3 1,107.2 +14.6
Net financial debt 145.3 10.7 +1,262.6

DRÄGER ANNUAL REPORT 201576
In fiscal year 2015, total assets rose by EUR 77.3 million to EUR 2,311.4 million. On the assets side, intangible assets in-creased by EUR 57.5 million, largely due to the acquisition of GasSecure AS. Property, plant and equipment climbed by EUR 56.4 million, largely due to investments in the “factory of the future.” Trade receivables increased by EUR 53.9 million, while cash and cash equivalents fell by EUR 124.1 million.
On the liabilities side, interest-bearing loans and liabilities to banks increased by EUR 11.5 million, with note loans of EUR 86.5 million being repaid on schedule and substitut-ed by short-term bank loans. Current provisions climbed by EUR 43.7 million, whereas trade payables decreased by EUR 14.9 million.
DRÄGER VALUE ADDED
Our Dräger Value Added fell year on year to EUR –46.3 million (2014: EUR 81.6 million) as of December 31, 2015. Our EBIT was insufficient to cover the cost of capital. EBIT declined by over 60 percent, while cost of capital increased by EUR 15.9 million. The rise in capital employed was due to the increase in fixed assets caused by investments, increased inventories and higher trade receivables. This trend is also reflected in days working capital (coverage of current assets), which rose by 2.9 days to 121.2 days.
Business performance of the medical division
see table “Business performance of the medical division”
ORDER INTAKE
In fiscal year 2015, order intake in the medical division in-creased by 0.6 percent (net of currency effects). A positive demand trend in Europe, Germany and the Middle East, Africa and Other Countries region was offset by a decline in demand in the Asia/Pacific region. Order intake in the Americas region was stable.
Order intake rose in fiscal year 2015, especially for respira-tory care and thermoregulation products. Demand rose in certain European countries, the Africa, Middle East and Other Countries region and North America, but declined in Central and South American countries. Order intake in the patient monitoring and clinical data management business increased slightly. This was partly due to a rise in demand in the Asia/Pacific region, with demand in Europe falling. Orders in the service business rose slightly on the back of positive development in Europe, South America and the Asia/Pacific region, while a decline in service orders was recorded in the US. Order intake in the hospital consum-ables business fell slightly short of the prior-year figure net of currency effects. The strong orders situation in Europe was unable to compensate for weak business in the Afri-ca, Middle East and Other Countries region. We reported a moderate decline in order intake for anesthesiology de-vices. An increase in demand in the Africa, Middle East and Other Countries region was offset by weak development in certain European countries and the Americas region. In the strongly project-oriented workplace infrastructure business, we recorded a significant decline in orders. De-mand fell in some countries in the Europe and Asia/Pacific region.
In the Europe including Germany region, our order intake rose by 1.3 percent (net of currency effects). Germany, Ro-mania, Turkey and Italy recorded particularly high increas-es in demand, while demand declined in the Netherlands and Azerbaijan.
Order volume in Germany increased by 2.6 percent. Par-ticular growth was recorded in service business, the hos-pital consumables business and the respiratory care and thermoregulation business. On the other hand, demand fell in the patient monitoring and clinical data management business.
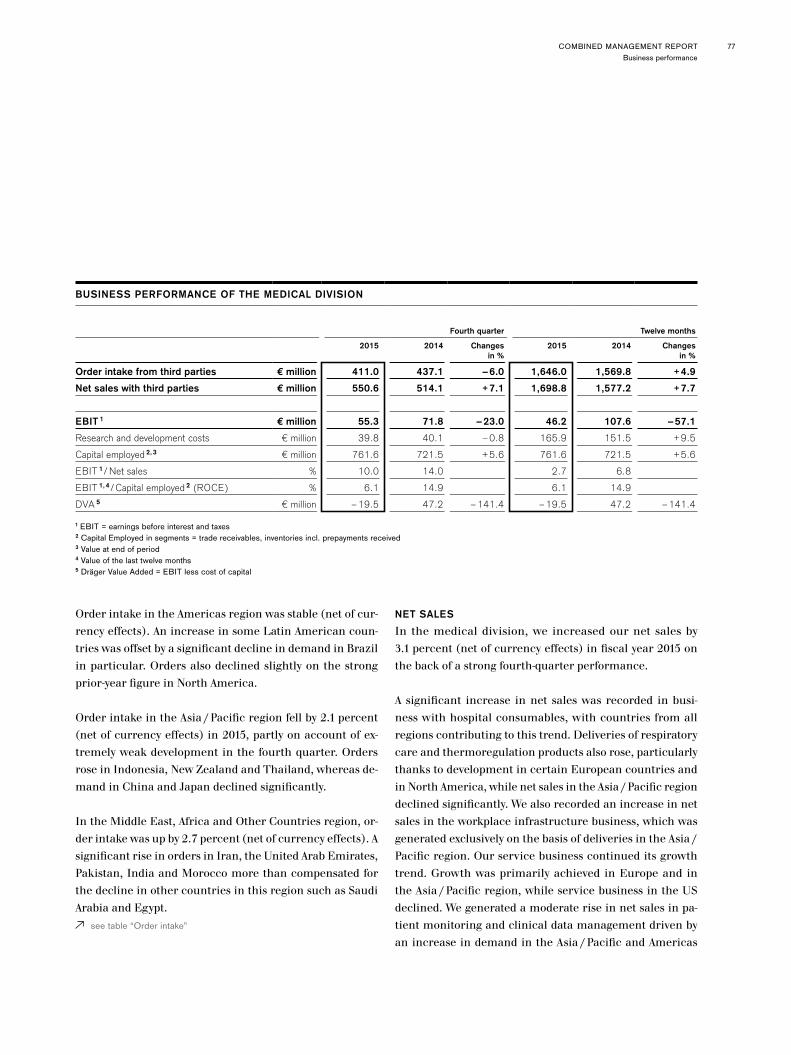
COMBINED MANAGEMENT REPORTBusiness performance
77
Order intake in the Americas region was stable (net of cur-rency effects). An increase in some Latin American coun-tries was offset by a significant decline in demand in Brazil in particular. Orders also declined slightly on the strong prior-year figure in North America.
Order intake in the Asia/Pacific region fell by 2.1 percent (net of currency effects) in 2015, partly on account of ex-tremely weak development in the fourth quarter. Orders rose in Indonesia, New Zealand and Thailand, whereas de-mand in China and Japan declined significantly.
In the Middle East, Africa and Other Countries region, or-der intake was up by 2.7 percent (net of currency effects). A significant rise in orders in Iran, the United Arab Emirates, Pakistan, India and Morocco more than compensated for the decline in other countries in this region such as Saudi Arabia and Egypt.
see table “Order intake”
NET SALES
In the medical division, we increased our net sales by 3.1 percent (net of currency effects) in fiscal year 2015 on the back of a strong fourth-quarter performance.
A significant increase in net sales was recorded in busi-ness with hospital consumables, with countries from all regions contributing to this trend. Deliveries of respiratory care and thermoregulation products also rose, particularly thanks to development in certain European countries and in North America, while net sales in the Asia/Pacific region declined significantly. We also recorded an increase in net sales in the workplace infrastructure business, which was generated exclusively on the basis of deliveries in the Asia/Pacific region. Our service business continued its growth trend. Growth was primarily achieved in Europe and in the Asia/Pacific region, while service business in the US declined. We generated a moderate rise in net sales in pa-tient monitoring and clinical data management driven by an increase in demand in the Asia/Pacific and Americas
BUSINESS PERFORMANCE OF THE MEDICAL DIVISION
Fourth quarter Twelve months
2015 2014 Changesin %
2015 2014 Changesin %
Order intake from third parties € million 411.0 437.1 –6.0 1,646.0 1,569.8 +4.9
Net sales with third parties € million 550.6 514.1 +7.1 1,698.8 1,577.2 +7.7
EBIT 1 € million 55.3 71.8 –23.0 46.2 107.6 –57.1
Research and development costs € million 39.8 40.1 –0.8 165.9 151.5 +9.5
Capital employed 2, 3 € million 761.6 721.5 +5.6 761.6 721.5 +5.6
EBIT 1/ Net sales % 10.0 14.0 2.7 6.8
EBIT 1, 4/Capital employed 2 (ROCE) % 6.1 14.9 6.1 14.9
DVA 5 € million –19.5 47.2 –141.4 –19.5 47.2 –141.4
1 EBIT = earnings before interest and taxes2 Capital Employed in segments = trade receivables, inventories incl. prepayments received3 Value at end of period 4 Value of the last twelve months5 Dräger Value Added = EBIT less cost of capital
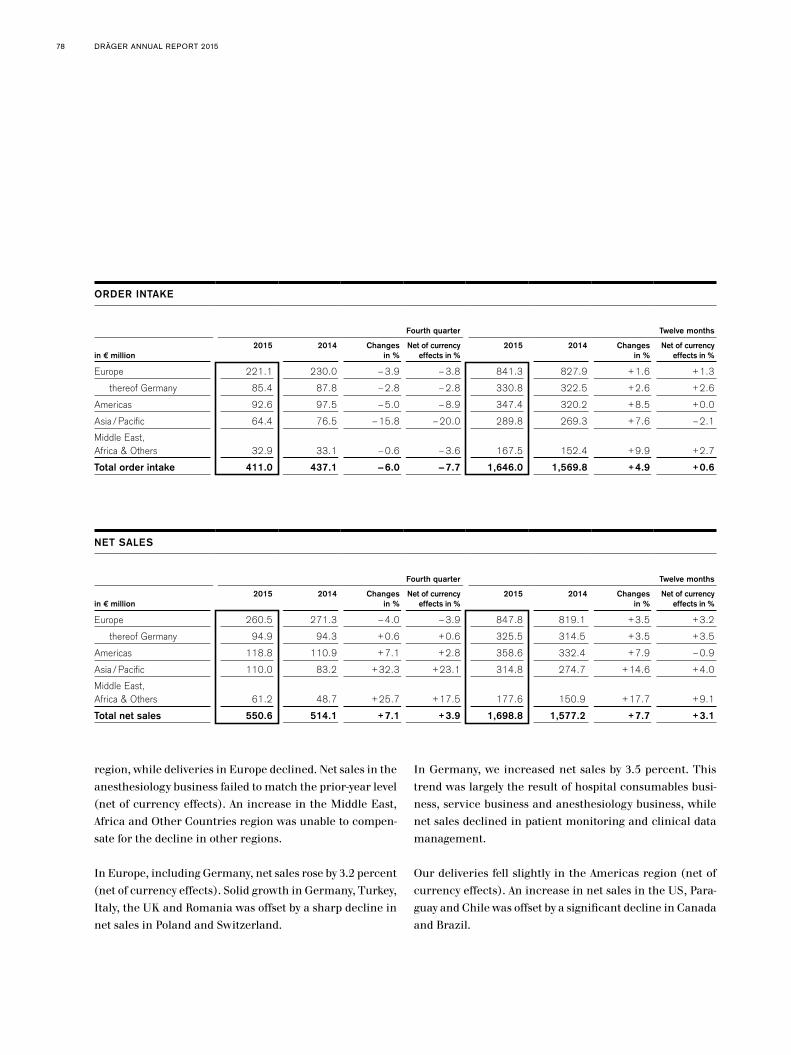
DRÄGER ANNUAL REPORT 201578
region, while deliveries in Europe declined. Net sales in the anesthesiology business failed to match the prior-year level (net of currency effects). An increase in the Middle East, Africa and Other Countries region was unable to compen-sate for the decline in other regions.
In Europe, including Germany, net sales rose by 3.2 percent (net of currency effects). Solid growth in Germany, Turkey, Italy, the UK and Romania was offset by a sharp decline in net sales in Poland and Switzerland.
In Germany, we increased net sales by 3.5 percent. This trend was largely the result of hospital consumables busi-ness, service business and anesthesiology business, while net sales declined in patient monitoring and clinical data management.
Our deliveries fell slightly in the Americas region (net of currency effects). An increase in net sales in the US, Para-guay and Chile was offset by a significant decline in Canada and Brazil.
ORDER INTAKE
Fourth quarter Twelve months
in € million2015 2014 Changes
in %Net of currency
effects in %2015 2014 Changes
in %Net of currency
effects in %
Europe 221.1 230.0 –3.9 –3.8 841.3 827.9 +1.6 +1.3
thereof Germany 85.4 87.8 –2.8 –2.8 330.8 322.5 +2.6 +2.6
Americas 92.6 97.5 –5.0 –8.9 347.4 320.2 +8.5 +0.0
Asia /Pacific 64.4 76.5 –15.8 –20.0 289.8 269.3 +7.6 –2.1
Middle East, Africa & Others 32.9 33.1 –0.6 –3.6 167.5 152.4 +9.9 +2.7
Total order intake 411.0 437.1 –6.0 –7.7 1,646.0 1,569.8 +4.9 +0.6
NET SALES
Fourth quarter Twelve months
in € million2015 2014 Changes
in %Net of currency
effects in %2015 2014 Changes
in %Net of currency
effects in %
Europe 260.5 271.3 –4.0 –3.9 847.8 819.1 +3.5 +3.2
thereof Germany 94.9 94.3 +0.6 +0.6 325.5 314.5 +3.5 +3.5
Americas 118.8 110.9 +7.1 +2.8 358.6 332.4 +7.9 –0.9
Asia /Pacific 110.0 83.2 +32.3 +23.1 314.8 274.7 +14.6 +4.0
Middle East, Africa & Others 61.2 48.7 +25.7 +17.5 177.6 150.9 +17.7 +9.1
Total net sales 550.6 514.1 +7.1 +3.9 1,698.8 1,577.2 +7.7 +3.1

COMBINED MANAGEMENT REPORTBusiness performance
79
The Asia/Pacific region recorded net sales growth of 4.0 percent, boosted by an extremely strong fourth quarter (net of currency effects). Deliveries in Indonesia, New Zealand and Thailand increased in particular, while net sales in China, Japan and South Korea declined considerably.
Net sales in the Middle East, Africa and Other Countries regions grew by 9.1 percent (net of currency effects). Higher deliveries in Iran, Saudi Arabia and the United Arab Emir-ates were able to compensate for the declines in Egypt and Iraq.
see table “Net sales”
EARNINGS
In fiscal year 2015, gross profit in the medical division was up on the prior-year figure despite a lower gross margin (–1.6 percentage points). Net sales growth more than compensated for the decline in margins. The decline in the gross margin was partly due to lower pricing in pro- ject business. Margins also came under pressure in certain countries such as China and Japan. In addition, a less-fa-vorable product mix, provisions for quality costs related to batteries in respiratory care devices and currency effects also negatively impacted the gross margin.
At 12.7 percent, functional costs (net of one-off restructur-ing effects and currency effects: 4.3 %) in the medical divi-sion rose disproportionately to net sales in 2015.
R & D expenses were 9.5 percent higher than the prior-year figure (+3.2 percent net of currency effects). In the US, these costs were particularly impacted by the weak euro against the US dollar. The R & D ratio increased marginally to 9.8 % (2014: 9.6 %).
EBIT fell by a total of 57.1 percent to EUR 46.2 million (2014: EUR 107.6 million). The EBIT margin of 2.7 percent was significantly down on the previous year’s figure (2014: 6.8 percent).
FINANCIAL POSITION AND NET ASSETS
As of December 31, 2015, capital employed increased by EUR 40.1 million to EUR 761.6 million (December 31, 2014: EUR 721.5 million). The primary reason for this was a rise in trade receivables.
DRÄGER VALUE ADDED
Our DVA in the medical division fell by EUR 66.7 million to EUR –19.5 million year-on-year in the twelve months to December 31, 2015 (12 months to December 31, 2014: EUR 47.2 million). This drop in DVA was primarily caused by the EUR 61.4 million fall in EBIT. Cost of capital for the higher average capital employed pushed DVA down by a further EUR 5.3 million.
Business performance of the safety division
see table “Business performance of the safety division”
ORDER INTAKE
In fiscal year 2015, order intake in the safety division rose by 1.3 percent (net of currency effects). Demand rose in Germany and the Europe and Asia/Pacific regions, while declines were recorded in the Africa, Middle East and Other Countries and Americas regions.
There was a significant increase in demand in business with government agencies in 2015. Demand for alcohol testing devices was particularly high in Europe, the Asia/Pacific region and the Americas region. Order intake for personal protection products for fire services rose in all regions except for the Americas region; in North America, the lack of a distribution permission for the self-contained breathing apparatus (SCBA) had a negative impact on busi-ness. We recorded a moderate rise in order intake for plant safety equipment. This was primarily due to demand in maintenance and equipment rental business, but orders for stationary gas detection systems also climbed slightly.
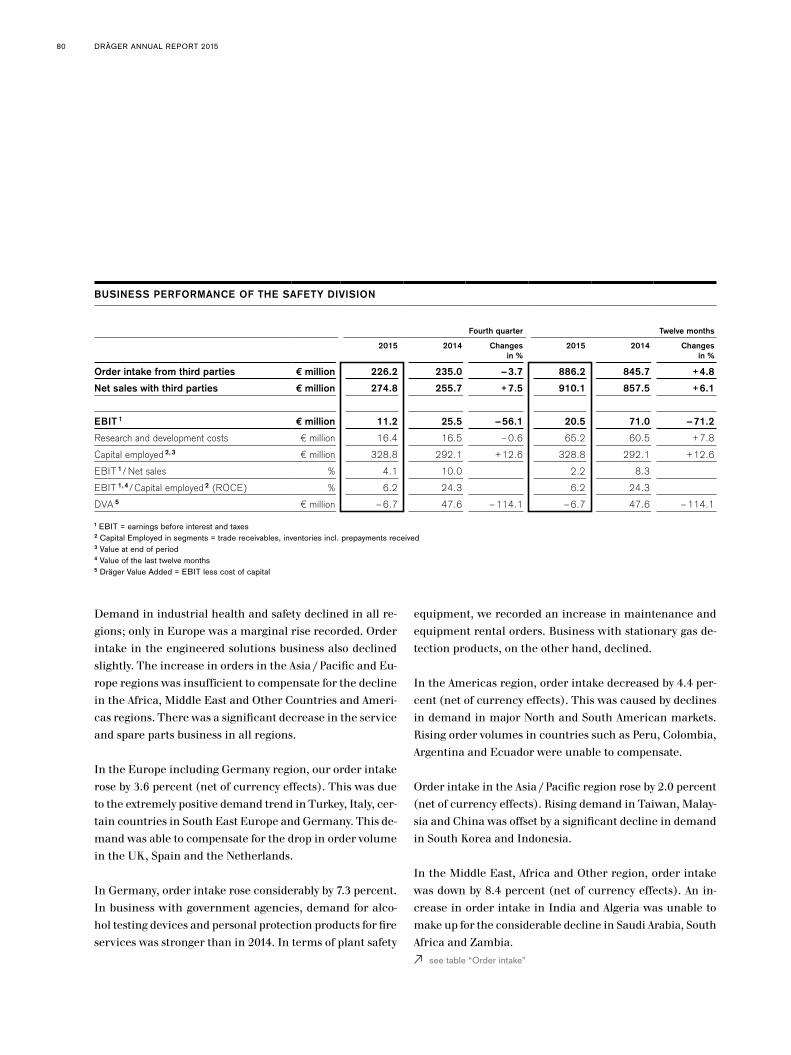
DRÄGER ANNUAL REPORT 201580
equipment, we recorded an increase in maintenance and equipment rental orders. Business with stationary gas de-tection products, on the other hand, declined.
In the Americas region, order intake decreased by 4.4 per-cent (net of currency effects). This was caused by declines in demand in major North and South American markets. Rising order volumes in countries such as Peru, Colombia, Argentina and Ecuador were unable to compensate.
Order intake in the Asia/Pacific region rose by 2.0 percent (net of currency effects). Rising demand in Taiwan, Malay-sia and China was offset by a significant decline in demand in South Korea and Indonesia.
In the Middle East, Africa and Other region, order intake was down by 8.4 percent (net of currency effects). An in-crease in order intake in India and Algeria was unable to make up for the considerable decline in Saudi Arabia, South Africa and Zambia.
see table “Order intake”
Demand in industrial health and safety declined in all re-gions; only in Europe was a marginal rise recorded. Order intake in the engineered solutions business also declined slightly. The increase in orders in the Asia/Pacific and Eu-rope regions was insufficient to compensate for the decline in the Africa, Middle East and Other Countries and Ameri-cas regions. There was a significant decrease in the service and spare parts business in all regions.
In the Europe including Germany region, our order intake rose by 3.6 percent (net of currency effects). This was due to the extremely positive demand trend in Turkey, Italy, cer-tain countries in South East Europe and Germany. This de-mand was able to compensate for the drop in order volume in the UK, Spain and the Netherlands.
In Germany, order intake rose considerably by 7.3 percent. In business with government agencies, demand for alco-hol testing devices and personal protection products for fire services was stronger than in 2014. In terms of plant safety
BUSINESS PERFORMANCE OF THE SAFETY DIVISION
Fourth quarter Twelve months
2015 2014 Changesin %
2015 2014 Changesin %
Order intake from third parties € million 226.2 235.0 –3.7 886.2 845.7 +4.8
Net sales with third parties € million 274.8 255.7 +7.5 910.1 857.5 +6.1
EBIT 1 € million 11.2 25.5 –56.1 20.5 71.0 –71.2
Research and development costs € million 16.4 16.5 –0.6 65.2 60.5 +7.8
Capital employed 2, 3 € million 328.8 292.1 +12.6 328.8 292.1 +12.6
EBIT 1/ Net sales % 4.1 10.0 2.2 8.3
EBIT 1, 4/Capital employed 2 (ROCE) % 6.2 24.3 6.2 24.3
DVA 5 € million –6.7 47.6 –114.1 –6.7 47.6 –114.1
1 EBIT = earnings before interest and taxes2 Capital Employed in segments = trade receivables, inventories incl. prepayments received3 Value at end of period 4 Value of the last twelve months5 Dräger Value Added = EBIT less cost of capital

COMBINED MANAGEMENT REPORTBusiness performance
81
NET SALES
In fiscal year 2015, net sales in the safety division increased by 2.7 percent (net of currency effects). Net sales increased in Germany and the Middle East, Africa and Other Coun-tries region, but fell in the Asia/Pacific and Americas re-gions.
In the engineered solutions business, net sales in Germa-ny increased significantly as a result of partial invoicing for tunnel rescue train orders for Deutsche Bahn and for fire training systems. Net sales with government agencies
also increased significantly. This applies particularly to al-cohol testing devices and personal protection equipment for fire services. Net sales of plant safety equipment rose slightly. There was a substantial increase in maintenance and equipment rental business in all regions, while station-ary gas detection business was stable. There was a slight decline in industrial occupational health and safety busi-ness, with deliveries down in all regions, particularly in the Americas region. There was a moderate decrease in the service business in all regions.
ORDER INTAKE
Fourth quarter Twelve months
in € million2015 2014 Changes
in %Net of currency
effects in %2015 2014 Changes
in %Net of currency
effects in %
Europe 147.4 148.9 –1.0 –1.0 549.8 527.7 +4.2 +3.6
thereof Germany 50.3 44.1 +14.3 +14.3 172.7 160.9 +7.3 +7.3
Americas 36.6 38.6 –5.2 –10.6 149.5 140.9 +6.1 –4.4
Asia /Pacific 33.0 31.8 +3.6 –1.1 135.8 123.4 +10.0 +2.0
Middle East, Africa & Others 9.2 15.7 –41.4 –41.3 51.2 53.7 –4.6 –8.4
Total order intake 226.2 235.0 –3.8 –5.3 886.2 845.7 +4.8 +1.3
NET SALES
Fourth quarter Twelve months
in € million2015 2014 Changes
in %Net of currency
effects in %2015 2014 Changes
in %Net of currency
effects in %
Europe 174.8 164.5 +6.3 +6.0 573.1 541.3 +5.9 +5.3
thereof Germany 66.4 53.8 +23.5 +23.5 190.8 172.0 +10.9 +10.9
Americas 41.8 38.3 +9.1 +3.1 150.6 138.3 +8.9 –1.6
Asia /Pacific 43.7 37.5 +16.6 +9.7 133.9 127.7 +4.9 –2.7
Middle East, Africa & Others 14.5 15.4 –6.2 –6.5 52.5 50.2 +4.5 +0.6
Total net sales 274.8 255.7 +7.5 +5.3 910.1 857.5 +6.1 +2.7

DRÄGER ANNUAL REPORT 201582
In Europe, including Germany, net sales rose by 5.3 per-cent (net of currency effects). Deliveries increased in some countries in South Eastern Europe, Turkey, Russia, Germa-ny, France and Scandinavia, while net sales were down in Switzerland, the UK, the Netherlands and Spain.
We increased net sales in Germany significantly by 10.9 percent. This trend was driven by the partial invoicing of tunnel rescue trains for Deutsche Bahn in the area of en-gineered solutions, together with increases in sales to gov-ernment agencies. Only in service and spare parts business did net sales decline.
The Americas region saw a slight decrease in net sales (net of currency effects). Deliveries increased in some Central and South America countries, but net sales fell in Mexico, Brazil and the US – significantly in some parts.
Net sales in the Asia/Pacific region declined by 2.7 percent (net of currency effects). In South Korea, Thailand and Ja-pan, deliveries fell significantly year on year. Marginally pos-itive net sales development was recorded in China, whereas net sales in Australia and New Zealand were stable.
Net sales in the Middle East, Africa and Other Countries region increased by 0.6 percent (net of currency effects). This was primarily due to a rise in deliveries in Qatar, India and Saudi Arabia. Net sales declined in Iraq, the United Arab Emirates and Zambia.
see table “Net sales”
EARNINGS
Gross profit in the safety division was 1.2 percent up on the prior year in fiscal year 2015, while the gross margin fell by 2.2 percentage points. The drop in margin was pre-dominantly due to a less-favorable product mix as well as extraordinary effects in project business. Margins in the en-gineered solutions business were impacted by higher costs while an unfavorable product mix and lower pricing pushed
down gross margins in business with government agencies. In addition, expenses were incurred through investments in the quality of these products. However, the increase in net sales volume was able to compensate for the negative margin development.
Functional costs were 14.9 percent up on the prior year (net of one-off expenses for restructuring and currency effects: +7.6 percent). Research and development expenses rose by 7.8 percent (net of currency effects: +5.0 percent) and resulted in a R & D ratio of 7.2 percent (2014: 7.1 percent).
In view of these developments, EBIT in the safety divisions decreased to EUR 20.5 million in total (2014: EUR 71.0 mil-lion). The EBIT margin declined from 8.3 percent in the prior year to 2.2 percent in 2015.
FINANCIAL POSITION AND NET ASSETS
As of December 31, 2015, capital employed increased by EUR 36.7 million to EUR 328.8 million (December 31, 2014: EUR 292.1 million). The main reason for this was a rise in trade receivables and inventories.
DRÄGER VALUE ADDED
At EUR –6.7 million, DVA in the safety division was signifi-cantly down year on year in the twelve months to December 31, 2015 (12 months to December 31, 2014: EUR 47.6 mil-lion). This was largely caused by the EUR 50.5 million fall in EBIT. Cost of capital rose slightly to EUR 3.8 million.
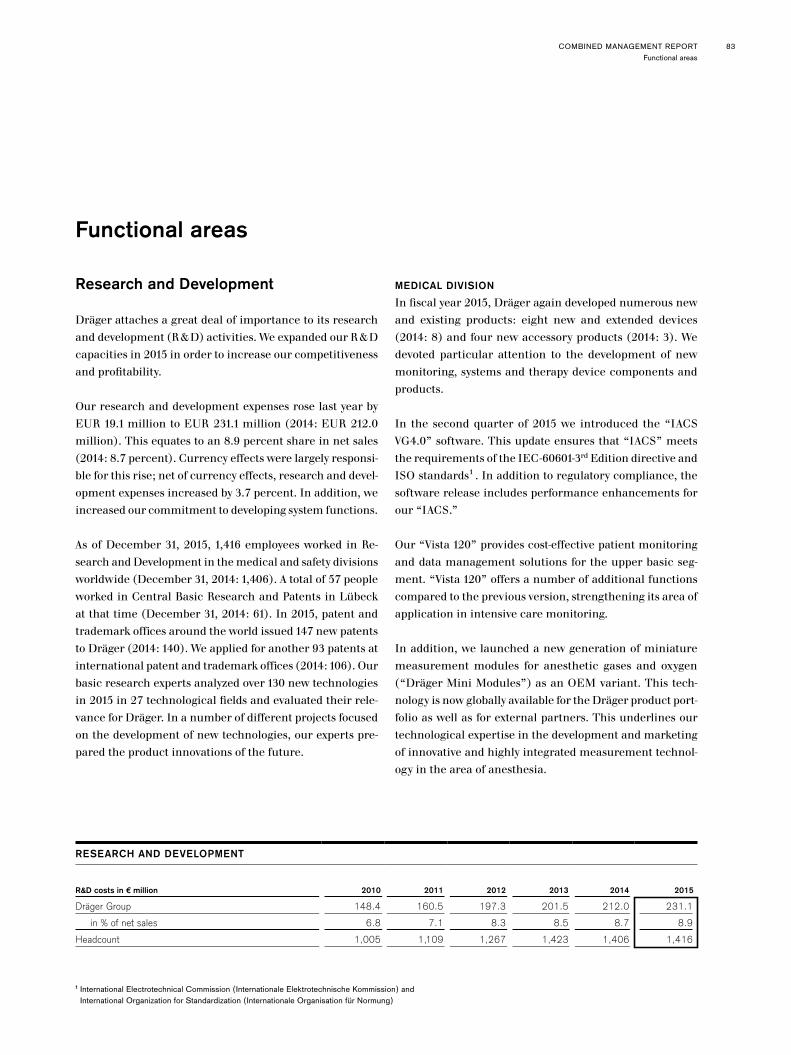
COMBINED MANAGEMENT REPORTFunctional areas
83
Functional areas
Research and Development
Dräger attaches a great deal of importance to its research and development (R & D) activities. We expanded our R & D capacities in 2015 in order to increase our competitiveness and profitability.
Our research and development expenses rose last year by EUR 19.1 million to EUR 231.1 million (2014: EUR 212.0 million). This equates to an 8.9 percent share in net sales (2014: 8.7 percent). Currency effects were largely responsi-ble for this rise; net of currency effects, research and devel-opment expenses increased by 3.7 percent. In addition, we increased our commitment to developing system functions.
As of December 31, 2015, 1,416 employees worked in Re-search and Development in the medical and safety divisions worldwide (December 31, 2014: 1,406). A total of 57 people worked in Central Basic Research and Patents in Lübeck at that time (December 31, 2014: 61). In 2015, patent and trademark offices around the world issued 147 new patents to Dräger (2014: 140). We applied for another 93 patents at international patent and trademark offices (2014: 106). Our basic research experts analyzed over 130 new technologies in 2015 in 27 technological fields and evaluated their rele-vance for Dräger. In a number of different projects focused on the development of new technologies, our experts pre-pared the product innovations of the future.
MEDICAL DIVISION
In fiscal year 2015, Dräger again developed numerous new and existing products: eight new and extended devices (2014: 8) and four new accessory products (2014: 3). We devoted particular attention to the development of new monitoring, systems and therapy device components and products.
In the second quarter of 2015 we introduced the “IACS VG4.0” software. This update ensures that “IACS” meets the requirements of the IEC-60601-3rd Edition directive and ISO standards1 . In addition to regulatory compliance, the software release includes performance enhancements for our “IACS.”
Our “Vista 120” provides cost-effective patient monitoring and data management solutions for the upper basic seg-ment. “Vista 120” offers a number of additional functions compared to the previous version, strengthening its area of application in intensive care monitoring.
In addition, we launched a new generation of miniature measurement modules for anesthetic gases and oxygen (“Dräger Mini Modules”) as an OEM variant. This tech-nology is now globally available for the Dräger product port-folio as well as for external partners. This underlines our technological expertise in the development and marketing of innovative and highly integrated measurement technol-ogy in the area of anesthesia.
1 International Electrotechnical Commission (Internationale Elektrotechnische Kommission) and International Organization for Standardization (Internationale Organisation für Normung)
RESEARCH AND DEVELOPMENT
R&D costs in € million 2010 2011 2012 2013 2014 2015
Dräger Group 148.4 160.5 197.3 201.5 212.0 231.1
in % of net sales 6.8 7.1 8.3 8.5 8.7 8.9
Headcount 1,005 1,109 1,267 1,423 1,406 1,416
DRÄGER ANNUAL REPORT 201584
The “Innovian Solution Suite VF8” is a data management system for capturing, displaying and recording anesthesio-logical and intensive care treatment information in elec-tronic form for documentation purposes as well as for in-ternal and cross-department communication and therapy planning and to provide support in clinical decisions. In this version, the “Innovian Solution Suite VF8” integrates the “SmartSonar Sepsis” launched in 2014 for automated sepsis screening and supports hospital employees in infec-tion management at arterial and venous access points. In addition, the software also contains general enhancements and additional functions requested by customers around the world in product surveys.
At MEDICA, the world’s largest medical technology trade fair, we unveiled the “Polaris 600” as the latest model in our range of operating room lights in 2015. The streamlined design follows on from the “Polaris 100/200,” but offers a range of additional functions such as adjustable color tem-perature, different light field diameters and a high-resolu-tion integrated camera. The HD video signal is transferred wirelessly, which provides the ideal framework for simple installation and also enables retrofitting without too many difficulties.
With “Tcore” we launched an innovation in 2015 that al-lows the non-invasive monitoring of core body temperature. “Tcore” makes use of a unique dual heat flow sensor, which continuously measures core body temperature after a short warm-up phase so precisely that “Tcore” is even capable of replacing previously recommended invasive measurement methods. Precise and continuous core temperature moni-toring is extremely important, particular during operations, as there is a danger that a patient’s body temperature may fall below 36°C during the surgical procedure. This can lead to a variety of complications, which are proven to delay the recovery process, extent patient bed time and therefore increase the cost of treatment.
SAFETY DIVISION
Many product launches shaped 2015 in R & D in the safety di-vision, too. In total, we launched 13 new products (2014: 13).
We further optimized the range of “Dräger Tubes,” a prod-uct used to measure gases. We have expanded the lower end of the benzene measurement range with the introduc-tion of the new “Dräger Tube for Benzene 0.25/a.” This ensures that the measurement of threshold values meets legislative requirements, particularly those in the chemical and petrochemical industries. The measurement time is significantly shorter, while the color display on the tube has also been improved. At the same time, the development of a single tube has made using the product much simpler for customers than with a double tube.
At the end of 2013, the National Fire Protection Association (NFPA) introduced a thermal imaging camera standard for the US market (NFPA 1801), for which our “UCF 9000” received immediate approval. In 2015, we also received ap-proval for our “UCF 6000,” “UCF 7000” and “UCF 8000” small-format thermal imaging cameras. This means that we have a refined portfolio of thermal imaging cameras for the fire service market.
The new “Dräger DrugCheck 3000” allows five narcotic substances to be tested using a single saliva sample with-in a short space of time. The compact test is easy to use, extremely hygienic and manipulation-proof. It can also be deployed very quickly and is therefore perfect for roadside drug testing and drug testing in safety-relevant workplaces.
Our “Parat 3000” filter detector tubes have been developed to include a model specially designed for use in tropical climates. The devices and filters are supplied in vacu-um-sealed aluminum protective packaging. By replacing the protective packaging after a period of six years, the de-tector tubes can be used for a total of twelve years.

COMBINED MANAGEMENT REPORTFunctional areas
85
We have also added a new model to our range of fire escape hoods: The “Dräger PARAT 5550” is a fire escape hood in a flame-retardant holster. It was specifically developed for fire rescue teams for use in victim rescue. The main ad-vantage: The combination of fire escape hood and holster is an approved accessory for all Dräger breathing apparatus according to EN 137:2006, Type 2.
We have adapted the SGR process cuvette, an accessory for our “PIR 7x00” gas detector, to meet customer require-ments. The SGR process cuvette helps to record gases emit-ted in special process applications, such as those in the printing and coating industry. The SGR process cuvette can be fitted into the optical beam path of the “PIR 7x00” for the monitoring of industrial processes, has improved sta-bility under negative pressure and is significantly easier to clean. In addition, we have made significant improvements to the CO2 variant “PIR 7200” in terms of its durability in corrosive atmospheres, meaning that the “PIR 7200” can now also be deployed in extremely aggressive environments such as in potash mining.
The new “Dräger PSS 4000” is a professional respiratory protective device for firefighters that meets the highest standards. The set is light weight and comfortable to wear. The target market is professional firefighting in emerging markets and volunteer services.
The “Dräger X-dock Series” provides support in maintain-ing, testing and managing mobile gas detection instru-ments, which are used in a wide variety of industries. With the “X-dock Software Update,” we have opened up brand-new opportunities for our customers to simplify their pro-cesses and, at the same time, improve the way they docu-ment and control them. For example, device parameters can be corrected immediately during the daily gas detection instrument tests.
The “Dräger REGARD 3910 C” is part of a control system for the detection of toxic and explosive substances. It can monitor signals from up to 16 gas detection instruments and provides warnings when alarm or fault conditions oc-cur. The “Dräger REGARD 3910 C” has now also been ap-proved by the China Certification Center for Fire Products (CCCF).
Purchasing, Production and Logistics
In September 2015, we pooled together Purchasing, Produc-tion and Logistics into a single function within the Exec-utive Board. By doing so, we can ensure the even closer integration of customer areas and a further increase in efficiency in our value chain.
PURCHASING
At Dräger, Strategic Purchasing is responsible for obtaining all of the materials and services required at the Company: from plastic and machining and complex mechatronic sys-tems such as cockpits to IT services or fleet management. In fiscal year 2015, our purchasing volume came to EUR 1,178 million (2014: EUR 1,055 million), roughly half of which can be attributed to production materials.
In the prior year, Purchasing developed further strategies for goods groups such as cast parts and batteries together with Production, Logistics, R & D and Quality Management. In these strategies, we define our preferred suppliers; in the case of projects concerning the development of new products, this means that decisions in favor of particular suppliers can be made quickly and efficiently and market entry accelerated.
SUPPLIER QUALITY AND RELIABILITY
We implemented a number of improvements in the prior year in terms of supplier quality, with the rate of supplier- caused defects to end products delivered to customers cut
DRÄGER ANNUAL REPORT 201586
by around 12 percent year on year. Our day-to-day work with our suppliers is paying off – as is our SQIP (supplier quality improvement program), which we launched four years ago.
Close cooperation with our suppliers enabled us to opti-mize the supply chain for further components and modules using logistical models. This boosted loyalty among suppli-ers and availability in the consignment warehouse.
COMPETITIVENESS
Outstanding quality is a primary feature of our products, especially when compared with the competition. The stan-dards we set for our suppliers are just as high. However, when purchasing production materials, services and sys-tems, we expect competitive prices and terms and condi-tions. We regularly apply value management methods to our purchasing activities both in relation to series produc-tion and in terms of developing new products. Value and target price analyses help us to identify areas in which we can improve our suppliers’ technologies and manufactur-ing processes as well as cut costs.
The introduction of the catalog module from the e-purchas-ing platform SAP Ariba in October 2015 represented a major improvement in purchasing indirect materials. From ser-vices to non-production materials and capital goods – we can now order all of these products electronically and with SAP integration. The main benefits of the new platform are reduced costs and increased transparency on cross-func-tional expenditure, as well as time and cost savings through automated ordering processes.
PRODUCTION AND LOGISTICS
In 2015, the focus of our efforts in Production and Logistics was on increasing the efficiency of our processes.
The shift of the production of masks and chemical protec-tion suits from the Lübeck site to Klášterec in the Czech Republic is proceeding according to schedule. All mask
production lines have been in operation since mid-2015. We have also begun relocating chemical protection suit pro-duction, which will be completed by early 2016.
In the US, we have started transferring production lines from Pittsburgh to the Lübeck, Blyth and Telford sites. Some production lines, such as the gas detection instru-ment line, have already been commissioned in Lübeck and Telford. The relocation will be completed in the first half of 2016.
We continued with the renovation of existing production buildings at the Lübeck production site and commenced the construction of the new factory of the future for con-figurable medical technology devices. This project is set to be completed in the first half of 2016. These measures will allow us to combine processes across the entire value chain even further and bring production and logistics even closer together.
Last but not least, we pressed ahead with our efforts to in-crease efficiency at all production and logistics sites, simpli-fied order processing structures and further standardized processes and IT systems.
Quality
People entrust our products with their most valuable pos-session: their lives. As a result, they have to be able to trust in our products and their quality at all times. We meet the highest quality requirements in all process steps – from development and production to delivery, sales and service.
CONTINUOUS IMPROVEMENT IN QUALITY
Ambitious quality targets apply to our products and product groups, but in our opinion quality is not a static parameter. In fact, constantly improving the quality of our products from year to year is part of our fabric as a business. A result
COMBINED MANAGEMENT REPORTFunctional areas
87
of years of work, standard, reliable, Company-wide process-es and control cycles ensure that quality improvement mea-sures are initiated and implemented systematically and without any delays. We place great value on constructive cooperation among all Company functions, such as R & D, Purchasing, Production and all those involved in the quality organization. All of these measures are geared towards the requirements of our customers. By remaining in close con-tact with the people who operate and use our products, we are able to make adjustments to positively influence prod-uct quality for the benefit of our customers at early stages of development. In addition, we push for components and sub-systems to be tested earlier than they normally would be. This is supported by the organizational consolidation of competencies required for licensing activities. As a result, we reduce risks and costs, while increasing product reliabil-ity, by identifying and eliminating defects and potential for defects at an earlier stage.
In 2015, we once again succeeded in boosting the quality of the Company in spite of significant expenses for some individual measures and achieving further improvements both in terms of products and in terms of important quality figures.
DEVELOPMENT OF THE QUALITY MANAGEMENT SYSTEM
In 2015, we continued consolidating processes from the previously separate medical and safety divisions. For the certification of our quality management system, we pooled together our production, sales and service sites into two certification groups for reasons of efficiency. The introduc-tion of these groups means that key external certifications are only required once for each group, significantly reduc-ing the costs of certification. By the end of the fiscal year, 85 companies worldwide had an ISO 9001-certified quali-ty management system. All production, sales and service sites for medical technology products also have ISO 13485 certification, an international standard focusing specifical-ly on the design and manufacturing of these products. In
addition, the majority of our production and a large pro-portion of our sales and service sites have both ISO 14001 certification, an international standard for environmental management systems, and OHSAS 18001 certification, an international standard for occupational health and safety. Our management systems have been and continue to be reviewed and their efficiency validated by means of internal and external audits.
You will find more information on our certifications on our company website at www.draeger.com/certificates.
Marketing, Sales and Service
MARKETING FOCUS: WORLDWIDE COOPERATION
One of the key focal points of our marketing activities is recognizing customer requirements and trends, assessing and implementing them into services in collaboration with the respective departments and, ultimately, marketing the products. Our aim is to increase the benefit for custom-ers worldwide over the long-term, to positively influence the customer’s purchasing behavior and, in doing so, put Dräger at a competitive advantage. These tasks had previ-ously been housed separately in each division. As part of the “Marketing Next Level” program, we spent the past fiscal year allocating these to roles coordinated worldwide.
At Dräger, international marketing specialists teams draw up solutions for their respective areas, such as digital mar-keting. This gives us the opportunity to make decisions and act on these decisions as internationally as necessary but also as locally as possible. The variety of opinions aids prob-lem solving and promotes the degree of creativity required for innovation. These intercultural teams have a wide va-riety of experience and add knowledge on local markets to the discussions. These measures enable us to strengthen the international network of our employees and therefore customer intimacy.
DRÄGER ANNUAL REPORT 201588
CUSTOMER OPINIONS – CUSTOMER SATISFACTION
The long-term success of our Company is strongly depen-dent on the satisfaction of our customers. This is why we have introduced the Net Promoter Score (NPS) system. NPS is a way in which we can continuously measure the strength of our customer relationships and customer loyal-ty. Last year, we surveyed over 6,000 customers worldwide and asked for their opinion on Dräger and our products. Aside from closed questions with predefined responses, cus-tomers also had the opportunity to tell us what they think in the form of open questions.
The results from our customer surveys flow directly into operative customer relations management. On the basis of these surveys, we have already been able to improve local processes, such as the order process, for the benefit of our customers. Customers who expressed their dissatisfaction over the order process were linked via interface to the local Dräger EDI platform within a short space of time. They can now send their orders to Dräger through their own ERP system and review order statuses at any time.
OIL & GAS: EVEN GREATER CUSTOMER INTIMACY
We are always pursuing the best possible combination of customer intimacy and customer benefit, which is why we decided last year to move global management for our “Oil & Gas” customer segment to Houston, Texas (USA). The Texan city is known as the energy capital of the world and all major energy multinationals and their suppliers have a presence there.
SALES AND SERVICES – BETTER NETWORK WORLDWIDE
As globalization takes hold, many customers and partners would like to work with Dräger towards a common goal across national and in some cases also regional borders. In 2015, we worked on a number of areas in Sales and Ser-vices, which promise a great deal when it comes to profit-able growth.
In Global Key Account Management, we have enhanced the way in which national sales and service organizations are networked. This enables us to provide a better service to selected global customers from key industrial sectors and, in doing so, establish Dräger as a competent partner world-wide.
We will continue to develop our customer relationships in growth markets in the current fiscal year. In terms of Glob-al Key Accounts, the current trend is moving towards stan-dardized product portfolios. The aim is to boost efficiency by pooling purchasing volumes, reducing the number of in-dividual suppliers and minimizing training requirements. We are actively supporting this trend and expect to draw positive net sales effects from it.
Our OEM (original equipment manufacturer) business, in which we license Dräger patents and products to selected manufacturers, also performed well in 2015. We successful-ly acquired a number of new customers in the medical and safety divisions through our innovations and enhancement of the OEM portfolio. Prospects for success and growth in OEM business are therefore positive moving into 2016.
In Sales and Service, Dräger works closely together with a number of different partners worldwide. In 2015, we refined the process of selecting and assessing these partners by car-rying out pilot tests in a handful of countries; this process is now being rolled out globally. In the current fiscal year, we will look into how we can cooperate more intensively with existing partners, who already work for and with Dräger in various countries, as well as how we can integrate new part-ners into our sales and service network. In addition, we are also planning to provide our partners with more focused and comprehensive information through country-specific portals as well as enhanced training programs for partners’ employees. In the medium-term, we expect to generate net sales growth and improve margins in key markets.

COMBINED MANAGEMENT REPORTSustainability
89
The Dräger Services customer area has continued on its positive development course. We successfully concluded a program focused on improving and developing our already extensive range of services and improving service effi-�ciency. In addition, we put the organizational framework in place to implement the comprehensive international expansion of a business that is pivotal to Dräger’s future. Important growth drivers include more sophisticated ser-vices, such as multi-vendor service projects which involve supplying entire hospitals, or rental & safety services, in which Dräger provides extensive support in the controlled shutdown of major industrial facilities, such as those in the chemical industry.
CUSTOMER RELATIONSHIP MANAGEMENT
Last year we introduced our customer relationship manage-ment (CRM) system in further sales companies, increas-ing the system’s global coverage even further. At the same time, we enhanced the CRM’s functions. For example, we mapped sales partner management processes in the sys-tem, as well as processes for the performance of mainte-nance and repairs. The aim is to integrate the major cus-tomer touchpoints in terms of customer contact, customer acquisition and customer service in the CRM system and, by doing so, seize all of the benefits offered by comprehen-sive customer management.
Sustainability
Employees
Dräger takes responsibility: not simply for people who rely on our technology for life day after day, but also for those who develop this technology. As a family-run company, this is a matter very close to our hearts. After all, the success of our Company is based on the commitment and com-petency of our employees. That is why our employees are the focal point of our human resources (HR) goal, which applies worldwide: “attracting the right candidates for the right roles – keeping our people motivated, committed and healthy for Dräger over the long term.”
SUPPORT AND DEVELOPMENT
Dräger operates on a worldwide scale. Customer orien-tation, an entrepreneurial approach, flexibility and an international focus are the principles for our employees’ day-to-day work. That is why we teach and reinforce these fundamental principles in individual and group-based training courses. We identify potential and goals for de-velopment with each individual employee – particularly during annual employee meetings – and reach binding agreements on them.
In 2015, our personnel development costs were on a par with the prior year at EUR 16.7 million (2014: EUR 16.6 million). Costs for further training amounted to EUR 7.9 million (2014: EUR 8.6 million).
We constantly review the development of our Company and our workflows in order to cement our competitiveness. When implementing changes, we deploy Change Managers who have undergone in-house training. The advantage of such Change Managers is that they understand Dräger’s business and can apply their methodological and social competencies to change processes.
DRÄGER ANNUAL REPORT 201590
TRAINING AND TALENT-SPOTTING
In order to guarantee a long-term stream of highly talented employees, we take responsibility for training young people ourselves. We offer young people a wide range of career opportunities in the form of twelve vocational training sub-jects, seven dual study courses and our own international graduate trainee program “life.” In 2015, we recruited 90 trainees and dual students in Germany.
At the end of September 2015, the Minister of School and Pro-fessional Education for the Federal State of Schleswig-Hol-stein, Britta Ernst, and Stefan Dräger officially opened an “info truck,” the new mobile careers hub of the two major employers associations in the northern German metal in-dustry, Nordmetall and AGV Nord, on the Dräger site. The impressive info truck helps students understand their ca-reer opportunities using the latest multimedia technolo-gy and experimentation stations. It travels from school to school and attends events all over northern Germany.
We secure access to high-potential young people in relevant employment markets by positioning ourselves as an inter-esting employer and systematically developing Dräger as an employer brand. We appeal to applicants who fit in with our value-oriented corporate culture: people who are interested in work that makes a difference.
HEALTH AND SAFETY
The working conditions at our Company and the health of all employees worldwide are matters very close to our hearts. Our comprehensive medical care, measures for preventing accidents and illness, and systematic occupa-tional health management far exceed minimum statutory obligations. All of these things have a positive impact on job satisfaction, employee motivation, absences and the accident rate.
In 2015, the ratio of reportable accidents per one million working hours at Dräger in Germany was at 3.9 lower than
in the prior year (2014: 4.38) and remained at a low level in comparison with the rest of the industry (Employer’s Li-ability Insurance Association for the Energy, Textile, Elec-tronic and Media Industries 2014: 11.8; 2013: 12.2; 2012: 13.0). Our long-term aim is to reduce the accident rate by 20 percent within the next five years.
An ever-increasing number of employees are making use of the health center, which was opened at the Dräger headquarters in Lübeck in 2013. In addition to housing various public doctors’ offices and the Company medical services, the health center also features a gym. Financially supported by the Company, the health center gives employ-ees the chance to keep fit and healthy in close proximity to their workplace. In 2015, 3,021 employees took part in one of Dräger’s prevention or health promotion programs. Health-related absences again remained low in Germany in 2015 on 5.4 percent of work days (2014: 5.2 percent).
EMPLOYEES IN NUMBERS
As of December 31, 2015, 13,936 people worked for the Dräger Group worldwide, 199 more than in the prior year (December 31, 2014: 13,737); this equates to a 1.4 percent rise in headcount. In Germany, the number of people work-ing for the Dräger Group rose by 149, while the number of people working abroad rose by 50. As of December 31, 2015, 53.6 percent (December 31, 2014: 54.0 percent) of employ-ees worked outside of Germany.
We expanded the workforce worldwide in light of our long-term growth strategy, above all in Sales (+114) and in Ser-vice (+70).
In Germany, we employed a total of 149 more employees as of December 31, 2015 than the year before, with 52 new em-ployees recruited in Sales. Due to the recruitment of tem-porary employees in short-term project business relating to industrial inspections, the number of employees in Rental & Safety Services increased by 22. Moreover, we recruited 34 new employees in R & D.

COMBINED MANAGEMENT REPORTSustainability
91
Of the additional 50 employees outside of Germany, 11 are attributed to the acquisition GasSecure AS in Norway. 62 new employees were recruited to strengthen Sales and 57 to work in Service. In other areas personnel was reduced, especially in Production (–27), in Purchasing and Logistics (–25) as well as in R & D (–24).
Personnel expenses within the Group rose by 12.8 percent year on year (net of currency effects: +8.6 percent) to EUR 1,040.8 million. This was primarily the result of recruit-ment and pay raises, including raises in accordance with wage agreements in the metal and electrical industries in Germany. The personnel cost ratio in fiscal year 2015 was 39.9 percent (2014: 37.9 percent).
see tables “Workforce trend”
WORKFORCE TREND
Headcount as of the balance sheet date
December 31, 2015 December 31, 2014
Number of employees 13,936 13,737
Percentage of female employees % 28.9 29.2
Part-time employees 775 842
Average years with Dräger in Germany Years 14 13
Average age of employees Years 42 42
Turnover of employees % 5.0 3.6
Sick days of work days in Germany % 5.4 5.2
Accidents in Germany (accidents at work and while commuting to work) Time off sick > 3 days 40 44
WORKFORCE TREND
Headcount as of the balance sheet date Headcount (average)
December 31, 2015 December 31, 2014 2015 2014
Germany 6,473 6,324 6,376 6,278
Other countries 7,463 7,413 7,479 7,299
Dräger Group total 13,936 13,737 13,855 13,576
Women 4,033 4,006 4,017 3,979
Men 9,903 9,731 9,838 9,598
Dräger Group total 13,936 13,737 13,855 13,576
Personnel development costs € million 16.7 16.6
thereof training expenses € million 7.9 8.6
DRÄGER ANNUAL REPORT 201592
Environment
Protecting the environment is not just an empty promise at Dräger, it is a core element of the corporate strategy, which is geared towards increasing value in the long term. We have laid down our guiding principles in the directive “We take responsibility – quality, environment, employees, society.” This directive has been published in 21 languages across the Group to enable as many employees as possible to understand and apply it every single day.
We have also anchored our company principles of quali-ty, environmental protection and occupational health and safety in our processes by means of an integrated manage-ment system. By doing so, we ensure that we not only com-ply with legal requirements, but that we also systematically identify and seize potential for improvement. In 2015, TÜV Nord once again validated the effectiveness of our environ-mental and occupational health and safety management system in accordance with ISO 14001 and OHSAS 18001. In 2015, we also recertified our sales companies in Brazil, India, Canada, Mexico and Spain. For smaller, non-certified units, we have also defined appropriate worldwide Dräger standards.
ENVIRONMENTALLY FRIENDLY PRODUCT DESIGN
Dräger products are subject to the strict regulatory require-ments applicable to medical and safety products. Our cus-tomers expect long periods of use and low operating costs from our devices. That is why we design products to save energy and resources without compromising on safety and functionality. In 2015, we organized comprehensive train-ing courses on environmentally friendly product develop-ment. We systematically use the “Life Cycle Assessment” instrument so that we are able to consider the impact of our products on the environment throughout their entire life cycle at the development stage.
We offer professional maintenance and repair services through Dräger Service all across the world and ensure a long-term supply of replacement parts and software updates so that our customers can make full use of their Dräger devices’ long service life. Dräger pursues a policy of safe recycling and disposal of used devices through spe-cific recycling passports and our product takeback unit, which is a certified waste management company. We also take back consumables such as filters, Dräger tubes or soda lime for recycling wherever this makes logistic sense.
All electrical and electronic medical devices in the Europe-an Union must comply with the substance-related restric-tions of the RoHS1 II Directive (2011/65/EU). We imple-mented these requirements within the given time frame. The majority of electronic safety devices have to comply with the regulations stipulated in the RoHS II Directive by July 22, 2017 at the earliest. However, all new developments and changes are already designed to meet RoHS II require-ments, securing the long-term availability of devices. We assess existing devices in cooperation with our suppliers and revise them as and when necessary. All materials con-sidered “Substances of Very High Concern” under the EU REACH2 regulation, which will be subject to mandatory approval in the future, and contained in Dräger tubes have been replaced by alternative materials, even though special regulations apply to such applications.
In order to continue to meet stricter requirements relat-ing to product ingredients at a global level in the future, too, we have introduced a systematic monitoring system for materials on which restrictions are foreseeable or under discussion, and take this “early warning system” into con-sideration in the product development process.
ENVIRONMENTAL PROTECTION IN PRODUCTION,
SALES AND SERVICE
The Dräger production processes are classified as having a low impact on the environment overall. The largest impact
1 EU regulation “Restriction of the use of certain hazardous substances in electrical and electronic equipment”2 EU regulation “Registration, Evaluation, Authorisation and Restriction of Chemicals”
COMBINED MANAGEMENT REPORT 93Sustainability
on the environment results from direct and indirect carbon dioxide emissions through the use of electricity, heating and transportation.
EnergyDirect CO2 emissions occur predominantly in the gener-ation of heat and power. At our central production site in Lübeck, we operate a highly efficient gas-powered com-bined heat and power plant and use district heat generated from landfill gas and biogas. Through its strategic project “Energy 20+”, Dräger is aiming to cut heat energy and elec-tricity by 20 percent at its ten most important sites across the world. To meet this goal, Dräger has analyzed the build-ings and the technology in the buildings from every angle. In 2013, the inaugural year of the project, we succeeded in cutting energy consumption of some 77 million kWh/year by approximately 23 percent; this equates to a saving of roughly 7,500 tons of CO2 per year.
Dräger is currently investing EUR 70 million in the con-struction of a “factory of the future” in Lübeck, which will have a number of significant environmental benefits: The new building’s energy consumption values are 20 percent lower than those stipulated in statutory energy standards. A heat recovery plant reduces exhaust losses by some 75 per-cent. The new factory also has a photovoltaic system, which generates up to 250 kWp (kilowatt peak) in renewable pow-er. Buildings are fitted with LED lighting, which can be controlled depending on the time of day and occupancy of rooms. In addition, there will no longer be a need for any transport between two previously separate production sites. Energy-efficient ventilation has also been installed in exist-ing production buildings as part of the project.
In spring 2015, Dräger successfully commissioned a new central administration building at its headquarters in Lü-beck. It is much more energy-efficient compared to the old building. At the Shanghai site, we have already succeeded in reducing our energy consumption by over 20 percent.
In the Czech Republic, we constructed a brand-new pro-duction site in Klášterec in 2014, which meets the latest standards. We are now gradually moving the production fa-cilities still located at nearby Chomutov over to the new site.
Indirect CO2 emissions largely occur through transpor-tation processes. We are counteracting the rise in sales performance by transferring overseas deliveries from air freight to sea freight. To avoid business travel, Dräger has also invested in video conference systems through “Skype for Business”, which is used by over 10,000 employees worldwide. In an annual survey conducted by Deutsche Umwelthilfe of how environmentally friendly the company car fleets of listed firms as well as small and medium sized enterprises are, Dräger was among the front-runners. The vehicle fleet at Dräger’s Lübeck site includes electric vehi-cles and electric bicycles.
We measure and assess the CO2 emissions of our most im-portant production, service and sales processes across the Company and once again voluntarily took part in the “Car-bon Disclosure Project”1 in 2015 .
Please refer chart “Global CO2 emissions (2014)”
WaterWe mainly use water for sanitary purposes. Larger quanti-ties of process water are used regularly in only a handful of production areas, such as for manufacturing soda lime and particle filters. Despite the rising headcount and increased production volumes, we have succeeded in cutting water consumption considerably over the past few years by intro-ducing extensive closed-loop circulation and implementing measures to boost efficiency (–13.8 percent compared to 2014).
WasteWaste from our production processes and other activities is predominantly considered harmless and can be recycled. The main waste categories are cardboard/paper, metals,
1 The Carbon Disclosure Project (CDP) is an independent reporting organization for information on climate change.

DRÄGER ANNUAL REPORT 201594
soda lime and typical household rubbish. We regularly re-view our waste disposal processes in internal and external audits to ensure compliance with the law. The waste dispos-al unit at our most important production site in Lübeck is a certified waste collection company. In 2015, a total of 3,890 tons of waste (210 tons or 6 percent more than in the prior year) was produced in Lübeck. This rise is largely due to the expansion of our production activities and the increase in product takeback at the end of life cycles. The recycling rate came to 97.3 percent.
Air emissions Air emissions from Dräger sites are primarily the result of the power supply. Dräger does not produce hazardous air emissions that would have to be recorded in the European Pollutant Release and Transfer Register (E-PRTR). The in-stallation and service work carried out in most areas of pro-duction does not release any harmful materials into the air. Only at a handful of production sites are cleaning agents, adhesives and coatings containing solvents used.
At our production site in Blyth (UK), we paint compressed gas containers. Here, an electrostatic paint robot is installed with UV curing, which allows us to significantly reduce paint consumption and as a consequence also solvent emis-sions and energy consumption. As part of the relocation of chemical protection suits production from Lübeck to Klášterec (Czech Republic), we were also able to reduce sol-vent emissions even further thanks to the thermal exhaust system installed at the new site. Dräger employs highly ef-ficient technology to scrub the exhaust air from soda lime and activated carbon production in Lübeck. Residual emis-sions (non-carbon pollutants) here are well below one ton per year, meaning that concentration levels are 95 percent below the statutory maximum limit.
Corporate Social Responsibility
We regularly fulfill our corporate social responsibility by donating medical and safety equipment; so also last year.
In May we received an urgent request for assistance from the volunteer fire service in Bützow, Mecklenburg-Vorpom- mern (Germany). On May 5, an F3-category tornado tore through the town, destroying large swathes of the town center and injuring 30 people. When conducting a danger-ous inspection of the damage caused, the local fire service required a gas detector. As soon as it received the request, Dräger got involved straight away and donated a mobile gas detector with personal protection accessories.
In June, we supported the Doctors for Madagascar aid asso-ciation in its efforts to establish a healthcare system on the African island nation by donating two anesthesiology devic-es. Together with its partners on the ground in Madagascar, the association is systematically developing the “Hopitaly Zoara” hospital in Fotadrevo in the south-west of the coun-try, which was opened in March 2012. A number of new buildings were constructed in 2015, including one building
GLOBAL CO2 EMISSIONS (2014) 1
in %
1. Electricity 25 4. Vehicle use 20
2. Central sales logistics 25 5. Heating and production gas 9
3. Air / rail travel 211 Data for each period become available in the middle of the following year.
1
23
4
5
Total 118,000 t

COMBINED MANAGEMENT REPORT 95
containing two operating rooms in which our equipment is now being used.
We also played a role in training local fire services in Dar es Salaam (Tanzania). As part of its twin city status with Dar es Salaam, the city of Hamburg sent firefighters to Tanzania to train the City Fire Brigade of Dar es Salaam in rescue div-ing; Dräger donated two sets of diving apparatus to enable the training to take place.
In the 2013 annual report, we reported on a project in Boliv-ia, which we launched in collaboration with the Deutsche Gesellschaft für Internationale Zusammenarbeit (GIZ). The program, which is part of the Federal Ministry for Eco-nomic Cooperation and Development’s (BMZ) “develoPPP.de” project, focuses on the expansion of the healthcare sys-tem, particularly in terms of pediatric heart surgery. So far, it has been extremely successful. Thanks to the anesthesia and ventilation equipment we donated and the training we provided to medical personnel, pediatric heart operations can be performed in La Paz at short notice for the first time. Children and young people living in the Bolivia’s highlands often suffer from hereditary heart conditions. The project is set to run for three years.
We also initiated another three-year “develoPPP.de” proj-ect in 2015, this time in Rwanda in collaboration with the Deutsche Investitions- und Entwicklungsgesellschaft (DEG) and the BMZ. This project involves the installation of an aircraft fire training system at Kigali International Airport in spring 2016. Dräger will also be offering local fire services the chance to train using this simulator system.
Aside from donations in kind, we also continue to provide financial support to a number of facilities in northern Ger-many. Last year, we were able to help children and young people at a curative school for disabled children take part in an organized vacation project on the Danish North Sea coast. We also made a donation to a regional care center for
children and young people for its commitment to helping people cope with grief. These are a few examples of our donation activities.
Sustainability

DRÄGER ANNUAL REPORT 201596
Dräger attaches great importance to corporate governance. In an effort to emphasize this, we apply the German Corpo-rate Governance Code – which is aimed at stock corpora-tions – to Drägerwerk AG & Co. KGaA. The corporate gover-nance report describes the features of the management and control structure of Drägerwerk AG & Co. KGaA as well as the significant rights of the shareholders and explains the special features compared to a stock corporation.
PARTNERSHIP LIMITED BY SHARES
“A partnership limited by shares (KGaA) is a company with a separate legal personality where at least one partner is fully liable to the Company’s creditors (general partner) and the remaining shareholders have a financial interest in the capital stock, which is divided into shares, without being personally liable for the company’s liabilities (limited shareholders)” (Sec. 278 [1] AktG). Hence, a partnership limited by shares is a hybrid between a stock corporation and a limited partnership, with the character of a stock corporation predominating. As is the case at a stock cor-poration, a partnership limited by shares has a two-tier management and oversight structure by law. The general partner manages the company and its operations, and the supervisory board oversees the company’s management. The main differences compared to a stock corporation are the general partner, which essentially manages operations, the absence of an executive board and the restricted rights and obligations of the supervisory board. While a super-visory board at a stock corporation appoints the executive board, the supervisory board of a partnership limited by
Corporate Governance Report
At Dräger, “corporate governance” stands for a responsible and transparent management and control process that focuses on a long-term increase in the value of the Company. It fosters the trust of investors, customers, employees and the public. The recommendations of the Government Commission of the German Corporate Governance Code are applied in all areas.
shares does not have this authorization. This means that the supervisory board does not appoint the general partner or its management bodies and does not determine their contractual conditions. In a partnership limited by shares, the supervisory board may not adopt rules of procedure for the company’s management or a catalog of transactions re-quiring approval. There are also differences relating to the annual shareholders’ meeting. Certain resolutions must be approved by the general partner (Sec. 285 [2] AktG), in par-ticular the resolution to approve the financial statements (Sec. 286 [1] AktG). Many of the recommendations of the German Corporate Governance Code (hereinafter also re-ferred to as the “Code”), which is designed for stock corpo-rations, can therefore only be applied to a limited extent to a partnership limited by shares.
The sole general partner of Drägerwerk AG & Co. KGaA is Drägerwerk Verwaltungs AG, which is a wholly owned company of Stefan Dräger GmbH. Drägerwerk Verwaltungs AG manages the operations of Drägerwerk AG & Co. KGaA and represents it. To do so, it acts through its Executive Board. Drägerwerk Verwaltungs AG does not hold an equity interest in Drägerwerk AG & Co. KGaA.
Please refer chart “Drägerwerk AG & Co. KGaA”
DECLARATION OF CONFORMITY
The joint declaration of conformity by the general part-ner and the Supervisory Board of Drägerwerk AG & Co. KGaA was discussed and approved in the meeting of the Supervisory Board on December 11, 2015. It states that the
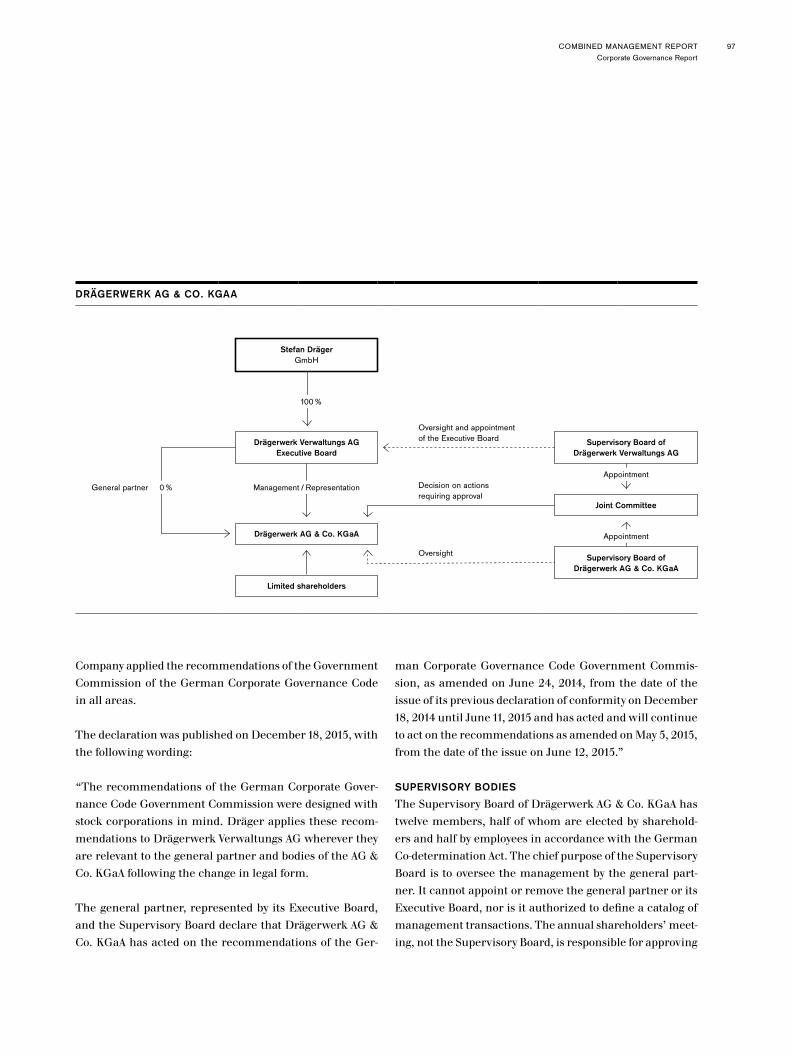
COMBINED MANAGEMENT REPORTCorporate Governance Report
97
Company applied the recommendations of the Government Commission of the German Corporate Governance Code in all areas.
The declaration was published on December 18, 2015, with the following wording:
“The recommendations of the German Corporate Gover-nance Code Government Commission were designed with stock corporations in mind. Dräger applies these recom-mendations to Drägerwerk Verwaltungs AG wherever they are relevant to the general partner and bodies of the AG & Co. KGaA following the change in legal form.
The general partner, represented by its Executive Board, and the Supervisory Board declare that Drägerwerk AG & Co. KGaA has acted on the recommendations of the Ger-
man Corporate Governance Code Government Commis-sion, as amended on June 24, 2014, from the date of the issue of its previous declaration of conformity on December 18, 2014 until June 11, 2015 and has acted and will continue to act on the recommendations as amended on May 5, 2015, from the date of the issue on June 12, 2015.”
SUPERVISORY BODIES
The Supervisory Board of Drägerwerk AG & Co. KGaA has twelve members, half of whom are elected by sharehold-ers and half by employees in accordance with the German Co-determination Act. The chief purpose of the Supervisory Board is to oversee the management by the general part-ner. It cannot appoint or remove the general partner or its Executive Board, nor is it authorized to define a catalog of management transactions. The annual shareholders’ meet-ing, not the Supervisory Board, is responsible for approving
DRÄGERWERK AG & CO. KGAA
Oversight and appointment of the Executive BoardDrägerwerk Verwaltungs AG
Executive Board
Stefan Dräger GmbH
100%
Drägerwerk AG & Co. KGaA
Limited shareholders
Supervisory Board ofDrägerwerk Verwaltungs AG
Joint Committee
0% Management / Representation
Supervisory Board ofDrägerwerk AG & Co. KGaA
General partnerAppointment
Appointment
Oversight
Decision on actionsrequiring approval
DRÄGER ANNUAL REPORT 201598
the financial statements of Drägerwerk AG & Co. KGaA. Several members of the Supervisory Board hold or held high-ranking positions at other companies. However, all of the shareholder representatives on the Supervisory Board are independent of the Company in the sense defined by the Corporate Governance Code. Where business relationships with Supervisory Board members exist, transactions are conducted on an arm’s length basis as between unrelated parties and do not affect the independence of the members. The Supervisory Board of Drägerwerk Verwaltungs AG has six members who are elected by Stefan Dräger GmbH and are also the shareholder representatives on the Superviso-ry Board of Drägerwerk AG & Co. KGaA. The Supervisory Board of Drägerwerk Verwaltungs AG therefore does not have any employee representatives. It appoints the Execu-tive Board of Drägerwerk Verwaltungs AG.
Pursuant to Sec. 22 of the Company’s articles of associa-tion, Drägerwerk AG & Co. KGaA has set up a Joint Com-mittee as a voluntary, additional body. It comprises eight members: four members each from the Supervisory Boards of Drägerwerk Verwaltungs AG and Drägerwerk AG & Co. KGaA, which must include two shareholder representatives and two employee representatives from the Supervisory Board of Drägerwerk AG & Co. KGaA. The Joint Commit-tee decides on the extraordinary management transactions by the general partner which require approval as set out in Sec. 23 (2) of the articles of association of Drägerwerk AG & Co. KGaA.
The Supervisory Board of Drägerwerk AG & Co. KGaA re-solved that, when selecting its members pursuant to 5.4.1 of the Code, it would be guided by the following criteria that take into account diversity:
– Professional and personal qualifications,– Business management experience in German and foreign
companies with a worldwide presence in various cultural regions,
– Experience as a representative of family-owned as well as listed companies,
– A proven track record in finance and accounting as well as in financing and capital market communication,
– Experience in marketing and sales in diversified technol-ogy companies,
– Intellectually and financially independent persons with a high degree of personal integrity who do not have a conflict of interest with the Company,
– The majority of shareholder representatives are indepen-dent members,
– Must be under 70 years of age for new election or re-elec-tion, and
– Usually no more than three terms on the Supervisory Board.
The last elections for shareholders’ representatives took place at the annual shareholders’ meeting on May 3, 2013. The criteria described above were taken into account and fulfilled without exception. It was ensured that a high pro-portion of Supervisory Board members have experience in representing family-run companies and listed companies as well as in marketing and sales at technology-led companies. According to the assessment of the Supervisory Board, all shareholder representatives are independent as defined by 5.4.2 of the German Corporate Governance Code.
The Supervisory Board of Drägerwerk AG & Co. KGaA moni- tors and advises the Executive Board of the general partner in the management of the partnership limited by shares. The Supervisory Board regularly discusses business perfor-mance and plans as well as the implementation of the busi-ness strategy based on written and oral reports by the Exec-utive Board of the general partner. It reviews the financial statements of Drägerwerk AG & Co. KGaA and the Dräger Group. In doing so, it takes into account the audit reports of the statutory auditors and the results of the review by the Audit Committee. The Supervisory Board makes its recommendation to the annual shareholders’ meeting for

COMBINED MANAGEMENT REPORTCorporate Governance Report
99
a resolution to approve the financial statements and the group financial statements.
The Joint Committee makes decisions on extraordinary management transactions by the general partner. The in-dividual transactions requiring approval are defined in Sec. 23 (2) of the articles of association of the Company.
Appointing and removing members of the Executive Board of Drägerwerk Verwaltungs AG, which manages the opera-tions of Drägerwerk AG & Co. KGaA as the legal represen-tative of the general partner, is the task of the Supervisory Board of Drägerwerk Verwaltungs AG.
In an effort to improve its effectiveness and efficiency, the Supervisory Board of Drägerwerk AG & Co. KGaA es-tablished an Audit Committee in accordance with 5.3.2 of the Code and a Nomination Committee in accordance with 5.3.3 of the Code. The Audit Committee consists of the Chairman of the Supervisory Board as well as four further members, of which two are shareholder representatives and two are employee representatives. The Supervisory Board ensures that the Committee members are indepen-dent and places great emphasis on their particular knowl-edge and experience in applying accounting standards and internal control processes. The Audit Committee monitors the adequacy and functionality of the Company’s external and internal financial reporting system. Together with the statutory auditors, the Audit Committee discusses the re-ports drawn up by the Executive Board during the year, the Company’s financial statements and audit reports. On this basis, the Audit Committee draws up recommendations for the approval of the financial statements by the annual shareholders’ meeting. It deals with the Company’s inter-nal control system and with the procedure for recording risks, for risk control and risk management as well as com-pliance. The internal audit department reports regularly to the Audit Committee, and is engaged by this Committee to
carry out audits as is deemed necessary. Reference is also made to the report of the Supervisory Board.
The Chairman of the Supervisory Board as well as two shareholder representatives are members of the Nomina-tion Committee. It is charged with proposing suitable can-didates for election to the Supervisory Board. On this basis, the Supervisory Board compiles appropriate suggestions for the annual shareholders’ meeting.
MANAGEMENT
Drägerwerk Verwaltungs AG manages the operations of Drägerwerk AG & Co. KGaA.
In its role as managing body of Drägerwerk AG & Co. KGaA and of the Dräger Group, the Executive Board of Dräger- werk Verwaltungs AG makes decisions on corporate policy. It determines the Company’s strategic focus, plans and sets budgets, is responsible for resource allocation and moni-tors business performance. It also compiles the quarterly reports and the financial statements of Drägerwerk AG & Co. KGaA and the Group. It works closely with the oversight bodies. The Chairman of the Supervisory Boards of the Company and of the general partner works closely with the Chairman of the Executive Board of the general partner. He regularly provides the Supervisory Board with up-to-date and comprehensive information on all issues relevant to the Company: strategy and its implementation, planning, business performance, financial position and results of op-erations as well as business risk.
The Supervisory Board of Drägerwerk Verwaltungs AG ap-proved the rules of procedure and its allocation of responsi-bilities for the Executive Board at its meeting on December 10, 2015.
RELATIONSHIP TO SHAREHOLDERS
The annual shareholders’ meeting is held in the first eight months of the fiscal year. It approves the financial state-

DRÄGER ANNUAL REPORT 2015100
Employee training was regularly carried out on compliance issues such as anti-corruption and antitrust law in 2015, both in the form of events on location and online training courses able to be accessed worldwide.
The compliance helpline e-mail address also offers employ-ees assistance when it comes to compliance issues. They also have the opportunity to ask questions or report con-cerns relating to certain business practices by telephone via a compliance helpline – anonymously if they wish. In addition, we have also established a process to assess the level of compliance risk involved with sales partners.
Further components of the Compliance Program include compliance reviews and decentralized compliance reports concerning the effectiveness of compliance-related meas- ures. We will continue to develop and adapt the Dräger Compliance Program in the future in order to meet updat-ed legal and ethical demands at all times.
Remuneration report
The remuneration report also forms part of the combined management report of Drägerwerk AG & Co. KGaA and the Dräger Group.
EXECUTIVE BOARD REMUNERATION
Dräger places great value on providing detailed informa-tion on the remuneration of the Executive Board as this forms part of exemplary governance and transparency for its shareholders.
This report provides an overview of the amount and struc-ture of Executive Board remuneration at Dräger and out-lines the joint remuneration system for the Executive Board members and the top management levels in the Group (Top Management Incentive, TMI). Dräger’s remuneration sys-tem complies with the requirements of the German Stock
ments of Drägerwerk AG & Co. KGaA, among other things. In addition, it votes on profit appropriation, the exoneration of the general partner and of the Supervisory Board and the election of the statutory auditors. Furthermore, it also elects the shareholder representatives to the Supervisory Board and approves amendments to the articles of asso-ciation and changes in capital, which the general partner implements. The shareholders exercise their rights at the annual shareholders’ meeting in accordance with the legal requirements and the Company’s articles of association. Insofar as the resolutions of the annual shareholders’ meet-ing relate to extraordinary transactions and core business, they also require the approval of the general partner.
In addition, Dräger reports to its shareholders on business performance, net assets, financial position and results of operations in three interim reports and the annual report.
COMPLIANCE
Dräger has stood for “Technology for Life” for over 125 years. The highest degree of professionalism and reliability also determine Dräger’s conduct and values. The Compa-ny’s Principles of Business and Conduct provide the frame-work for this. In terms of risk, we supplement these prin-ciples with business-specific rules, such as on the topics of corruption, antitrust law or conflicts of interest.
Compliance organization at Dräger consists of the Execu-tive Board, the Corporate Compliance Committee, the Cor-porate Compliance Office, the regional coordinators, the country managers, local compliance committees and local compliance officers in selected countries. On the Executive Board, the Chairman is responsible for compliance. The Executive Board makes the strategic decisions necessary for the establishment and development of compliance, the implementation of which is guaranteed by the Corporate Compliance Committee; the necessary measures are exe-cuted by the Corporate Compliance Office or the local Com-pliance agent.
COMBINED MANAGEMENT REPORTCorporate Governance Report
101
Corporation Act (AktG) and the German Corporate Gover-nance Code (DCGC):
– The remuneration structure is designed to support sus-tainable business performance,
– The remuneration consists of fixed and variable compo-nents,
– The variable remuneration component is based on a long-term measurement period over several years,
– Positive and negative developments in Company value are taken into account,
– Remuneration is designed to appropriately reflect the function, the Company and the industry; remuneration for top management is also in proportion to that of the rest of the workforce,
– Incentives for entering into disproportionate risks are avoided, and
– Upper limits on total remuneration and variable remu-neration components.
CONTRACTS AND RESPONSIBILITIES
Stefan Dräger was appointed member and Chairman of the Executive Board of Drägerwerk Verwaltungs AG for a further five years from March 1, 2015 until February 29, 2020 by Supervisory Board resolution in January 2015. Dr. Herbert Fehrecke retired as of March 31, 2015 as planned. Rainer Klug was appointed member of the Executive Board for three years in March 2015. He began his role as new Chief Supply Chain Officer (CSCO) at Dräger on August 1, 2015. Dr. Reiner Piske was appointed as a new member of the Executive Board responsible for HR for three years in June 2015. He began his role at Dräger on November 1, 2015. Gert-Hartwig Lescow was appointed member and Vice Chairman of the Executive Board for a further five years until March 31, 2021 in December 2015.
DRÄGER VALUE ADDED AS A KEY MANAGEMENT FIGURE
Since 2010, Dräger has geared the management of the Com-pany towards a long-term, sustainable increase in Compa-
ny value. We introduced the Company-related key figure Dräger Value Added (DVA) as a key performance indicator to measure this. DVA is the result of EBIT in the past twelve months less calculated cost of capital (basis: average capital employed in the past twelve months). DVA management has been integrated into all management processes. The maxim of value added is particularly important for the defi-nition of strategies, planning, regular reporting and when making investment and business decisions. Consequently, performance-related variable remuneration of the Dräger management also reflects DVA. As a result, Dräger has already adjusted the existing management and Executive Board remuneration systems by setting all quantitative tar-gets so as to have a direct and positive impact on DVA or op-erating cash flow. Targets can also be defined on the basis of other key performance indicators for individual functions.
NEW REMUNERATION STRUCTURE IN 2015
The absolute amount of remuneration for Executive Board members and top managers is based on each person’s range of tasks, responsibilities and required abilities.
From fiscal year 2015, the monetary remuneration compo-nents comprise three components: (i) fixed annual remu-neration, (ii) an annual bonus based on the annual DVA target and a KPI-based annual bonus and (iii) a long-term bonus based on DVA development over a three-year period. The DVA-based bonus therefore represents the core com-ponent of variable remuneration for all Executive Board members. Upper limits are defined for all remuneration components, ensuring that the absolute value of the remu-neration is limited. A long-term measurement limit applies to the majority of variable salary components.
– Fixed remuneration is paid monthly as a salary. The fixed remuneration of existing Executive Board mem-bers was determined upon their appointments or at the time their contracts were extended and has remained unchanged since.

DRÄGER ANNUAL REPORT 2015102
– Of the variable target remuneration, 50 percent com-prises an annual bonus and 50 percent a long-term bonus.
– In turn, half of the annual bonus is based on a DVA tar-get and the other half on one or more KPI targets. Both targets are defined every year by the Supervisory Board. Target achievement of 0 to 200 percent is possible for the annual bonus and its component targets.
– The DVA target is at least EUR 50 million for 100 per-cent target achievement; in the case of 200 percent target achievement, the target is at least EUR 50 million above the 100 percent DVA target. If DVA is negative, there is no bonus payment for the DVA target.
– For 2015, KPI targets were based on three component targets: (i) business development in North America and selected growth markets, (ii) the expansion of global ser-vice business and (iii) the achievement of the cost targets set for 2015.
– The long-term bonus is based on the average achieve-ment of DVA targets for the last three fiscal years and the achievement of a fixed DVA target figure defined at the start of a three-year period. For the long-term bonus, target achievement of 0 percent to 300 percent is possible.
The new remuneration system, including its long-term components, takes full effect from fiscal year 2017. Until then, the one-year remuneration component of 100 % is used as a basis for the calculation of the variable remuner-ation for fiscal year 2015 and fiscal year 2016.
The variable remuneration is restricted to 250 percent of the benchmark amount.
It has been agreed with Dr. Herbert Fehrecke that he will receive variable remuneration for the year of his departure on a pro rata basis assuming full target achievement.
The variable remuneration target system also forms the basis for roughly 230 managers at the Company. However, the focus here is on remuneration with one-year targets
for DVA and KPIs and only on the defined DVA target of the three-year period to a lesser extent.
BONUS RESERVE
In fiscal year 2014, the Supervisory Board resolved to abol-ish the bonus reserve. The bonus reserve from 2011 to 2014 was as follows: Stefan Dräger: EUR –1,470,609; Dr. Her-bert Fehrecke: EUR –553,330; Gert-Hartwig Lescow: EUR –284,572; Anton Schrofner: EUR –538,339. Bonus reserve amounts were not settled or carried forward for members of the Executive Board.
EMPLOYEE SHARE PROGRAM
The employee share program launched in Germany in 2013 was once again offered in fiscal year 2015. This program grants members of the Executive Board one bonus share for every three acquired shares. As was the case when the pro-gram was launched in 2013, the number of shares is limited to nine acquired packages each containing three shares, meaning that a maximum of nine bonus shares were issued per employee. The shares have a two-year holding period and are reported in the table as share-based, long-term vari-able remuneration.
ADDITIONAL BENEFITS AND REMUNERATION
COMPONENTS
Additional benefits, which Executive Board members re-ceive in addition to the aforementioned remuneration, include contributions for pension, care and health insur-ance premiums and preventative health care as well as a company car for business and private use. The use of the company car is calculated using the 1 percent method plus the benefit for trips between home address and place of work, and taxed individually. The Executive Board mem-bers are responsible for paying the incurred payroll tax. Furthermore, additional benefits to Executive Board mem-bers Rainer Klug and Dr. Reiner Piske also include one-off expenses payments to compensate costs associated with moving to Lübeck. The Company has also taken out group

COMBINED MANAGEMENT REPORTCorporate Governance Report
103
accident insurance for Executive Board members and pays the premium for the D & O for members of the Executive Board; these policies do not constitute part of the Execu-tive Board’s remuneration. The financial loss liability insur-ance includes a deductible, which has been set since 2010 at one-and-a-half times the amount of gross fixed annual remuneration in accordance with the Act on the Appropri-ateness of Executive Board Remuneration (VorstAG).
REMUNERATION TABLES
In accordance with the requirements of the German Cor-porate Governance Code and German Accounting Standard 17, Executive Board remuneration has been presented in the form of three separate tables for sufficient clarity. Fixed remuneration and additional benefits are based on the agreed fixed amount. For the variable remuneration, the “Granted allowances” table includes a target value for achieving 100 percent as well as minimum and maximum remuneration.
SEVERANCE PAYMENTS
The employment contracts of all active Executive Board members contain regulations for the early termination of their contracts without good cause. They limit compen-sation to the total remuneration for one fiscal year (com-pensation cap) and may never exceed total remuneration including additional benefits for the remaining term of the respective employment contract.
see tables “Executive board remuneration – granted allocations”, “Executive board remuneration – contribution”, “Executive board remuneration – DRS 17”
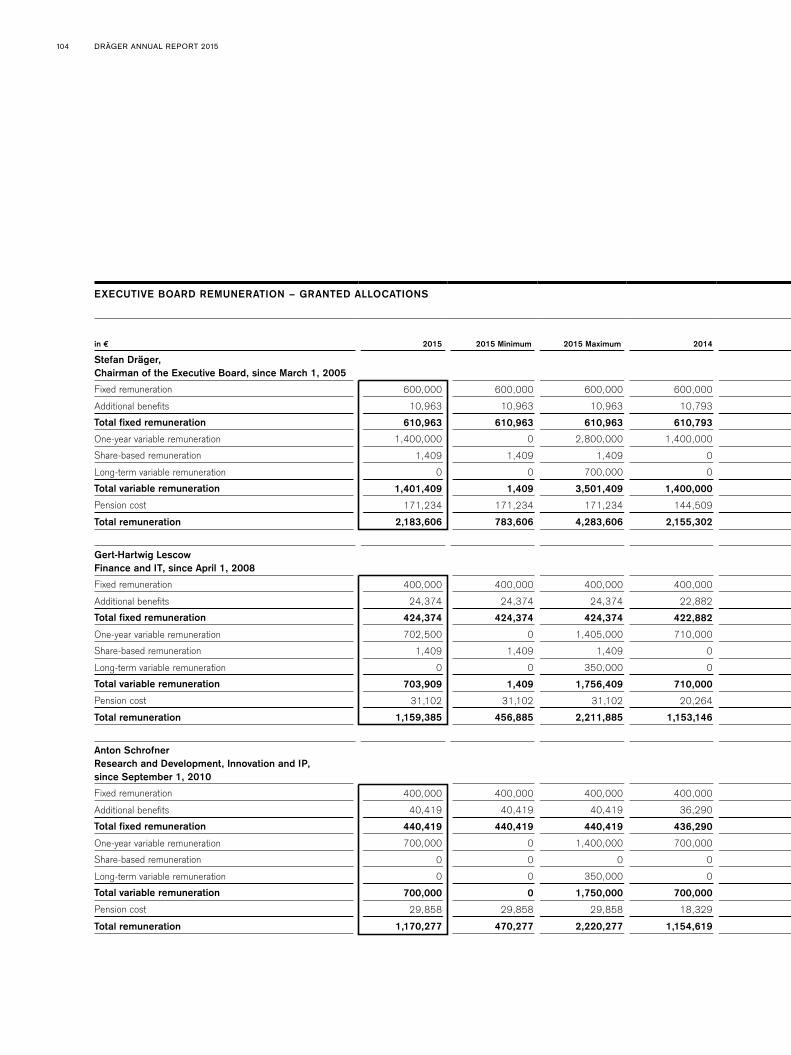
DRÄGER ANNUAL REPORT 2015104
EXECUTIVE BOARD REMUNERATION – GRANTED ALLOCATIONS
in € 2015 2015 Minimum 2015 Maximum 2014 in € 2015 2015 Minimum 2015 Maximum 2014
Stefan Dräger, Chairman of the Executive Board, since March 1, 2005
Rainer KlugPurchasing, Production and Logistics, since August 1, 2015
Fixed remuneration 600,000 600,000 600,000 600,000 Fixed remuneration 166,667 166,667 166,667 0
Additional benefits 10,963 10,963 10,963 10,793 Additional benefits 83,685 83,685 83,685 0
Total fixed remuneration 610,963 610,963 610,963 610,793 Total fixed remuneration 250,352 250,352 250,352 0
One-year variable remuneration 1,400,000 0 2,800,000 1,400,000 One-year variable remuneration 291,667 0 583,333 0
Share-based remuneration 1,409 1,409 1,409 0 Share-based remuneration 0 0 0 0
Long-term variable remuneration 0 0 700,000 0 Long-term variable remuneration 0 0 350,000 0
Total variable remuneration 1,401,409 1,409 3,501,409 1,400,000 Total variable remuneration 291,667 0 933,333 0
Pension cost 171,234 171,234 171,234 144,509 Pension cost 0 0 0 0
Total remuneration 2,183,606 783,606 4,283,606 2,155,302 Total remuneration 542,018 250,352 1,183,685 0
Gert-Hartwig LescowFinance and IT, since April 1, 2008
Dr. Reiner PiskeHR, since November 1, 2015
Fixed remuneration 400,000 400,000 400,000 400,000 Fixed remuneration 50,000 50,000 50,000 0
Additional benefits 24,374 24,374 24,374 22,882 Additional benefits 53,322 53,322 53,322 0
Total fixed remuneration 424,374 424,374 424,374 422,882 Total fixed remuneration 103,322 103,322 103,322 0
One-year variable remuneration 702,500 0 1,405,000 710,000 One-year variable remuneration 100,000 0 200,000 0
Share-based remuneration 1,409 1,409 1,409 0 Share-based remuneration 0 0 0 0
Long-term variable remuneration 0 0 350,000 0 Long-term variable remuneration 0 0 300,000 0
Total variable remuneration 703,909 1,409 1,756,409 710,000 Total variable remuneration 100,000 0 500,000 0
Pension cost 31,102 31,102 31,102 20,264 Pension cost 0 0 0 0
Total remuneration 1,159,385 456,885 2,211,885 1,153,146 Total remuneration 203,322 103,322 603,322 0
Anton SchrofnerResearch and Development, Innovation and IP,since September 1, 2010
Dr. Herbert FehreckePurchasing, Quality and Technology,from April 1, 2008 to March 31, 2015
Fixed remuneration 400,000 400,000 400,000 400,000 Fixed remuneration 100,000 100,000 100,000 400,000
Additional benefits 40,419 40,419 40,419 36,290 Additional benefits 5,331 5,331 5,331 21,138
Total fixed remuneration 440,419 440,419 440,419 436,290 Total fixed remuneration 105,331 105,331 105,331 421,138
One-year variable remuneration 700,000 0 1,400,000 700,000 One-year variable remuneration 175,000 0 350,000 702,350
Share-based remuneration 0 0 0 0 Share-based remuneration 0 0 0 0
Long-term variable remuneration 0 0 350,000 0 Long-term variable remuneration 0 0 0 0
Total variable remuneration 700,000 0 1,750,000 700,000 Total variable remuneration 175,000 0 350,000 702,350
Pension cost 29,858 29,858 29,858 18,329 Pension cost 5,000 5,000 5,000 20,000
Total remuneration 1,170,277 470,277 2,220,277 1,154,619 Total remuneration 280,331 105,331 455,331 1,143,488

COMBINED MANAGEMENT REPORTCorporate Governance Report
105
EXECUTIVE BOARD REMUNERATION – GRANTED ALLOCATIONS
in € 2015 2015 Minimum 2015 Maximum 2014 in € 2015 2015 Minimum 2015 Maximum 2014
Stefan Dräger, Chairman of the Executive Board, since March 1, 2005
Rainer KlugPurchasing, Production and Logistics, since August 1, 2015
Fixed remuneration 600,000 600,000 600,000 600,000 Fixed remuneration 166,667 166,667 166,667 0
Additional benefits 10,963 10,963 10,963 10,793 Additional benefits 83,685 83,685 83,685 0
Total fixed remuneration 610,963 610,963 610,963 610,793 Total fixed remuneration 250,352 250,352 250,352 0
One-year variable remuneration 1,400,000 0 2,800,000 1,400,000 One-year variable remuneration 291,667 0 583,333 0
Share-based remuneration 1,409 1,409 1,409 0 Share-based remuneration 0 0 0 0
Long-term variable remuneration 0 0 700,000 0 Long-term variable remuneration 0 0 350,000 0
Total variable remuneration 1,401,409 1,409 3,501,409 1,400,000 Total variable remuneration 291,667 0 933,333 0
Pension cost 171,234 171,234 171,234 144,509 Pension cost 0 0 0 0
Total remuneration 2,183,606 783,606 4,283,606 2,155,302 Total remuneration 542,018 250,352 1,183,685 0
Gert-Hartwig LescowFinance and IT, since April 1, 2008
Dr. Reiner PiskeHR, since November 1, 2015
Fixed remuneration 400,000 400,000 400,000 400,000 Fixed remuneration 50,000 50,000 50,000 0
Additional benefits 24,374 24,374 24,374 22,882 Additional benefits 53,322 53,322 53,322 0
Total fixed remuneration 424,374 424,374 424,374 422,882 Total fixed remuneration 103,322 103,322 103,322 0
One-year variable remuneration 702,500 0 1,405,000 710,000 One-year variable remuneration 100,000 0 200,000 0
Share-based remuneration 1,409 1,409 1,409 0 Share-based remuneration 0 0 0 0
Long-term variable remuneration 0 0 350,000 0 Long-term variable remuneration 0 0 300,000 0
Total variable remuneration 703,909 1,409 1,756,409 710,000 Total variable remuneration 100,000 0 500,000 0
Pension cost 31,102 31,102 31,102 20,264 Pension cost 0 0 0 0
Total remuneration 1,159,385 456,885 2,211,885 1,153,146 Total remuneration 203,322 103,322 603,322 0
Anton SchrofnerResearch and Development, Innovation and IP,since September 1, 2010
Dr. Herbert FehreckePurchasing, Quality and Technology,from April 1, 2008 to March 31, 2015
Fixed remuneration 400,000 400,000 400,000 400,000 Fixed remuneration 100,000 100,000 100,000 400,000
Additional benefits 40,419 40,419 40,419 36,290 Additional benefits 5,331 5,331 5,331 21,138
Total fixed remuneration 440,419 440,419 440,419 436,290 Total fixed remuneration 105,331 105,331 105,331 421,138
One-year variable remuneration 700,000 0 1,400,000 700,000 One-year variable remuneration 175,000 0 350,000 702,350
Share-based remuneration 0 0 0 0 Share-based remuneration 0 0 0 0
Long-term variable remuneration 0 0 350,000 0 Long-term variable remuneration 0 0 0 0
Total variable remuneration 700,000 0 1,750,000 700,000 Total variable remuneration 175,000 0 350,000 702,350
Pension cost 29,858 29,858 29,858 18,329 Pension cost 5,000 5,000 5,000 20,000
Total remuneration 1,170,277 470,277 2,220,277 1,154,619 Total remuneration 280,331 105,331 455,331 1,143,488
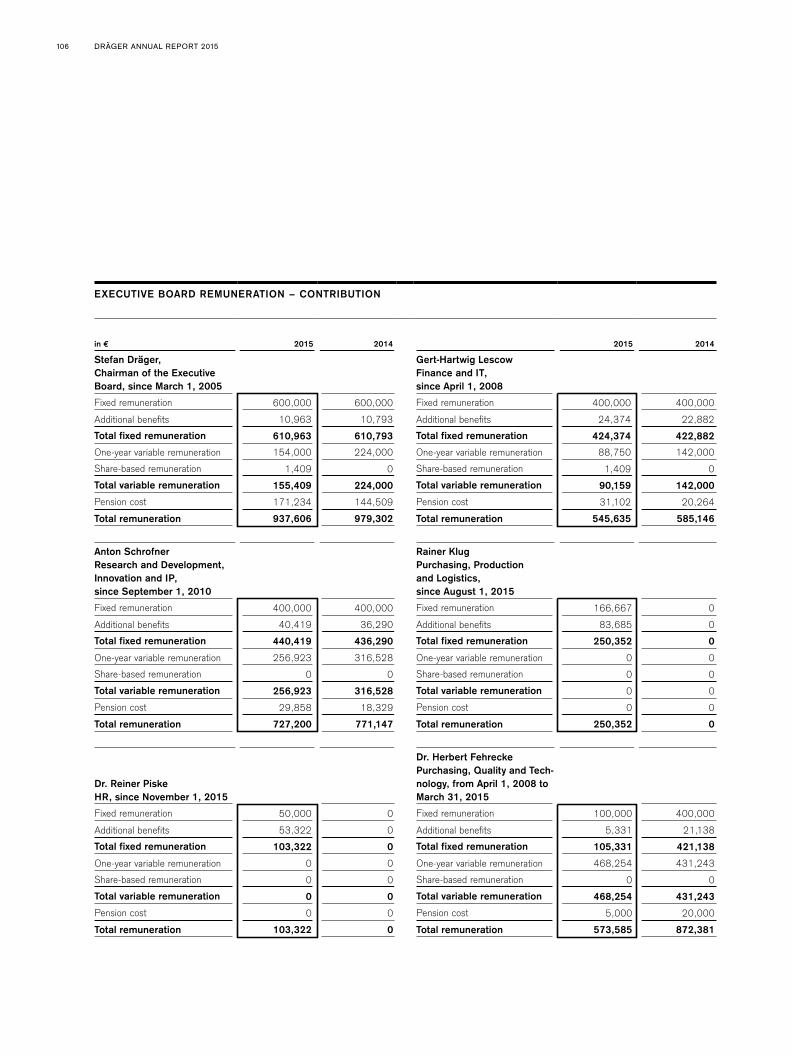
DRÄGER ANNUAL REPORT 2015106
EXECUTIVE BOARD REMUNERATION – CONTRIBUTION
in € 2015 2014 2015 2014
Stefan Dräger, Chairman of the Executive Board, since March 1, 2005
Gert-Hartwig LescowFinance and IT, since April 1, 2008
Fixed remuneration 600,000 600,000 Fixed remuneration 400,000 400,000
Additional benefits 10,963 10,793 Additional benefits 24,374 22,882
Total fixed remuneration 610,963 610,793 Total fixed remuneration 424,374 422,882
One-year variable remuneration 154,000 224,000 One-year variable remuneration 88,750 142,000
Share-based remuneration 1,409 0 Share-based remuneration 1,409 0
Total variable remuneration 155,409 224,000 Total variable remuneration 90,159 142,000
Pension cost 171,234 144,509 Pension cost 31,102 20,264
Total remuneration 937,606 979,302 Total remuneration 545,635 585,146
Anton SchrofnerResearch and Development, Innovation and IP,since September 1, 2010
Rainer KlugPurchasing, Production and Logistics, since August 1, 2015
Fixed remuneration 400,000 400,000 Fixed remuneration 166,667 0
Additional benefits 40,419 36,290 Additional benefits 83,685 0
Total fixed remuneration 440,419 436,290 Total fixed remuneration 250,352 0
One-year variable remuneration 256,923 316,528 One-year variable remuneration 0 0
Share-based remuneration 0 0 Share-based remuneration 0 0
Total variable remuneration 256,923 316,528 Total variable remuneration 0 0
Pension cost 29,858 18,329 Pension cost 0 0
Total remuneration 727,200 771,147 Total remuneration 250,352 0
Dr. Reiner PiskeHR, since November 1, 2015
Dr. Herbert FehreckePurchasing, Quality and Tech-nology, from April 1, 2008 to March 31, 2015
Fixed remuneration 50,000 0 Fixed remuneration 100,000 400,000
Additional benefits 53,322 0 Additional benefits 5,331 21,138
Total fixed remuneration 103,322 0 Total fixed remuneration 105,331 421,138
One-year variable remuneration 0 0 One-year variable remuneration 468,254 431,243
Share-based remuneration 0 0 Share-based remuneration 0 0
Total variable remuneration 0 0 Total variable remuneration 468,254 431,243
Pension cost 0 0 Pension cost 5,000 20,000
Total remuneration 103,322 0 Total remuneration 573,585 872,381
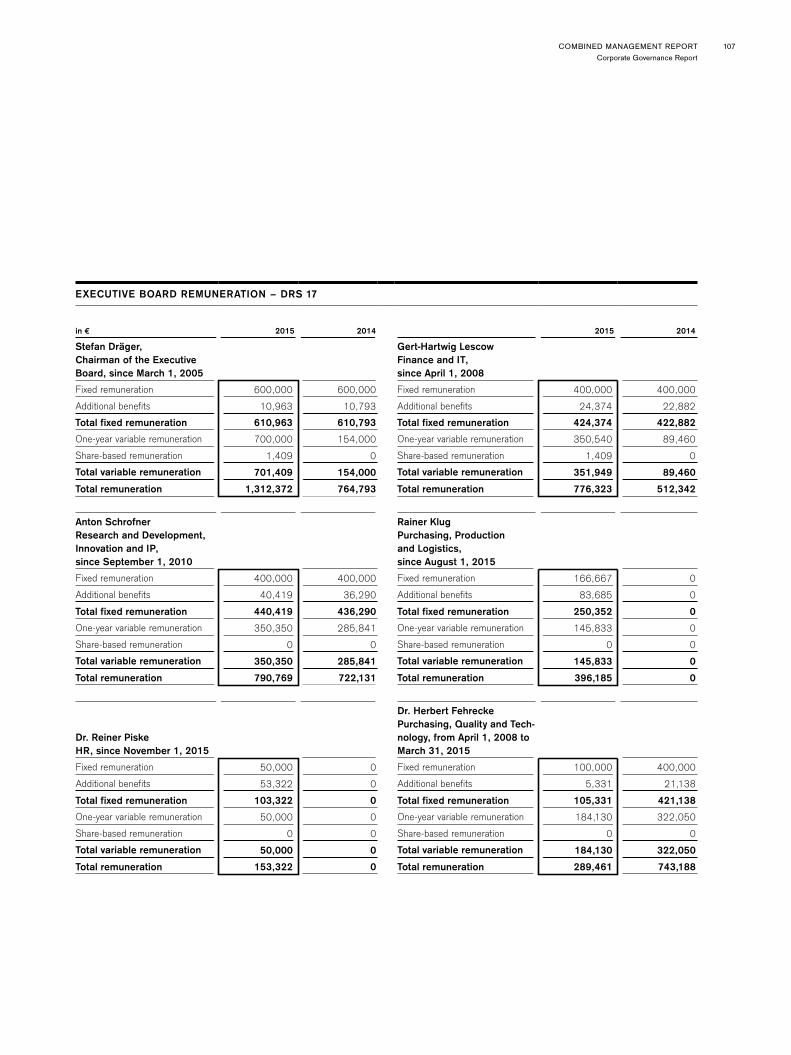
COMBINED MANAGEMENT REPORTCorporate Governance Report
107
EXECUTIVE BOARD REMUNERATION – DRS 17
in € 2015 2014 2015 2014
Stefan Dräger, Chairman of the Executive Board, since March 1, 2005
Gert-Hartwig LescowFinance and IT, since April 1, 2008
Fixed remuneration 600,000 600,000 Fixed remuneration 400,000 400,000
Additional benefits 10,963 10,793 Additional benefits 24,374 22,882
Total fixed remuneration 610,963 610,793 Total fixed remuneration 424,374 422,882
One-year variable remuneration 700,000 154,000 One-year variable remuneration 350,540 89,460
Share-based remuneration 1,409 0 Share-based remuneration 1,409 0
Total variable remuneration 701,409 154,000 Total variable remuneration 351,949 89,460
Total remuneration 1,312,372 764,793 Total remuneration 776,323 512,342
Anton SchrofnerResearch and Development, Innovation and IP,since September 1, 2010
Rainer KlugPurchasing, Production and Logistics, since August 1, 2015
Fixed remuneration 400,000 400,000 Fixed remuneration 166,667 0
Additional benefits 40,419 36,290 Additional benefits 83,685 0
Total fixed remuneration 440,419 436,290 Total fixed remuneration 250,352 0
One-year variable remuneration 350,350 285,841 One-year variable remuneration 145,833 0
Share-based remuneration 0 0 Share-based remuneration 0 0
Total variable remuneration 350,350 285,841 Total variable remuneration 145,833 0
Total remuneration 790,769 722,131 Total remuneration 396,185 0
Dr. Reiner PiskeHR, since November 1, 2015
Dr. Herbert FehreckePurchasing, Quality and Tech-nology, from April 1, 2008 to March 31, 2015
Fixed remuneration 50,000 0 Fixed remuneration 100,000 400,000
Additional benefits 53,322 0 Additional benefits 5,331 21,138
Total fixed remuneration 103,322 0 Total fixed remuneration 105,331 421,138
One-year variable remuneration 50,000 0 One-year variable remuneration 184,130 322,050
Share-based remuneration 0 0 Share-based remuneration 0 0
Total variable remuneration 50,000 0 Total variable remuneration 184,130 322,050
Total remuneration 153,322 0 Total remuneration 289,461 743,188

DRÄGER ANNUAL REPORT 2015108
THIRD-PARTY PAYMENTS AND CLAIM REIMBURSEMENTS
In the fiscal year, no payments were made or promised by a third party to any member of the Executive Board in relation to duties as member of the Executive Board. If Executive Board remuneration is paid by Drägerwerk Ver-waltungs AG, pursuant to Sec. 11 (1) and (3) of the articles of association of Drägerwerk AG & Co. KGaA it is entitled to claim reimbursement from Drägerwerk AG & Co. KGaA monthly. Pursuant to Sec. 11 (4) of the Company’s articles of association, the general partner receives a fee, indepen-dent of profit and loss, of 6 percent of the equity disclosed in its financial statements, payable one week after the gen-eral partner prepares its financial statements, for the man-agement of the Company and the assumption of personal liability. For fiscal year 2015, this remuneration amounts to EUR 86,761.84 (2014: EUR 83,498.48) plus potentially incurred VAT.
DEFINED BENEFIT PLANS
Obligations to the Executive Board members from the pension plan remain unchanged at Drägerwerk AG & Co. KGaA pursuant to the terms and conditions of individual contracts. Defined benefit plans for members of the Execu-tive Board are performance-based and are agreed individ-ually, based on “Führungskräfteversorgung 2005”, which has been in effect within the Group since January 1, 2006.
The defined benefits under the pension plans offered to the members of the Executive Board are based on the basic annual salary and years of service on the Executive Board. It is based on an annual contribution of up to 15 percent of the basic annual salary. From April 2015, the annual contribution of Gert-Hartwig Lescow increased by up to 15 percent of pensionable earnings, depending on the Group EBIT margin. Under the deferred compensation option, an additional annual contribution of up to 20 percent of the basic annual remuneration is possible. These personal con-tributions were as follows in fiscal year 2015: Stefan Dräger: EUR 120,000 (2014: EUR 120,000); Dr. Herbert Fehrecke: EUR 7,500 (2014: EUR 30,000); and Gert-Hartwig Lescow: EUR 24,000 (2014: EUR 80,000). Stefan Dräger receives a further contribution of 50 percent from Drägerwerk AG & Co. KGaA on deferred compensation, but no more than 8 percent of his basic annual salary. From April 2015, Gert-Hartwig Lescow also received a further contribution of the same amount of his deferred compensation, but no more than 5 percent of his basic annual salary. These further contributions are progressive if the Group EBIT margin equals 5 percent or more of net sales.
EUR 3,144,049.45 was paid to former members of the Ex-ecutive Board and their surviving dependents (2014: EUR 3,304,845.91). Pension commitments to former members
PENSION OBLIGATIONS FOR ACTIVE EXECUTIVE BOARD MEMBERS
Addition Obligation Addition Obligation
in € 2015 December 31, 2015 2014 December 31, 2014
Dräger, Stefan 242,525 3,125,055 1,188,611 2,882,530
Fehrecke, Dr. Herbert (until March 31, 2015) 40,374 384,698 118,230 344,324
Lescow, Gert-Hartwig 123,707 908,126 385,953 784,419
Schrofner, Anton 10,702 460,058 166,444 449,356
Klug, Rainer (since August 1, 2015) 12,749 12,749 0 0
Piske, Dr. Reiner (since November 1, 2015) 3,946 3,946 0 0
Executive Board members in total 434,003 4,894,632 1,859,238 4,460,629

COMBINED MANAGEMENT REPORTCorporate Governance Report
109
of the Executive Board and their surviving dependents amounted to EUR 44,969,123 (2014: EUR 48,674,558).
see chart “Pension obligations for active Executive board members”
PENSION OBLIGATIONS FOR ACTIVE SUPERVISORY
BOARD MEMBERS
The annual shareholders’ meeting of Drägerwerk AG & Co. KGaA has specified the remuneration of members of the Supervisory Board of Drägerwerk AG & Co. KGaA in the articles of association with effect from fiscal year 2011.
see chart “Supervisory board remuneration”
In accordance with Sec. 21 (1) of the articles of association of Drägerwerk AG & Co. KGaA, each Supervisory Board member receives compensation for expenses incurred plus annual remuneration, which is composed of fixed remu-neration of EUR 20,000 (2014: EUR 20,000) and variable
remuneration. The variable component is 0.015 percent of DVA, but no more than EUR 20,000 (as in 2014).
Pursuant to Sec. 21 (2) and (3) of the articles of association of Drägerwerk AG & Co. KGaA, the remuneration of mem-bers of the Supervisory Board is distributed according to the following principles: Its chairman is entitled to three times and the vice chairman to one and a half times the amount. The members of the Audit Committee receive an additional fixed annual remuneration of EUR 10,000 and the Chairman of the Audit Committee an additional EUR 20,000. The members of the Nomination Committee do not receive any additional remuneration. Since fiscal year 2009, the Company no longer pays Supervisory Board members a per diem. The Company concludes a D & O financial loss lia-bility insurance policy, liability insurance policy and a legal expense insurance policy for Supervisory Board members;
SUPERVISORY BOARD REMUNERATION
2015 2014
in € Fixed Variable Other Total Fixed Variable Other Total
Schweickhart, Prof. Dr. Nikolaus (Chairman) 60,000 0 10,000 70,000 60,000 36,720 10,000 106,720
Kasang, Siegfrid (Vice-Chairman) 30,000 0 10,000 40,000 30,000 18,360 10,000 58,360
Fett, Klaus-Dieter 20,000 0 0 20,000 10,000 6,120 0 16,120
Friedrich, Daniel 20,000 0 0 20,000 20,000 12,240 0 32,240
Fürstenberg, Klaus-Dieter 0 0 0 0 10,000 6,120 0 16,120
Grenz, Prof. Dr. Thorsten 20,000 0 20,000 40,000 20,000 12,240 20,000 52,240
Klein, Stefan 20,000 0 0 20,000 20,000 12,240 0 32,240
Lauer, Stefan 20,000 0 0 20,000 20,000 12,240 0 32,240
Lüders, Uwe 20,000 0 0 20,000 20,000 12,240 0 32,240
Rauscher, Prof. Dr. Klaus 20,000 0 10,000 30,000 20,000 12,240 10,000 42,240
Rickers, Thomas 20,000 0 0 20,000 20,000 12,240 0 32,240
Tinnefeld, Ulrike 20,000 0 10,000 30,000 20,000 12,240 10,000 42,240
Zinkann, Dr. Reinhard 20,000 0 0 20,000 20,000 12,240 0 32,240
Total 290,000 0 60,000 350,000 290,000 177,480 60,000 527,480

DRÄGER ANNUAL REPORT 2015110
it is not part of the Supervisory Board’s remuneration. The deductible for Supervisory Board members is one and a half times their fixed annual remuneration.
In fiscal year 2015, the total remuneration of the six mem-bers of the Supervisory Board of the general partner, Drägerwerk Verwaltungs AG, amounted to EUR 135,000 (2014: EUR 135,000) as well as additional flat fees for out-of-pocket expenses totaling EUR 55,000 (2014: EUR 55,000). No remuneration was paid to Supervisory Board members of Group companies.
SHARES OWNED BY THE EXECUTIVE AND
SUPERVISORY BOARDS
As of December 31, 2015, the members of the Executive Board of Drägerwerk Verwaltungs AG and their related parties directly held 6,144 preferred shares in Drägerwerk AG & Co. KGaA, equivalent to less than 0.04 percent of the Company’s total shares, and 114,605 common shares, cor-responding to 0.65 percent of the Company’s total shares.
Dr. Heinrich Dräger GmbH held around 67.19 percent of common shares of Drägerwerk AG & Co. KGaA with 68.31 percent attributable to the Chairman of the Executive Board Stefan Dräger, whereby 67.19 percent are attribut-able to him in accordance with the terms of Sec. 22 (1) Sen-tence 1 No. 1 WpHG (Wertpapierhandelsgesetz – German Securities Trading Act).
As of December 31, 2015, the members of the Supervisory Board and their related parties directly or indirectly held
a total of 916 preferred shares, equivalent to less than 0.01 percent of the Company’s total shares). They did not hold any common shares, either directly or indirectly.
DIRECTORS’ DEALINGS
In fiscal year 2015, the Company was informed about the following business transactions with executive employees pursuant to Sec. 15a WpHG (Wertpapierhandelsgesetz – German Securities Trading Act).
see table “Directors’ Dealings” Announcements of transactions with executive employees pursuant
to Sec. 15a WpHG (Wertpapierhandelsgesetz – German Securities Trading Act) are published at www.dgap.de in the Directors’ Dealings section.
Subsequent events
SUBSEQUENT EVENTS
There were no significant events in the new fiscal year up to the time the management report was prepared.
DISTRIBUTIONS
The general partner and the Supervisory Board of Dräger-werk AG & Co. KGaA, Lübeck, plan to propose to distribute out of the net earnings of Drägerwerk AG & Co. KGaA of EUR 365.976 million for fiscal year 2015 a dividend of EUR 0.13 per common share and EUR 0.19 per preferred share: This equates to a total dividend of EUR 2.765 million. The remaining amount of EUR 363.211 million will be carried forward to new account. The preferred share dividend also governs the dividend for participation certificates, which will amount to EUR 1.90 each – ten times the preferred share dividend.
DIRECTORS’ DEALINGS
Date Name ISIN Units Type Price Volume
July 17, 2015 Prof. Dr. Thorsten Grenz DE0005550602 St. 300 Buy EUR 90.00 EUR 27,000.00
October 14, 2015 Prof. Dr. Thorsten Grenz DE0005550602 St. 300 Buy EUR 61.26 EUR 18,378.00

COMBINED MANAGEMENT REPORTPotential
111
Potential
Risks and opportunities for the future development of the Dräger Group and of Drägerwerk AG & Co. KGaA
RISK AND OPPORTUNITY MANAGEMENT
Our risk and opportunity management system has two aims: to systematically take advantage of opportunities and to identify risks at an early stage and manage them with concrete measures. Dräger intends to utilize this approach to permanently increase the value of the Company.
Dräger regularly updates its risk assessments, especially with regard to developments that could threaten the ex-istence of the Company. Dräger’s opportunity and risk management comprises long-term as well as medium and short-term analysis.
Dräger takes relevant opportunities and risks into consid-eration in its strategic corporate planning. On this basis, and in consideration of Dräger’s strengths and weaknesses, Dräger develops measures focusing on the development of products and the market positioning of these products over the course of their respective life cycles.
IDENTIFYING AND CONSIDERING RISKS
An essential element of Dräger’s risk management is the early identification of potential strategic and operating risks, determining the scope of these risks, and monitor-ing and managing them. The basis of our risk management system is strategic corporate planning: Our risk reporting process is integrated into the planning process and into the financial rolling forecast. We specify potential uncertain-ties in our assumptions at the planning stage and report on both negative (risks) and positive (opportunities, see page xx) deviations from the plan or from the rolling finan-cial forecast. All operating areas of the Company report at least twice a year on risks and opportunities using speci-fied criteria; Group Controlling then summarizes these at Company level. Risk reporting is complemented by ad-hoc
reporting, so that Dräger can act upon material risks as quickly as possible. The risk committee supports the re-sponsible risk owners, usually the departments, in assess-ing and managing risks. The Risk Committee is the link between the Chief Risk Officer and the departments. The members of the Risk Committee possess extensive knowl-edge of the departments and the Company’s risk situation. In addition, the Risk Committee is also tasked with improv-ing the risk management system by monitoring it across all departments. Essentially, risks may not be entered into if they threaten the existence of Dräger, if they could lead to significant damage to Dräger’s reputation, or if the risk is greater than the associated opportunity. In terms of risk recording, EBIT risks are given priority. However, material cash flow risks are also reported on, as are strategic or rep-utation risks, which are difficult to quantify.
Thanks to the exchange of information on risks and op-portunities between the respective process owners, the Executive and Supervisory Boards, action can be taken at short notice. The internal audit department and the Super-visory Board complement risk management and monitor its effectiveness. As an element of our risk management system, our early risk identification system is also part of the annual audit.
Internal control and risk management system in respect of the (Group) accounting process
DEFINITION AND ELEMENTS
The internal control system in the Dräger Group ensures the correctness, reliability and efficiency of the financial re-porting system and that business transactions are recorded completely and promptly and in compliance with Interna-tional Financial Reporting Standards (IFRS). It comprises controls as well as a monitoring system. The Group Con-

DRÄGER ANNUAL REPORT 2015112
trolling and Group Accounting functions of Drägerwerk AG & Co. KGaA are responsible for the internal control system.
Our internal control system provides for both process-in-tegrated and process-independent measures. Process-inte-grated measures include automated and manual process controls (such as a system of checks and balances). In ad-dition, bodies like the Corporate Compliance Committee and specific Group functions like the central tax and Group legal departments ensure process-integrated monitoring. The Supervisory Board of Drägerwerk AG & Co. KGaA, par-ticularly its Audit Committee, and the internal audit depart-ment are also part of the internal monitoring system. The internal audit department also regularly audits our nation-al and international subsidiaries. The auditor of the finan-cial statements performs the audit of the internal control system. The auditor of the Group financial statements also audits the major financial statements of our subsidiaries consolidated in the Group’s results.
The internal control system in the Dräger Group is sup-plemented by a risk management system. It comprises operational risk management and a systematic early-warn-ing system for detecting business risks. In relation to the financial reporting process, risk management is also aimed at ensuring the use of correct information in the Group’s accounts and external reports.
USE OF IT SYSTEMS
At Dräger, the consolidated subsidiaries prepare individual financial statements on the basis of the relevant accounting information. Consolidated subsidiaries mainly use SAP and Microsoft standard software. This ensures that each month, the single entity financial statements and additional, stan-dardized reporting information are consolidated in the SAP SEM-BCS system. For financial reporting, we transfer data from SAP SEM-BCS to the SAP Business Warehouse. To do this, we use a Group-wide, standardized accounts struc-ture, which also stipulates which reconciliation methods
are to be used for the financial statements. Local account-ing methods are adjusted to comply with IFRS either in the local accounting systems or by reporting adjustments on a Group level. Once the data have been translated into the Group currency euro, all internal business transactions are consolidated. Dräger assesses the IT environment, identi-fies potential risks and reports them at least two times a year to the Executive Board within the scope of the risk management system. In addition, the auditors of the Group financial statements carry out an audit of the IT control system, change management, IT operations, access to pro-grams and data, and system development once a year.
ESSENTIAL REGULATORY MEASURES AND CONTROLS
With our internal control system, we check whether amounts reported in the balance sheet, income statement and the statement of comprehensive income are recog-nized in the correct period and fully assigned, and whether the record contains reliable and traceable documentation regarding the business transactions. To do this, we clearly allocate responsibilities and control mechanisms, provide transparent accounting and reporting guidelines, and use highly reliable IT accounting systems in the Group com-panies. The monthly Group financial statements contain comprehensive system validations. They are also checked by Controlling and compared with the plans and the latest financial forecast. The Dräger accounting policies are ap-plied throughout the Group to ensure that all German and foreign subsidiaries consolidated in the Group financial statements use the same standard. These apply to general accounting policies, balance sheet, income statement, con-solidated statement of comprehensive income and notes. The accounting policies are regularly updated to comply with current EU legislation.
Regular alignment meetings and institutionalized report-ing requirements within the Finance function guarantee that Group-wide restructuring and changes are recorded promptly in the Group financial statements. When a new
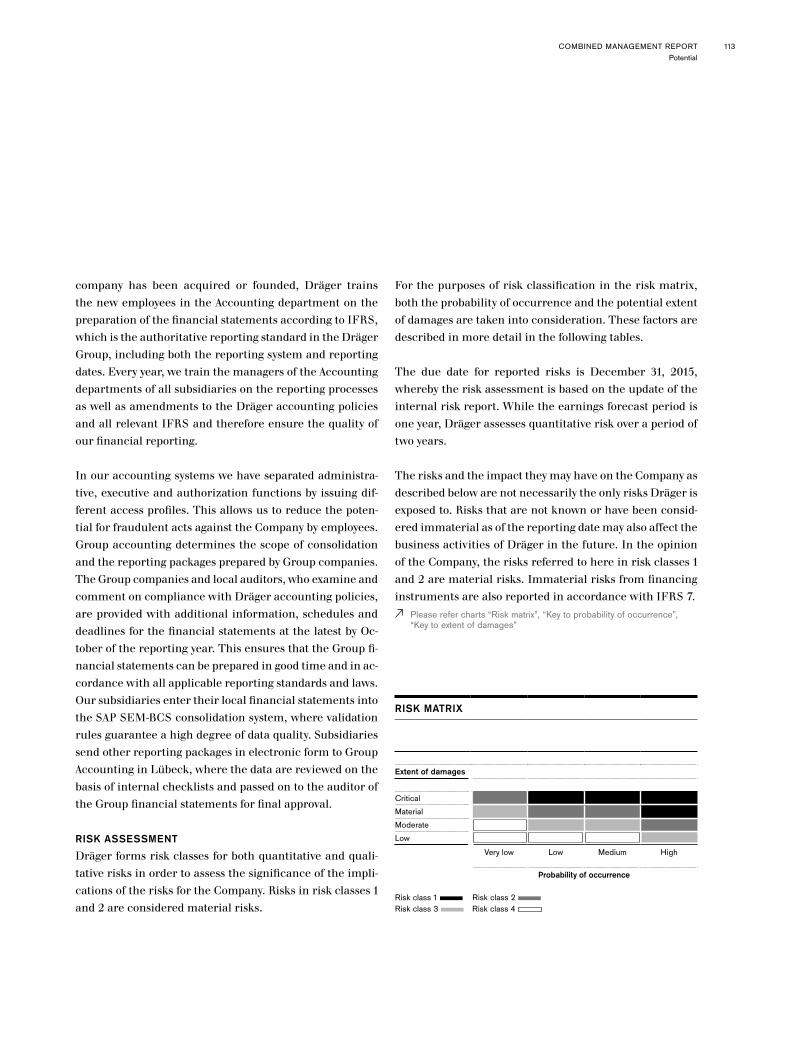
COMBINED MANAGEMENT REPORT 113
company has been acquired or founded, Dräger trains the new employees in the Accounting department on the preparation of the financial statements according to IFRS, which is the authoritative reporting standard in the Dräger Group, including both the reporting system and reporting dates. Every year, we train the managers of the Accounting departments of all subsidiaries on the reporting processes as well as amendments to the Dräger accounting policies and all relevant IFRS and therefore ensure the quality of our financial reporting.
In our accounting systems we have separated administra-tive, executive and authorization functions by issuing dif-ferent access profiles. This allows us to reduce the poten-tial for fraudulent acts against the Company by employees. Group accounting determines the scope of consolidation and the reporting packages prepared by Group companies. The Group companies and local auditors, who examine and comment on compliance with Dräger accounting policies, are provided with additional information, schedules and deadlines for the financial statements at the latest by Oc-tober of the reporting year. This ensures that the Group fi-nancial statements can be prepared in good time and in ac-cordance with all applicable reporting standards and laws. Our subsidiaries enter their local financial statements into the SAP SEM-BCS consolidation system, where validation rules guarantee a high degree of data quality. Subsidiaries send other reporting packages in electronic form to Group Accounting in Lübeck, where the data are reviewed on the basis of internal checklists and passed on to the auditor of the Group financial statements for final approval.
RISK ASSESSMENT
Dräger forms risk classes for both quantitative and quali-tative risks in order to assess the significance of the impli-cations of the risks for the Company. Risks in risk classes 1 and 2 are considered material risks.
For the purposes of risk classification in the risk matrix, both the probability of occurrence and the potential extent of damages are taken into consideration. These factors are described in more detail in the following tables.
The due date for reported risks is December 31, 2015, whereby the risk assessment is based on the update of the internal risk report. While the earnings forecast period is one year, Dräger assesses quantitative risk over a period of two years.
The risks and the impact they may have on the Company as described below are not necessarily the only risks Dräger is exposed to. Risks that are not known or have been consid-ered immaterial as of the reporting date may also affect the business activities of Dräger in the future. In the opinion of the Company, the risks referred to here in risk classes 1 and 2 are material risks. Immaterial risks from financing instruments are also reported in accordance with IFRS 7.
Please refer charts “Risk matrix”, “Key to probability of occurrence”, “Key to extent of damages”
RISK MATRIX
Extent of damages
CriticalMaterialModerate
Low
Very low Low Medium High
Probability of occurrence
Risk class 1 Risk class 2 Risk class 3 Risk class 4
Potential
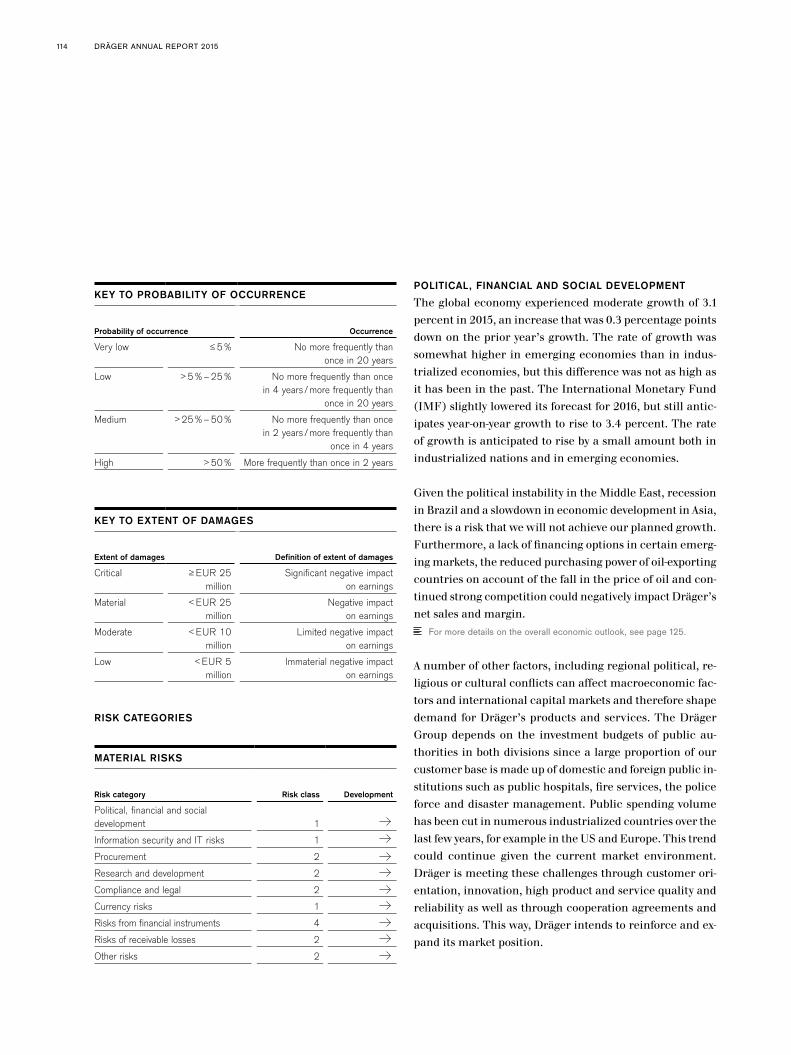
DRÄGER ANNUAL REPORT 2015114
RISK CATEGORIES
POLITICAL, FINANCIAL AND SOCIAL DEVELOPMENT
The global economy experienced moderate growth of 3.1 percent in 2015, an increase that was 0.3 percentage points down on the prior year’s growth. The rate of growth was somewhat higher in emerging economies than in indus-trialized economies, but this difference was not as high as it has been in the past. The International Monetary Fund (IMF) slightly lowered its forecast for 2016, but still antic-ipates year-on-year growth to rise to 3.4 percent. The rate of growth is anticipated to rise by a small amount both in industrialized nations and in emerging economies.
Given the political instability in the Middle East, recession in Brazil and a slowdown in economic development in Asia, there is a risk that we will not achieve our planned growth. Furthermore, a lack of financing options in certain emerg-ing markets, the reduced purchasing power of oil-exporting countries on account of the fall in the price of oil and con-tinued strong competition could negatively impact Dräger’s net sales and margin.
For more details on the overall economic outlook, see page 125.
A number of other factors, including regional political, re-ligious or cultural conflicts can affect macroeconomic fac-tors and international capital markets and therefore shape demand for Dräger’s products and services. The Dräger Group depends on the investment budgets of public au-thorities in both divisions since a large proportion of our customer base is made up of domestic and foreign public in-stitutions such as public hospitals, fire services, the police force and disaster management. Public spending volume has been cut in numerous industrialized countries over the last few years, for example in the US and Europe. This trend could continue given the current market environment. Dräger is meeting these challenges through customer ori-entation, innovation, high product and service quality and reliability as well as through cooperation agreements and acquisitions. This way, Dräger intends to reinforce and ex-pand its market position.
MATERIAL RISKS
Risk category Risk class Development
Political, financial and social development 1
Information security and IT risks 1
Procurement 2
Research and development 2
Compliance and legal 2
Currency risks 1
Risks from financial instruments 4
Risks of receivable losses 2
Other risks 2
KEY TO EXTENT OF DAMAGES
Extent of damages Definition of extent of damages
Critical ≥ EUR 25 million
Significant negative impact on earnings
Material < EUR 25 million
Negative impact on earnings
Moderate < EUR 10 million
Limited negative impact on earnings
Low < EUR 5 million
Immaterial negative impact on earnings
KEY TO PROBABILITY OF OCCURRENCE
Probability of occurrence Occurrence
Very low ≤ 5% No more frequently than once in 20 years
Low
> 5%–25%
No more frequently than once in 4 years /more frequently than
once in 20 years
Medium
> 25%–50%
No more frequently than once in 2 years /more frequently than
once in 4 years
High > 50% More frequently than once in 2 years

COMBINED MANAGEMENT REPORT 115
Over the past few years, the share of net sales attributed to emerging economies has constantly been rising, with Chi-na playing a particularly major role in this trend. However, recently China has recorded falling growth rates. There is a risk that we will not achieve our planned net sales growth there and market momentum will drop off even further. The current fight against corruption in China may also lead to decisions on public sector orders being postponed or or-ders being divided up between different suppliers. What is more, local competition is also increasing. Chinese suppli-ers may therefore be given preferential treatment when it comes to order placement.
Dräger operates in future-oriented industries with strong growth in which it can expect further consolidation pro-cesses that are likely to affect the structure and intensity of competition: Hospitals and other relevant customer groups are being consolidated or forming purchasing cooperatives, thereby pooling purchasing volumes and gaining increased market power. Large, diversified conglomerates among other primary competitors have strong market positions in certain segments and regions due to the wide range of prod-ucts and services they offer. New competitors, particularly from Asia, are also a factor; the quality of their products has increased significantly over the past few years, mean-ing that they are now competing with Dräger in the lower and middle performance and price segment. Therefore, we must enhance our product portfolio, sales channels, and service offering in order to remain successful in these customer segments over the long term. There is a certain amount of risk that, in doing so, we will jeopardize products from higher performance segments (Risk class 1).
INFORMATION SECURITY AND IT RISKS
Information, and the processing of this information, plays a pivotal role in Dräger’s business. Usually, strategic and operative functions and tasks are IT-supported. However, Dräger also processes information in other ways (paper,
meetings). The loss, unavailability or misuse of informa-tion could cause serious problems for Dräger.
As a result, reliable IT systems are a decisive factor in our business processes, as system failure through overloading or external disruption (such as a hacker attack) can im-pair critical processes and lead to short-term production outages.
To enable access to IT systems and system availability for its day-to-day business, Dräger requires a standardized in-frastructure. Devices not managed centrally or subject to regular maintenance can cause security vulnerabilities. That is why Dräger works with network segmentations and uses standardized software worldwide as well as a standard basic installation for notebooks and desktop PCs.
Database security is also important in minimizing IT risks. Read and write authorizations are essential for the security of data relating to customers, production, and suppliers. Against this backdrop, defined workflows are installed to safeguard the central systems and, when necessary, are sys-tematically improved through the use of electronic systems. These improvements are subject to defined standards and are gradually being rolled out across all of our sites (Risk class 1).
PROCUREMENT
Procurement risks at Dräger consist of supplier and mate-rial price risks in particular. For our current and planned product portfolio, we cooperate extensively with reliable and competent suppliers. Dräger integrates suppliers into its processes as the level of vertical integration in its busi-ness model has been reduced to the necessary core tech-nologies and the assembly of purchased parts and compo-nents. Strict quality standards apply to supplier selection and purchasing processes. Dräger has concluded binding price agreements with all of its strategic suppliers, which
Potential
DRÄGER ANNUAL REPORT 2015116
usually apply for a period of one year and guarantee plan-ning security for a certain period of time.
In the case of components and modules that our suppliers stop manufacturing as standard, we will purchase the esti-mated number of components or modules required for the remaining product life cycle and store these components and modules either with Dräger or with the supplier. In our medical division, we analyze potential risks relating to purchased module components across multiple functions. In some cases, Dräger will purchase these from a single supplier. As module components are used in a number of Dräger products, bottlenecks in the supply of these compo-nents can cause production to be interrupted for a certain period of time. In such cases, established crisis manage-ment processes – for example the deployment of a task force – are implemented to minimize the effects. The potential bankruptcy of suppliers can also lead to production outages and additional costs (Risk class 2).
RESEARCH AND DEVELOPMENT
It is important for our profitability that the product port-folios of both divisions are kept up to date. Experience has shown that new products are more profitable than products in a later phase of the product life cycle. This is why Dräger continuously invests in research and development in order to keep the proportion of new products as high as possible. This means that Dräger must develop top technological solutions and also products that appeal to the requirements of a large section of the market. Dräger optimizes its oper-ating processes, from development, sales and order fulfill-ment through to maintenance of the product portfolio. This way, we can produce a high-quality product portfolio. Risks may therefore arise from factors such as the unexpectedly high complexity of development projects, delayed product launches, and changes in market requirements. Quality is-sues with our products can lead to increased costs and loss of net sales in future (Risk class 2).
COMPLIANCE AND LEGAL
Dräger companies are subject to various legal provisions that frequently change in all countries in which Dräger op-erates. Obligations can arise from public law, such as tax law, or from civil law. Laws to protect intellectual property and third-party concessions, varying approval and licensing regulations for products, competition rules, regulations in connection with awarding of contracts, export control reg-ulations and more are also relevant to business operations. Drägerwerk AG & Co. KGaA is also subject to legal regula-tions governing capital markets. The measures Dräger has to take to be aware of, adhere to, and comply with all of these regulations can result in significant operating costs. Dräger’s business policies and code of conduct are intend-ed to ensure that business is conducted responsibly and in accordance with legal requirements. We have also estab-lished a Company-wide compliance program. Despite the control and prevention mechanisms in place in our compli-ance structure, there remains a risk that we are in breach of certain laws. In addition, the increasing connectivity of our devices also raises the issue of data protection and the resulting risk of cyber attacks. Sales partners may assert compensation or equalization claims pursuant to respec-tive applicable laws. Such claims are excluded in the sales agreements to the extent permitted by law.
see Compliance section in the Corporate Governance Report, page 100
Dräger companies are currently involved in legal disputes and may be involved in legal disputes within the scope of their business activities in the future. In exceptional cir-cumstances, assumption of liability can also be advisable when the customer is at fault in order to minimize conse-quential damages for Dräger. To counter such legal risks, Dräger has taken out liability insurance policies with cov-erage, which the Executive Board of the general partner considers appropriate and customary for the industry. In some regions, legal uncertainty could result from Dräger only having limited possibilities to assert its rights.

COMBINED MANAGEMENT REPORT 117
Additional regulatory requirements and rising local stan-dards result in greater expenses for product licensing. Further risks in relation to this arise from the ongoing re-newal of necessary, but time-limited licensing certificates and national adjustments. Furthermore, there is also the possibility that, despite extensive quality management pro-cesses, licensing authorities auditing our products or pro-cesses do not consider the licensing requirements to have been met. In this case, it is possible for licensing authori-ties to revoke the license, impose import bans on certain products or product areas or order installed devices to be changed. Dräger combats risks that arise in line with li-censing requirements by adapting the respective organiza-tional structures and processes in the product and quality management areas (Risk class 2).
CURRENCY RISK
Dräger conducts its business in a variety of currencies whose exchange rates to the euro vary greatly. As a result, Dräger’s payment flows are exposed to corresponding currency risks. In addition, changes in exchange rates when converting earnings not generated in euros into the Group’s operating currency (euro) can have a major impact on Group earnings. Risks develop in particular due to the fact that products are manufactured and sold in different currencies and volumes: Over half of the costs at Dräger are incurred in euros, while a large share of sales is generated in other currencies. The devaluation of the euro in 2012 had a positive impact on earnings, while the sustained in-crease in the euro’s value in 2013 had a negative effect. The years 2014 and 2015 saw different trends: In 2015, the first half of the year brought a positive effect, while the second half of the year was impacted by a negative effect. All in all, the effect in fiscal year 2015 was negative.
Please refer charts “Net sales and costs by currency (2015)”, “Dräger currency basket (weighted according to net sales)”
Currency risks are hedged at Group level, some of which through currency hedges. The hedging strategy is redefined
on an annual basis. Planned, risk-prone net foreign cur-rency liquidity flows from legal units at the start of a fiscal year are hedged by a maximum of 80 percent (Risk class 1).
RISKS FROM FINANCIAL INSTRUMENTS
Our aim is to minimize liquidity risk and risk from finan-cial instruments, i. e. interest rate, currency and credit risk. Dräger hedges liquidity risk, currency risk, and interest risk centrally at Drägerwerk AG & Co. KGaA. We mitigate against credit risk with regard to cash investments and derivatives centrally. Credit risk due to receivables from operating activities is managed partly centrally, partly de-centrally by Group companies and is hedged by instruments such as letters of credit or guarantees.
The only financial derivatives Dräger uses are marketable hedging instruments contracted with reputable banks as counterparties. Members of the Dräger Group may only employ such derivatives if they are covered by the Com-pany’s treasury guidelines or have been approved by the Executive Board.
NET SALES AND COSTS BY CURRENCIES (2015)
in %
Net sales Costs
EUR USD Other
22
17
61
41
13
46
Potential

DRÄGER ANNUAL REPORT 2015118
The Dräger Group uses note loans with various residual terms of up to five years in order to reduce liquidity risk. As of December 31, 2015, we have agreed on bilateral credit lines of EUR 362.5 million due on October 30, 2018 to se-cure liquidity. The framework agreement for the bilateral credit lines stipulates target values based on certain finan-cial covenants. Should Dräger not comply with these, the banks are entitled to terminate the bilateral credit lines. The values have been specified so that we would only run the risk of being unable to meet them if our financial po-sition was to deteriorate drastically. It is also possible for Dräger to obtain the banks’ approval to exceed or undercut these key figures at an early stage. We continuously monitor key financial performance figures.
Dräger is also exposed to interest rate risk, primarily in the eurozone. We combat these risks through a combination of fixed- and variable-rate liabilities. We also hedge against part of the variable interest rates through standard interest hedging products. Dräger only invests cash and cash equiv-
alents over the short-term at commercial banks with high credit ratings.
Dräger manages currency risks associated with currencies other than the euro through forward and swap hedging transactions with selected banking partners, wherein the payment streams are hedged on a transaction-specific ba-sis. Due to the limited and conservative use of financial instruments, these risks are classed as immaterial. Despite the low risk involved, risks from financial instruments are reported in accordance with IFRS 7 (Risk class 4).
Please refer to Note 46 of the notes for more information on the man-agement of financial risks.
RISKS OF RECEIVABLE LOSSES
In principle, Dräger is exposed to a very minor risk of fi-nancial crises, political upheaval or other events leading to large-scale receivable losses or defaults on payments. Specifically, such a risk of receivable losses currently exists in relation to our business activities in Saudi Arabia (Risk class 2).
DEVELOPMENT OF THE SALES-WEIGHTED CURRENCY BASKET
Index: Jan. 2010 = 1.0 Dräger currency basket end of period Dräger currency basket average 12 months
1.02
1.00
0.98
0.96
0.94
0.92
Dec. 2010 Jun. 2011 Dec. 2011 Jun. 2012 Dec. 2012 Jun. 2013 Dec. 2013 Jun. 2014 Dec. 2014 Jun. 2015 Dec. 2015

COMBINED MANAGEMENT REPORT 119
OTHER RISKS
The positive reputation of our brand is extremely import-ant for the trust of our stakeholders, particularly our cus-tomers, in the Company and our products. Damage to our reputation could have long-term negative implications for the success of the business. Customers, business partners, employees and other stakeholders share information and experiences on an increasing number of channels. This also increases the risk of negative information spreading more quickly and damaging our reputation. We have set up an early warning system and introduced a communications policy in order to minimize this risk. By doing so, we want to counteract any potential damage to our reputation prompt-ly and respond to criticism in a coordinated manner.
Recognizing opportunities
We observe opportunities within the scope of our strategic planning process, which involves identifying trends, deter-mining strategic focuses, and defining measures. Dräger makes use of its so-called sales funnel, an overview of all potential orders, for the purpose of systematically pursu-ing medium- and short-term market opportunities and turning as many of them as possible into customer orders. The potential use of these opportunities also flows into our rolling financial forecast. Furthermore, we also established an integrated risk reporting process this year, in which the functional areas report on both risks and opportunities. Information on opportunities is integrated into the consol-idated risk report.
see also the “Group structure and control system” section on page 58 et seq.
ACTIVITIES IN GROWTH MARKETS
The medical and safety markets in which Dräger operates are growth markets. Megatrends such as globalization, health, and the ever-expanding digital network foster this growth. For example, business opportunities arise from an
increasing and aging population, the expansion of health infrastructure in emerging markets, increasing safety stan-dards, and the growing importance of system solutions. Making targeted use of the Company’s strengths allows Dräger to take advantage of opportunities. For example, Dräger uses the basis of installed Dräger equipment in order to expand its service and accessories business. And thanks to our high innovation intensity, we are able to con-tinuously optimize our range of products.
see also the “Trends with an influence on business performance” section on page 65 et seq.
– Increasing and aging population: Increasing life expec-tancy and structural changes are causing rising demand for medical products not just in many industrialized countries, but also in a number of emerging markets. Population growth in many countries all over the world is also boosting demand for medical care.
– Growing affluence in emerging markets: Increasing incomes in emerging markets are coupled with higher standards of healthcare and workplace safety. Dräger’s broad range of products in corresponding segments and our presence in respective markets means that it is well positioned to take advantage of this opportunity.
– Growing importance of system business: The increasing extent of digital networking is raising the standards in the medical and safety markets. Networked equipment and IT systems in hospitals provide support to medical processes and administrative processes alike. Secure, real-time data transfer to IT systems is also becoming in-creasingly important in safety markets.
HIGH MARKET ENTRY BARRIERS FOR COMPETITORS
The medical technology and safety technology markets both feature high market entry barriers: current and future approval requirements through government regulation, complex and often patented technologies, as well as the fact that many customers continue to prefer to implement tried and tested solutions. As an established provider, these barriers represent an opportunity for Dräger.
Potential

DRÄGER ANNUAL REPORT 2015120
LEADING MARKET POSITIONS
Dräger considers itself one of the global market leaders in many market segments and product groups of its two divisions. We see opportunities for the continued growth of our market share by building on its extensive techno-logical expertise, high product quality, brand awareness and long-term customer relationships. Alongside our estab-lished market segments, we focus in this respect not only on attractive market segments, but also on niches where the Company identifies above-average profitability and growth opportunities. We also strive to open up new markets by developing new products.
EXPANSION OF THE SERVICE AND
ACCESSORIES BUSINESS
We are striving to increase the share of net sales we gener-ate in the stable and attractive service and accessories busi-ness. In order to achieve this goal, we continue to improve customer support following equipment sales by offering services and products in the accessories and consumables business. Here, both of our divisions benefit from the large number of Dräger devices already in use around the world.
PROJECT BUSINESS
In the hospital business, an increasing number of oppor-tunities are emerging from so-called turnkey projects, in which finished hospitals or hospital departments are re-alized together with all medical equipment. As a supplier of important medical devices, systems and components, Dräger can participate in this development in selected countries in conjunction with its turnkey partners.
As a global project player in the industrial business, we have a great number of opportunities to become involved in major oil and gas, chemical, and mining projects and, in doing so, secure the framework for sustained, positive business development. Investments aimed at expanding gas and oil capacities running into the billions of euros are currently at the implementation or planning stage,
particularly in the Middle East. This is set to result in a rise in demand for safety technology products. We also see opportunities to acquire new projects concerning the con-struction of training facilities for fire and rescue services all over the world.
CHANGES TO THE PRODUCT PORTFOLIO
Changes to the product portfolio come with both risks and rewards. We want to increase the number of new products in our product portfolio and thus increase our profitability. At the same time, we are working towards the optimization of our product portfolio in order to meet demand, particu-larly from emerging markets.
SYNERGY EFFECTS AND PLATFORM STRATEGY
Opportunities also arise from synergy effects between our medical and safety divisions. We can take particular advan-tage of synergies at our sales and service companies, for ex-ample by consolidating administrative functions. Further-more, by pooling demand, we can achieve more favorable procurement conditions in common purchasing for fleet or travel management in Europe.
We are also striving to reduce material costs through our platform strategy, which refers to the use of common components in different models. Dräger takes subsequent manufacturing costs into account as early as the product development phase.
2015 saw further enhancements to our standardized sys-tem infrastructure in customer relationship management (CRM). The performance of service orders in the first companies to utilize CRM is now supported, strengthen-ing the link between marketing, sales and service in terms of a comprehensive customer management system. In ad-dition, the first steps were taken to include customer and partner management from the indirect sales channel in the CRM, too. As a result, companies can now access more in-formation on successful customer contact, customer acqui-

COMBINED MANAGEMENT REPORT 121
SWOT ANALYSIS – DRÄGER GROUP
Company-specific
Strengths Weaknesses
– Strong brand and long-term customer relationships
– Established presence in important growth markets in Asia, Central America and South America
– High installed device basis in many markets
– High innovation intensity (R&D ratio)
– Detailed understanding of all relevant markets and competitors
– Strong direct sales model with close-knit sales network
– Solid, long-term financing framework and good equity base
– Stable ownership structure
– Wealth of experience with complex product and service offerings
– High degree of diversification with some unused growth potential
– Wide range of products and services
– Close cooperation with suppliers, some joint development activities
– Strong reliance on the European market; some market-leading positions in markets where growth is slow
– Niche provider status in some segments
– High complexity through broad product portfolio
– High cost base in euros and disproportionately high US dollar cost position
– Partial dependency on sales partners
– Low diversification of products for economic buyers
Market /sector-specific
Opportunities Risks
– Progress in medical industry and aging society driving forward expenditure on medical technology
– Expansion of healthcare systems in emerging markets (as a result of increasing incomes)
– Continual increase in safety requirements for employees at hazardous workplaces
– Broadness of product portfolio and operating markets reduces the effects of economic fluctuations
– High market entry barriers for new competitors as a result of regulation, technology, patent protection
– Declining rates of economic growth in Asia and a trend towards the purchasing of medical technology equipment from domestic producers in China
– Economic risks from the financial crisis in various emerging economies
– Increasing complexity and requirements for local licensing and the ongoing certification of products
– Central purchasing strategy and increased purchasing power of companies operating worldwide
– Restrictions on domestic budgets and trend towards public companies forming purchasing cooperatives
– Some reliance on key suppliers
– Information security and IT risks
– Foreign currency losses due to exchange rate fluctuations
– Pressure on margins from increasing local competition
The aim of the SWOT analysis is to provide an overview of important aspects in the strategic environment. Not all risks and opportunities referred to in the report are includ-ed in the SWOT analysis. The manner in which the issues are listed does not represent any kind of weighting; related issues are simply listed together.
Potential
DRÄGER ANNUAL REPORT 2015122
sition and customer service beyond national and functional boundaries from a single source.
DEVELOPMENT OF THE MACROECONOMIC SITUATION
AND EXCHANGE RATES
Macroeconomic development and fluctuating exchange rates can bring both risks and rewards. Associated risks are presented on page 117 et seq.. The positive development of the described factors can also result in opportunities. For example, business in Iran could benefit from the lifting of trading sanctions.
OVERALL ASSESSMENT OF RISKS AND OPPORTUNITIES
Overall, risks resulting from economic and political devel-opments in some regions, currency risks and regulatory risks are the most significant elements in Dräger’s risk port-folio. However, Dräger mitigates these risks both through the regional spread and the diversification of the product and service offerings. Risks linked with information securi-ty have also increased steadily in importance over the years. We also limit performance risks from the completion of orders through good diversification strategies.
In total, the risks the Dräger Group is exposed to are man-ageable; the existence of the Company as a going concern is not at risk on the basis of known factors.
In Dräger’s view, the number of opportunities outweighs the number of risks, especially the opportunities resulting from demographic changes, developments in emerging markets and the increasing importance of system business. As a result, the outlook for the future is optimistic.
Please refer chart “SWOT analysis – Dräger Group”
Disclosures pursuant to Secs. 298 (4) and 315 (4) of the German Commercial Code (HGB) and explanations of the general partner
The following disclosures reflect circumstances on the bal-ance sheet date.
COMPOSITION OF CAPITAL STOCK
The subscribed capital of Drägerwerk AG & Co. KGaA amounts to EUR 45,465,600. It consists of 10,160,000 vot-ing bearer common shares and 7,600,000 non-voting bearer preferred shares, each with a EUR 2.56 share in capital stock. Shares of the same type carry the same rights and ob-ligations. The rights and obligations of the shareholders are laid down in the German Stock Corporation Act, in particu-lar in Secs. 12, 53a et seq., 118 et seq. and 186 AktG, as well as in the articles of association of the Company. As com-pensation for the lack of voting rights, an advance dividend of EUR 0.13 per preferred share is distributed from net earnings. If sufficient net earnings are available, a dividend of EUR 0.13 per common share is then paid. Any profit in excess of this amount, if distributed, is allocated so that pre-ferred shareholders receive EUR 0.06 more than common shareholders. If the net earnings are not sufficient for an advance dividend for preferred shares in one or more years, the amounts are paid from the net earnings of subsequent fiscal years before a dividend is paid on common shares. If amounts in arrears are not paid in the next year along with the full preferred dividend for that year, the preferred shareholders have voting rights until the arrears have been paid. In the event of liquidation, the preferred shareholders receive 25 percent of net liquidation proceeds in advance. The remaining liquidation proceeds are distributed evenly among all shares.

COMBINED MANAGEMENT REPORT 123
RESTRICTIONS RELATING TO VOTING RIGHTS OR
THE TRANSFER OF SHARES
The legal structures of Dr. Heinrich Dräger GmbH mean that neither Stefan Dräger nor Stefan Dräger GmbH, which he controls, have any influence on the exercise of the voting rights of those common shares held by Dr. Heinrich Dräger GmbH in terms of the annual shareholders’ meeting of Drägerwerk AG & Co. KGaA passing resolutions on agenda items within the meaning of Sec. 285 (1) Sentence 2 AktG. There are no further restrictions that relate to voting rights or the transfer of shares, even though they could arise from agreements between shareholders.
DIRECT OR INDIRECT SHAREHOLDINGS
EXCEEDING 10 PERCENT
67.19 percent of the common shares of Drägerwerk AG & Co. KGaA, equivalent to 6,826,000 common shares or 38.43 percent of the total capital stock, belong to Dr. Heinrich Dräger GmbH, Lübeck. Its shares are mainly owned by members and shareholders of the Dräger family, so that the voting rights associated with the common shares are held by the Dräger family. 59.23 percent of Dr. Heinrich Dräger GmbH, Lübeck, is held by Stefan Dräger GmbH. Stefan Dräger GmbH is wholly owned by Stefan Dräger, Lü-beck. The voting rights of Stefan Dräger GmbH are to be allocated to its partner, Stefan Dräger, pursuant to Sec. 22 of the German Securities Trading Act (WpHG). Through Stefan Dräger GmbH, Stefan Dräger also holds all shares in Drägerwerk Verwaltungs AG, Lübeck, the general part-ner of Drägerwerk AG & Co. KGaA. This means that Stefan Dräger is a shareholder for the general partner as well as common shareholder of Drägerwerk AG & Co. KGaA. In cases covered by Sec. 285 (1) Sentence 2 AktG, he would therefore not be entitled to vote. The legal structure of Dr. Heinrich Dräger GmbH ensures that, for such resolutions, Stefan Dräger cannot exert any influence on the exercise of the voting rights of common shares held by Dr. Heinrich Dräger GmbH.
SHARES WITH SPECIAL RIGHTS CONFERRING CONTROL
There are no shares with special rights conferring control or special controls over voting rights.
NATURE OF CONTROL OVER VOTING RIGHTS BY
EMPLOYEE SHAREHOLDERS WHO DO NOT DIRECTLY
EXERCISE THEIR CONTROL RIGHTS
Employees of the Company or the Dräger Group can pur-chase common shares in the Company with voting rights on the stock exchange. They can directly exercise the control rights to which they are entitled through the ownership of common shares with voting rights like other shareholders, subject to the applicable legal regulations and the provi-sions of the articles of association.
APPOINTMENT AND REMOVAL OF MANAGEMENT AND
AMENDMENTS TO THE ARTICLES OF ASSOCIATION
In the legal form of a partnership limited by shares (KGaA), the general partner is authorized to manage and repre-sent the Company, a regulation derived from partnership law. Drägerwerk Verwaltungs AG is the general partner of Drägerwerk AG & Co. KGaA, and acts through its Execu-tive Board. The Supervisory Board of Drägerwerk AG & Co. KGaA, which has half of its members elected by employees, is not authorized to appoint or remove the general partner or its Executive Board. The general partner joined the Com-pany with a corresponding declaration; it withdraws from the Company in the cases defined under Article 14 (1) of the articles of association.
The general partner’s Executive Board, which is authorized to manage and represent Drägerwerk AG & Co. KGaA, is appointed and removed pursuant to Secs. 84 and 85 AktG and Art. 8 of the articles of incorporation and bylaws of Drägerwerk Verwaltungs AG. The Executive Board of the general partner comprises at least two persons, the Super-visory Board of the general partner determines how many other members there are. The Supervisory Board of the general partner, elected by its annual shareholders’ meet-
Potential

DRÄGER ANNUAL REPORT 2015124
ing, is responsible for appointing and removing members of the Executive Board. It appoints members of the Executive Board for a maximum of five years. Repeat appointments or extensions of the term of office are permissible.
The Supervisory Board of Drägerwerk AG & Co. KGaA is not authorized to adopt rules of procedure for management or to define a catalog of management transactions requiring approval. The Joint Committee – comprising four members of each of the Supervisory Boards of the Company and its general partner – and not the annual shareholders’ meet-ing, decides on the management transactions that require approval as set out in Article 23 (2) of the articles of associ-ation of Drägerwerk AG & Co. KGaA. The Supervisory Board of Drägerwerk AG & Co. KGaA represents the Company in dealings with the general partner.
Pursuant to Secs. 133, 179 AktG, amendments to the articles of association must be approved by the annual sharehold-ers’ meeting. Such resolution requires a majority of at least three quarters of the capital stock represented at the time of the vote. The articles of association may stipulate a differ-ent majority of capital stock, but for changes in the purpose of the Company this can only be a majority of more than three quarters of capital (Sec. 179 [2] Sentence 2 AktG). At Drägerwerk AG & Co. KGaA, pursuant to Art. 30 (3) of the articles of association, resolutions by the annual share-holders’ meeting are adopted by a simple majority of votes cast (simple voting majority) if this does not conflict with any legal provisions and, if the law additionally requires a majority of capital, by a simple majority of the capital stock represented upon adoption of the resolution (simple capital majority). The Company has not made use of the possibility pursuant to Sec. 179 (2) Sentence 3 AktG to set further re-quirements in the articles of association for amendments to the same agreement. In addition to the relevant majority of limited shareholders, amendments to the articles of as-sociation also require the approval of the general partner (Sec. 285 [2] AktG). Pursuant to Article 20 (7) of the articles
of association of the Company, the Supervisory Board is au-thorized to make amendments and additions to the articles of association which relate only to its wording.
POWER OF THE GENERAL PARTNER TO ISSUE
OR BUY BACK SHARES
By resolution of May 7, 2010, the annual shareholders’ meet-ing conditionally increased the Company’s capital stock by up to EUR 3,200,000 with the aim of issuing up to 1,250,000 new no-par preferred bearer shares (no-par shares) in re-turn for cash and/or contributions in kind (conditional capital, Article 6 [5] of the articles of association). The cap-ital stock will only be conditionally increased to the extent that applicable option rights are exercised. Dräger issued warrant bonds with option rights guaranteed in the form of warrants on account of the resolution on the authori-zation and instruction passed by the annual shareholders’ meeting on May 7, 2010 regarding agenda point 7a). In the fiscal year, ten options were exercised, after which 500,000 new no-par preferred shares (no-par shares) were issued from authorized capital. Thus, of the initial 25 options, all were exercised.
In accordance with the resolution agreed upon at the annu-al shareholders’ meeting on May 6, 2011, the general part-ner is entitled to increase the Company’s capital until May 5, 2016, with the approval of the Supervisory Board, by up to EUR 21,132,800.00 (approved capital) by issuing new bearer common and/or preferred shares (no-par value shares) in return for cash and/or contributions in kind, in either one or several tranches. The authorization includes the approv-al to issue new common shares and/or preferred shares, which carry the same status as the previously issued pre-ferred shares with regard to the distribution of profits and/or Company assets. The statutory maximum as stipulated in Sec. 139 (2) AktG is to be taken into account: No more than half of the capital stock may be issued as preferred shares. Shareholders are principally given a subscription right in the case of a capital increase – unless the Company

COMBINED MANAGEMENT REPORT 125
excludes subscription rights with the approval of the Super-visory Board. In the case of common and preferred shares being issued together, the right of holders of one share type to subscribe to the other type of shares (“crossed exclusion of subscription rights”) can be excluded.
In accordance with the resolution agreed upon at the an-nual shareholders’ meeting on May 4, 2012, the general partner is entitled, until May 3, 2017 and upon consent of the Supervisory Board, to acquire up to 10 percent in own shares of both types (common and/or preferred shares) and to use them for all legal purposes. The Company uti-lized this entitlement as part of its employee share pro-gram.
MATERIAL ARRANGEMENTS MADE BY THE COMPANY
SUBJECT TO A CHANGE OF CONTROL IN THE WAKE OF
A TAKEOVER BID
The Company has not made any material arrangements subject to a change of control in the wake of a takeover bid.
COMPENSATION AGREEMENTS MADE BY THE COMPANY
WITH MEMBERS OF THE EXECUTIVE BOARD OF THE
GENERAL PARTNER OR EMPLOYEES IN THE EVENT OF
A TAKEOVER BID
There are no compensation agreements in place in the Dräger Group with members of the Executive Board of the general partner or employees in the event of a takeover bid.
Outlook
FUTURE MARKET ENVIRONMENT
The International Monetary Fund (IMF) corrected its glob-al economic forecast for the third time in twelve months in mid-January. It expects total growth in 2015 to only stand at 3.1 percent, 0.3 percentage points lower than in the prior year. For 2016 and 2017, the IMF anticipates growth rates
of 3.4 and 3.6 percent respectively, 0.2 percentage points down on the previous forecast from October 2015.
Economic growth in emerging economies fell to a new low for the fifth year in succession in 2015, while industrialized nations continued their moderate improvement in growth momentum. This is also due to the slight increase in eco-nomic recovery in the eurozone. Here, the IMF expects growth of 1.7 percent in 2016 and 2017. Growth forecasts were raised slightly, particularly for Germany, but recently lowered for the US. Emerging economies account for over two-thirds of global economic growth, but the IMF only ex-pects moderate growth increases here. Of the major emerg-ing economies, only India is experiencing dynamic growth. The Chinese economy continues to lose momentum and recorded its lowest growth rate in 25 years in 2015. Brazil and Russia are currently in the midst of a recession. In addition, weak development in oil-exporting countries due to the slump in oil prices is also contributing to sluggish growth.
According to the IMF, the risks for the global economy have increased further over the past few months. There are cur-rently three major sources of uncertainty: the slowdown of the Chinese economy and its transformation from an export- and investment-driven growth to a more consumer- and service provision-based economy; the decline in energy prices and the prices of other commodities; the gradual departure from expansive monetary policy and the first in-terest rate hikes in the US. If the world economy is unable to rise to these challenges, the IMF believes that global growth could be under threat.
see table “IMF – January 2016 Gross domestic product (Gdp) growth forecast”
Potential

DRÄGER ANNUAL REPORT 2015126
FUTURE SITUATION OF THE SAFETY
TECHNOLOGY INDUSTRY
We anticipate slightly positive development of the safety technology industry in 2016 overall. We consider the growth outlook in the US to be stable but low. The low price of oil is an important factor when it comes to economic develop-ment and therefore also for the safety technology industry. Although it is an important driver of growth in the chemi-cal industry, the oil and gas sector is suffering against the backdrop of the low prices. As a result, the US chemical industry is on course for growth; the American Chemistry Council (ACC) expects production to increase by 4 percent in 2016. However, this growth will be offset by a decline in investments in safety technology in the oil and gas indus-try. In our opinion, sales opportunities in emerging econ-omies are moderate. We believe that economic growth in emerging economies, particularly China, will experience a further slowdown in 2016, meaning that demand for safety products will also decline – despite rising health and safety standards. We expect there to be a slight rise in investment in safety technology products in the European market. All in all, we anticipate economic development in South Eu-rope to recover and North Europe to experience an increase in growth momentum. The situation in South America con-tinues to be determined by the development of the region’s two largest economies, Brazil and Mexico. Investment in
According to the Deutsche Bundesbank, economic growth in Germany is currently being driven by high domestic demand, while export business is suffering from weak de-mand from emerging economies. However, the economic situation in Germany is likely to improve when the antici-pated recovery materializes in sales markets outside of the eurozone and eurozone growth increases. For 2016 and 2017, the Deutsche Bundesbank forecasts growth of 1.8 percent and 1.7 percent respectively.
FUTURE SITUATION OF THE MEDICAL
TECHNOLOGY INDUSTRY
We only expect the medical technology industry to experi-ence marginally positive growth in 2016. In spite of sluggish macroeconomic development, industry growth in emerg-ing economies is expected to be moderate due to the estab-lishment and modernization of healthcare systems in these states. We regard the demand trend in North America as positive. Even though pressure to cut costs in the health-care industry will remain high in 2016, rising demand on account of long-term trends such as an increasing and ag-ing population and the spread of “lifestyle diseases” will overcompensate these effects. The growth outlook for the European medical technology market is cautious in our view. Growth momentum in 2016 is also largely dependent on the implementation of the European medicinal product directive. In spite of sluggish macroeconomic development, industry growth in emerging economies is expected to be moderate due to the establishment and modernization of healthcare systems in these states. Market growth in China is once again likely to be focused on the mid-market seg-ment. We continue to regard business in Russia as difficult. In Latin America, we expect a slight increase in growth in the medical technology industry due to a need to mod-ernize and replace equipment as this industry is likely to remain largely unaffected by the general economic slow-down in the region. The medical technology industry in the Middle East is likely to experience moderate growth.
IMF – JANUARY 2016 GROSS DOMESTIC PRODUCT (GDP) GROWTH FORECAST
in % 2015 2016 2017
Global economy 3.1 3.4 3.6
USA 2.5 2.6 2.6
Eurozone 1.5 1.7 1.7
Germany 1.5 1.7 1.7
Emerging economies 4.0 4.3 4.7
China 6.9 6.3 6.0
Source: International Monetary Fund (IMF)
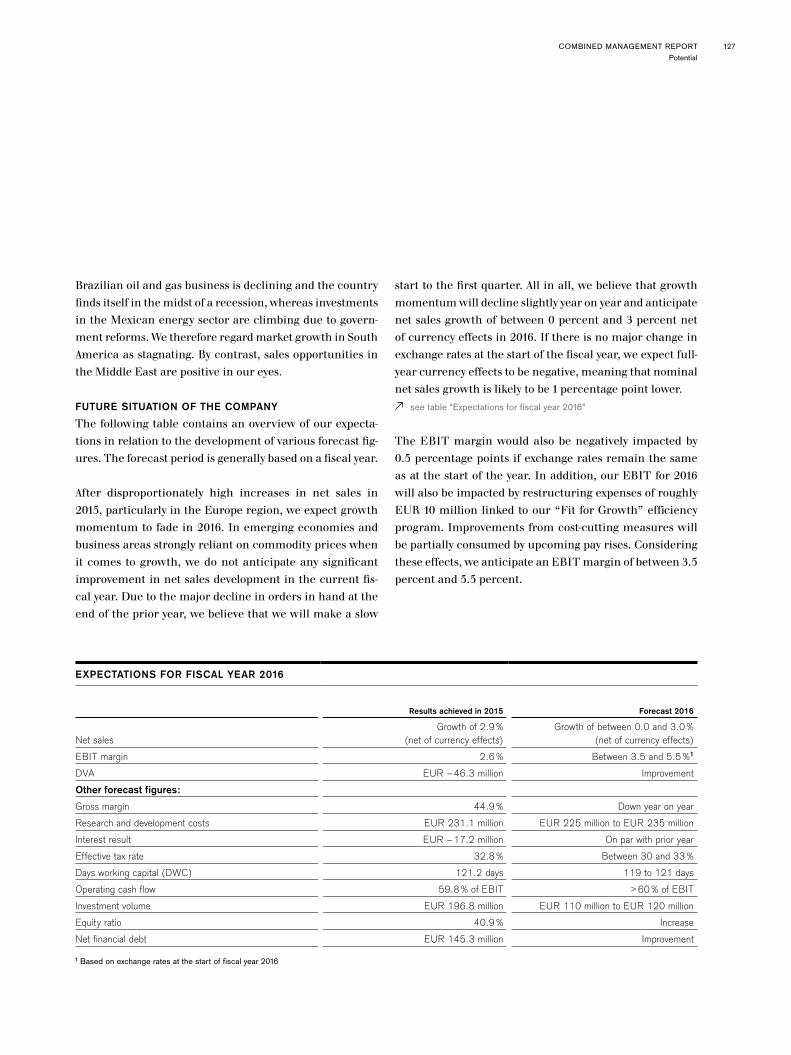
COMBINED MANAGEMENT REPORT 127
Brazilian oil and gas business is declining and the country finds itself in the midst of a recession, whereas investments in the Mexican energy sector are climbing due to govern-ment reforms. We therefore regard market growth in South America as stagnating. By contrast, sales opportunities in the Middle East are positive in our eyes.
FUTURE SITUATION OF THE COMPANY
The following table contains an overview of our expecta-tions in relation to the development of various forecast fig-ures. The forecast period is generally based on a fiscal year.
After disproportionately high increases in net sales in 2015, particularly in the Europe region, we expect growth momentum to fade in 2016. In emerging economies and business areas strongly reliant on commodity prices when it comes to growth, we do not anticipate any significant improvement in net sales development in the current fis-cal year. Due to the major decline in orders in hand at the end of the prior year, we believe that we will make a slow
start to the first quarter. All in all, we believe that growth momentum will decline slightly year on year and anticipate net sales growth of between 0 percent and 3 percent net of currency effects in 2016. If there is no major change in exchange rates at the start of the fiscal year, we expect full-year currency effects to be negative, meaning that nominal net sales growth is likely to be 1 percentage point lower.
see table “Expectations for fiscal year 2016”
The EBIT margin would also be negatively impacted by 0.5 percentage points if exchange rates remain the same as at the start of the year. In addition, our EBIT for 2016 will also be impacted by restructuring expenses of roughly EUR 10 million linked to our “Fit for Growth” efficiency program. Improvements from cost-cutting measures will be partially consumed by upcoming pay rises. Considering these effects, we anticipate an EBIT margin of between 3.5 percent and 5.5 percent.
EXPECTATIONS FOR FISCAL YEAR 2016
Results achieved in 2015 Forecast 2016
Net salesGrowth of 2.9%
(net of currency effects)Growth of between 0.0 and 3.0%
(net of currency effects)
EBIT margin 2.6% Between 3.5 and 5.5%1
DVA EUR –46.3 million Improvement
Other forecast figures:
Gross margin 44.9% Down year on year
Research and development costs EUR 231.1 million EUR 225 million to EUR 235 million
Interest result EUR –17.2 million On par with prior year
Effective tax rate 32.8% Between 30 and 33%
Days working capital (DWC) 121.2 days 119 to 121 days
Operating cash flow 59.8% of EBIT > 60% of EBIT
Investment volume EUR 196.8 million EUR 110 million to EUR 120 million
Equity ratio 40.9% Increase
Net financial debt EUR 145.3 million Improvement
1 Based on exchange rates at the start of fiscal year 2016
Potential
DRÄGER ANNUAL REPORT 2015128
We expect there to be a major improvement in Dräger Value Added (DVA) in fiscal year 2016, primarily on the basis of the improvement in EBIT.
We believe that our gross margin in 2016 will be slightly down on the prior-year level. Measures to boost margins from the efficiency program are only likely to partially com-pensate for the negative effect on our margins, the ongoing price and competitive pressure as well as the change of the product mix.
We will continue to invest in the future sustainability of our Company in 2016. Our research and development costs are likely to remain on a par with the prior-year figure. We plan to launch a total of nine new products or upgrades in the medical division and 14 new products or upgrades in the safety division.
Our interest result is set to remain stable year on year, assum-ing interest rates remain unchanged. We expect a tax rate of between 30 percent and 33 percent for fiscal year 2016.
We have taken a range of measures to make the use of cur-rent assets more efficient. Besides optimizing our inven-tories, we also intend to improve our receivables manage-ment further. We anticipate a slight improvement in days working capital in the range of 119 to 121 days in 2016.
We anticipate cash inflow of over 60 percent of EBIT in fiscal year 2016. This is due to the expected improvements in earnings and the further optimization of net financial current assets.
Investment volume is likely to be lower in 2016 than in the prior year. Total investment volume will continue exceed depreciation and amortization and stand at between EUR 110 million and EUR 120 million.
We expect the equity ratio to rise on the back of expected earnings development, the planned retention of most of 2015 profits and only a slight rise in total assets.
In spite of anticipated investment volume, we expect a fur-ther improvement in net financial debt thanks to an im-provement in cash inflow from operating activities.
“FIT FOR GROWTH” EFFICIENCY PROGRAM
Already in 2014 we launched our efficiency program “Fit for Growth” comprising a wide range of measures to boost com-petitiveness and productivity in the next few years. Given the unsatisfactory cost and earnings trend in fiscal year 2015, we have decided to intensify the “Fit for Growth” program and add short- to medium-term cost-cutting measures.
We have pooled together the efficiency measures in three programs: SHAPE, FIT! and Global Footprint. Each pro-gram focuses on a particular issue.
– SHAPE: Functional process and structures, supplement-ed with restructuring measures
– FIT!: Innovation and “time to market” – Global Footprint: Optimization of production and R & D
sites
SHAPE
The SHAPE program involves reviewing and enhancing our worldwide structures and processes in sales, marketing and administration with a clear focus on our customers.
Cost-cutting targets have been set for 2016 and 2017 for the headquarters in Lübeck and foreign subsidiaries. Aside from reducing personnel expenses, we also intend to achieve these targets by reducing material expenses. For instance we are reviewing our expenses for external ser-vice providers as well as travel expenses and costs for trade fair attendance. Alongside these indirect areas, we are also cooperating intensively with our suppliers to reduce direct

COMBINED MANAGEMENT REPORT 129
production costs. At the moment the country organizations are working on underpinning their targets with detailed measures. This will likely result in a reduction in the head-count at foreign subsidiaries by a total of roughly 150 jobs. In Lübeck, we plan to reduce the number of employees by an additional 200 by the end of fiscal year 2016. Only part of this amount will be able to achieve via natural employee turnover. Our aim is to organize redundancies in a manner as socially acceptable as possible and through mutual con-sent. As a result, we are offering a “volunteer redundancy program” at the Lübeck site, which comprises an attrac-tive severance package and support in seeking new career opportunities. The program runs from February 1 to the end of April 2016 and is based on mutual consent, in other words on both the employer and employee agreeing to ter-mination. The offer can be declined by either side without having to give a reason. We will assess the results of the program once it has been concluded. If the targeted num-ber of redundancies is not achieved, further measures such as terminations for operating reasons would be considered.
In the medium term we will be making our structures and processes leaner and more efficient. In this context, we will be transferring operative responsibility from the head-quarters to the operating units responsible for customers in their respective regions. We want to eliminate complex administrative processes in doing so. The first decisions on the new organization have already been made:
Besides changes in Executive Board responsibilities to strengthen the market and customer focus across the whole Company, the organizational structure in the countries and regions will also be realigned by the end of the first quarter. Below the regional board members, there are six regions each managed by a “Regional CEO”. The countries will be managed by an overall “Managing Director” in the future. This ensures a clear, cross-function allocation of responsi-bilities for activities in a country or region, guaranteeing distinct and quick decision-making.
By restructuring our organization, we intend to create more transparency and boost commitment when it comes to mar-ket, business and process responsibility.
FIT!
The standards of our technology and product developments are constantly rising against the backdrop of dynamically changing markets and increasing regulation. The primary aim of our “FIT!” program is to reduce time to market – in other words, to bring the customer benefit onto the market more quickly. The program covers all phases of the product lifecycle, from the product idea or customer request to its development and successful market launch. The successful implementation of this program is also being complement-ed by the restructuring of research and development, which we carried out in the prior year. The strategic realignment goes even further with the “Faster. Connected. Innovative” mission, which pushes the interconnectedness of our ap-plications and our innovation organization both internal-ly and externally and, in doing so, boosts innovation. The resulting solutions also make a significant contribution to customer satisfaction.
GLOBAL FOOTPRINT
In the “Global Footprint” program, we continually review our range of sites worldwide with the aim of optimizing the site structure to accelerate the flow of materials and therefore increase our supply capability while reducing production costs. At our Lübeck site, we have invested in a more efficient production and logistics structure within the scope of our “factory of the future” project over the past two years. In mid-2016, production in the medical division will start to operate at the “factory of the future” at the Revalstraße site. The “factory of the future” is set to be fully operational by 2017. In addition, labor-intensive production processes in the area of masks and protective suits will be moved from Lübeck to our site in Klášterec in the Czech Republic in the first half of 2016. We will also be closing our US safety technology site in Pittsburgh towards the end
Potential

DRÄGER ANNUAL REPORT 2015130
of the second quarter of 2016. Customer-relevant activities such as marketing and sales have already been transferred to our site in Houston, and all other tasks are to be distrib-uted across other Dräger sites in the US and in Europe.
DRÄGER MANAGEMENT ESTIMATE
The global economy should only experience moderate growth in 2016. The slight improvement in economic mo-mentum in industrialized economies will support growth, while the contribution to growth from emerging econo-mies is likely to be lower than it has been in the past. The diverging monetary policies in the US on the one side and the eurozone and Japan on the other could be the source of fluctuations on capital markets and with exchange rates in 2016. For the medical and safety markets, we anticipate a slight growth trend with regional differences in 2016 as well.
Our net sales are likely to experience slight growth in 2016 net of currency effects. We will continue to invest in the future sustainability of our Company in 2016. We are once again planning for high research and development expens-es, while our capital investments – including those for the “factory of the future” in Lübeck – will remain above de-preciation and amortization. We are driving forward our “Fit for Growth” efficiency program with the aim of boost-ing competitiveness and efficiency. We expect expenses in relation to our efficiency program to amount to up to EUR 10 million in 2016. In summary, we expect a Group EBIT margin of between 3.5 percent and 5.5 percent in fiscal year 2016, based on the exchange rates at the beginning of the fiscal year.
For fiscal year 2017, we expect net sales growth (net of currency effects) and a further improvement in the EBIT margin compared to fiscal year 2016, provided there is no deterioration in exchange rates and developments in the markets relevant to us.
Business performance of Drägerwerk AG & Co. KGaA
Within the scope of activities aimed at simplifying our cor-porate structures, Dräger Medical GmbH was subsumed into Drägerwerk AG & Co. KGaA with retroactive effect as of January 1, 2015 in August 2015. As a consequence, the business performance and the net profit of Drägerwerk AG & Co. KGaA in fiscal year 2015 was significantly impacted in the amount of EUR –69.8 million (2014: EUR 86.1 million) by the merger loss of EUR –64.5 million and the business transactions of the former Dräger Medical GmbH. Prior-year comparisons are therefore only possible to a limited extent.
EARNINGS EFFECTS FROM OPERATING ACTIVITIES
In fiscal year 2015, Drägerwerk AG & Co. KGaA’s result from the operating activities – excluding income from in-vestments, interest result, taxes and the merger loss – stood at EUR –95.4 million in fiscal year 2015 (2014: EUR –41.2 million).
At Drägerwerk AG & Co. KGaA, net sales from medical busi-ness of EUR 880.6 million and cost of materials of EUR 506.8 million were reported for the first time due to the merger. The merger had a major impact of EUR 260.7 mil-lion on personnel expenses and of EUR 400.0 million on other operating expenses.
In addition, the result was also impacted by expenses for the efficiency program (EUR 16.4 million), the rise in headcount and pay rises, including the rise for the German metal and electrical industries. Pension expenses rose considerably in 2015 due to the cutting of the interest rate from 4.55 percent (2014) to 3.89 percent in the calculation of pension provi-sions according to the German Commercial Code (HGB).
The members of the Executive Board of Drägerwerk Verwal-tungs AG receive their remuneration directly from Dräger-werk Verwaltungs AG, while the Executive Board members’ pension obligations are held by Drägerwerk AG & Co. KGaA.
COMBINED MANAGEMENT REPORT 131
LOWER RESULTS OF GROUP COMPANIES
Earnings from profit and loss transfer agreements (includ-ing intra-Group tax allocations) came to EUR 81.4 million in fiscal year 2015 (2014: EUR 157.1 million). The profit transferred by Dräger Safety AG & Co. KGaA in fiscal year 2015 was down by EUR 11.4 million year on year.
DISTRIBUTION FOR PARTICIPATION CAPITAL
Based on the proposed dividend for preferred shares of EUR 0.19, the distribution for participation capital for fiscal year 2015 decreased to EUR 1.90 per participation certificate; in 2014, a dividend for participation certificates of EUR 13.90 was paid.
INVESTMENTS
In fiscal year 2015, the Company invested EUR 6.4 million (2014: EUR 16.8 million) in software and intangible assets. Investments in property, plant and equipment came to EUR 76.4 million (2014: EUR 25.1 million). Investments were focused on the construction of the new reception and administration building and the “factory of the future” in-cluding plant, inspection and office equipment as well as on IT hardware and replacements.
NET ASSETS AND FINANCIAL POSITION
Due to the merger, the business transactions of the former Dräger Medical GmbH will play a major role in the balance sheet of Drägerwerk AG & Co. KGaA from 2015. The financial assets, inter-company receivables and liabilities and liabili-ties from Group financing were material balance sheet items in 2014; now, inventories and third-party receivables and lia-bilities are also material balance sheet items. After deducting cash and cash equivalents, net financial liabilities to banks as of December 31, 2015 amounted to EUR 201.0 million (2014: EUR 41.3 million); Group financing of Group compa-nies came to EUR 151.5 million (2014: EUR 126.7 million).
Drägerwerk AG & Co. KGaA’s equity came to EUR 876.4 million and decreased by a total of EUR 61.6 million, pri-marily as a result of the merger loss of EUR –64.5 million.
Drägerwerk AG & Co. KGaA’s equity ratio as of the reporting date therefore came to 56.4 percent (2014: 68.9 percent).
COMPARISON OF FORECAST FIGURES AND
ACTUAL FIGURES
Due to the merger with Dräger Medical GmbH, compar-ison with prior-year forecast figures is only possible to a limited extent. Since fiscal year 2015, Drägerwerk AG & Co. KGaA’s earnings have been principally impacted by net sales in Germany and abroad, income from services, invest-ments and profit and loss transfers. As announced in 2014, dividends in the amount of EUR 23.4 million were paid on common and preferred shares and participation certif-icates. The net financial liabilities to banks offset against cash and cash equivalents stood at EUR 201.0 million as of the balance sheet date. This value significantly deviated from the prior-year forecast, which had predicted a slight improvement (EUR 41.3 million), for the aforementioned reasons. In terms of the equity ratio, the forecast slight in-crease was unable to be achieved due to merger effects. It fell from 68.9 percent to 56.4 percent.
FUTURE SITUATION OF DRÄGERWERK AG & CO. KGAA
In fiscal year 2016, Drägerwerk AG & Co. KGaA will continue to provide services to Group companies alongside its operat-ing medical business. Earnings in 2016 are likely to be shaped by net sales and income from services and investments.
We expect a slight rise in the equity ratio year on year.
DECLARATION OF CORPORATE GOVERNANCE
The Company management prepared the single entity fi-nancial statements and combined management report of Drägerwerk AG & Co. KGaA and is responsible for the con-tents of both documents and the objectivity of the informa-tion provided therein. The same applies to the combined management report associated with the single entity finan-cial statements.
Business performance of Drägerwerk AG & CO KGaA
DRÄGER ANNUAL REPORT 2015132
The financial statements were prepared in accordance with the German Commercial Code (Handelsgesetzbuch – HGB).
DECLARATION PURSUANT TO SEC. 161 AKTG.
Our declaration of conformity is available on the Company website www.draeger.com in the Investor Relations/Corporate Governance section
and is also printed in this Annual Report on page 96 et seq.
DISCLOSURES ON CORPORATE GOVERNANCE PRACTICES
The Executive Board has implemented effective internal control systems and relevant employee training measures to ensure that the Group’s financial reporting system is cor-rect and complies with legal requirements. The Company’s principles are based on integrity and social responsibility in all areas such as environmental protection, quality, prod-uct and process safety, and compliance with local laws and regulations. The Internal Audit department continuously monitors the implementation of these principles as well as the reliability and functionality of the control systems. The Executive Board of Drägerwerk Verwaltungs AG governs the Group in the interest of its shareholders and is aware of its responsibility to employees, society and the environment. We have made it our goal to use the resources entrusted to us in a manner that increases the value of the Dräger Group.
According to the resolution passed by the annual share-holders’ meeting on April 30, 2015, the Supervisory Board appointed PricewaterhouseCoopers Aktiengesellschaft Wirtschaftsprüfungsgesellschaft as the independent audi-tor of the single entity financial statements of Drägerwerk AG & Co. KGaA for fiscal year 2015.
The auditing firm also examined the existing risk manage-ment system with regard to the Control and Transparency in Business Act (Gesetz zur Kontrolle und Transparenz im Unternehmensbereich – KonTraG). Representatives of the statutory auditor attend the Audit Committee’s meeting as well as the Supervisory Board’s meeting to discuss the fi-nancial statements, during which the management report and auditor’s report are deliberated on. The Supervisory
Board has issued a separate report on this subject in the report of the Supervisory Board in the annual report 2015.
TARGET INDICATORS PURSUANT TO SECS. 76 (4)
AND 111 (5) AKTG
In its meetings on September 7, 2015, the Executive Board of the general partner defined a quota of 27 percent in rela-tion to female participation in the first level of management below the Executive Board and a quota of 19 percent for the second level of management below the Executive Board. These quotas must be achieved by June 30, 2017.
FORWARD-LOOKING STATEMENTS
This combined management report contains forward-look-ing statements. The statements are based on the current expectations, presumptions, and forecasts of the Executive Board of Drägerwerk Verwaltungs AG as well as the infor-mation available to it to date. The forward-looking state-ments do not provide any warranty for the future devel-opments and results contained therein. Rather, the future developments and results are dependent on a number of factors, including various risks and uncertainties; they are based on assumptions which could prove to be incorrect. Dräger does not assume any responsibility for updating the forward-looking statements made in this report.
Lübeck, February 17, 2016
The general partnerDrägerwerk Verwaltungs AG,represented by its Executive Board
Stefan DrägerRainer KlugGert-Hartwig LescowDr. Reiner PiskeAnton Schrofner

AN
NU
AL
FIN
AN
CIA
L S
TATE
ME
NTS
PAGE 133 – 234
ANNUAL FINANCIAL STATEMENTS
133 ANNUAL FINANCIAL STATEMENTS
Annual Financial Statements 2015 of the Dräger Group 135
Consolidated income statement of the Dräger Group 135
Consolidated statement of comprehensiveincome of the Dräger Group 136
Consolidated balance sheet of the Dräger Group 137
Consolidated cash flow statement ofthe Dräger Group 138
Notes of the Dräger Group for 2015 141
Management compliance statement 229
Auditor’s report 230
The Company’s Boards 232
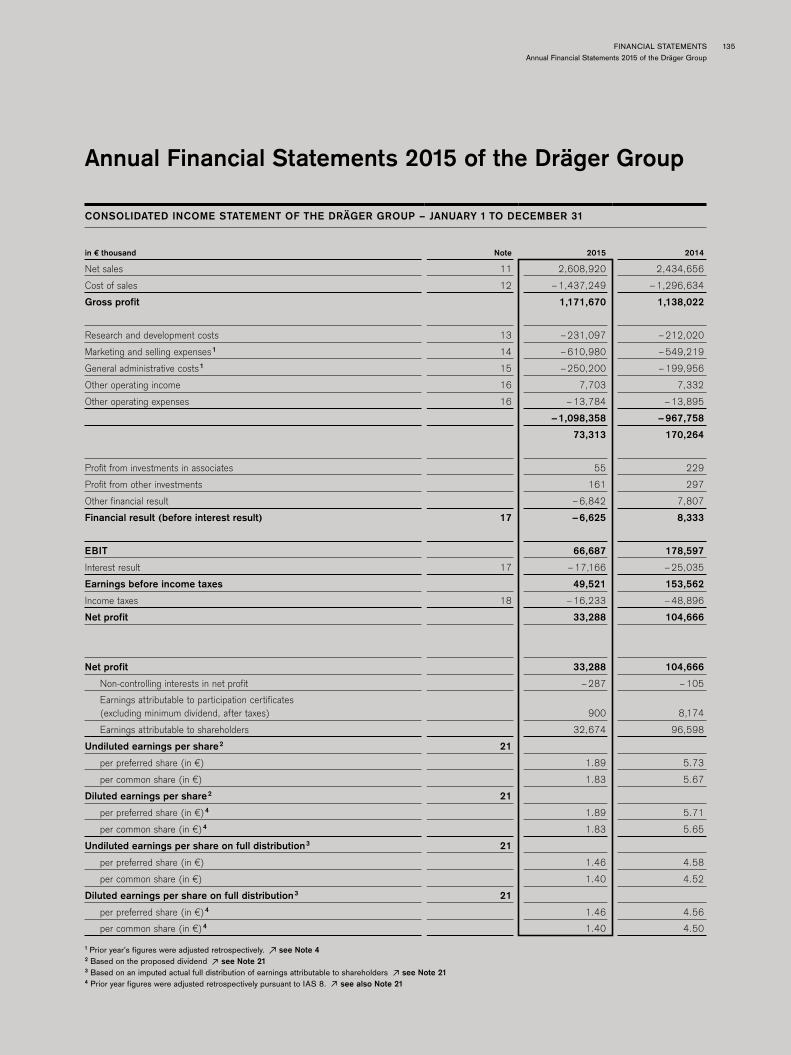
FINANCIAL STATEMENTSAnnual Financial Statements 2015 of the Dräger Group
135
Annual Financial Statements 2015 of the Dräger Group
CONSOLIDATED INCOME STATEMENT OF THE DRÄGER GROUP – JANUARY 1 TO DECEMBER 31
in € thousand Note 2015 2014
Net sales 11 2,608,920 2,434,656
Cost of sales 12 –1,437,249 –1,296,634
Gross profit 1,171,670 1,138,022
Research and development costs 13 –231,097 –212,020
Marketing and selling expenses 1 14 –610,980 –549,219
General administrative costs 1 15 –250,200 –199,956
Other operating income 16 7,703 7,332
Other operating expenses 16 –13,784 –13,895
–1,098,358 –967,758
73,313 170,264
Profit from investments in associates 55 229
Profit from other investments 161 297
Other financial result –6,842 7,807
Financial result (before interest result) 17 –6,625 8,333
EBIT 66,687 178,597
Interest result 17 –17,166 –25,035
Earnings before income taxes 49,521 153,562
Income taxes 18 –16,233 –48,896
Net profit 33,288 104,666
Net profit 33,288 104,666
Non-controlling interests in net profit –287 –105
Earnings attributable to participation certificates (excluding minimum dividend, after taxes) 900 8,174
Earnings attributable to shareholders 32,674 96,598
Undiluted earnings per share 2 21
per preferred share (in €) 1.89 5.73
per common share (in €) 1.83 5.67
Diluted earnings per share 2 21
per preferred share (in €) 4 1.89 5.71
per common share (in €) 4 1.83 5.65
Undiluted earnings per share on full distribution 3 21
per preferred share (in €) 1.46 4.58
per common share (in €) 1.40 4.52
Diluted earnings per share on full distribution 3 21
per preferred share (in €) 4 1.46 4.56
per common share (in €) 4 1.40 4.50
1 Prior year’s figures were adjusted retrospectively. see Note 42 Based on the proposed dividend see Note 21 3 Based on an imputed actual full distribution of earnings attributable to shareholders see Note 214 Prior year figures were adjusted retrospectively pursuant to IAS 8. see also Note 21

136 DRÄGER ANNUAL REPORT 2015
CONSOLIDATED STATEMENT OF COMPREHENSIVE INCOME OF THE DRÄGER GROUP
in € thousand 2015 2014
Net profit 33,288 104,666
Items that cannot be reclassified into the income statement
Remeasurements of defined benefit pension plans 11,019 –82,375
Deferred taxes on remeasurements of defined benefit pension plans –3,099 25,495
Items that may be reclassified into the income statement in the future
Currency translation adjustment for foreign subsidiaries 14,529 20,458
Change in the fair value of financial assets designated as available for sale recognized directly in equity 3 44
Deferred taxes on changes in the fair value of financial assets designated as available for sale recognized directly in equity –11 –3
Change in the fair value of derivative financial instruments recognized directly in equity 473 –1,325
Deferred taxes on changes in the fair value of derivative financial instruments recognized directly in equity –116 515
Other comprehensive income (after taxes) 22,799 –37,191
Total comprehensive income 56,086 67,476
thereof earnings attributable to non-controlling investments –423 –68
thereof earnings attributable to participation certificates (excluding minimum dividend, after taxes) 900 8,174
thereof earnings attributable to shareholders 55,609 59,370

FINANCIAL STATEMENTSAnnual Financial Statements 2015 of the Dräger Group
137
CONSOLIDATED BALANCE SHEET OF THE DRÄGER GROUP
in € thousand Note December 31, 2015 December 31, 2014
Assets
Intangible assets 22 351,776 294,242
Property, plant and equipment 23 406,355 349,936
Investments in associates 24 231 277
Other non-current financial assets 25 11,613 14,523
Deferred tax assets 26 135,322 119,528
Other non-current assets 27 1,881 2,959
Non-current assets 907,177 781,465
Inventories 28 401,978 388,497
Trade receivables and receivables from construction contracts 29 711,323 657,394
Other current financial assets 30 47,708 33,843
Cash and cash equivalents 31 172,767 296,855
Current tax refund claims 19,386 23,797
Other current assets 32 47,724 52,260
1,400,885 1,452,645
Non-current assets held for sale 33 3,334 0
Current assets 1,404,220 1,452,645
Total assets 2,311,397 2,234,110
Equity and liabilities
Capital stock 45,466 44,186
Capital reserves 234,028 203,760
Reserves retained from earnings, incl. Group result 626,634 622,342
Participation capital 36 29,497 29,497
Other comprehensive income 8,691 –5,325
Non-controlling interests 35 1,614 2,146
Equity 34 945,929 896,606
Liabilities from participation certificates 36 21,779 20,872
Provisions for pensions and similar obligations 37 288,147 297,009
Other non-current provisions 38 56,646 55,619
Non-current interest-bearing loans 39 138,118 168,563
Other non-current financial liabilities 40 27,604 27,653
Non-current income tax liabilities 4,392 10,286
Deferred tax liabilities 41 3,431 1,540
Other non-current liabilities 42 5,762 5,830
Non-current liabilities 545,880 587,373
Other current provisions 38 232,984 189,278
Current interest-bearing loans and liabilities to banks 43 169,662 127,686
Trade payables 44 186,405 201,340
Other current financial liabilities 44 25,343 30,166
Current income tax liabilities 37,751 25,854
Other current liabilities 45 167,442 175,808
Current liabilities 819,588 750,132
Total equity and liabilities 2,311,397 2,234,110

138 DRÄGER ANNUAL REPORT 2015
CONSOLIDATED CASH FLOW STATEMENT OF THE DRÄGER GROUP
in € thousand 2015 2014
Operating activities
Group net profit 33,288 104,666
+ Write-down /write-up of non-current assets 84,202 76,980
+ Interest result 1 17,166 25,035
+ Income taxes 1 16,233 48,896
+/– Increase /decrease in provisions 1 35,989 –11,991
– Other non-cash expenses / income 1 –223 –16,862
+ Loss from the disposal of non-current assets 592 1,173
– Increase in inventories –5,384 –1,153
– Increase in leased equipment –13,730 –11,454
+/– Decrease / increase in trade receivables –44,647 1,602
– Increase in other assets 1 –6,146 –3,774
+/– Increase /decrease in trade payables –22,756 25,193
+/– Increase /decrease in other liabilities 1 –11,981 10,633
+ Received dividends 1 102 250
– Cash outflow for income taxes 1 –29,214 –43,348
– Cash outflow for interest 1 –18,336 –21,214
+ Cash inflow from interest 1 4,706 3,351
Cash inflow from operating activities 39,861 187,982
Investing activities
– Cash outflow for investments in intangible assets –4,240 –17,004
+ Cash inflow from the disposal of intangible assets 187 1,201
– Cash outflow for investments in property, plant and equipment –110,149 –88,874
+ Cash inflow from disposals of property, plant and equipment 5,680 4,274
– Cash outflow for investments in non-current financial assets –692 –93
+ Cash inflow from the disposal of non-current financial assets 290 634
– Cash outflow from the acquisition of subsidiaries –58,063 –2,748
Cash outflow from investing activities –166,987 –102,610
Financing activities
– Distribution of dividends (including dividends for participation certificates) –34,601 –19,820
+ Cash inflow from the exercise of option rights to preferred shares 31,548 34,888
– Cash outflow from the acquisition of treasury shares for the employee share program –1,143 –
+ Cash provided by raising loans 48,087 8,927
– Cash used to redeem loans –105,472 –56,252
+ Net balance of other liabilities to banks 66,082 7,539
– Net balance of finance lease liabilities repaid / incurred –1,761 –1,591
– Cash outflow from the change in shareholdings in subsidiaries without a change in the method of accounting –4,000 –
– Profit distributed to non-controlling interests –42 –28
Cash outflow from financing activities –1,303 –26,337
Change in cash and cash equivalents in the fiscal year –128,429 59,035
+ Effect of exchange rates on cash and cash equivalents 4,342 5,689
+ Cash and cash equivalents at the beginning of the fiscal year 296,855 232,131
Cash and cash equivalents as of December 31 of the fiscal year 172,767 296,855
1 Payments for received dividends, income taxes and interests are shown separately in the cash flow statement. Prior year’s figures were adjusted accordingly.
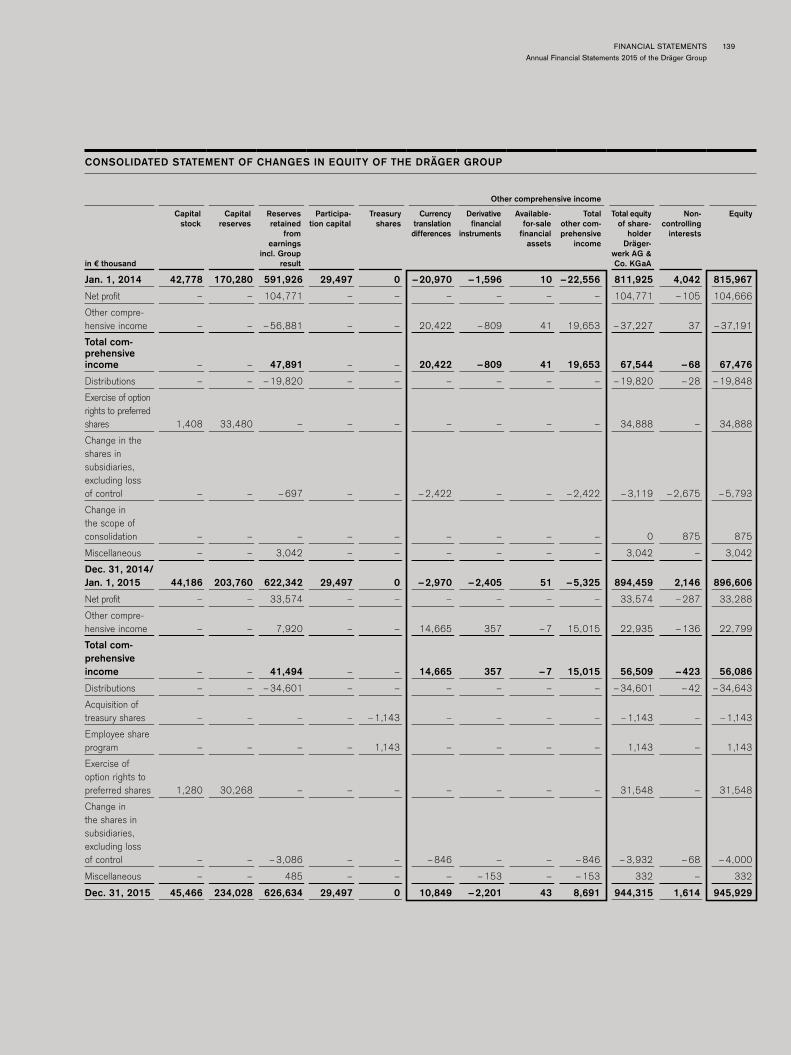
FINANCIAL STATEMENTSAnnual Financial Statements 2015 of the Dräger Group
139
CONSOLIDATED STATEMENT OF CHANGES IN EQUITY OF THE DRÄGER GROUP
Other comprehensive income
in € thousand
Capital stock
Capital reserves
Reserves retained
from earnings
incl. Group result
Participa-tion capital
Treasury shares
Currency translation
differences
Derivative financial
instruments
Available-for-sale
financial assets
Total other com-prehensive
income
Total equity of share-
holder Dräger-
werk AG & Co. KGaA
Non- controlling
interests
Equity
Jan. 1, 2014 42,778 170,280 591,926 29,497 0 –20,970 –1,596 10 –22,556 811,925 4,042 815,967
Net profit – – 104,771 – – – – – – 104,771 –105 104,666
Other compre-hensive income – – –56,881 – – 20,422 –809 41 19,653 –37,227 37 –37,191
Total com- prehensive income – – 47,891 – – 20,422 –809 41 19,653 67,544 –68 67,476
Distributions – – –19,820 – – – – – – –19,820 –28 –19,848
Exercise of option rights to preferred shares 1,408 33,480 – – – – – – – 34,888 – 34,888
Change in the shares in subsidiaries, excluding loss of control – – –697 – – –2,422 – – –2,422 –3,119 –2,675 –5,793
Change in the scope of consolidation – – – – – – – – – 0 875 875
Miscellaneous – – 3,042 – – – – – – 3,042 – 3,042
Dec. 31, 2014/Jan. 1, 2015 44,186 203,760 622,342 29,497 0 –2,970 –2,405 51 –5,325 894,459 2,146 896,606
Net profit – – 33,574 – – – – – – 33,574 –287 33,288
Other compre-hensive income – – 7,920 – – 14,665 357 –7 15,015 22,935 –136 22,799
Total com- prehensive income – – 41,494 – – 14,665 357 –7 15,015 56,509 –423 56,086
Distributions – – –34,601 – – – – – – –34,601 –42 –34,643
Acquisition of treasury shares – – – – –1,143 – – – – –1,143 – –1,143
Employee share program – – – – 1,143 – – – – 1,143 – 1,143
Exercise of option rights to preferred shares 1,280 30,268 – – – – – – – 31,548 – 31,548
Change in the shares in subsidiaries, excluding loss of control – – –3,086 – – –846 – – –846 –3,932 –68 –4,000
Miscellaneous – – 485 – – – –153 – –153 332 – 332
Dec. 31, 2015 45,466 234,028 626,634 29,497 0 10,849 –2,201 43 8,691 944,315 1,614 945,929

140 DRÄGER ANNUAL REPORT 2015

FINANCIAL STATEMENTSNotes of the Dräger Group for 2015
141
Notes of the Dräger Group for 2015
1 GENERAL
The Dräger Group is managed by Drägerwerk AG & Co. KGaA, Moislinger Allee 53 – 55, D-23542 Lübeck, Germany, the ultimate parent company. Drägerwerk AG & Co. KGaA is entered in the commercial register of the Local Court of Lübeck under HR B No. 7903 HL.
On March 9, 2016, the Executive Board is approving the publication of the Group finan-cial statements of Drägerwerk AG & Co. KGaA for fiscal year 2015. The Group financial statements are published in electronic form in the Federal Gazette.
The Group’s business activities and structure are described in the segment reporting as well as management report of this annual report.
2 BASIS OF PREPARATION OF THE GROUP FINANCIAL STATEMENTS
Drägerwerk AG & Co. KGaA prepared its Group financial statements for fiscal year 2015 in accordance with International Financial Reporting Standards (IFRS) promulgated by the International Accounting Standards Boards (IASB) and the interpretations of the In-ternational Financial Reporting Interpretations Committee (IFRIC). Drägerwerk AG & Co. KGaA applied all the IFRSs adopted by the IASB as of December 31, 2015 to its 2015 Group financial statements, provided that these standards were endorsed by the European Commission and published in the Official Journal of the European Union by the date of publication of the Group financial statements and that application of such standards is mandatory for fiscal year 2015.
On their effective dates, Dräger has applied the following revised and new standards issued by the IASB for the first time in fiscal year 2015 in particular:
– The “Annual Improvements to IFRSs 2010 – 2012 Cycle (issued December 2013)” resulted in slight adjustments or corrections to IFRS 2, IFRS 3, IFRS 8, IFRS 13, IAS 16, IAS 24 and IAS 38. This does not have a material impact on Dräger’s Group financial statements.
– The “Annual Improvements to IFRSs 2011 – 2013 Cycle (issued December 2013)” resulted in slight adjustments or corrections to IFRS 1, IFRS 3, IFRS 13 and IAS 40. This does not have a material impact on Dräger’s Group financial statements.
– The amendments to IAS 19 “Defined Benefit Plans: Employee Contributions (issued November 2013)” pertain to amendments to IAS 19.93 to the effect that an employee’s contributions to defined benefit plans that are related to the services rendered by that em-ployee (such as deferred compensation) reduce the service costs for that period, insofar as the contributions and the employee’s services apply to the same period. Consequently, these contributions may not be attributed to years of service as a negative benefit. This does not impact Dräger’s Group financial statements.
Additional accounting provisions have already been adopted into European law by the EU and apply to fiscal years beginning on or after January 1, 2016. Dräger did not voluntarily apply this interpretation prematurely. These accounting provisions relate in particular to the following standards and amended standards:
142 DRÄGER ANNUAL REPORT 2015
– The “Annual Improvements to IFRSs 2012 – 2014 Cycle (issued September 2014)” result-ed in slight adjustments or corrections to IFRS 5, IFRS 7, IAS 19 and IAS 34. This does not have a material impact on Dräger’s Group financial statements.
– The IASB published clarifications on IAS 1 in line with the “Disclosure Initiative – Amendments to IAS 1 (issued December 2014).” In addition to assessing the materiality of information in the financial statements, the presentation of additional line items in the balance sheet and the statement of comprehensive income, and the structure of disclosures in the notes, these also relate to the presentation of significant accounting policies. They also relate to the presentation of the other comprehensive income of as-sociates and joint ventures accounted for using the equity method. This does not have a material impact on Dräger’s Group financial statements.
– The amendments to IFRS 11 “Accounting for Acquisitions of Interests in Joint Operations (issued May 2014)” means that the acquirer of an interest in a joint operation in which the activity constitutes a business, as defined in IFRS 3, is required to apply all of the principles on business combinations accounting in IFRS 3 and other IFRSs with the exception of those principles that conflict with the guidance in IFRS 11. This does not impact Dräger’s Group financial statements.
Further standards were published and existing standards amended, which become ef-fective for fiscal years starting on or after January 1, 2016 and which had not yet been endorsed by the balance sheet date. These accounting provisions include, in particular, the following:
– IFRS 9 “Financial Instruments (issued November 2009, amended December 2011)” deals with the classification, recognition and measurement of financial assets and lia-bilities. This standard replaces the sections of IAS 39 that describe the classification and measurement of financial instruments. According to IFRS 9, financial assets are now only classified into two measurement categories: at fair value and at amortized cost. Most of the regulations regarding financial assets in IAS 39 still apply. The application of IFRS 9 can result in changes to the classification of financial assets in Dräger’s Group financial statements. The management is evaluating the effects of these amendments on Dräger’s Group financial statements.
– IAS 39 “Hedge Accounting” was largely revised and then added to IFRS 9 as a separate chapter relating to hedge accounting within the scope of IFRS 9 “Financial Instruments – Hedge Accounting and Amendments to IFRS 9, IFRS 7 and IAS 39 (issued November 2013).” Thus far, Dräger has only made use of hedge accounting to a limited extent. As a result, this does not have a material impact on Dräger’s Group financial statements.
– IFRS 9 “Financial Instruments (issued July 2014)” completes the IASB’s financial in-struments project. IFRS 9 was published as a complete standard, bringing together all previously published regulations and the new regulations on the recognition of impair-ment and limited amendments to the classification and measurement of financial assets. This is not expected to have a material impact on Dräger’s Group financial statements, although this is still being assessed by management.
– The amendments to the requirements of IAS 28 and IFRS 10 “Sale or Contribution of Assets between an Investor and its Associate or Joint Venture (issued September 2014)” address a conflict between these requirements and clarify that in a transaction involving
FINANCIAL STATEMENTSNotes of the Dräger Group for 2015
143
an associate or joint venture, the extent of gain or loss recognition depends on whether the assets sold or contributed constitute a business. This does not have a material impact on Dräger’s Group financial statements.
– IFRS 15 “Revenue from Contracts with Customers (issued May 2014)” specifies how and when an IFRS reporter will recognize revenue as well as requiring such entities to provide users of financial statements with more informative, relevant disclosures. The standard replaces IAS 18 “Revenue”, IAS 11 “Construction Contracts” and revenue-re-lated interpretations IFRIC 13, 15, 18 and SIC-31. Revenue realization and, in particular the revenue recognition processes, are currently being analyzed on behalf of manage-ment. The current impact analysis indicates that this does not have a material impact on Dräger’s Group financial statements.
– The amendments to IFRS 10, IFRS 12 and IAS 28 (issued December 2014) govern the application of the consolidation exception for investment companies. This does not im-pact Dräger’s Group financial statements.
– The new IFRS 16 “Leases (issued January 2016)” supersedes the current standard on lease-accounting IAS 17 as well as the interpretations IFRIC 4, SIC-15 and SIC-27. IFRS 16 defines leases as an agreement in which the right to control the use of an identifiable asset is transferred and that during the term of use the customer has the right to both define the use of this asset as well as to benefit from the use of this asset. The material changes affected by IFRS 16 relate to how the lessee accounts for these leases. The lessee is required to recognize assets and liabilities for the rights and obligations arising under leases. Recognition exemptions are granted for low-value assets and short-term leases. The accounting principles for lessors largely correspond to the existing provisions under IAS 17. The management is currently evaluating the effects of these amendments on Dräger’s Group financial statements.
– The amendments to IAS 7 “Statement of Cash Flows (issued January 2016)” in line with the “Disclosure Initiative” stipulate additional notes disclosure that should help users of financial statements to evaluate changes in liabilities arising from entity’s financing activities. This does not have a material impact on Dräger’s Group financial statements.
– The amendments to IAS 12 “Recognition of Deferred Tax Assets (issued January 2016)” clarify how to account for deferred tax assets for unrealized losses related to debt instru-ments measured at fair value and recognized in other comprehensive income. This does not have a material impact on Dräger’s Group financial statements.
The provisions of Art. 4 EC Regulation No. 1606/2002 of the European Parliament in conjunction with Sec. 315a (1) HGB (Handelsgesetzbuch – German Commercial Code) governing a company’s exemption from its obligation to prepare group financial statements in accordance with German commercial law have been met.
To ensure that the Group financial statements are equivalent to consolidated financial statements prepared in accordance with the German Commercial Code, all disclosures and explanations required by German commercial law above and beyond the provisions of the IFRSs have been provided in accordance with Sec. 315a (1) HGB.
The Group financial statements were prepared in euros. Unless stated otherwise, all figures were disclosed in thousands of euros (EUR thousand); rounding differences may arise as a result. The balance sheet is classified according to the current/non-current dis-tinction; the income statement was prepared according to the cost of sales method. Where

144 DRÄGER ANNUAL REPORT 2015
certain items of the financial statements have been grouped with a view to enhancing the transparency of presentation, they are disclosed separately in the notes. The single entity financial statements of the companies included in consolidation were prepared as of the balance sheet date of the Group financial statements on the basis of uniform accounting policies.
3 AMENDMENTS TO SEGMENT REPORTING
Dräger is reducing unnecessary double structures in the medical and safety divisions with-in the scope of the introduction of the functional, cross-departmental management model so as to facilitate the use of synergy effects. Dräger has therefore started to gradually merge the legal entities in the various countries, thereby cutting complexity and costs.
The merger of the previously separate legal entities of the safety division and the medi-cal division requires amendments to segment reporting. From the first quarter of 2015, the results of the medical and safety divisions are calculated on the basis of product attribution to the medical or safety division rather than on the basis of the legal entities as had been the case previously.
This results in the following changes to our segment reporting:
– The reporting of net sales will no longer be based on the consolidated net sales of the sub-groups; the reporting will instead be based solely on third-party net sales.
– Non-product-related costs, including headquarter costs, previously recognized in the Drägerwerk AG & Co. KGaA/Other companies segment, are now allocated to the two divisions on the basis of the planned net sales.
– The segment Drägerwerk AG & Co. KGaA/Other companies will no longer exist in the future. This segment had, until now, recognized, among other things, non-product-relat-ed costs, including a share of headquarter costs. These will now be allocated to the two segments on the basis of the plan-based net sales formula.
– Balance sheet items not allocated to products in the medical and safety divisions or to their customers are only reported at Group level.
– Reporting capital employed by segment is based on the key drivers of net working capital (trade receivables, inventories including prepayments received). Long-term capital em-ployed such as property, plant and equipment is no longer included in segment reporting, as it can no longer be allocated to the segments following the merger of the respective legal units.
The amendments were applied retrospectively in accordance with IAS 8. This results in the following effects on the Group financial statements as of December 31, 2014:

FINANCIAL STATEMENTSNotes of the Dräger Group for 2015
145
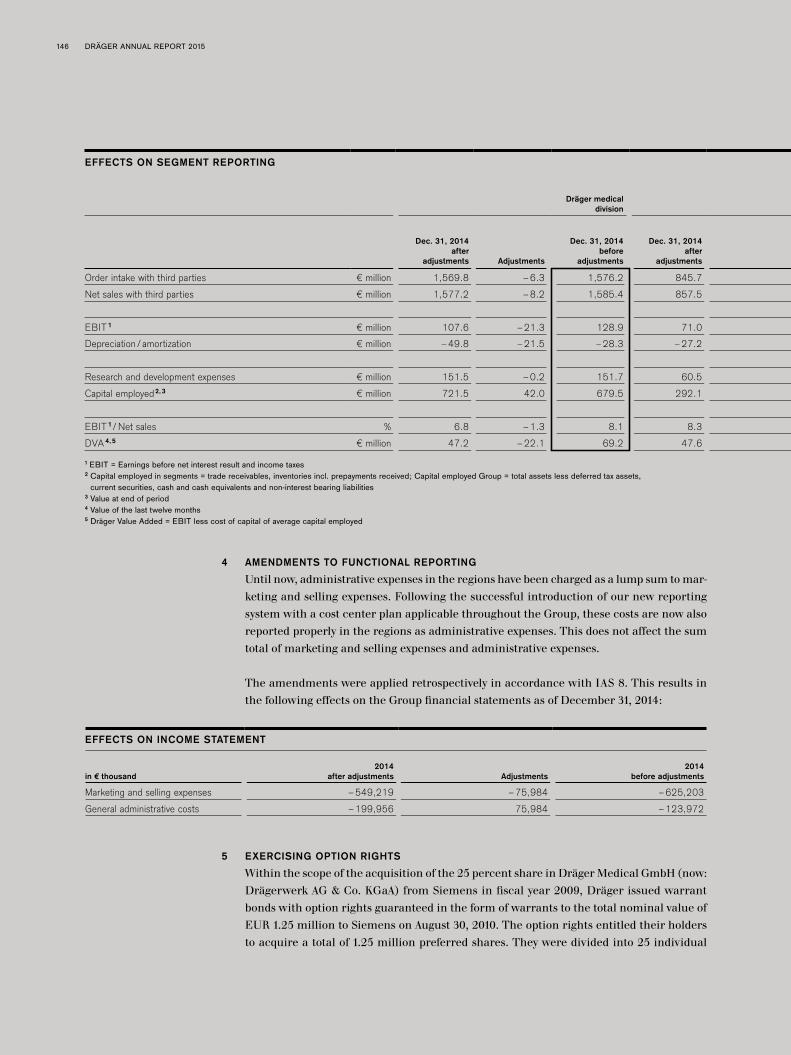
146 DRÄGER ANNUAL REPORT 2015
4 AMENDMENTS TO FUNCTIONAL REPORTING
Until now, administrative expenses in the regions have been charged as a lump sum to mar-keting and selling expenses. Following the successful introduction of our new reporting system with a cost center plan applicable throughout the Group, these costs are now also reported properly in the regions as administrative expenses. This does not affect the sum total of marketing and selling expenses and administrative expenses.
The amendments were applied retrospectively in accordance with IAS 8. This results in the following effects on the Group financial statements as of December 31, 2014:
EFFECTS ON INCOME STATEMENT
in € thousand2014
after adjustments Adjustments2014
before adjustments
Marketing and selling expenses –549,219 –75,984 –625,203
General administrative costs –199,956 75,984 –123,972
5 EXERCISING OPTION RIGHTS
Within the scope of the acquisition of the 25 percent share in Dräger Medical GmbH (now: Drägerwerk AG & Co. KGaA) from Siemens in fiscal year 2009, Dräger issued warrant bonds with option rights guaranteed in the form of warrants to the total nominal value of EUR 1.25 million to Siemens on August 30, 2010. The option rights entitled their holders to acquire a total of 1.25 million preferred shares. They were divided into 25 individual
EFFECTS ON SEGMENT REPORTING
Dräger medical division
Dräger safety division
Drägerwerk AG & Co. KGaA/ Other companies/consolidation
Dräger Group
Dec. 31, 2014 after
adjustments Adjustments
Dec. 31, 2014 before
adjustments
Dec. 31, 2014 after
adjustments Adjustments
Dec. 31, 2014 before
adjustments
Dec. 31, 2014 after
adjustments Adjustments
Dec. 31, 2014 before
adjustments
Dec. 31, 2014 after
adjustments Adjustments
Dec. 31, 2014 before
adjustments
Order intake with third parties € million 1,569.8 –6.3 1,576.2 845.7 –38.0 883.7 – 44.3 –44.3 2,415.5 – 2,415.5
Net sales with third parties € million 1,577.2 –8.2 1,585.4 857.5 –33.4 890.9 – 41.6 –41.6 2,434.7 – 2,434.7
EBIT 1 € million 107.6 –21.3 128.9 71.0 –17.4 88.4 – 38.7 –38.7 178.6 – 178.6
Depreciation / amortization € million –49.8 –21.5 –28.3 –27.2 2.0 –29.2 – 19.5 –19.5 –77.0 – –77.0
Research and development expenses € million 151.5 –0.2 151.7 60.5 2.1 58.4 – –1.9 1.9 212.0 – 212.0
Capital employed 2, 3 € million 721.5 42.0 679.5 292.1 35.8 256.3 – –171.4 171.4 1,107.2 – 1,107.2
EBIT 1/ Net sales % 6.8 –1.3 8.1 8.3 –1.6 9.9 7.3 7.3
DVA 4, 5 € million 47.2 –22.1 69.2 47.6 –18.5 66.1 – – – 81.6 – 81.6
1 EBIT = Earnings before net interest result and income taxes2 Capital employed in segments = trade receivables, inventories incl. prepayments received; Capital employed Group = total assets less deferred tax assets,
current securities, cash and cash equivalents and non-interest bearing liabilities3 Value at end of period4 Value of the last twelve months5 Dräger Value Added = EBIT less cost of capital of average capital employed
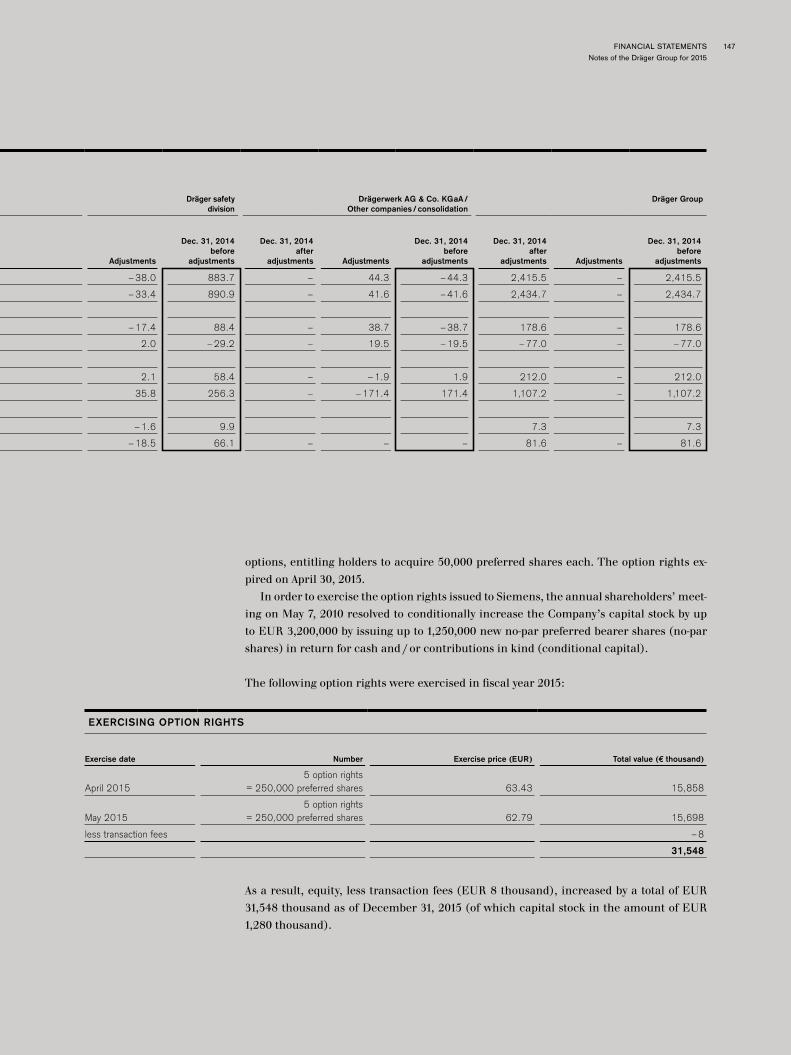
FINANCIAL STATEMENTSNotes of the Dräger Group for 2015
147
options, entitling holders to acquire 50,000 preferred shares each. The option rights ex-pired on April 30, 2015.
In order to exercise the option rights issued to Siemens, the annual shareholders’ meet-ing on May 7, 2010 resolved to conditionally increase the Company’s capital stock by up to EUR 3,200,000 by issuing up to 1,250,000 new no-par preferred bearer shares (no-par shares) in return for cash and/or contributions in kind (conditional capital).
The following option rights were exercised in fiscal year 2015:
EXERCISING OPTION RIGHTS
Exercise date Number Exercise price (EUR) Total value (€ thousand)
April 20155 option rights
= 250,000 preferred shares 63.43 15,858
May 20155 option rights
= 250,000 preferred shares 62.79 15,698
less transaction fees –8
31,548
As a result, equity, less transaction fees (EUR 8 thousand), increased by a total of EUR 31,548 thousand as of December 31, 2015 (of which capital stock in the amount of EUR 1,280 thousand).
EFFECTS ON SEGMENT REPORTING
Dräger medical division
Dräger safety division
Drägerwerk AG & Co. KGaA/ Other companies/consolidation
Dräger Group
Dec. 31, 2014 after
adjustments Adjustments
Dec. 31, 2014 before
adjustments
Dec. 31, 2014 after
adjustments Adjustments
Dec. 31, 2014 before
adjustments
Dec. 31, 2014 after
adjustments Adjustments
Dec. 31, 2014 before
adjustments
Dec. 31, 2014 after
adjustments Adjustments
Dec. 31, 2014 before
adjustments
Order intake with third parties € million 1,569.8 –6.3 1,576.2 845.7 –38.0 883.7 – 44.3 –44.3 2,415.5 – 2,415.5
Net sales with third parties € million 1,577.2 –8.2 1,585.4 857.5 –33.4 890.9 – 41.6 –41.6 2,434.7 – 2,434.7
EBIT 1 € million 107.6 –21.3 128.9 71.0 –17.4 88.4 – 38.7 –38.7 178.6 – 178.6
Depreciation / amortization € million –49.8 –21.5 –28.3 –27.2 2.0 –29.2 – 19.5 –19.5 –77.0 – –77.0
Research and development expenses € million 151.5 –0.2 151.7 60.5 2.1 58.4 – –1.9 1.9 212.0 – 212.0
Capital employed 2, 3 € million 721.5 42.0 679.5 292.1 35.8 256.3 – –171.4 171.4 1,107.2 – 1,107.2
EBIT 1/ Net sales % 6.8 –1.3 8.1 8.3 –1.6 9.9 7.3 7.3
DVA 4, 5 € million 47.2 –22.1 69.2 47.6 –18.5 66.1 – – – 81.6 – 81.6
1 EBIT = Earnings before net interest result and income taxes2 Capital employed in segments = trade receivables, inventories incl. prepayments received; Capital employed Group = total assets less deferred tax assets,
current securities, cash and cash equivalents and non-interest bearing liabilities3 Value at end of period4 Value of the last twelve months5 Dräger Value Added = EBIT less cost of capital of average capital employed

148 DRÄGER ANNUAL REPORT 2015
A total of four option rights (200,000 preferred shares) were exercised in fiscal year 2013 and a total of eleven option rights (550,000 preferred shares) were exercised in fiscal year 2014. In fiscal year 2014, equity, less transaction fees (EUR 7 thousand), increased by a total of EUR 34,888 thousand as of December 31, 2014 (of which capital stock in the amount of EUR 1,408 thousand).
As a result, all 25 option rights had been exercised as of December 31, 2015.
6 SCOPE OF CONSOLIDATION
The consolidated group of Drägerwerk AG & Co. KGaA is composed of the following entities:
SCOPE OF CONSOLIDATION
Germany Abroad Total
Drägerwerk AG & Co. KGaA and fully consolidated companies
January 1, 2015 25 91 116
Acquisition – 1 1
Mergers 2 1 3
December 31, 2015 23 91 114
Associates
January 1 / December 31, 2015 1 – 1
Total 24 91 115
Besides Drägerwerk AG & Co. KGaA, fully consolidated companies include all subsidiar-ies controlled by Drägerwerk AG & Co. KGaA within the meaning of IFRS 10 (including structured companies). Drägerwerk AG & Co. KGaA controls a company when it has power over the company, exposure, or rights, to variable returns from its involvement with the company, and the ability to use its power over the company to affect the amount of the com-pany’s returns. Those of the company’s activities that significantly influence its returns are classified as relevant activities.
Control can also exist without a majority of voting rights if Drägerwerk AG & Co. KGaA has other means of controlling a company’s relevant activities. These means can result from, for example, other contractual agreements, potential voting rights, the size of its voting rights relative to the size and dispersion of holdings of other vote holders.
The consolidated group includes six (2014: seven) real estate companies and a further special purpose entity as structured companies. The activities of these companies are limited, because they were each only founded for a specific purpose. Dräger controls these structured companies not exclusively through voting rights or comparable rights, but par-tially only through other contractual agreements (please refer to our comments on the use of assumptions and estimates in Note 10). Dräger does not provide these companies with any financing or guarantees, nor does it intend to do so.
The determination of the entities to be included in consolidation on the basis of IFRS 10 did not result in any change to Dräger’s scope of consolidation in fiscal year 2014.
Note 10
FINANCIAL STATEMENTSNotes of the Dräger Group for 2015
149
Controlled companies are included in the Group financial statements as subsidiaries from the date on which Dräger obtains control, and are removed from the Group financial state-ments as subsidiaries from the date on which Dräger no longer has control.
Dräger leases land and buildings from two companies, whose only purpose is leas-ing these properties while Dräger does not hold any interests in or have any influence over these companies by means of other contracts. These companies are not included in Dräger’s consolidated group, as Dräger does not exercise any control over these companies within the meaning of IFRS 10 on account of the firm contractual commitments. The companies do not receive any financing or guarantees from Dräger, nor does Dräger plan any such support. Provisions for potential losses are recognized, as Dräger does not use these properties to their full extent (please refer to our comments in Note 38).
Joint arrangements where Dräger has joint control together with one or more parties are accounted for in accordance with IFRS 11. A difference is made here between joint operations and joint ventures.
A joint operation occurs when the parties that have joint control of the arrangement have rights to the assets and obligations for the liabilities. In the case of investments in joint operations, only a proportionate share of the assets, liabilities, income and expenses are recognized. Dräger is not involved in any material joint operations.
Joint ventures, on the other hand, occur when the parties that have joint control of the arrangement have rights to the net assets of the arrangement. Dräger is currently contractually involved in four joint ventures in the form of working groups accounted for using the equity method. These companies are not presented in the notes, as their business in and of itself is not material, their shares have no costs, and these companies, as in the prior year, do not generate any earnings of their own. Drägerwerk AG & Co. KGaA directly and indirectly exerts a significant influence on an associate. In compliance with IAS 28, associates are accounted for according to the equity method.
The consolidated companies of the Dräger Group as of December 31, 2015 are listed under Note 55.
7 EFFECTS OF THE CHANGES IN THE SCOPE OF CONSOLIDATION
On March 16, 2015, Dräger acquired 100 percent of the shares in GasSecure AS, Oslo, Norway, and added this company to the scope of consolidation. GasSecure AS develops and sells wireless gas detection systems for explosion protection in the oil and gas industry. The acquisition of shares enables Dräger to expand its portfolio of gas detection systems.
The purchase price of the shares in GasSecure AS amounted to the equivalent of EUR 58,378 thousand and has already been paid in full. The purchase price included a suspend-ing contingent amount of EUR 5,000 thousand. The condition required that the provisions of safety integrity level 2 for wireless gas detection systems would be met by April 30, 2015. This condition was fulfilled within the time limit prescribed.
The current net outflow of funds in the Group financial statements totaled EUR 58,063 thousand on account of the simultaneous takeover of cash in the amount of EUR 314 thousand.
The acquisition of shares impacted the consolidated balance sheet as follows:
Note 38
Note 55

150 DRÄGER ANNUAL REPORT 2015
EFFECT OF ACQUISITION ON THE CONSOLIDATED BALANCE SHEET
in € thousand
Goodwill 43,980
Other intangible assets 16,431
Property, plant and equipment 35
Other non-current financial assets 61
Inventories 384
Trade receivables and receivables from construction contracts 253
Other current financial assets 1
Other current assets 340
Cash and cash equivalents 314
Total assets acquired 61,799
Deferred tax liabilities 2,521
Other current provisions 16
Trade payables 244
Other current financial liabilities 360
Other current liabilities 280
Total liabilities assumed 3,421
The goodwill remaining after the purchase price allocation relates to expected synergy effects that cannot be capitalized as well as to the expected income related to future in-novations to maintain competitiveness. The purchase price allocation is provisional with regard to the measurement of the intangible assets and the tax assessment. The goodwill is calculated from the purchase price, less the acquired assets and assumed liabilities, and is attributed to the safety division. Goodwill is not deductible for tax purposes.
The fair value of the acquired trade receivables corresponds to a gross amount of EUR 253 thousand. There is no doubt as to the recoverability of these receivables. There are no contingent liabilities.
Since joining the scope of consolidation, the net sales of GasSecure AS of EUR 1,372 thousand, as well as corresponding earnings after income taxes of EUR –2,211 thousand, are included in the consolidated income statement of the Dräger Group. Had GasSecure AS joined the scope of consolidation effective January 1, 2015, net sales of EUR 1,604 thousand, as well as corresponding earnings after income taxes of EUR –2,476 thousand, would have been included in the consolidated income statement of the Dräger Group.
In January 2015, Dräger also acquired the shares of the non-controlling shareholder of Draeger Medikal Ticaret ve Servis Anonim Sirketi, Istanbul, Turkey, of 11.25 percent at a total cost of EUR 4,000 thousand. This means that Dräger is now this subsidiary’s sole shareholder. As a result, non-controlling interests fell by EUR 68 thousand. The statement of changes in equity shows the overall effect on equity.
In August 2015, Dräger Medical GmbH was merged with Drägerwerk AG & Co. KGaA ret-rospectively as of January 1, 2015 as part of our efforts to simplify our corporate structure. HAMUS Grundstücks-Vermietungsgesellschaft mbH & Co. Objekt Lübeck KG, Pullach i. Isartal, became part of Drägerwerk AG & Co. KGaA following the withdrawal of the general partner in November 2015. Dräger Medical Netherlands B.V., the Netherlands, was merged with Dräger Nederland B.V., the Netherlands, in May 2015.
FINANCIAL STATEMENTSNotes of the Dräger Group for 2015
151
8 CONSOLIDATION PRINCIPLES
Purchases are accounted for according to the acquisition method. On initial consolida-tion of acquired subsidiaries, the identifiable assets and liabilities (including contingent liabilities) are measured at their fair values at the date on which control of the subsidiary is obtained. The excess of the cost of the investment over the acquirer’s interest in the net fair value of the identifiable assets and liabilities is recognized as goodwill. All inci-dental purchase costs relating to the acquired company, with the exception of the costs of issuing debt instruments or shares, are recognized as expenses at the time they are incurred. Adjustments to components of the contingent purchase price are recognized as expenses, provided that these are recognized as a liability at the time of acquisition. Non-controlling interests have to be measured either at fair value (“full goodwill method”) or at the proportionally fair value of the acquired assets and assumed liabilities. Pursuant to IAS 36, goodwill is subject to an impairment test to be performed at least once annually (impairment-only approach). Any excess of the Group’s share in equity over the cost of the investment is recognized in profit or loss at the date of acquisition.
Successively acquired shares that do not affect the controlled status of an entity are treated as transactions between providers of equity capital (“entity concept”). The carry-ing amounts of assets and liabilities remain the same. The value shift between Dräger and the non-controlling interests is recorded directly in equity. Any non-controlling interests in equity are shown in the consolidated balance sheet as such (see also Note 35).
When swapping or exchanging shares or engaging in similar transactions, the fair value of the shares given is attributed to the shares received.
Associates and joint ventures are accounted for using the equity method at cost on the date of acquisition. The cost of investments is adjusted to reflect their share in net profit or loss for the period and dividend distributions. The goodwill is included in the carrying values of the investments. Impairments are accounted separately. At each balance sheet date Dräger determines whether there are indications that the shares in the associates are not recoverable. If this is the case, the difference between the carrying value and the recoverable amount is calculated as the impairment loss and recognized in profit or loss as “profit from investments in associates.”
Intercompany receivables and liabilities are netted (elimination of intercompany bal-ances). The carrying values of assets from intercompany goods and services are adjusted for unrealized intercompany profits and losses (elimination of intercompany profits and losses); therefore, these assets are measured at Group cost. For associates, elimination of intercompany profits and losses is waived due to immateriality. Internal net sales are eliminated. Any other intercompany income and expenses are mutually offset (elimination of income and expenses). Deferred tax assets or liabilities from consolidation entries that affect profit or loss are recognized whenever differences in tax expenses or income are expected to reverse in subsequent years.
9 CURRENCY TRANSLATION
In the single entity financial statements of Drägerwerk AG & Co. KGaA and its subsidiaries, foreign currency transactions are translated at the average exchange rate at the date of the transaction.
Exchange differences from the settlement of monetary items in foreign currencies during the year and the measurement of open foreign currency positions at the rate on the balance sheet date are recognized in profit or loss.
Note 35
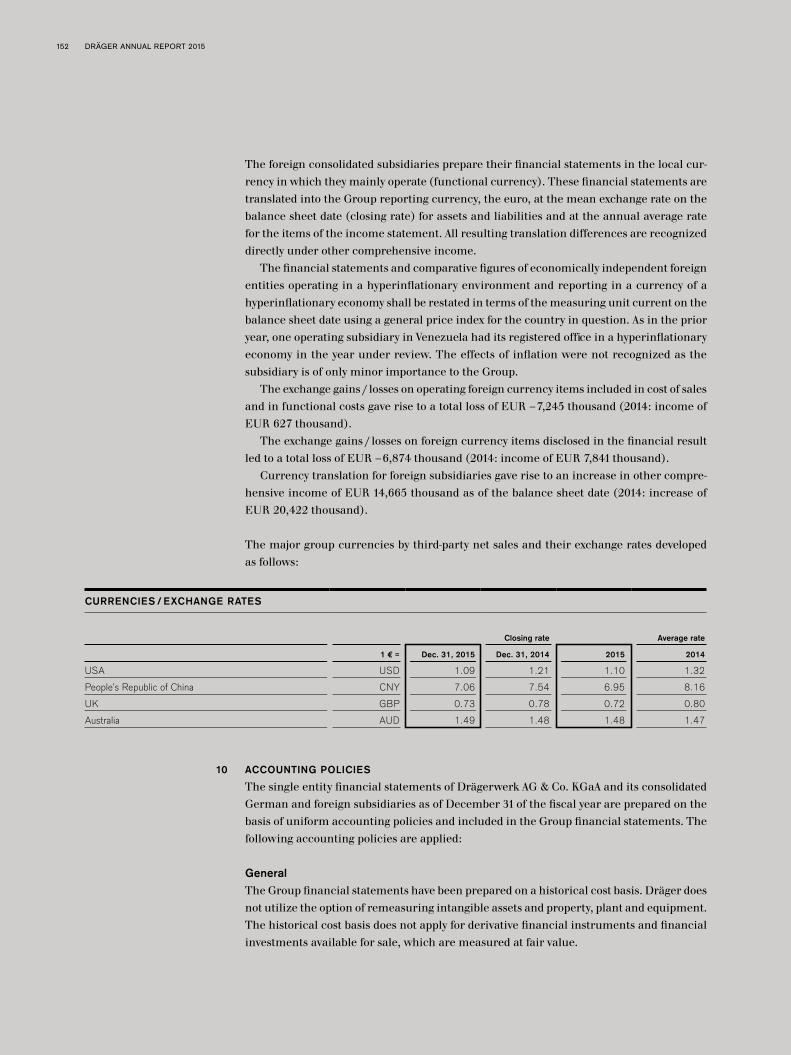
152 DRÄGER ANNUAL REPORT 2015
The foreign consolidated subsidiaries prepare their financial statements in the local cur-rency in which they mainly operate (functional currency). These financial statements are translated into the Group reporting currency, the euro, at the mean exchange rate on the balance sheet date (closing rate) for assets and liabilities and at the annual average rate for the items of the income statement. All resulting translation differences are recognized directly under other comprehensive income.
The financial statements and comparative figures of economically independent foreign entities operating in a hyperinflationary environment and reporting in a currency of a hyperinflationary economy shall be restated in terms of the measuring unit current on the balance sheet date using a general price index for the country in question. As in the prior year, one operating subsidiary in Venezuela had its registered office in a hyperinflationary economy in the year under review. The effects of inflation were not recognized as the subsidiary is of only minor importance to the Group.
The exchange gains/losses on operating foreign currency items included in cost of sales and in functional costs gave rise to a total loss of EUR –7,245 thousand (2014: income of EUR 627 thousand).
The exchange gains/losses on foreign currency items disclosed in the financial result led to a total loss of EUR –6,874 thousand (2014: income of EUR 7,841 thousand).
Currency translation for foreign subsidiaries gave rise to an increase in other compre-hensive income of EUR 14,665 thousand as of the balance sheet date (2014: increase of EUR 20,422 thousand).
The major group currencies by third-party net sales and their exchange rates developed as follows:
CURRENCIES/ EXCHANGE RATES
Closing rate Average rate
1 € = Dec. 31, 2015 Dec. 31, 2014 2015 2014
USA USD 1.09 1.21 1.10 1.32
People’s Republic of China CNY 7.06 7.54 6.95 8.16
UK GBP 0.73 0.78 0.72 0.80
Australia AUD 1.49 1.48 1.48 1.47
10 ACCOUNTING POLICIES
The single entity financial statements of Drägerwerk AG & Co. KGaA and its consolidated German and foreign subsidiaries as of December 31 of the fiscal year are prepared on the basis of uniform accounting policies and included in the Group financial statements. The following accounting policies are applied:
GeneralThe Group financial statements have been prepared on a historical cost basis. Dräger does not utilize the option of remeasuring intangible assets and property, plant and equipment. The historical cost basis does not apply for derivative financial instruments and financial investments available for sale, which are measured at fair value.
FINANCIAL STATEMENTSNotes of the Dräger Group for 2015
153
The historical costs are determined on the basis of the fair value of the consideration transferred on the date of acquisition. Fair value is the price that would be received to sell an asset or paid to transfer a liability in an orderly transaction in the principal (or most advantageous) market at the measurement date under current market conditions regardless of whether that price is directly observable or estimated using another valuation technique. This means of determining fair value does not apply to the following at Dräger:
– Leasing transactions within the scope of IAS 17; and– Measurements that have some similarities to fair value but are not fair value.
A differentiation is also made between the dependence on observable market data in the following hierarchies when determining fair value; this differentiation must be disclosed:
Level 1: In the event of an active market for the asset to be measured to which the en-tity has access, the fair value shall be the value determined and published on this market (mark to market).
Level 2: In the event that there is no active market for the financial instrument to be measured, the timely and observable market or transaction prices for assets that are sub-stantially the same shall be used where these exist.
Level 3: In the event that neither an active market nor timely market or transaction prices exist for the financial instrument to be measured, the fair value shall be determined using accepted valuation techniques. These also include methods that derive prices from past market transactions.
Net sales recognitionNet sales are recognized when control, for instance the risks and rewards incident to ownership, has been transferred to the buyer. Net sales includes the income that can be determined reliably, if it is probable that the economic benefit will flow to the entity.
Net sales from services are recognized when the service has been rendered, if the amount of income can be measured reliably and it is probable that the economic benefit will flow to the entity. Net sales that cannot be reliably estimated are only recognized to the extent of the expenses recognized that are recoverable.
If several deliveries and/or services are provided to the same customer at the same time or within a short time frame and are included in a single civil law contract with a single price (multi-element contracts), this transaction is split into a number of different elements and the regulations pertaining to net sales recognition are applied to the indi-vidual components of the transaction to reflect the economic content of the transaction appropriately.
Net sales are reduced by sales deductions, if any.In accordance with IAS 11, construction contracts are recognized using the stage of
completion method. The stage of completion which has to be established to this end in the case of fixed price contracts is determined using the cost-to-cost method (input-based meth-od). This method determines the stage of completion based on the costs incurred as of the balance sheet date in relation to the estimated total cost. If the outcome of a construction contract can be estimated reliably, the revenues are recorded at the amount of contract costs incurred plus a profit margin. The contracts are recognized under receivables from construction contracts or, if a loss is expected, under liabilities from construction con-

154 DRÄGER ANNUAL REPORT 2015
tracts. Partial payments received are deducted from the receivable. If the partial payments received exceed the receivable, the balance is recognized under liabilities.
Intangible assetsGroup-controlled intangible assets from which future economic benefits are expected to flow to the Group and which can be reliably measured are recognized at cost, provided that these are clearly identifiable and are therefore to be distinguished from goodwill.
In the event of the acquisition of intangible assets within the scope of a business com-bination, the cost corresponds to the fair value on the date of acquisition.
The intangible assets are amortized on a straight-line basis over their expected useful lives. Borrowing costs that are material and directly attributable to the acquisition, con-struction or production of a qualifying asset are capitalized as part of the cost of that asset in accordance with IAS 23.
Purchased software for internal use is capitalized as a separate asset unless it is an integral part of the related hardware. Costs incurred in connection with the installation and implementation of purchased software are recognized as incidental purchase costs of the same.
Expenses required for maintaining the original use of the software (functionality) as well as updates via hot packages shall be expensed as incurred.
Dräger’s research costs include direct research costs as well as the attributable over-heads and are charged as expense in the period in which they are incurred.
Internal development costs for products, including their software, as well as software for internal use are capitalized if the following conditions are met:
– The completion of the product is technically feasible.– Management intends to complete the product in order to use or sell it. – The ability to use or sell the product.– It can be proven that the product will likely generate future economic benefits. – Adequate technical, financial and other resources are available to complete the develop-
ment and use or sell the product. – The development costs attributable to the product can be measured reliably.
However, due to strict legal and safety requirements for Dräger Group products, this means that the product must have already been approved for sale in the major markets. If not all criteria for capitalization are met, internal development costs for products, including their software, are expensed as incurred (as in the case of research costs).
Intangible assets generally have a useful life of four years, patents and trademarks are amortized over their term (eleven years on average) using the straight-line method.
Goodwill recognized as an intangible asset is disclosed at cost less accumulated impair-ment losses. Under IAS 36, amortization is no longer charged on a systematic basis (please also refer to our comments under “Impairment losses on intangible assets and property, plant and equipment”).
FINANCIAL STATEMENTSNotes of the Dräger Group for 2015
155
Property, plant and equipmentItems of property, plant and equipment are stated at cost less accumulated depreciation and accumulated impairment losses.
The cost of purchase of an item of property, plant and equipment includes its purchase price and any costs directly attributable to bringing the asset to the location and condi-tion necessary for it to be capable of operating in the manner intended. Production costs comprise attributable direct and overhead costs as well as depreciation attributable to the production process. Borrowing costs that are material and directly attributable to the ac-quisition, construction or production of a qualifying asset are capitalized as part of the cost of that asset in accordance with IAS 23. Subsequent expenditure incurred after the assets have been put into operation, such as ongoing repairs and maintenance and overhaul costs, is charged as expense in the period in which the costs are incurred.
Whenever it is probable that the expenditure will result in future economic benefits in excess of the originally assessed standard of performance of the existing asset flowing to the Company, the expenditure is recognized as an additional cost of property, plant and equipment.
Depreciation is computed on a straight-line basis over the following estimated useful lives:
– Office and factory buildings 20 to 40 years– Other buildings 15 to 20 years– Production plant and machinery 5 to 8 years– Other plant, factory and office equipment
(excluding low-value assets) 2 to 15 years
Land is not depreciated.Where significant parts of property, plant and equipment contain components with
substantially different useful lives, such components are recorded separately and depreci-ated over their useful lives.
The useful life and depreciation methods used for property, plant and equipment are re-viewed annually to ensure that the method and period of depreciation are consistent with the expected pattern of economic benefits from items of property, plant and equipment.
Assets under construction are stated at cost.
Investment allowancesWhen determining the carrying amount of the relevant asset, investment allowances (gov-ernment grants) for assets are deducted from the cost. Grants are therefore recognized in profit or loss through a reduced depreciation charge over the useful life of the depreciable asset.
Impairment losses on intangible assets and property, plant and equipmentIf there are external or internal indicators of impairment of intangible assets or property, plant and equipment on the balance sheet date, these items are subjected to an impairment test pursuant to IAS 36. If the carrying value of the asset exceeds its recoverable amount (the higher of its value in use and net realizable value), an impairment loss is charged. If no future cash flows independently generated from other assets can be attributed to individual
156 DRÄGER ANNUAL REPORT 2015
assets, the recoverable amount is tested for impairment on the basis of the cash-generating unit to which the asset belongs.
An impairment test is to be performed on goodwill and intangible assets with indetermin-able useful lives annually and whenever there are indications that it may be impaired. The impairment test for goodwill is performed on the basis of the cash-generating unit to which the asset belongs; this is expected to benefit from the underlying business combination.
Goodwill is tested for impairment using the discounted cash flow method based on the operational five-year plan and, as in the prior year, an assumed sustained growth of one percent in the subsequent period is used to test the goodwill of the individual cash gener-ating units. A risk-adjusted interest rate is used for discounting. Goodwill is based on the operating business segments in accordance with IFRS 8.
If the reasons for an impairment loss cease to apply, write-ups are performed, except in the case of goodwill.
Financial instrumentsA financial instrument is any contract that gives rise to a financial asset of one entity and a financial liability or equity instrument of another entity.
The Dräger Group holds the following financial assets:
– Other shareholdings,– Securities,– Loans and other receivables,– Derivative financial assets, – Other financial assets, and– Cash and cash equivalents.
The Dräger Group reports the following financial liabilities:
– Liabilities to banks and loan liabilities,– Trade payables,– Derivative financial liabilities, and– Other financial liabilities.
Financial assetsFinancial assets are divided into the following categories:
– Financial assets measured at fair value through profit and loss,– Loans and receivables,– Held-to-maturity investments, and– Available-for-sale financial assets.
Financial assets are initially recognized at fair value. Incidental purchase costs (transaction fees), such as commission, agents’ costs, notary costs or taxes and fees, are only to be allocat-ed to financial assets or liabilities whose changes in value are not recognized in profit or loss.For purchases or sales of financial assets at normal market conditions, the settlement date is relevant, i. e. the date on which the asset is delivered to or supplied by Dräger. Purchases

FINANCIAL STATEMENTSNotes of the Dräger Group for 2015
157
or sales at normal market conditions are when assets have to be delivered within the statu-tory or conventional time scale applicable to the location where the transaction took place.
Financial assets may be classified, upon initial recognition, at fair value through profit or loss if they fulfill the requirements of the IASB (fair value option). This option has not been exercised by the Dräger Group to date.
Loans and receivables are non-derivative financial assets with fixed or determinable payments that are not quoted in an active market. After initial recognition, loans and receivables are recognized at amortized cost less any impairment losses and discounting (effective interest method).
Securities with fixed or determinable payments and fixed maturities that the Dräger Group has the positive intent and ability to hold to maturity are classified as held-to-ma-turity investments and recognized at amortized cost using the effective interest method.
Available-for-sale financial assets are those non-derivative financial assets that are desig-nated as available for sale and are not classified as belonging to any of the other categories. This category comprises other investments and securities, which are measured at fair value, or, if not determinable, at amortized cost. Unrealized gains and losses from the change in fair value are recorded in equity, taking the tax effects into account.
Changes in fair value are not recognized in profit or loss until the asset is sold, or if it is permanently impaired.
Financial assets held for or due in more than twelve months are disclosed as non-cur-rent financial assets.
In subsequent measurements, financial assets are subject to an impairment test. As part of a two-stage method, the first step is to examine whether there is substantial evidence of impairment following the initial recognition (i.e. it is highly probable that the borrower will become insolvent or the obligor is in considerable financial difficulties). The second step is to determine the extent of the impairment on the basis of expected future cash flows. The carrying values of loans and receivables are generally adjusted through the use of allowance accounts. Assets and allowances are written off if it is established that the finan-cial assets are determined to be impaired. In the event of the unforeseeable impairment of receivables, these receivables are written off directly, not using the allowance account.
The effects of the impairment loss and of the subsequent measurement by applying the effective interest method are recognized in profit or loss.
A financial asset shall be removed from the seller’s balance sheet when the rights to cash flows from the asset have expired or the rights to cash flows and significant opportunities and risks have been transferred and the seller no longer has any control over the asset.
Financial liabilitiesFinancial liabilities are divided into the following categories: fair value through profit or loss or other financial liabilities.
Financial liabilities are initially recognized at fair value. Transaction fees directly attrib-utable to the issue of the liability are deducted on the initial measurement of the liabilities when changes in value are not recognized in profit or loss.
The subsequent measurement of liabilities held for trading, as they were acquired with the intention of repurchasing them in the short term, is always recognized in profit or loss.Other financial liabilities are disclosed at amortized cost in subsequent periods, taking into account repayment amounts as well as premiums and discounts. Any differences between

158 DRÄGER ANNUAL REPORT 2015
the payment (less transaction fees) and repayment are recognized in the income statement over the term of the loan, using the effective interest method.
Financial assets and liabilities are offset and reported at net amounts if there is a right at the present time to set off the reported amounts against each other and the intention is to settle on a net basis or to settle the associated liability simultaneously with the real-ization of the asset.
Non-current liabilities that do not bear interest or bear interest at a rate substantially below market rates are disclosed at present value. Premiums and discounts are allocated over the term of the liability using the effective interest method.
Financial liabilities held for, or due in more than twelve months are disclosed as non-current financial liabilities.
Financial liabilities are derecognized when the corresponding obligation has been settled, cancelled or expired.
Derivative financial instrumentsThe Dräger Group uses derivatives as part of its risk management to hedge currency and interest rate risks.
Derivatives are recognized at fair value. For derivative financial instruments that meet the hedge accounting criteria of IAS 39, the changes in fair value are recognized depending on the type of hedge.
In a hedge of the exposure to changes in fair value of a recognized asset or liability (fair value hedge), the changes in the fair value of both the hedged item and the derivative are recognized in profit or loss. Changes in the fair value of the exposure to variability in future cash flows (cash flow hedge) are recognized directly under other comprehensive income if the hedge is effective. These amounts are recognized in profit or loss until the hedged item affects profit or loss.
Derivative financial instruments that are not designated as effective hedging instru-ments in accordance with IAS 39 are classified as held for trading and recognized at fair value. The fair value of listed derivatives is the positive or negative market value. In the absence of a market value, the fair value is determined according to generally accepted methods of financial mathematics such as the discounting of expected future cash flows.
In hedging foreign currency risks posed by recognized assets or recognized liabilities, the Dräger Group does not use hedge accounting in accordance with IAS 39 to recognize hedges as the profit or loss from the currency translation of the hedged item pursuant to IAS 21 affects the income statement at the same time as the profit or loss from the mea-surement of the hedging instrument.
We refer to Note 46 for details of the nature and scope of the Dräger Group’s existing financial instruments.
InventoriesInventories comprise raw materials, consumables and supplies, work in process and fin-ished goods and merchandise. They are measured at the lower of cost and net realizable value. Costs are measured using the average cost method. Cost comprises production-re-lated full costs calculated on the basis of normal capacity utilization. In addition to direct materials and production costs, it includes materials and production overheads as well as special direct production costs allocable to the production process. Depreciation on
Note 46

FINANCIAL STATEMENTSNotes of the Dräger Group for 2015
159
items classified as property, plant and equipment used in the production process is also included. Borrowing costs that are material and directly attributable to the acquisition, construction or production of a qualifying asset are capitalized as part of the cost of that asset in accordance with IAS 23.
Net realizable value is the estimated selling price in the ordinary course of business less the estimated costs of completion and the estimated costs necessary to make the sale. Unrealizable inventories are written off.
The finished goods and merchandise item also includes rental and demo equipment, which is taken over by the customers after a short period of time. The net realizable value declines by 25 percent per year over the period during which rental and demo equipment is used.
Cash and cash equivalentsCash and cash equivalents comprise cash on hand and bank balances, including short-term deposits; the availability of these is restricted in some cases.
Participation capitalIn accordance with IAS 32 and IAS 39, the individual Dräger participation certificate series are recognized pursuant to the commercial value of their contractual agreements. Series A certificates are classified as equity. However, they include an obligation with a value to the amount of the minimum return which is recognized as liability.
Series K and D certificates are classified as debt, but the premium on the issue price exceeding Dräger’s obligation is recognized as equity.
Effects recognized in equity reflect the participation certificates’ equity component (including tax effects) and corresponding past compounding effects.
The components recognized as debt are measured at amortized cost using the effective interest method (present value of repayment obligation). Please refer to Note 36 for further information on the individual Dräger participation certificate series.
The compounding of liabilities from participation certificates and the minimum divi-dend for series A and K are included in the interest expense of the respective period. The dividend for series D certificates and the amount exceeding the minimum dividend for series A and K certificates are paid with equity capital.
DividendsDividends are recognized in profit or loss once a legal right exists to receive payment.
Provisions for pensions and similar obligationsThe Dräger Group’s provisions for pension obligations and similar obligations are calculat-ed annually by actuaries in compliance with IAS 19 (revised) using the projected unit cred-it method allowing for future adjustments to salaries and pensions and employee turnover.
Remeasurements due to changes in demographic and/or financial assumptions and experience based adjustments are immediately recognized directly under other compre-hensive income taking account of deferred taxes. These are not subsequently recognized in Group profit or loss.
Note 36

160 DRÄGER ANNUAL REPORT 2015
The net interest expense is calculated by multiplying the chosen interest rate by the perfor-mance-oriented net liability or net asset at the beginning of the year. The performance-ori-ented net liability or net asset is the balance of defined benefit obligations and plan assets.
With effect as of December 2007, funds from the German pension plan were paid into a new fund including a settlement account and secured in favor of the employees via a contractual trust arrangement (CTA), meaning that they only serve to cover and finance the Company’s direct pension obligations in Germany.
Any excess of plan assets over the pension obligations is recognized as an asset at a maximum of the present value of the economic benefit to the Company (due to a refund of contributions or reduction of future contributions) plus any past service cost not yet recognized (asset ceiling).
Public pension schemes, which are classified as public plans pursuant to IAS 19, are also defined contribution plans. The Group does not accrue any other payment obligations once the due payments have been made. The amounts are recognized as pension expenses when the payments are due. Paid amounts are recognized as other receivables if these advance payments result in a reimbursement or a reduction in future payments.
Other provisionsA provision is recognized when the entity has a present obligation (legal or constructive) to a third party as a result of a past event and it is probable that an outflow of resources representing economic benefits will be required to settle the obligation, and a reliable estimate can be made of the amount of the obligation.
Provisions are stated at the amount expected to be required to settle the obligation. This settlement amount also includes cost increases that have to be taken into account on the balance sheet date. Non-current provisions are discounted to the balance sheet date using appropriate pre-tax market rates. These interest rates are determined taking into account the risk and the term of the provision, if the risk had not already been recognized when determining future payments. Provisions are not offset against rights of recourse.
Other provisions include long-term employee benefits (other than provisions for pension obligations and similar obligations). These are measured based on the net balance of the present value of the obligation at the reporting date less the fair value at the reporting date of plan assets out of which the obligations are to be settled directly. The present value of the obligation and plan assets are determined in the same way as provisions for pensions and similar obligations.
Other provisions additionally include post-employment benefits, which are employee benefits (not including pensions) that are mainly paid in connection with personnel-relat-ed restructuring, e. g. one-time payments, periodic payments over a number of years, as well as salary payments during leaves of absence. An entity shall recognize termination benefits as a liability and an expense when the entity is demonstrably committed to ei-ther terminate the employment of an employee or group of employees before the normal retirement date or provide termination benefits as a result of an offer made in order to encourage voluntary resignation. In the case of an offer made to encourage voluntary resignation, the measurement of termination benefits should be based on the number of employees expected to accept the offer. Additional payments as part of a pre-retirement part-time work agreement shall be recognized periodically from the time the obligation arises (if necessary taking into account minimum periods of service) until the end of the employment phase.
FINANCIAL STATEMENTSNotes of the Dräger Group for 2015
161
Income taxesThe tax expense for the period was made up of current and deferred taxes. Taxes are report-ed in the income statement, unless they relate to items recognized in other comprehensive income. In this case, the taxes are also recognized in other comprehensive income.
The Dräger Group companies are required to pay income taxes in several countries. Current tax expenses are determined using the tax regulations applicable on the balance sheet date in the individual countries. When determining global income tax receivables and liabilities, the interpretation of tax regulations in particular can carry a degree of uncertainty. It cannot be ruled out that the various fiscal authorities have different per-spectives with regards to the correct interpretation of tax standards. The associated uncer-tainty is taken into account in that uncertain tax receivables and liabilities are estimated as soon as management is of the view that the probability of occurrence exceeds 50 per-cent. Changes in the assumptions as to the correct interpretation of tax standards such as on account of amended prevailing jurisdiction are consolidated in the accounting of uncertain tax receivables and liabilities accordingly in the corresponding fiscal year. The likely estimated tax payment is taken as the best estimate when accounting for uncertain income tax positions.
Pursuant to IAS 12, deferred taxes are determined using the balance sheet-based lia-bility method. Deferred taxes on loss carryforwards and temporary differences between the Group financial statements and the tax accounts of the consolidated companies are recognized. Deferred tax liabilities are not recognized if they result from the initial rec-ognition of goodwill.
Deferred tax assets are only recognized to the extent that it is probable that taxable profit will be available against which the deductible temporary difference can be offset. Deferred tax assets and liabilities are only offset if they relate to the same taxation authority.
Deferred tax liabilities resulting from temporary differences in connection with invest-ments in subsidiaries are recognized unless the timing of the reversal of the temporary differences can be controlled by the Group and it is probable that the temporary differences will not be reversed in the foreseeable future.
Deferred taxes are measured using the tax rates (and tax laws) enacted at the balance sheet date that are expected to apply to the period when the deferred tax asset is realized or the deferred tax liability is settled.
Share-based paymentIn fiscal year 2015, as in fiscal year 2013, Dräger offered all Dräger employees in Germany share-based compensation in the form of an employee share program. This is designed to increase employees’ identification with the Company and Dräger’s attractiveness as an employer.
This program allows employees who acquire Dräger preferred shares within a spec-ified period of time within the fiscal year to receive one preferred share as a bonus for every three Dräger preferred shares purchased (matching model). These Dräger preferred shares are subject to a two-year holding period. The employee does not need to remain at Dräger during this period. The bonus preferred shares are not new shares but treasury preferred shares repurchased by Dräger on the capital market and transferred to the em-ployee’s securities account.
These bonus preferred shares are measured at fair value on the entry date (grant date). The entry date is the date on which Dräger and the employees conclude the share-based

162 DRÄGER ANNUAL REPORT 2015
payment agreement. The fair value of the bonus preferred shares is the price of Dräger’s preferred shares on the stock exchange.
LeasesLeases are all agreements whereby the lessor conveys to the lessee in return for payment the right to use an asset for an agreed period of time.
A) FINANCE LEASES
Dräger Group as lesseeLeases of assets under which substantially all the risks and rewards of ownership are effectively transferred to the lessee are classified as finance leases.
At inception of the lease, finance leases are recognized as assets and liabilities in the balance sheet at amounts equal to the fair value of the leased property at the inception of the lease or, if lower, at the present value of the minimum lease payments. In calculating the present value of the minimum lease payments, the discount factor is the interest rate implicit in the lease if this is practicable to determine. If this is not the case, the lessee’s incremental borrowing rate is used. Initial direct costs are included as part of the asset. Lease payments are apportioned between the finance charge and the reduction of the outstanding liability. The finance charge is allocated to periods during the lease term so as to produce a constant periodic rate of interest on the remaining balance of the liability for each period. The corresponding interest expense is recognized in the interest result.
A finance lease gives rise to a depreciation expense for the capitalized asset as well as a finance expense for each period. The depreciation policy for leased assets is consistent with that for corresponding depreciable assets which are owned by the Company.
Dräger Group as lessorAssets held under a finance lease are recognized in the balance sheet and presented as a receivable at an amount equal to the net investment (present value of the gross investment) in the lease. The recognition of finance income is based on a pattern reflecting a constant periodic rate of return on the lessor’s net investment outstanding in respect of the finance lease. The corresponding interest income is recognized in the interest result. Initial direct costs are capitalized and allocated as an expense over the term of the lease.
B) OPERATING LEASES
Dräger Group as lesseeLeases of assets under which substantially all the risks and rewards of ownership are effec-tively retained by the lessor are classified as operating leases. Lease payments under this lease are recognized as an expense in the function in which they are incurred.
Dräger Group as lessorAssets subject to operating leases are presented in the balance sheet according to the nature of the asset. Lease income from these leases is recognized in profit or loss on a straight-line basis over the lease term and, depending on the lease object, reported in net sales (Dräger products) or other operating income (e. g. buildings).
FINANCIAL STATEMENTSNotes of the Dräger Group for 2015
163
Use of estimates and assumptionsIn preparing the Group financial statements in accordance with IFRS, assumptions and estimates have to be made which have an effect on the recognition of assets and liabilities, the disclosure of contingent liabilities as of the balance sheet date and the recognition of income and expenses. Actual amounts may differ from these assumptions and estimates.
The estimates pertain to the following areas in particular:Beside Dräger’s voting rights, other matters and circumstances need to be taken into
account when determining whether a special purpose entity or a company is controlled to such an extent that it should be included as a subsidiary in the Group financial statements. Assumptions need to be taken into account in particular in those cases in which other contractual rights or constructive circumstances exist so as to determine whether Dräger can use its power over the company to influence the company’s variable returns. Changes to contractual agreements or facts or circumstances are monitored with regard to their potential impact on the assumptions made.
In the case of two real estate companies, many corporate measures are predetermined on account of their narrow business purposes, meaning that they do not need to be consol-idated on the basis of voting rights. However, Dräger has contractual purchasing options for these properties, which are integrated in Dräger’s premises. As a result, by managing the residual value of these properties Dräger exercises control over the variable returns of these companies and therefore over the own returns from the investments. As in the prior year, these real estate companies therefore need to be included in Dräger’s scope of consolidation as subsidiaries. Rational expectations as to the development of real estate prices were used when assessing the management of the residual values.
As part of the annual assessment of the recoverable amount of capitalized goodwill, Dräger’s management uses estimates to arrive at its conclusions. Management uses data from internal analyses and forecasts with regards to anticipated earnings trends and data from external information sources with regards to other analysis parameters.
Other assumptions and estimates mainly relate to the determination of useful lives throughout the Group. At least once a year, the Group assesses the applied useful lives and carries out adjustments if necessary. Useful lives are determined on the basis of market observations and empirical values.
The recoverability of receivables is subject to the assessment and valuation of individual customers and their creditworthiness. This takes into account current economic develop-ments as well as experience from past receivable losses.
Customer-specific construction contracts are recognized using the stage of completion method. The most important measurements used for the careful determination of the stage of completion include total costs, total revenues and risks related to the contract as well as other estimates. Management continuously assesses all estimates made in connec-tion with such construction contracts.
Defined benefit pension plans and similar obligations are recognized in accordance with actuarial methods. These methods are based on actuarial assumptions such as the dis-count rate, wage and salary trends, increases in pensions and employee turnover. The used discount factors are calculated on the basis of the effective market return on high-quality corporate bonds. Deviations of actuarial assumptions from actual developments could have serious implications for the measurement of defined pension plans and similar obligations.
164 DRÄGER ANNUAL REPORT 2015
The results of sensitivity analyses for the discount rate, future increases in pensions and life expectancy as stated in Note 37 provide indications of these effects.
The Group has set aside provisions for various risks. The likelihood of these provisions being used is assessed on the basis of prior experience and assessments of individual busi-ness transactions. Adjusting events were taken into account accordingly.
Assets and liabilities recognized at fair value are measured on the basis of available market data. In the event that such data do not exist, Dräger also refers to the assessments of qualified external experts.
The Group has to pay income taxes in several countries. This involves a specific calcu-lation of the expected actual income tax exposure for each tax object and an assessment of temporary differences resulting from the different treatment of certain items for IFRS and tax reporting purposes. Management has to make assumptions when calculating effective and deferred taxes. Tax estimates are made in accordance with local laws.
Note 37

FINANCIAL STATEMENTSNotes of the Dräger Group for 2015
165
Notes to the income statement
11 NET SALES
For the breakdown of net sales by sales types, please see the table below. A detailed seg-ment report, including net sales by regions, is provided in Note 49. Please refer to Note 3 for the reconciliation of the prior year’s presentation of net sales by division.
NET SALES
in € thousand 2015 2014 Change in %
Net sales from the sale of products and goods 1,671,836 1,565,273 6.8
Net sales from the sale of services and accessories (including replacement parts) 846,006 789,869 7.1
Net sales from construction contracts 91,078 79,514 14.5
Net sales 2,608,920 2,434,656 7.2
In the reporting year, as in the prior year, there were no customers whose share of net sales exceeded 10 percent of Group net sales.
12 COST OF SALES
Cost of sales include the following:
COST OF SALES
in € thousand 2015 2014
Direct materials 741,054 672,667
Direct labor 274,542 264,569
Direct costs 1,015,596 937,236
Material overheads 77,518 71,254
Production overheads 231,186 232,762
Other indirect costs 112,950 55,382
Indirect costs 421,653 359,398
Cost of sales 1,437,249 1,296,634
Production overheads comprise amortization of production-related intangible assets and depreciation of property, plant and equipment as well as costs of internal transportation until delivery to the distribution warehouse.
Cost of warranties and inventory allowances, among others, are recognized in other indirect costs.
Costs of sales include inventory variances, measurement differences and scrapping. Income from the reversal of previously impaired inventories reduces the cost of sales.
Note 49
Note 3
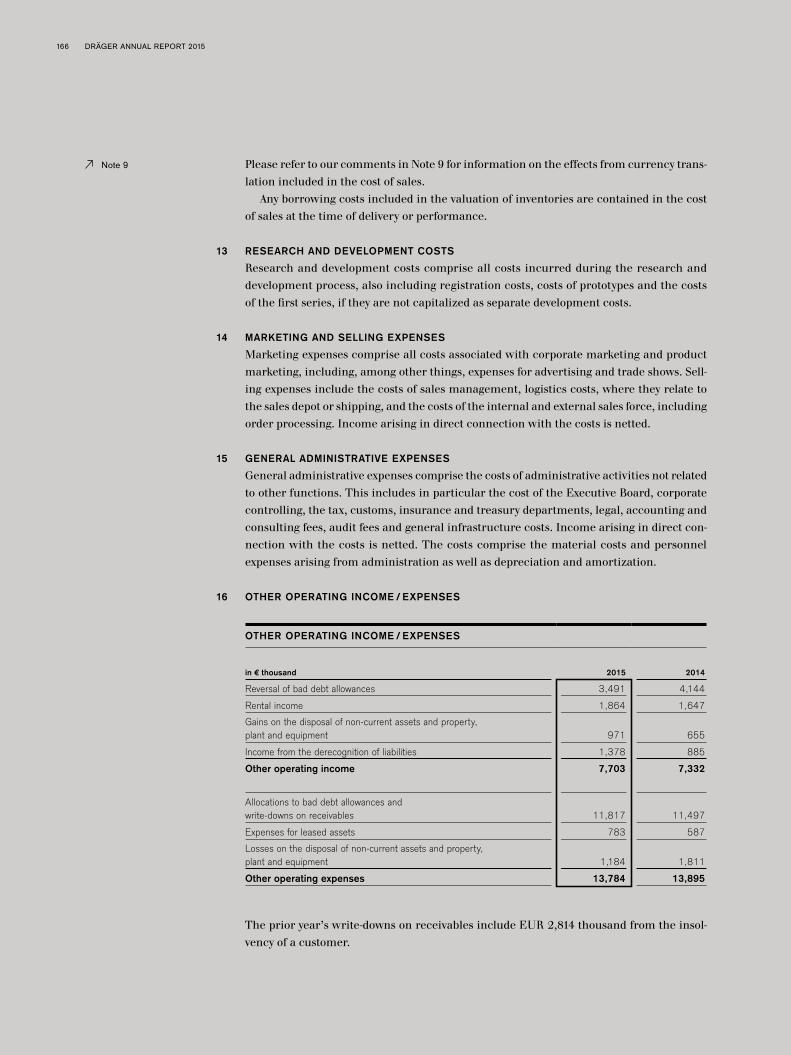
166 DRÄGER ANNUAL REPORT 2015
Please refer to our comments in Note 9 for information on the effects from currency trans-lation included in the cost of sales.
Any borrowing costs included in the valuation of inventories are contained in the cost of sales at the time of delivery or performance.
13 RESEARCH AND DEVELOPMENT COSTS
Research and development costs comprise all costs incurred during the research and development process, also including registration costs, costs of prototypes and the costs of the first series, if they are not capitalized as separate development costs.
14 MARKETING AND SELLING EXPENSES
Marketing expenses comprise all costs associated with corporate marketing and product marketing, including, among other things, expenses for advertising and trade shows. Sell-ing expenses include the costs of sales management, logistics costs, where they relate to the sales depot or shipping, and the costs of the internal and external sales force, including order processing. Income arising in direct connection with the costs is netted.
15 GENERAL ADMINISTRATIVE EXPENSES
General administrative expenses comprise the costs of administrative activities not related to other functions. This includes in particular the cost of the Executive Board, corporate controlling, the tax, customs, insurance and treasury departments, legal, accounting and consulting fees, audit fees and general infrastructure costs. Income arising in direct con-nection with the costs is netted. The costs comprise the material costs and personnel expenses arising from administration as well as depreciation and amortization.
16 OTHER OPERATING INCOME/ EXPENSES
OTHER OPERATING INCOME/ EXPENSES
in € thousand 2015 2014
Reversal of bad debt allowances 3,491 4,144
Rental income 1,864 1,647
Gains on the disposal of non-current assets and property, plant and equipment 971 655
Income from the derecognition of liabilities 1,378 885
Other operating income 7,703 7,332
Allocations to bad debt allowances and write-downs on receivables 11,817 11,497
Expenses for leased assets 783 587
Losses on the disposal of non-current assets and property, plant and equipment 1,184 1,811
Other operating expenses 13,784 13,895
The prior year’s write-downs on receivables include EUR 2,814 thousand from the insol-vency of a customer.
Note 9

FINANCIAL STATEMENTSNotes of the Dräger Group for 2015
167
17 FINANCIAL RESULT
FINANCIAL RESULT (BEFORE INTEREST RESULT)
in € thousand 2015 2014
Share in the profits from investments in associates 102 250
Other expenses from investments in associates –46 –21
Profit from investments in associates 55 229
Income from other investments 161 297
Profit from other investments 161 297
Net result from foreign exchange transactions –6,874 7,841
Earnings from the disposal of other financial assets and securities –12 –19
Write-downs on other financial assets –10 0
Write-ups on other financial assets 3 4
Other financial income 82 114
Other financial expenses –31 –133
Other financial result –6,842 7,807
Financial result (before interest result) –6,625 8,333
INTEREST RESULT
in € thousand 2015 2014
Other interest and similar income 3,752 1,948
Interest income from bank balances 1,125 1,059
Interest contained in lease payments 243 218
Income from other securities and loans 114 151
Income from interest hedges 4 3
Interest and similar income 5,238 3,379
Interest expenses from bank liabilities –10,072 –14,014
Other interest and similar expenses –5,632 –7,026
Expenses from interest hedges –4,211 –5,096
Interest contained in lease payments –908 –856
Interest portion contained in pension provisions –669 –526
Distribution for participation certificates –568 –551
Compounding of participation certificates –345 –345
Interest and similar expenses –22,404 –28,414
Interest result –17,166 –25,035

168 DRÄGER ANNUAL REPORT 2015
Other interest and similar expenses include expenses incurred from the compounding of provisions (see also Note 37).
18 INCOME TAXES
COMPOSITION OF TAX EXPENSE
in € thousand 2015 2014
Germany –2,707 4,172
Abroad –32,558 –32,924
Current tax expense –35,265 –28,752
Germany
Deferred tax income /expense from temporary differences 22,450 –7,567
Deferred tax expense from loss carryforwards –3,471 –8,836
Deferred tax income/expense (Germany) 18,979 –16,403
Abroad
Deferred tax income /expense from temporary differences 1,619 –3,222
Deferred tax expense from loss carryforwards –1,566 –519
Deferred tax income/expense (abroad) 53 –3,741
Deferred tax income/expense 19,032 –20,144
Income taxes –16,233 –48,896
Deferred tax expenses include an effect of EUR 5 thousand (2014: EUR 295 thousand) from the change in tax rates.
A deferred tax liability of EUR 3,891 thousand (2014: EUR 3,308 thousand) was recog-nized for temporary differences in connection with retained profits of foreign subsidiar-ies. No deferred tax liabilities are recognized for temporary differences associated with investments in subsidiaries to the amount of EUR 9,944 thousand (2014: EUR 12,802 thousand) as the sale of these companies or a distribution of retained profits is unlikely in the foreseeable future.
Payment of dividends to the shareholders of the parent companies does not have any income tax consequences.
Note 37

FINANCIAL STATEMENTSNotes of the Dräger Group for 2015
169
RECONCILIATION OF EXPECTED INCOME TAX EXPENSE TO RECOGNIZED INCOME TAX EXPENSE
in € thousand 2015 2014
Earnings before income taxes 49,521 153,562
Expected income tax expenses (tax rate: 31.0%; 2014: 30.92%) –15,352 –47,481
Reconciliation:
Effects from other periods and non-deductible withholding tax –3,014 4,447
Effect from change in tax rates –5 –295
Effect from different tax rates 7,993 4,425
Tax effect of non-deductible expenses and tax-free income –5,646 –11,113
Recognition and measurement of deferred tax assets –299 1,090
Other tax effects 90 31
Recognized income tax expenses –16,233 –48,896
Tax rate (%) overall 32.8 31.8
The parent company’s tax rate of 31.0 percent (2014: 30.92 percent) was used as the ex-pected tax rate. The expected tax rate is composed of a corporate income tax component of 15.83 percent, including the 5.5 percent solidarity surcharge (2014: 15.83 percent), and a trade tax component of 15.17 percent (2014: 15.09 percent). The increase was due to a change in the composition of the trade tax rate.
Domestic deferred taxes are determined on the basis of a 31.5 percent tax rate (2014: 30.92 percent). The change was due to increases in the trade tax rate.
The following deferred tax assets and deferred tax liabilities relate to recognition and measurement differences in the individual balance sheet items:

170 DRÄGER ANNUAL REPORT 2015
DEFERRED TAX ASSETS/ DEFERRED TAX LIABILITIES
Deferred tax assets Deferred tax liabilities
in € thousand 2015 2014 2015 2014
Intangible assets 6,012 7,258 6,536 5,463
Property, plant and equipment 1 4,681 5,547 13,511 12,255
Other non-current financial assets 294 – 516 901
Other non-current assets 2 – – 93 –
Non-current assets 1, 2 10,987 12,805 20,656 18,619
Inventories 1, 2 17,360 13,362 3,409 4,209
Trade receivables and receivables from construction contracts 1, 2 4,159 6,228 1,523 5,030
Other current financial assets 1,037 1,387 3,460 9,636
Other current assets 189 633 1,222 2,332
Current assets 1, 2 22,745 21,610 9,614 21,207
Liabilities from participation certificates – – 7,268 7,399
Provisions for pensions and similar obligations 1, 2 57,423 59,242 – –
Other non-current provisions 1, 2 6,978 7,933 – –
Non-current interest-bearing loans – 982 20 52
Other non-current financial liabilities 1 4,108 3,567 – 1
Other non-current liabilities 1,794 1,776 – –
Non-current liabilities 1, 2 70,303 73,500 7,288 7,452
Other current provisions 1, 2 23,559 10,809 – –
Current interest-bearing loans and liabilities to banks – 217 20 7
Trade payables 422 567 78 29
Liabilities from construction contracts – – – –
Other current financial liabilities 5,784 7,688 35 3,495
Other current liabilities 1 2,624 8,002 325 5,099
Current liabilities 1, 2 32,389 27,283 458 8,630
Capitalized tax loss carryforwards 10,128 15,005 – –
Capitalized interest carryforwards – – – –
Gross amount 1, 2 146,552 150,203 38,016 55,908
Valuation allowances on temporary differences 1 –852 –1,843 – –
Offset 2 –63,904 –79,957 –63,904 –79,957
Deferred taxes from consolidation entries 53,526 51,125 29,319 25,589
Carrying amount 135,322 119,528 3,431 1,540
1 Valuation allowances on deferred taxes from temporary differences will be reported separately from fiscal year 2015 onwards and not allocated to the respective balance sheet items. Prior year’s figures were adjusted accordingly.
2 Deferred tax liabilities are offset with deferred tax assets on the balance sheet items where these refer to the same taxable entity. Prior year’s figures were adjusted accordingly.

FINANCIAL STATEMENTSNotes of the Dräger Group for 2015
171
The recoverable amount of the recognized deferred tax assets on recognized tax loss carry-forwards and temporary differences at the consolidated companies is tested for valuation allowances once a year on the basis of the future taxable profit, which was determined on the basis of a five-year operating plan. A loss from valuation allowances is recognized where a realization of the deferred tax assets is unlikely. Deductible temporary differences of EUR 2,458 thousand (2014: EUR 3,254 thousand) are not accounted for as these are not expected to be utilized during the planning period.
The deferred taxes on consolidation entries mainly relate to deferred taxes from the elimination of intercompany profits in inventories as well as in intangible assets and in property, plant and equipment.
Deferred taxes are determined on the basis of the tax rates which, under the legislation in force, apply in the individual countries at the time of realization or which are expected.
The following effects on deferred tax assets and liabilities resulted on the acquisition date from the acquisition of GasSecure AS, Oslo, Norway, in March 2015:
DEFERRED TAX ASSETS/ DEFERRED TAX LIABILITIES 2015 FROM THE ACQUISITION OF GASSECURE AS, OSLO
in € thousandDeferred tax
assets Deferred tax
liabilities
Other intangible assets – 4,428
Property, plant and equipment 15 –
Other non-current financial assets – 6
Other current financial liabilities 4 –
Tax loss carryforwards 1,894 –
Consolidated balance sheet 1,913 4,434
Tax loss carryforwards were as follows at the end of the year:
CAPITALIZED TAX LOSS CARRYFORWARDS
in € thousand 2015 2014
Corporate income tax 31,917 31,752
Trade tax and state tax USA 81,179 102,930
Interest carryforwards – –
Total 113,096 134,682
NON-CAPITALIZED TAX LOSS CARRYFORWARDS
in € thousand 2015 2014
Corporate income tax 36,395 44,480
of which will expire in the next 12 months 23 30
of which will expire after more than 12 months 40 1,107
of which does not expire 36,332 43,343
Trade tax and state tax USA 14,047 14,013
of which does not expire 14,047 14,013
Total 50,442 58,493

172 DRÄGER ANNUAL REPORT 2015
Deferred taxes are recognized on loss carryforwards of EUR 51,201 thousand (2014: EUR 52,184 thousand) of the US companies which are subject to an average state tax of between 1.74 percent and 2.70 percent (2014: between 2.20 percent and 2.94 percent).
Theoretically, deferred taxes of EUR 9,353 thousand (2014: EUR 11,166 thousand) would have been recognized for unrecognized corporate income and trade tax losses.
Despite losses in the current and/or prior year, deferred tax assets of EUR 72,119 thou-sand (2014: EUR 2,923 thousand) were recognized for loss carryforwards and temporary differences. The sharp year-on-year increase was mainly due to deferred tax assets of EUR 59,553 thousand on temporary differences and EUR 7,083 thousand on loss carryforwards of the fiscal unit of Drägerwerk AG & Co. KGaA, which reported a slight tax loss in 2015. The amounts are recognized on the basis of the tax planning for the German fiscal unit or the approved budget for the foreign subsidiaries. Management assumes that the companies in question will generate sufficient taxable profits in the future.
The expense from the valuation allowance on deferred tax assets amounted to EUR 1,069 thousand (2014: EUR 379 thousand). The income from the reversal of a previous valuation allowance on deferred tax assets came to EUR 770 thousand in fiscal year 2015 (2014: EUR 1,469 thousand).
Current income taxes of EUR 336 thousand (2014: EUR 3,046 thousand) are recognized directly in equity and primarily related to the share of the dividend for participation cer-tificates relating to the equity component.
The deferred tax assets recognized in other comprehensive income decreased by EUR 3,226 thousand (2014: increased by EUR 26,007 thousand) during the period and mainly concerned the recognition of the effects from the remeasurements of pension plans di-rectly in equity.
19 PERSONNEL EXPENSES/ HEADCOUNT
PERSONNEL EXPENSES
in € thousand 2015 2014
Wages and salaries 859,793 764,723
Social security 150,155 137,019
Pension expenses and related employee benefits 30,848 20,751
1,040,796 922,492
Personnel expenses include the remuneration of the members of the Executive Board of the general partner Drägerwerk Verwaltungs AG, Lübeck. Please refer to our comments in the remuneration report (Note 51).
Depending on function, personnel expenses are taken into account in the cost of sales, research and development costs, marketing and selling expenses, as well as administrative expenses.
Personnel expenses included severance payments of EUR 28,357 thousand (2014: EUR 3,166 thousand).
Note 51

FINANCIAL STATEMENTSNotes of the Dräger Group for 2015
173
HEADCOUNT AS OF THE BALANCE SHEET DATE
2015 2014
Germany 6,473 6,324
Abroad 7,463 7,413
Total headcount 13,936 13,737
Production: manufacturing, service, exterior fitting 5,666 5,642
Other 8,270 8,095
Total headcount 13,936 13,737
HEADCOUNT (AVERAGE)
2015 2014
Germany 6,376 6,278
Abroad 7,479 7,299
Total headcount 13,855 13,576
Production: manufacturing, service, exterior fitting 5,637 5,527
Other 8,218 8,049
Total headcount 13,855 13,576
Please see the comments in the management report for more information on the devel-opment of headcount.
20 AMORTIZATION OF INTANGIBLE ASSETS AND DEPRECIATION OF PROPERTY, PLANT
AND EQUIPMENT
Amortization of intangible assets and depreciation of property, plant and equipment of EUR 84,229 thousand (2014: EUR 77,008 thousand) were incurred in the following func-tional areas:
DISTRIBUTION OF DEPRECIATION/AMORTIZATION ON THE FUNCTIONAL AREAS
in € thousand 2015 2014
Cost of sales 36,622 32,614
Research and development costs 3,274 3,197
Marketing and selling expenses 8,007 12,977
General administrative expenses 36,326 28,219
84,229 77,008
No impairment losses were charged on property, plant and equipment in fiscal year 2015. The prior year’s impairment losses of EUR 2,989 thousand related to software that was no longer used (EUR 1,372 thousand) as well as mainly to buildings that were no longer used and will be – partially – demolished (EUR 1,617 thousand).
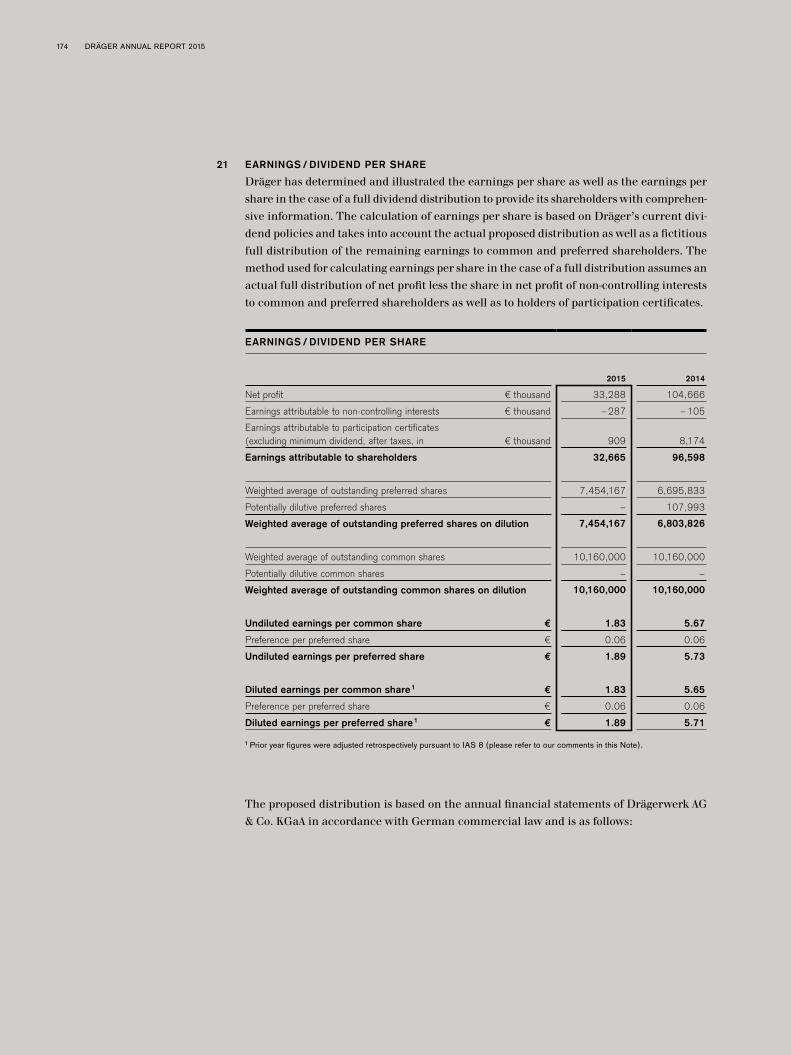
174 DRÄGER ANNUAL REPORT 2015
21 EARNINGS/ DIVIDEND PER SHARE
Dräger has determined and illustrated the earnings per share as well as the earnings per share in the case of a full dividend distribution to provide its shareholders with comprehen-sive information. The calculation of earnings per share is based on Dräger’s current divi-dend policies and takes into account the actual proposed distribution as well as a fictitious full distribution of the remaining earnings to common and preferred shareholders. The method used for calculating earnings per share in the case of a full distribution assumes an actual full distribution of net profit less the share in net profit of non-controlling interests to common and preferred shareholders as well as to holders of participation certificates.
EARNINGS/ DIVIDEND PER SHARE
2015 2014
Net profit € thousand 33,288 104,666
Earnings attributable to non-controlling interests € thousand –287 –105
Earnings attributable to participation certificates (excluding minimum dividend, after taxes, in € thousand 909 8,174
Earnings attributable to shareholders 32,665 96,598
Weighted average of outstanding preferred shares 7,454,167 6,695,833
Potentially dilutive preferred shares – 107,993
Weighted average of outstanding preferred shares on dilution 7,454,167 6,803,826
Weighted average of outstanding common shares 10,160,000 10,160,000
Potentially dilutive common shares – –
Weighted average of outstanding common shares on dilution 10,160,000 10,160,000
Undiluted earnings per common share € 1.83 5.67
Preference per preferred share € 0.06 0.06
Undiluted earnings per preferred share € 1.89 5.73
Diluted earnings per common share 1 € 1.83 5.65
Preference per preferred share € 0.06 0.06
Diluted earnings per preferred share 1 € 1.89 5.71
1 Prior year figures were adjusted retrospectively pursuant to IAS 8 (please refer to our comments in this Note).
The proposed distribution is based on the annual financial statements of Drägerwerk AG & Co. KGaA in accordance with German commercial law and is as follows:

FINANCIAL STATEMENTSNotes of the Dräger Group for 2015
175
CALCULATION OF PROPOSED DISTRIBUTION
Number of shares
Dividend per share in €
Dividends in €
less taxes and minimum dividends
Total in €
Common shares 10,160,000 0.13 1,320,800.00 1,320,800.00
Preferred shares 7,600,000 0.19 1,444,000.00 1,444,000.00
Participation certificates 831,951 1.90 1,580,706.90 –680,950.45 899,756.45
3,664,556.45
The proposed distribution corresponds to 10.91 percent (2014: 30.12 percent) of Group net profit less the share in net profit of non-controlling interests.
The method used for calculating earnings per share in the case of a full distribution as-sumes an actual full distribution of net profit less the share in net profit of non-controlling interests to common and preferred shareholders as well as to holders of participation cer-tificates. If an actual full distribution of net profit is assumed, earnings per share are calcu-lated as follows in the case of a full distribution due to the effects on earnings attributable to participation certificates with an unchanged average number of shares outstanding:
EARNINGS/ DIVIDEND PER SHARE ON FULL DISTRIBUTION
2015 2014
Net profit € thousand 33,288 104,666
Earnings attributable to non-controlling interests € thousand –287 –105
Earnings attributable to participation certificates (excluding minimum dividend, after taxes 1) € thousand 8,530 27,686
Earnings attributable to shareholders 1 25,044 77,085
Undiluted earnings per common share 1 € 1.40 4.52
Preference per preferred share € 0.06 0.06
Undiluted earnings per preferred share 1 € 1.46 4.58
Diluted earnings per common share 1, 2 € 1.40 4.50
Preference per preferred share € 0.06 0.06
Diluted earnings per preferred share 1, 2 € 1.46 4.56
1 On an imputed actual full distribution2 Prior year figures were adjusted retrospectively pursuant to IAS 8 (please refer to our comments in this Note).
On April 29, 2015, Dräger published a correction of the diluted earnings per share for fiscal years 2014 and 2013 on its website and also submitted an announcement to the German Federal Gazette, which was published on June 9, 2015. The incorrect disclosures regarding diluted earnings per shares were adjusted retrospectively pursuant to IAS 8. As a result, earnings per preferred share were adjusted from EUR 5.77 to EUR 5.71 (on full distribution
176 DRÄGER ANNUAL REPORT 2015
from EUR 4.59 to EUR 4.56), while diluted earnings per common share were adjusted from EUR 5.71 to EUR 5.65 (on full distribution from EUR 4.53 to EUR 4.50).
831,951 Drägerwerk AG & Co. KGaA participation certificates were issued as of Decem-ber 31, 2015. In accordance with the terms and conditions of participation certificates, Drägerwerk AG & Co. KGaA will grant the holders either ten common or preferred shares per certificate or ten times the current stock market price of preferred shares upon termi-nation. The factor ten is used due to the share split, which did not apply to the participation certificates (please refer to the information on participation certificates provided in Note 36).
Within the scope of the acquisition of the 25 percent share in Dräger Medical GmbH (now: Drägerwerk AG & Co. KGaA) from Siemens in fiscal year 2009, Dräger issued warrant bonds with option rights guaranteed in the form of warrants with a total nominal value of EUR 1.25 million to Siemens on August 30, 2010. The option rights entitled their holders to acquire a total of 1.25 million preferred shares. They were divided into 25 individual op-tions, entitling holders to acquire 50,000 preferred shares each. The option rights expired on April 30, 2015 and were all exercised (please refer to Note 5).
The exercising of all option rights means that there was no dilution as of December 31, 2015. In the prior year, 107,993 potentially diluted preferred shares were taken into consideration in the calculation of diluted earnings per share. This figure is the result of the average market price for preferred shares, which at EUR 80.90 exceeded the exercise price of option rights of EUR 63.43 on December 31, 2014.
A further dilution of earnings per share does not have to be calculated, as the owners of the participation certificates do not have the right to exchange their participation certifi-cates against shares and Drägerwerk AG & Co. KGaA irrevocably relinquished its right to exchange its participation certificates against shares in favor of the holders of participation certificates and their legal successors by way of Executive Board resolution.
Likewise, the possibility of acquiring treasury shares cannot lead to dilution due to the provisions governing the use of such shares.
Note 36
Note 5

FINANCIAL STATEMENTSNotes of the Dräger Group for 2015
177
Notes to the consolidated balance sheet
22 INTANGIBLE ASSETS
INTANGIBLE ASSETS AS OF DECEMBER 31, 2015
in € thousand
Goodwill Patents, trademarks and
licenses
Purchased software
Internally generated
intangible assets
Leased assets (finance lease)
Payments made
2015 Total
Cost
January 1, 2015 268,170 17,864 111,040 17,632 2,585 3,400 420,691
Additions – 105 3,190 – – 4,165 7,460
Disposals – –108 –3,050 –4,860 – –62 –8,079
Reclassifications – 512 1,306 – – –1,818 0
Change in the scope of consolidation 43,980 16,431 – – – – 60,411
Currency translations effects 1,429 2,605 1,054 87 – 8 5,183
Dec. 31, 2015 313,579 37,408 113,541 12,859 2,585 5,694 485,665
Accumulated amortization and impairment losses
January 1, 2015 4,976 16,722 86,990 17,632 129 – 126,449
Additions – 1,326 10,239 – 517 – 12,082
Disposals – –2 –3,043 –4,860 – – –7,906
Currency translations effects –29 2,995 210 87 – – 3,263
Dec. 31, 2015 4,947 21,041 94,395 12,859 646 0 133,889
Net carrying value 308,632 16,367 19,145 0 1,939 5,694 351,776
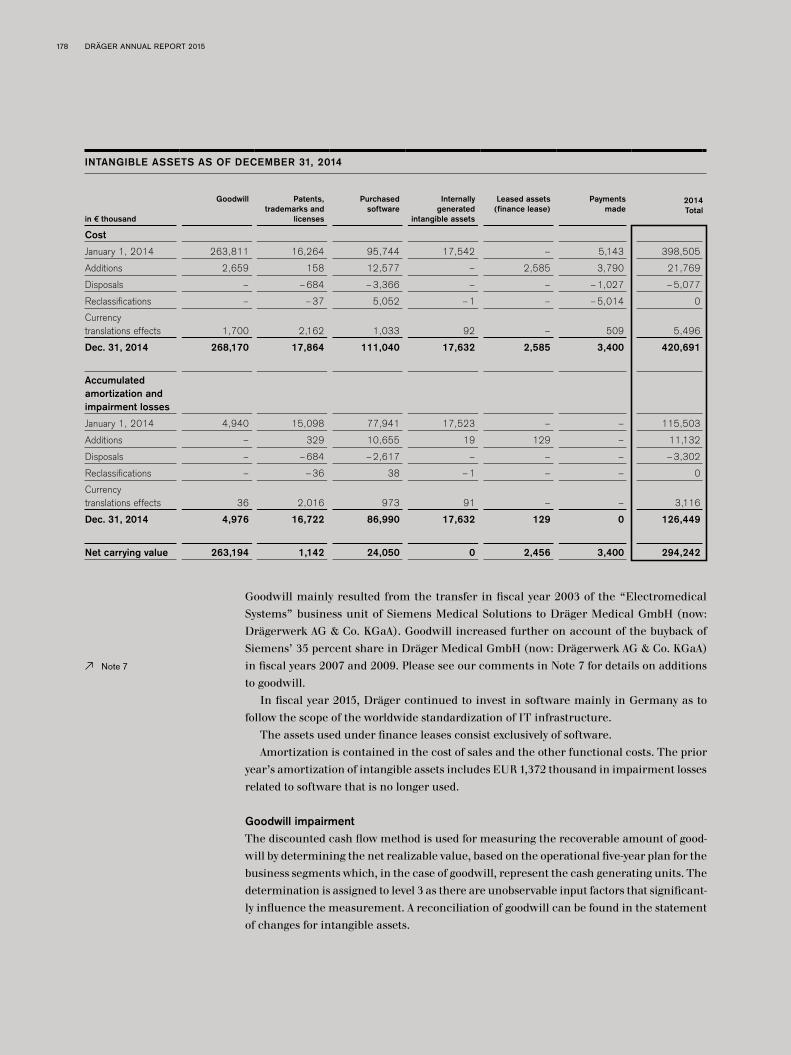
178 DRÄGER ANNUAL REPORT 2015
INTANGIBLE ASSETS AS OF DECEMBER 31, 2014
in € thousand
Goodwill Patents, trademarks and
licenses
Purchased software
Internally generated
intangible assets
Leased assets (finance lease)
Payments made
2014 Total
Cost
January 1, 2014 263,811 16,264 95,744 17,542 – 5,143 398,505
Additions 2,659 158 12,577 – 2,585 3,790 21,769
Disposals – –684 –3,366 – – –1,027 –5,077
Reclassifications – –37 5,052 –1 – –5,014 0
Currency translations effects 1,700 2,162 1,033 92 – 509 5,496
Dec. 31, 2014 268,170 17,864 111,040 17,632 2,585 3,400 420,691
Accumulated amortization and impairment losses
January 1, 2014 4,940 15,098 77,941 17,523 – – 115,503
Additions – 329 10,655 19 129 – 11,132
Disposals – –684 –2,617 – – – –3,302
Reclassifications – –36 38 –1 – – 0
Currency translations effects 36 2,016 973 91 – – 3,116
Dec. 31, 2014 4,976 16,722 86,990 17,632 129 0 126,449
Net carrying value 263,194 1,142 24,050 0 2,456 3,400 294,242
Goodwill mainly resulted from the transfer in fiscal year 2003 of the “Electromedical Systems” business unit of Siemens Medical Solutions to Dräger Medical GmbH (now: Drägerwerk AG & Co. KGaA). Goodwill increased further on account of the buyback of Siemens’ 35 percent share in Dräger Medical GmbH (now: Drägerwerk AG & Co. KGaA) in fiscal years 2007 and 2009. Please see our comments in Note 7 for details on additions to goodwill.
In fiscal year 2015, Dräger continued to invest in software mainly in Germany as to follow the scope of the worldwide standardization of IT infrastructure.
The assets used under finance leases consist exclusively of software. Amortization is contained in the cost of sales and the other functional costs. The prior
year’s amortization of intangible assets includes EUR 1,372 thousand in impairment losses related to software that is no longer used.
Goodwill impairmentThe discounted cash flow method is used for measuring the recoverable amount of good-will by determining the net realizable value, based on the operational five-year plan for the business segments which, in the case of goodwill, represent the cash generating units. The determination is assigned to level 3 as there are unobservable input factors that significant-ly influence the measurement. A reconciliation of goodwill can be found in the statement of changes for intangible assets.
Note 7

FINANCIAL STATEMENTSNotes of the Dräger Group for 2015
179
The main planning assumptions are market growth, development of market shares and market price trends. The estimations of these parameters are included in the planning of country organizations. The resulting “bottom-up” planning of the countries is validated and, when necessary, adjusted at Group headquarters. Based on these assumptions, sales growth of 2.4 percent (2014 for 2015 – 2019: 5.4 percent) is expected for the medical divi-sion between 2016 and 2020 and growth of 3.3 percent (2014 for 2015 – 2019: 3.9 percent) expected in the same period for the safety division, resulting in overall growth for the Group of 2.7 percent (2014: 4.9 percent). The calculation was also based on discounting rate assumptions:
In the current planning, a discount rate of 6.52 percent (2014: 6.82 percent) after taxes and a growth rate of 1 percent (2014: 1 percent) were taken into account for perpetual annuity of the medical division. The pre-tax discount rate is 9.66 percent (2014: 9.74 per-cent). In the planning, a discount rate of 7.69 percent (2014: 7.95 percent) after taxes and a growth rate of 1 percent (2014: 1 percent) were taken into account for perpetual annuity of the safety division. The pre-tax discount rate is 11.39 percent (2014: 11.35 percent). These assumptions are validated by external sources of information on market development. No impairment loss was required on the basis of this multi-year plan. Even if the perpetual annuity was to grow by 0 percent and the discount rate were to increase by another 2 per-centage points, no impairment loss would have to be recognized.
As of December 31, 2015, goodwill was made up of EUR 260.5 million for the medical division and EUR 48.1 million for the safety division. As of December 31, 2014, goodwill was made up of EUR 259.0 million for the medical division and EUR 4.2 million for the safety division and Drägerwerk AG & Co. KGaA (see our comments in Note 3 for details on the change in segments).
Note 3
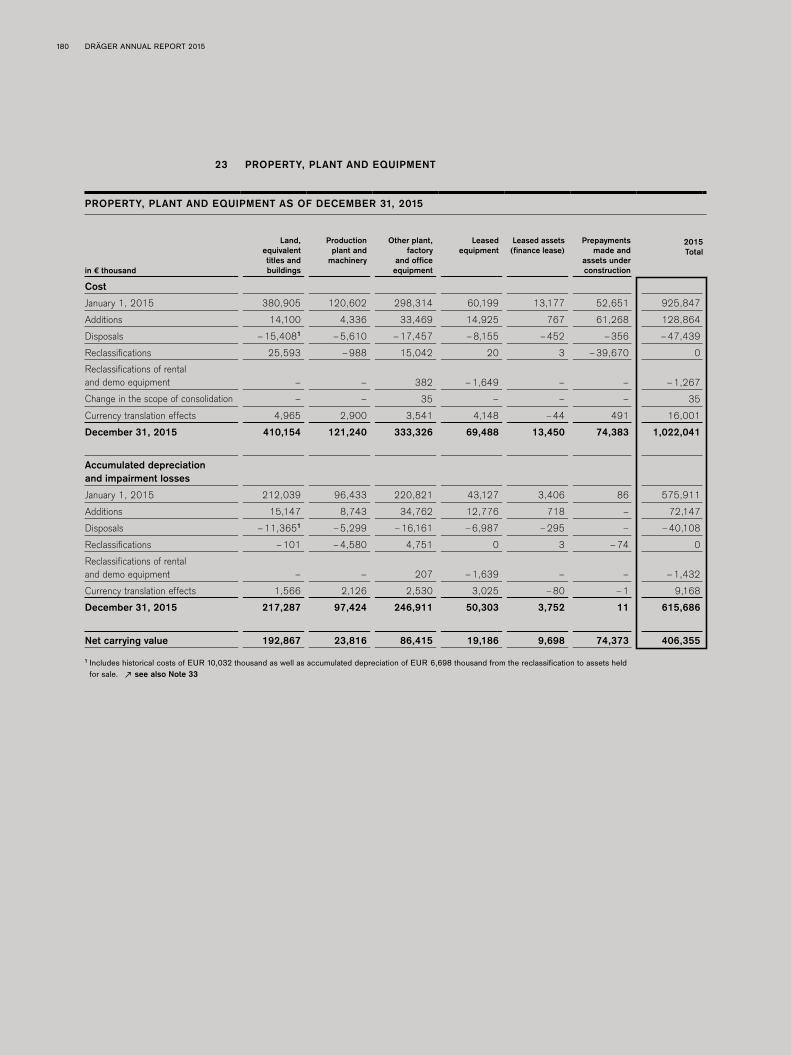
180 DRÄGER ANNUAL REPORT 2015
23 PROPERTY, PLANT AND EQUIPMENT
PROPERTY, PLANT AND EQUIPMENT AS OF DECEMBER 31, 2015
in € thousand
Land, equivalent titles and buildings
Production plant and
machinery
Other plant, factory
and office equipment
Leased equipment
Leased assets (finance lease)
Prepayments made and
assets under construction
2015 Total
Cost
January 1, 2015 380,905 120,602 298,314 60,199 13,177 52,651 925,847
Additions 14,100 4,336 33,469 14,925 767 61,268 128,864
Disposals –15,4081 –5,610 –17,457 –8,155 –452 –356 –47,439
Reclassifications 25,593 –988 15,042 20 3 –39,670 0
Reclassifications of rental and demo equipment – – 382 –1,649 – – –1,267
Change in the scope of consolidation – – 35 – – – 35
Currency translation effects 4,965 2,900 3,541 4,148 –44 491 16,001
December 31, 2015 410,154 121,240 333,326 69,488 13,450 74,383 1,022,041
Accumulated depreciation and impairment losses
January 1, 2015 212,039 96,433 220,821 43,127 3,406 86 575,911
Additions 15,147 8,743 34,762 12,776 718 – 72,147
Disposals –11,3651 –5,299 –16,161 –6,987 –295 – –40,108
Reclassifications –101 –4,580 4,751 0 3 –74 0
Reclassifications of rental and demo equipment – – 207 –1,639 – – –1,432
Currency translation effects 1,566 2,126 2,530 3,025 –80 –1 9,168
December 31, 2015 217,287 97,424 246,911 50,303 3,752 11 615,686
Net carrying value 192,867 23,816 86,415 19,186 9,698 74,373 406,355
1 Includes historical costs of EUR 10,032 thousand as well as accumulated depreciation of EUR 6,698 thousand from the reclassification to assets held for sale. see also Note 33
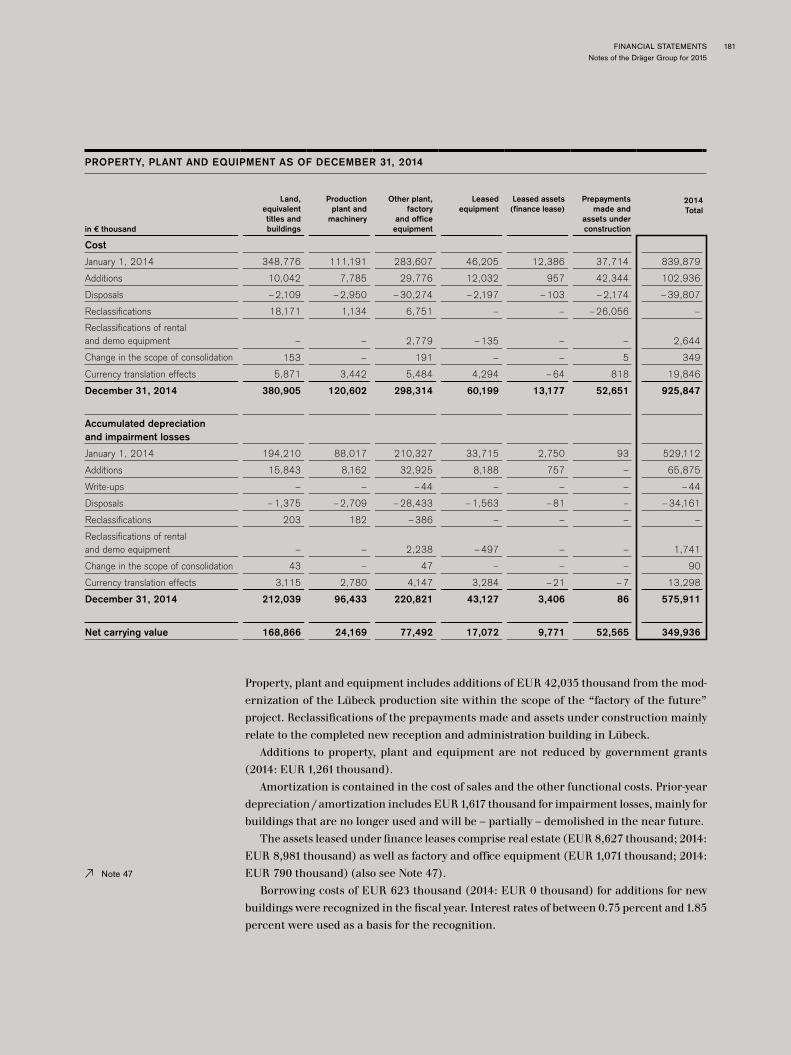
FINANCIAL STATEMENTSNotes of the Dräger Group for 2015
181
PROPERTY, PLANT AND EQUIPMENT AS OF DECEMBER 31, 2014
in € thousand
Land, equivalent titles and buildings
Production plant and
machinery
Other plant, factory
and office equipment
Leased equipment
Leased assets (finance lease)
Prepayments made and
assets under construction
2014 Total
Cost
January 1, 2014 348,776 111,191 283,607 46,205 12,386 37,714 839,879
Additions 10,042 7,785 29,776 12,032 957 42,344 102,936
Disposals –2,109 –2,950 –30,274 –2,197 –103 –2,174 –39,807
Reclassifications 18,171 1,134 6,751 – – –26,056 –
Reclassifications of rental and demo equipment – – 2,779 –135 – – 2,644
Change in the scope of consolidation 153 – 191 – – 5 349
Currency translation effects 5,871 3,442 5,484 4,294 –64 818 19,846
December 31, 2014 380,905 120,602 298,314 60,199 13,177 52,651 925,847
Accumulated depreciation and impairment losses
January 1, 2014 194,210 88,017 210,327 33,715 2,750 93 529,112
Additions 15,843 8,162 32,925 8,188 757 – 65,875
Write-ups – – –44 – – – –44
Disposals –1,375 –2,709 –28,433 –1,563 –81 – –34,161
Reclassifications 203 182 –386 – – – –
Reclassifications of rental and demo equipment – – 2,238 –497 – – 1,741
Change in the scope of consolidation 43 – 47 – – – 90
Currency translation effects 3,115 2,780 4,147 3,284 –21 –7 13,298
December 31, 2014 212,039 96,433 220,821 43,127 3,406 86 575,911
Net carrying value 168,866 24,169 77,492 17,072 9,771 52,565 349,936
Property, plant and equipment includes additions of EUR 42,035 thousand from the mod-ernization of the Lübeck production site within the scope of the “factory of the future” project. Reclassifications of the prepayments made and assets under construction mainly relate to the completed new reception and administration building in Lübeck.
Additions to property, plant and equipment are not reduced by government grants (2014: EUR 1,261 thousand).
Amortization is contained in the cost of sales and the other functional costs. Prior-year depreciation/amortization includes EUR 1,617 thousand for impairment losses, mainly for buildings that are no longer used and will be – partially – demolished in the near future.
The assets leased under finance leases comprise real estate (EUR 8,627 thousand; 2014: EUR 8,981 thousand) as well as factory and office equipment (EUR 1,071 thousand; 2014: EUR 790 thousand) (also see Note 47).
Borrowing costs of EUR 623 thousand (2014: EUR 0 thousand) for additions for new buildings were recognized in the fiscal year. Interest rates of between 0.75 percent and 1.85 percent were used as a basis for the recognition.
Note 47

182 DRÄGER ANNUAL REPORT 2015
24 INVESTMENTS IN ASSOCIATES AND JOINT VENTURES
As in the prior years, the associate in question is MAPRA Assekuranzkontor GmbH, Lübeck, an insurance broker, in which Dräger holds 49 percent of the shares and over which Dräger exercises significant influence. MAPRA Assekuranzkontor GmbH continues to be included in the Group financial statements and accounted for using the equity method; its fiscal year ends on December 31.
As this company in and of itself is not material, Dräger exercises the option to use the simplified consolidated method.
The following figures are based on the last annual financial statement of the company.
FINANCIAL INFORMATION ON ASSOCIATES
in € thousand Dec. 31, 2015 Dec. 31, 2014
Carrying value of the Group shares of associates 231 277
Share in the profits from continued operations / total profits of the associates 203 250
In working groups (unlisted companies) together with other partners, Dräger offers fire training facilities for firefighters in Engineered Solutions. As of the balance sheet date, Dräger is involved in four (2014: four) working groups, which are accounted for as joint ventures using the equity method. The interests in these amount to between 51 percent and 74 percent (2014: 51 percent and 73 percent). These working groups do not generate any income of their own and their shares were not purchased. As a result, these do not need to be presented in the consolidated balance sheet nor does any financial information need to be presented. As their business in and of itself is not material, Dräger exercises the option to use the simplified consolidated method.
There are no obligations to associates and joint ventures to provide financing or resourc-es that are not accounted for; nor are there any contingent liabilities.
25 OTHER NON-CURRENT FINANCIAL ASSETS
OTHER NON-CURRENT FINANCIAL ASSETS
in € thousand 2015 2014
Security deposits paid 4,968 6,653
Trade receivables 2,346 4,534
Other loans 1,363 1,059
Finance lease receivables (lessor) 1,142 640
Positive fair values of derivatives 383 41
Sundry non-current financial assets 1,411 1,595
11,613 14,523
The non-current receivables do not carry any discernible risks nor have they been impaired by any bad debt allowances.

FINANCIAL STATEMENTSNotes of the Dräger Group for 2015
183
Where non-current financial assets do not bear interest, fair value is determined by dis-counting future cash flows.
The positive fair values of derivatives pertain exclusively to currency forwards and fu-tures.
Sundry non-current financial assets include investments and other non-current securi-ties of EUR 1,059 thousand (2014: EUR 1,041 thousand).
For further details of finance lease receivables, please refer to our comments on recog-nition of finance leases by the lessor (Note 47).
26 DEFERRED TAX ASSETS
Deferred tax assets are explained in Note 18.
27 OTHER NON-CURRENT ASSETS
OTHER NON-CURRENT ASSETS
in € thousand 2015 2014
Fund assets from pension plans 59 1
Sundry non-current assets 1,822 2,958
1,881 2,959
Fund assets relating to pension plans contain the available excess of plan assets (see also Note 37).
Sundry non-current assets include receivables from taxes of a foreign subsidiary of EUR 1,107 thousand (2014: EUR 1,378 thousand).
28 INVENTORIES
INVENTORIES
in € thousand 2015 2014
Finished goods and merchandise 218,647 209,576
Work in progress 49,514 51,057
Raw materials, consumables and supplies 131,152 126,291
Payments made 2,665 1,574
401,978 388,497
The carrying value of inventories written down to their net realizable value as of December 31, 2015, is EUR 91,852 thousand (2014: EUR 63,873 thousand).
Impairment losses of EUR 24,006 thousand (2014: EUR 13,377 thousand) were charged on inventories in the fiscal year and recognized in cost of sales. However, EUR 11,931 thou-sand (2014: EUR 5,905 thousand) of impairments recognized in prior years were reversed.
Finished goods and merchandise comprise loan equipment and demo equipment lent to customers in the short term worth EUR 15,994 thousand (2014: EUR 17,462 thousand).
Note 47
Note 18
Note 37
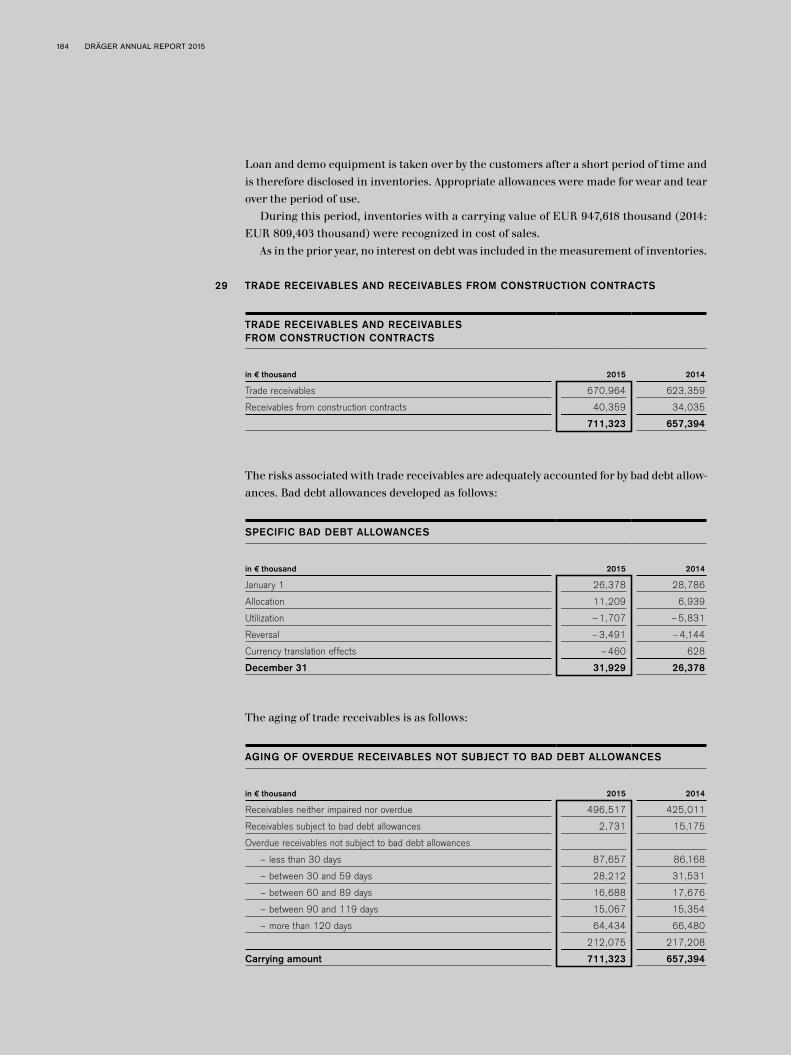
184 DRÄGER ANNUAL REPORT 2015
Loan and demo equipment is taken over by the customers after a short period of time and is therefore disclosed in inventories. Appropriate allowances were made for wear and tear over the period of use.
During this period, inventories with a carrying value of EUR 947,618 thousand (2014: EUR 809,403 thousand) were recognized in cost of sales.
As in the prior year, no interest on debt was included in the measurement of inventories.
29 TRADE RECEIVABLES AND RECEIVABLES FROM CONSTRUCTION CONTRACTS
TRADE RECEIVABLES AND RECEIVABLES FROM CONSTRUCTION CONTRACTS
in € thousand 2015 2014
Trade receivables 670,964 623,359
Receivables from construction contracts 40,359 34,035
711,323 657,394
The risks associated with trade receivables are adequately accounted for by bad debt allow-ances. Bad debt allowances developed as follows:
SPECIFIC BAD DEBT ALLOWANCES
in € thousand 2015 2014
January 1 26,378 28,786
Allocation 11,209 6,939
Utilization –1,707 –5,831
Reversal –3,491 –4,144
Currency translation effects –460 628
December 31 31,929 26,378
The aging of trade receivables is as follows:
AGING OF OVERDUE RECEIVABLES NOT SUBJECT TO BAD DEBT ALLOWANCES
in € thousand 2015 2014
Receivables neither impaired nor overdue 496,517 425,011
Receivables subject to bad debt allowances 2,731 15,175
Overdue receivables not subject to bad debt allowances
– less than 30 days 87,657 86,168
– between 30 and 59 days 28,212 31,531
– between 60 and 89 days 16,688 17,676
– between 90 and 119 days 15,067 15,354
– more than 120 days 64,434 66,480
212,075 217,208
Carrying amount 711,323 657,394

FINANCIAL STATEMENTSNotes of the Dräger Group for 2015
185
Collateral for trade receivables in this respect amounted to EUR 1,200 thousand on De-cember 31, 2015 (2014: EUR 0 thousand). The collateral is in the form of a letter of credit. The fair value largely corresponds to the nominal value. In addition, the maximum credit risk on the reporting date corresponds to the carrying amount of the aforementioned receivables.
The credit quality of those receivables that are neither impaired nor overdue is de-termined on the basis of external credit ratings or historical experience regarding the default rates of the respective business partners. Our analysis indicates that no allowance is required.
In the case of overdue receivables of approximately EUR 2,784 thousand (2014: EUR 4,924 thousand), which are not subject to bad debt allowances, payment is expected after a period of more than 365 days. A payment period of less than one year was initially agreed for these receivables within the scope of the company’s normal operating cycle. As such, they are disclosed as current receivables and are not discounted.
In addition to costs incurred for the contracts, receivables from construction contracts include the corresponding profit and were offset against part payments received.
The cost incurred for the contracts in progress plus the corresponding profit according to the percentage of completion method amount to EUR 59,733 thousand (2014: EUR 53,228 thousand) as of the balance sheet date and were offset against partial payments received of EUR 19,374 thousand (2014: EUR 19,193 thousand). This leads to receivables from construction contracts of EUR 40,359 thousand (2014: EUR 34,035 thousand).
No specific bad debt allowances were recognized on receivables from construction con-tracts. There are no overdue trade receivables or receivables from construction contracts which require additional bad debt allowances.
30 OTHER CURRENT FINANCIAL ASSETS
OTHER CURRENT FINANCIAL ASSETS
in € thousand 2015 2014
Notes receivable 21,045 16,128
Receivables from commissioning agents 9,430 11,422
Receivables from employees 7,175 1,608
Security deposits paid 2,512 544
Creditors with debit balances 2,188 490
Positive fair values of derivatives 1,754 1,852
Finance lease receivables (lessor) 451 371
Receivables from associates 2 3
Sundry 3,150 1,425
47,708 33,843
Notes receivable chiefly stem from the Turkish, Chinese and Japanese subsidiaries where the bill of exchange is a common method of payment.
For the derivative financial instruments recognized as other financial assets, please refer to the table of derivative financial instruments in the Dräger Group (Note 46). Note 46

186 DRÄGER ANNUAL REPORT 2015
For details of finance lease receivables, please refer to our comments on recognition of finance leases by the lessor (Note 47).
Of the receivables from commissioning agents, EUR 7,019 thousand (2014: EUR 7,561 thousand) are overdue by more than 120 days. No allowance is required.
As in the prior year, all other current financial assets are neither impaired nor overdue.
31 CASH AND CASH EQUIVALENTS
Cash and cash equivalents comprise cash in hand and balances at various banks in dif-ferent currencies. Cash and cash equivalents which were subject to restrictions as of the balance sheet date amount to EUR 8,933 thousand (2014: EUR 8,376 thousand).
32 OTHER CURRENT ASSETS
OTHER CURRENT ASSETS
in € thousand 2015 2014
Prepaid expenses 23,210 24,674
Other tax refund claims 19,285 20,830
Receivables from investment allowances 820 593
Other 4,409 6,163
47,724 52,260
As in the prior year, no specific bad debt allowances are required for other current assets.Other tax refund claims primarily result from VAT claims.
33 ASSETS HELD FOR SALE
In November 2015, Dräger sold the land and building of the subsidiary in Pittsburgh, USA, which is part of the safety division. The buyer can select either May 1, 2016 or Sep-tember 1, 2016 as the transfer date. The buyer also has the right to rescind the contract until 120 days after the signing.
No impairment losses were recognized as the purchase price less costs to sell is in excess of the residual carrying amount of the disposed assets. The assets held for sale have no impact on the statement of comprehensive income from the reclassification date.
34 EQUITY
For the breakdown and changes in equity in fiscal years 2015 and 2014, please see the statement of changes in equity of the Dräger Group.
Capital stockThe capital stock of Drägerwerk AG & Co. KGaA amounts to EUR 45,466 thousand (2014: EUR 44,186 thousand).
April and early May 2015 saw the last ten of originally 25 options that Dräger had issued in the form of warrants on August 30, 2010 being exercised (also see our comments in Note 5).
Note 47
Note 5
FINANCIAL STATEMENTSNotes of the Dräger Group for 2015
187
The nominal value of these 500,000 new preferred shares amounts to EUR 2.56 and in-creased the capital stock by a total of EUR 1,280 thousand.
This capital stock is divided into 10,160,000 limited no-par bearer common shares and 7,600,000 limited no-par preferred shares (2014: 7,100,000 limited no-par preferred shares). Please refer to Note 5 for our comments on the increase in preferred shares.
The nominal value of both share types is EUR 2.56. Drägerwerk Verwaltungs AG, the general partner, holds no shares in capital.
The capital stock has been fully paid in. As before, the preferred and common shares are traded on the capital market.
Other than voting rights, the preferred shares have the same rights as those attached to the common shares. As compensation for the lack of voting rights, an advance dividend of EUR 0.13 per preferred share is distributed from net earnings.
If sufficient profits are available, a dividend of EUR 0.13 per common share is then paid. Any profit in excess of this amount, if distributed, is allocated so that preferred shares receive EUR 0.06 more than common shares.
If the profit is not sufficient to distribute the advance dividend for preferred shares in one or more years, the amounts are paid from the profit of subsequent fiscal years before a dividend is paid on common shares.
If amounts in arrears are not paid in the next year along with the full preferred dividend for that year, the preferred shareholders have voting rights until the arrears have been paid.
In the event of liquidation, the preferred shareholders receive 25 percent of net liqui-dation proceeds in advance. The remaining liquidation proceeds are distributed evenly among all shares.
By resolution of the annual shareholders’ meeting on May 6, 2011, the general part-ner was authorized to increase the capital stock of the Company, with the approval of the Supervisory Board, until May 5, 2016, by issuing new bearer common shares and/or preferred shares (no-par shares) in return for cash and/or contributions in kind by up to EUR 21,132,800.00 (authorized share capital) in one or several tranches. The authoriza-tion includes the entitlement to optionally issue new common shares and/or non-voting preferred shares up to the statutory maximum as stipulated in Sec. 139 (2) AktG, which carry the same status as the previously issued non-voting preferred shares with regard to the distribution of profits and/or Company assets.
In the case of common and preferred shares being issued at the same time while main-taining the ratio of both share types at the time of issuance, the general partner is au-thorized, subject to approval by the Supervisory Board, to exclude the right of the case of common and preferred shares to subscribe to the other type of shares (“crossed exclusion of subscription rights”).
Reports regarding voting rightsSec. 160 (1) No. 8 AktG requires disclosure of the existence of investments that have been notified to the company in accordance with Sec. 21 (1) or (1a) WpHG.
The following table shows the reportable investments disclosed during the Drägerwerk AG & Co. KGaA’s fiscal year. Please note that the disclosures may since have changed.
Note 5

188 DRÄGER ANNUAL REPORT 2015
DISCLOSED REPORTABLE INVESTMENTS
Reporter
Date that thresholds were reached, exceeded
or undercut
Reporting threshold
Allocation pursuant to WpHG
Investment in %
Investment in voting rights
Norges Bank, Oslo, Norway Apr. 24, 2015 3% undercut Sec. 21 (1) Sentence 1 2.74% 278,470
Ministry of Finance, Oslo, Norway Apr. 24, 2015 3% undercut Sec. 22 (1) Sentence 1 No. 1 2.74% 278,470
SICAV Objectif Small Caps Euro, Paris, France Apr. 29, 2015 3% exceeded Sec. 21 (1) 3.19% 323,700
Ministry of Finance, Oslo, Norway May 11, 2015 3% exceeded Sec. 22 (1) Sentence 1 No. 1 3.27% 332,415
Norges Bank, Oslo, Norway May 11, 2015 3% exceeded Sec. 21 (1) Sentence 1 3.27% 332,415
Capital reservesThe portion of the exercise price that exceeds the nominal value following the exercising of the ten options (EUR 30,275 thousand), less transaction fees of EUR 8 thousand, was added to the capital reserves (also see our comments in Note 5).
The capital reserves until the prior year originated from share premiums from Dräger-werk AG & Co. KGaA’s establishment (transformation) in 1970 and from capital increases in 1979, 1981, 1991 and 2010.
Retained earningsRetained earnings comprise the earnings generated until fiscal year 2015 by the companies included in the Group financial statements, where they were not attributed to minority interests or paid as a dividend by Drägerwerk AG & Co. KGaA. The actual tax benefit from the tax deductibility of the participation certificates, which relates to the participation capital recognized in equity, was recognized directly in retained earnings. Effects from the remeasurements of the Company’s pension provisions, including deferred taxes, are also included in retained earnings.
Total comprehensive income increased retained earnings.Other effects, which reduced retained earnings, mainly comprise the distribution to
shareholders and participation certificate holders (EUR 34,601 thousand; 2014: EUR 19,820 thousand).
Reserves retained from earnings, including Group result, therefore changed as follows:
RESERVES RETAINED FROM EARNINGS, INCL. GROUP RESULT
in € thousand 2015 2014
Reserves retained from earnings, incl. Group result as of January 1 622,342 591,926
Changes from remeasurements of pension plans (after taxes) 7,920 –56,881
Net profit for the year (excluding non-controlling interests) 33,574 104,771
Other effects –37,202 –17,475
Reserves retained from earnings, incl. Group result as of Dec. 31 626,634 622,342
Note 5

FINANCIAL STATEMENTSNotes of the Dräger Group for 2015
189
Own shares within the scope of the employee share programIn fiscal year 2015, the Executive Board resolved to enable Dräger employees in Germany to participate in the Company through an employee share program. This was designed to increase employees’ identification with the Company and Dräger’s attractiveness as an employer.
One bonus share was issued for every three investment shares bought by the employee. The maximum purchase price per investment share for the employees amounted to EUR 92.36 (which corresponded to the closing price of the preferred shares in Xetra trading on the last trading day before the start of the acquisition period, meaning on March 10, 2015). The shares were subject to a two-year holding period and may not be sold or otherwise transferred during this period. Employees do not have to continue their employment with the Company during the holding period.
The participation period, during which employees could acquire the share parcels, started on March 11, 2015 and ended on March 23, 2015. During this period, 7,303 bo-nus shares resulted from the shares acquired by employees, including Executive Board members. An account was opened with Deutsche Bank Privat- und Geschäftskunden AG (paying agent), Frankfurt am Main, Germany, for the entry and custody of bonus shares for participating employees.
The 7,303 bonus shares were acquired for Dräger on the stock exchange in the period from March 11 to March 23, 2015 by the paying agent on a commission basis in the form of a share buyback at a total cost of EUR 792 thousand. The price on the stock exchange amounted to an average of EUR 108.41. The shares were transferred directly to the respec-tive employee’s securities accounts. The contractually agreed benefits for the employees arising from this program, consisting of bonus shares and the maximum purchase price, were recognized in personnel expenses at EUR 1,143 thousand. Aside from the price paid on the stock exchange, no other expectations for future dividends or other characteristics were included in the fair value of the bonus shares.
The acquisition of own shares to pass on to participating employees in the form of bonus shares is covered by the resolution of the annual shareholders’ meeting on May 4, 2012, according to which the general partner is authorized to acquire until May 3, 2017 up to 10 percent of the own shares of both types (common and/or preferred shares) of the Company’s capital stock as of the date of resolution or – if this value is lower – as of the date on which the authorization is exercised. Together with all other shares held by the Company or attributable to it according to Secs. 71a et seq. AktG, shares purchased under this provision may at no time equal more than 10 percent of capital stock. The authoriza-tion may not be used for the purpose of trading in treasury shares. The authorization may be exercised in whole or in part, on one or more occasions and for one or more purposes by the Company or by dependent Group companies or enterprises in which the Company has a majority shareholding, or by third parties for its or their account. The purchase may be limited in part or in full to a single class of shares by excluding, in part or in full, the shareholders’ right to sell the other class of share.
The purchase could, at the discretion of the general partner, have been affected by the stock exchange, or by means of a public purchase offer to all holders of the respective type of share or by means of a public invitation to all holders of the respective type of share to submit offers for sale.
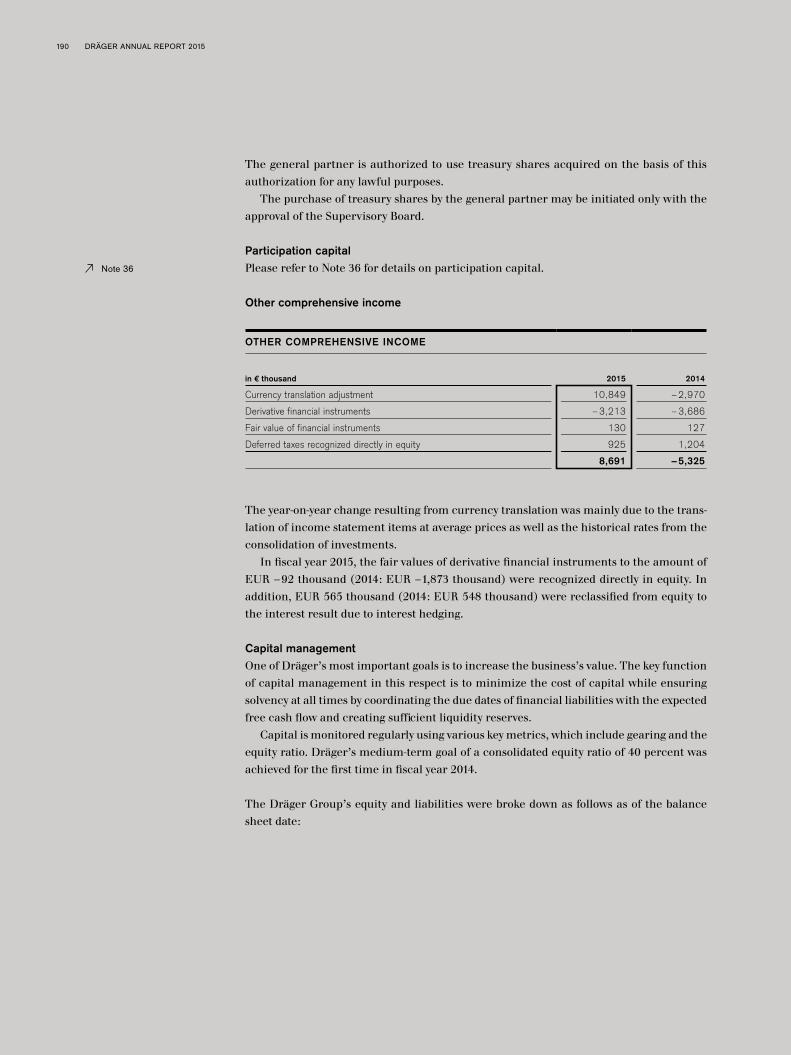
190 DRÄGER ANNUAL REPORT 2015
The general partner is authorized to use treasury shares acquired on the basis of this authorization for any lawful purposes.
The purchase of treasury shares by the general partner may be initiated only with the approval of the Supervisory Board.
Participation capitalPlease refer to Note 36 for details on participation capital.
Other comprehensive income
OTHER COMPREHENSIVE INCOME
in € thousand 2015 2014
Currency translation adjustment 10,849 –2,970
Derivative financial instruments –3,213 –3,686
Fair value of financial instruments 130 127
Deferred taxes recognized directly in equity 925 1,204
8,691 –5,325
The year-on-year change resulting from currency translation was mainly due to the trans-lation of income statement items at average prices as well as the historical rates from the consolidation of investments.
In fiscal year 2015, the fair values of derivative financial instruments to the amount of EUR –92 thousand (2014: EUR –1,873 thousand) were recognized directly in equity. In addition, EUR 565 thousand (2014: EUR 548 thousand) were reclassified from equity to the interest result due to interest hedging.
Capital managementOne of Dräger’s most important goals is to increase the business’s value. The key function of capital management in this respect is to minimize the cost of capital while ensuring solvency at all times by coordinating the due dates of financial liabilities with the expected free cash flow and creating sufficient liquidity reserves.
Capital is monitored regularly using various key metrics, which include gearing and the equity ratio. Dräger’s medium-term goal of a consolidated equity ratio of 40 percent was achieved for the first time in fiscal year 2014.
The Dräger Group’s equity and liabilities were broke down as follows as of the balance sheet date:
Note 36

FINANCIAL STATEMENTSNotes of the Dräger Group for 2015
191
EQUITY AND LIABILITIES
in € million 2015 2014
Equity interest held by shareholders of Drägerwerk AG & Co. KGaA 944.3 894.5
+ Non-controlling interests 1.6 2.1
Equity of the Dräger Group 945.9 896.6
Share of total equity and liabilities 40.9% 40.1%
Non-current liabilities 545.9 587.4
Current liabilities 819.6 750.1
Total liabilities 1,365.5 1,337.5
Share of total equity and liabilities 59.1% 59.9%
Total equity and liabilities 2,311.4 2,234.1
The Dräger Group’s gearing had developed as follows as of the balance sheet date:
GEARING
in € million 2015 2014
Non-current interest-bearing loans 138.1 168.6
+ Current interest-bearing loans and liabilities to banks 169.7 127.7
+ Non-current and current liabilities from finance lease 10.3 11.3
– Cash and cash equivalents –172.8 –296.9
Net financial debt 145.3 10.7
Equity 945.9 896.6
Gearing (= net financial debt /equity) 0.15 0.01
On December 31, 2015, the Dräger Group also agreed on bilateral credit lines of EUR 358.0 million due on October 30, 2018 to secure liquidity. The framework agreement for the bilateral credit lines stipulates target values based on certain financial covenants. Should the Dräger Group not comply with these, the banks are entitled to terminate the bilateral credit lines. The values have been specified so that the Dräger Group would only run the risk of being unable to meet them if the Company’s financial position was to deteriorate drastically. It is also possible for the Dräger Group to obtain the banks’ approval to exceed or undercut these key figures at an early stage. Key financial performance figures are monitored continuously.
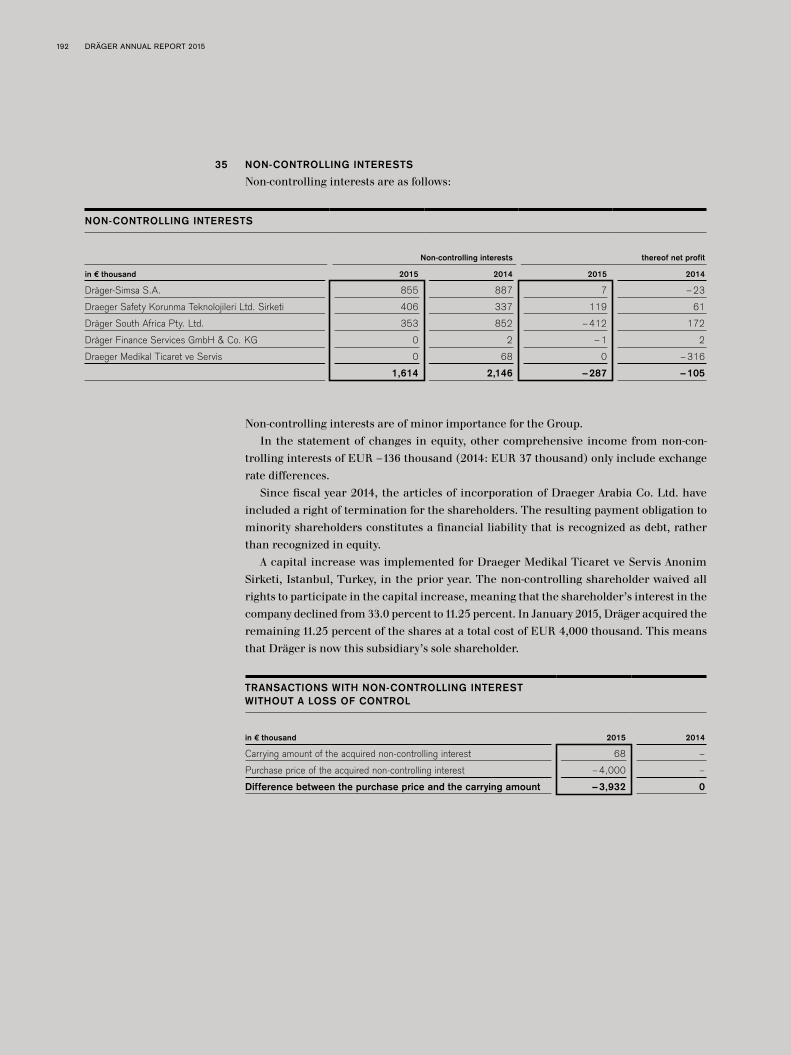
192 DRÄGER ANNUAL REPORT 2015
35 NON-CONTROLLING INTERESTS
Non-controlling interests are as follows:
NON-CONTROLLING INTERESTS
Non-controlling interests thereof net profit
in € thousand 2015 2014 2015 2014
Dräger-Simsa S.A. 855 887 7 –23
Draeger Safety Korunma Teknolojileri Ltd. Sirketi 406 337 119 61
Dräger South Africa Pty. Ltd. 353 852 –412 172
Dräger Finance Services GmbH & Co. KG 0 2 –1 2
Draeger Medikal Ticaret ve Servis 0 68 0 –316
1,614 2,146 –287 –105
Non-controlling interests are of minor importance for the Group.In the statement of changes in equity, other comprehensive income from non-con-
trolling interests of EUR –136 thousand (2014: EUR 37 thousand) only include exchange rate differences.
Since fiscal year 2014, the articles of incorporation of Draeger Arabia Co. Ltd. have included a right of termination for the shareholders. The resulting payment obligation to minority shareholders constitutes a financial liability that is recognized as debt, rather than recognized in equity.
A capital increase was implemented for Draeger Medikal Ticaret ve Servis Anonim Sirketi, Istanbul, Turkey, in the prior year. The non-controlling shareholder waived all rights to participate in the capital increase, meaning that the shareholder’s interest in the company declined from 33.0 percent to 11.25 percent. In January 2015, Dräger acquired the remaining 11.25 percent of the shares at a total cost of EUR 4,000 thousand. This means that Dräger is now this subsidiary’s sole shareholder.
TRANSACTIONS WITH NON-CONTROLLING INTEREST WITHOUT A LOSS OF CONTROL
in € thousand 2015 2014
Carrying amount of the acquired non-controlling interest 68 –
Purchase price of the acquired non-controlling interest –4,000 –
Difference between the purchase price and the carrying amount –3,932 0
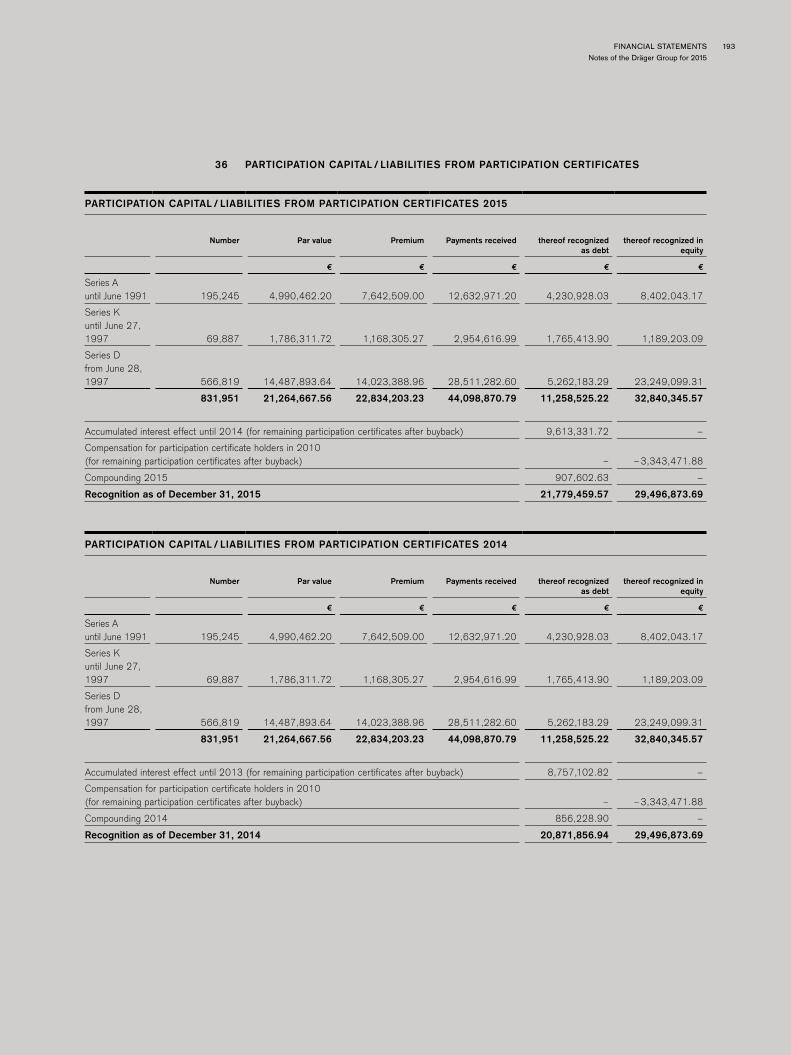
FINANCIAL STATEMENTSNotes of the Dräger Group for 2015
193
36 PARTICIPATION CAPITAL/ LIABILITIES FROM PARTICIPATION CERTIFICATES
PARTICIPATION CAPITAL/ LIABILITIES FROM PARTICIPATION CERTIFICATES 2015
Number Par value Premium Payments received thereof recognized as debt
thereof recognized in equity
€ € € € €
Series A until June 1991 195,245 4,990,462.20 7,642,509.00 12,632,971.20 4,230,928.03 8,402,043.17
Series K until June 27, 1997 69,887 1,786,311.72 1,168,305.27 2,954,616.99 1,765,413.90 1,189,203.09
Series D from June 28, 1997 566,819 14,487,893.64 14,023,388.96 28,511,282.60 5,262,183.29 23,249,099.31
831,951 21,264,667.56 22,834,203.23 44,098,870.79 11,258,525.22 32,840,345.57
Accumulated interest effect until 2014 (for remaining participation certificates after buyback) 9,613,331.72 –
Compensation for participation certificate holders in 2010 (for remaining participation certificates after buyback) – –3,343,471.88
Compounding 2015 907,602.63 –
Recognition as of December 31, 2015 21,779,459.57 29,496,873.69
PARTICIPATION CAPITAL/ LIABILITIES FROM PARTICIPATION CERTIFICATES 2014
Number Par value Premium Payments received thereof recognized as debt
thereof recognized in equity
€ € € € €
Series A until June 1991 195,245 4,990,462.20 7,642,509.00 12,632,971.20 4,230,928.03 8,402,043.17
Series K until June 27, 1997 69,887 1,786,311.72 1,168,305.27 2,954,616.99 1,765,413.90 1,189,203.09
Series D from June 28, 1997 566,819 14,487,893.64 14,023,388.96 28,511,282.60 5,262,183.29 23,249,099.31
831,951 21,264,667.56 22,834,203.23 44,098,870.79 11,258,525.22 32,840,345.57
Accumulated interest effect until 2013 (for remaining participation certificates after buyback) 8,757,102.82 –
Compensation for participation certificate holders in 2010 (for remaining participation certificates after buyback) – –3,343,471.88
Compounding 2014 856,228.90 –
Recognition as of December 31, 2014 20,871,856.94 29,496,873.69
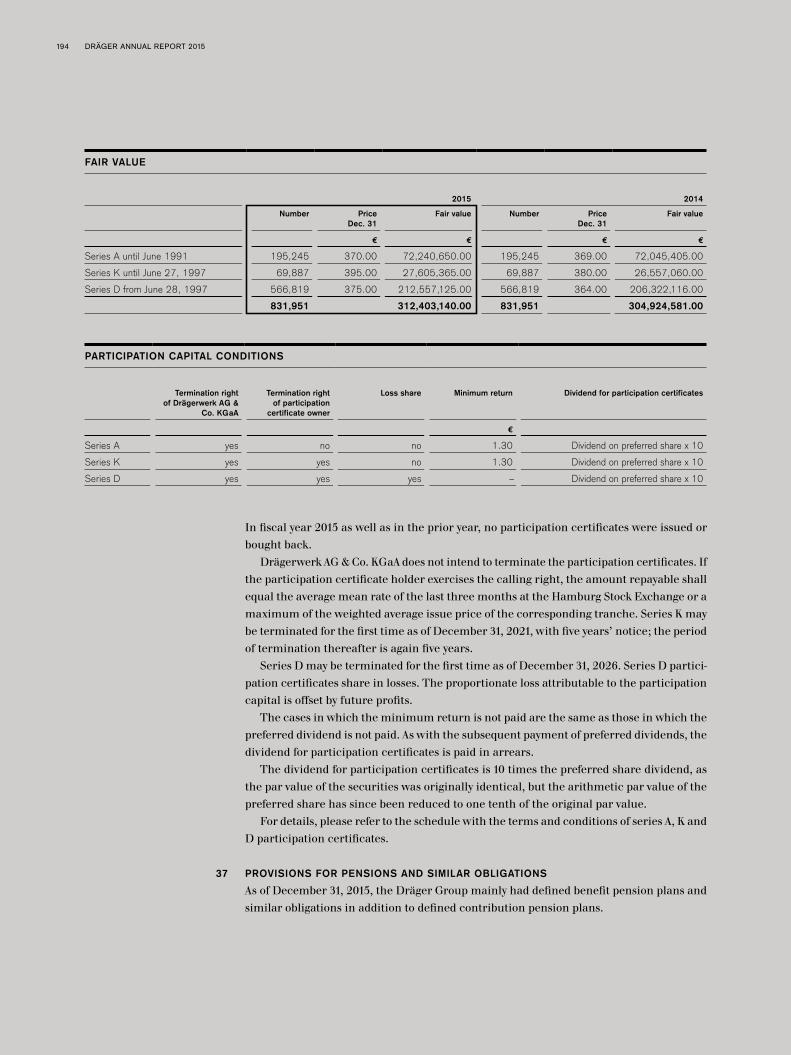
194 DRÄGER ANNUAL REPORT 2015
FAIR VALUE
2015 2014
Number Price Dec. 31
Fair value Number Price Dec. 31
Fair value
€ € € €
Series A until June 1991 195,245 370.00 72,240,650.00 195,245 369.00 72,045,405.00
Series K until June 27, 1997 69,887 395.00 27,605,365.00 69,887 380.00 26,557,060.00
Series D from June 28, 1997 566,819 375.00 212,557,125.00 566,819 364.00 206,322,116.00
831,951 312,403,140.00 831,951 304,924,581.00
PARTICIPATION CAPITAL CONDITIONS
Termination right of Drägerwerk AG &
Co. KGaA
Termination right of participation
certificate owner
Loss share Minimum return Dividend for participation certificates
€
Series A yes no no 1.30 Dividend on preferred share x 10
Series K yes yes no 1.30 Dividend on preferred share x 10
Series D yes yes yes – Dividend on preferred share x 10
In fiscal year 2015 as well as in the prior year, no participation certificates were issued or bought back.
Drägerwerk AG & Co. KGaA does not intend to terminate the participation certificates. If the participation certificate holder exercises the calling right, the amount repayable shall equal the average mean rate of the last three months at the Hamburg Stock Exchange or a maximum of the weighted average issue price of the corresponding tranche. Series K may be terminated for the first time as of December 31, 2021, with five years’ notice; the period of termination thereafter is again five years.
Series D may be terminated for the first time as of December 31, 2026. Series D partici-pation certificates share in losses. The proportionate loss attributable to the participation capital is offset by future profits.
The cases in which the minimum return is not paid are the same as those in which the preferred dividend is not paid. As with the subsequent payment of preferred dividends, the dividend for participation certificates is paid in arrears.
The dividend for participation certificates is 10 times the preferred share dividend, as the par value of the securities was originally identical, but the arithmetic par value of the preferred share has since been reduced to one tenth of the original par value.
For details, please refer to the schedule with the terms and conditions of series A, K and D participation certificates.
37 PROVISIONS FOR PENSIONS AND SIMILAR OBLIGATIONS
As of December 31, 2015, the Dräger Group mainly had defined benefit pension plans and similar obligations in addition to defined contribution pension plans.
FINANCIAL STATEMENTSNotes of the Dräger Group for 2015
195
Defined benefit pension plans and similar obligationsUnder the Group’s defined benefit pension plans, provisions for pensions and similar obli-gations have been accrued for benefits payable in the form of old-age, disability and surviv-ing dependents’ pensions. The amount of the obligations is determined using the projected unit credit method. The obligations are partly funded by plan assets.
The defined benefit pension plans of the German companies, which use the 2005G Heubeck mortality tables as a basis of calculation, account for some 90 percent (2014: 92 percent) of the provisions for pensions and similar obligations disclosed as of the balance sheet date. As of January 1, 2005, the new company pension plans “Rentenplan 2005” for almost all employees of the Dräger Group’s German subsidiaries and “Führungskräftever-sorgung 2005” for management came into effect, superseding the former “Versorgungsord-nung ’90” and “Ruhegeldordnung ’90” schemes.
Under the old pension plan, employees received pensions based on their salaries and period of employment. As part of the transition to the new plan, employees were guaran-teed a pension based on the old plan for their years of service prior to the transition. The new plan is now composed of the employer-funded basic level, the employee-funded top-up level (deferred compensation) and the employer-funded supplementary level.
The pension cost for the employer-funded basic level is based on the respective employ-ee’s income. The employee funded top-up level allows employees to increase their pension entitlement through deferred compensation.
The contribution made at the employer-funded supplementary level depends on the employee contribution through deferred compensation and on the Company’s business performance (EBIT).
Since December 2007, these funds from the pension plan as well as the employee con-tributions from the respective fiscal year have been paid into a new fund (WKN [securities identification number] AOHG1B) and secured in favor of the employees via a contractual trust arrangement (CTA), meaning that they only serve to cover and finance the Company’s direct pension obligations. The employees’ pension accounts have a minimum guaranteed return of 2.75 percent. Hence, the assets of this fund fulfill the criteria of plan assets pur-suant to IAS 19, the EUR 105,630 thousand (2014: EUR 93,869 thousand) in assets secured by the CTA were offset against the gross pension obligations in fiscal year 2015. Additions to the CTA of EUR 8,870 thousand are expected for fiscal year 2016 (in 2014 for fiscal year 2015: EUR 10,204 thousand).
The available excess of plan assets over the relevant pension obligations totaling EUR 59 thousand (2014: EUR 1 thousand) is disclosed under other non-current assets (see Note 27).
Under the Group’s defined benefit pension plans, Dräger is exposed to the following risks.– Due to the specific benefits, defined benefit pension plans are particularly long-term
employee benefits, the measurement of which includes making long-term assumptions that are subject to an increased risk in view of actual realization.
– The underlying discount rate in the recognition of pension obligations reflects the effec-tive market return on high-quality corporate bonds (calculated on the basis of modified Bloomberg indices) with the same term as the pension obligations as of the balance sheet date. If the actual return on plan assets is less than the calculated return, this creates a shortfall.
Note 27

196 DRÄGER ANNUAL REPORT 2015
– Reducing the effective market return of high-quality corporate bonds leads to an increase in the projected benefit obligation. If the projected benefit obligation is counteracted by plan assets, some of this effect is compensated for.
– If benefit obligations are not covered by plan assets, Dräger has to generate pension pay-ments within the course of its operating activities in the respective year.
– Due to the minimum guaranteed return of 2.75 percent, Dräger must compensate for the actual return of the plan assets should this fall below the minimum guaranteed return.
– According to Sec. 16 (1) of the German Act to Improve Occupational Pensions (BetrAVG), an employer that has guaranteed company pension plan obligations must consider adjust-ing these obligations in line with the rate of inflation every three years. The employer’s decision must consider the needs of the pension recipient and, above all, the economic situation of the company.The net obligation from defined benefit pension plans is recognized in the balance
sheet as follows:
NET OBLIGATION FROM DEFINED BENEFIT PENSION PLANS
in € thousand 2015 2014
Carrying amount of benefit obligations with plan assets 230,441 199,643
Present value of plan assets –176,780 –150,799
Underfunded pension plans 53,661 48,844
Carrying amount of benefit obligations without plan assets 234,427 248,164
Net obligation as of December 31 288,088 297,008
Available excess of plan assets 59 1
Provisions for pension obligations and similar obligations 288,147 297,009
Changes in the net obligation are as follows:
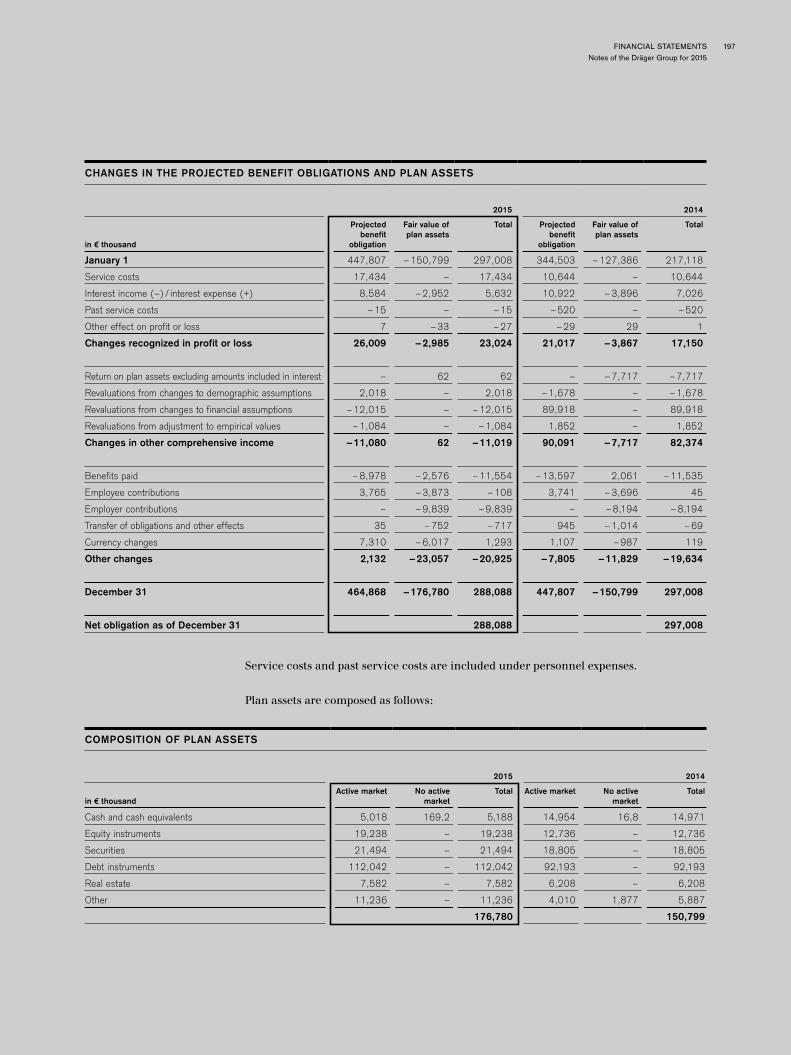
FINANCIAL STATEMENTSNotes of the Dräger Group for 2015
197
CHANGES IN THE PROJECTED BENEFIT OBLIGATIONS AND PLAN ASSETS
2015 2014
in € thousand
Projected benefit
obligation
Fair value of plan assets
Total Projected benefit
obligation
Fair value of plan assets
Total
January 1 447,807 –150,799 297,008 344,503 –127,386 217,118
Service costs 17,434 – 17,434 10,644 – 10,644
Interest income (–) / interest expense (+) 8,584 –2,952 5,632 10,922 –3,896 7,026
Past service costs –15 – –15 –520 – –520
Other effect on profit or loss 7 –33 –27 –29 29 1
Changes recognized in profit or loss 26,009 –2,985 23,024 21,017 –3,867 17,150
Return on plan assets excluding amounts included in interest – 62 62 – –7,717 –7,717
Revaluations from changes to demographic assumptions 2,018 – 2,018 –1,678 – –1,678
Revaluations from changes to financial assumptions –12,015 – –12,015 89,918 – 89,918
Revaluations from adjustment to empirical values –1,084 – –1,084 1,852 – 1,852
Changes in other comprehensive income –11,080 62 –11,019 90,091 –7,717 82,374
Benefits paid –8,978 –2,576 –11,554 –13,597 2,061 –11,535
Employee contributions 3,765 –3,873 –108 3,741 –3,696 45
Employer contributions – –9,839 –9,839 – –8,194 –8,194
Transfer of obligations and other effects 35 –752 –717 945 –1,014 –69
Currency changes 7,310 –6,017 1,293 1,107 –987 119
Other changes 2,132 –23,057 –20,925 –7,805 –11,829 –19,634
December 31 464,868 –176,780 288,088 447,807 –150,799 297,008
Net obligation as of December 31 288,088 297,008
Service costs and past service costs are included under personnel expenses.
Plan assets are composed as follows:
COMPOSITION OF PLAN ASSETS
2015 2014
in € thousandActive market No active
marketTotal Active market No active
marketTotal
Cash and cash equivalents 5,018 169,2 5,188 14,954 16,8 14,971
Equity instruments 19,238 – 19,238 12,736 – 12,736
Securities 21,494 – 21,494 18,805 – 18,805
Debt instruments 112,042 – 112,042 92,193 – 92,193
Real estate 7,582 – 7,582 6,208 – 6,208
Other 11,236 – 11,236 4,010 1,877 5,887
176,780 150,799
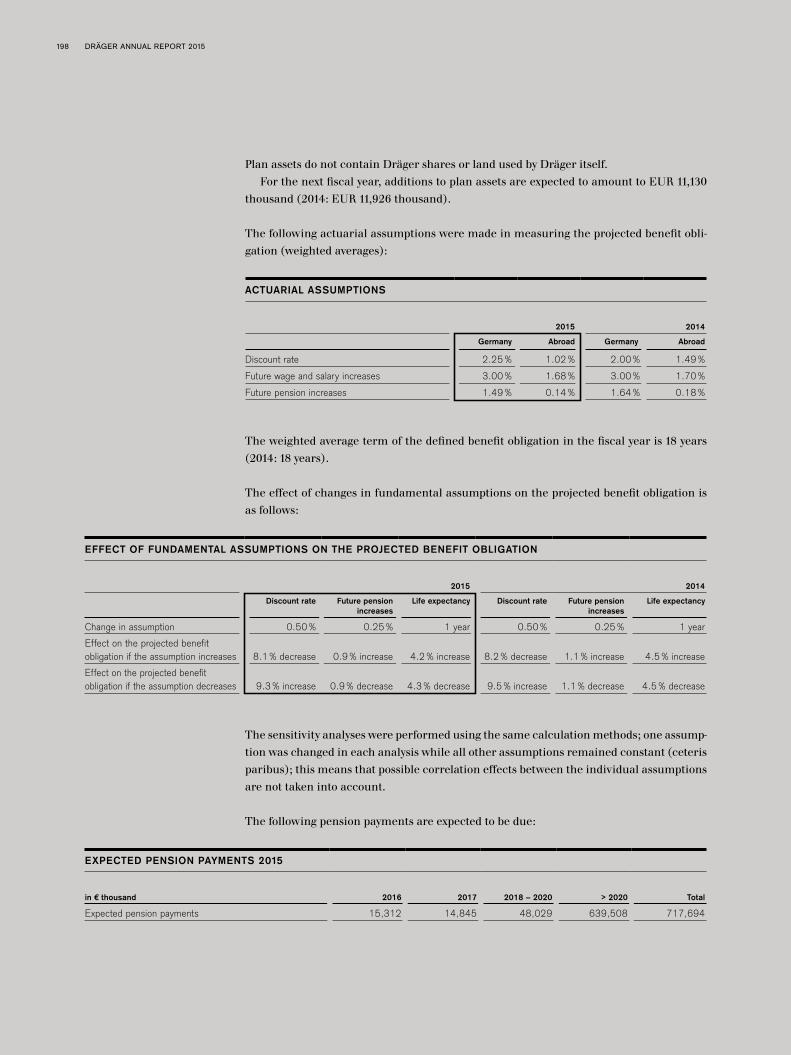
198 DRÄGER ANNUAL REPORT 2015
Plan assets do not contain Dräger shares or land used by Dräger itself.For the next fiscal year, additions to plan assets are expected to amount to EUR 11,130
thousand (2014: EUR 11,926 thousand).
The following actuarial assumptions were made in measuring the projected benefit obli-gation (weighted averages):
ACTUARIAL ASSUMPTIONS
2015 2014
Germany Abroad Germany Abroad
Discount rate 2.25% 1.02% 2.00% 1.49%
Future wage and salary increases 3.00% 1.68% 3.00% 1.70%
Future pension increases 1.49% 0.14% 1.64% 0.18%
The weighted average term of the defined benefit obligation in the fiscal year is 18 years (2014: 18 years).
The effect of changes in fundamental assumptions on the projected benefit obligation is as follows:
EFFECT OF FUNDAMENTAL ASSUMPTIONS ON THE PROJECTED BENEFIT OBLIGATION
2015 2014
Discount rate Future pension increases
Life expectancy Discount rate Future pension increases
Life expectancy
Change in assumption 0.50% 0.25% 1 year 0.50% 0.25% 1 year
Effect on the projected benefit obligation if the assumption increases 8.1% decrease 0.9% increase 4.2% increase 8.2% decrease 1.1% increase 4.5% increase
Effect on the projected benefit obligation if the assumption decreases 9.3% increase 0.9% decrease 4.3% decrease 9.5% increase 1.1% decrease 4.5% decrease
The sensitivity analyses were performed using the same calculation methods; one assump-tion was changed in each analysis while all other assumptions remained constant (ceteris paribus); this means that possible correlation effects between the individual assumptions are not taken into account.
The following pension payments are expected to be due:
EXPECTED PENSION PAYMENTS 2015
in € thousand 2016 2017 2018 – 2020 > 2020 Total
Expected pension payments 15,312 14,845 48,029 639,508 717,694

FINANCIAL STATEMENTSNotes of the Dräger Group for 2015
199
EXPECTED PENSION PAYMENTS 2014
in € thousand 2015 2016 2017 – 2019 > 2019 Total
Expected pension payments 14,353 15,100 45,655 588,115 663,223
Expenses for additional benefits to pensioners of EUR 2,740 thousand (2014: EUR 1,447 thousand) were recognized in fiscal year 2015.
Defined contribution plansIn addition to the defined benefit plans and similar obligations described above, Dräger pays voluntary and statutory contributions to government and private pension insurers (defined contribution plans).
The cost of other defined contribution plans came to EUR 10,716 thousand in fiscal year 2015 (2014: EUR 9,179 thousand). Dräger also paid statutory pension contributions in Germany of EUR 34,411 thousand (2014: EUR 33,181 thousand).
38 OTHER NON-CURRENT AND CURRENT PROVISIONS
OTHER NON-CURRENT AND CURRENT PROVISIONS
in € thousand
Provisions for personnel
and welfare obligations
Warranty provisions
Provisions for potential losses
Provisions for commissions
Provisions for other obligations
in the normal course of business
2015 Total
January 1 127,447 27,129 8,353 9,477 72,491 244,897
Allocation 120,132 23,032 1,893 7,730 61,953 214,740
Accumulation of interest 255 – 461 – 94 810
Utilization –92,205 –13,187 –618 –6,536 –43,410 –155,956
Reversal –3,686 –1,908 –1,885 –233 –9,414 –17,126
Change in the scope of consolidation 1 10 – – 6 16
Currency translations effects 2,425 370 –18 –48 –478 2,250
December 31 154,369 35,445 8,187 10,389 81,241 289,631
Other provisions include expenses for severance payments paid within the scope of the “Fit-for-growth” efficiency program of EUR 27,437 thousand. Of this amount, EUR 21,887 thousand relate to German subsidiaries and EUR 5,550 thousand to foreign subsidiaries. Expenses of EUR 3,100 thousand have also been deferred for the safety division facility in Pittsburgh, USA.
In addition, provisions for personnel and welfare obligations were largely recognized to cover bonuses and sales compensation; the basis on which these are calculated had not been finalized as of the balance sheet date, meaning that the obligations are not yet report-ed as a liability. This item also includes provisions for phased retirement and long-service awards.
The warranty provisions were measured by reference to the warranty claims made in the past and specific known risks.

200 DRÄGER ANNUAL REPORT 2015
Provisions for potential losses mainly resulted from long-term leases of unused or not fully used business premises.
Provisions for commissions relate to those contractual commission entitlements where the underlying intermediary transaction had not been finalized as of the balance sheet date, meaning that the obligation is not yet reported as a liability.
Provisions for other obligations in the normal course of business contain provisions for unpaid invoices for services received amounting to EUR 31,789 thousand (2014: EUR 22,164 thousand), the amount of which is not sufficiently certain. These mainly relate to provisions for services received that have not yet been settled; as a result, the amount of these provisions has not been finalized. In addition, obligations for the audit of financial statements of EUR 2,923 thousand (2014: EUR 2,396 thousand) were set aside, as were obligations for customer bonuses of EUR 5,068 thousand (2014: EUR 4,130 thousand). Obligations in the normal course of business also include obligations for litigation costs and risks, purchase guarantees and other taxes. The expected utilization of other provisions is as follows:
MATURITIES
in € thousand Up to 1 year 1 to 5 years Over 5 years Total
Provisions for personnel and welfare obligations 118,524 25,495 10,350 154,369
Warranty provisions 29,467 5,821 157 35,445
Provisions for potential losses 1,195 2,103 4,889 8,187
Provisions for commissions 10,389 – – 10,389
Provisions for other obligations in the normal course of business 73,409 7,536 295 81,241
232,984 40,955 15,691 289,631
39 NON-CURRENT INTEREST-BEARING LOANS
NON-CURRENT INTEREST-BEARING LOANS
2015 2014
in € thousand 1 to 5 years Over 5 years Total 1 to 5 years Over 5 years Total
Non-current liabilities to banks 47,421 52,259 99,681 37,723 35,007 72,730
Note loans (issued 2011) 38,437 – 38,437 95,833 – 95,833
85,859 52,259 138,118 133,556 35,007 168,563
The non-current note loans in place as of the balance sheet date are not subject to any contractually agreed termination options.
The terms and conditions and the interest on non-current interest-bearing loans are as follows:

FINANCIAL STATEMENTSNotes of the Dräger Group for 2015
201
TERMS AND CONDITIONS AND INTEREST RATES FOR NON-CURRENT INTEREST-BEARING LOANS
2015 2014
in € thousand Interest conditions Interest rate in % Total Interest conditions Interest rate in % Total
Liabilities to banks
EUR fixed 0.75 – 6.0 80,122 fixed 1.25 – 5.97 54,026
EUR variable 1.46 – 1.54 16,250 variable 1.54 – 1.75 13,892
ZAR fixed 8.8 3,162 variable 0
INR fixed 5.0 40 fixed 10.15 4,436
Other fixed 0.13 – 17.0 107 fixed 7.44 – 8.0 376
99,681 72,730
Note loans
EUR fixed 3.88 38,437 fixed 3.21 – 3.88 95,833
38,437 95,833
138,118 168,563
Variable interest rates are partly hedged. Please see our information on derivative financial instruments and interest rate risks (Note 46).
Liabilities to banks arising from the construction of the medical division’s new office and laboratory building that was completed in fiscal year 2008 have been collateralized by a mortgage of EUR 55 million. The finance for the new production and logistics building for the Infrastructure Projects segment in Lübeck, which was completed in fiscal year 2011, has been secured with a mortgage of EUR 10.8 million. There are no other mortgages on land and buildings or assignments as security for recognized liabilities.
40 OTHER NON-CURRENT FINANCIAL LIABILITIES
OTHER NON-CURRENT FINANCIAL LIABILITIES
2015 2014
in € thousand 1 to 5 years Over 5 years Total 1 to 5 years Over 5 years Total
Repayment obligation Draeger Arabia Co. Ltd. – 12,463 12,463 – 11,542 11,542
Finance lease liabilities (lessee) 2,914 5,660 8,574 3,929 5,778 9,707
Negative fair values of derivate financial instruments 766 3,213 3,979 74 3,686 3,760
Sundry non-current financial liabilities 2,303 286 2,589 2,127 517 2,644
5,982 21,622 27,604 6,130 21,523 27,653
The repayment obligation to the non-controlling shareholder of Draeger Arabia Co. Ltd. results from the amended agreements that came into force effective from February 2014 and allow the shareholders to offer their shares to the other shareholder from January 1, 2024, or to bring about the company’s liquidation in the event that the other shareholder does not consent to purchase the shares. The non-controlling shareholder’s puttable shares
Note 46
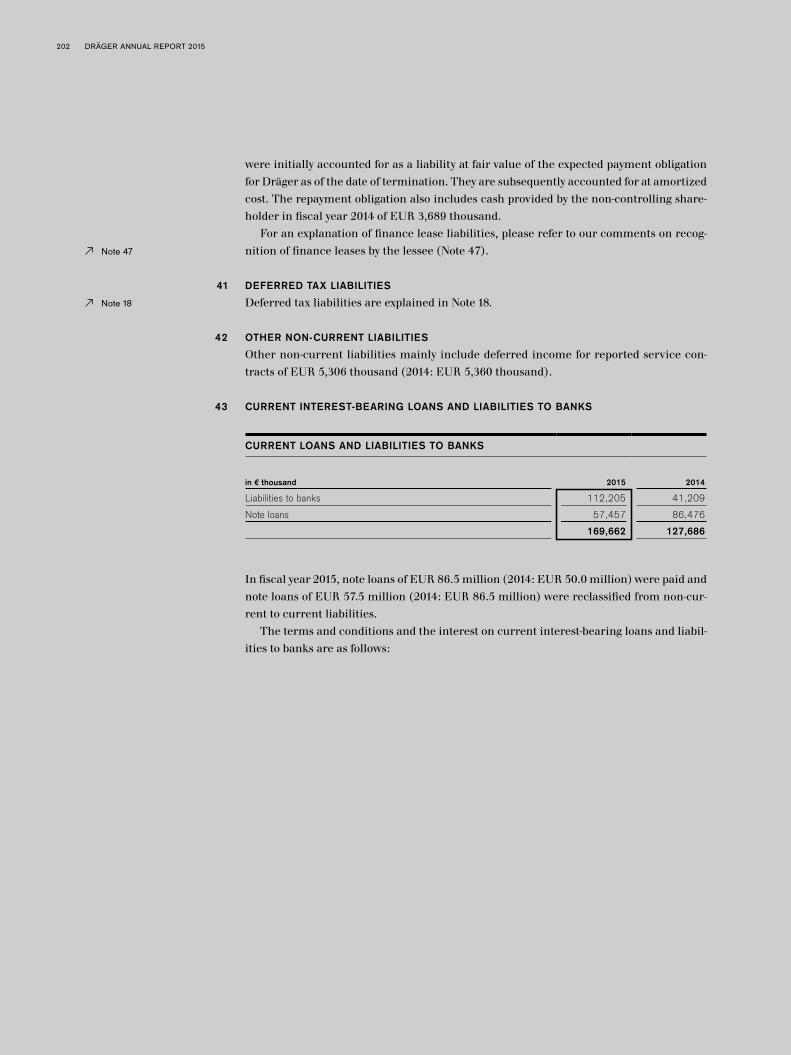
202 DRÄGER ANNUAL REPORT 2015
were initially accounted for as a liability at fair value of the expected payment obligation for Dräger as of the date of termination. They are subsequently accounted for at amortized cost. The repayment obligation also includes cash provided by the non-controlling share-holder in fiscal year 2014 of EUR 3,689 thousand.
For an explanation of finance lease liabilities, please refer to our comments on recog-nition of finance leases by the lessee (Note 47).
41 DEFERRED TAX LIABILITIES
Deferred tax liabilities are explained in Note 18.
42 OTHER NON-CURRENT LIABILITIES
Other non-current liabilities mainly include deferred income for reported service con-tracts of EUR 5,306 thousand (2014: EUR 5,360 thousand).
43 CURRENT INTEREST-BEARING LOANS AND LIABILITIES TO BANKS
CURRENT LOANS AND LIABILITIES TO BANKS
in € thousand 2015 2014
Liabilities to banks 112,205 41,209
Note loans 57,457 86,476
169,662 127,686
In fiscal year 2015, note loans of EUR 86.5 million (2014: EUR 50.0 million) were paid and note loans of EUR 57.5 million (2014: EUR 86.5 million) were reclassified from non-cur-rent to current liabilities.
The terms and conditions and the interest on current interest-bearing loans and liabil-ities to banks are as follows:
Note 47
Note 18

FINANCIAL STATEMENTSNotes of the Dräger Group for 2015
203
TERMS AND CONDITIONS AND INTEREST RATES FOR CURRENT LOANS AND LIABILITIES TO BANKS
2015 2014
Interest conditions Interest rate in % Total Interest conditions Interest rate in % Total
Liabilities to banks
EUR variable 0.01 – 8.0 60,961 variable 1.54 – 1.75 407
EUR fixed 0.01 – 5.1 5,485 fixed 2.12 – 6.0 6,590
SAR fixed 1.55 – 3.40 17,868 fixed – –
JPY variable 1.1 – 1.6 12,106 variable 1.35 7,334
USD fixed 1.53 – 1.60 7,807 fixed 1.53 7,001
INR fixed 3.0 – 5.0 6,313 fixed 10.01 4,312
CLP variable – – variable 0.60 – 1.50 4,185
CNY fixed – – fixed 5.6 – 7.9 8,231
Other fixed 0.13 – 17.0 1,496 fixed 3.0 – 26.25 3,054
Other variable 0.50 – 5.0 169 variable 1.5 – 2.35 95
112,205 41,209
Note loans
EUR fixed 3.21 57,457 fixed 4.95 – 7.07 86,476
57,457 86,476
169,662 127,686
Variable interest rates are partly hedged. Please also see our information on derivative financial instruments (Note 46).
44 OTHER CURRENT FINANCIAL LIABILITIES
OTHER CURRENT FINANCIAL LIABILITIES
in € thousand 2015 2014
Trade payables to third parties 186,405 201,340
Other current financial liabilities
Liabilities to employees 7,982 8,452
Debtors with credit balances 5,862 2,199
Liabilities to Drägerwerk Verwaltungs AG 3,787 2,665
Negative fair values of derivate financial instruments 3,104 3,334
Finance lease liabilities (lessee) 1,726 1,564
Liabilities from accrued loan interest 368 4,450
Distribution for participation capital 345 345
Liabilities to associates – 87
Other financial liabilities 2,168 7,070
25,343 30,166
211,748 231,506
For the derivative financial instruments recognized as other financial liabilities, please refer to the table of derivative financial instruments in the Dräger Group presented in Note 46.
Note 46
Note 46
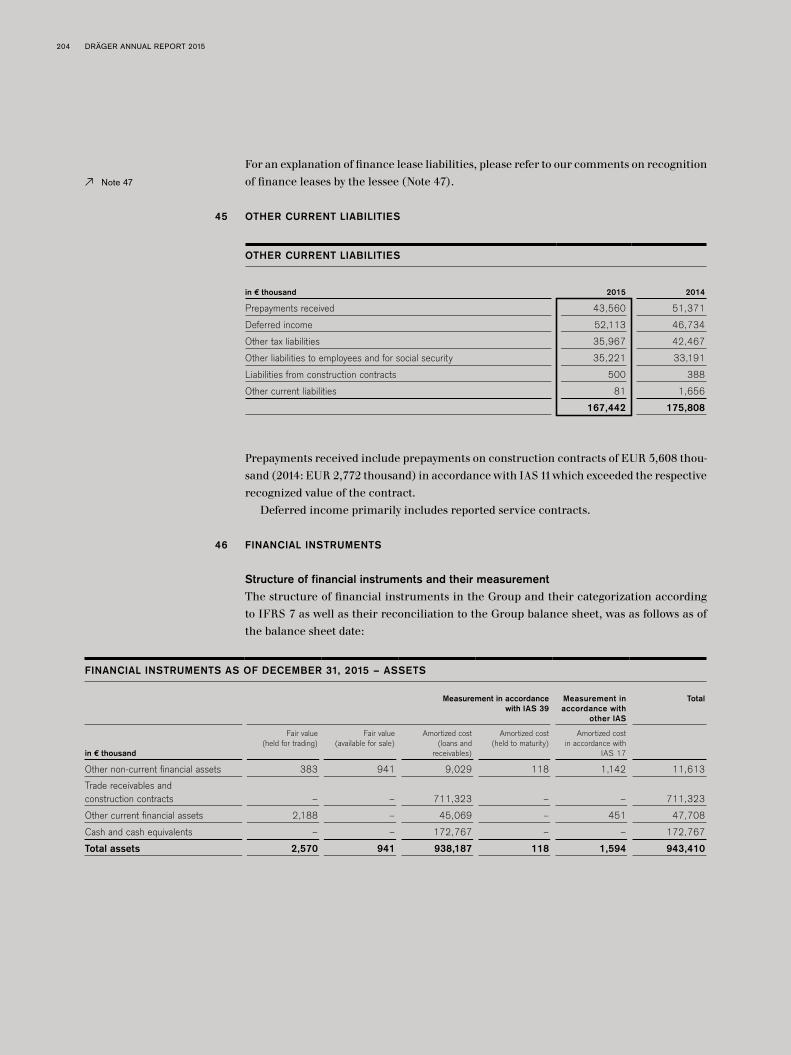
204 DRÄGER ANNUAL REPORT 2015
For an explanation of finance lease liabilities, please refer to our comments on recognition of finance leases by the lessee (Note 47).
45 OTHER CURRENT LIABILITIES
OTHER CURRENT LIABILITIES
in € thousand 2015 2014
Prepayments received 43,560 51,371
Deferred income 52,113 46,734
Other tax liabilities 35,967 42,467
Other liabilities to employees and for social security 35,221 33,191
Liabilities from construction contracts 500 388
Other current liabilities 81 1,656
167,442 175,808
Prepayments received include prepayments on construction contracts of EUR 5,608 thou-sand (2014: EUR 2,772 thousand) in accordance with IAS 11 which exceeded the respective recognized value of the contract.
Deferred income primarily includes reported service contracts.
46 FINANCIAL INSTRUMENTS
Structure of financial instruments and their measurement The structure of financial instruments in the Group and their categorization according to IFRS 7 as well as their reconciliation to the Group balance sheet, was as follows as of the balance sheet date:
FINANCIAL INSTRUMENTS AS OF DECEMBER 31, 2015 – ASSETS
Measurement in accordance with IAS 39
Measurement in accordance with
other IAS
Total
in € thousand
Fair value (held for trading)
Fair value(available for sale)
Amortized cost (loans and
receivables)
Amortized cost (held to maturity)
Amortized cost in accordance with
IAS 17
Other non-current financial assets 383 941 9,029 118 1,142 11,613
Trade receivables and construction contracts – – 711,323 – – 711,323
Other current financial assets 2,188 – 45,069 – 451 47,708
Cash and cash equivalents – – 172,767 – – 172,767
Total assets 2,570 941 938,187 118 1,594 943,410
Note 47
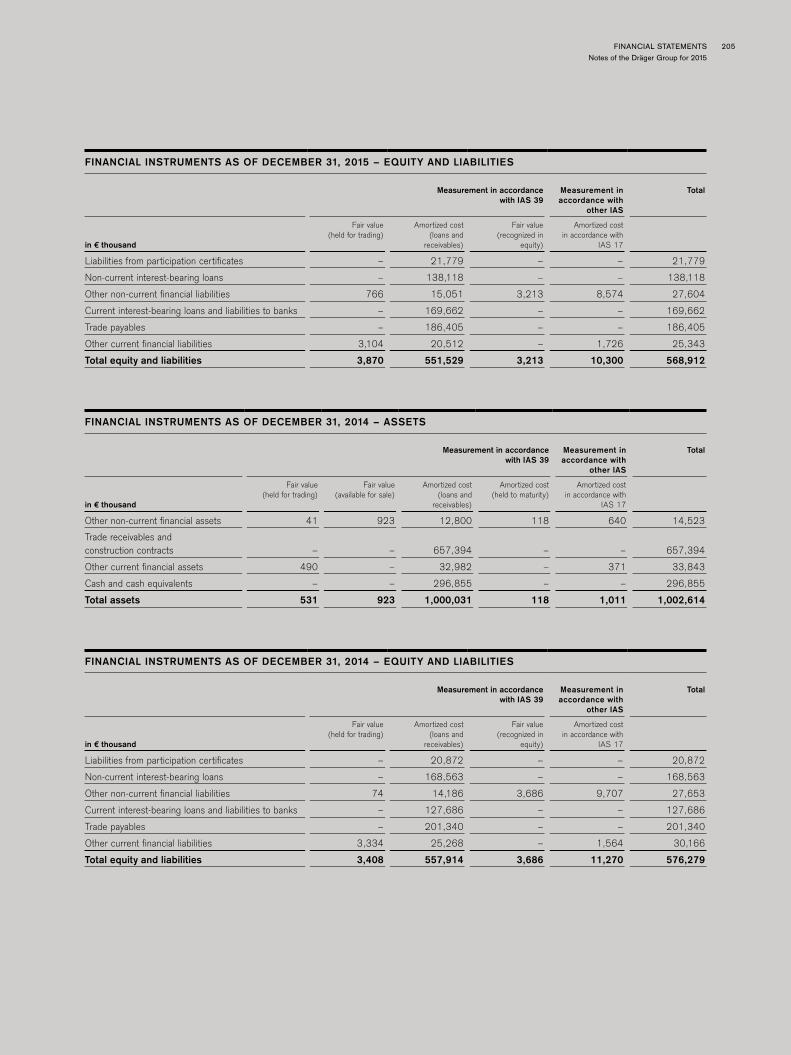
FINANCIAL STATEMENTSNotes of the Dräger Group for 2015
205
FINANCIAL INSTRUMENTS AS OF DECEMBER 31, 2015 – EQUITY AND LIABILITIES
Measurement in accordance
with IAS 39 Measurement in accordance with
other IAS
Total
in € thousand
Fair value (held for trading)
Amortized cost (loans and
receivables)
Fair value (recognized in
equity)
Amortized cost in accordance with
IAS 17
Liabilities from participation certificates – 21,779 – – 21,779
Non-current interest-bearing loans – 138,118 – – 138,118
Other non-current financial liabilities 766 15,051 3,213 8,574 27,604
Current interest-bearing loans and liabilities to banks – 169,662 – – 169,662
Trade payables – 186,405 – – 186,405
Other current financial liabilities 3,104 20,512 – 1,726 25,343
Total equity and liabilities 3,870 551,529 3,213 10,300 568,912
FINANCIAL INSTRUMENTS AS OF DECEMBER 31, 2014 – ASSETS
Measurement in accordance with IAS 39
Measurement in accordance with
other IAS
Total
in € thousand
Fair value (held for trading)
Fair value(available for sale)
Amortized cost (loans and
receivables)
Amortized cost (held to maturity)
Amortized cost in accordance with
IAS 17
Other non-current financial assets 41 923 12,800 118 640 14,523
Trade receivables and construction contracts – – 657,394 – – 657,394
Other current financial assets 490 – 32,982 – 371 33,843
Cash and cash equivalents – – 296,855 – – 296,855
Total assets 531 923 1,000,031 118 1,011 1,002,614
FINANCIAL INSTRUMENTS AS OF DECEMBER 31, 2014 – EQUITY AND LIABILITIES
Measurement in accordance
with IAS 39 Measurement in accordance with
other IAS
Total
in € thousand
Fair value (held for trading)
Amortized cost (loans and
receivables)
Fair value (recognized in
equity)
Amortized cost in accordance with
IAS 17
Liabilities from participation certificates – 20,872 – – 20,872
Non-current interest-bearing loans – 168,563 – – 168,563
Other non-current financial liabilities 74 14,186 3,686 9,707 27,653
Current interest-bearing loans and liabilities to banks – 127,686 – – 127,686
Trade payables – 201,340 – – 201,340
Other current financial liabilities 3,334 25,268 – 1,564 30,166
Total equity and liabilities 3,408 557,914 3,686 11,270 576,279

206 DRÄGER ANNUAL REPORT 2015
The measurement categories are explained in our comments on the measurement of financial assets and liabilities in Note 10.
Other non-current financial assets include investments with a carrying value of EUR 274 thousand (2014: EUR 250 thousand). These investments are not quoted in any active market. Other methods for calculating an objective market value rendered no reliable result. The investments are therefore carried at cost.
Regular fair value measurement of financial instruments Financial instruments recognized at fair value were located to the following three levels of the fair value hierarchy:
FAIR VALUE MEASUREMENT
in € thousand Level 2015 2014
Assets measured at fair value
Derivatives with positive fair value (non-current) 2 383 41
Derivatives with positive fair value (current) 2 2,188 490
Securities (non-current) 1 667 674
Liabilities measured at fair value
Derivatives with negative fair value (non-current) 2 3,979 3,760
thereof with a hedging relationship 3,213 3,686
Derivatives with negative fair value (current) 2 3,104 3,334
Level 1:Prices in the active markets are assumed in unchanged form for identical financial assets or liabilities. The fair values of non-current securities are based on current stock market prices.
Level 2:Uses largely observable input factors that can be directly (i.e. price) or indirectly (i.e. de-rived from prices) observed for financial assets or financial inabilities; these do not include any listed prices taken into consideration in level 1.
Dräger applies the discounted cash flow method when measuring derivatives. Expected cash flows are determined on the basis of secured prices and/or interest rates and the observable closing rates and/or interest rates, which are then discounted using an interest rate that takes into account Dräger’s Company-related risks.
Level 3:Uses factors not based on observable market data for the measurement of financial assets and liabilities (unobservable input factors). These are classified as level 3 when there is an unobservable input factor present that significantly influences the measurement. The Dräger Group does not hold any level 3 financial instruments.
No reclassifications between the levels were carried out in the past two fiscal years.
Note 10
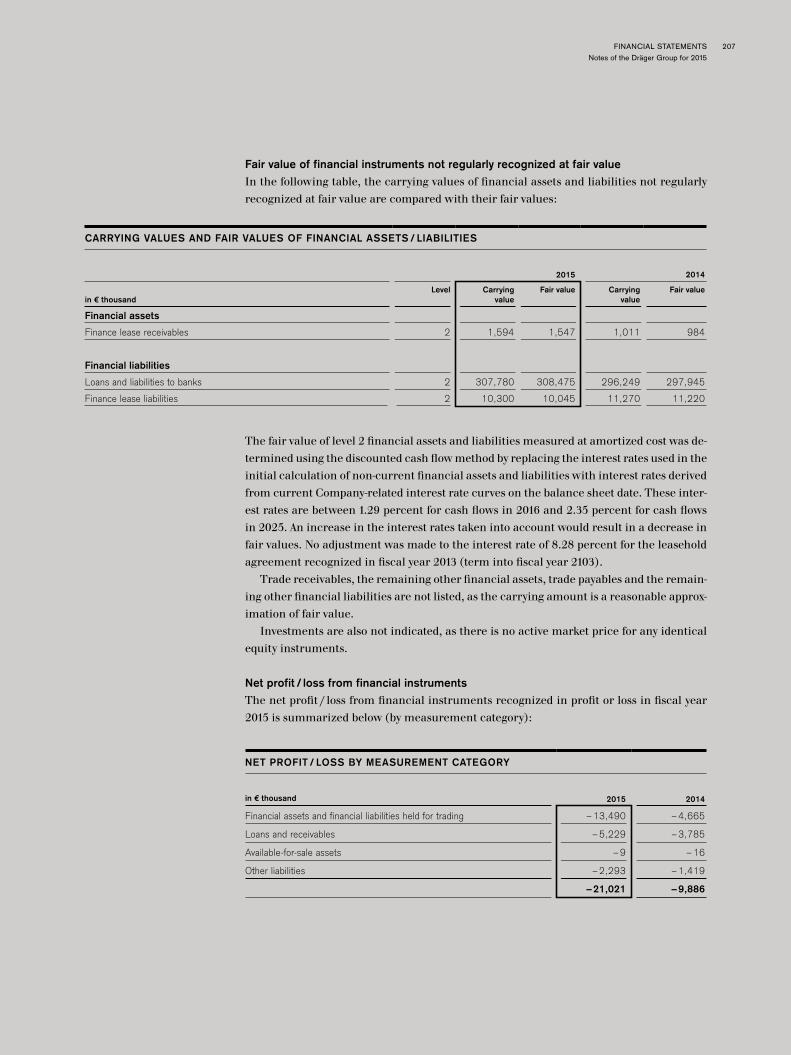
FINANCIAL STATEMENTSNotes of the Dräger Group for 2015
207
Fair value of financial instruments not regularly recognized at fair valueIn the following table, the carrying values of financial assets and liabilities not regularly recognized at fair value are compared with their fair values:
CARRYING VALUES AND FAIR VALUES OF FINANCIAL ASSETS/ LIABILITIES
2015 2014
in € thousandLevel Carrying
valueFair value Carrying
valueFair value
Financial assets
Finance lease receivables 2 1,594 1,547 1,011 984
Financial liabilities
Loans and liabilities to banks 2 307,780 308,475 296,249 297,945
Finance lease liabilities 2 10,300 10,045 11,270 11,220
The fair value of level 2 financial assets and liabilities measured at amortized cost was de-termined using the discounted cash flow method by replacing the interest rates used in the initial calculation of non-current financial assets and liabilities with interest rates derived from current Company-related interest rate curves on the balance sheet date. These inter-est rates are between 1.29 percent for cash flows in 2016 and 2.35 percent for cash flows in 2025. An increase in the interest rates taken into account would result in a decrease in fair values. No adjustment was made to the interest rate of 8.28 percent for the leasehold agreement recognized in fiscal year 2013 (term into fiscal year 2103).
Trade receivables, the remaining other financial assets, trade payables and the remain-ing other financial liabilities are not listed, as the carrying amount is a reasonable approx-imation of fair value.
Investments are also not indicated, as there is no active market price for any identical equity instruments.
Net profit/loss from financial instrumentsThe net profit/loss from financial instruments recognized in profit or loss in fiscal year 2015 is summarized below (by measurement category):
NET PROFIT/ LOSS BY MEASUREMENT CATEGORY
in € thousand 2015 2014
Financial assets and financial liabilities held for trading –13,490 –4,665
Loans and receivables –5,229 –3,785
Available-for-sale assets –9 –16
Other liabilities –2,293 –1,419
–21,021 –9,886

208 DRÄGER ANNUAL REPORT 2015
The net profit/loss of the financial assets and liabilities in the held for trading category comprises profit and loss from changes in fair value as well as interest income/expenses for these assets and liabilities. The net profit/loss in the category loans and receivables contains losses from receivables of EUR 11,817 thousand (2014: EUR 11,497 thousand).
Interest income/expenses from financial instrumentsIn fiscal year 2015, interest income/expenses from financial instruments not measured at fair value through profit or loss was as follows:
INTEREST INCOME/ EXPENSES FROM FINANCIAL INSTRUMENTS
in € thousand 2015 2014
Interest income
Loans and receivables 1,462 1,402
Held-to-maturity investments 4 4
Available-for-sale assets 176 323
1,643 1,729
Interest expenses
Other liabilities –11,993 –15,741
–10,350 –14,012
Financial risk managementAs an international company, the Dräger Group is especially exposed to exchange rate and interest rate risks, in addition to liquidity risks.
The aim of financial risk management is to uncover and mitigate financial risks posed to the Dräger Group through ongoing operating and finance-oriented processes. A systematic recognition, control and monitoring of market risks is designed to counter developments that could jeopardize the existence of Dräger early on and ensure Dräger’s continued ex-istence in the long term. Derivative financial instruments are used to hedge the currency and interest exposure of current and forecast transactions. These derivatives are used ex-clusively as hedging instruments and are generally not concluded for speculative purposes. Derivatives are used to decrease credit risks and are only transacted with banks with an investment grade rating.
A committee, which is comprised of the CFO as well as participants from the treasury, accounting and controlling departments, determines and monitors the basic features of Dräger’s financial policies. The members of this committee meet at least once per quarter to decide on possible hedging strategies on the basis of current developments as well as the existing risk positions.
Financial risk management is based on the annually revised strategic plans of the Group and divisions and the resultant short and medium-term plans. The financial policies as well as financial risk management for liquidity, currency and interest rate risks are im-plemented centrally by the Group treasury department. Please see our comments in the management report for more general information on risk management.
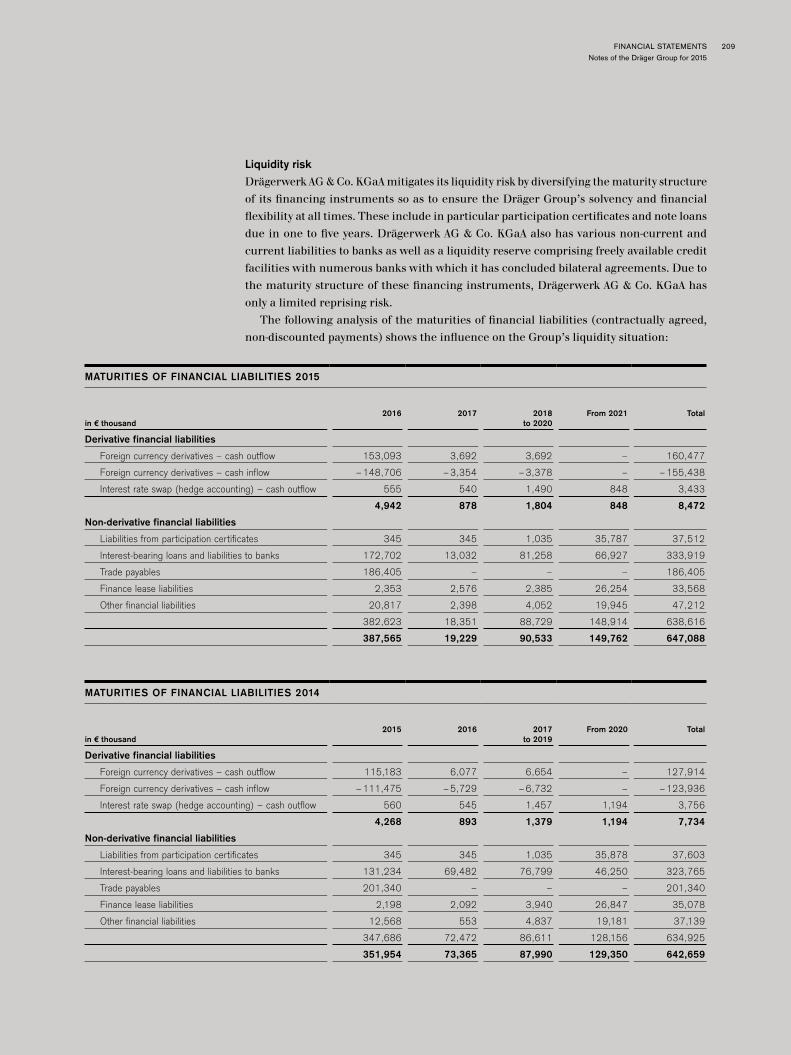
FINANCIAL STATEMENTSNotes of the Dräger Group for 2015
209
Liquidity riskDrägerwerk AG & Co. KGaA mitigates its liquidity risk by diversifying the maturity structure of its financing instruments so as to ensure the Dräger Group’s solvency and financial flexibility at all times. These include in particular participation certificates and note loans due in one to five years. Drägerwerk AG & Co. KGaA also has various non-current and current liabilities to banks as well as a liquidity reserve comprising freely available credit facilities with numerous banks with which it has concluded bilateral agreements. Due to the maturity structure of these financing instruments, Drägerwerk AG & Co. KGaA has only a limited reprising risk.
The following analysis of the maturities of financial liabilities (contractually agreed, non-discounted payments) shows the influence on the Group’s liquidity situation:
MATURITIES OF FINANCIAL LIABILITIES 2015
in € thousand2016 2017 2018
to 2020From 2021 Total
Derivative financial liabilities
Foreign currency derivatives – cash outflow 153,093 3,692 3,692 – 160,477
Foreign currency derivatives – cash inflow –148,706 –3,354 –3,378 – –155,438
Interest rate swap (hedge accounting) – cash outflow 555 540 1,490 848 3,433
4,942 878 1,804 848 8,472
Non-derivative financial liabilities
Liabilities from participation certificates 345 345 1,035 35,787 37,512
Interest-bearing loans and liabilities to banks 172,702 13,032 81,258 66,927 333,919
Trade payables 186,405 – – – 186,405
Finance lease liabilities 2,353 2,576 2,385 26,254 33,568
Other financial liabilities 20,817 2,398 4,052 19,945 47,212
382,623 18,351 88,729 148,914 638,616
387,565 19,229 90,533 149,762 647,088
MATURITIES OF FINANCIAL LIABILITIES 2014
in € thousand2015 2016 2017
to 2019From 2020 Total
Derivative financial liabilities
Foreign currency derivatives – cash outflow 115,183 6,077 6,654 – 127,914
Foreign currency derivatives – cash inflow –111,475 –5,729 –6,732 – –123,936
Interest rate swap (hedge accounting) – cash outflow 560 545 1,457 1,194 3,756
4,268 893 1,379 1,194 7,734
Non-derivative financial liabilities
Liabilities from participation certificates 345 345 1,035 35,878 37,603
Interest-bearing loans and liabilities to banks 131,234 69,482 76,799 46,250 323,765
Trade payables 201,340 – – – 201,340
Finance lease liabilities 2,198 2,092 3,940 26,847 35,078
Other financial liabilities 12,568 553 4,837 19,181 37,139
347,686 72,472 86,611 128,156 634,925
351,954 73,365 87,990 129,350 642,659

210 DRÄGER ANNUAL REPORT 2015
Cash outflow from currency hedges of EUR 160.5 million (2014: EUR 127.9 million) faced cash inflow of EUR 155.4 million (2014: EUR 123.9 million) as of December 31, 2015.
Currency riskThe Group’s currency risks within the meaning of IFRS 7 relate to the financial instru-ments used in connection with operating activities or investing and financing activities. The Dräger Group mainly counters this risk that remains after offsetting cash inflows and outflows in the same foreign currency by entering into derivatives. Currency management aims to limit the effect of exchange rate fluctuations on the Dräger Group’s results of op-erations and net assets.
Group treasury and controlling are responsible for determining and analyzing currency risk positions as well as developing and implementing the hedging strategy. As a general rule, only those currency risks that impact the Group’s cash flows are hedged. However, risks resulting from the translation of statements of assets and liabilities of foreign subsid-iaries into the Group’s reporting currency are generally not hedged.
In order to better illustrate existing currency risks, the effects of hypothetical changes in relevant currencies on net profit and equity are discussed below on the basis of a currency sensitivity analysis. For this purpose, it was assumed that most monetary financial instru-ments are already denominated in the functional currency or have been converted into the functional currency using derivative financial instruments. Currency risks therefore lie in the remaining unhedged financial instruments in foreign currencies in respect of which currency fluctuations affect profit or loss. If the euro were up/down 10 percent against the US dollar, the main foreign currency in the Dräger Group, as of the balance sheet date, with all other variables remaining the same, earnings after taxes (pursuant to IFRS 7) would be EUR 2.2 million lower (2014: EUR 3.9 million lower)/EUR 2.6 million higher (2014: EUR 4.8 million higher); as in the prior year, this did not directly impact equity.
Interest rate riskAs well as variable rate non-current receivables and liabilities from operations, variable rate non-current loan liabilities also give rise to an interest rate risk due to changes in market rates. The Group treasury department conducts monthly risk analyses to determine the risk potential. These analyses are based on the maturity and interest rate lock-down structure as well as liquidity planning. Drägerwerk AG & Co. KGaA counters interest rate risks with a combination of fixed and variable rate financial liabilities and by using normal market hedging instruments. Changes in the market interest rates for primary financial instruments with fixed interest only affect the Group’s profit or loss if such instruments are recognized at fair value. Thus none of the fixed-interest financial instruments recognized at amortized cost poses an interest rate risk that would affect cash flows. In order to better illustrate existing interest rate risks, the effects of hypothetical changes in market interest rates on net profit and equity are discussed below on the basis of an interest rate sensi-tivity analysis. For this purpose, it was assumed that interest rate changes affect primary financial instruments measured at fair value and derivative financial instruments that are not part of a hedging relationship, whose changes in value are recognized in profit or loss. Derivative financial instruments that are part of a cash flow hedge are also affected by interest rate changes, with the changes in value recognized directly in equity.
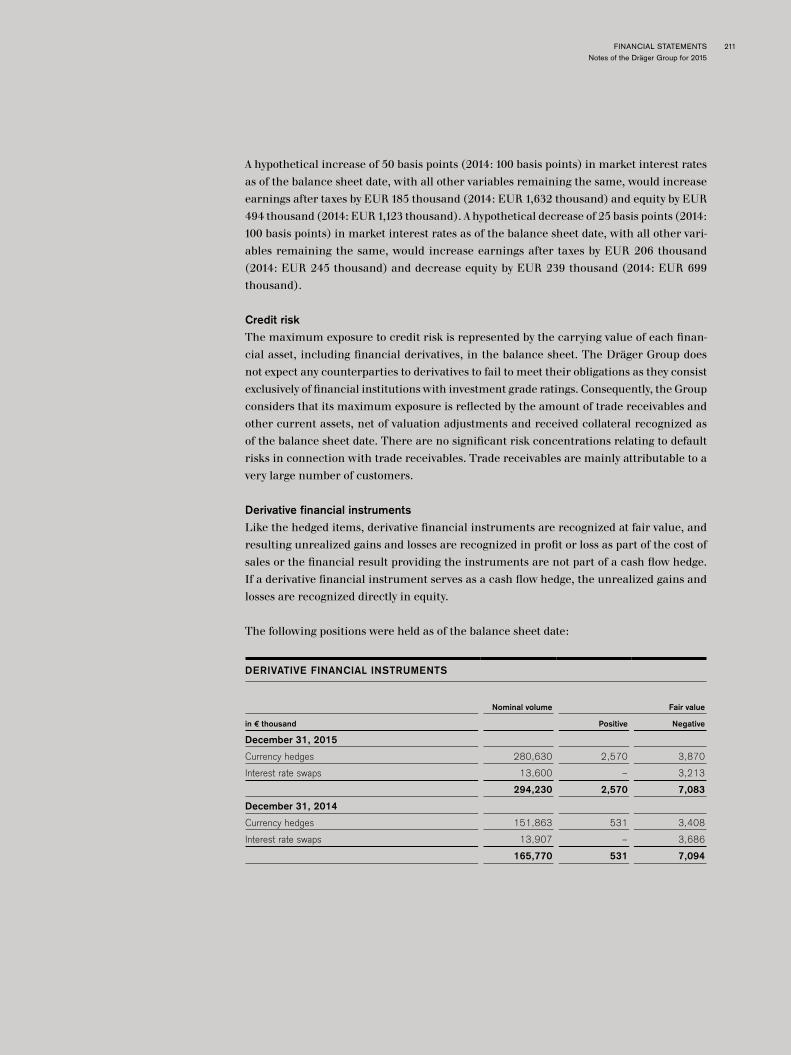
FINANCIAL STATEMENTSNotes of the Dräger Group for 2015
211
A hypothetical increase of 50 basis points (2014: 100 basis points) in market interest rates as of the balance sheet date, with all other variables remaining the same, would increase earnings after taxes by EUR 185 thousand (2014: EUR 1,632 thousand) and equity by EUR 494 thousand (2014: EUR 1,123 thousand). A hypothetical decrease of 25 basis points (2014: 100 basis points) in market interest rates as of the balance sheet date, with all other vari-ables remaining the same, would increase earnings after taxes by EUR 206 thousand (2014: EUR 245 thousand) and decrease equity by EUR 239 thousand (2014: EUR 699 thousand).
Credit riskThe maximum exposure to credit risk is represented by the carrying value of each finan-cial asset, including financial derivatives, in the balance sheet. The Dräger Group does not expect any counterparties to derivatives to fail to meet their obligations as they consist exclusively of financial institutions with investment grade ratings. Consequently, the Group considers that its maximum exposure is reflected by the amount of trade receivables and other current assets, net of valuation adjustments and received collateral recognized as of the balance sheet date. There are no significant risk concentrations relating to default risks in connection with trade receivables. Trade receivables are mainly attributable to a very large number of customers.
Derivative financial instrumentsLike the hedged items, derivative financial instruments are recognized at fair value, and resulting unrealized gains and losses are recognized in profit or loss as part of the cost of sales or the financial result providing the instruments are not part of a cash flow hedge. If a derivative financial instrument serves as a cash flow hedge, the unrealized gains and losses are recognized directly in equity.
The following positions were held as of the balance sheet date:
DERIVATIVE FINANCIAL INSTRUMENTS
Nominal volume Fair value
in € thousand Positive Negative
December 31, 2015
Currency hedges 280,630 2,570 3,870
Interest rate swaps 13,600 – 3,213
294,230 2,570 7,083
December 31, 2014
Currency hedges 151,863 531 3,408
Interest rate swaps 13,907 – 3,686
165,770 531 7,094

212 DRÄGER ANNUAL REPORT 2015
The positive fair values of the derivatives are disclosed as current and non-current financial assets, the negative fair values as current and non-current financial liabilities.
The currency hedges cover selected foreign currency cash flows from operating ac-tivities over the next three years (2014: four years). Currency hedging mainly relates to operations in US dollars and to a lesser extent to operations in pounds sterling, Australian dollars as well as dividends distributed in Swiss francs.
In order to offset the effects of future changes to interest rates on cash flows, the Group concluded interest rate swaps caps.
The interest rate swap has a remaining term of eight years. For the swap, the only con-tract for which the Group uses hedge accounting, the Group pays variable interest and in turn receives fixed interest. It is used for hedging variable interest rates from a real estate lease agreement. Interest rate swaps are recognized at fair value. The ineffective part of the changes in fair value is recognized in income if such exists as of the balance sheet date. As in the prior year, there was no ineffectiveness in fiscal year 2015.
Netting of financial assets and liabilitiesThe following financial assets and liabilities are subject to netting due to contractually agreed offsetting procedures:
NETTING OF FINANCIAL ASSETS 2015
in € thousand
Gross amounts of financial
assets
Amount of netted financial
liabilities
Recognized net amount
2015
Unnetted amount of
a netting agreement
Net amount 2015
Positive derivative financial instruments 2,570 – 2,570 –243 2,327
Cash and cash equivalents 172,767 – 172,767 – 172,767
175,337 0 175,337 –243 175,094
NETTING OF FINANCIAL LIABILITIES 2015
in € thousand
Gross amounts of financial
liabilities
Amount of netted financial
assets
Recognized net amount
2015
Unnetted amount of
a netting agreement
Net amount 2015
Negative derivative financial instruments 7,083 – 7,083 –1,355 5,728
Liabilities to banks 211,886 – 211,886 21,109 232,995
218,969 0 218,969 19,754 238,723
NETTING OF FINANCIAL ASSETS 2014
in € thousand
Gross amounts of financial
assets
Amount of netted financial
liabilities
Recognized net amount
2014
Unnetted amount of a netting agreement
Net amount 2014
Positive derivative financial instruments 531 – 531 –217 314
Cash and cash equivalents 296,855 – 296,855 –217 296,638
297,385 0 297,385 –434 296,952
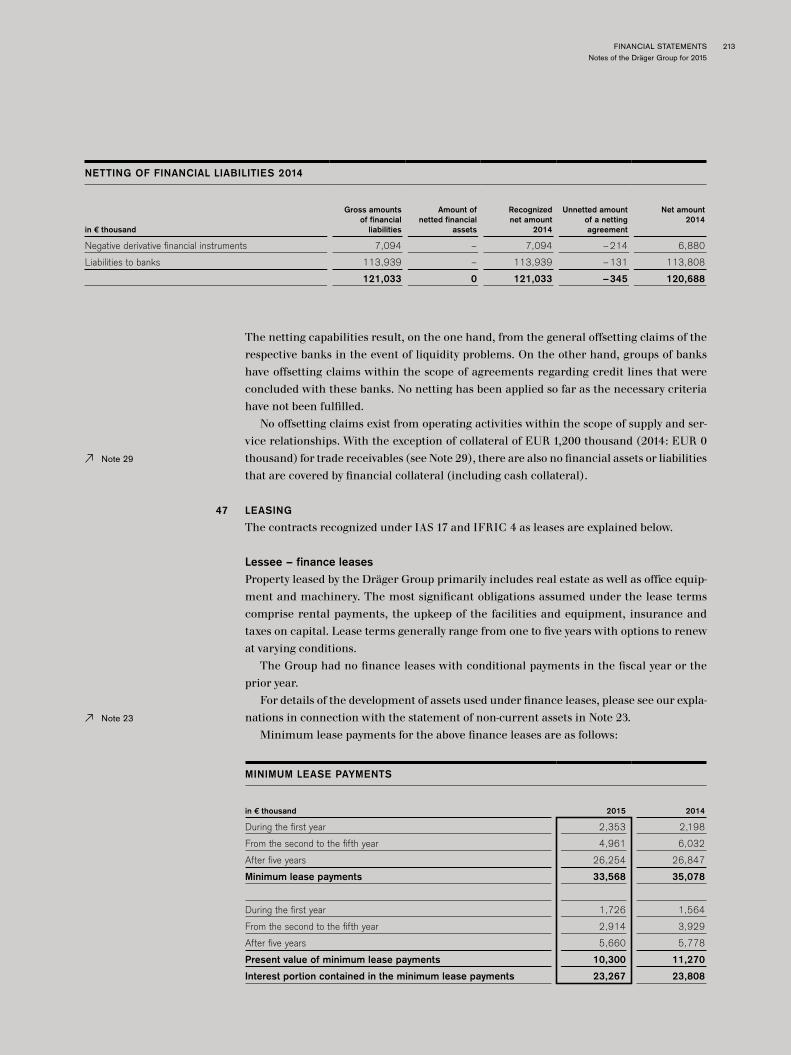
FINANCIAL STATEMENTSNotes of the Dräger Group for 2015
213
NETTING OF FINANCIAL LIABILITIES 2014
in € thousand
Gross amounts of financial
liabilities
Amount of netted financial
assets
Recognized net amount
2014
Unnetted amount of a netting agreement
Net amount 2014
Negative derivative financial instruments 7,094 – 7,094 –214 6,880
Liabilities to banks 113,939 – 113,939 –131 113,808
121,033 0 121,033 –345 120,688
The netting capabilities result, on the one hand, from the general offsetting claims of the respective banks in the event of liquidity problems. On the other hand, groups of banks have offsetting claims within the scope of agreements regarding credit lines that were concluded with these banks. No netting has been applied so far as the necessary criteria have not been fulfilled.
No offsetting claims exist from operating activities within the scope of supply and ser-vice relationships. With the exception of collateral of EUR 1,200 thousand (2014: EUR 0 thousand) for trade receivables (see Note 29), there are also no financial assets or liabilities that are covered by financial collateral (including cash collateral).
47 LEASING
The contracts recognized under IAS 17 and IFRIC 4 as leases are explained below.
Lessee – finance leasesProperty leased by the Dräger Group primarily includes real estate as well as office equip-ment and machinery. The most significant obligations assumed under the lease terms comprise rental payments, the upkeep of the facilities and equipment, insurance and taxes on capital. Lease terms generally range from one to five years with options to renew at varying conditions.
The Group had no finance leases with conditional payments in the fiscal year or the prior year.
For details of the development of assets used under finance leases, please see our expla-nations in connection with the statement of non-current assets in Note 23.
Minimum lease payments for the above finance leases are as follows:
MINIMUM LEASE PAYMENTS
in € thousand 2015 2014
During the first year 2,353 2,198
From the second to the fifth year 4,961 6,032
After five years 26,254 26,847
Minimum lease payments 33,568 35,078
During the first year 1,726 1,564
From the second to the fifth year 2,914 3,929
After five years 5,660 5,778
Present value of minimum lease payments 10,300 11,270
Interest portion contained in the minimum lease payments 23,267 23,808
Note 29
Note 23
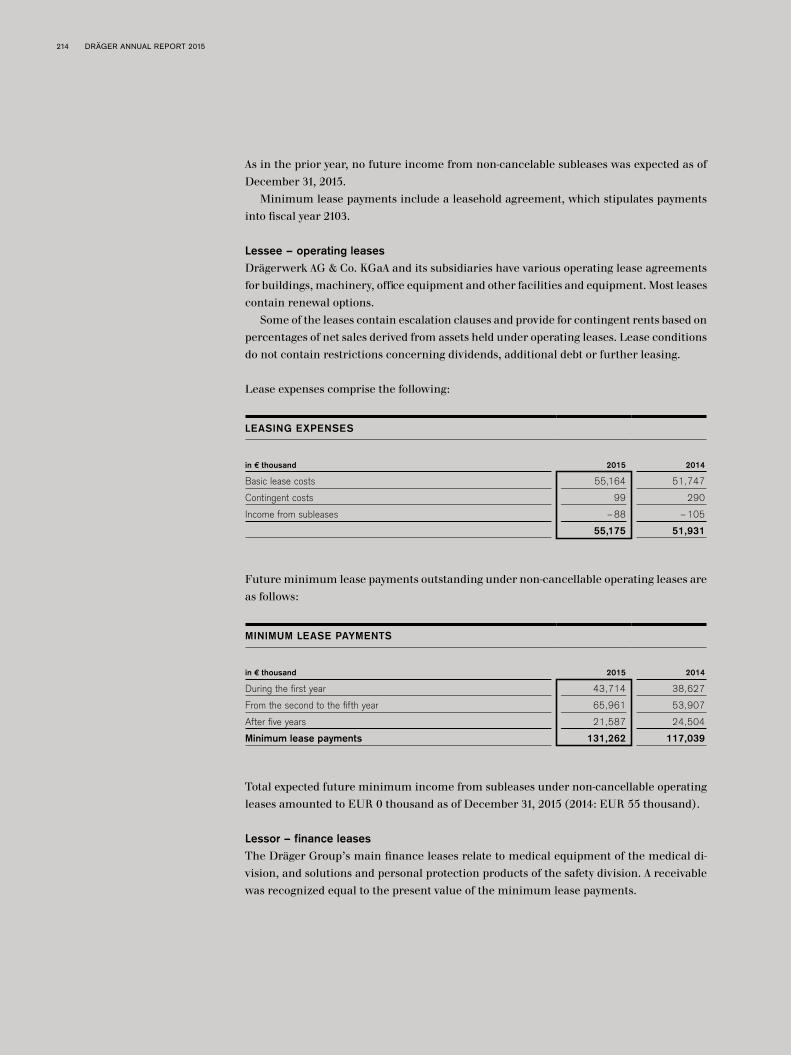
214 DRÄGER ANNUAL REPORT 2015
As in the prior year, no future income from non-cancelable subleases was expected as of December 31, 2015.
Minimum lease payments include a leasehold agreement, which stipulates payments into fiscal year 2103.
Lessee – operating leasesDrägerwerk AG & Co. KGaA and its subsidiaries have various operating lease agreements for buildings, machinery, office equipment and other facilities and equipment. Most leases contain renewal options.
Some of the leases contain escalation clauses and provide for contingent rents based on percentages of net sales derived from assets held under operating leases. Lease conditions do not contain restrictions concerning dividends, additional debt or further leasing.
Lease expenses comprise the following:
LEASING EXPENSES
in € thousand 2015 2014
Basic lease costs 55,164 51,747
Contingent costs 99 290
Income from subleases –88 –105
55,175 51,931
Future minimum lease payments outstanding under non-cancellable operating leases are as follows:
MINIMUM LEASE PAYMENTS
in € thousand 2015 2014
During the first year 43,714 38,627
From the second to the fifth year 65,961 53,907
After five years 21,587 24,504
Minimum lease payments 131,262 117,039
Total expected future minimum income from subleases under non-cancellable operating leases amounted to EUR 0 thousand as of December 31, 2015 (2014: EUR 55 thousand).
Lessor – finance leasesThe Dräger Group’s main finance leases relate to medical equipment of the medical di-vision, and solutions and personal protection products of the safety division. A receivable was recognized equal to the present value of the minimum lease payments.

FINANCIAL STATEMENTSNotes of the Dräger Group for 2015
215
Receivables from future lease payments outstanding are shown below:
RECEIVABLES FROM FUTURE LEASE PAYMENTS OUTSTANDING
in € thousand 2015 2014
During the first year 494 402
From the second to the fifth year 825 674
After five years 411 0
Total gross investments in finance leases 1,730 1,076
During the first year 451 371
From the second to the fifth year 754 640
After five years 388 0
Present value of minimum lease payments outstanding as of the balance sheet date 1,594 1,011
Unearned finance income 136 65
As in the prior year, bad debt allowances for uncollectible minimum lease payments were not required as of December 31, 2015.
Lessor – operating leasesThe Dräger Group’s main operating leases relate to medical equipment of the medical division, and solutions and gas detection products of the safety division as well as building space.
EUR 16,513 thousand (2014: EUR 15,858 thousand) in leased building space is contained in the Group’s property, plant and equipment at historical cost as well as EUR 13,545 thou-sand (2014: EUR 12,612 thousand) in accumulated amortization and depreciation charges.
Dräger reports equipment leased out separately under property, plant and equipment. For information on assets leased under operating leases, we also refer to our comments in Note 23.
Future minimum lease payments outstanding under non-cancellable operating leases are as follows:
MINIMUM LEASE PAYMENTS
in € thousand 2015 2014
During the first year 9,308 13,035
From the second to the fifth year 17,198 17,531
After five years 1,005 1,923
27,511 32,489
As in the prior year, no contingent rents were recognized in profit or loss in fiscal year 2015.
Note 23
216 DRÄGER ANNUAL REPORT 2015
48 CONTINGENT LIABILITIES AND OTHER FINANCIAL OBLIGATIONS
As in the prior year, the Dräger Group did not have any contingent liabilities.
Other financial obligationsAs of December 31, 2015, other financial obligations amounted to a total of EUR 187,815 thousand (2014: EUR 190,371 thousand) and are structured as follows:
a) Rental and lease agreementsFor other financial obligations from rental and lease agreements of EUR 164,830 thousand (2014: EUR 152,117 thousand), please refer to our comments in Note 47 (lessee – operating leases).
b) Purchase obligationsIn line with the usual requirements, the Dräger Group has also entered into purchase ob-ligations with other service providers in order to guarantee the availability of IT services. Due to the centralization of IT activities at Drägerwerk AG & Co. KGaA, the Company assumed all existing long-term obligations to IT service providers of the medical and safety divisions. As a result of outstanding orders, the Group had obligations to purchase intangi-ble assets of EUR 159 thousand (2014: EUR 83 thousand) and items of property, plant and equipment of EUR 20,596 thousand (2014: EUR 28,112 thousand) as of December 31, 2015.
c) Investment allowance for MOLVINA Based on the decision of Investitionsbank Schleswig-Holstein (IB.SH) on November 1, 2005, Drägerwerk AG & Co. KGaA (formerly: Dräger Medical GmbH) and MOLVINA Vermi-etungsgesellschaft mbH & Co. Finkenstrasse KG, both jointly and severally liable, were granted an allowance for investment costs of EUR 7,829 thousand for a building, which has been fully paid out. The grant can only be used for this specific purpose and is subject to the fulfillment of specific conditions, all of which relate to Dräger’s use of the building. If these conditions are not fulfilled within the contractually stipulated period of seven years, the amount paid out must be repaid. The commitment period expired as of December 31, 2015, meaning that there were no repayment obligations as of the balance sheet date.
d) Investment allowance for DRENITABased on the decision of Investitionsbank Schleswig-Holstein (IB.SH) on August 18, 2010, Drägerwerk AG & Co. KGaA (formerly: Dräger Medical GmbH) and DRENITA Grund-stücks-Vermietungsgesellschaft mbH & Co. KG, both jointly and severally liable, were grant-ed an allowance for investment costs of a maximum of EUR 2,230 thousand for the new production and logistics building for the Infrastructure Projects business in Lübeck, which was completed in fiscal year 2011. EUR 1,780 thousand was paid out in 2013 and EUR 450 thousand in 2012. The grant can only be used for this specific purpose and is subject to the fulfillment of specific conditions, all of which relate to Dräger’s use of the building. If these conditions are not fulfilled within the contractually stipulated period of five years (ending 2016), the amount paid out must be repaid.
Note 47
FINANCIAL STATEMENTSNotes of the Dräger Group for 2015
217
e) LitigationCompanies of the Dräger Group were involved in litigation and claims for damages in connection with business activities as of December 31, 2015. The Executive Board of the general partner believes that the outcome of such litigation and claims will not have any further material adverse effect on the Company’s net assets, financial position or results of operations over and above the provisions which have already been recognized.
It is not to be expected for these contingent liabilities to materialize into actual liabilities for which no provision has been recognized yet.

218 DRÄGER ANNUAL REPORT 2015
49 SEGMENT REPORT
BUSINESS PERFORMANCE OF THE SEGMENTS
Dräger medical division Dräger safety division Dräger Group
2015 2014 2015 2014 2015 2014
Order intake with third parties € million 1,646.0 1,569.8 886.2 845.7 2,532.2 2,415.5
Net sales with third parties € million 1,698.8 1,577.2 910.1 857.5 2,608.9 2,434.7
EBIT 1 € million 46.2 107.6 20.5 71.0 66.7 178.6
Depreciation/ amortization € million –54.1 –49.8 –30.1 –27.2 –84.2 –77.0
Research and development expenses € million 165.9 151.5 65.2 60.5 231.1 212.0
Capital employed 2, 3 € million 761.6 721.5 328.8 292.1 1,269.3 1,107.2
EBIT 1/net sales % 2.7 6.8 2.2 8.3 2.6 7.3
DVA 4, 5 € million –19.5 47.2 –6.7 47.6 –46.3 81.6
1 EBIT = Earnings before net interest result and income taxes2 Capital employed in segments = trade receivables, inventories incl. prepayments received;
Capital employed Group = total assets less deferred tax assets, current securities, cash and cash equivalents and non-interest-bearing liabilities3 Value at end of period4 Value of the last twelve months5 Dräger Value Added = EBIT less cost of capital
The Dräger Group is managed in line with its segments of the medical division and the safety division. These segments form the foundations of strategic development and are the primary management parameters for the development of operating business. The Company’s legal structures were largely division-based until 2014, a system under which separate legal entities usually existed for the safety division and for the medical division. These structures are being consolidated to allow Dräger to achieve the corporate structure that forms the basis of the “One Dräger” project. In many countries it is a logical process to merge legal units with each other, thereby reducing complexity and costs. This is now being pursued systematically in the Dräger Group. In Switzerland, Austria, the Netherlands and South Africa, this consolidation has already been carried out. In Germany, Dräger Medical GmbH was merged into Drägerwerk AG & Co. KGaA. Further mergers in Germany and abroad are set to follow.
The merger of the previously separate legal entities of the safety division and the med-ical division will require amendments to segment reporting. From the first quarter of 2015, the results of the medical and safety divisions are calculated on the basis of product attribution to the medical or safety division rather than on the basis of the legal entities as had been the case previously. The Drägerwerk AG & Co. KGaA/Other Companies segment, as well as the need for consolidation in the reporting process, no longer applies (also see our comments in Note 3 for the effects of this).
The medical division develops, produces and markets system solutions, equipment and services for the optimization of processes at the acute point of care. These include emer-
Note 3

FINANCIAL STATEMENTSNotes of the Dräger Group for 2015
219
gency care, perioperative care (in connection with the operation), critical care and also perinatal care (in connection with childbirth).
The safety division develops, produces and markets products, system solutions and ser-vices for personal protection, gas detection technology and integrated hazard manage-ment. Its customers come from industry, mining and public sectors such as fire depart-ments, police and disaster protection.
The segment reports were prepared in accordance with IFRS as applied in the Group financial statements.
At Group level, the key figures from the segment report are as follows:
EBIT/ EBITDA
in € million 2015 2014
Net profit 33.3 104.7
+ Interest result 17.2 25.0
+ Income taxes 16.2 48.9
EBIT 66.7 178.6
CAPITAL EMPLOYED
in € million 2015 2014
Capital employed of the segments 1,090.5 1,013.6
– Other current provisions –233.0 –189.3
– Trade payables –186.4 –201.3
– Deferred income –52.1 –46.7
– Other tax liabilities –36.0 –42.5
– Other net working capital components –0.7 5.7
Group net working capital 582.3 539.4
+ Non-current assets 907.2 781.5
+ Cash and cash equivalents 172.8 296.9
+ Other current provisions 233.0 189.3
+ Trade payables 186.4 201.3
+ Other current financial liabilities 25.3 30.2
+ Current income tax liabilities 37.8 25.9
+ Other current liabilities 167.4 175.8
Other balance sheet items –0.7 –6.1
Total assets 2,311.4 2,234.1
– Deferred tax assets –135.3 –119.5
– Cash and cash equivalents –172.8 –296.9
– Non-interest-bearing liabilities –734.0 –710.6
Capital employed 1,269.3 1,107.2

220 DRÄGER ANNUAL REPORT 2015
DVA
in € million 2015 2014
EBIT 66.7 178.6
– Cost of capital –113.0 –97.0
DVA –46.3 81.6
The business performance of the individual segments is detailed in the management re-port. Services rendered between the divisions follow the arm’s length principle.
SEGMENT PERFORMANCE BY REGION
Dräger medical division Dräger safety division Dräger Group
2015 2014 2015 2014 2015 2014
Net sales by region € million 1,698.8 1,577.2 910.1 857.5 2,608.9 2,434.7
Europe € million 847.8 819.1 573.1 541.3 1,420.9 1,360.4
thereof Germany € million 325.5 314.5 190.8 172.0 516.3 486.6
Americas € million 358.6 332.4 150.6 138.3 509.2 470.7
Asia /Pacific € million 314.8 274.7 133.9 127.7 448.7 402.4
Middle East, Africa & Others € million 177.6 150.9 52.5 50.2 230.1 201.1
Non-current assets by region 1 € million – – – – 760.0 647.1
Europe € million – – – – 653.4 536.6
thereof Germany € million – – – – 573.8 475.5
Americas € million – – – – 52.6 58.3
Asia /Pacific € million – – – – 47.1 46.7
Middle East, Africa & Others € million – – – – 6.8 5.5
1 Non-current assets = intangible assets, property, plant and equipment, and other non-current assets (excluding the fund assets relating to plan assets reported under this balance sheet item)
50 NOTES TO THE CASH FLOW STATEMENT
Due to the elimination of exchange rate effects, the underlying changes recognized in the cash flow statement cannot be directly reconciled with the items of the published balance sheet.
In fiscal year 2015, Dräger Group’s cash inflow from operating activities amounted to EUR 39.9 million (2014: EUR 188.0 million). The reduction in earnings before net interest result, income taxes, depreciation and amortization (EBITDA) – adjusted for changes to cash-neutral provisions and other non-cash earnings/expenses – by EUR 40.1 million to EUR 186.7 million was a primary factor in this development. In addition, trade receivables increased by EUR 44.6 million, while they decreased by EUR 1.6 million in the prior year. Furthermore, trade payables fell by EUR 22.8 million, while other liabilities decreased by EUR 12.0 million. In the prior year, trade payables had risen by EUR 25.2 million, while
FINANCIAL STATEMENTSNotes of the Dräger Group for 2015
221
other liabilities rose by EUR 10.6 million. Income tax payments declined from EUR 43.3 million to EUR 29.2 million.
At EUR 167.0 million, cash outflow from investing activities increased (2014: EUR 102.6 million). Cash outflow for 2015 includes the EUR 58.1 million purchase price payment for the shares in GasSecure AS, Oslo, Norway (after deduction of acquired cash and cash equivalents of EUR 0.3 million). Investments in property, plant and equipment also rose, mainly due to the construction of the reception and administration building as well as a number of modernizing measures at the Lübeck production site within the scope of the “factory of the future” project (EUR 45.9 million; 2014: EUR 45.5 million) and the reno-vation of existing buildings at the Lübeck site.
The lower cash outflow from financing activities of EUR 1.3 million compared to cash inflow of EUR 26.3 million in the prior year is mainly due to raising loans and the utiliza-tion of current account credit lines brought in a total of EUR 114.2 million (2014: EUR 16.5 million). This amount includes KfW loans of EUR 43.1 million to finance the “factory of the future” project. At the same time, loans of EUR 105.5 million (2014: EUR 56.3 million) were repaid, including note loans of EUR 86.5 million (2014: EUR 50.0 million). At EUR 34.6 million (2014: EUR 19.8 million), dividends paid to shareholders were almost offset by the exercising of ten options on preferred shares to the amount of EUR 31.5 million (2014: eleven options for EUR 34.9 million) (please refer to our comments in Note 5). The acqui-sition of the remaining shares in a Turkish subsidiary led to a payment of EUR 4.0 million.
Cash and cash equivalents as of December 31, 2015 exclusively comprised cash, of which EUR 8.9 million (December 31, 2014: EUR 8.4 million) was subject to restrictions.
Unused credit lines come to EUR 271.6 million as of December 31, 2015 (December 31, 2014: EUR 316.9 million) and are subject to restrictions applicable in the market.
51 REMUNERATION OF THE EXECUTIVE AND SUPERVISORY BOARDS
Executive Board remuneration Total remuneration for Executive Board members amounted to EUR 3,718,431 in fiscal year 2015 (2014: EUR 2,742,455). This amount is made up of non-performance related pay-ments of EUR 1,934,760 (2014: EUR 1,891,104), performance related short-term payments of EUR 1,780,853 (2014: EUR 851,351) as well as share-based remuneration with long-term incentives in the amount of EUR 2,818 (2014: EUR 0).
If Executive Board remuneration is paid by Drägerwerk Verwaltungs AG, pursuant to Sec. 11 (1) and (3) of the articles of association of Drägerwerk AG & Co. KGaA it is entitled to claim reimbursement from Drägerwerk AG & Co. KGaA monthly. Pursuant to Sec. 11 (4) of the Company’s articles of association, the general partner receives a fee, independent of profit and loss, of 6 percent of the equity disclosed in its financial statements, payable one week after the general partner prepares its financial statements, for the management of the Company and the assumption of personal liability. For fiscal year 2015, this remu-neration amounts to EUR 86,761.84 (2014: EUR 83,498) plus potentially incurred VAT.
Obligations to Executive Board members under pension plans are stated in the financial statements 2015 at EUR 4,894,632 (2014: EUR 4,460,629).
In fiscal year 2015, the Company made pension provisions contributions of EUR 434,003 for members of the Executive Board (2014: EUR 1,859,238).
EUR 3,144,050 was paid to former members of the Executive Board and their surviving dependents (2014: EUR 3,304,846). Pension commitments to former members of the Ex-
Note 5

222 DRÄGER ANNUAL REPORT 2015
ecutive Board and their surviving dependents amounted to EUR 44,969,123 (2014: EUR 48,674,558).
If an Executive Board member dies during his or her active service on the Board, the surviving spouse is entitled to Dräger widow’s pension and any remaining children have claim to Dräger orphan’s pension. The annual Dräger widow’s and widower’s pension amounts to 55 percent of the Dräger pension received by or which would have been re-ceived by the deceased executive if said executive would have been unable to work when they died (notional invalidity pension). The amount of the Dräger orphan’s pension is 10 percent of the fictitious reduction in earning capacity pension or the current Dräger pension of the deceased Executive Board member.
Supervisory Board remuneration The annual shareholders’ meeting of Drägerwerk AG & Co. KGaA has defined Supervisory Board remuneration in the articles of association since fiscal year 2011. Supervisory Board remuneration for fiscal year 2015 came to EUR 350,000 (2014: EUR 527,480).
In fiscal year 2015, the total remuneration of the six members of the Supervisory Board of the general partner, Drägerwerk Verwaltungs AG, amounted to EUR 135,000 (2014: EUR 135,000) as well as additional flat fees for out-of-pocket expenses totaling EUR 55,000 (2014: EUR 55,000). No remuneration was paid to Supervisory Board members of Group companies.
Further information on the itemized remuneration of the Executive Board and the Supervisory Board can be found in the remuneration report.
52 SHARES OWNED BY THE EXECUTIVE AND SUPERVISORY BOARDS
As of December 31, 2015, the members of the Executive Board of Drägerwerk Verwaltungs AG and their related parties directly held 6,144 preferred shares in Drägerwerk AG & Co. KGaA, equivalent to 0.035 percent of the Company’s total shares, and 114,605 common shares, corresponding to 0.65 percent of the Company’s total shares.
Dr. Heinrich Dräger GmbH held 67.19 percent of common shares of Drägerwerk AG & Co. KGaA with 68.31 percent of voting rights attributable to the Chairman of the Executive Board Stefan Dräger, whereby 67.19 percent are attributable to him in accordance with the terms of Sec. 22 (1) Sentence 1 No. 1 WpHG (Wertpapierhandelsgesetz – German Securities Trading Act).
On December 31, 2015, the members of the Supervisory Board and their related parties directly or indirectly held a total of 916 preferred shares, equivalent to 0.01 percent of the Company’s total shares, but did not hold any common shares (directly or indirectly).
53 RELATED PARTY TRANSACTIONS
Services were rendered for Stefan Dräger and companies related to Stefan Dräger, the Dräger-Stiftung and the Dräger-Familienstiftung (Dräger Foundation and Dräger Family Foundation) totaling EUR 143 thousand (2014: EUR 73 thousand) in fiscal year 2015. Re-maining rent of EUR 20 thousand for 2014 was also invoiced. Receivables in this respect amounted to EUR 13 thousand on December 31, 2015 (2014: EUR 63 thousand).
Drägerwerk AG & Co. KGaA rendered rental services and other services totaling EUR 124 thousand for associate MAPRA Assekuranzkontor GmbH in fiscal year 2015 (2014: EUR 122 thousand).
FINANCIAL STATEMENTSNotes of the Dräger Group for 2015
223
Receivables in this respect amounted to EUR 2 thousand on December 31, 2015 (2014: EUR 3 thousand); there were no liabilities.
Claudia Dräger, the wife of Stefan Dräger, is actively employed by the Dräger Group. Her employment contract was concluded at arm’s length terms and conditions.
The remuneration of the employee representatives on the Supervisory Board for work performed in addition to the Supervisory Board activities was also concluded at arm’s length terms and conditions. Overall, remuneration is of immaterial importance for the Dräger Group.
Dräger Verwaltungs AG is the general partner of Drägerwerk AG & Co. KGaA and holds 0 percent of the capital. Only a few transactions are conducted with the general partner, as it only exercises administrative functions. The general partner is entitled to compen-sation for all expenses incurred in association with the management of Drägerwerk AG & Co. KGaA, including the contractually agreed remuneration for its executive bodies. These expenses comprise the remuneration of the Executive Board, the remuneration of its Supervisory Board, liability remuneration, as well as other expenses.
Liabilities to Drägerwerk Verwaltungs AG amounted to EUR 3.8 million as of December 31, 2015 (2014: EUR 2.7 million).
Two members of the Executive Board of Drägerwerk Verwaltungs AG participated in the 2015 employee share program. Both Executive Board members purchased nine sets of three shares at a cost of EUR 92.36 per share using their own funds. For every three pre-ferred shares, participants received one preferred share worth EUR 109.20 free of charge from Dräger. The holding period for these preferred shares – including those that partici-pants acquired themselves – runs until April 30, 2017.
All transactions with related parties were conducted at arm’s length terms and condi-tions.

224 DRÄGER ANNUAL REPORT 2015
54 ADDITIONAL INFORMATION
Auditor’s feeThe total fee charged by the auditor – PricewaterhouseCoopers Aktiengesellschaft Wirtschaftsprüfungsgesellschaft – in fiscal year 2015 for the audit of the Group financial statements amounted to EUR 1,116 thousand (2014: EUR 1,018 thousand) for the audit of the financial statements, EUR 140 thousand (2014: EUR 377 thousand) for other audit services, EUR 28 thousand (2014: EUR 23 thousand) for other services, and EUR 134 thousand (2014: EUR 0 thousand) for tax consultancy.
The audit report was signed by Dr. Peter Bartels and Dr. Andreas Focke from Pricewa-terhouseCoopers Aktiengesellschaft Wirtschaftsprüfungsgesellschaft. The audit opinion for fiscal year 2015 was the seventh one that Dr. Andreas Focke has signed in a row. Dr. Peter Bartels signed his second audit report for the Dräger Group.
Corporate governance declaration Drägerwerk AG & Co. KGaA’s declaration of conformity under the terms of Sec. 161 AktG (Aktiengesetz – German Stock Corporation Act) has been issued and made permanently available to the shareholders in December 2015 at www.draeger.com.
For further Information www.draeger.com

FINANCIAL STATEMENTSNotes of the Dräger Group for 2015
225
55 CONSOLIDATED COMPANIES
CONSOLIDATED COMPANIES
Name and registered office Capital stock in LCU thousand
Share- holding
in %
Germany
Dräger Safety AG & Co. KGaA, Lübeck 25,739 EUR 100 1
Dräger Medical Deutschland GmbH, Lübeck 2,000 EUR 100 1
Dräger Electronics GmbH, Lübeck 2,000 EUR 100
Dräger Medizin System Technik GmbH, Lübeck 1,023 EUR 100
Dräger Safety Verwaltungs AG, Lübeck 1,000 EUR 100 1
Dräger TGM GmbH, Lübeck 767 EUR 100 1
Dräger MSI GmbH, Hagen 1,000 EUR 100
Dräger Medical ANSY GmbH, Lübeck 500 EUR 100 1
Dräger Interservices GmbH, Lübeck 256 EUR 100 1
Dräger Gebäude und Service GmbH, Lübeck 250 EUR 100 1
Dräger Medical International GmbH, Lübeck 108 EUR 100 1
MAPRA Assekuranzkontor GmbH, Lübeck 55 EUR 49 2
Fachklinik für Anästhesie und Intensivmedizin Vahrenwald GmbH, Lübeck 26 EUR 100
Dräger Energie GmbH, Lübeck 25 EUR 100
FIMMUS Grundstücks-Vermietungs GmbH, Lübeck 25 EUR 100 1, 3
Dräger Finance Services GmbH & Co. KG, Bad Homburg v. d. Höhe 511 EUR 95 3
OPTIO Grundstücks-Verwaltungsgesellschaft mbH & Co. KG, Lübeck 26 EUR 100 3
FIMMUS Grundstücks-Vermietungs Gesellschaft mbH & Co. Objekt Lübeck KG, Lübeck 10 EUR 100 3
MOLVINA Vermietungsgesellschaft mbH & Co. Objekt Finkenstraße KG, Düsseldorf 5 EUR 100 3
DRENITA Grundstücks-Vermietungsgesellschaft mbH & Co. Objekt Fertigung Dräger Medizintechnik KG, Düsseldorf 10 EUR 100 3
Dräger Grundstücksverwaltungs GmbH, Lübeck 25 EUR 100
Dräger Holding International GmbH, Lübeck 25 EUR 100 1
FUNDUS Grundstücksverwaltungs-GmbH& Co. KG, Lübeck 3,985 EUR 100 3
Europe
Belgium Dräger Medical Belgium NV, Wemmel 1,503 EUR 100
Dräger Safety Belgium NV, Wemmel 789 EUR 100
Bulgaria Draeger Medical Bulgaria EOOD, Sofia 705 BGN 100
Draeger Safety Bulgaria EOOD, Sofia 500 BGN 100
Denmark Dräger Safety Danmark A /S, Herlev 5,000 DKK 100
Dräger Medical Danmark A /S, Allerod 4,110 DKK 100
Finland Dräger Suomi Oy, Helsinki 802 EUR 100
France Dräger Médical SAS, Antony 8,000 EUR 100
Draeger Safety France SAS, Strasbourg 1,470 EUR 100
AEC SAS, Antony 70 EUR 100
Greece Draeger Hellas A.E. for Products of Medical and Safety Technology, Athens 1,500 EUR 100
Great Britain Draeger Safety UK Ltd., Blyth 7,589 GBP 100
Draeger Medical UK Ltd., Hemel Hempstead 4,296 GBP 100
1 Relief in accordance with Sec. 264 (3) HGB.2 This company is treated as an associate as defined by IAS 28.3 Relief in accordance with Sec. 264b HGB.
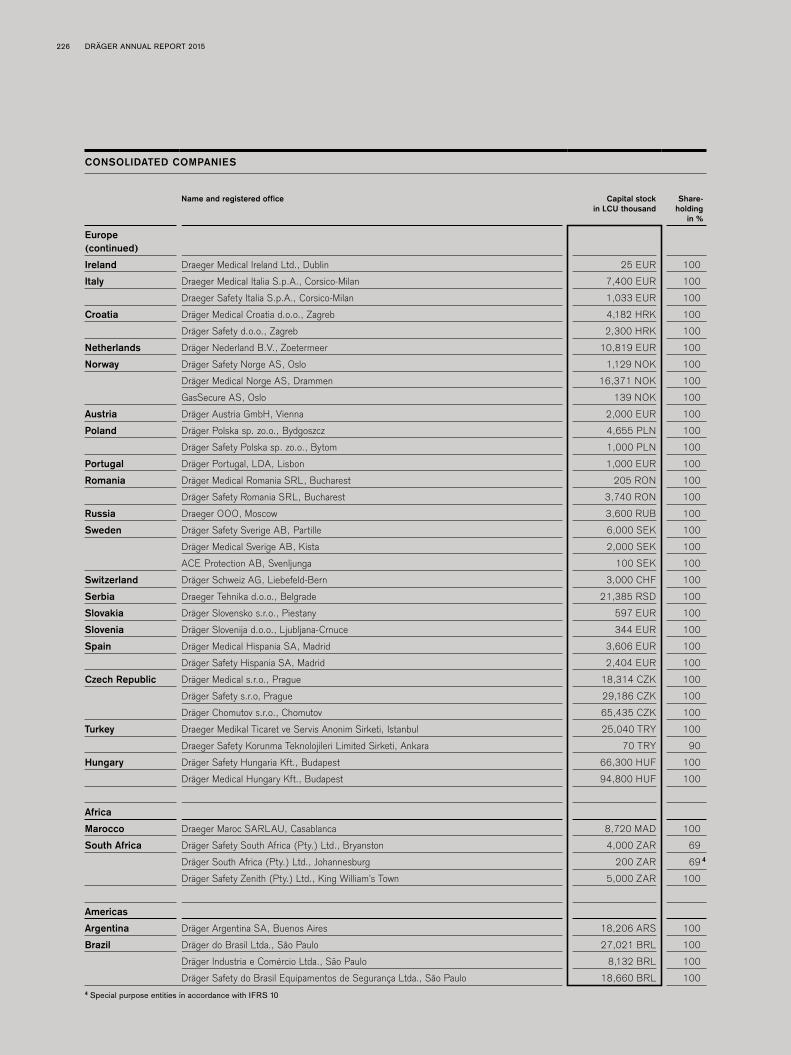
226 DRÄGER ANNUAL REPORT 2015
CONSOLIDATED COMPANIES
Name and registered office Capital stock in LCU thousand
Share- holding
in %
Europe (continued)
Ireland Draeger Medical Ireland Ltd., Dublin 25 EUR 100
Italy Draeger Medical Italia S.p.A., Corsico-Milan 7,400 EUR 100
Draeger Safety Italia S.p.A., Corsico-Milan 1,033 EUR 100
Croatia Dräger Medical Croatia d.o.o., Zagreb 4,182 HRK 100
Dräger Safety d.o.o., Zagreb 2,300 HRK 100
Netherlands Dräger Nederland B.V., Zoetermeer 10,819 EUR 100
Norway Dräger Safety Norge AS, Oslo 1,129 NOK 100
Dräger Medical Norge AS, Drammen 16,371 NOK 100
GasSecure AS, Oslo 139 NOK 100
Austria Dräger Austria GmbH, Vienna 2,000 EUR 100
Poland Dräger Polska sp. zo.o., Bydgoszcz 4,655 PLN 100
Dräger Safety Polska sp. zo.o., Bytom 1,000 PLN 100
Portugal Dräger Portugal, LDA, Lisbon 1,000 EUR 100
Romania Dräger Medical Romania SRL, Bucharest 205 RON 100
Dräger Safety Romania SRL, Bucharest 3,740 RON 100
Russia Draeger OOO, Moscow 3,600 RUB 100
Sweden Dräger Safety Sverige AB, Partille 6,000 SEK 100
Dräger Medical Sverige AB, Kista 2,000 SEK 100
ACE Protection AB, Svenljunga 100 SEK 100
Switzerland Dräger Schweiz AG, Liebefeld-Bern 3,000 CHF 100
Serbia Draeger Tehnika d.o.o., Belgrade 21,385 RSD 100
Slovakia Dräger Slovensko s.r.o., Piestany 597 EUR 100
Slovenia Dräger Slovenija d.o.o., Ljubljana-Crnuce 344 EUR 100
Spain Dräger Medical Hispania SA, Madrid 3,606 EUR 100
Dräger Safety Hispania SA, Madrid 2,404 EUR 100
Czech Republic Dräger Medical s.r.o., Prague 18,314 CZK 100
Dräger Safety s.r.o, Prague 29,186 CZK 100
Dräger Chomutov s.r.o., Chomutov 65,435 CZK 100
Turkey Draeger Medikal Ticaret ve Servis Anonim Sirketi, Istanbul 25,040 TRY 100
Draeger Safety Korunma Teknolojileri Limited Sirketi, Ankara 70 TRY 90
Hungary Dräger Safety Hungaria Kft., Budapest 66,300 HUF 100
Dräger Medical Hungary Kft., Budapest 94,800 HUF 100
Africa
Marocco Draeger Maroc SARLAU, Casablanca 8,720 MAD 100
South Africa Dräger Safety South Africa (Pty.) Ltd., Bryanston 4,000 ZAR 69
Dräger South Africa (Pty.) Ltd., Johannesburg 200 ZAR 69 4
Dräger Safety Zenith (Pty.) Ltd., King William’s Town 5,000 ZAR 100
Americas
Argentina Dräger Argentina SA, Buenos Aires 18,206 ARS 100
Brazil Dräger do Brasil Ltda., São Paulo 27,021 BRL 100
Dräger Industria e Comércio Ltda., São Paulo 8,132 BRL 100
Dräger Safety do Brasil Equipamentos de Segurança Ltda., São Paulo 18,660 BRL 1004 Special purpose entities in accordance with IFRS 10
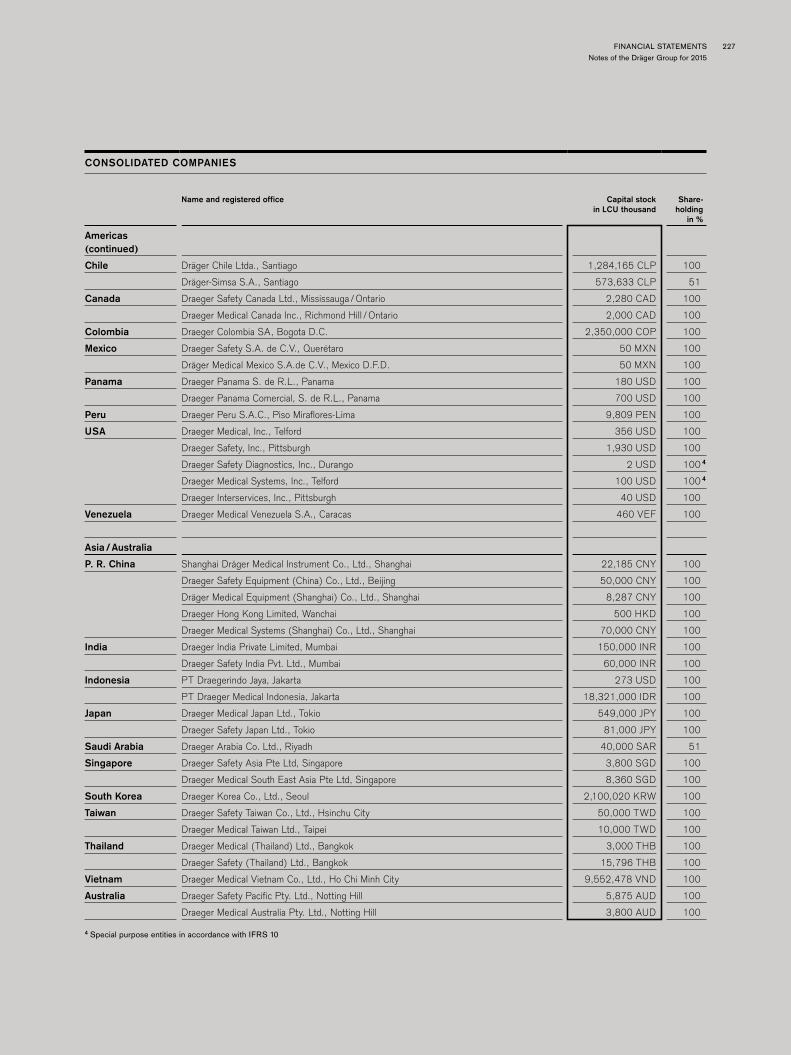
FINANCIAL STATEMENTSNotes of the Dräger Group for 2015
227
CONSOLIDATED COMPANIES
Name and registered office Capital stock in LCU thousand
Share- holding
in %
Americas (continued)
Chile Dräger Chile Ltda., Santiago 1,284,165 CLP 100
Dräger-Simsa S.A., Santiago 573,633 CLP 51
Canada Draeger Safety Canada Ltd., Mississauga /Ontario 2,280 CAD 100
Draeger Medical Canada Inc., Richmond Hill /Ontario 2,000 CAD 100
Colombia Draeger Colombia SA, Bogota D.C. 2,350,000 COP 100
Mexico Draeger Safety S.A. de C.V., Querétaro 50 MXN 100
Dräger Medical Mexico S.A.de C.V., Mexico D.F.D. 50 MXN 100
Panama Draeger Panama S. de R.L., Panama 180 USD 100
Draeger Panama Comercial, S. de R.L., Panama 700 USD 100
Peru Draeger Peru S.A.C., Piso Miraflores-Lima 9,809 PEN 100
USA Draeger Medical, Inc., Telford 356 USD 100
Draeger Safety, Inc., Pittsburgh 1,930 USD 100
Draeger Safety Diagnostics, Inc., Durango 2 USD 100 4
Draeger Medical Systems, Inc., Telford 100 USD 100 4
Draeger Interservices, Inc., Pittsburgh 40 USD 100
Venezuela Draeger Medical Venezuela S.A., Caracas 460 VEF 100
Asia/Australia
P. R. China Shanghai Dräger Medical Instrument Co., Ltd., Shanghai 22,185 CNY 100
Draeger Safety Equipment (China) Co., Ltd., Beijing 50,000 CNY 100
Dräger Medical Equipment (Shanghai) Co., Ltd., Shanghai 8,287 CNY 100
Draeger Hong Kong Limited, Wanchai 500 HKD 100
Draeger Medical Systems (Shanghai) Co., Ltd., Shanghai 70,000 CNY 100
India Draeger India Private Limited, Mumbai 150,000 INR 100
Draeger Safety India Pvt. Ltd., Mumbai 60,000 INR 100
Indonesia PT Draegerindo Jaya, Jakarta 273 USD 100
PT Draeger Medical Indonesia, Jakarta 18,321,000 IDR 100
Japan Draeger Medical Japan Ltd., Tokio 549,000 JPY 100
Draeger Safety Japan Ltd., Tokio 81,000 JPY 100
Saudi Arabia Draeger Arabia Co. Ltd., Riyadh 40,000 SAR 51
Singapore Draeger Safety Asia Pte Ltd, Singapore 3,800 SGD 100
Draeger Medical South East Asia Pte Ltd, Singapore 8,360 SGD 100
South Korea Draeger Korea Co., Ltd., Seoul 2,100,020 KRW 100
Taiwan Draeger Safety Taiwan Co., Ltd., Hsinchu City 50,000 TWD 100
Draeger Medical Taiwan Ltd., Taipei 10,000 TWD 100
Thailand Draeger Medical (Thailand) Ltd., Bangkok 3,000 THB 100
Draeger Safety (Thailand) Ltd., Bangkok 15,796 THB 100
Vietnam Draeger Medical Vietnam Co., Ltd., Ho Chi Minh City 9,552,478 VND 100
Australia Draeger Safety Pacific Pty. Ltd., Notting Hill 5,875 AUD 100
Draeger Medical Australia Pty. Ltd., Notting Hill 3,800 AUD 100
4 Special purpose entities in accordance with IFRS 10
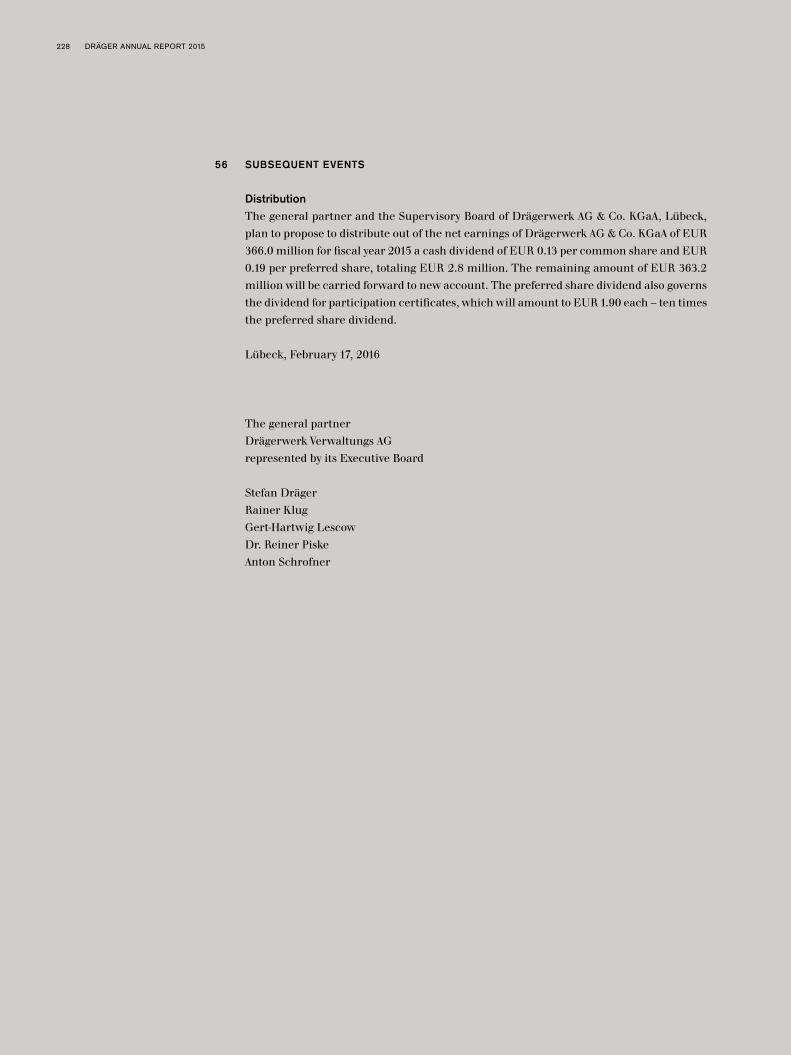
228 DRÄGER ANNUAL REPORT 2015
56 SUBSEQUENT EVENTS
DistributionThe general partner and the Supervisory Board of Drägerwerk AG & Co. KGaA, Lübeck, plan to propose to distribute out of the net earnings of Drägerwerk AG & Co. KGaA of EUR 366.0 million for fiscal year 2015 a cash dividend of EUR 0.13 per common share and EUR 0.19 per preferred share, totaling EUR 2.8 million. The remaining amount of EUR 363.2 million will be carried forward to new account. The preferred share dividend also governs the dividend for participation certificates, which will amount to EUR 1.90 each – ten times the preferred share dividend.
Lübeck, February 17, 2016
The general partnerDrägerwerk Verwaltungs AGrepresented by its Executive Board
Stefan DrägerRainer KlugGert-Hartwig LescowDr. Reiner PiskeAnton Schrofner

FINANCIAL STATEMENTSManagement compliance statement
229
Management compliance statement
We confirm to the best of our knowledge that, in accordance with the applicable financial reporting framework, the Group financial statements give a true and fair view of the net assets, financial position and results of operations of the Group, the Group management report presents business performance including business results and the situation of the Group so as to give a true and fair view, and that the material opportunities and risks relating to the Group’s development have been described.
Lübeck, February 17, 2016
The general partnerDrägerwerk Verwaltungs AGrepresented by its Executive Board
Stefan DrägerRainer KlugGert-Hartwig LescowDr. Reiner PiskeAnton Schrofner

230 DRÄGER ANNUAL REPORT 2015
Auditor’s Report We have audited the consolidated financial statements prepared by the Drägerwerk AG & Co. KGaA, Lübeck, comprising the statement of financial position, the statement of com-prehensive income, statement of changes in equity, cash flow statement and the notes to the consolidated financial statements, together with the group management report, which is combined with the management report of Drägerwerk AG & Co. KGaA, Lübeck, for the business year from January 1, 2015 to December 31, 2015. The preparation of the consoli-dated financial statements and the combined management report in accordance with the IFRSs, as adopted by the EU, and the additional requirements of German commercial law pursuant to § (Article) 315a Abs. (paragraph) 1 HGB (“Handelsgesetzbuch”: German Com-mercial Code) is the responsibility of the parent Company’s Board of Managing Directors. Our responsibility is to express an opinion on the consolidated financial statements and the combined management report based on our audit.
We conducted our audit of the consolidated financial statements in accordance with § 317 HGB and German generally accepted standards for the audit of financial statements promulgated by the Institut der Wirtschaftsprüfer (Institute of Public Auditors in Germany) (IDW). Those standards require that we plan and perform the audit such that misstate-ments materially affecting the presentation of the net assets, financial position and results of operations in the consolidated financial statements in accordance with the applicable financial reporting framework and in the combined management report are detected with reasonable assurance. Knowledge of the business activities and the economic and legal environment of the Group and expectations as to possible misstatements are taken into account in the determination of audit procedures. The effectiveness of the accounting-re-lated internal control system and the evidence supporting the disclosures in the consoli-dated financial statements and the combined management report are examined primarily on a test basis within the framework of the audit. The audit includes assessing the annual financial statements of those entities included in consolidation, the determination of the entities to be included in consolidation, the accounting and consolidation principles used and significant estimates made by the Company’s Board of Managing Directors as well as evaluating the overall presentation of the consolidated financial statements and the combined management report. We believe that our audit provides a reasonable basis for our opinion.

FINANCIAL STATEMENTS 231Auditor’s Report
Our audit has not led to any reservations.
In our opinion based on the findings of our audit the consolidated financial statements comply with the IFRSs as adopted by the EU and the additional requirements of German commercial law pursuant to § 315a Abs. 1 HGB and give a true and fair view of the net assets, financial position and results of operations of the Group in accordance with these requirements. The combined management report is consistent with the consolidated fi-nancial statements and as a whole provides a suitable view of the Group’s position and suitably presents the opportunities and risks of future development.
Hamburg, February 22, 2016
PricewaterhouseCoopersAktiengesellschaftWirtschaftsprüfungsgesellschaft
Dr. Peter Bartels Dr. Andreas Focke(German Public Auditor) (German Public Auditor)
232 DRÄGER ANNUAL REPORT 2015
The Company’s Boards
Supervisory Board of Drägerwerk AG & Co. KGaA
Chairman
Prof. Dr. Nikolaus SchweickartLawyer, Bad HomburgChairman, Altana-Kulturstiftung gGmbH, Bad HomburgChairman of the Board of Trustees, Städel Museum, FrankfurtSupervisory Board memberships:– Drägerwerk Verwaltungs AG, Lübeck (Chairman)– Dräger Medical GmbH, Lübeck (Chairman), until August 2, 2015– Dräger Safety AG & Co. KGaA, Lübeck (Chairman)– Dräger Safety Verwaltungs AG, Lübeck (Chairman)
Memberships on comparable boards of German orforeign companies:– Diehl-Stiftung & Co. KG, Nuremberg (Chairman of the
Advisory Board)– Max-Planck-Innovation GmbH, Munich (Advisory Board),
until March 31, 2015
Vice-Chairman
Siegfrid KasangGroup Works Council Chairman of Dräger, LübeckDräger Lübeck Works Council Chairman, LübeckSupervisory Board memberships:– Dräger Medical GmbH, Lübeck, until August 2, 2015
Nike Benten (from February 1, 2016)Member of Dräger Lübeck Works Council, LübeckMember of the Group Works Council of Dräger, LübeckSupervisory Board memberships:– Dräger Safety AG & Co. KGaA, Lübeck
Klaus-Dieter Fett Works Council Chairman, GermanyMember of the Group Works Council of Dräger, LübeckSupervisory Board memberships:– Dräger Medical Deutschland GmbH, Lübeck
Daniel FriedrichDistrict secretary of the metalworkers' union IG Metall Küste, Hamburg, until September 30, 20151st Delegate of the metalworkers’ union IG Metall, Lübeck-Wismar administrative office, Lübeck, from October 1, 2015Supervisory Board memberships:– Dräger Medical GmbH, Lübeck (Vice-Chairman),
until August 2, 2015– Dräger Safety AG & Co. KGaA, Lübeck
Prof. Dr. Thorsten GrenzManaging Partner of KIMBRIA Gesellschaft für Beteiligung und Beratung mbH, BerlinProfessor of Economics and Social Sciences at Christian-Albrechts University, KielSupervisory Board memberships:– Gpredictive GmbH, Hamburg, (Chairman of the Advisory Board),
from January 1, 2015– Drägerwerk Verwaltungs AG, Lübeck– Dräger Medical GmbH, Lübeck, until August 2, 2015– Dräger Safety AG & Co. KGaA, Lübeck– Dräger Safety Verwaltungs AG, Lübeck
Stefan KleinOfficer of Drägerwerk AG & Co. KGaA, LübeckSupervisory Board memberships:– Dräger Medical GmbH, Lübeck, until August 2, 2015
Stefan LauerFormer Executive Board member of Deutsche Lufthansa AG, FrankfurtSupervisory Board memberships:– Lufthansa Cargo AG, Frankfurt– Drägerwerk Verwaltungs AG, Lübeck– Dräger Medical GmbH, Lübeck, until August 2, 2015– Dräger Safety AG & Co. KGaA, Lübeck
Memberships on comparable boards of German or foreign companies:– Günes Ekspres Havacilik A. S. (Sun Express), Antalya
(Vice-Chairman of the Board of Directors)– Landesbank Hessen-Thüringen Girozentrale, Frankfurt,
Board of Directors– People at Work Systems AG, Munich
Uwe LüdersChairman of the Executive Board of L. Possehl & Co. mbH, LübeckSupervisory Board memberships:– Lübecker Hafen-Gesellschaft mbH (LHG), Lübeck, Chairman,
from May 29, 2015– Drägerwerk Verwaltungs AG, Lübeck– Dräger Medical GmbH, Lübeck, until August 2, 2015– Dräger Safety AG & Co. KGaA, Lübeck
Prof. Dr. Klaus RauscherFormer Chairman of the Management Board of Vattenfall Europe AG, BerlinSupervisory Board memberships:– Vonovia SE, Düsseldorf
(formerly Deutsche Annington Immobilien SE)– Drägerwerk Verwaltungs AG, Lübeck– Dräger Medical GmbH, Lübeck, until August 2, 2015– Dräger Safety AG & Co. KGaA, Lübeck– Dräger Safety Verwaltungs AG, Lübeck
Memberships on comparable boards of German orforeign companies:– Stiftungsrat Berliner Philharmoniker, Berlin

FINANCIAL STATEMENTSThe Company’s Boards
233
Thomas Rickers1st Delegate of the metalworkers’ union IG Metall, Lübeck-Wismar administrative office, Lübeck, until September 30, 2015Officer for the Dräger Group, the metalworker’s union IG Metall, Lübeck-Wismar administrative office, Lübeck, from October 1, 2015Supervisory Board memberships:– Dräger Medical GmbH, Lübeck, until August 2, 2015– Dräger Safety AG & Co. KGaA, Lübeck
Ulrike Tinnefeld (until January 31, 2016)Group Works Council Vice-Chairperson of Dräger, LübeckMember of Dräger Lübeck Works Council, LübeckSupervisory Board memberships:– Dräger Safety AG & Co. KGaA, Lübeck (Vice-Chairperson),
until January 31, 2016
Dr. Reinhard ZinkannManaging Partner of Miele & Cie. KG, GüterslohSupervisory Board memberships:– Falke KGaA, Schmallenberg (Chairman)– Drägerwerk Verwaltungs AG, Lübeck– Dräger Medical GmbH, Lübeck, until August 2, 2015– Dräger Safety AG & Co. KGaA, Lübeck
Memberships on comparable boards of German or foreign companies:– Hipp & Co., Pfaffenhofen (President of the Board of Directors),
from February 26, 2015– Krombacher Brauerei GmbH & Co. KG, Kreuztal-Krombach
(Advisory Board)– Nobilia-Werke J. Stickling GmbH & Co. KG, Verl (Advisory Board)
Members of the Audit Committee:Prof. Dr. Thorsten Grenz (Chairman)Siegfrid KasangProf. Dr. Klaus RauscherProf. Dr. Nikolas SchweickartUlrike Tinnefeld, until January 31, 2016Daniel Friedrich, from February 1, 2016
Members of the Nomination Committee:Prof. Dr. Nikolas Schweickart (Chairman)Uwe LüdersDr. Reinhard Zinkann
Members of the Joint Committee:Representatives of Drägerwerk Verwaltungs AG:Prof. Dr. Thorsten GrenzStefan LauerUwe LüdersProf. Dr. Klaus Rauscher
Representatives of Drägerwerk AG & Co. KGaA:Prof. Dr. Nikolas Schweickart (Chairman)Dr. Reinhard ZinkannSiegfrid KasangThomas Rickers
Members of the Executive Board of Drägerwerk Verwaltungs AG, acting for Drägerwerk AG & Co. KGaA
Stefan DrägerChairman of the Executive BoardChairman of the Executive Board of Drägerwerk Verwaltungs AG, Lübeck(general partner of Drägerwerk AG & Co. KGaA)Chairman of the Executive Board of Dräger Safety Verwaltungs AG, Lübeck(general partner of Dräger Safety AG & Co. KGaA)Managing Director of Dräger Medical GmbH, Lübeck, until August 2, 2015
Supervisory Board memberships:– Sparkasse zu Lübeck AG, Lübeck
Dr. Herbert Fehrecke (until March 31, 2015)Executive Board member for Purchasing and QualityVice-Chairman of the Executive BoardVice-Chairman of the Executive Board of Drägerwerk VerwaltungsAG, Lübeck (general partner of Drägerwerk AG & Co. KGaA), until March 31, 2015Executive Board member of Dräger Safety Verwaltungs AG, Lübeck(general partner of Dräger Safety AG & Co. KGaA), until March 31, 2015General Manager of Dräger Medical GmbH, Lübeck, until March 31, 2015
Supervisory Board memberships:– Diehl-Stiftung & Co. KG, Nuremberg (Advisory Board)– Dräger Medical Deutschland GmbH, Lübeck (Chairman),
until March 31, 2015
Gert-Hartwig LescowCFO and Executive Board member for ITVice-Chairman of the Executive Board, from April 1, 2015Executive Board member of Drägerwerk Verwaltungs AG, Lübeck(general partner of Drägerwerk AG & Co. KGaA)Executive Board member of Dräger Safety Verwaltungs AG, Lübeck(general partner of Dräger Safety AG & Co. KGaA)General Manager of Dräger Medical GmbH, Lübeck, until August 2, 2015
Supervisory Board memberships:– AXA Corporate Solutions S. A., Paris
Rainer Klug (from August 1, 2015)Executive Board member for Production, Logistics, PurchasingRegional responsibility for the Americas, from January 1, 2016Executive Board member of Drägerwerk Verwaltungs AG, Lübeck(general partner of Drägerwerk AG & Co. KGaA)Executive Board member of Dräger Safety Verwaltungs AG, Lübeck(general partner of Dräger Safety AG & Co. KGaA), from Septem-ber 10, 2015

234 DRÄGER ANNUAL REPORT 2015
Dr. Reiner Piske (from November 1, 2015)ExecutiveBoardmemberforHumanResourcesRegionalresponsibilityforEurope,fromJanuary1,2016ExecutiveBoardmemberofDrägerwerkVerwaltungsAG,Lübeck(generalpartnerofDrägerwerkAG&Co.KGaA)ExecutiveBoardmemberofDrägerSafetyVerwaltungsAG,Lübeck(generalpartnerofDrägerSafetyAG&Co.KGaA)
Anton SchrofnerExecutiveBoardmemberforInnovationRegionalresponsibilityforAfrica,AsiaandAustralia,fromJanuary1,2016ExecutiveBoardmemberofDrägerwerkVerwaltungsAG,Lübeck(generalpartnerofDrägerwerkAG&Co.KGaA)ExecutiveBoardmemberofDrägerSafetyVerwaltungsAG,Lübeck(generalpartnerofDrägerSafetyAG&Co.KGaA)GeneralManagerofDrägerMedicalGmbH,Lübeck,untilAugust2,2015
Legal note: Some articles provide information on products and their possible applications in general. They do not constitute any guarantee that a product has specific properties or of its suitability for any specific purpose. All specialist personnel are required to make use exclu sively of the skills they have acquired through their education and training and through practical experience. The views, opinions, and statements expressed by the persons named in the texts do not necessarily correspond to those of Drägerwerk AG & Co. KGaA. Such views, opinions, and statements are solely the opinion of the respective person. Not all of the products named in this report are available worldwide. Equipment packages can vary from country to country. We reserve the right to make changes to products.
Imprint
Drägerwerk AG & Co. KGaACorporateCommunicationsMoislingerAllee53–5523558LübeckGermanywww.draeger.com
Concept and designHeisters&Partner,BürofürKommunikationsdesign,Mainz,Germany
PublicationMarch9,2016
ReproductionsHeisters&Partner,BürofürKommunikationsdesign,Mainz
Printed byEBERLPRINTGmbH,Immenstadt
PhotographyHeikoSchaffrath,DrägerwerkAG&Co.KGaA
ThisAnnualReporthasbeensetupinGermanandEnglishlanguage.IncaseofanydiscrepancybetweentheGermanandEnglishversion,theGermanversionshallprevail.

AN
NU
AL
RE
PO
RT
2015
90 7
0 41
1
Drägerwerk AG & Co. KGaAMoislinger Allee 53 – 5523558 Lübeck, Germanywww.draeger.com
Corporate CommunicationsTel. + 49 451 882 – 3998Fax + 49 451 882 – 3944
Investor RelationsTel. + 49 451 882 – 2685Fax + 49 451 882 – 3296
FINANCIAL CALENDAR 2016
Annual accounts press conference March 9, 2016
Analysts’ meeting March 9, 2016
Report for the fi rst quarter 2016, Conference call April 26, 2016
Annual shareholders’ meeting, Lübeck April 27, 2016
Half-yearly report for 2016, Conference call July 28, 2016
Report for the third quarter 2016, Conference call November 3, 2016
I WILL BE THERE
ANNUAL REPORT 2015
TEC
HN
OLO
GY
FOR
LIF
E /
MA
RK
ETS
SE
LEC
TET
KE
Y FI
GU
RE
S /
DR
ÄG
ER
WO
RLD
WID
E
DIV
ISIO
NS
OVE
R T
HE
PA
ST
FIVE
YE
AR
S
THE
DR
ÄG
ER
GR
OU
P O
VER
TH
E P
AS
T FI
VE Y
EA
RS

Dräger is an international leader in the fi elds of medical and safety tech-nology. The family-run company was founded in Lübeck, Germany, in 1889. Over the past fi ve generations, Dräger has evolved into a publicly traded, worldwide group. The company’s long-term success is based on the four key strengths of its value-driven corporate culture: customer intimacy, professional employees, continuous innovation and a commit-ment to outstanding quality.
“Technology for Life” is the guiding philosophy of the company. Whe-ther in the operating room, in intensive care or in fi re and emergency res-ponse services, Dräger products protect, support and save lives.
Dräger consists of two divisions: the medical division and the safety divi-sion. It has more than 13,000 employees worldwide and is currently represented in over 190 countries. Dräger has sales and service subsi-diaries in more than 50 countries. Its development and production facilities are based in Germany, the United Kingdom, Norway, Sweden, the Czech Republic, South Africa, the United States, Brazil, Chile and China.
Technology for Life
COMPANY PROFILE
DRÄGER WORLDWIDE
Headquarters, sales and service organizations, production plants, logistic centers
Headquarters Sales and service organizations Production plants Logistic centers1 Closure over the course of 2016
Americas Pittsburgh1
TelfordAndoverSão PauloSantiago de Chile
Europe PlymouthBlythOsloHagenLübeckSvenljungaChomutov / Klášterec
Africa King William’s Town
Asia Bejing Shanghai
Dräger off ers its hospital customers anesthesia workstations, ventilators for intensive and emergency care, patient monitoring solutions as well as neonatal care equipment for premature babies and newborns. With its ceiling supply units, operating room IT solutions and gas management systems, Dräger is at the customer’s side throughout the entire hospital.
In the safety division, fi re services, emergency response services, law and regulatory enforcement and industry customers all place their trust in Dräger’s integrated hazard management systems, in particular for per-sonal protection and plant safety. This includes respiratory protection equipment, stationary and mobile gas detection systems, professional diving equipment and systems as well as alcohol and drug testing devices. Dräger also develops customized solutions, such as entire fi re training systems, training concepts and workshops, in collaboration with its cus-tomers.
MARKETS
Hospital Fire services Oil and gas industry
Mining Chemical industry Application-driven markets
THE DRÄGER GROUP OVER THE PAST FIVE YEARS
Twelve months
2011 2012 2013 2014 2015
Order intake € million 2,293.2 2,405.5 2,384.6 2,415.5 2,532.2
Net sales € million 2,255.8 2,373.5 2,374.2 2,434.7 2,608.9
EBITDA 1, 2 € million 274.6 296.0 270.3 255.6 150.9
EBIT 3 € million 213.8 230.3 200.8 178.6 66.7
in % of net sales (EBIT margin) % 9.5 9.7 8.5 7.3 2.6
Interest result € million –33.0 –32.8 –23.5 –25.0 –17.2
Income taxes € million –55.7 –61.8 –57.5 –48.9 –16.2
Net profi t € million 125.1 135.7 119.9 104.7 33.3
Earnings attributable to shareholders € million 120.7 127.0 114.6 96.6 32.7
Earnings per share 4
per preferred share € 7.35 7.73 6.94 5.73 1.89
per common share € 7.29 7.67 6.88 5.67 1.83
Earnings per share on full distribution 5
per preferred share € 4.60 5.90 5.30 4.58 1.46
per common share € 4.54 5.84 5.24 4.52 1.40
Equity 6 € million 731.6 729.7 816.0 896.6 945.9
Equity ratio 6 % 34.6 34.7 39.5 40.1 40.9
Capital employed 6, 7 € million 880.0 901.9 1,052.9 1,107.2 1,269.3
EBIT 3, 8/Capital employed 6, 7 (ROCE) % 24.3 25.5 19.1 16.1 5.3
Net fi nancial debt 6 € million 39.8 56.8 110.0 10.7 145.3
DVA 9 € million 134.6 150.0 113.9 81.6 –46.3
Headcount on 31. December 11,924 12,516 13,334 13,737 13,936
Drägerwerk AG & Co. KGaA dividends
Preferred shares € 0.19 0.92 0.83 1.39 0.19
Common shares € 0.13 0.86 0.77 1.33 0.13
1 EBITDA = Earnings before net interest result, income taxes, depreciation and amortization2 Equipment leased out is recognized in property, plant and equipment since 2012. The fi gures for 2011 were adjusted accordingly.3 EBIT = earnings before interest and taxes4 On the basis of the proposed dividend5 Based on an imputed actual full distribution of earnings attributable to shareholders6 Value at end of period7 Capital employed = total assets less deferred tax assets, current securities, cash and cash equivalents and non-interest-bearing liabilities8 Value of the last twelve months9 Dräger Value Added = EBIT less cost of capital
DIVISIONS OVER THE PAST FIVE YEARS 1
Twelve months
2011 2012 2013 2014 2015
Medical division
Net sales € million 1,484.5 1,558.4 1,545.2 1,577.2 1,698.8
EBIT 2 € million 155.8 151.0 126.1 107.6 46.2
in % of net sales (EBIT margin) % 10.5 9.7 8.2 6.8 2.7
Safety division
Net sales € million 771.3 815.1 829.0 857.5 910.1
EBIT 2 € million 58.0 79.2 74.7 71.0 20.5
in % of net sales (EBIT margin) % 7.5 9.7 9.0 8.3 2.2
1 The years 2011 to 2013 were adjusted pro forma due to the change in segment reporting. Regarding the adjustments for 2014 we refer to Note 3 in the notes.2 EBIT = earnings before interest and taxes
SELECTED KEY FIGURES DRÄGER GROUP
Twelve months
2015 2014 Changes in %
Order intake € million 2,532.2 2,415.5 +4.8
Net sales € million 2,608.9 2,434.7 +7.2
EBIT 1 € million 66.7 178.6 –62.7
in % of net sales % 2.6 7.3
Earnings after income taxes € million 33.3 104.7 –68.2
Earnings per share 2
per preferred share € 1.89 5.73 –67.0
per common share € 1.83 5.67 –67.7
Earnings per share on full distribution 3
per preferred share € 1.46 4.58 –68.2
per common share € 1.40 4.52 –69.1
Cash fl ow from operating activities € million 39.9 188.0 –78.8
Net fi nancial debt 4 / EBITDA 5, 6 0.96 0.04
Equity ratio 4 % 40.9 40.1
DVA 7 € million –46.3 81.6 –156.7
Headcount on 31. December 13,936 13,737 +1.4
1 EBIT = earnings before interest and taxes2 On the basis of the expected dividend3 Based on an imputed actual full distribution of earnings attributable to shareholders4 Value at end of period5 EBITDA = Earnings before net interest result, income taxes, depreciation and amortization6 Value of the last twelve months7 Dräger Value Added = EBIT less cost of capital

AN
NU
AL
RE
PO
RT
2015
90 7
0 41
1
Drägerwerk AG & Co. KGaAMoislinger Allee 53 – 5523558 Lübeck, Germanywww.draeger.com
Corporate CommunicationsTel. + 49 451 882 – 3998Fax + 49 451 882 – 3944
Investor RelationsTel. + 49 451 882 – 2685Fax + 49 451 882 – 3296
FINANCIAL CALENDAR 2016
Annual accounts press conference March 9, 2016
Analysts’ meeting March 9, 2016
Report for the fi rst quarter 2016, Conference call April 26, 2016
Annual shareholders’ meeting, Lübeck April 27, 2016
Half-yearly report for 2016, Conference call July 28, 2016
Report for the third quarter 2016, Conference call November 3, 2016
I WILL BE THERE
ANNUAL REPORT 2015
TEC
HN
OLO
GY
FOR
LIF
E /
MA
RK
ETS
SE
LEC
TET
KE
Y FI
GU
RE
S /
DR
ÄG
ER
WO
RLD
WID
E
DIV
ISIO
NS
OVE
R T
HE
PA
ST
FIVE
YE
AR
S
THE
DR
ÄG
ER
GR
OU
P O
VER
TH
E P
AS
T FI
VE Y
EA
RS