
I. 'the - OJP
32
Volume 2, Issue 1 February 1989 Supported by the Robert I. Kutak Foundation and 'the National Institute of Corrections by ; C. McDonald, ph. D. rithreviews by in M. Schuman Riveland -.-... --- -.- - .-'-.. .. - ---'---,-, --"-"" ". ----- . . -,." -.- .. 1 '1 'f I I _.- ---- - .. _ ... _--_ .•.. _ .. --'--, - -. --_ .. - - ,-. "'-'-- '-'.-- A series reporting the results of research in corrections for administrators and practitioners If you have issues viewing or accessing this file contact us at NCJRS.gov.
Transcript of I. 'the - OJP

Volume 2, Issue 1 February 1989
Supported by the Robert I. Kutak Foundation and 'the National Institute of Corrections
by ; C. McDonald,
ph. D.
rithreviews by
in M. Schuman ~hase Riveland
-.-... --- -.- - .-'-.. --~ .. - ---'---,-, --"-"" ". ----- . . -,." -.- ..
1'1 'f
I I
_.- --~----,-.-.-.----"- '~-'.---'--'-- ---- - .. --.-.--."-~--~-.-. _ ... _--_ .•.. _ .. --'--, -~.-- - ~ -. --_ .. - - ,-. "'-'-- '-'.--
A series reporting the results of appli~d research in corrections for administrators and practitioners
If you have issues viewing or accessing this file contact us at NCJRS.gov.
Joan Petersilia, Director, Criminal Justice Program, The RAND Corporation
Harold 1. Rock, President William G. Campbell, Vice President D. Dean Pohlenz, Executive Director
Larry Solomon, Acting Director Phyllis Modley, Grant Monitor
George Keiser, Director, Community Corrections Division
Janet DeLand Sally Belford
This project was supported by the Robert J. Kutak Foundation of Omaha; Nebraska, and the National Institute of Corrections, U.S. Dep~rtment bf Justice.
Points of view.{ or opini<?:rt()·.ar~. those of the avthors and do not nc(cessarily repres:ent the;official position of
the Kutak Fou~da~Qn:or ~he u..s. DepartmenJ of Justice. ,0:., ~ ' ....... .,t"" '"1 t-' I., ... ~. • ,;.
~ · .... i . ..•. : .~'. • .... ~&
I
Cover photo courtesy of the National Institute of Justice
Editor
Kutak Foundation
National Institute of Corrections
Managing Editor Art Director
For information, contact the National Institute of Corrections' National Information Center 1790 30th Street, Suite 130 Boulder, Colorado 80301
Telephone: 303-939-8877
--- -- -- ---- ~------------.--------------
RESEARCH IN Corrections
Volume 2, Issue 1 February 1989
Supported by the Robert J. Kutak Foundation and the National Institute of Corrections
[ THE COST OF CORRECTIONS: IN SEARCH OF J I ~ J (/ Y THE BOTTOM LINE Douglas C. McDonald, ph.D. Page 1
[THE COST OF CORRECTIONAL SERVICES: EXPLORING
A POORLY CHARTED TERRAIN Alan M. Schuman
r CORRECTIONS "PROPORTIONATE VALUE" Chase Riveland
\ i
\ U.S. Department of Justice National Institute of Justice
116344-116346
This document has been reproduced exactly as received from the person or organization originating it. Points of view or opinions stated in this document are those of the authors and do not necessarily represent the official position or policies of the National Institute of Justice.
Permission to reproduce this c ,. '; ted material has been granted by
Public Domain/NIC -ll.-S. Department of .IllsJ:ic..e to the National Criminal Justice Reference Service (NCJRS).
Further reprcduction outside of the NCJRS system requires permission of the ~owner.
Page 27
A series reporting the results of applied research in corrections for administrators and practitioners

EARLIER VOLUMES IN THIS SERIES
Statistical Prediction in Corrections, by Todd Clear, Ph.D., Vol. I, Issue I, March 1988.
The Effects of Diet on Behavior: Implications for Criminology and Corrections, by Diana Fishbein, Ph.D., and Susan Pease, Ph.D., Vol. I, Issue 2, June 1988.
Pretrial Release: Concepts, Issues, and Strategies for Improvement, by Stevens H. Clarke, Vol. I, Issue 3, October 1988.

FOREWORD
In the economic climate of the 1980s, any discussion of correctional program choices rapidly focuses on the costs associated with sanctioning offenders in different ways. Both the increased cost of services and the problem of crowding throughout the corrections system demand that administrators become more adept at defining and analyzing costs. In this monograph, the fourth in the Research in Corrections series, Douglas McDonald offers both substantive cost information on prisons, jails, probation, and parole and a tutorial on the shortcomings of popular methods of computing corrections costs.
Dr. McDonald provides important insights into why corrections expenditures grew so rapidly in the decade between 1975 and 1985. He defines a framework for understanding the real or full costs of correctional services and discusses the widespread underreporting of costs.
In the practitioner responses, Alan Schuman, Director of the Social Service Division of the Superior Court of the District of Columbia, explores the benefits of community corrections from a cost perspective and calls for remedies to the generally poor state of cost information on community corrections programs. Chase Riveland, Secretary of Corrections, Washington State, places the question of an improved understanding of costs in the perspective of broader public perceptions of the value of correctional programs.
It is our hope that the monograph will be useful to both corrections practitioners and decisionmakers in the broad public policymaking arena.
Larry Solomon Acting Director, National Institute of Corrections

EDITOR'S NOTE
No issue has brought criminal justice more to the forefront of public policy than that of corrections costs. State spending for corrections throughout the nation has grown by more than 50 percent since 1980-the greatest increase of any state-funded service-and next year, Americans will spend close to $10 billion to operate the nation's prisons.
As the costs of corrections continue to spiral upward, most states are asking: How much ·punishment" can we afford? The answer depends on how much various types of punishment cost. Most policy discussions of the costs of imprisonment relative to those of other alternatives have been overly simplistic. The annual operating cost of prisons (usually quoted to be about $14,000 per inmate) is generally compared with the annual cost of probation (about $2,000 per probationer). Comparing these two figures fuels the popular notion that probation is far cheaper than prison.
But as Douglas McDonald makes painfully clear in this comprehensive monograph, reaching the "bottom line" on corrections costs is much more complicated. The annual operating cost of a prison does not reflect capital costs, fringe benefits and pensions, and other necessary expenditures; adding in these items more than doubles the annual cost. Other sanctions, such as jail, probation, and parole, involve cost complications as well.
Dr. McDonald, who has written extensively in criminal justicel reviews current knowledge on corrections costs, pointing out the critical gaps. His review should be of particular interest to budget analysts, state legislators, and corrections practitioners who are concerned with the cost implications of corrections policy.
Chase Riveland and Alan Schuman, in their practitioner reviews, provide another critical dimension to the cost issue. Both of these corrections offidais have had extensive experience in managing their own operational budgets, and have been responsible for informing and educating those who fund correctional services. Here, they review Dr. McDonald's monograph to examine how his findings relate to the day-to-day concerns of the corrections practitioner. Mr. Riveland discusses the "proportionate value" of different corrections services and considers what aspects of corrections seem worth paying for from the public's point of view. Mr. Schuman expands the cost discussion to include community corrections and discusses the impact of litigation on prison operating costs.
The next issue of Research in Corrections will present "Intensive Supervision in Probation and Parole," by James Byrne, Arthur Lurigio, and Christopher Baird.
Complimentary copies of this monograph and earlier v"lumes in the Research in Corrections series can be obtained by writing to the National Institute of Corrections' National Infom1ation Center, 1790 30th Street, Suite 130, Boulder, CO 80301.
Persons wishing further information on the series are asked to write to Joan Petersilia, The RAND Corporation, 1700 Main Street, Santa Monica, CA 90406-2138.
Joan Petersilia
THE COST OF CORRECTIONS: IN SEARCH OF THE BOTTOM LINE
Douglas C. McDonald 1
INTRODUCTION
Several years ago, in testimony before' a state legislative committee that was considering a change in sentencing law, I referred in passing to the $15,000 per-inmate annual cost of operating the state's prison sytem. The commissioner of the state's prisons followed me to the microphone and disputed my figures: UDon't believe everything researchers tell you. I've just calculated that the annual cost is more like $11,500. That has to be right; just divide my budget by the average daily population, and that's what you get." Meeting him in the corridor afterwards, I asked about pension and fringe benefit costs. uOh yes, you're right," he said. "I forgot about them. They're not my costs." .
The idea of "my costs" reflects a much broader problem in public accounting, one which complicates enormously the task of determining what correctional services-and other public services as well-actually cost. The task of the public manager is, in part, to administer appropriated funds. Consistent with this emphasis on budget administration, public accounting methods were designed primarily to track dollars so that fraudulent use of public funds could be prevented or detected. Cost analysis has taken a back seat to funds control, and
·t the way expenditures are counted and reported reflects this. For example, the unit of analysis is the agency rather than the service performed. Where different services are provided by a single agency, the costs of these services are often not disentangled. Where different agencies contribute to the same governmental service, public accounts generally fail to consolidate the costs of that service. Rather than separate capital from operating expenses, many reporting systems con£1ate the two or draw the line dividing them in different ways. Because determining the actual cost of a service is not a central preoccupation of government, rules about how debt should be capitalized, or depreciation calculated, have not been adopted. The result is widespread variation in how costs are computed (when somebody actually makes an attempt to compute them) and a perv"sive underreporting of costs.
In the environment in which correctional managers now work, it is important to have a clear and precise understanding of the fiscal consequences of different choices. During the decade between 1975 and 1985, the cost of operating correctional institutions in the United States rose by nearly 240 percent, and all levels of government spent large sums-a total of about $10.5 billion-to
ISeveral people provided helpful reviews, assistance, and unpublished data. I am especially grateful to Sue Lindgren of the Bureau of Justice Statistics, John Curry of the Bureau of the Census' Government Finance Division, and Joan Jacoby of the Jefferson Institute.
1
--_._---------- -- - ---- -
2 DOUGLAS C. McDONALD
expand their correctional systems.2 Since then, growth has remained strong, and prospects appear quite bleak for a significant reduction in spending in the foreseeable future unless dramatic changes are made in sentencing policies. Rising raster than the gross national product, spending for corrections will have to be fueled either by raising tax revenues or by spending less for other government programs, a painful choice for political leaders and taxpayers alike.
Even if correctional managers were faced with a zero-growth future, just bringing existing facilities up to standards is and will continue to be extremely costly. As of October 1987, forty-five states, the District of Columbia, Puerto Rico, the Virgin Islands, and an undetermined number of county arId municipal governments were under court orders to remedy conditions in their prisons and jails.3
In mid-1984 (according to the most recent survey available), 46 percent of all jails holding at least 100 inmates-which, taken as a group, held about 74 percent of all the nation's jail inmates at that time-were under court orders to reduce overcrowding or improve their recreational and/or medical facilities and services. In most, if not all, instances, the courts are making demands that cost money to satisfy. In one dramatic case, Judge Frank M. Johnson ordered, in James v. Wallace, that the Alabama prison system be improved. This order resulted in a corrections budget in 1976 of $55 million, $35 million of which was said to be caused directly by the judge's decision. 4
This essay presents a discussion of correctional costs, how they are conceived or misconceived, calculated and miscalculated, and how they behave-that is, why they vary from place to place and over time, why they have increased so dramatically in so many jurisdictions, and how they differ among the various types of correctional services. Because my expertise is primarily in elucidating the implications of different policy choices, and beca.use I have little training in professional accounting and none in administering correctional facilities, I have steered almost clear of a review of accounting rule". More detailed and competent discussions of them can be found elsewhere. I have also chosen to avoid the topic of cost-inefficiencies, waste, and how to control them. My aim is, rather, to explore the gross costs of correctional services, including per-capita expenditures, to indicate the problematic nature of the data commonly used and published, and to explore how these costs might be estimated more accurately. I shall present some information that has not been published elsewhere and indi-o cate where I see softness in the published data. My assumption is that the kind of information discussed may be of interest to decisionmakers in the correctional policymaking arena, and not just in correctional administration.
I have not been able to avoid a tension in this discussion between presenting substantive information and discussing methodological matters. This paper is intended to be part sourcebook and part tutorial. Some readers may find the result maddening. A straightforward presentation of costs and cost-related
2See Table 1 on p. 13. 3'Status Report: State Prisons and the Courts; Tile National Prison Project Journal, ACLU
National Prison Project, 13, Fall 1987, p. 24. 4Reported in Charles Prigmore and Richard T. Crow, "Is the Court Remaking the American
Prison System?" Federal Probation, 40, June 1976, p. 8.
THE COST OF CORRECTIONS: IN SEARCH OF THE BOTTOM LINE 3
issues, with only a few qualifications and quibbles, would perhaps make easier and more satisfying reading. However, such a discussion' would reinforce the notion I want to challenge, namely, that the data we commonly use for costs in corrections are misleading. The corrective for this is to take at least a short journey into a more abstract discussion of how costs should be conceived of and computed. In the following, I have tried to balance the discussion somewhere between the two poles of abstract methodology and substantive cost information.
This is not intended as a review of the entire field or all the literature on the subject. Instead, it is a selective discussion of points that I hope have general significance.
ESTIMATING THE COST OF CORRECTIONAL PROGRAMS
Prisons. According to the Census Bureau" survey of audited expenditures, state governments spent between $4.28 and $4.80 billion for their correctional systems during 1985.5 This amounted to an annual average operating expenditure of $9,550 to $10,700 per inmate.6 During the same year, the federal government spent roughly $501 million to operate its adult prison system, or $12,500 per inmate.7 According to other widely used sources, however, the expenditure was substantially higher. The American Correctional Association's annual survey reports that state and federal budgets for operating the nation's prison systems totaled $7.9 billion in that same year. s Translated into per-capita terms, the average annual budgeted amount was $16,400 for each inmate. The Corrections Yearbook computed from its survey of agency budgets that operating costs averaged $14,591 per inmate that year. The highest estimate was more than half again as much as the lowest of the three.
The actual cost was probably higher than all three, largely because we can be assured that some categories of direct costs were not picked up in any of the surveys. Given the existing data, however, it is difficult to estimate how much higher the real expenditure was. The Census Bureau's figures are probably the best estimates of base operating costs, simply because they were derived from audited expenditures rather than budgets and because Census Bureau examiners followed uniform rules to distinguish different types of costs. They also
5State figures represent aggregate expenditures for institutional operations, reported in Government Finances in 1984-1985, Washington, D.C.: U.s. Department of Justice, 1985, Table 47. The total of $527 million reported spent by state governments for institutional operations is not separated into adult and juvenile corrections, but is categorized as 'other and combined"; hence, a range is represented, rather than a single figure.
6Average number of prisoners from Bureau of Justice Stdtistics, Prisoners in 1985, Washington, D.C.: U.S. Department of Justice, 1986, Table 2. .
7 Annual budget reported in George M. Camp and Camille Graham Camp, The Corrections Yearbook, South Salem, N.Y.: Criminal Justice Institute, 1986, p.23. Average daily popUlation is reported in Bureau of Justice Statistics, Prisoners in 1985, Washington, D.C.: U.s. Department of Justice, 1986, Table 2.
BAmerican Correctional Association, 1986 Directory: Juvellile alld Adult Correctional Departments, Institutions, Agencies, and Paroling Authorities, College Park, Md., 1986, pp. x, xi.

4 DOUGLAS C. McDONALD
followed the same rules in deciding what to include and what to exclude. But because there is wide variation from state to state in activities and costs that agency budgets cover, and because the annual budget surveys don't tell us what is or is not in them, it is difficult to know how much confidence to place in these figures.
Jails. Reliable estimates for the costs of the nation's 3,300 local jails are even harder to come by. The Census Bureau's ~urvey of government finances estimated that county and municipal governments spent a total of $3 billion in fiscal year 1985 to operate jails and detention centers.9 This amount included both adult and juvenile institutions, but extrapolating from limited data, we can e~timate that county and local expenditures for adult jails alone totaled roughly $2.3 billion that year. lO On a per-prisoner basis, this averaged $8,679 per year, or $23.78 per dayY Again, some cost elements were systematically excluded from these figures (principally, pension fund contributions), so the costs are low by some undetermined percentage.
Few other surveys of jail costs exist. One undertaken by the Criminal Justice Institute for its Corrections Yearbook polled all jails in the United States holding more than 250 prisoners in 1985. Four dozen responded, about one-fifth of all jails meeting the size criterion.12 These 48 jurisdictions reported spending an annual average of $13,803 per prisoner, or $37.82 per day. Costs ranged from a low of $1,080 per year in Alabama's Jefferson County jail to a high of $40,077 per year in New York City's adolescent detention center. Again, it is difficult to determine how much confidence should be placed in the accuracy of these figures, absent a description of the accounting methods used by each county to calculate rates. Moreover, the selected sample consisted of larger jails and may not necessarily be representative of the entire set of adult jails in the country. The bottom line is that none of the estimates of average jail costs seems strong enough to stand on.
Probation and Parole. Very few data are available on nationwide expenditures for probation and parole. The Bureau of Justice Statistics (BJS) reports that the total direct expenditure during fiscal year 1985 for both activities at the state and local, but not federal, levels amounted to $1.5 billion. Of this total, all but $10.4 million went for agency operations; the remainder represented capital
9Bureau of Justice Statistics, "Justice Expenditure and Employment Final Report, 1985," unpublished document, Table 42.
lOAccording to the same Bureau of Justice Statistics report, 72 large county governments sampled by the Bureau of Census reported that 77.5 percent of their expenditures for institutional corrections went to adult facilities. Applying that proportion to the total combined expenditure for adults and juveniles in both county and municipal jails yields $2.3 billion for adults alone. (Ibid., Tables 42 and 50.)
11 At midyear 1985, there were approximately 265,000 persons in U.S. jails (Bureau of Justice Statistics, Jai/Illmates, 1985, Washington, D.C.: U.s. Department of Justice, 1987, Table 1.
12Camp and Camp, The Correctiolls Yearbook, 1985, pp. 67-68. The sample reported here represents about half of all jails having more than 250 persons, but Charles DeWitt counts 214 jails of this size in 1983. See DeWitt, New COllstructioll Methods for Correctiollal Facilities, Washington, D.C.: U.S. Department of Justice, 1986, Fig. D.
THE COST OF CORRECTIONS: IN SEARCH OF THE BOTTOM LINE 5
expenses. 13 No information is given for probation activities alone, or parole separately. Again, these data underestimate the actual operating costs because they, like all data developed by the Bureau of the Census for its survey of government finances, omit certain categories of fringe benefit and retirement fund contributions. These and other local sources also tend to overlook certain categories of direct expenditures made for either probation or parole, because those expenditures are picked up in other departments' budgets.
The Criminal Justice Institute, in its Corrections Yearbook (1985), reports that its national survey of probation agencies found the estimated cost of supervising one probationer for a year to range from $156 in Connecticut to $1,500 in the federal system. The average cost for the 44 agencies reporting was $584.14 Because the Yearbook provides no description of the methodology followed to compute these costs, we cannot assess their accuracy. Probation is a local responsibility in many states, and it is lil<ely that the state-level agencies that reported the costs to the authors of the Yearbook passed on estimates of varying quality obtained from local departments. IS
Probation costs vary in relatively direct proportion to the caseload size-that is, the number of probationers supervised by a single probation officer-and to the salary levels of officers. Various forms of beefed-up probation supervision programs (e.g., intensive-supervision probation) usually involve smaller caseloads, which come at a higher per-capita cost. The annual cost of intensive supervision in Georgia during 1982, for example, was reported to be $1,595 per probationer, compared with $275 for regular supervision during the same period.16
To the best of my knowledge, no national survey of parole supervision costs exists. The cost is often difficult to identify, because in many jurisdictions parole supervision costs are not separated from the larger agency costs, which often include those of the parole board and, in many jurisdictions, probation services as well. To give some idea of the magnitude of the costs, a study of New York expenditures in 1978 estimated that parole supervision cost about 7 percent of the average per-capita cost of incarceration in the state's prisonsY
The Need for Special Studies. An extensive list could be assembled here of the various estimates for different forms of correctional programs in different jurisdictions. But it is more useful, I think, for the reader to understand that the vast majority of estimates used to represent total costs are of questionable accuracy.
13"Justice Expenditure and Employment Final Report, 198.'i,' Table 43. HCamp and Camp, Tile Corrections Yearbook, 1985, pp. 74-75. 15 Determining the cost of probation supervision is difficult because of all the general problems
with public accounting systems and their reports, but also for reasons peculiar to the structure of many probation departments. Probation agencies are multiservice agencies, providing-in addition to correctional supervision-services to adult courts in the form of presentence investigations, operating intake in the family courts, and other activities. If separate subdivisions do not exist to perform each of these activities, and if the accounting systems do track these functional areas separately, singling out the cost of probation supervision is quite difficult.
16BilIie S. Erwin, Evaluation of Intensive ProbatiOll Supervisioll ill Georgia, Atlanta: Georgia Department of Offender Rehabilitation, 1984.
17Douglas McDonald, The Price of PUllisizmellt: Public Spendillg for CorrectiollS in New York, Boulder, Colo.: Westview Press, 1980, pp. 62-63.
~~-- ~-~-- ---------------
6 DOUGLAS C. McDONALD
Most are derived from agency expenditures-or worse, from budgets-and consequently they ignore several important categories of costs. What is needed is better agreement and understanding about what should be counted as costs. Because the cost of a service is so dependent upon how that service is delivered in each jurisdiction, and because there is such variation among jurisdictions in how costs are shared among agencies, special studies must be undertaken if accurate estimates of costs are to be obtained.
WHAT SHOULD COUNT AS A COST?
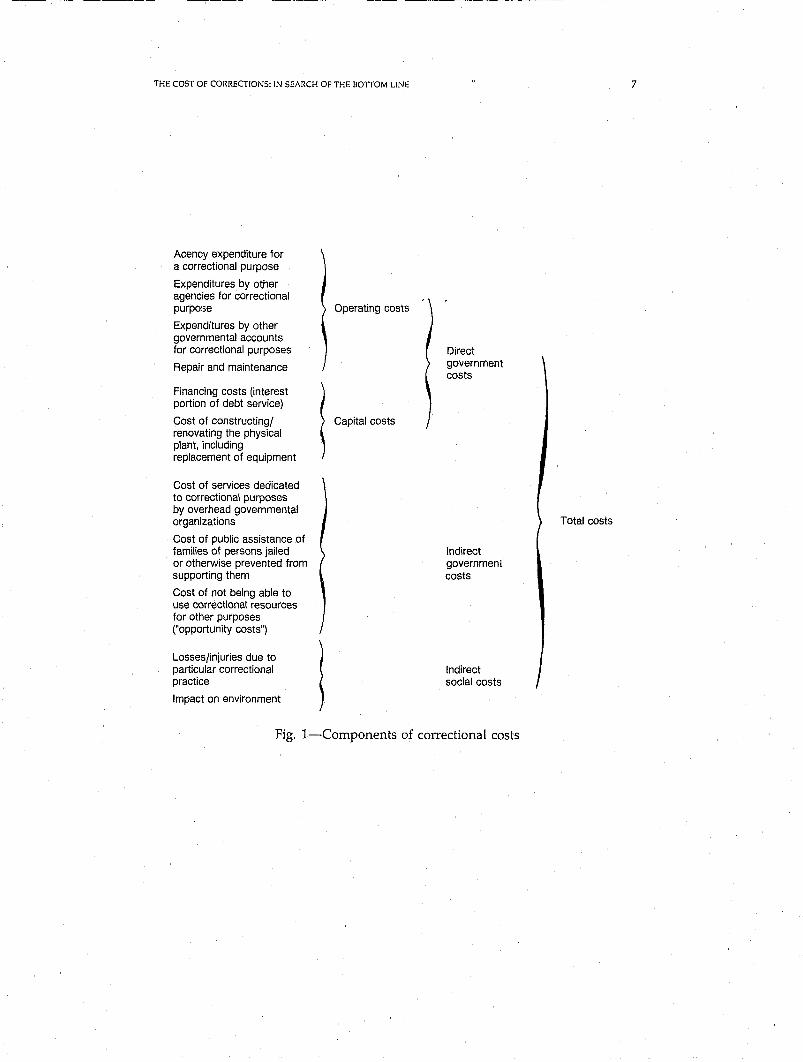
The basic problem in correctional cost analysis is that many expenditures that should be counted as costs of providing a particular service are overlooked. The relationship of severi=ll broad classes of cos''> is illustrated in Figure 1.
Moving from right to left in Figure 1: The total cost of a particular correctional service should logically include both direct costs, or those expenditures made by an agency of government to provide the service in question, and indirect costs, those costs borne by government or nongovernmental parties to support a particular correctional activity. Although these latter costs-the indirect governmental and indirect social costs-are real, their calculation is often difficult, speculative, and controversial, and will not be discussed further in this paper.
Direct costs consist of both operating costs and capital costs. It is important to distinguish between the two, because each provides benefits to different clients and publics. The rule is that operating costs are incurred to provide a service to the current client popUlation, whereas expenditures for the expansion or replacement of capital stock benefit future generations as well.
Amortizing Capital Expenditures. The true cost of delivering a service in a particular year should include operating costs incurred during that year and some portion of the capital expenditures made that year. Determining precisely what proportion of the capital cost should be incorporated into the current cost estimate depends how long the capital resource will be used-how many years the cost should be spread over. The simplest method is to spread the cost of the facility evenly across all the years the facility provides useful service-the socalled IIstraight-line" method of allocation. I8 Most analyses of correctional costs fail to amortize capital spending and therefore understate the actual cost of operations.
Financing. The costs of purchasing correctional assets, if financed by borrowing, should be considered current operating costs, although they rarely are in public accounts. The portion that should be assigned to the annual (or daily, or
18For a clear discussion of the concept and the various methods, see Gail S. Funke and Billy L. Wayson, 'What Price Justice? A Handbook for the Analysis of Criminal Justice Costs,' unpublished document written for the National Institute of Justice-supported National Baseline Information Project of the Jefferson Institute and the Institute for Economic and Policy Studies, Washington, D.C., pp.64-69.
THE COST OF CORRECTIONS: IN SEARCH OF THE BOTTOM LINE
Acency expenditure for a correctional purpose
Expenditures by other agencies for correctional purpose
Expenditures by other governmental accounts for correctional purposes
Repair and maintenance
Financing costs (interest portion of debt service)
Cost of constructing/ renovating the physical plant, including replacement of equipment
Cost of services dedicated to correctional purposes by overhead governmental organizations
Cost of public assistance of families of persons jailed or otherwise prevented from supporting them
Cost of not being able to use correctional resources for other purposes ("opportunity costs")
Losses/injuries due to particular correctional practice
Impact on environment
Operating costs
Capital costs
l
Direct government costs
Indirect governmeni costs
Indirect social costs
Fig. I-Components of correctional costs
7
Total costs

8 DOUGLAS C. McDONALD
whatever) operating cost is the amount of interest paid on the debt during the time period measured.
Expenditures by Other Agencies. The direct costs other agencies incur in serving a correctional agency's mission must also be counted as direct costs, although they are typically overlooked because of the exclusive focus on the correctional agency's expenditures. For example, teachers in prisons and jails are sometimes paid not by the correctional agency, but by local school districts. Doctors and other medical workers might be paid by local or state departments of public health and mental hygiene. In-hospital care is often charged to the public hospital rather than to the correctional agency. Utility bills in correctional facilities are sometimes paid by departments of public works. Departments of transportation often provide the vehicles used to move prisoners. In some instances, a local department may have a special program that is financed not by the local government but by a state or federal government, and these costs might not show up in the department's expenditure reports. Failure to count the costs of services provided by other agencies Dnd other levels of gov0rnment may result in signficant undercounting of the total direct cost of a correctional service.
Disentangling Costs Within an Agency. In instances where a single agency performs a variety of different services, the costs of those services are often conflated with one another because the control of the agency's funds is more important than a precise determination of what each separate service costs. For example, probation departments typically provide both a correctional servicethe supervision of offenders-and an investigative service to the court in support of the judges' sentencing function. Likewise, local sheriffs' departments are often structured as multipurpose agencies. They operate jails, patrol highways, and answer calls for service that do not involve law enforcement duties. When public accounts do not track expenditures for these separate functions (indeed, that is often difficult because the same people perform many different duties), teasing out the cost of a discrete correctional service usually requires not only a reanalysis of raw expenditure reports, but often new data collection as well.
Expenditures from Other Accounts: Fringe Benefits and Pensi'lns. Finally, some costs are paid not out of any department's budget, but from general government accounts. In many jurisdictions, fringe benefits and contributions to employee retirement funds are not assigned to agency budgets but are transferred from the general fund into a separate account for all government employees as a group. Because personnel expenses represent such a large proportion of expenditures for correctional services, failure to count the added costs of benefits and pension plans results in the loss of a major expense item.
Whereas determining the cost of fringe benefits is quite straightforward, putting a true dollar figure on pension costs is much more difficult. This is due largely to the special nature of these costs. Pensions are a form of additional compensation to employees which is deferred either until employees reach retirement age or until they put in a specified number of years of service. As such, these obligations constitute a debt to employees. Funds to payoff these debts come
THE COST OF CORRECTIONS: IN SEARCH OF THE BOTTOM LINE 9
from government contributions to retirement systems and earnings received on investments of these contributions.
Government accountants use different methods for measuring the cost of retirement compensation, and inadequate financial reporting practices comf\ .... und the confusion. 19 Some governments recognize the cost of pension benefits at the moment when cash payments are paid out to the retired worker. Others recognize it when the liability for a future benefit is created-that is, when the worker earns an increment of his or her future benefit payment. Determining the actual cost of a government service is presently obscured by the first method of computing pension costs, because costs in the form of liabilities are not being counted when they are created. (Lacking a method of matching liabilities to fund contributions, pension systems so designed also tend to build up large liabilities that are not offset by regular government contributions. The unfunded liabilities have to be paid, consequently, not by those who used the government service, but by later generations of taxpayers.) The method preferred by the standard-setting authorities involves making predictions about the size of those future costs and contributing some portion of them in the present. Contributions can be made to the retirement fund in amounts that will ensure that an employee's retirement benefits will be paid out of the funds that were set aside by the government for that purpose during his working lifetime.
The virtue of the latter method, from our point of view, is that it provides a way of measuring a piece of correction.al spending for current operations. If the estimates are accurate, one needs only to track down the amount contributed by the government during any given year to the correctional staff person's retirement.20
Whether or not these contributions can be taken as accurate indicators of actual cost is thrown in doubt, however, by studies of current funding practices in public pension systems. According to some studies, current contributions in many places do not match the liabilities that employees are incurring for futurE' benefits. A 1975 study by the U.S. General Accounting Office of state and local pension systems estimated that the unfunded liabilities of those systems-the gap between what governments will have to pay and the assets that will be on hand to cover them-was between $150 and $175 billion, about the same as the entire outstanding credit market debt of state and local governments at that timeY This gloomy picture was reinforced by Frank Arnold's 1983 survey of all 144 state-administered pension plans. He estimated that assets covered only about 45 percent of total projected liabilities. The unfunded liability in these
19For a discussion of the great variability and deficiencies in the reporting practices of public pension systems, see John E. Peterson, Public Pellsioll System Fillancial Disclosure, Washington, D.C.: Government Finance Research Center, 1983.
20public budgets and published expenditure audits rarely indicate the amounts contributed on behalf of employees in specified agencies, but those who administer the pension funds can usually compute the amounts.
21ComptroIIer General of the United States, Fundillg of State alld Local Govemmellf Pension Plalls: A Natiollal Problem, Washington, D.C.: General Accounting Office, August 1979.

10 DOUGLAS C. McDONALD
state plans alone was estimated to be $170 billion.22 (This exceeded by two and a half times the total long-term state debt in 1978.23)
Uniformed employee pension systems, at least those for police and firefighters, tend to be more fully funded than others, but it is not known, in the aggregate, how much smaller the unfunded liability in these systems is or, correspondingly, how much larger the actual cost of current corrections services is, properly computed. Studies of unfunded liabilities indicate that the cost could be substantially larger than is commonly perceived. It is safe to assume, consequently, that pension contributions for correctional workers represent a low estimate of retire~ ment costs.
Correctional pension contributions in New York give some idea of how large these costs can be. During 1976-1977, contributions by state government to the retirement fund for state prison employees equaled 23.6 percent of all salary and wage payments-none of which came from the department's budgeted funds. 24
(This was in addition to expenditures for other fringe benefits, which added another 12.7 percent.) During the same year, pension contributions for city jail employees in New York City averaged 35 percent of all salary and wage payments, all of which were paid by a general government account. Some additional fringe benefits were paid out of that general account, the result being that these extradepartmental costs equaled 46 percent of all salary payments that year.25 In fiscal year 1987, these costs accumulated at a rate that was only slightly lower.26 Excluding pension contributions from estimates of correctional spending in these jurisdictions would have undercounted greatly the actual direct cost of those services.
The proportion of all pension and fringe costs covered by correctional department budgets, and how much larger the cost of operations would be if these were fully included in jurisdictions where agency budgets exclude them, has not been systematically determined. According to the American Correctional Association's Vital Statistics in CorrectiJns, 1986, the average fringe and pension rate of the 86 jurisdictions that responded to a survey was reported to be 24.14 percent of salary. Whether these costs were included in department budgets was not indicated, nor do we know the method by which these rates were calculated, or whether the withholdings cover 100 percent of the liabilities.
22State and Local Public Pension Funding: Theon}, Evidence, and Implications, Ph.D. dissertation, Harvard University, 1983, cited in Herman B. Leonard, Unchecked Balances: The Quiet Side of Public Spending, New York: Basic Books, 1986, pp. 34-35. Based on his review of other evidence, Leonard suspects that Arnold's estimates may even be too optimistic.
23Leonard, Unchecked Balances, p. 35. 24McDonald, The Price of Punishment, note 12, Chap. 2. 25Ibid., pp. 112-113. 26The total pension cost and part of the fringe costs that were not included in the department's
budget represented 46 percent of the uniformed officers' salary payments, and 30.5 percent of the civilians'. (Letter dated January 20, 1988, from Judith Keefer, City of New York Department of Correction; the equivalent rates in fiscal year 1978 were 42.5 percent and 32 percent, respectively.)
THE COST OF CORRECTIONS: IN SEARCH OF THE BOTTOM LINE 11
HOW MUCH HIGHER ARE REAL COSTS LIKELY TO BE?
Several studies give an indication of the difference between true costs and what correctional authorities perceive as the costs of jailing. Funke and Wayson (1977) estimated that operating costs of local jails in the state of Washington were underreported by 28 percent. 27 A 1982 study by the Center for Justice Planning, conducted for the National Institute of Corrections, computed costs and found an identical underreporting of expenditures for 34 "constitutionar jails in the figures correctional administrators provided. 28 McDonald found that about 36 percent of estimated total expenditure for New York City's jail operations was paid not by the Department of Correction, but by other agencies and other accounts, and that state prison costs were consequently underreportecl. by about 22 percent. (The degree of underreporting-and the estimated total cost-would have been even higher had estimates of depreciation and the interest portion of the debt service been included.)29 Roughly similar findings were also obtained in other studies.3o
If audited and reported costs equal about 60 to 75 percent of total direct costs across the nation (which is not unreasonable to expect), the actual cost of operating public correctional programs is about 33 to 66 percent higher than is usually reported.31
HOW MUCH AND WHY HAVE COSTS GROWN SO RAPIDLY?
Even though the periodic surveys of correctional costs provide incomplete information on total costs of operations, they do provide a good picture of how costs have changed in recent years. The most reliable source is the Bureau of the Census's annual survey of government finances, whose accounting methods have been consistent from year to year, except for a change adopted in 1971.
Operating costs nationwide, exclusive of capital expenditures, increased 470 percent between 1971 (the first year when operating and capital costs were reported separately in government reports) and 1985. Growth was fastest at the federal level, where a 532 percent increase was posted during this period, although spending in the federal system is only about 1/20 of the expenditure at state and local levels. Growth at the state level was also explosive: 519
27G. S. Funke and B. L. Wayson, Comparative Costs of State and Local Facilities, Washington, D.C.: Correctional Economics Center, 1977.
2BThe Costs of Constitutional Jails, Washington, D.C.: National Institute of Corrections, 1982, p.24.
29McDonald, The Price of Punishment, p. 112. 30 Coopers and Lybrand, The Cost of Incarceration in New York City, Hackensack, N.J.: National
Council on Crime and Delinquency, 1978; and G. P. Falkin et al., Revising Connecticut's Sentencing Laws: An Impact Assessment, Alexandria, Va.: Institute for Economic and Policy Studies, 1981.
31The use of these two percentages may seem contradictory, but if 75 percent of the total +F 1 cost of a program is covered by a department's budget, the 25 percent not coul!ted is equivalent to 33 percent of that budget. If 60 percent is budgeted, the uncounted 40 percent equals 66 percent of it.
12 DOUGLAS C. McDONALD
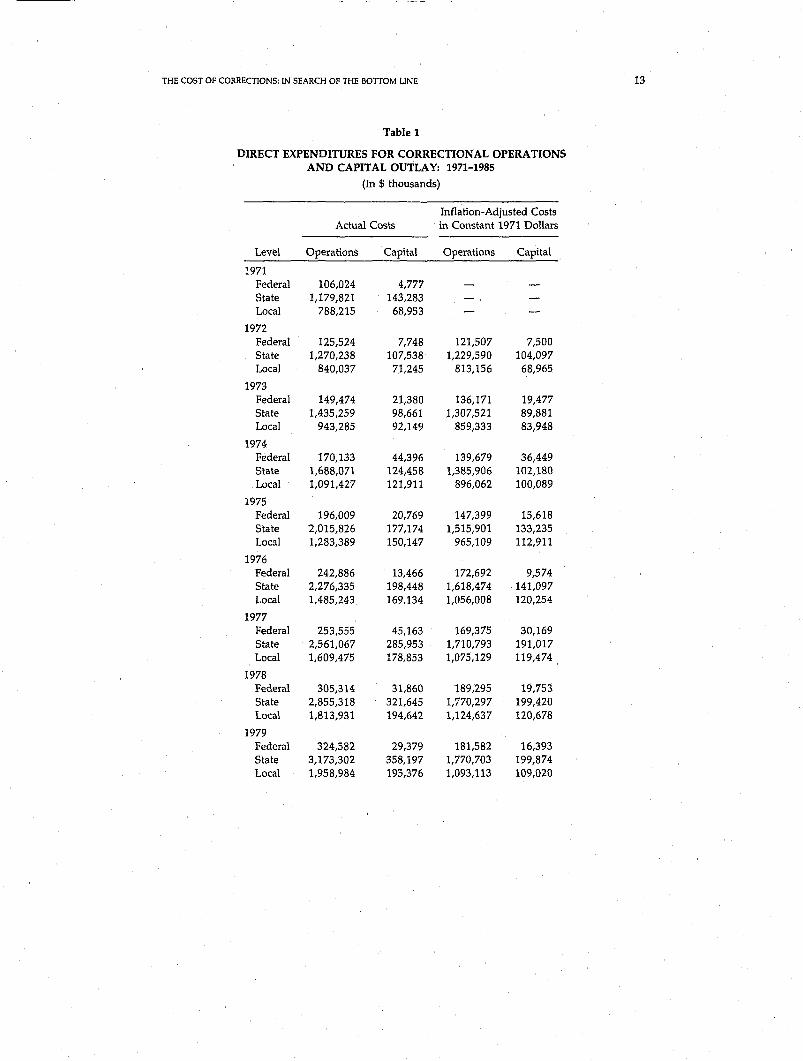
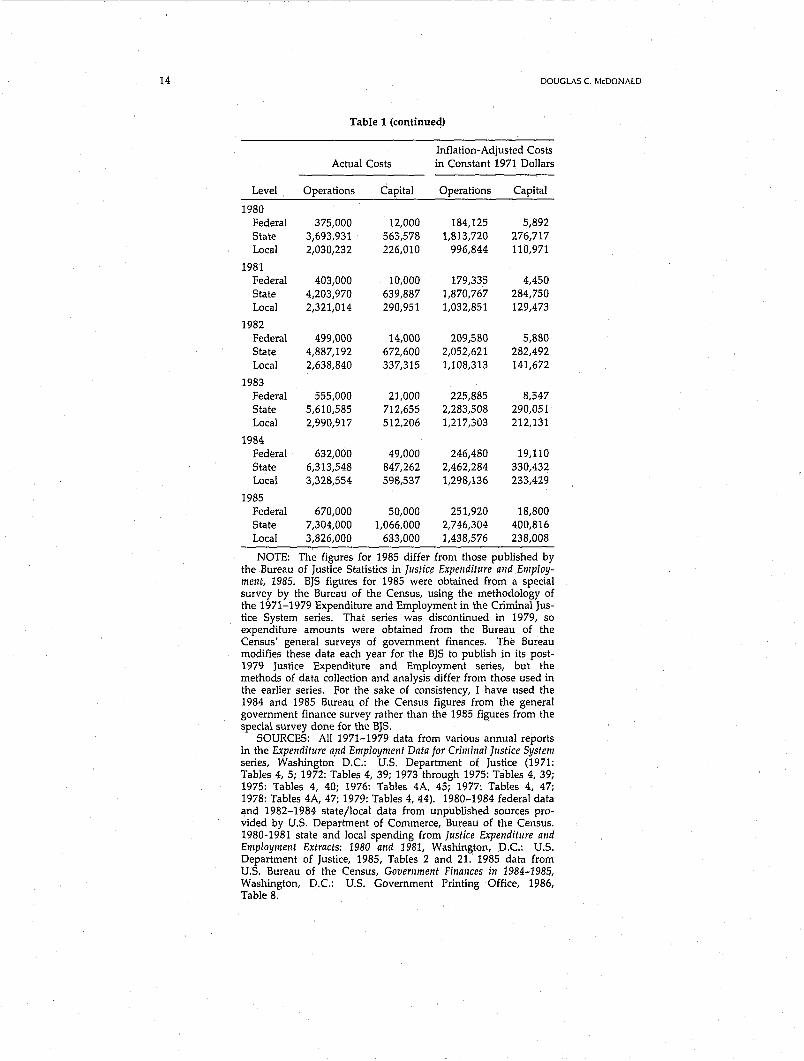
percent during this 14-year period. This is especially significant because states shouldered the major burden of correctional spending. 32 Local spending for correctional operations also increased substantially, by 385_percent (see Table 1).
The big boom, however, was in capital spending. Correctional agencies at all levels of government scrambled to purchase, build, and rehabilitate facilities to handle their swelling client populations. Between 1971 and 1985, state governments spent a total of $6.05 billion for capital outlays (not including the cost of servicing the debt on borrowed capital). Local governments during this period spent approximately $3.8 billion, most of it for prisons and jails. In 1977, 92 percent of all capital outlays in corrections by state and local governments combined went for institutional expansion and improvement. In 1985, institutions commanded 99 percent of all capital spending.33 By that year, annual capital expenditures were about 700 percent higher than they were in 1971.
What accounted for these enormous increases? In large part, the increase was illusory: Costs rose as the dollar's purchasing power dropped. The value of the dollar eroded only slightly between 1952 and the mid-1960s, but an inflationary surge was ignited in the latter years of that decade when federal spending for domestic and military purposes far exceeded available tax revenues. Inflation proceeded apace throughout the 1970s and into the early 1980s, so that by 1985, a 1971 dollar was worth only 38 cents. Three-qu.arters of the increase in correctional spending between 1971 and 1985 was due, consequently, to inflation and the dollar's corresponding loss of purchasing power. The ureal" increase in correctional spending, deflated for inflation, was therefore 122 percent for operations, rather than 470 percent (the increase not adjusted for inflation). Annual capital spending was really about 200 percent higher in 1985 than in 1971, not the 700 percent reflected in the dollar differences.
This real doubling of spending for operations between 1971 and 1985 resulted mainly from the growing offender population and correctional workforce. The numbers of offenders (adults and children) incarcerated increased 102 percent.34
Probation and parole populations increased significantly, but the size of that change cannot be computed, because no surveys of probation and parole populations were made between 1965 and 1976. The workforce grew correspondingly. In October 1971, the Bureau of the Census counted 177,600 correctional
32In fiscal year 1985, state governments paid the lion's share of all corrections costs-62 percent. Counties footed the bill for 24.5 percent, and the remainder was split between municipal governments (8.1 percent) and the federal government (5.4 percent) (see Table 1). In alI, corrections expenditures represented about 28 percent of all civil and criminal justice spending that year (which totaled $45.6 billion) and approximately 0.8 percent of direct governmental expenditures for all purposes. (Computed from data in "Justice Expenditure and Employment Final Report, 1985," Tables 1 and 2.)
33Expenditure and Employment Data for the Criminal Justice System: 1977, Tables 48, 49, and 'Justice Expenditure and Employment Final Report, 1985," Tables 42, 43.
34State and federal prison populations increased 154 percent and jail populations increased by about 77 percent, while the numbers of children in custody declined by 14 percent. Bureau of Justice Statistics Bulletins, Prisoners 1925-81 (1982), Prisoners in 1985 (1986), Children in Custody (1986), Washington, D.C.: U.S. Department of Justice; 1971 jail data estimated from 1970 and 1972 census figures, reported in Margaret Cahalan, "Trends in Incarceration in the United States Since 1880,' Crime & Delinquency, 25, 1979, p. 14i 1971 figure on children in custody and 1985 jail popUlation from personal communication with BJS personnel.
---- -- -- ~--
THE COST OF CORRECTIONS: IN SEARCH OF THE BOTTOM LINE 13
Table 1
DIRECT EXPENDITURES FOR CORRECTIONAL OPERATIONS AND CAPITAL OUTLAY: 1971-1985
(In $ thousands)
Inflation-Adjusted Costs Actual Costs in Constant 1971 Dollars
Level Operations Capital Operations Capital
1971 Federal 106,024 4,777 State 1,179,821 143,283 Local 788,215 68,953
1972 Federal 125,524 7,748 121,507 7,500 State 1,270,238 107,538 1,229,590 104,097 Local 840,037 71,245 813,156 68,965
1973 Federal 149,474 21,380 136,171 19,477 State 1,435,259 98,661 1,307,521 89,881 Local 943,285 92,149 859,333 83,948
1974 Federal 170,133 44,396 139,679 36,449 State 1,688,071 124,458 1,385,906 102,180 Local 1,091,427 121,911 896,062 100,089
1975 Federal 196,009 20,769 147,399 15,618 State 2,015,826 177,174 1,515,901 133,235 Local 1,283,389 150,147 965,109 112,911
1976 Federal 242,886 13,466 172,692 9,574 State 2,276,335 198,448 1,618,474 141,097 Local 1,485,243 169,134 1,056,008 120,254
1977 Federal 253,555 45,163 169,375 30,169 State 2,561,067 285,953 1,710,793 191,017 Local 1,609,475 178,853 1,075,129 119,474
1978 Federal 305,314 31,860 189,295 19,753 State 2,855,318 321,645 1,770,297 199,420 Local 1,813,931 194,642 1,124,637 120,678
1979 Federal 324,582 29,379 181,582 16,393 State 3,173,302 358,197 1,770,703 199,874 Local 1,958,984 195,376 1,093,113 109,020
14
Level
1980 Federal State Local
1981 Federal State Local
1982 Federal State Local
1983 Federal State Local
1984 Federal State Local
1985 Federal State Local
DOUGLAS C. McDONALD
Table 1 (continued)
Actual Costs
Operations Capital
375,000 12,000 3,693,931 563,578 2,030,232 226,010
403,000 10,000 4,203,970 639,887 2,321,014 290,951
499,000 14,000 4,887,192 672,600 2,638,840 337,315
555,000 21,000 5,610,585 712,655 2,990,917 512,206
632,000 49,000 6,313,548 847,262 3,328,554 598,537
670,000 50,000 7,304,000 1,066,000 3,826,000 633,000
Inflation-Adjusted Costs in Constant 1971 Dollars
Operations Capital
184,125 5,892 1,813,720 276,717
996,844 110,971
179,335 4,450 1,870,767 284,750 1,032,851 129,473
209,580 5,880 2,052,621 282,492 1,108,313 141,672
225,885 8,547 2,283,508 290,051 1,217,303 212,131
246,480 19,110 2,462,284 330,432 1,298,136 233,429
251,920 18,800 2,746,304 400,816 1,438,576 238,008
NOTE: The figures for 1985 differ from those published by the Bureau of Justice Statistics in Justice Expellditure and Employmellt, 1985. BJS figures for 1985 were obtained from a special survey by the Bureau of the Census, using the methodology of the 1971-1979 Expenditure and Employment in the Criminal Justice System series. That series was discontinued in 1979, so expenditure amounts were obtained from the Bureau of the Census' general surveys of government finances. The Bureau modifies these data each year for the BJS to publish in its post-1979 Justice Expenditure and Employment series, but the methods of data collection and analysis differ from those used in the earlier series. For the sake of consistency, I have used the 1984 and 1985 Bureau of the Census figures from the general government finance survey rather than the 1985 figures from the special survey done for thl! BJS.
SOURCES: All 1971-1979 data from various annual reports in the Expenditure a.nd Employmellt Data for Criminal Justice System series, Washington D.C.: U.S. Department of Justice (1971: Tables 4, 5; 1972: Tables 4, 39; 1973 through 1975: Tables 4, 39; 1975: Tables 4, 40; 1976: Tables 4A, 45; 1977: Tables 4, 47; 1978: Tables 4A, 47; 1979: Tables 4, 44). 1980-1984 federal data and 1982-1984 state/local data from unpublished sources provided by U.S. Department of Commerce, Bureau of the Census. 1980-1981 state and local spending from Justice Expenditure alld Employment Extracts: 1980 alld 1981, Washington, D.C.: U.s. Department of Justice, 1985, Tables 2 and 21. 1985 data from U.S. Bureau of the Census, Government Finallces in 1984-1985, Washington, D.C.: U.S. Government Printing Office, 1986, Table 8.
THE COST OF CORRECTIONS: IN SEARCH OF THE BOTTOM LINE 15
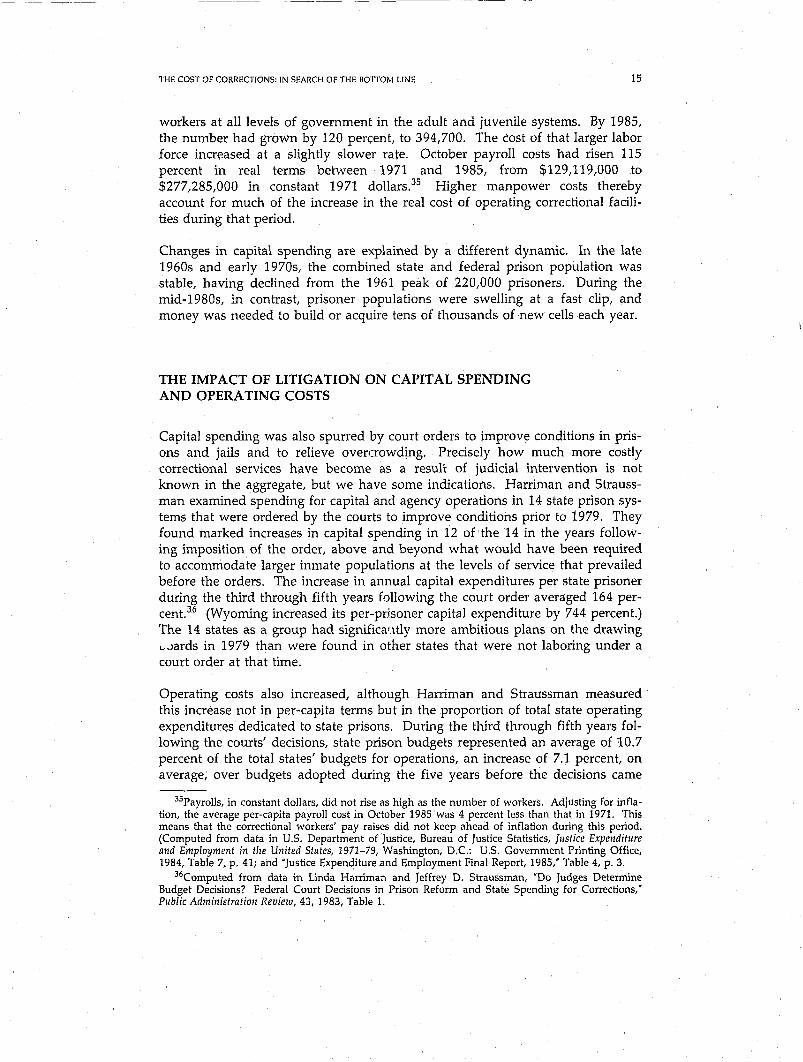
workers at all levels of government in the adult and juvenile systems. By 1985, the number had grown by 120 percent, to 394,700. The cost of that larger labor force increased at a slightly slower rate. October payroll costs had risen 115 percent in real terms between 1971 and 1985, from $129,119,000 to $277,285,000 in constant 1971 dollars. 35 Higher manpower costs thereby account for much of the increase in the real cost of operating correctional facilities during that period.
Changes in capital spending are explained by a different dynamic. In the late 1960s and early 1970s, the combined state and federal prison population was stable, having declined from the 1961 peak of 220,000 prisoners. During the mid-1980s, in contrast, prisoner populations were swelling at a fast clip, and money was needed to build or acquire tens of thousands of new cells each year.
THE IMPACT OF LITIGATION ON CAPITAL SPENDING AND OPERATING COSTS
Capital spending was also spurred by court orders to improve conditions in prisons and jails and to relieve overcrowding. Precisely how much more costly correctional services have become as a result of judicial intervention is not known in the aggregate, but we have some indications. Harriman and Straussman examined spending for capital and agency operations in 14 state prison systems that were ordered by the courts to improve conditions prior to 1979. They found marked increases in capital spending in 12 of the 14 in the years following imposition of the order, above and beyond what would have been required to accommodate larger inmate populations at the levels of service that prevailed before the orders. The increase in annual capital expenditures per state prisoner during the third through fifth years fl)llowing the court order averaged 164 percent.36 (Wyoming increased its per-prisoner capital expenditure by 744 percent.) The 14 states as a group had significa'.ltly more ambitious plans on the drawing L-Jards in 1979 than were found in other states that were not laboring under a court order at that time.
Operating costs also increased, although Harriman and Straussman measured this increase not in per-capita terms but in the proportion of total state operating expenditures dedicated to state prisons. During the third through fifth years following the courts' decisions, state prison budgets represented an average of 10.7 percent of the total states' budgets for operations, an increase of 7.1 percent, on average, over budgets adopted during the five years before the decisions came
35Payrolls, in constant dollars, did not rise as high as the number of workers. Adjusting for inflation, the average per-capita payroll cost in October 1985 was 4 percent less than that in 1971. This means that the correctional workers' pay raises did not keep ahead of inflation during this period. (Computed from data in U.s. Department of Justice, Bureau of Justice Statistics, Justice Expenditure and Employment in the United States, 1971-79, Washington, D.C.: U.S. Government Printing Office, 1984, Table 7, p. 41; and "Justice Expenditure and Employment Final Report, 1985," Table 4, p. 3.
36Computed from data in Linda Harriman and Jeffrey D. Straussman, "Do Judges Determine Budget Decisions? Federal Court Decisions in Prison Reform and State Spending for Corrections," Public Administration Review, 43, 1983, Table 1.
16 DOUGLAS C. McDONALD
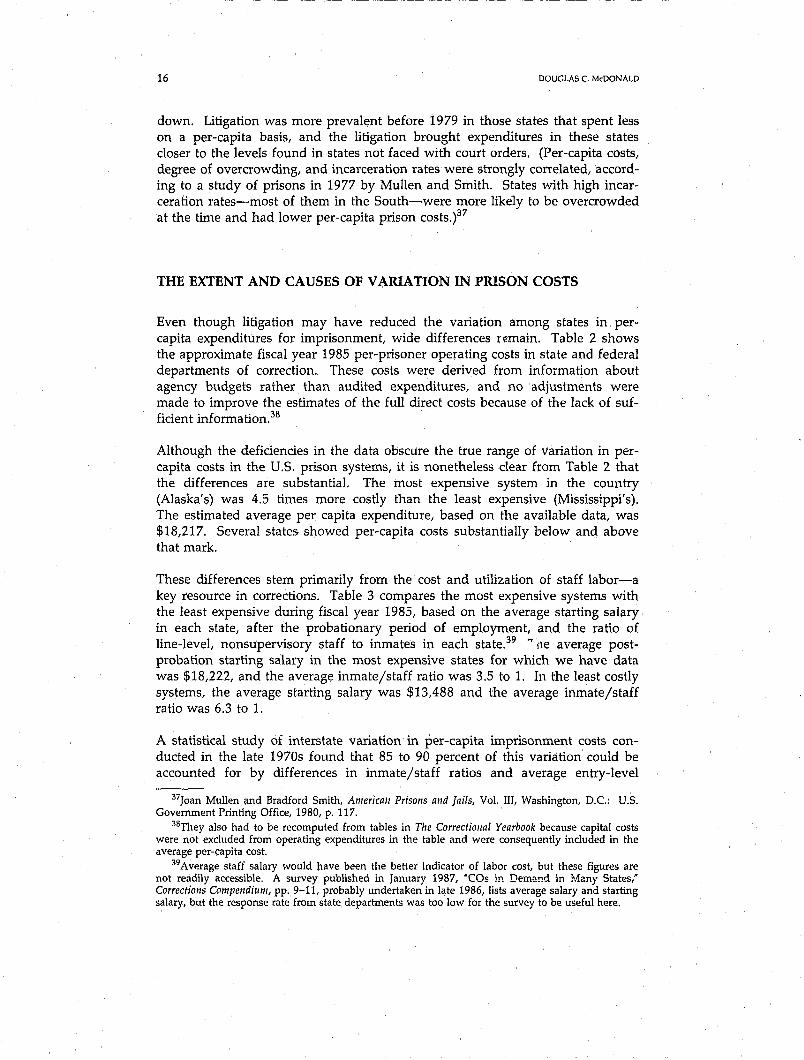
down. Litigation was more prevalent before 1979 in those states that spent less on a per-capita basis, and the litigation brought expenditures in these states closer to the levels found in states not faced with court orders. (Per-capita costs, degree of overcrowding, and incarceration rates were strongly correlated, according to a study of prisons in 1977 by Mullen and Smith. States with high incarceration rates-most of them in the South-were more likely to be overcrowded at the time and had lower per-capita prison costs.)37
THE EXTENT AND CAUSES OF VARIATION IN PRISON COSTS
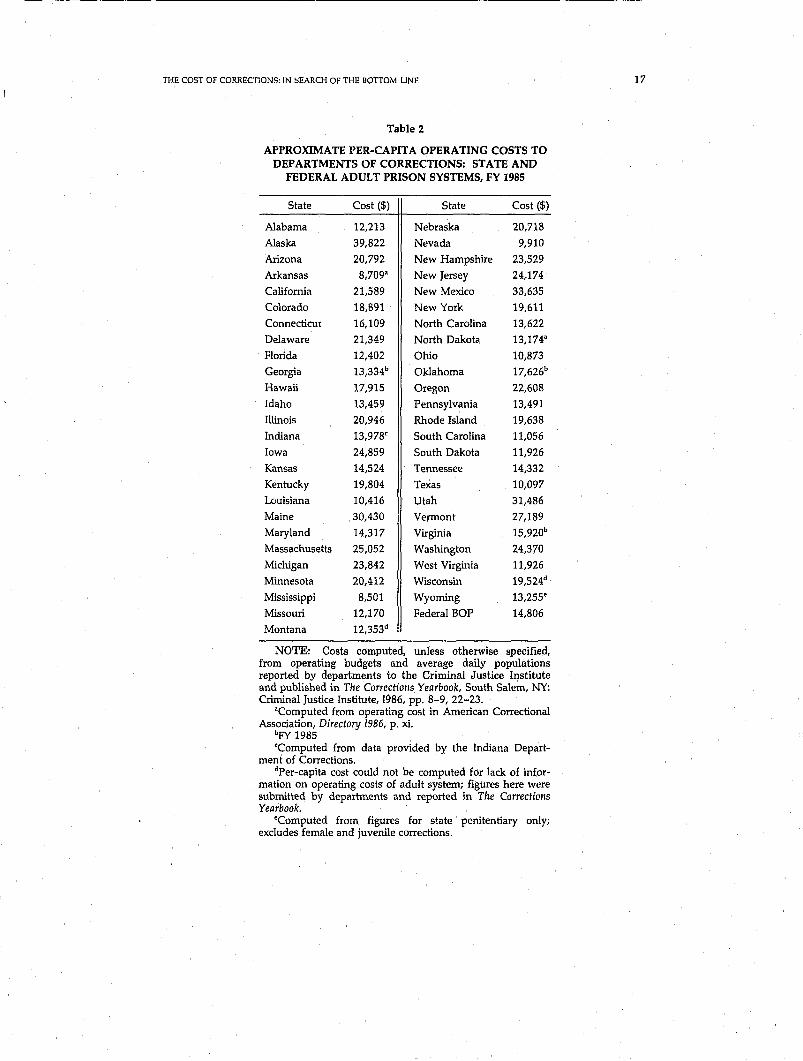
Even though litigation may have reduced the variation among states in percapita expenditures for imprisonment, wide differences rf!main. Table 2 shows the approximate fiscal year 1985 per-prisoner operating costs in state and federal departments of correction. These costs were derived from information about agency budgets rather than audited expenditures, and no adjustments were made to improve the estimates of the full direct costs because of the lack of sufficient information.3B
Although the deficiencies in the data obscure the true range of variation in percapita costs in the U.S. prison systems, it is nonetheless clear from Table 2 that the differences are substantial. The most expensive system in the country (Alaska's) was 4.5 times more costly than the least expensive (Mississippi's). The estimated average per capita expenditure, based on the available data, was $18,217. Several states showed per-capita costs substantially below and above that mark.
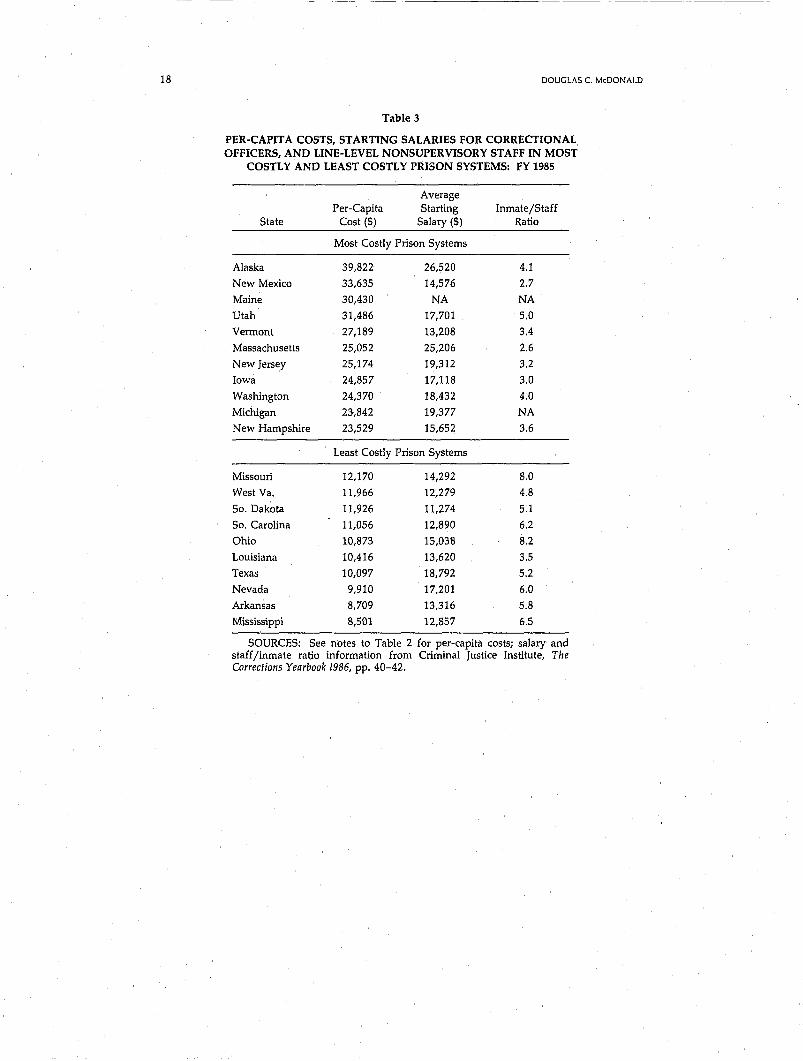
These differences stem primarily from the cost and utilization of staff labor-a key resource in corrections. Table 3 compares the most expensive systems with the least expensive during fiscal year 1985, based on the average starting salary in each state, after the probationary period of employment, and the ratio of line-level, nonsupervisory staff to inmates in each state.39 .... fie average postprobation starting salary in the most expensive states for which we have data was $18,222, and the average inmate/staff ratio was 3.5 to 1. In the least costly systems, the average starting salary was $13,488 and the average inmate/staff ratio was 6.3 to 1.
A statistical study of interstate variation in per-capita imprisonment costs conducted in the late 1970s found that 85 to 90 percent of this variation could be accounted for by differences in inmate/staff ratios and average entry-level
37Joan Mullen and Bradford Smith, American Prisons and Jails, Vol. III, Washington, D.C.: U.S. Government Printing Office, 1980, p. 117.
38They also had to be recomputed from tables in The Correctional Yearbook because capital costs were not excluded from operating expenditures in the table and were consequently included in the average per-capita cost.
39 Average staff salary would have been the better indicator of labor cost, but these figures are not readily accessible. A survey published in January 1987, "COs in Demand in t-.1any States,' Corrections C(lmpendium, pp. 9-11, probably undertaken in late 1986, lists average salary and starting salary, but the response rate from state departments was too low for the survey to be useful here.
THE COST OF CORRECTIONS: IN SEARCH OF THE BOTTOM LINE
Table 2
APPROXIMATE PER-CAPITA OPERATING COSTS TO DEPARTMENTS OF CORRECTIONS: STATE AND
FEDERAL ADULT PRISON SYSTEMS, FY 1985
State Cost ($) State Cost ($)
Alabama 12,213 Nebraska 20,718
Alaska 39,822 Nevada 9,910
Arizona 20,792 New Hampshire 23,529
Arkansas 8,709" New Jersey 24 .. 174
California 21,589 New Mexico 33,635
Colorado 18,891 New York 19,611
Connecticut 16,109 North Carolina 13,622
Delaware 21,349 North Dakota 13,174'
Florida 12,402 Ohio 10,873
Georgia 13,334b Oklahoma 17,626b
Hawaii )'7,915 Oregon 22,608
Idaho 13,459 Pennsylvania 13,491
Illinois 20,946 Rhode Island 19,638
Indiana 13,978< South Carolina 11,056
Iowa 24,859 South Dakota 11,926
Kansas 14,524 Tennessee 14,332
Kentucky 19,804 Texas 10,097
Louisiana 10,416 Utah 31,486
Maine 30,430 Vermont 27,189
Maryland 14,317 Virginia 15,920b
Massachusetts 25,052 Washington 24,370
Michigan 23,842 West Virginia 11,926
Minnesota 20,412 Wisconsin 19,524d
Mississippi 8,501 Wyoming 13,255"
Missouri 12,170 Federal BOP 14,806
Montana 12,353d
NOTE: Costs computed, unless otherwise specified, from operating budgets !iIld average daily populations reported by departments to the Criminal Justice Institute and published in The Corrections Yearbook, South Salem, NY: Criminal Justice Institute, 1986, pp. 8-9, 22-23.
"Computed from operating cost in American Correctional Association, Directory 1986, p. xi.
bpy 1985 <Computed from data provided by the Indiana Depart
ment of Corrections. dper-capita cost could not be computed for lack of infor
mation on operating costs of adult system; figures here were submitted by departments and reported in The Corrections Yearbook.
·Computed from figures for state penitentiary only; excludes female and juvenile corrections.
17
18
---------------------------------
DOUGLAS C. McDONALD
Table 3
PER-CAPITA COSTS, STARTING SALARIES FOR CORRECTIONAL OFFICERS, AND LINE-LEVEL NONSUPERVISORY STAFF IN MOST
COSTLY AND LEAST COSTLY PRISON SYSTEMS; FY 1985
Average Per-Capita Starting Inmate/Staff
State Cost ($) Salary ($) Ratio
Most Costly Prison Systems
Alaska 39,822 26,520 4.1
New Mexico 33,635 14,576 2.7
Maine 30,430 NA NA
Utah 31,486 17,701 5.0
Vermont 27,189 13,208 3.4
Massachusetts 25,052 25,206 2.6
New Jersey 25,174 19,312 3.2
Iowa 24,857 17,118 3.0
Washington 24,370 18,432 4.0
Michigan 23,842 19,377 NA
New Hampshire 23,529 15,652 3.6
Least Costly Prison Systems
Missouri 12,170 14,292 8.0
West Va. 11,966 12,279 4.8
So. Dakota 11,926 11,274 5.1
So. Carolina 11,056 12,890 6.2
Ohio 10,873 15,038 8.2
Louisiana 10,416 13,620 3.5
Texas 10,097 18,792 5.2
Nevada 9,910 17,201 6.0
Arkansas 8,709 13,316 5.8
Mississippi 8,501 12,857 6.5
SOURCES: See notes to Table 2 for per-capita costs; salary and staff/inmate ratio information from Criminal Justice Institute, The Corrections Yearbook /986, pp. 40-42.
THE COST OF CORRECTIONS: IN SEARCH OF THE BOTTOM LINE 19
salary.4o Whether this relationship still holds so powerfu11y has not been tested, although it is likely that the findings would be similar.
COST V ARIA TION WITHIN A SYSTEM: IS THERE AN OPTIMAL SIZE FOR FACILITIES?
Costs also vary substantially from one facility to another within a single prison system. These differences are clearly related to many of the same features that produce differences among state systems. In a study of fiscal year 1978 costs in New York State's prison system, which had 32 facilities at the time, McDonald found that larger prisons were less expensive on a per-prisoner basis, on average, than smaller ones. In addition, the average per-capita cost of operating maximum-security prisons was lower than the cost of minimum-security camps, which in turn were less expensive than medium-security facilities. Communitybased work-release facilities were the most expensive to operate that year, on the whole. These cost differences resulted in large part from variations in the way each type of facility was staffed. Maximum-security prisons were larger, on average, and had fewer staff persons for each inmate than other facilities. As the staff/inmate ratio increased, so did cost.41
Examining cost variation among different types of facilities within a single system raises an interesting question: Is a prison of a particular size more costeffective than others? The unit cost of a wide variety of goods and services produced by private firms decreases as output grows, up to a certain level of production, and then begins to increase. In other words, increasing output permits a firm to achieve economies of scale up to the point where the cost per unit stabilizes. The finding that larger prisons are cheaper on an average per-capita basis suggests that economies of scale can also be achieved in the provision of correctional services. Is there an optimal size for a prison, from the point of view of operational costs?
Because prisons differ from one another in a variety of important ways in addition to population size, this question cannot be answered unless one holds constant the effects of all dimensions except for size and cost. One early attempt to do this was Block's application in 1976 of microeconomic theory to data on California prisons and jails. He found some evidence that unit costs varied according to the size of the prisoner popUlation when several other features of prisons were held constant. He recognized, however, that his analysis was extremely tentative and that the findings were only suggestive.42 In their 1984 study, Schmidt and Witte analyzed facilities in the Federal Bureau of Prisons and
40MuJlen and Smith, American Prisons and Jails, p. 369. 41McDonald, The Price of Punishment, pp. 17-23. Depreciation qnd the interest portion of debt
service charges were not included in the computations of costs. Had they been, the operating costs of maximum-security facilities would have been somewhat higher, and the gap between them and the cost of other facilities wider.
42Michael K. Block, Cost, Scale Ecollomies, alld Other Economic Concepts, Washington, D.C.: Correctional Economics Center, American Bar Association, 1976.
20 DOUGLAS C. McDONALD
concluded that "prisons are cheapest to run when they are quite large but not behemoth.,,43 The statistical tests they applied to cost and program data revealed tha~ the cost per capita decreased as a function of population size until the number of prisoners reached about 900. Above 1,300 prisoners, per-capita costs began to increase. Schmidt and Witte concluded, therefore, that the optimal size for a prison, from the perspective of cost, is one that houses between 700 and 1,500 inmates. Moreover, their findings indicated that percapita costs are lower, other things being equal, if inmates are given relatively ample 1iving space, are housed in single cells, and have fewer sanitary facilities available. These data support the notion that it is not cost-effective to squeeze more prisoners into smaller spaces (probably because staffing costs will rise in these circumstances). The authors indicate that prisons of the commonly preferred size, i.e., holding approXimately 500 persons, will be less efficient than larger-sized ones, but they also recognize that such prisons may be desirable for reasons other than pure cost-based efficiency.44 These studies raise important questions that are not fully answered, because the logic of the analyses-using rnicroeconomic theories of profit-seeking firms to understand public agenciesinvolves taking some large leaps. Rather than accepting the finding that 700- to l,SOO-bed facilities are more cost-efficient in all systems and adopting this as a design principle, corrections policymakers should undertake similar studies of other systems to clarify the relationship between size and cost.
THE COSTS OF IMPRISONING ADDITIONAL PEOPLE AND SAVINGS FROM DECARCERATING OTHERS
A related matter that deserves systematic research, and one that is now poorly understood, is the marginal cost of imprisoning additional persons and the marginal "avings of imprisoning fewer. (Also poorly understood are marginal costs and savings of all types of correctional services, institutional and noninstitutional.) Estimates of these marginal costs are frequently computed to quantify the implications of changing policies. The most common method of such calculation is to determine the average annual or per diem operating cost of incarceration in the facility or system in question and then multiply this cost by the number of beds needed or not needed. Even if it were possible to determine the actual direct operating cost of a facility, this method would yield gross overestimates of costs or savings. Many costs are quite fixed and vary little with changes in inmate population. For exampie, adding ten, fifty, or even a hundred inmates to a medium-sized prison generally requires no larger adminstrative and support staff. The cost of equipment, for example, remains relatively fixed. But other costs, e.g., those of food, medicines, and personal effects, vary more directly with changes in popUlation levels. Because so many of the costs of imprisonment are relatively fixed, the cost of adding additional prisoners is actually much less than the average cost per prisoner in a facility. The same
43Peter Schmidt and Ann D. Witte, An Economic Analysis of Crime and Justice, Orlando, Fla.: Academic Press, Inc., 1984, p. 355.
44Ibid., pp. 357-363.
-~-~~ ------ ~- ---
THE COST OF CORRECTIONS: IN SEARCH OF THE BOTTOM LINE 21
holds for the reverse dynamic: The marginal savings incurred by not incarcerating or decarcerating prisoners is much less than the average cost.
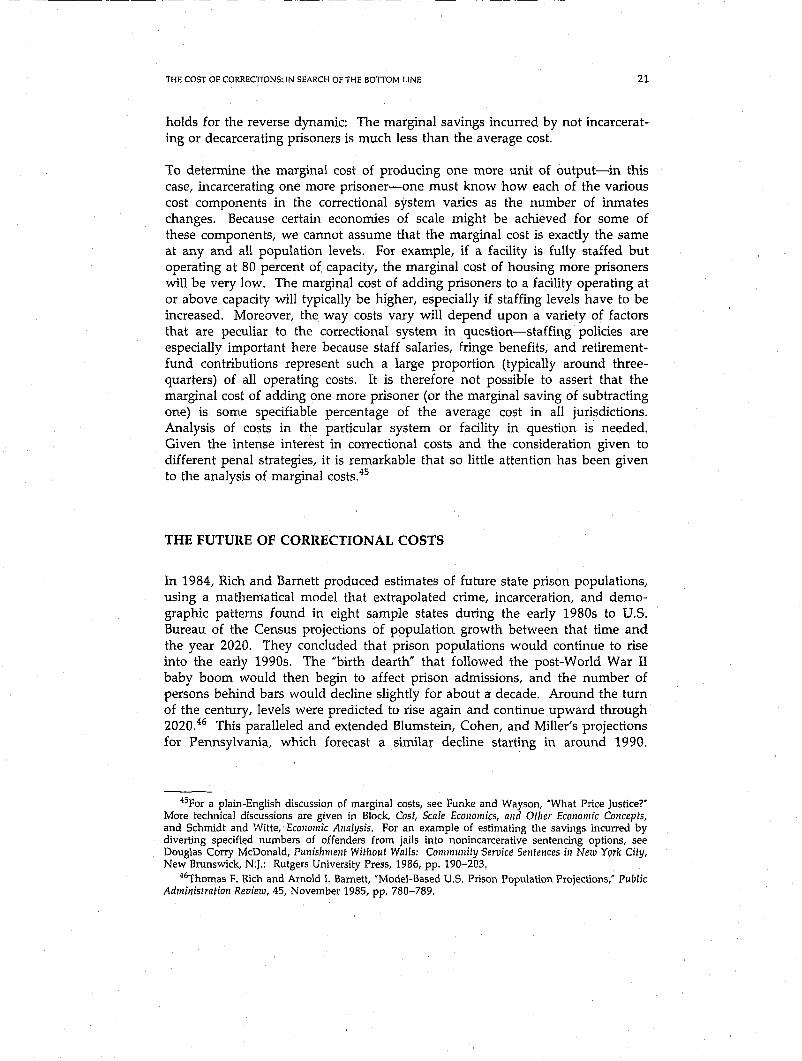
To determine the marginal cost of producing one more unit of output-in this case, incarcerating one more prisoner-one must know how each of the various cost components in the correctional system varies as the number of inmates changes. Because certain economies of scale might be achieved for some of these components, we cannot assume that the marginal cost is exactly the same at any and all population levels. For example, if a facility is fully staffed but operating at 80 percent of capacity, the marginal cost of housing more prisoners will be very low. The marginal cost of adding prisoners to a facility operating at or above capacity will typically be higher, especially if staffing levels have to be increased. Moreover, the way costs vary will depend upon a variety of factors that are peculiar to the correctional system in question-staffing policies are especially important here because staff salaries, fringe benefits, and retirementfund contributions represent such a large proportion (typically around threequarters) of all operating costs. It is therefore not possible to assert that the marginal cost of adding one more prisoner (or the marginal saving of subtracting one) is some specifiable percentage of the average cost in all jurisdictions. Analysis of costs in the particular system or facility in question is needed. Given the intense interest in correctional costs and the consideration given to different penal strategies, it is remarkable that so little attention has been given to the analysis of marginal costS.45
THE FUTURE OF CORRECTIONAL COSTS
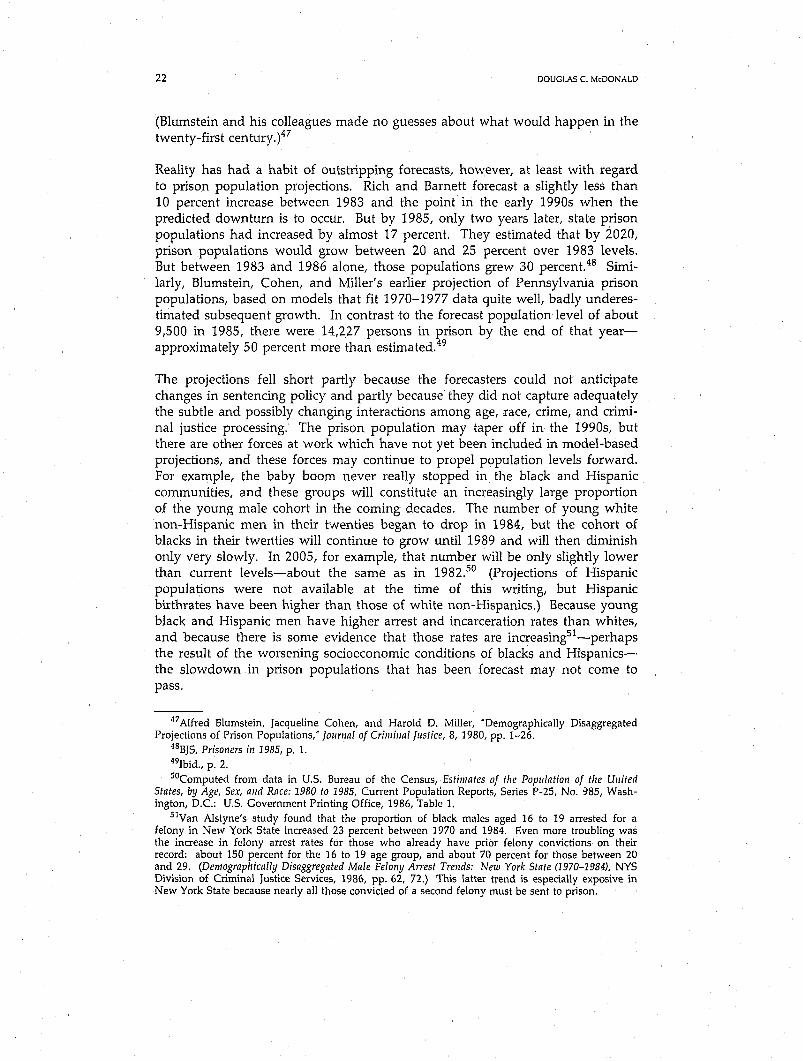
In 1984, Rich and Barnett produced estimates of future state prison populations, using a mathematical model that extrapolated crime, incarceration, and demographic patterns found in eight sample states during the early 1980s to U.S. Bureau of the Census projections of population growth between that time and the year 2020. They concluded that prison populations would continue to rise into the early 1990s. The Hbirth dearth" that followed the post-World War II baby boom would then begin to affect prison admissions, and the number of persons behind bars would decline slightly for about a decade. Around the turn of the century, levels were predicted to rise again and continue upward through 2020.46 This paralleled and extended Blumstein, Cohen, and Miller's projections for Pennsylvania, which forecast a similar decline starting in around 1990.
45For a plain-English discussion of marginal costs, see Funke and Wayson, 'What Price Justice?' More technical discussions are given in Block, Cost, Scale Economics, and Otller Economic Concepts, and Schmidt and Witte, Economic Analysis. For an example of estimating the savings incurred by diverting specified numbers of offenders from jails into nonincarcerative sentencing options, see Douglas Corry McDonald, Punishment Without Walls: Community Service Sentences in New York City, New Brunswick, N.J.: Rutgers University Press, 1986, pp. 190-2Q3.
46Thomas F. Rich and Arnold 1. Barnett, "Model-Based U.S. Prison Population Projections,' Public Administration Review, 45, November 1985, pp. 780-789.
22 DOUGLAS C. McDONALD
(Blumstein and his colleagues made no guesses about what would happen in the twenty-first century.)47
Reality has had a habit of outstripping forecasts, however, at least with regard to prison population projections. Rich and Barnett forecast a slightly less than 10 percent increase between 1983 and the point in the early 1990s when the predicted downturn is to occur. But by 1985, only two years later, state prison populations had increased by almost 17 percent. They estimated that by 2020, prison populations would grow between 20 and 25 percent over 1983 levels. But between 1983 and 1986 alone, those populations grew 30 percent.48 Similarly, Blumstein, Cohen, and Miller's earlier projection of Pennsylvania prison populations, based on models that fit 1970-1977 data quite well, badly underestimated subsequent growth. In contrast to the forecast population level of about 9,500 in 1985, there were 14,227 persons in prison by the end of that yearapproximately 50 percent more than estimated.49
The projections fell short partly because the forecasters could not anticipate changes in sentencing policy and partly because they did not capture adequately the subtle and possibly changing interactions among age, race, crime, and criminal justice processing. The prison population may taper off in the 1990s, but there are other forces at work which have not yet been included in model-based projections, and these forces may continue to propel population levels forward. For example, the baby boom never really stopped in the black and Hispanic communities, and these groups will constitute an increasingly large proportion of the young male cohort in the coming decades. The number of young white non-Hispanic men in their twenties began to drop in 1984, but the cohort of blacks in their twenties will continue to grow until 1989 and will then diminish only very slowly. In 2005, for example, that number will be only slightly lower than current levels-about the same as in 1982.50 (Projections of Hispanic populations were not available at the time of this writing, but Hispanic birthrates have been higher than those of white non-Hispanics.) Because young black and Hispanic men have higher arrest and incarceration rates than whites, and because there is some evidence that those rates are increasing51-perhaps the result of the worsening socioeconomic conditions of blacks and Hispanicsthe slowdown in prison populations that has been forecast may not come to pass.
47 Alfred Blumstein, Jacqueline Cohen, and Harold D. Miller, 'Demographically Disaggregated Projections of Prison Populations," joumal of Criminal Justice, 8, 1980, pp. 1-26.
48BJS, Prisoners in 1985, p. 1. 49Ibid., p. 2. sOComputed from data in U.s. Bureau of the Census, Estimates of the Population of the United
States, by Age, Sex, and Race: 1980 to 1985, Current Population Reports, Series P-25, No. 985, Washington, D.C.: U.s. Government Printing Office, 1986, Table 1.
51Van Alstyne's study found that the proportion of black males aged 16 to 19 arrested for a felony in New York State increased 23 percent between 1970 and 1984. Even more troubling was the increase in felony arrest rates for those who already have prior felony convictions on their record: about 150 percent for the 16 to 19 age group, and about 70 percent for those between 20 and 29. (Demographically Disaggregated Male Felony Arrest Trends: New York State (1970-1984), NYS Division of Criminal Justice Services, 1986, pp. 62, 72.) This latter trend is especially exposive in New York State because nearly all those convicted of a second felony must be sent to prison.

THE COST OF CORRECTIONS: IN SEARCH OF THE BOTTOM LINE 23
It is not difficult to imagine the U.S. prison population doubling in the next ten years. The current. rates of growth are pointing in that direction. Without significant changes in sentencing policies, the demand for prison and jail cells will continue to rise. If the prison population doubles, state and federal governments will have to construct in short order as many cells as now exist to handle the demand, to say nothing of replacing outworn or substandard facilities. The cost of this construction, based on a reported average cost per bed of $51,000, will be approximately $26 billion in constant 1986 dollars, exclusive of financing charges, for p11sons alone.52
Jail populations have also been rIsmg quickly: Between 1978 and 1985-the most recent years for which data are available-the number of persons held in jail has been increasing at an average of 8.8 percent per year. 53 Jail populations will also double in a little more than a decade, if this rate continues. Assuming again an average construction cost of nearly $49,000 per bed, doubling the size of America's jail capacity would cost approximately $12 billion in constant 1986 dollars. The cost of operating both jails and prisons would thus probably be about double the current cost, in constant 1986 dollars.
These estimates assume no upgrading of existing facilities. Unfortunately, a large proportion of the existing correctional facilities do not meet accepted standards and are in need of capital improvement. A Bureau of Justice Statistics survey found that 62 percent of all inmates housed in state prisons were being held in units smaller than 60 square feet, the American Correctional Association (ACA) minimum standard.54 If new cells were built for all these inmates at the average cost of construction that prevailed in 1985 (as reported in The Corrections Yearbook), the total capital expenditure required would be about $11 billion constant 1985 dollars, exclusive of financing costs and perhaps such additional costs as those of site acquisition and development. This is, admittedly, a very rough estimate, but it is probably in the ballpark. Although we cannot calculate similar estimates for jails because we lack recent data on space utilization, it would be reasonable to assume that a very large proportion of all jails fall short of ACA standards and that the costs to remedy conditions would be counted in billions of dollars as well.
FOOTING THE BILL
Given these conditions, correctional administrators will find themselves in an increasingly tight bind, and the dilemma facing legislators will become sharper. State and local revenues are not increasing quickly enough to pay for these kinds of increases without other services being sacrificed.
52Average cost per bed computed using data in Corrections Compendium, February 1988, p. 8. 53Bureau of Justice Statistics, Jail Inmates, 1985, Washington, D.C.: U.S. Department of Justice;
1978 data from B]S, Jail Inmates, 1984. 54Population Density in State Prisons, Washington, D.C.: U.S. Department of Justice, 1986, Table
5, p. 4.
24 DOUGLAS C. McDONALD
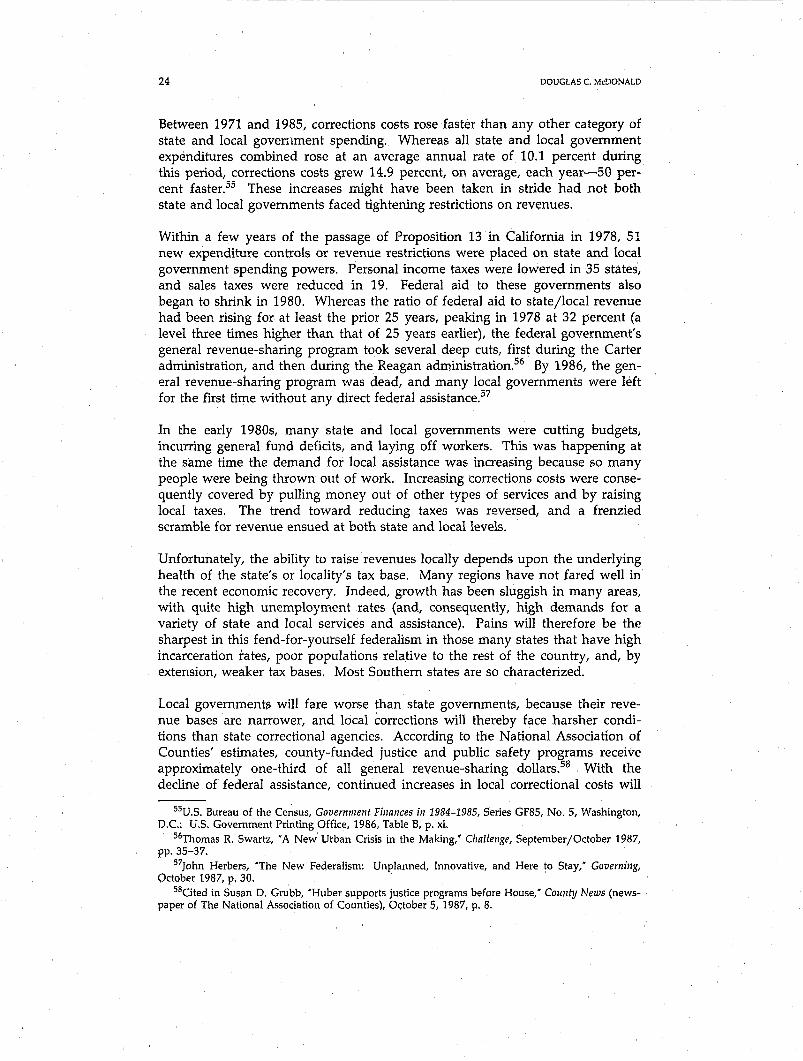
Between 1971 and 1985, corrections costs rose faster than any other category of state and local govenlment spending. Whereas all state and local government expenditures combined rose at an average annual rate of 10.1 percent during this period, corrections costs grew 14.9 percent, on average, each year-50 percent faster. 55 These increases might have been taken in stride had not both state and local governments faced tightening restrictions on revenues.
Within a few years of the passage of Proposition 13 in California in 1978, 51 new expenditure controls or revenue restrictions were placed on state and local government spending powers. Personal income taxes were lowered in 35 states, and sales taxes were reduced in 19. Federal aid to these governments also began to shrink in 1980. Whereas the ratio of federal aid to state/local revenue had been rising for at least the prior 25 years, peaking in 1978 at 32 percent (a level three times higher than that of 25 years earlier), the federal government's general revenue-sharing program took several deep cuts, first during the Carter administration, and then during the Reagan administration.56 By 1986, the general revenue-sharing program was dead, and many local governments were left for the first time without any direct federal assistance.57
In the early 1980s, many state and local governments were cutting budgets, incurring general fund deficits, and laying off workers. This was happening at the same time the demand for local assistance was increasing because so many people were being thrown out of work. Increasing corrections costs were consequently covered by pulling money out of other types of services and by raising local taxes. The trend toward reducing taxes was reversed, and a frenzied scramble for revenue ensued at both state and local levels.
Unfortunately, the ability to raise revenues locally depends upon the underlying health of the state's or locality's tax base. Many regions have not fared well in the recent economic recovery. Indeed, growth has been sluggish in many areas, with quite high unemployment rates (and, consequently, high demands for a variety of state and local services and assistance). Pains will therefore be the sharpest in this fend-for-yourself federalism in those many states that have high incarceration rates, poor populations relative to the rest of the country, and, by extension, weaker tax bases. Most Southern states are so characterized.
Local governments will fare worse than state governments, because their revenue bases are narrower, and local corrections will thereby face harsher conditions than state correctional agencies. According to the National Association of Counties' estimates, county-funded justice and public safety programs receive approximately one-third of all general revenue-sharing dollars.58 With the decline of federal assistance, continued increases in local correctional costs will
55U.S. Bureau of the Census, Government Finances in 1984-1985, Series GF85, No.5, Washington, D.C.: U.S. Government Printing Office, 1986, Table B, p. xi.
56Thomas R. Swartz, • A New Urban Crisis in the Making," Challenge, September/October 1987, pp.35-37.
57John Herbers, "The New Federalism: Unplanned, Innovative, and Here to Stay,' Governing, October 1987, p. 30.
58Cited in Susan D. Grubb, "Huber supports justice programs before House,' County News (newspaper of The National Association of Counties), October 5, 1987, p. 8.
THE COST OF CORRECTIONS: IN SEARCH OF THE BOTTOM LINE 25
have to be covered by cuts in other services or parallel increases in tax revenues, or both. In the poorer states, the limits on raising tax revenues are such that increased corrections spending will probably come at the expense of other services.
Barring dramatic reversals, corrections administrators will have to attend even more to the task of cost management, and legislators will have more difficult choices to make. It would seem that having more accurate information about costs, better reporting systems, and accounting methods better oriented to cost analysis in the public sector would be welcome, and perhaps even imperative, if corrections managers are to make intelligent decisions about how scarce resources should best be used.