I STUDY AND DEVELOPMENT OF NONDESTRUCTIVE WELD INSPECTION TECHNIQUES · · 2017-06-27STUDY AND...
117
I I I I I I I I I I I I I I I I I I NASA CR 73,207 STUDY AND DEVELOPMENT OF NONDESTRUCTIVE WELD INSPECTION TECHNIQUES Phase I Final Report March 1968 Distribution of this report is provided in the interest of information exchange. Re- sponsibility for the contents resides in the author or organization that prepared it. Prepared under Contract NAS 2-4166 by WALTER V. STERLING, INC. Technical and Management Consultants Los Altos and Claremont, California for AMES RESEARCH CENTER NATIONAL AERONAUTICS AND SPACE ADMINISTRATION https://ntrs.nasa.gov/search.jsp?R=19680012214 2018-06-22T10:12:37+00:00Z
-
Upload
trankhuong -
Category
Documents
-
view
219 -
download
3
Transcript of I STUDY AND DEVELOPMENT OF NONDESTRUCTIVE WELD INSPECTION TECHNIQUES · · 2017-06-27STUDY AND...
I
I
I
II
II
II
II
II
II
I
II
NASA CR 73,207
STUDY AND DEVELOPMENT OF
NONDESTRUCTIVE WELD
INSPECTION TECHNIQUES
Phase I
Final Report
March 1968
Distribution of this report is provided in
the interest of information exchange. Re-
sponsibility for the contents resides in
the author or organization that prepared it.
Prepared under Contract NAS 2-4166 by
WALTER V. STERLING, INC.
Technical and Management Consultants
Los Altos and
Claremont, California
for
AMES RESEARCH CENTER
NATIONAL AERONAUTICS AND SPACE ADMINISTRATION
https://ntrs.nasa.gov/search.jsp?R=19680012214 2018-06-22T10:12:37+00:00Z
I
I
I
I
I
I
I
I
I
I
I
!
I
I
I
I
I
I
Section 1
Section 2
Section 3
Appendices
A
B
CONTENTS
- Introduction
- Summary and Conclusions
- Detailed Discussion
A. Background Study
B. Selection of Weld Attributes
for Instrumentation
C. Weld Acceptance Criteria
D. Process Control Monitoring
E. Welding Equipment Selection
F. WVS Weld Station Calibration
Techniques
G. Weld Materials Selection
H. Weld Schedule Development
I. NDT Instrumentation Development
J. Experiment Design
K. Experiment Results
References
List of Organizations and Persons Contacted
1
6
ii
ii
14
18
26
28
34
39
40
43
60
68
i •
i
II
II
I
II
II
III
I
I
II
II
I
IA
IB
2
3
4
5
6
7
8
9
i0
ii
12
13
14
15
16
17
18
19
20
21
22
23
FIGURES
Welding Electrode Configuration 50 °
Welding Electrode Configuration 70 °
Weld Strength Profile
Locations of Weld Pulse Monitoring and
Reference Leads
IR Detector Assembly
Welder Head Setdown Instrumentation
Monitoring Points
Strain Gage Output Overlay System
Bending Repeatability Investigation
Complete Welder Head NDT Instrumentation
Typical Strain Gage Calibration Curve
Pull Strength Distribution - Experiment B-7
Dynamic Setdown Distribution - Experiment B-7
Infrared Pulse Amplitude Distribution - Exper. B-7
Weld Voltage Waveform - V/Peak Value Distribution
NDT Results for 0.012" x 0.030" Nickel Ribbon -
0.025" OFHC Copper Wire Welds - Experiment B-7
Pull Strength Distribution - Experiment B-8
Dynamic Setdown Distribution - Experiment B-8
Infrared Pulse Amplitude Distribution - Exper. B-8
Weld Voltage Waveform - V/Peak Value Distribution
NDT Results for 0.012" x 0.030" Nickel Ribbon -
0.017" Gold Plated Kovar Welds - Experiment B-8
Pull Strength Distribution - Experiment B-9
Dynamic Setdown Distribution - Experiment B-9
Infrared Pulse Amplitude Distribution - Exper. B-9
Weld Voltage Waveform - V/Peak Value Distribution
NDT Results for 0.012" x 0.030" Nickel Ribbon -
0.020" Dumet - Experiment B-9
33
33
41
46
5O
55
56
58
59
70
71
72
73
75
83
84
85
86
88
96
97
98
99
i01
ii.
TABLES
I
I
I
I
I
I
I
I
II
I
I
II
II
1
2
3
5
6
7
8
Specified Weld Acceptance Criteria(Ten Sources)
Critical IR Cell Parameters
Control Group Data Summary
Experiment B-7
NDT Measurement Truth Table
Experiment B-7
Control Group Data Summary
Experiment B-8
NDT Measurement Truth Table
Experiment B-8
Control Group Data Summary
Experiment B-9
NDT Measurement Truth Table
Experlment B-9
20
49
74
77
87
91
i00
103
iii.
I
I
ISECTION 1
I
I
I
I
I
I
I
I
I
I
I
I
I
I
INTRODUCTION
This is the final report covering the
first phase of a program whose objec-
tive is the Development of Nondestruc-
tive Weld Inspection Techniques (NDT)*.
Work by Walter V. Sterling, Inc. (WVS)
on this program was initiated under
NASA/ARC contract NAS2-4166 on Feb-
ruary 27, 1967 for the purpose of
developing nondestructive test tech-
niques and the associated instrumen-
tation for use in microcircuit weld-
ing.
Our work during this initial phase
has been devoted to three major tasks.
The first of these was a study of the
existing literature relating to micro-
welding operation and evaluation tech-
niques, augmented by visits to aerospace
organizations interested in and using
wirewelding for electronic assembly.
*For simplicity, NDT is used in the remainder of the
report to mean Non Destructive Testing.
l.
I
II
I
II
I
1I
III
i
II
I
II
I
The second task was concerned with the selection of weld at-
tributes for NDT instrumentation, and the development of the
applicable instrumentation. The third task area covered all
aspects of evaluating the effectiveness of the NDT techniques
that were developed.
In this report, the complete work of Phase I is discussed in
summary form in Section 2, and provides a detailed evaluation
of the conclusions reached regarding the effectiveness of the
NDT techniques being used. Section 3 of the report presents
a detailed discussion of the complete program. Included as
appendices to the report are an NDT-related bibliography and
a list of organizations and persons contacted initially in
the program.
The perception by NASA of the need for the development of an
effective microwelding NDT system to aid in the consistent
production of good weld joints has been further substantiated
by the organizations visited. Those who were actually manu-
facturing hardware found it necessary to maintain constant
vigilance over a somewhat diverse group of product and process
attributes which they believed would control product quality.
The factors being used for control varied significantly be-
tween organizations but among them were the following common
features:
MATERIALS IDENTIFICATION AND SPECIFICATION CONTROL is
essential to component manufacturers' lead materials,
plating thicknesses, surface contamination, cleaning,
and differences in weldability of different lots of
ostensibly the same wire material.
.
!
i •
I
I
II
II
I
III
I
II
I
I
EQUIPMENT STANDARDIZATION in a production facility is
essential where different welding stations are to be
used interchangeably. This is not assured simply by
procuring and installing quantities of similar equip-
ment models from the same equipment vendor but must be
accomplished by consistent machine certification, cal-
ibration, and maintenance•
EQUIPMENT CALIBRATION AND _,_INTENANCE is required on a
periodic basis to maintain repeatability of welder per-
formance. This must include measurements of the welder
electrical output characteristics and testing of the
welding heads for welding force and follow-up perfor-
mance.
PRODUCTION OPERATION of the welding stations requires
procedures to insure use of the correct weld schedules,
frequent attention to electrode surface dressing, and
periodic pull tests on sample welds to verify total
process control.
OPERATOR TRAINING AND QUALIFICATION require unique at-
tention in that operator errors are ranked high among
the causes for producing bad welds• In addition to the
need for operator training covering the fundamentals of
good welding practices, special qualifications for ap-
plication to particular welding machine and module con-
figurations has been found important to the production
of good welds.
.
II"I
I
II
II
I
III
I
II
II
' i
VISUAL INSPECTION of welds is universally accepted as
the primary quality assurance method. To be effective,
pictures and diagrams of acceptable, as well as unac-
ceptable, welds must be used to provide a comparative
basis for acceptance. Many organizations provide
inspection training for the production line welding
operators to maintain high quality. Use is often made
of weld joint appearance characteristics derived during
the development of the weld schedules.
CONTINUING MANAGEMENT ATTENTION is essential to main-
tain a successful production welding operation. Buying
standard welding equipment and hiring capable operating
personnel are only two of the several areas requiring
management action. Examples of the span of required
management attention are:
Assuring that a system is established and fol-
lowed for producing engineering designs of con-
sistent and producible nature for the weldedmodules.
Provision for determining that these module en-
gineering designs are consistent with the capa-
bilities of the welding production facilitiesto be used.
Determination that adequate supervision, equip-
ping, and training of production personnel are
continued in the areas outlined in the preced-
ing paragraphs.
The objectives of Phase I NDT investigations have been suc-
cessfully demonstrated. The laboratory studies have been
carried out under closely controlled welding conditions with
•
I
I
II
II
II
II
II
II
II
II
common welding practice errors purposely introduced to pro-
duce faulty welds. The second phase, which is now in prog-
ress, is designed to prove the effectiveness of the NDT
system in actual production line operations. We will develop
from the Phase I NDT laboratory equipment, a prototype opera-
tion of two prototype models, and generate an evaluation test
plan for application of these prototype units on aerospace
welded module production lines.
This will be accomplished in two steps: first, prototype
models of the NDT weld evaluator will be built for produc-
tion line use, certified in our laboratories, and a produc-
tion evaluation plan developed. Then, as the second step,
these equipments will be installed on the manufacturing
lines of two major aerospace companies for objective eval-
uation in production situations.
.
II
II SECTION 2
II
I
II
III
I
II
II
II
SUMMARY AND CONCLUSIONS
A comprehensive study of the field of
wire welding technology, as it applies
to electronic circuit fabrication, has
been made in order to devise a means
for determining weld quality in a non-
destructive manner. This study has been
supported by concurrent laboratory in-
vestigations of the instrumentation tech-
niques showing the greatest promise of
providing useful nondestructive measure-
ments.
Three techniques were selected and used
in combination to form an NDT "system"
with the ability to provide consistent
and valid indications of weld quality.
This system was then subjected to a var-
ied and extensive evaluation program in
our laboratories by intentionally fabri-
cating faulty welds whose defects repre-
sented a cross-section of the most prob-
able failures resulting from machine,
.
II
iI
I
I
III
II
II
II
II
I
operator, and material deficiencies. Our conclusions from
this combined analytical, experimental, and critical evalu-
ation program are the following:
THE ABILITY TO MAKE NONDESTRUCTIVE MEASUREMENTS
OF IMPLICIT WELD QUALITY HAS BEEN CLEARLY PROVED
Bad welds have been intentionally fabricated in
numerically meaningful quantities, representing
their normal types of occurrence in tens of thou-
sands of production welds. These, together with
good welds also produced under controlled condi-
tions, have been judged "good" or "bad" by the
NDT instrumentation developed on this program and
then pull tested to determine their quality in
terms of torsional shear strength. The NDT meas-
urements have shown excellent correlation with
the established strengths for good and bad welds.
THE MEASUREMENTS PROVIDE VALUABLE INDICATIONS OF
PROCESS DRIFTS BEFORE DEFECTIVE WELDS OCCUR
A secondary result of significant value is the
sensitivity of the measured attributes to devia-
tions in welding conditions which, if continued,
will result in bad welds. Properly used, this
can supply process control information that will
prevent the occurrence of poor quality welds.
.
!
I
II
II
I
II
II
II
II
II
I
I
MEASUREMENTS OF THREE DIFFERENT ATTRIBUTES ARE
REQUIRED TO PROVIDE THE MOST PRACTICAL SYSTEM
CONSIDERING BOTH PRODUCTION HARDWARE GEOMETRY
AND INSTRUMENTATION DIFFICULTY
Based upon consideration of actual geometry of
welded circuits and welded modules, and the prac-
tical problems of instrumentation, the measure-
ment of voltage pulse, infrared radiation, and
setdown were selected for detailed laboratory
investigations• These were studied singly and
in combination, and the use of "two-out-of-three"
logic was found superior to the indications of
any individual attribute.
The initial work on this project included what
we believe was a thoroughly comprehensive study
of the applicable literature plus the actual
practices and techniques currently used by in-
dustry. Over 120 articles related to nondestruc-
tive weld testing were carefully reviewed and
visits were made to the laboratories and/or pro-
duction lines of over 20 industrial and govern-
ment organizations• The information gathered
from these sources, together with our own experi-
ence in the welding research field, provided the
basis for selecting the most promising approaches
to nondestructive measurement or testing• The
•
I
II
I
II
I
II
III
II
II
II
I
following six techniques were selected for de-
tailed consideration; the last three were chosen
for hardware implementation:
• Eddy current measurement
Weld joint resistance measurement
• Sonic and ultrasonic measurement
Weld voltage pulse monitoring
• Infrared radiation measurement
• Setdown measurement
GENERALLY ACCEPTABLE DEFINITIONS OF WELD QUALITY
DO NOT EXIST
Our survey of industry and government activities in
wirewelding disclosed that a widely varied group of
visual or "cosmetic" acceptance criteria are being
used to implicitly judge pull strength and metal-
lurgical features. Our basic premise in this regard
was that in order to be "good", a weld must satisfy
two practical conditions; namely, it must have ade-
quate electrical conductivity and adequate physical
strength, with the definition of "adequate" being
the major problem° Measurements of weld oonductivity
performed by WVS and other organizations, in the
course of investigating the NDT utility of such meas-
urements, revealed that weldment resistance was neg-
ligible when compared to circuit, component and lead
e
I
I
I
I
II
I
II
II
II
II
I
III
resistance, and lacked correlation with pull
strength. Therefore, for the purose of our
studies, a minimum weld strength limit for a
specified sample size and material combination
has been used since electrical conductivity will
always be adequate if the weld will hold together
physically. (We recognize that there may be ex-
ceptions to this in semiconductor or oxide bonds
but they have not occurred in our studies.)
i0.
II
I
I SECTION 3
I
I
II
II
II
II
I
II
I
DETAILED DISCUSSION
A. BACKGROUND STUDY
The starting point for this development pro-
gram was a thorough study of all available
background data regarding nondestructive
weld testing. _his was coupled with a series
of visits to major aerospace and government
organizations currently involved with micro-
circuit welding technology, to insure that
the most up-to-date developments would be
used as the point of departure for our work*.
Based upon the literature research, our
previous welding research studies, and con-
ferences with other organizations knowl-
edgeable in this field, the following tech-
niques were considered for more detailed
investigation.
*The results of these visits were reported in detail in our
Monthly Status Report No. 2, WVS Rpt. No. 67-5-35 and a
list of contacts made is presented in Appendix B.
ii.
I
I
II
II
II
II
II
II
I
II
II
Eddy current measurement
Weld joint resistance measurement
Sonic and ultrasonic vibration
Weld pulse monitoring
Infrared radiation measurement
Setdown measurement
Our findings regarding each of these techniques were as
follows:
I. Eddy Current Testing
Eddy current testing has been widely and effectively employed
for NDT of electrically conducting materials. In principle,
detection of some of the factors directly relevant to weld
joint quality evaluation is possible using eddy current tech-
niques. This would include voids, cracks, and some attri-
butes of metallurgical structure. However, eddy current mag-
nitudes induced in the test specimens are directly responsive
to size and geometry of the material, and position of the test
coil with respect to the material. Thus, the complexity
of the many possible weld joint forms and control of their
orientation with respect to the test coil or probe appeared
to present too great an obstacle to effective application
within the time scale of this investigation.
2. Weld Joint Resistance Testing
The concept of weld joint resistance testing is based on the
postulate that post-weld joint resistance should bear a strong
relationship to weld joint area; and that weld joint area is,
in turn, a prime determinant of weld pull strength. However,
a number of investigations (including work in our own labora-
12.
I
I
II
I
II
I
III
l
II
II
I
I
tory) have tried this approach using a variety of methods with
the general conclusion that there is no useful correlation be-
tween post-weld joint resistance and weld pull strength.
3. Sonic and Ultrasonic Vibration
The idea that a weld joint may actually be undergoing physical
stress and strain while testing with sonic or ultrasonic vibra-
tions, gives this method a unique logical appeal. It appeared
that an appropriate vibration energy excitation method coupled
with measurement of the resulting stress-strain-rate behavior,
could reflect the effects of such weld joint attributes as work
hardening and bonded area. This, in turn, could be expected to
permit direct, effective weld-by-weld correlation with pull
strength, which also is influenced directly by these kinds of
physical characteristics. While this approach appears to have
merit, most of the applications have been in the area of large
structural type welds, with much less complex structural inter-
actions than the typical electronic module. It was therefore
not selected as a primary approach for this project.
4. Pulse Monitoring, Infrared Radiation, Setdown
The remaining three techniques, weld pulse voltage monitoring,
infrared radiation, and setdown, were ultimately selected by
WVS for instrumentation, and as a consequence, these techniques
are not further discussed here, since they are examined in de-
tail in later sections.
13.
I
I
I
I B. SELECTION OF WELD ATTRIBUTES FOR INSTRUMENTATION
I
I
I
I
I
I
I
I
I
I
I
I
I
I
I
The attributes currently being used by industry for differen-
tiating "good" welds from "bad _ welds, after the production
weld is made, are primarily cosmetic -- or visual -- and sub-
ject to a wide variance in personal interpretation. In addi-
tion, those attributes of a finished weld that may be amenable
to measurement (such as eddy current loss, thermal conductiv-
ity or acoustic transmissibility) pose very difficult instru-
mentation problems because of the highly variable circuit
geometry. As a consequence, while they are considered an at-
tractive basis for the subsequent development of a post-weld
inspection method, they did not appear immediately feasible
for investigation within the scope and schedule of the pres-
ent NDT program.
It was therefore determined that weld testing, in-process,
was potentially more immediately realizable on a practicable
basis, than weld testing after-the-fact since it was evident
that measurements could readily be made of the following dy-
namic parameters occurring while the weld is being made.
WELD
PULSE
VOLTAGE
One of the factors relating to weld
quality is the variation in resistance
through the weld joint while the weld
is being made. Analysis of the weld-
ing electrical circuit revealed that
two impedance factors are of concern:
the dynamic resistance of the welds
and the impedance of the total welder
circuit, which is fixed. The welding
14.
I
Il
II
I
I
iIi
II
i
III
I
II
I
INFRARED
RADIATION
current produces a voltage drop across
the weld that is a function of weld
resistance. The nature of this volt-
age pulse appearing across the welding
electrodes during the welding cycle
could thus be indicative of weld quality.
Another welding process attribute that
appeared amenable to instrumentation was
the thermal energy of the weld. The
application of force, generation of
sufficient thermal energy at the weld
faying surface, and maintenance of
proper heat energy distribution across
the weld joint are key factors in making
a resistance weld. The short duration
high temperatures that are an essential
part of the welding process produce a
considerable yield of infrared radiation.
The presence of infrared radiation in
correct quantities or with the proper
transient "signature" appeared to pro-
vide a ready means for indirectly
measuring the thermal energy generated
during formation of a weld, which, in
turn, should relate to the weld strength
and other acceptance criteria.
15.
I
II
I
II
II
II
II
I
II
II
I
DYN_\_ I C
SETDOWN
A third weld attribute which is known to
have a measure of correlation with weld
quality* is the change in total thickness
of the two materials from pre-weld to
post-weld condition. This change, re-
ferred to as setdown, has been recognized
in welding process control documentation,
quality control requirements, and speci-
fications, as a welding attribute requiring
controlled limits. In actual practice,
the setdown limits are usually employed
as guides for visual inspection in pro-
duction welding rather than being deter-
mined from actual gage measurements.
However, earlier _,_S investigations veri-
fied the existence of higher level of
correlation between the dynamic setdown
occurring during the weld and weld qual-
ity, and also verified the practicality
of its in-process measurement.
The rationale for the selection of weld-
ing pulse waveform, infrared radiation,
and dynamic setdown for further study
and instrumentation can thus be summed
up as follows:
Laboratory investigations by _NSand others have shown usable cor-
relation between the individual
attribute parameters and subse-
quent weld quality.
*See _'_S Rpt. No. 67-7-2, Quarterly Report No. 1
16.
I
II
II
I
I
II
III
l
III
I
I
II
All three attributes can provide
dynamic in-process data.
Simultaneous instrumentation of
all three attributes is practical
and has promise of greater weld
quality revelation thanhas been
shown by the parameters taken
singly.
17.
I
I
I
IC. WELD ACCEPTANCE CRITERIA
I
I
I
I
I
I
I
I
I
I
I
!
I
I
I
In order to make the investigation of a practical approach
to NDT meaningful, the criteria for "good '_ and "bad" welds
must be adequately defined. The analytical and more sub-
jective techniques currently employed by industry are part-
ly for process control and partially to establish whether
the welded connections will perform satisfactorily under
the required environmental conditions. When considering
this latter criterion for acceptability, at least two con-
ditions must be met in order to assure a practically usable
weld:
Adequate electrical conduc-
tivity
Adequate physical strength
The definition of "adequate appeared to be the first problem
for each of these attributes; and with this in mind, the fol-
lowing discussion of acceptance criteria is presented.
1. Current Aerospace Acceptance Criteria
The acceptance criteria for a weld are generally not the same
for any two manufacturers, even though the operations may be
very similar, and it is certain that some requirements will
accept bad welds while others will reject good ones. In an
attempt to resolve the question, a representative sampling of
military and other user specifications was analyzed and the
results are discussed on the following pages.
18.
I
l
II
l
I
l
I
l
l
I
I
l
I
I
I
I
I
Bearing in mind that the minimum criterion for a "good" weld
is that it will not break in its exposure to all use environ-
ments, no visual or physical requirement is useful unless it
correlates with weld strength; further, weld strength aver-
ages are not valid for this purpose unless they also insure
positive control of minimum strength for every weld made.
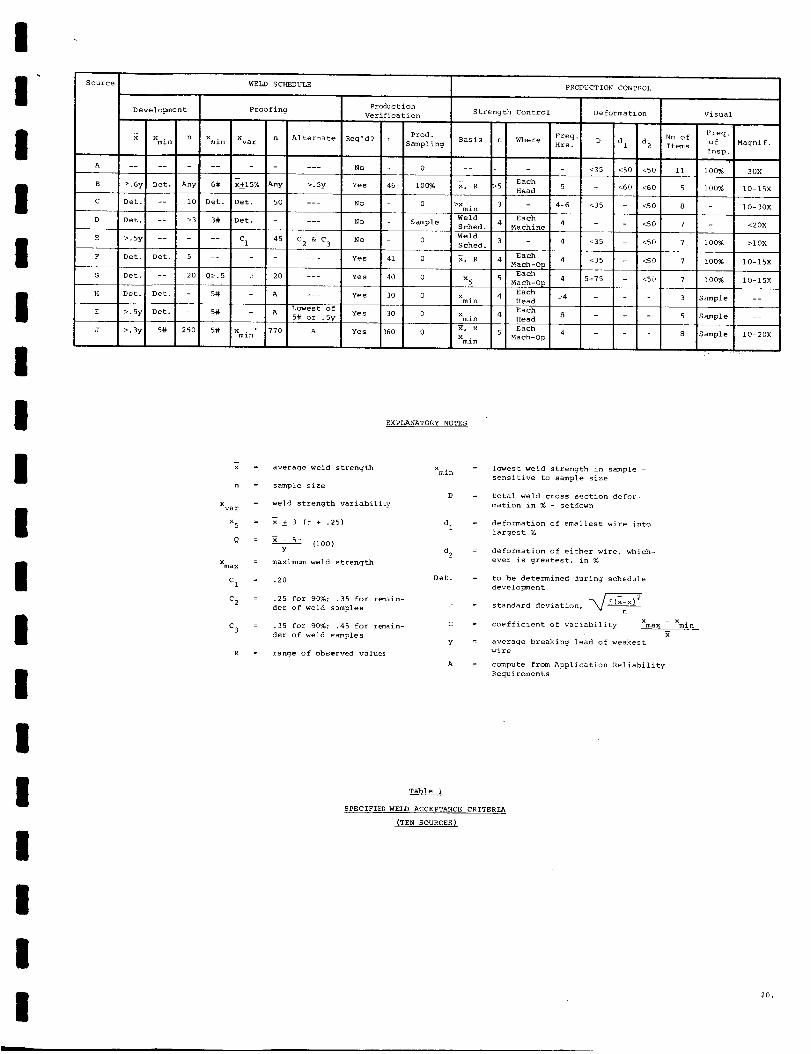
Our review of the various requirements in ten specifications
from cognizant organizations is presented in detail in Table 1
and shows the following:
Six of these specifications do not use strength
criteria in developing a weld schedule; of the
four that do, the minimum required for average
strength, x, ranges from 30% to 60% of the weak-
er wire. The sample sizes for setting the weld
schedule range from 3 to 250. Five of the speci-
fications do not specify the sample size.
Weld schedule proofing is required by eight.
This consists of an extensive confirmation of
the selected weld parameters. Four specifica-
tions have a fixed minimum weld strength. No
two specifications use even similar criteria
for the range of allowable weld strength vari-
ability.
Visual criteria are highly subjective and thus
difficult to apply because of personal inter-
pretation factors. Characteristics specified
for examination range from 3 to ii; three or-
ganizations require sampling only, five require
19.
!
i
II
I
I
II
II
III
I
II
iI
II
Source
Development
Xmi n n
A ....
B >.6y Det. Any
C Det. -- i0
D Det -- >3
E >.5y --
F Det. Det. 5
G Det. -- 20
H Det. Det.
I >.5y Det.
J >.3y 5# 250
WELD SCHEDULE
Proofing ProductionVerification
Xmi n Xva r n Alternate Req'd? n
...... No
6# _15% Any >.5y Yes 46
Det. Det. 50 --- NO
3# Det. --- NO
-- C 1 45 C 2 & C 3 NO
...... Yes 41
Q_.5 c 20 --- Yes 40
5# - A --- Yes 30
5# - A Lowest of Yes 305# or .5y
5# Xmi n 770 A Yes 360
Strength Control
PRODUCTION CONTROL
Prod.Basis
Sampling
0 --
I00_ x, R >5 i
0 >Xmi n 31
Weld
Sample Sched.
0 WeldSched.
0 _, R 4!
0 x 5 5
0 Xmi n 4
0 Xmi n 4
0 _, R 5
Xmin
n Where Freq.Hrs.
Each5
Head
4-6
Each4
Machine
4
Each4
Mach-Op
Each4
Mach-OpEach
74Head
Each8
Head
Each4
Mach-Op
Deformation
No ofD dl d2 Items
<35 <50 <50 ii
- <60 <60 5
<35 <50 8
- <50 7
<35 <50 7
<35 <50 7
5-75 <50 7
- 3
- 5
- 8
EXPLANATORY NOTES
n
Xva r
x 5
Q
Xmax
C 1
C 2
C 3
R
average weld strength
sample size
weld strength variability
± 3 (_ + .25)
(100)y
maximum weld strength
.20
.25 for 90%; .35 for remain-
der of weld samples
.35 for 90%; .45 for remain-
der of weld samples
range of observed va]ues
Xmi n
D
d 1
d 2
Det.
r
C
Y
A
lowest weld strength in sample -
sensitive to sample size
total weld cross section defor-
mation in % - setdown
deformation of smallest wire into
largest
deformation of either wire, which-
ever is greatest, in %
to be determined during schedule
development
standard deviation, _ ?(_-x)2n
coefficient of variability Xmax - Xmin
average breaking lead of weakest
wire
compute from Application Reliability
Requirements
Table 1
SPECIFIED WELD ACCEPTANCE CRITERIA
(TEN SOURCES)
Visual
Freq.
of Magnif.
Insp.
lO0% 30X
100% lO-15x
- IO-30X
- <20X
100% >10X
100% 10-15X
100% IO-15X
Sample --
Sample --
Sample 10-20X
20.
I
I
I
I
I
I
I
I
I
I
I
I
I
I
I
I
I
I
I
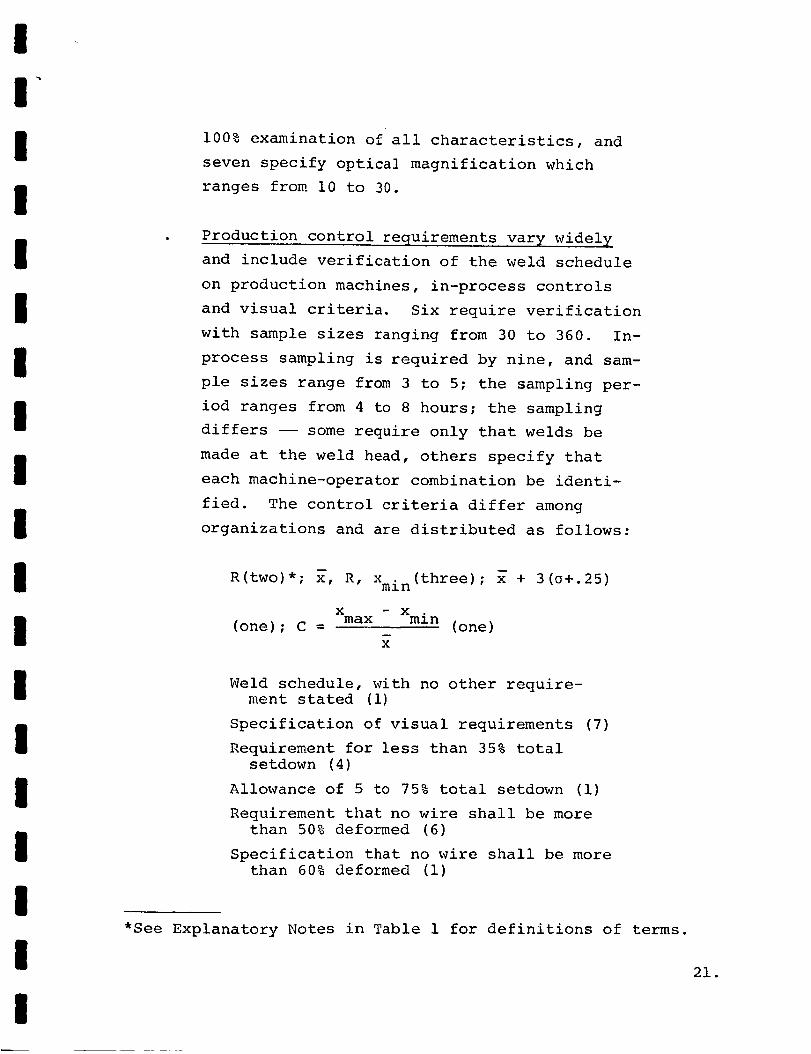
100% examination of all characteristics, and
seven specify optical magnification which
ranges from i0 to 30.
Production control requirements vary widely
and include verification of the weld schedule
on production machines, in-process controls
and visual criteria. Six require verification
with sample sizes ranging from 30 to 360. In-
process sampling is required by nine, and sam-
ple sizes range from 3 to 5; the sampling per-
iod ranges from 4 to 8 hours; the sampling
differs -- some require only that welds be
made at the weld head, others specify that
each machine-operator combination be identi-
fied. The control criteria differ among
organizations and are distributed as follows:
R(two)*; x, R, Xmin(three) ; x + 3(_+.25)
x - x
(one) ; C = max min (one)o
x
Weld schedule, with no other require-ment stated (i)
Specification of visual requirements (7)
Requirement for less than 35% total
setdown (4)
Allowance of 5 to 75% total setdown (I)
Requirement that no wire shall be more
than 50% deformed (6)
Specification that no wire shall be more
than 60% deformed (I)
*See Explanatory Notes in Table 1 for definitions of terms.
21.
II
I
II
I
II
III
II
II
I
II
I
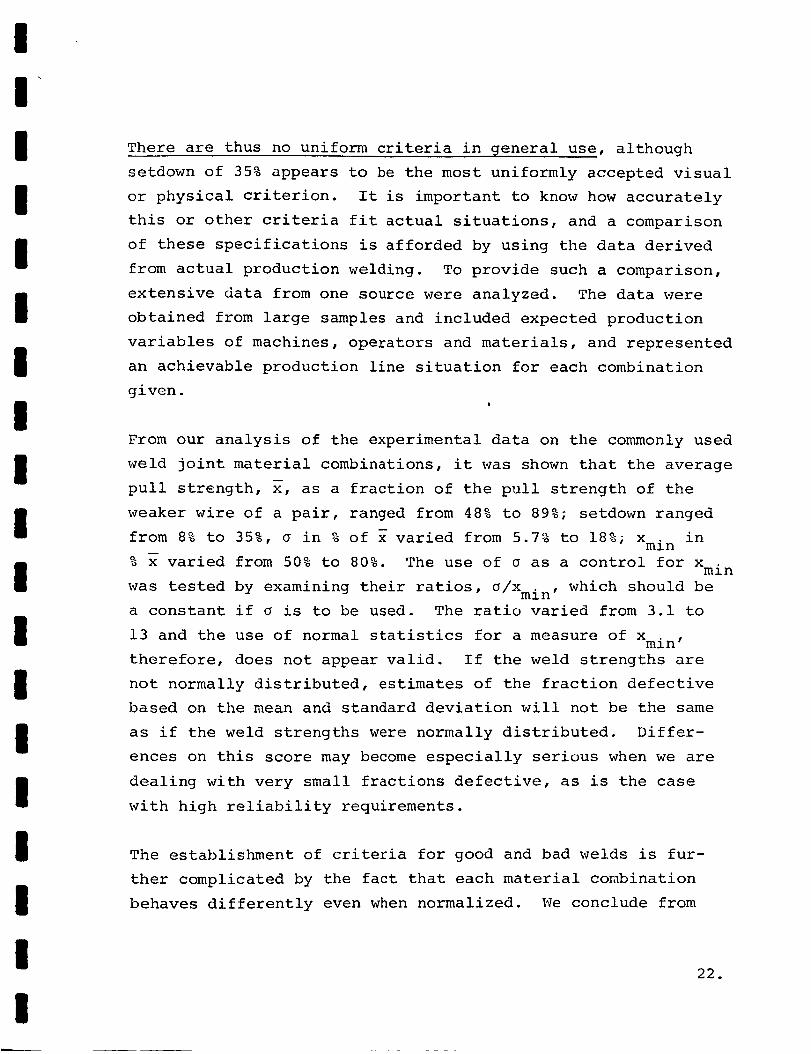
There are thus no uniform criteria in @eneral use, although
setdown of 35% appears to be the most uniformly accepted visual
or physical criterion. It is important to know how accurately
this or other criteria fit actual situations, and a comparison
of these specifications is afforded by using the data derived
from actual production welding. To provide such a comparison,
extensive data from one source were analyzed. The data were
obtained from large samples and included expected production
variables of machines, operators and materials, and represented
an achievable production line situation for each combination
given.
From our analysis of the experimental data on the commonly used
weld joint material combinations, it was shown that the average
pull strength, x, as a fraction of the pull strength of the
weaker wire of a pair, ranged from 48% to 89%; setdown ranged
from 8% to 35%, _ in % of x varied from 5.7% to 18%; Xmi n in
% x varied from 50% to 80%. The use of _ as a control for Xmi n
was tested by examining their ratios, O/Xmi n, which should be
a constant if _ is to be used. The ratio varied from 3.1 to
13 and the use of normal statistics for a measure of xmin'
therefore, does not appear valid. If the weld strengths are
not normally distributed, estimates of the fraction defective
based on the mean and standard deviation will not be the same
as if the weld strengths were normally distributed. Differ-
ences on this score may become especially serious when we are
dealing with very small fractions defective, as is the case
with high reliability requirements.
The establishment of criteria for good and bad welds is fur-
ther complicated by the fact that each material combination
behaves differently even when normalized. We conclude from
22.
II
I
II
I
II
III
II
II
I
II
I
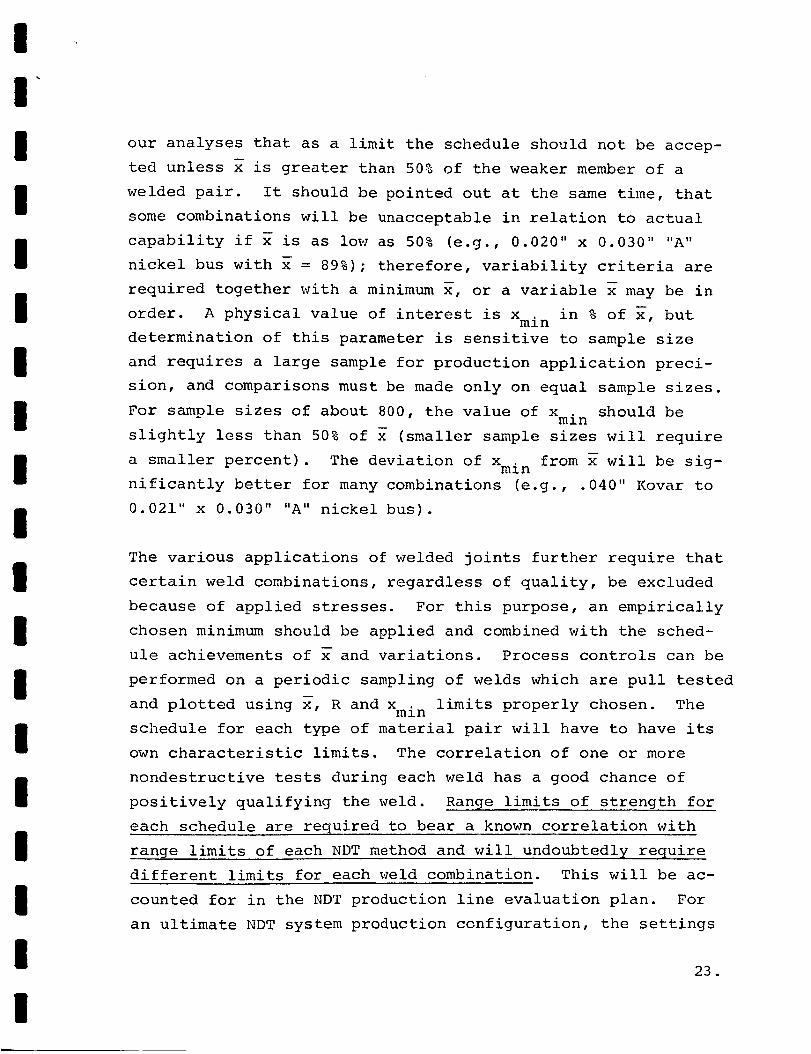
our analyses that as a limit the schedule should not be accep-
ted unless x is greater than 50% of the weaker member of a
welded pair. It should be pointed out at the same time, that
some combinations will be unacceptable in relation to actual
capability if x is as low as 50% (e.g., 0.020" x 0.030" "A"
nickel bus with x = 89%); therefore, variability criteria are
required together with a minimum x, or a variable x may be in
order. A physical value of interest is Xmi n in % of x, but
determination of this parameter is sensitive to sample size
and requires a large sample for production application preci-
sion, and comparisons must be made only on equal sample sizes.
For sample sizes of about 800, the value of Xmi n should be
slightly less than 50% of x (smaller sample sizes will require
a smaller percent). The deviation of Xmi n from x will be sig-
nificantly better for many combinations (e.g., .040" Kovar to
0.021" x 0.030" "A" nickel bus).
The various applications of welded joints further require that
certain weld combinations, regardless of quality, be excluded
because of applied stresses. For this purpose, an empirically
chosen minimum should be applied and combined with the sched-
ule achievements of x and variations. Process controls can be
performed on a periodic sampling of welds which are pull tested
and plotted using x, R and Xmi n limits properly chosen. The
schedule for each type of material pair will have to have its
own characteristic limits. The correlation of one or more
nondestructive tests during each weld has a good chance of
positively qualifying the weld. Range limits of strength for
each schedule are required to bear a known correlation with
range limits of each NDT method and will undoubtedly require
different limits for each weld combination. This will be ac-
counted for in the NDT production line evaluation plan. For
an ultimate NDT system production configuration, the settings
23.
I
I
II
I
III
II
II
II
I
III
needed for limit controls can be included with the weld sched-
ule settings by the use of a pre-punched card, or similar method,
to prevent errors in setting such control limits.
2. _S Acceptance Criteria
As a result of the analysis of existing welding specifica-
tions, it was apparent that minimum weld strength criteria
were currently in general use which could be applied to our
NDT study. Accordingly, the following approaches to gener-
ation of weld strength criteria were developed_
An optimum weld schedule would be developed
for each set of weld joint materials selec-
ted. The average strength of welds construc-ted at the selected schedule would be re-
quired to be at least 50% of the average
strength of the weakest weld material.
Sample quantities of welds would be construc-
ted by a competent operator and individual
torsion-shear pull strength data obtained.
The minimum weld strength required would be
not less than 50% of the average strength for
the sample.
For later production line evaluation of
the prototype NDT system, the minimum ac-
ceptance requirement for weld-to-weld
strength would be derived from detailed
analysis of the data resulting from the
s_mple runs, strength data derived from
the measurement program, and the ultimate
resolution of data derived from the proto-
type NDT instrumentation. These deviations
would utilize concepts of average, minimum,
and ranges of values such as defined in
Duncan's Quality Control and Industrial
Statistics. The purpose of this would be
to tie in production line periodic sample
weld measurements with the module produc-
tion NDT requirements.
24.
I
I'I
I
II
II
II
II
II
II
I
II
An additional overriding minimum strength
limit would be derived for each production
line weld application. This limit would be
established from expected product environ-
ment rather than from weld schedule data.
This would protect against using otherwise
"good" welds where they are inherently tooweak to survive the use environment.
A review of current industry acceptance criteria relative
to total weld deformation (setdown) showed that in four of
the five cases where a specification existed, 35% was the
limit established. In _'_S laboratories, the experience with
many materials has been that welds with setdown in excess of
35% exhibit poor cosmetic appearance and have a tendency to
possess a poor internal characteristic. In welds where set-
down exceeded 35%, voids and cracks were common. As a result,
a limit of 35% was established for weld acceptance for the
development phase covered by this report. This limit is sub-
ject to revision for later production application on dif-
ferent materials and on other welding machine configurations.
25.
!
I1
! D. PROCESS CONTROL MONITORING
I
I
I
I
I
I
I
I
I
I
I
I
I
I
I
I
Adequate production control of the welding process is clear-
ly essential for maintaining a high quality of welded con-
nection output. Current industry practices and production
control requirements have been discussed in Section C.
Mention was made of the potential value and our intention
of employing NDT parameters to supplement current practices
during the NDT production line evaluation phase.
While the primary objective of the NDT program is assessment
of the quality of each individual weld, a major additional
value as a process control is also evident from the data.
To demonstrate this in our experimental program, we have
induced controlled deviations from optimum welding con-
ditions. The weld pairs have demonstrated tolerance toward
many of these deviations by retaining acceptable pull strengths.
However, in many of these instances, one or more of the NDT
parameters have given data values consistently outside their
acceptable limits.
Thus, for process deviations not yet serious enough to reject
welds, one or another of the NDT parameter measurements have
shown ability to indicate process control deviation. In a
production process, these parameters can be watched for
trends to indicate progressive degradation of the welding
process. This information may then be used to initiate
remedial action in time to prevent bad welds which might
occur due to any systematic process control deterioration.
26.
II
I
I
II
I
II
III
I
II
I
II
I
The NDT data application to process control has tremendous
advantage over the traditional periodic pull test coupon meth-
ods of control. This advantage lies in the fact that the NDT
data can be made available for process control evaluation at
any time during a production run, under actual production op-
erating conditions, and without any interruption to the pro-
duction. The sensitivity of the system's detection capabil-
ity spans the range from subtle degradations in the welding
machine to poor operator techniques, including detection of
missed welds.
Some indications of these process control detection capabili-
ties will be presented in the data analysis section of this
report.
27.
!
II
! E. WELDING EQUIP_IENT SELECTION
I
I
II
II
II
II
I
II
I
I
Our survey of the aerospace industry indicates that a wide
variety of cross-wire welding equipment is being used, and
that the capacitor discharge power supply is the predominant
generic type in use. Within this category of welders, many
excellent types are found including Taylor-Winfield, Hughes,
Raytheon, Sippican, Unitek and others.
The selection of the specific welder head and electrode con-
figuration to be used in this study was dictated by the con-
siderations outlined in the following paragraphs.
An early decision was that instrumentation directly applicable
to a typical welder type and weld geometry -- if proven suc-
cessful --must subsequently be applicable to other welder con-
figurations. In addition, to provide a high degree of welder
performance repeatability, certain welder characteristics
were recognized by our survey contacts as being advanced and
desirable. These characteristics include_
Power supply regulation. This minimizes varia-
tions in welding pulse energy with power line
variation.
SCR firing circuit. Use of silicon controlled
rectifier circuitry for discharging the welder
capacitors into the transformer has been shown
to produce greater pulse-to-pulse uniformity
than can be obtained by use of a firing relay
with its contact resistance variability.
28.
I
II
II
I
I
II
II
IIi
I
II
I
II
Transformer core pre-biasin_. The state ofmagnetization of the welder transformer core
(at the instant before the charged capacitor
bank is connected to its primary windings)
influences significantly the characteristics
of the welding pulse. This initial state can
vary with the history of the previous weld made
on the machine (e.g., different weld schedule,
circuit ringing). The biasing circuit passes
a reverse current through the transformer be-
tween welds, and brings it to a consistent
point on its magnetic hysteresis curve. This
allows more consistent energy transfer throughthe transformer.
It was determined that the Unitek (Weldmatic) Model 1-065-03
had all of these desired characteristics. It was also de-
termined that the Unitek Model 1-048-02, already in use in
our laboratory, could be readily modified to include all of
the capabilities of the Model 1-065-03, and was therefore
selected for use on this study.
Details for this welder power supply are:
Energy storage ranges: 0.2 to 20 watt-
seconds and 0.7 to 100 watt-seconds
Discharge time: (at 50 watt-seconds)
normal pulse -- 0.0035 second; long pulse --0.0078 second
Capacitor Bank: 1610 microfarads (measured)
Capacitor Storage Voltage: 20 to 408
volts dc, continuously adjustable
Input Voltage: 105 to 130 volts ac
Maximum Repetition Rate: 80 welds perminute at 100 watt-seconds
To provide additional control over welding variables, several
other features were included in our laboratory weld station.
29.
Il
I
I
II
II
II
II
I
II
I
II
I
Provision was made to externally monitor the capacitor bank
voltage using a precision voltmeter. This yielded more pre-
cise measurement than the 2% voltmeter (equivalent to 4% in
watt-seconds) incorporated in the welder. In addition, the
flexible cables normally supplied to connect the welder power
supply to the welding head were replaced by rigid fixed-
geometry copper bus bars. There were two basic reasons for
this change. First, it was found in early studies that shifts
in relative positions of the cables due to the mutual magnetic
field coupling effects from the hundreds of amperes welding
current would affect the pulse waveform. Secondly, the large
area bus bar connections employed provide better control of
welder secondary circuit resistance. Earlier _'_S studies
had pointed out that significant changes can occur in the
welding process as a result of secondary circuit resistance
changes.
To provide availability for comparative studies, a second
weld station was installed alongside the primary station just
described. This station utilizes a Unitek (Weldmatic) I048B
power supply, which contains no SCR firing circuit, no trans-
former bias circuit, and uses normal cable connections to
the welder head. This is typical of many installations in
current use.
The Unitek (Weldmatic) Model 2-032-03 welding head was chosen
to meet aerospace packaging of discrete components in cord-
wood packages. This head is designed for connection to the
chosen power supply, and has the following specifications:
Force: 4 ounces to 15 pounds,
continuously adjustable
30.
I
I
II
II
I
II
III
I
II
I
II
Throat Depth:
Electrode Stroke:
Firing Control_
at preset force
Force Application:
2-1/2 inches
1.2 inches
automatic, fires
swing foot pedal
The electrode configuration selected for use in the NDT study
is representative of types widely employed in the aerospace
welding field. The electrode diameters must be small enough
for clearances between leads and buses, and this is provided
for in two generally available configurations. Both of these
have 1/8" diameter cylindrical shanks. One type has a conical
taper toward the tip, and the other reduces to a short length
of 1/8" diameter cylindrical section at the tip. Tapered
electrodes are quite acceptable, but are subject to some vari-
ation in surface area as electrode material is removed during
tip servicing. Therefore, standard 1/16 _ diameter cylindrical
electrodes (1/8 '_ shanks) were chosen to provide uniform tip
area bearing against the weldment.
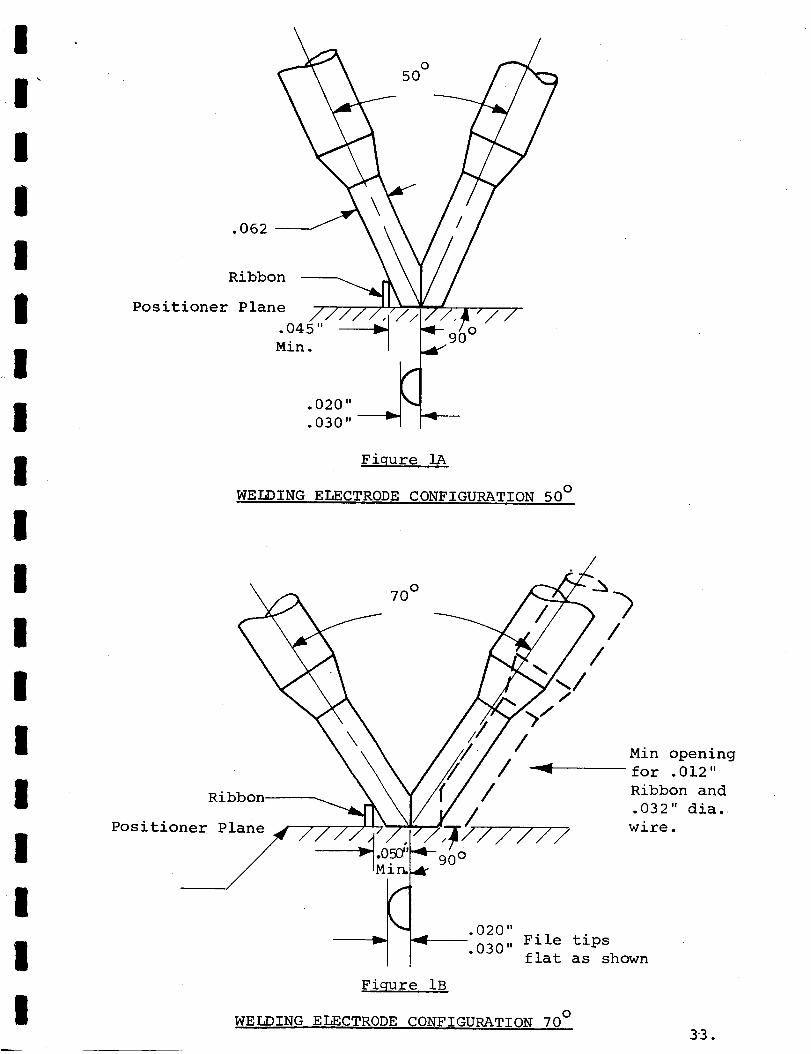
The electrode-to-electrode included angles, most commonly
used by the aerospace welding industry, vary between about
50 ° to 70 ° , according to the specific application. The ap-
plicability of NDT techniques is not dependent upon the val-
ues within this range of inter-electrode included angle. A
maximum of 70 ° was allowed for in the installation of NDT
monitoring sensors as it is the largest angle expected to
be in use.
As a matter of interest (as shown in Figure IA), the clearance
between the fixed electrode face and the nearest interfering
.030" ribbon is .045" minimum for the 50°electrode-to -
31o
m
II
II
II
IIII
I
II
I
II
I
electrode angle. A 70 ° included angle, as shown in Figure IB,
is used and recommended where a higher electrode force than
8 pounds is required. For this 70 ° case, the ribbon clearance
required is .050 _ minimum. Clearance for the moving elec-
trode must be considered in module design and must include the
bus and leadwire between the electrodes, plus clearance to
permit electrode positioning_
32.
I
I
I
I
I
I
I
I
II
I
I
I
I
I
I
II
050
.062
Ribbon
Positioner Plane
•045"
Min.
O
Fiqure IA
WELDING ELECTRODE CONFIGURATION 50 °
70 °
Ribbon
Positioner Plane
o
/
//
//
Min opening
for .012"
Ribbon and
.032" dia.
wire.
File tips
flat as shown
Fiqure IB
WELDING ELECTRODE CONFIGURATION 70 °33.
II
I F. WVS WELD STATION CALIBRATION TECHNIQUES
II
II
II
III
I
II
I
II
A high degree of operational reliability and repeatability
has been built into the weld station equipment employed in
our NDT study. However, our investigations into the oper-
ation of this complex equipment have shown that welder per-
formance variabilities occur which are critical to our con-
trolled NDT measurements. These performance variabilities
are the normal resultants of operating life, as well as main-
tenance actions, and involve such elements of the system as:
Energy storage capacitor bank
Regulation and measurement of capacitor
charging voltage
Resistance of the discharge circuit from
capacitors through the transformer primary
Welder transformer characteristics
Resistance of the conductors and electrical
joints in the high current carrying secon-
dary circuit down to and including the weld
head electrode faces
Inter-electrode force and other character-
istics of the welder head affecting follow-
up motion
In order to emphasize the essential need for careful weld sta-
tion control, an example of the kinds of problems detected
and remedied in time to prevent degradation of the NDT data
is given here in detail. This example involved the failure
of the silicon controlled rectifier (SCR) which controls the
primary current flow into the welder transformer from the
capacitor bank. Before the start of a group of welds, our
34°
I
I
I
I
I
I
I
I
I
I
I
I
I
I
I
I
I
I
I
customary pre-welding performance verification procedure re-
vealed a significant change in weld pulse output from the
normal value for this function. Diagnostic action was taken
immediately, resulting in isolation of the cause for the out-
put change to a failing SCR. The welder performance verifi-
cation procedures were repeated after replacement of the
defective SCR. The verification test now produced the re-
quired welder peak output test level at a watt-second energy
setting 10% less than normal, with a concurrent reduction in
pulse width from the required test standard value. Further
investigation revealed the replacement SCR to have about
one-half ohm lower forward conducting resistance than the
original (yet still within SCR manufacturer's specifications),
and the original pulse characteristics were restored by ad-
ding resistance to the circuit. The system then passed the
verification procedure, and the NDT measurements were con-
tinued without the serious compromise in data continuity that
the SCR replacement effects would otherwise have caused.
A calibration program was developed and employed to provide
the necessary assurance that the welding station equipment
conformed initially to acceptable performance requirements
and maintained known and repeatable operating characteris-
tics. This program is discussed in the following paragraphs.
Two categories of calibration were established. The first
was to provide initial certificaiton of the welding equipment
by measuring certain basic parameters and recording these for
later reference. This permitted the equipment to be returned
to its original condition after performance of any extensive
maintenance which might be required in the course of the pro-
gram. Remeasurement of these parameters would then be re-
quired only for the extensive maintenance cases, or in cases
35.
I
II
I
II
II
II
II
II
II
I
II
where significant variabilities were noted in a second cate-
gory of more frequently performed calibration measurements.
Our choice of parameters in this second category included
measurements which were demonstrated to be sensitive indica-
tors of changes occurring either in the Category 1 parameters,
or in any other normally stable elements of the welding equip-
ment. Details of NDT transducer calibration are covered in
the NDT Instrumentation Development portion of this report.
i. Category I. Initial Certification Calibration Steps
ao The actual capacitance of the power supply
capacitor bank was accurately measured at
the beginning of the study, and no effec-
tive changes have been noted in the course
of the program.
b • Measurements were made of the DC resistance
of the entire secondary circuit, including
the electrodes, and again no effective
changes have been noted. Periodic cleaning
of the critical electrical connections has
helped to maintain this condition.
C. The repeatability of the welder power supply
watt-second meter has been checked against
an external 0.25% meter and has shown con-
sistent agreement to within 1%. The meter
square law scale has also been checked against
our 0.25% meter, and there is agreement with-
in 2%.
36°
!
II
II
II
I
II
III
II
I
II
I
d. The mechanical follow-up characteristics of
the welder head were checked for complete
freedom of motion. A source of friction was
identified and remedied.
2. Category 2. Daily Calibration Steps
ae During each period of active _DT welding
measurement, welding system end-to-end
dynamic calibration checks were made.
The machine welding pulse peak output
and pulse width were measured on a stor-
age oscilloscope using a standard 150
micro-ohm shunt placed between the weld-
ing electrode tips. To provide stan-
dard, repeatable conditions for this
test, the electrode firing force was
set to its test condition value using
a precision dynamometer force gage,
the power supply was set to its test
value (with the watt-second meter being
checked against a precision DC volt-
meter), and the oscilloscope calibrated
against a square wave generator measured
by an AC meter.
be The voltage across the capacitor bank was
independently monitored to an accuracy of
0.25%. This measurement was also repeated
for each individual weld made during the
program.
37.
I
I
I
I
I
I
I
I
I
I
I
I
I
I
I
I
I
I
I
Co All of the welding forces were set using
standard dynamometer-type electrode force
gages. Two of these precision gages are
kept at the welding station to provide
cross-checks. These have been inter-
checked in our laboratory using precision
weights to assure gage consistency.
These calibration steps were followed with sufficient care
to assure us that the weld stations were operating properly
at the values established for each set of welds.
38.
I
i G. WELD MATERIALS SELECTION
I
II
I
II
III
II
I
II
I
The material in widest use for component interconnection is
nickel because of its excellent welding properties, particu-
larly with the commonly used lead materials discussed below.
Except for unusual cases where nonmagnetic materials (such
as alloy 180 and alloy 90) are needed, nickel is universally
used. There are several interconnect ribbon or wire sizes
in use, but the 0.012 inch by 0.030 inch ribbon appears to
have the greatest acceptance and was chosen as the basic
interconnect material for the WVS NDT studies.
Four materials w copper, Dumet, Kovar, and nickel q are the
most prevalent component lead materials used in the aerospace
industry, and are all covered by MIL-STD-1276. This speci-
fication is intended for use with component leads intended
for welding and contains sufficient quality control provi-
sions to assure the desired consistency for our program. It
was agreed upon by cognizant NASA personnel that for this
portion of the NDT investigation, the following lead mater-
ials would provide adequate experience with the welding com-
binations most frequently used in industry, with nickel rib-
bon utilized to represent the predominant interconnect mater-
ial:
0.012" x 0.030" nickel ribbon
0.017" gold-plated Kovar
0.025 '_ solder-coated copper
0.020" gold-plated Dumet
39.
I
I
IH. WELD SCHEDULE DEVELOPMENT
I
II
I
II
II
III
I
II
I
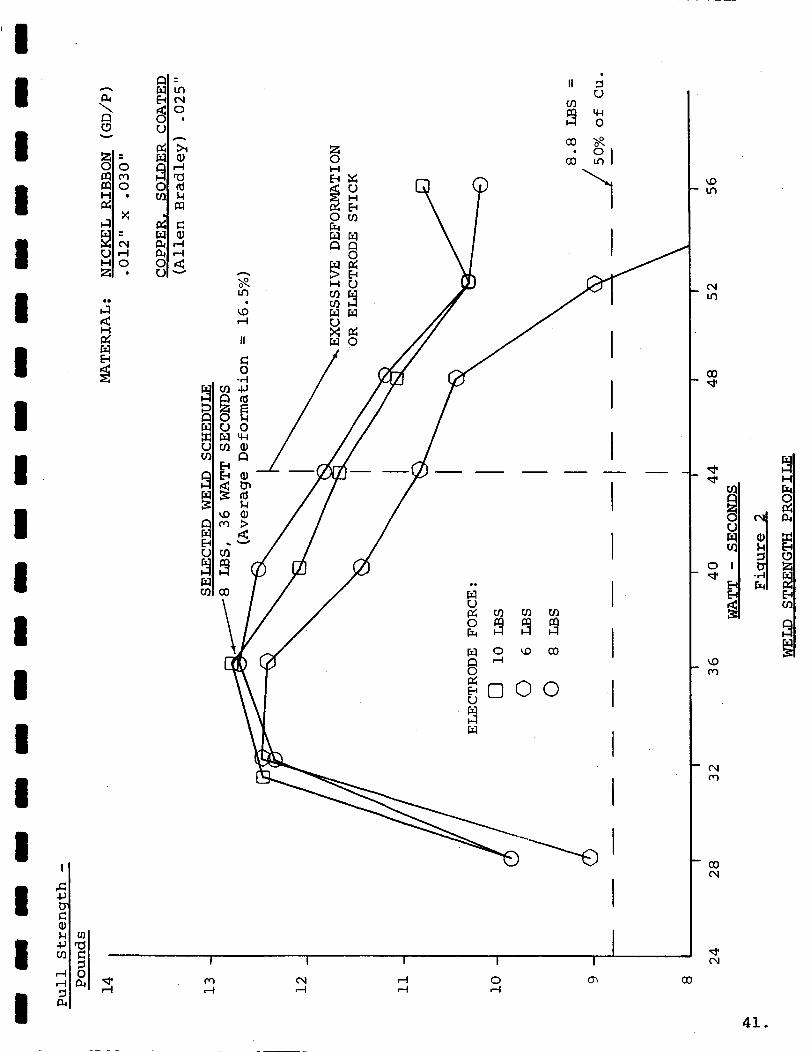
i. Weld Strength Profiles
Having chosen interconnect and lead material pairs to be em-
ployed in the NDT study, it was next necessary to develop
welding machine setting data for each pair, and from these
data to select optimum weld schedule values of welding energy
and inter-electrode force (at time of welder firing). These
weld schedule values are most easily obtained by first de-
veloping weld strength profiles for each pair of materials.
A weld strength profile is a method of establishing an opti-
mum weld schedule by an efficient and simplified procedure.
The weld strength profile is a plot of weld breaking load
versus energy at constant electrode pressure. An example
developed during our study is shown in Figure 2. The depen-
dent variable -- weld strength -- is plotted on one axis and
the independent variable --weld energy -- on the other. For
each of several force settings, a separate curve is plotted.
This provides a family of energy versus pull strength curves,
the welds identified with any individual curve having been
made at the same force setting. In practice, there is usually
enough experience available in connection with welding the
commonly used materials to allow choice of a small number of
strength profile force values for trial. These values are
selected in a range giving a high probability of encompas-
sing the optimum weld schedule point sought. The watt-
second energy range over which the test welds are to be made
can also be chosen roughly from existing experience. This
energy range is then divided up to provide a number of dis-
crete, spaced energy values. At each of these energy values
40.
I
I
II
II
I
II
II
III
I
II
II
I
I
0
,M,-I
--- _ in
_ 0
L9 L
_-" NO
C4 _ ,-4,-I C_ ,-I
• r,.,) ".-..,"
H
'd'rM
0 _o 0O
_,[3 0 0rO
I I I I I
¢0
_n
o
0_
41.
C
t_ Iz
i._1 1_
II
I
I
II
II
II
II
II
I
II
I
a number of welds are made, pull-tested, the pull strengths
averaged, and the average pull strengths are plotted for the
welds associated with any set of energy and forcevalues.
The characteristics of these families of constant force weld
strength profile curves are then utilized to choose an opti-
mum force and energy value as the individual weld schedule
pair for each pair of weld joint materials. Additional weld
quality evaluation factors are also utilized in evaluating
the optimum weld schedule points from the weld strength pro-
files. These factors include such weld characteristics as
incidence of pits, cracks, voids, excessive expulsion or
setdown, and spread of pull strength data for a given param-
eter set.
2. Weld Schedule Proofin@
Verification of each weld schedule selected was made by means
of a sample run of i00 welds. As verification, the minimum
weld strength in the sample lot of I00 welds was required to
be not less than 50% of the average strength computed for the
sample. This is in accord with our previous discussion of
acceptance criteria in Section 3, C.
42.
I
I
I
I I. NDT INSTRUMENTATION DEVELOPMENT
I
I
II
II
II
II
I
II
II
The instrumentation to be used for measurement of the three
selected welding attributes -- pulse waveform, setdown, and
infrared radiation --was developed within the following set
of constraints to insure a practical, production line-usable
system.
Noninterference with the operator - theinstrumentation must not interfere with
normal welding operation in any way. This
meant that the operator's view of the weld
area must not be impaired in any manner;
the normal operator manipulations of the
weld material with respect to the elec-
trodes must not be interfered with; and
accessibility of electrodes and other
welder parts for maintenance purposes
must not be impeded.
No effect on weldin@ characteristics -the instrumentation must not interfere
with welding characteristics in any man-
ner. This would be of particular concern
in instrumenting setdown, where electrode
movement must be transduced into voltage
without degrading electrode follow-up
characteristics.
Minimum complexity - in order to facili-tate initial installation of instrumenta-
tion, calibration, and maintenance, the
actual application must be as simple as
possible. For instance, in instrumenta-
tion of infrared radiation the use of
optics could result in an undesired
degree of complexity.
43.
I
II
II
I
I
II
II
II
II
I
II
I
The feasibility of using the three selected weld attributes
individually and in combination was investigated and quan-
titative data were obtained which established the degree of
correlation between the individual attribute and weld strength.
In order to maximize the utility of the data from the measure-
ment program, all three attributes were quantized simultane-
ously for each sample weld. By so doing, all three measure-
ments could be related to a single weld of known quality and
direct relationship to weld quality of different attributes
was made possible in the most effective combination.
The following paragraphs describe in more detail the instru-
mentation that was developed.
i. Weld Voltage Pulse
Measurement of the weld voltage pulse requires care to insure
that voltages induced into instrumentation leads by magnetic
fields from the large welding currents do not generate mis-
leading results.
In the instrumentation developed for this study, these induced
voltages were effectively eliminated by use of twisted pair
leads that were attached to the top ends of the electrodes,
and by orienting the lead loop up and away from the welder
head.
a. Validation of Measurement Inte@rity
In order to validate the selected instrumentation connec-
tions, a reference connection was made directly to the
electrode toes adjacent to the weld contact surface. This
44.
I
II
II
I
II
I
I
III
ll
l
I
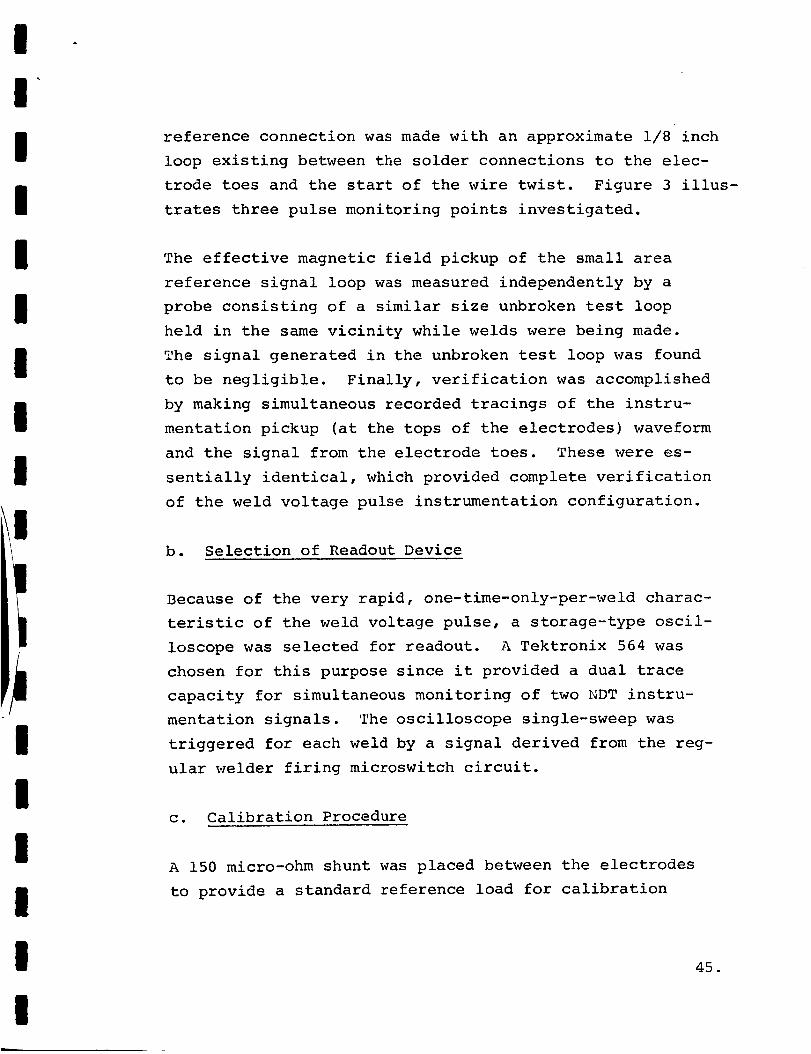
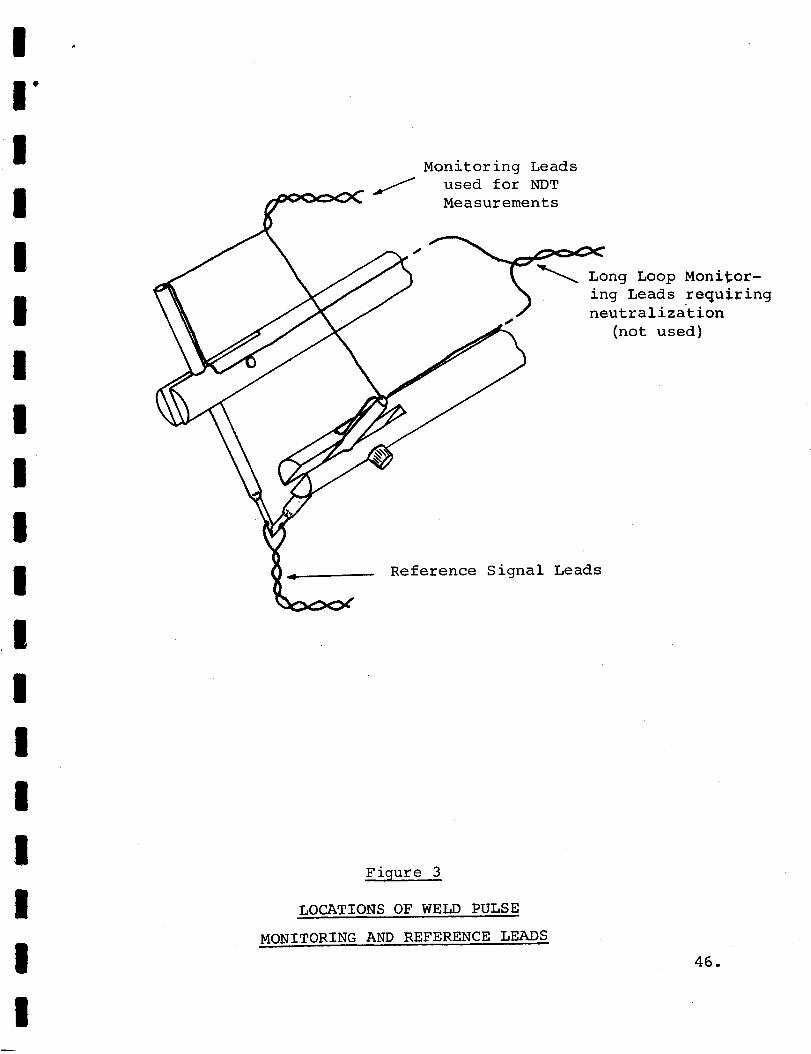
reference connection was made with an approximate 1/8 inch
loop existing between the solder connections to the elec-
trode toes and the start of the wire twist. Figure 3 illus-
trates three pulse monitoring points investigated.
The effective magnetic field pickup of the small area
reference signal loop was measured independently by a
probe consisting of a similar size unbroken test loop
held in the same vicinity while welds were being made.
The signal generated in the unbroken test loop was found
to be negligible. Finally, verification was accomplished
by making simultaneous recorded tracings of the instru-
mentation pickup (at the tops of the electrodes) waveform
and the signal from the electrode toes. These were es-
sentially identical, which provided complete verification
of the weld voltage pulse instrumentation configuration.
b. Selection of Readout Device
Because of the very rapid, one-time-only-per-weld charac-
teristic of the weld voltage pulse, a storage-type oscil-
loscope was selected for readout. A Tektronix 564 was
chosen for this purpose since it provided a dual trace
capacity for simultaneous monitoring of two NDT instru-
mentation signals. The oscilloscope single-sweep was
triggered for each weld by a signal derived from the reg-
ular welder firing microswitch circuit.
c. Calibration Procedure
A 150 micro-ohm shunt was placed between the electrodes
to provide a standard reference load for calibration
45.
l
!
I1"
!
!
!
I
I
I
!
iII
!
!
II
!
II
II
II
!
Monitoring Leads
used for NDT
Measurements
__ L._ng Loop Monitor-
ing Leads requiring
i / neutralization
(not used)
Reference Signal Leads
Figure 3
LOCATIONS OF WELD PULSE
MONITORING AND REFERENCE LEADS
46.
J_l
II
I
II
II
I
III
I
II
I
II
purposes. The correct amplitude of weld voltage pulse
that should appear across the 150 micro-ohm shunt was de-
termined for each watt-seconds schedule value. The volt-
age measured across the shunt was then used to verify
proper system operation for each weld schedule used.
2. Infrared Radiation
The basic requirement in instrumenting the infrared signature
of the weld joint formation was to transduce the infrared
energy into a usable signal voltage. A number of approaches
were evaluated as possibilities, among them the following:
Use of a single infrared detector of
adequate size and sensitivity, without
optics, located above and between the
electrodes.
Use of fiber optics to convey the IRfrom the immediate weld area to a
conveniently remote detector.
Use of an optical system to permit
concentration of IR energy at a conven-
iently located detector.
Use of cryogenic equipment to achieve
adequate detection sensitivity.
More detailed evaluation of each of these approaches suggested
that because of its simplicity, the first approach for labora-
tory investigation should be to provide as close to the weld
joint as feasible, large solid-angle coverage of the weld
heated areas without use of focusing optics.
47.
I
III
I
II
I
II
II
II
II
I
II
It was estimated from knowledge of the material properties
that the peak temperature range of welds under investigation
would be approximately 1350 ° to 1750 ° Kelvin. In our eval-
uation of thermal characteristics of the weld, it was also
recognized that spectral emissivities for the weld materials
could vary as a function of surface conditions of the same
material type. However, the experimental NDT results have
not indicated this to be a serious problem for our conditions
of measurement.
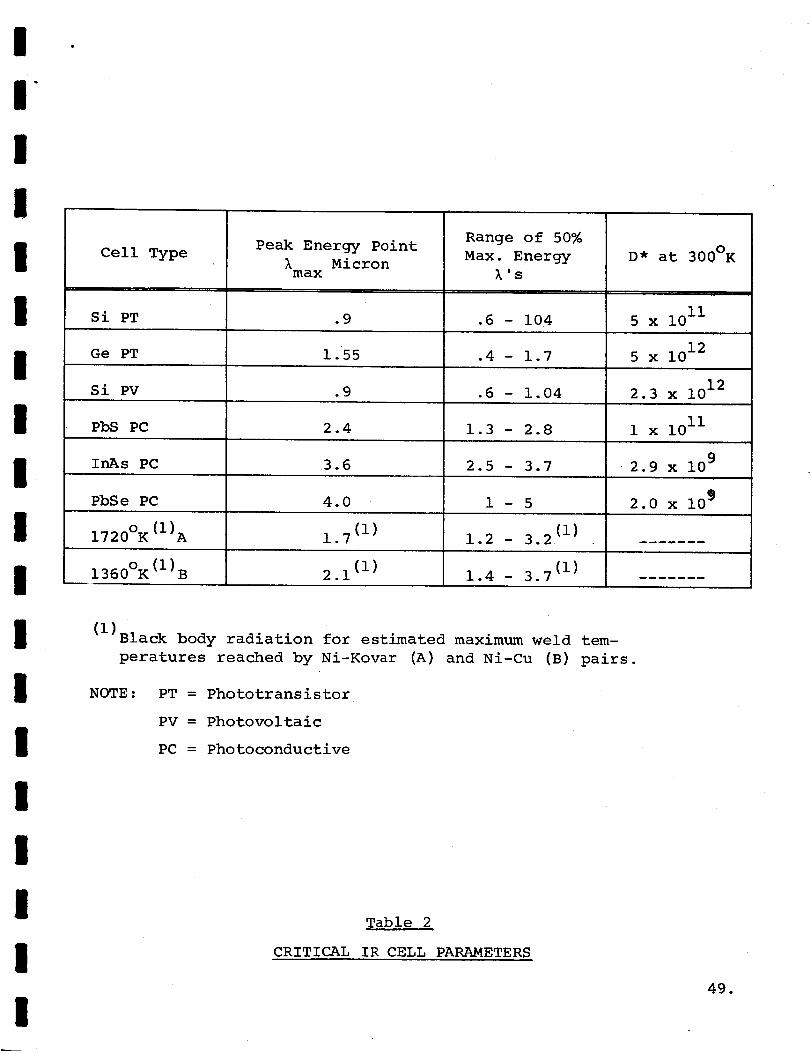
A number of specific IR detector materials with possibly
suitable characteristics were considered. The detector types
reviewed and the pertinent operating characteristics are
tabulated in Table 2.
From this list, two detector types were selected for detailed
evaluation. The silicon photovoltaic cell was chosen because
of its large sensitive area which circumvented the need for
optics or precise positioning. On the other hand, in order
to provide adequate coverage in the longer IR wavelengths with
good sensitivity, the lead sulfide photoconductive cell was
also considered. Because of its smaller sensitive area, the
lead sulfide cell required an optical support system.
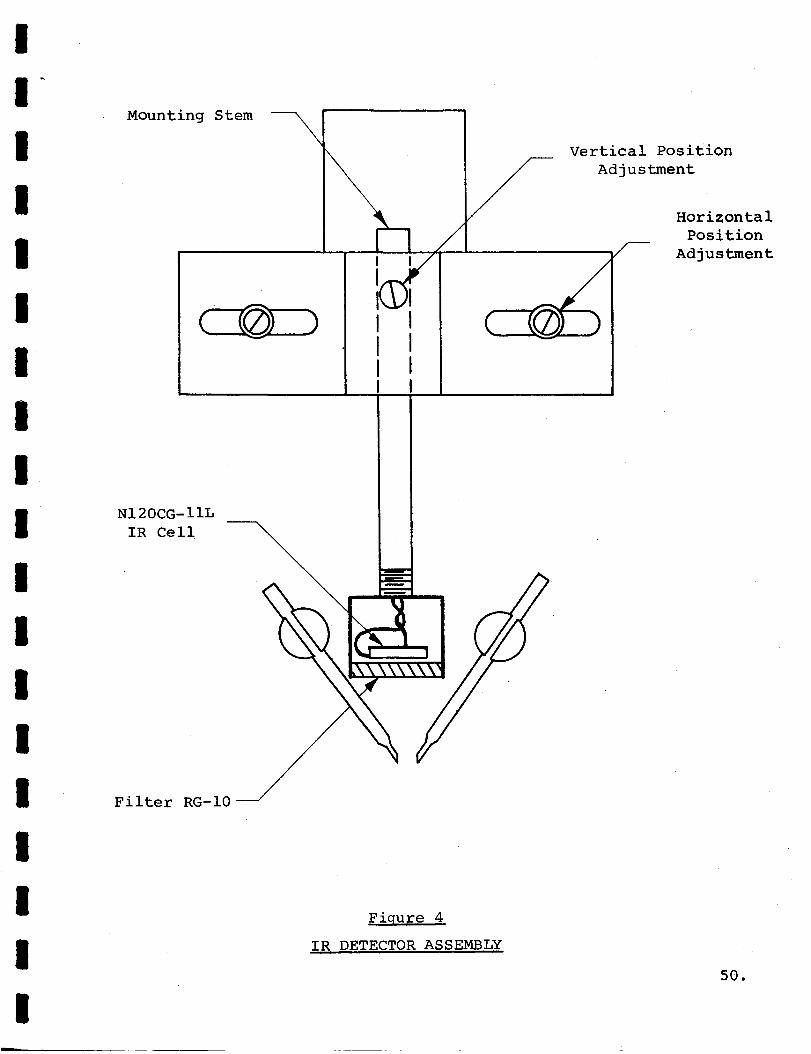
Our detector type evaluation, weighing all factors, has resulted
in the choice of the Hoffman NI20CG-IIL photovoltaic silicon
cell with a sensitive area of 0.375 '_ by 0.75". It is mounted
on the weldhead directly above the welding electrodes, as
shown in Figure 4, and is covered with an IR transmitting fil-
ter to minimize the effect of ambient light conditions on cell
output. Connection to the readout instrument is again through
twisted pair conductors to minmize stray magnetic field pickup.
48.
I
I
I
II
I
II
II
II
II
II
I
II
I
Cell Type
Si PT
Peak Energy Point
1 Micronmax
Ge PT
.9
Range of 50%
Max. Energy
_'s
1.55
D* at 300°K
.6 - 104 5 x i0 II
.4 - 1.7 5 x 10¹²
Si PV .9 .6 - 1.04 2.3 x 10¹²
PbS PC 2.4 1.3 - 2.8 1 x i0 II
InAs PC 3.6 2.5 - 3.7 2.9 x 10⁹
1 - 5 2.0x 10⁹PbSe PC 4.0
1720OK (1)A i. 7 (i)
1360°K (1)B 2.1 (I)
(i)1.2- 3.2
(i)1.4- 3.7
NOTE :
(i)Black body radiation for estimated maximum weld tem-
peratures reached by Ni-Kovar (A) and Ni-Cu (B) pairs.
PT = Phototransistor
PV = Photovoltaic
PC = Photoconductive
Table 2
CRITICAL IR CELL PARAMETERS
49.
I
I
II
I
Ii
II
II
II
II
II
I
Mounting Stem
NI20CG-IIL
IR Cell
Filter RG-10
i_
[I
IIIl
Vertical Position
Adjustment
Horizontal
Position
Adjustment
Fiqure 4
IR DETECTOR ASSEMBLY
50.
II
I
II
I
I
IIII
I
II
I
II
I
a. Readout Instrumentation
As with the weld voltage pulse, the infrared radiation
occurring during the time the weld is made is a tran-
sient phenomenon. For this reason, the second trace of
the dual trace Tektronix 564 was selected as the readout
device. Vertical amplifier gain of the Tektronix is
adequate to eliminate the need for preamplification and
the use of its image storage feature permits detailed
examination of the waveform and photography for future
reference as required.
b. Calibration Procedure
For calibration of IR instrumentation, a miniature (0.030"
diameter) tungsten filament bulb, operated at a predeter-
mined, precisely monitored current value, is used as a
reference source. A fixture was designed which places
the bulb in a fixed position relative to the IR sensor
with the filament parallel to the plane of the sensor.
This position is between the welding electrodes at the
same location where a weld would normally be made.
3. Setdown
The third welding attribute to be instrumented was "setdown."
For the purposes of this discussion, setdown includes both
embedment and indentation. Embedment is the distance that
lead and ribbon are displaced into each other, while inden-
tation is the distance that electrodes penetrate leads and
ribbon. The actual setdown of concern to this investiga-
tion is the change in electrode separation while the weld
51.
I
I
I
I
I
II
I
I
I
I
I
I
I
I
I
I
I
I
is being made. This change is measured as the difference be-
tween two positions of the movable electrode. The first is
the electrode position just at the time firing force is reached,
but immediately prior to application of weld energy. The second
electrode position is that reached after the weld process is
completed, but prior to removal of weld force. This change is
referred to in this discussion as dynamic setdown.
A feasibility study was made of a variety of transducers in-
cluding linear differential transformers, low-friction infi-
nite resolution potentiometers, light-actuated frictionless
potentiometers and mechano-electronic devices (such as the
RCA 5734 tube), and strain gages. Among the requirements
given prime consideration in the transducer study were lin-
earity, hysteresis, high output level, large dynamic range,
low spring rate or friction, and low mass.
a. Transducer Selection
A miniature cantilever beam assembly embodying the above
requirements was developed in our laboratory. A silicon
piezo-resistive strain gage was selected as being the most
suitable for measurement of beam deflection. The final
transducer design consists of four strain gages attached
to a beam -- two in tension mode and the other two in com-
pression mode -- and electrically connected in a full-bridge
for instrumentation. The strain gages were provided by
and mounted to our beam design by Manning Instruments,
Inc. The strain gage beam is clamped between metal mount-
ing blocks which support and position the beam perpendi-
cular to the movable electrode holder. The motion of the
electrode holder during the welding process deflects the
52.
I
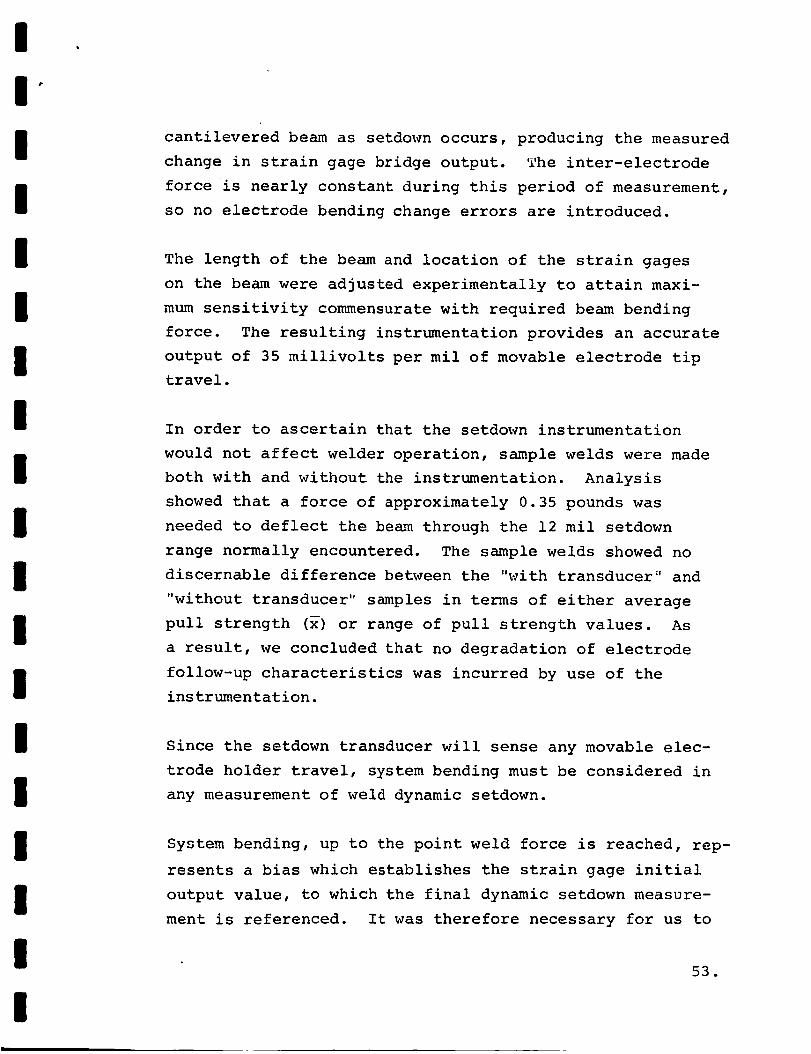
I
I"
I
I
I
I
I
I
I
I
I
I
I
I
I
I
I
I
I
cantilevered beam as setdown occurs, producing the measured
change in strain gage bridge output. _he inter-electrode
force is nearly constant during this period of measurement,
so no electrode bending change errors are introduced.
The length of the beam and location of the strain gages
on the beam were adjusted experimentally to attain maxi-
mum sensitivity commensurate with required beam bending
force. The resulting instrumentation provides an accurate
output of 35 millivolts per mil of movable electrode tip
travel.
In order to ascertain that the setdown instrumentation
would not affect welder operation, sample welds were made
both with and without the instrumentation. Analysis
showed that a force of approximately 0.35 pounds was
needed to deflect the beam through the 12 mil setdown
range normally encountered. The sample welds showed no
discernable difference between the "with transducer" and
"without transducer" samples in terms of either average
pull strength (x) or range of pull strength values. As
a result, we concluded that no degradation of electrode
follow-up characteristics was incurred by use of the
instrumentation.
Since the setdown transducer will sense any movable elec-
trode holder travel, system bending must be considered in
any measurement of weld dynamic setdown.
System bending, up to the point weld force is reached, rep-
resents a bias which establishes the strain gage initial
output value, to which the final dynamic setdown measure-
ment is referenced. It was therefore necessary for us to
53.
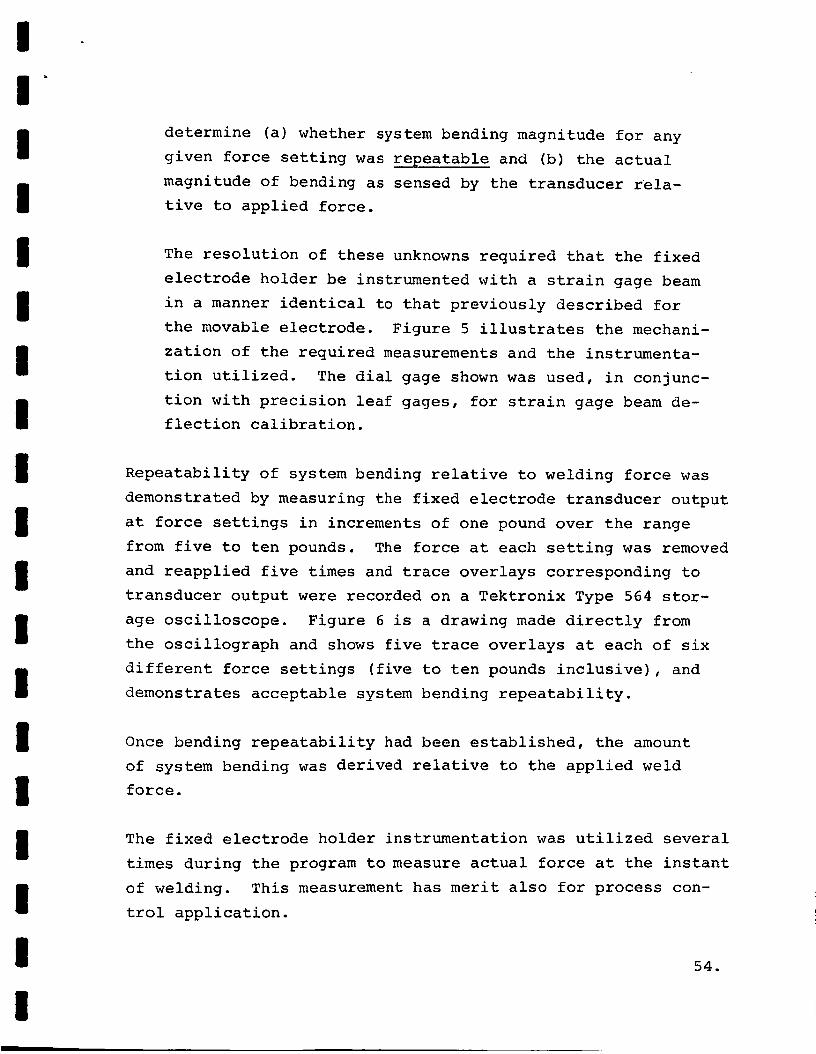
I
I
II
I
II
III
II
I
II
II
determine (a) whether system bending magnitude for any
given force setting was repeatable and (b) the actual
magnitude of bending as sensed by the transducer rela-
tive to applied force.
The resolution of these unknowns required that the fixed
electrode holder be instrumented with a strain gage beam
in a manner identical to that previously described for
the movable electrode. Figure 5 illustrates the mechani-
zation of the required measurements and the instrumenta-
tion utilized. The dial gage shown was used, in conjunc-
tion with precision leaf gages, for strain gage beam de-
flection calibration.
Repeatability of system bending relative to welding force was
demonstrated by measuring the fixed electrode transducer output
at force settings in increments of one pound over the range
from five to ten pounds. The force at each setting was removed
and reapplied five times and trace overlays corresponding to
transducer output were recorded on a Tektronix Type 564 stor-
age oscilloscope. Figure 6 is a drawing made directly from
the oscillograph and shows five trace overlays at each of six
different force settings (five to ten pounds inclusive), and
demonstrates acceptable system bending repeatability.
Once bending repeatability had been established, the amount
of system bending was derived relative to the applied weld
force.
The fixed electrode holder instrumentation was utilized several
times during the program to measure actual force at the instant
of welding. This measurement has merit also for process con-
trol application.
54.
I
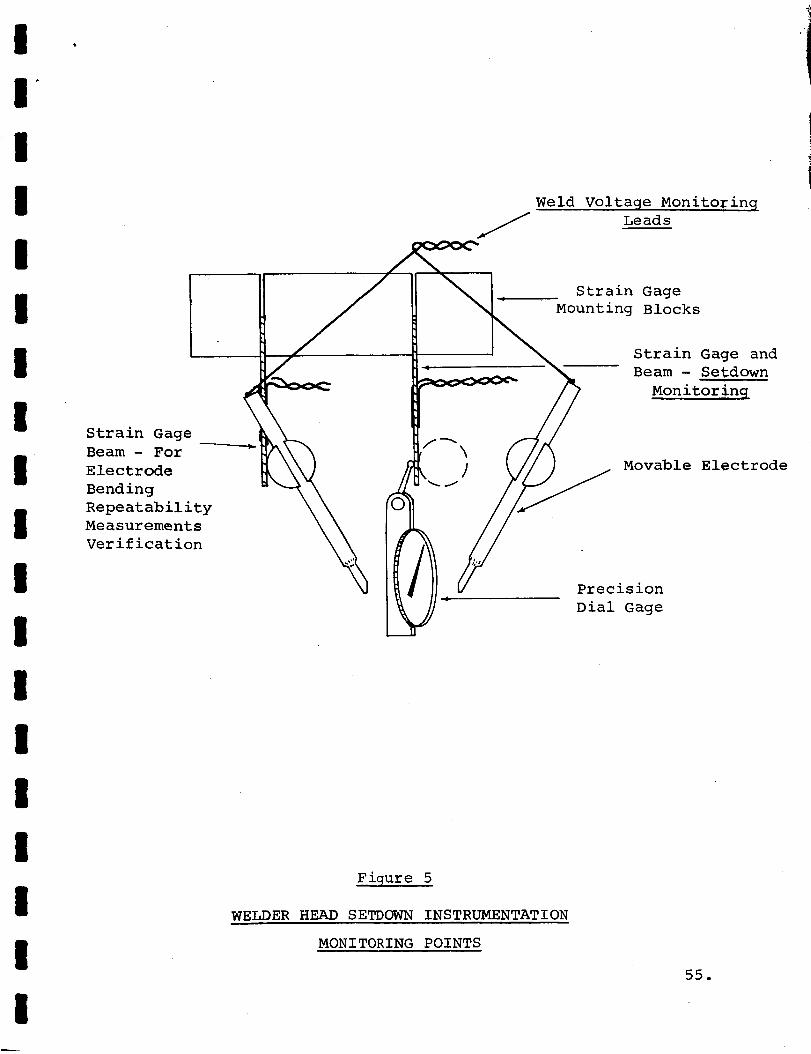
I
II
I
II
II
III
I
II
II
I
Weld Voltaqe Monitoring
Leads
Strain Gage
Mounting Blocks
Strain Gage and
Beam - Setdown
Monitorinq
Movable Electrode
Precision
Dial Gage
F iqure 5
WELDER HEAD SETDOWN INSTRUMENTATION
MONITORING POINTS
55.
q
!
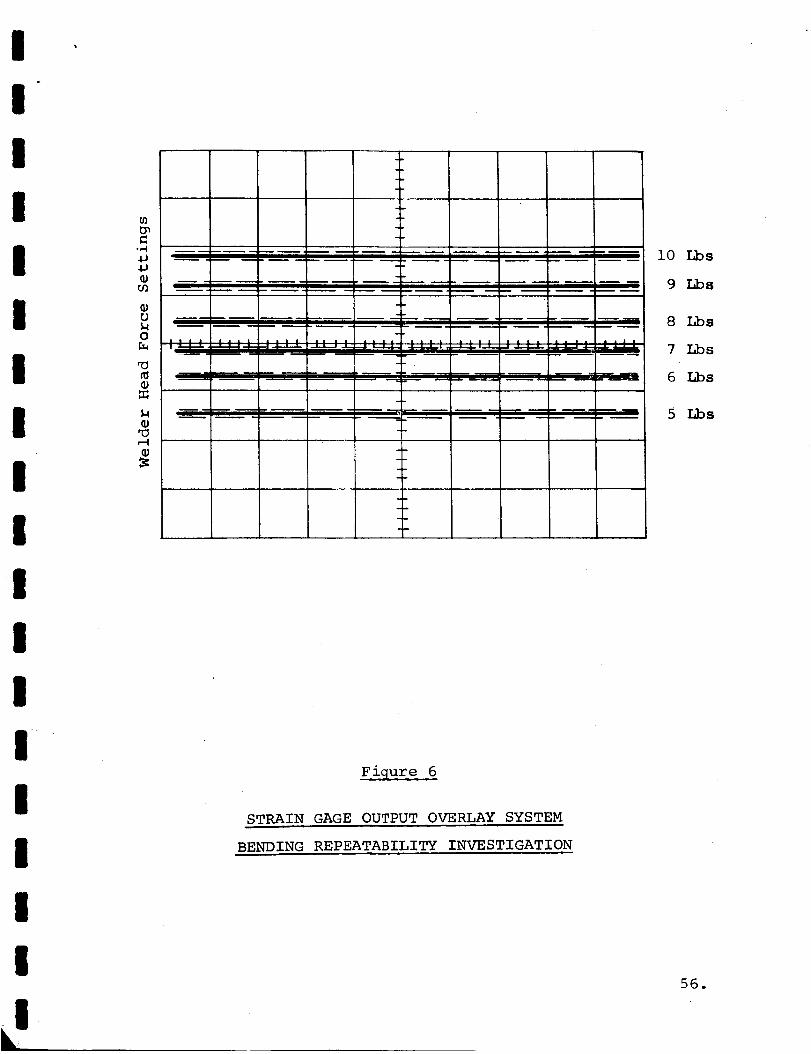
III
I
II
II
II
II
II
II
II
Ik
u}
-,-I
4J
(DU
0r_
=.
mmm
I_ _ I'--__L,__.''_ _ ___
.............. LL_ .... _Li_: : :J_i_L ..... ___
ii rE-"
-m
Figure 6
STRAIN GAGE OUTPUT OVERLAY SYSTEM
BENDING REPEATABILITY INVESTIGATION
i0 Lbs
9 Lbs
8 Lbs
7 Lbs
6 Lbs
5 Lbs
56.
I
III
I
I
III
II
II
II
II
I
b. Readout Instrumentation
Because of the range of values available from the trans-
ducer bridge (35 mV/mil), a digital voltmeter capable of
reading in millivolts was chosen for readout of setdown
information. A Digitek Model 201 was available in the
_'NS laboratory and proved adequate for the purpose.
Figure 7 shows the complete welder head instrumentation
configuration used to obtain our experimental results.
c. Calibration Procedure
Because of the bending characteristics of the electrodes
and holders, an indirect relationship exists between
transducer movement and weld setdown. For this reason
a calibration curve was generated to relate transducer
bridge output to true distance between electrode tips.
The calibration curve was generated by inserting shims
between the electrodes and measuring bridge output at
a specific weld-force setting. Seven readings were
taken at increments of shim thickness, and the mean of
each set of readings used to establish a point on the
calibration curve. A typical calibration curve is pre-
sented in Figure 8. Insofar as dynamic setdown accuracy
is concerned, setdown instrumentation is calibrated at
the specific welding force used, and any system bending
is automatically accounted for in the calibration pro-
cedure and valid readings are assured.
57.
I
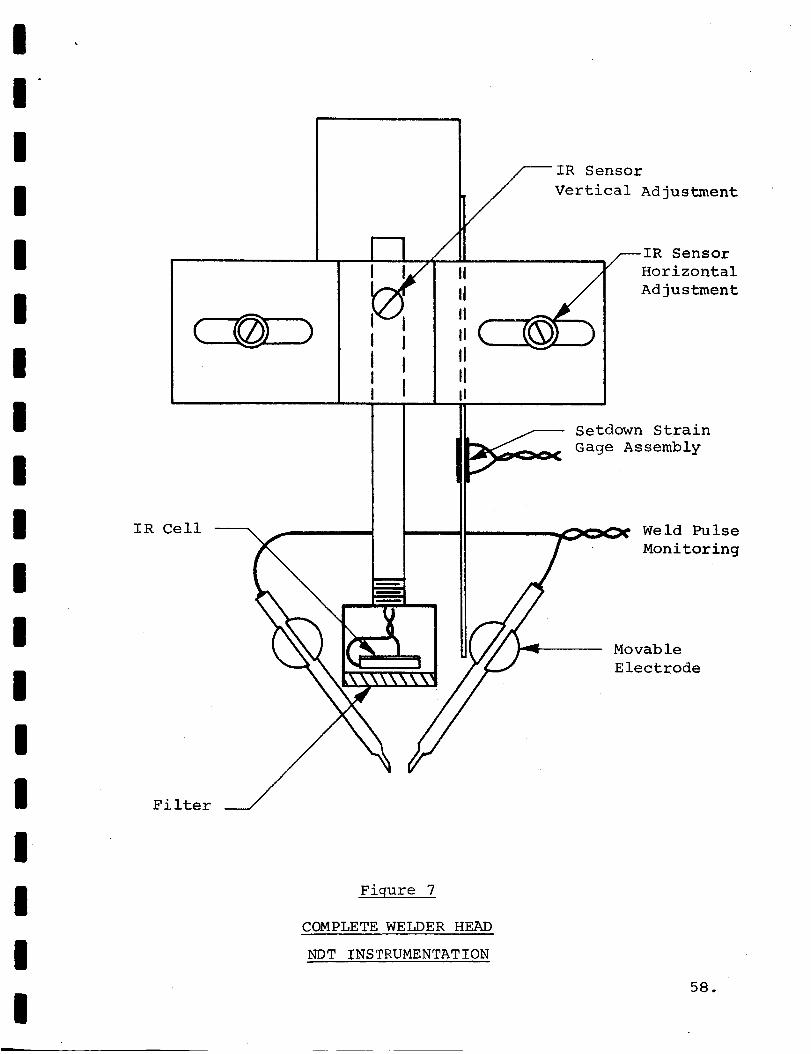
i •
I
II
I
I
I
I
IR Sensor
Vertical Adjustment
/--IR Sensor
Horizontal
Adjustment
Setdown Strain
e Assembly
Weld Pulse
Monitoring
Mo vab le
Electrode
I
I Filter
I
I
II
Figure 7
COMPLETE WELDER HEAD
NDT INSTRUMENTATION
58.
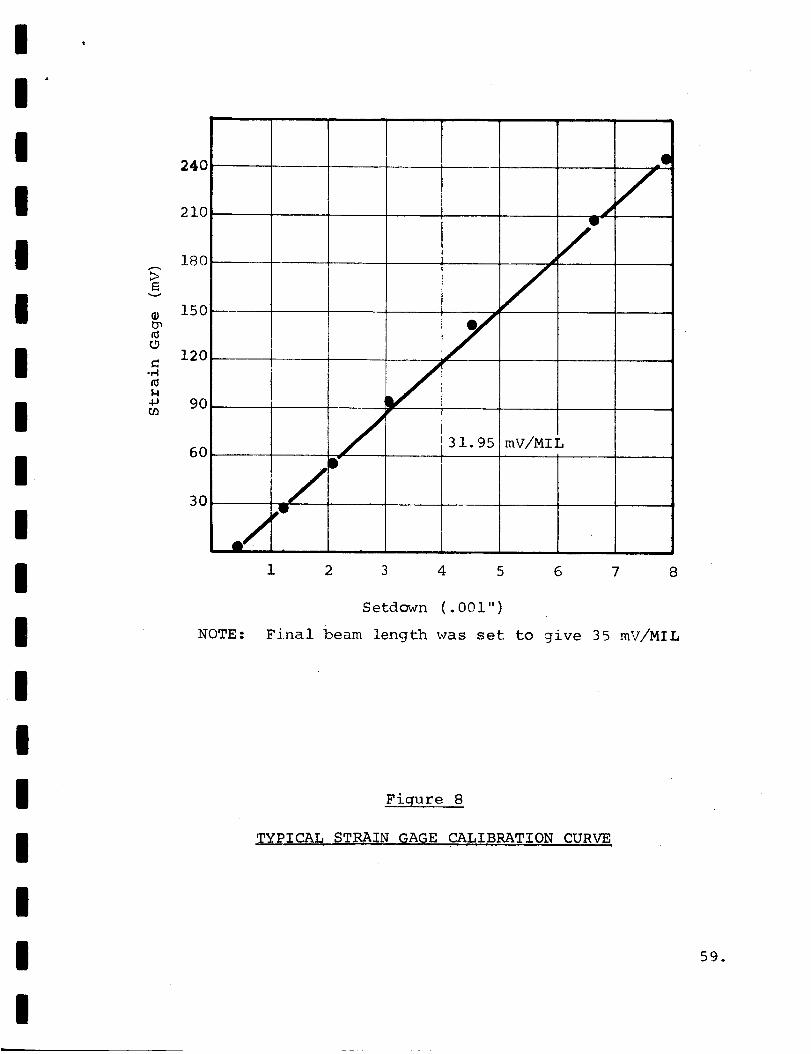
I
II
I
II
II
II
II
I
II
II
....,,.
mv
-r'4
240
210
180
150
120
90
60
3O/
//
jQ
31.95 mV/MIL
/_JB-
/
1 2 3 4 5 6 7 8
NOTE:
Setdown (.001")
Final beam length was set to give 35 mV/MIL
Figure 8
TYPICAL STRAIN SAGE CALIBRATION CURVE
59.
I
'1
i
I do EXPERIMENT DESIGN
i
I
II
In order to assess the potential effectiveness of our NDT in-
strumentation, a series of measurement programs was conducted
on selected pairs of weldable material. The construction of a
very large number of welds at optimum weld schedule (in the
hope of identifying any poor ones) was rejected because the
normal yield of "bad" welds would be small and there would be
little assurance that NDT measurements from defective welds
would provide reliable differentiating data.
II
II
The basic approach chosen was to intentionally deviate from op-
timum welding conditions in a controlled manner by duplicating
situations that might typically occur in production. This
would ensure the production of "bad _ welds in a manner and in
quantities that would make evident the most likely causes and
the most sensitive NDT attributes. A discussion of the steps
taken to implement these objectives follows.
I 1. Control Groups
I
I
I
For each weld material pair, an optimum weld schedule was first
established by the pull-strength energy-profile method (weld
strength profile, discussed in Section G above). A control
group of welds was then fabricated under ideal conditions.
The control groups consisted of fifty welds each, for which
all NDT measurements and pull strengths were recorded.
i
I
The control group measurement data provided us with a compari-
son baseline for each NDT parameter by defining the measurement
I60.
I
II
II
I
I
III
II
II
I
II
II
distribution characteristics that can be anticipated from welds
constructed under optimum schedule and process control condi-
tions.
2. Deviation Groups
In addition to the control group, many test groups of five welds
each were constructed in which controlled deviations in position-
ing, material, schedule and other process elements were intro-
duced. The variables used simulated the most frequent causes
of weld defects, as indicated by _'_S experience, and as iden-
tified by cognizant personnel from other organizations contac-
ted during this study program. The purpose of the variables
groups then is:
to explore the tolerance of the selected
welded material pairs to the induced
variables,
to provide an indication of the resolution
of our NDT instrumentation relative to the
detection of defective welds, and
to evaluate the sensitivity of our [_DTinstrumentation as an indicator of de-
viations in weld process control.
An IBM 1130 Computer was used to perform the analysis opera-
tions on each set of weld attribute measurements. The sta-
tistical criteria employed are typical of those currently
used in the aerospace industry for process analyses.
The statistical criteria and formulas used for the informa-
tion presented in this report are listed below:
61.
I
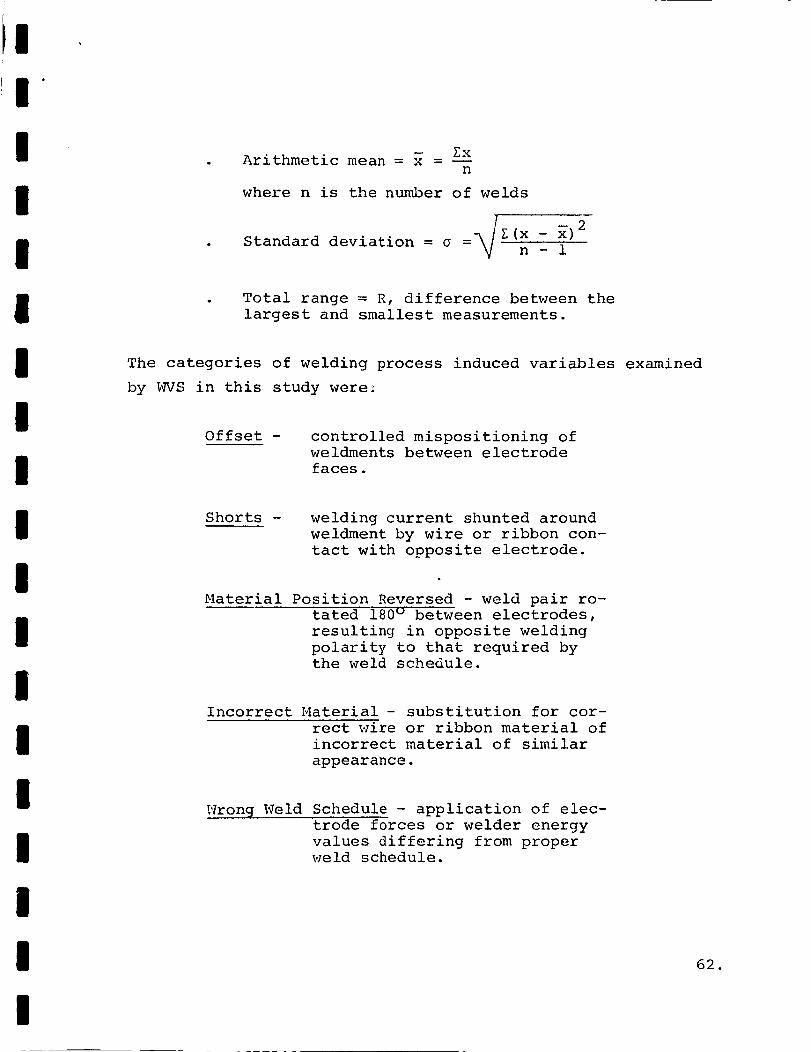
I
I
III
l
I
iI
III
I
II
I
II
Arithmetic mean = x = 7xn
where n is the number of welds
Standard deviation = _ = \iZ_Z (x - _._,2n - 1
Total range = R, difference between the
largest and smallest measurements.
The categories of welding process induced variables examined
by WVS in this study were:
Offset - controlled mispositioning of
weldments between electrode
faces.
Shorts - welding current shunted around
weldment by wire or ribbon con-
tact with opposite electrode.
Material Position Reversed - weld pair ro-
tated 180 ° between electrodes,
resulting in opposite welding
polarity to that required bythe weld schedule.
Incorrect Material - substitution for cor-
rect wire or ribbon material of
incorrect material of similar
appearance.
Wrong Weld Schedule - application of elec-
trode forces or welder energy
values differing from proper
weld schedule.
62.
I
II
I
II
I
ii
III
II
i
II
Ii
3. Acceptability Criteria
For purposes of this study, and for the particular materials
tested, a weld has been considered :_good" if the dynamic set-
down is less than 35% of the total material thickness, and the
pull strength exceeds 50% of the x value for the specific con-
trol test group welds. These values are practical and most
typical of those accepted by industry and therefore appropriate
for this study.
On a weld-by-weld basis and for the selected materials tested,
it was decided that our instrumentation should reject any weld
that failed to meet the above criteria and conversely should
accept every weld that did. During the forthcoming aerospace
production line NDT prototype equipment evaluation, criteria
and limits will be developed experimentally to fit particular
production requirements.
The individual weld data results of each controlled experiment
were layed out on matrix charts. The ranges of measured values
from the control groups are presented for pull strength and
the three _DT parameters. These data ranges establish the
acceptance limits for the deviation group welds. Each weld
is numbered° The completed charts were used to evaluate the
NDT effectivity of our instrumentation.
The summary results of the matrix data evaluations were then
presented in "truth tables. _' In these truth tables each con-
trolled variable is identified by number and description,
Columns 1 and 2, respectively. Column 3 identifies the indi-
vidual weld by a number which corresponds to an identical
weld number for the particular variables group contained on
the appropriate matrix chart. Columns 4 through 6, corres-
63.
!
I
I
I
II
I
II
II
II
Ii
I
II
I
ponding to the measured attributes (Setdown, Infrared and Weld
Waveform), are provided to allow assignment of the test results
to each weld.
The results of the individual weld measurements are summarized
and evaluated in the remaining columns. Column 7 states whether
the weld was accepted or rejected by the instrumentation re-
gardless of the authenticity of the evaluation. Column 8 lists
the reason for weld reject in the event a defective weld was
fabricated as determined by the Setdown instrumentation or
subsequent pull strength measurement. In the event a weld
was rejected by the instrumentation but was good by our cri-
teria (i.e., >50% of the control group average pull strength
and >35% Setdown), notation to that effect is made in the Weld
Failure column.
The validity of the NDT test result is indicated in Column 9.
Thus, if the NDT instrumentation accepts a weld that meets the
basic pull strength and setdown requirements, or if it rejects
one that does not, the test result is indicated as valid. Con-
versely, if the instrumentation rejects a weld that is good by
our criteria or accepts a weld that is bad, the NDT result is
indicated as not valid.
The Process Control Monitor entries in Column i0 are designed
to indicate the sensitivity of the NDT instrumentation to de-
viations from optimum welding conditions. The NDT system was
considered sensitive if two or more false readings were ob-
tained from any of the measured attributes in their respective
variable group. Where the materials being welded and the NDT
instrumentation were not sensitive to the particular variable
involved, a "materials not sensitive" notation was made.
Where defective welds were fabricated and the Process Control
64.
!
I
I"I
I
II
II
I
III
I
III
I
I
aspects of the NDT instrumentation were not sensitive to the
cause, a not valid condition is indicated in Column i0.
The three measurement result columns, 4, 5 and 6, utilize the
symbols T for "true _ and F for "false." A true, or acceptable
va__lu__eefor a given weld parameter measurement is here taken as
one lying within the range of values obtained for this param-
eter from the weld control group NDT measurements. A false,
or unacceptable value, is one lying outside the NDT control
group range.
In addition, for the setdown column, a symbol, IRI, is used to
indicate that the weld is to be rejected on an absolute cri-
terion basis, regardless of other data. To provide a reason-
able limit value for our study (to be revised as necessary to
fit later production evaluation requirements) the IRI value
for setdown was chosen to reject anything over 35%, which, in
fact, is a widely used maximum limit value in the industry.
The NDT prototype instrumentation will have an additional IRI
feature for cases where the welder power supply pulse polarity
control switch is in the wrong position. This condition would
result in an inverted Weld Pulse signal and will be indicated
as a process-out-of-control condition.
A summary of the conditions for acceptance or rejection of a
weld follows:
REJECTION CRITERIA: any weld with over 35% dynamic
setdown
or, any weld with pul ! strengthless than 50% of x
65.
!
I
l
I
I
l
l
I
l
l
i
I
I
I
I
I
I
l
I
or, any weld produced with reverse
polarity setting
or, any weld yielding any two or
more "FALSE" weld parameter
signals; i.e., any detected
signal outside the range of
values obtained from the con-
trol group NDT measurements.
ACCEPTANCE CRITERIA: any weld with less than 35%
dynamic setdown
and, more than 50% pull strength
and, proper weld polarity setting
and, any two or more "TRUE" weld
parameter signals; i.e., any
detected signal inside the
range of values obtained from
the control group NDT measure-ments.
To summarize, the following is the pertinent information rela-
tive to the experiments discussed in the next section:
Welder Type:
Electrode Type:
Electrode Angle:
IR Sensor:
IR Readout:
Capacitor discharge
R_'_A 2, Copper (2 each)
70 ° (included)
Hoffman NI20CG-IIL solar cell,
with Schott RG-10 filter
Tektronix, Type 564 storage
oscilloscope with 3A72 and
2B67 plug-ins
66.
!
I
I"
l
I
I
I
l
l
I
I
l
l
I
I
l
I
I
I
I
Weld Pulse
Monitoring Point:
Readout:
Setdown Transducer:
Setdown Readout :
Electrode tops
Tektronix, Type 564 storage
oscilloscope with 3A72 and
2B67 plug-ins
Manning Instruments strain
gage beam (full bridge)
Unified Systems Model 201
Digital Voltmeter
Four experiments were designed based on the welding materials
pairs listed below:
Experiment B-7_
Experiment B-8_
Experiment B-9:
Nickel ribbon to copper wire
Nickel ribbon to Kovar wire
Nickel ribbon to Dumet wire
The results of the above experiments and the measurement data
obtained are presented in the following section of this report.
67.
II
N'
! K. EXPERIMENT RESULTS
I
I
II
I
III
II
II
I
III
Detailed results of each of the four NDT instrumentation
evaluation experiments are presented in the following para-
graphs.
i. Experiment B-7
The background information pertinent to this specific experi-
ment is tabulated below:
Material:
Average Breaking
Pull-Strength ofMaterials:
Weld Schedule.
0.012 '_ x 0.030" type Anickel ribbon
0.025 '_ oxygen-free high
conductivity (OFHC) copper,solder coated
Nickel - 23.0 ibs
Copper - 18.8 lbs
8 ibs, 36 watt-seconds
Pulse : Long
The copper wire employed in this investigation was obtained
from 1/4 watt resistors supplied by a major manufacturer and
no attempt was made to control or select lead material rela-
tive to dimension, solder coating thickness, or composition.
This wire material is known to contain oxygen-free, high con-
ductivity copper (OFHC), and was chosen by WVS for its proven
weldability and uniformity characteristics (in contrast to
other common difficult-to-weld and variable materials, such
as electrolytic tough pitch copper).
68.
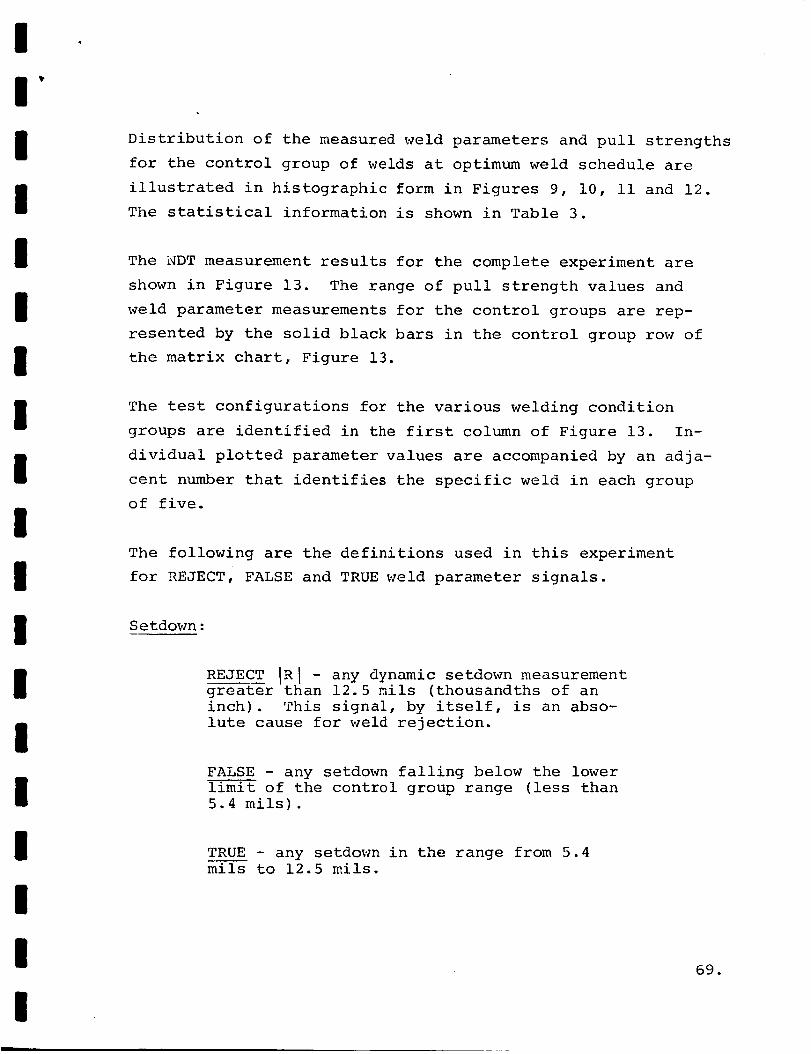
II"
II
I
II
II
III
II
I
III
I
Distribution of the measured weld parameters and pull strengths
for the control group of welds at optimum weld schedule are
illustrated in histographic form in Figures 9, i0, ii and 12.
The statistical information is shown in Table 3.
The NDT measurement results for the complete experiment are
shown in Figure 13. The range of pull strength values and
weld parameter measurements for the control groups are rep-
resented by the solid black bars in the control group row of
the matrix chart, Figure 13.
The test configurations for the various welding condition
groups are identified in the first column of Figure 13. In-
dividual plotted parameter values are accompanied by an adja-
cent number that identifies the specific weld in each group
of five.
The following are the definitions used in this experiment
for REJECT, FALSE and TRUE weld parameter signals.
Setdown:
REJECT IRI - any dynamic setdown measurement
greater than 12.5 mils (thousandths of an
inch). This signal, by itself, is an abso-
lute cause for weld rejection.
FALSE - any setdown falling below the lower
limit of the control group range (less than
5.4 mils).
TRUE - any setdown in the range from 5.4
mils to 12.5 mils.
69.

III
II
flIII
II
II
II
I
II
I
m
.H
,-I.H
-Hr._
I
0r..}
35
3O
25
20
15
10
9
Experiment B-7
•012"x .030"Nickel
.025" OFHC Cu (Allen Bradley)
Weld Sched. 8 Lbs. - 36 WS
i0
I
ii 12
Pull Strength - Lbs.
i Mean = 13 Lbs.
13 14 15
Figure 9
PULL STRENGTH DISTRIBUTION
70.
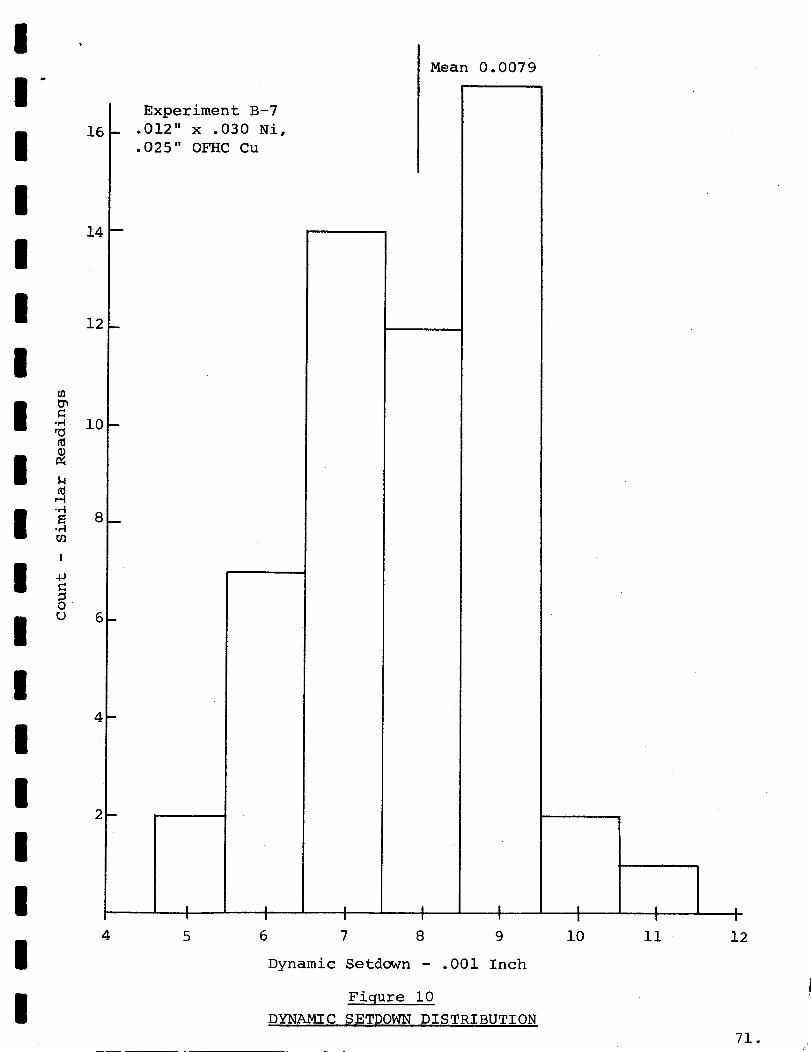
I
II
II
I
II
II
III
I
II
II
I
{/)
-,-I
I.I
,.-,-I-,-I
-,.-t
I
0U
16
14
12-
i0-
8_
6-
4-
2
4
Experiment B-7
_ •012" x .030 Ni,
•025" OFHC Cu
Mean 0•0079
I I I I I I I
5 6 7 8 9
Dynamic Setdown - .001 Inch
Fiqure I0
DYNAMIC SETDOWN DISTRIBUTION
i0 ii
I
12
71.
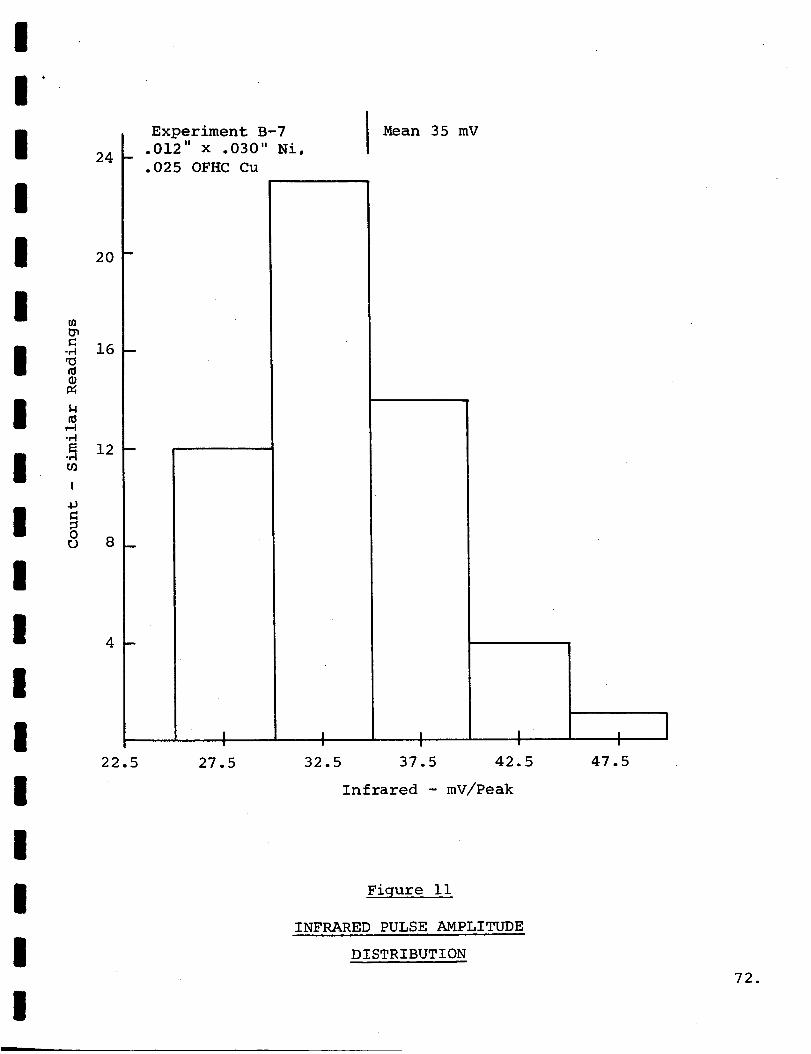
II
I
II
I
II
III
II
II
II
II
24
20
u}t_
._ 16
-M12
[
ou 8
m
m
4 -
22.5
Experiment B-7
.012" x .030" Ni,
.025 OFHC Cu
I Mean 35 mV
I I I I I27.5 32.5 37.5 42.5
Infrared - mV/Peak
47.5
Figure ii
INFRARED PULSE AMPLITUDE
DISTRIBUTION
72.
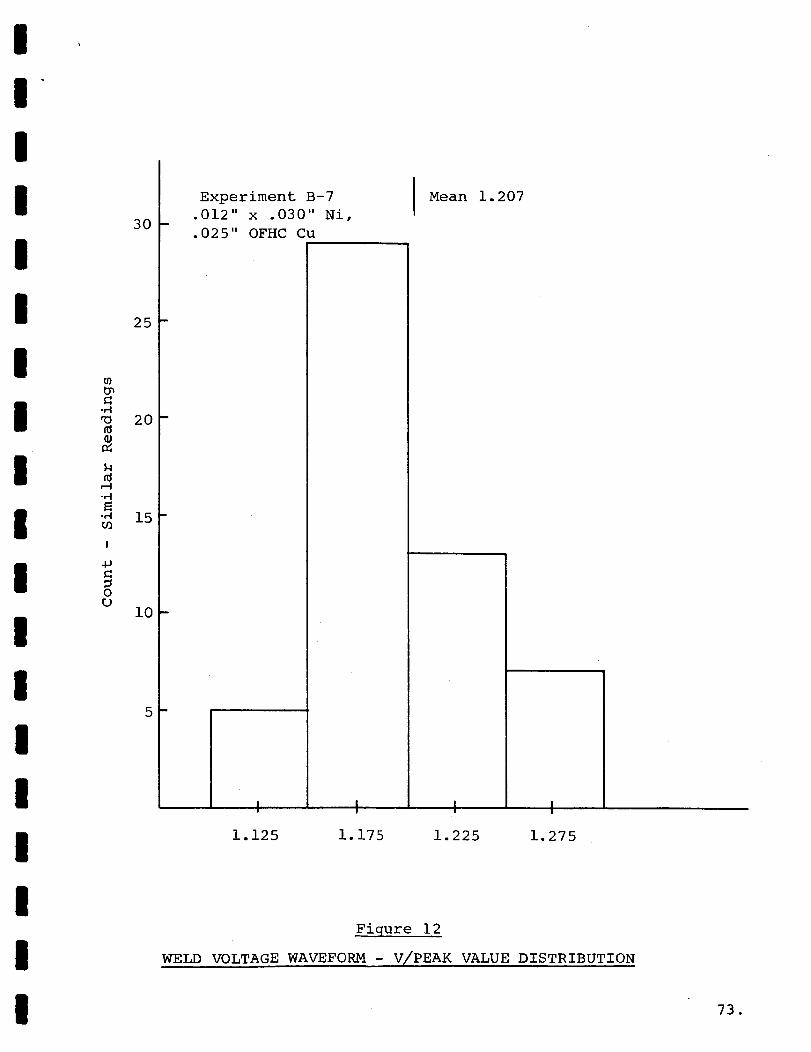
II
III
I
I
II
!II
!I
Ii
!
iI
3O
25
m
.,420
,-4
"_ 15
I
O
i0
Experiment B-7
.012" x .030" Ni,
.025" OFHC Cu
Mean 1.207
I I I I
1.125 1.175 1.225 1.275
Figure 12
WELD VOLTAGE WAVEFORM - V/PEAK VALUE DISTRIBUTION
73.
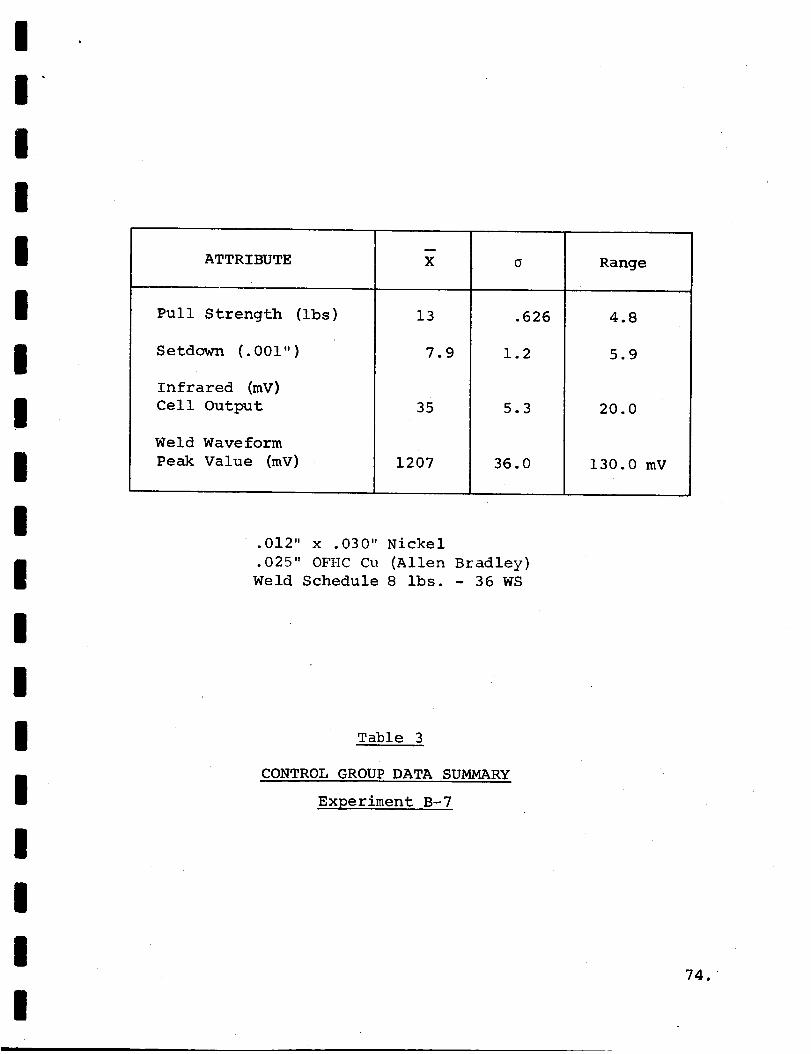
m
!
!
!
I
I
Ii
I
ATTRIBUTE
Pull Strength (ibs)
Setdown (.001")
Infrared (mV)
Cell Output
Weld Wave form
Peak Value (mY)
w
X o
13
7.9
35
1207
.626
1.2
5.3
36.0
Range
20.0
130.0 mV
I
III
I
II
II
I
.012" x .030" Nickel
.025" OFHC Cu (Allen Bradley)
Weld Schedule 8 ibs. - 36 WS
Table 3
CONTROL GROUP DATA SUMMARY
Experiment B-7
74.
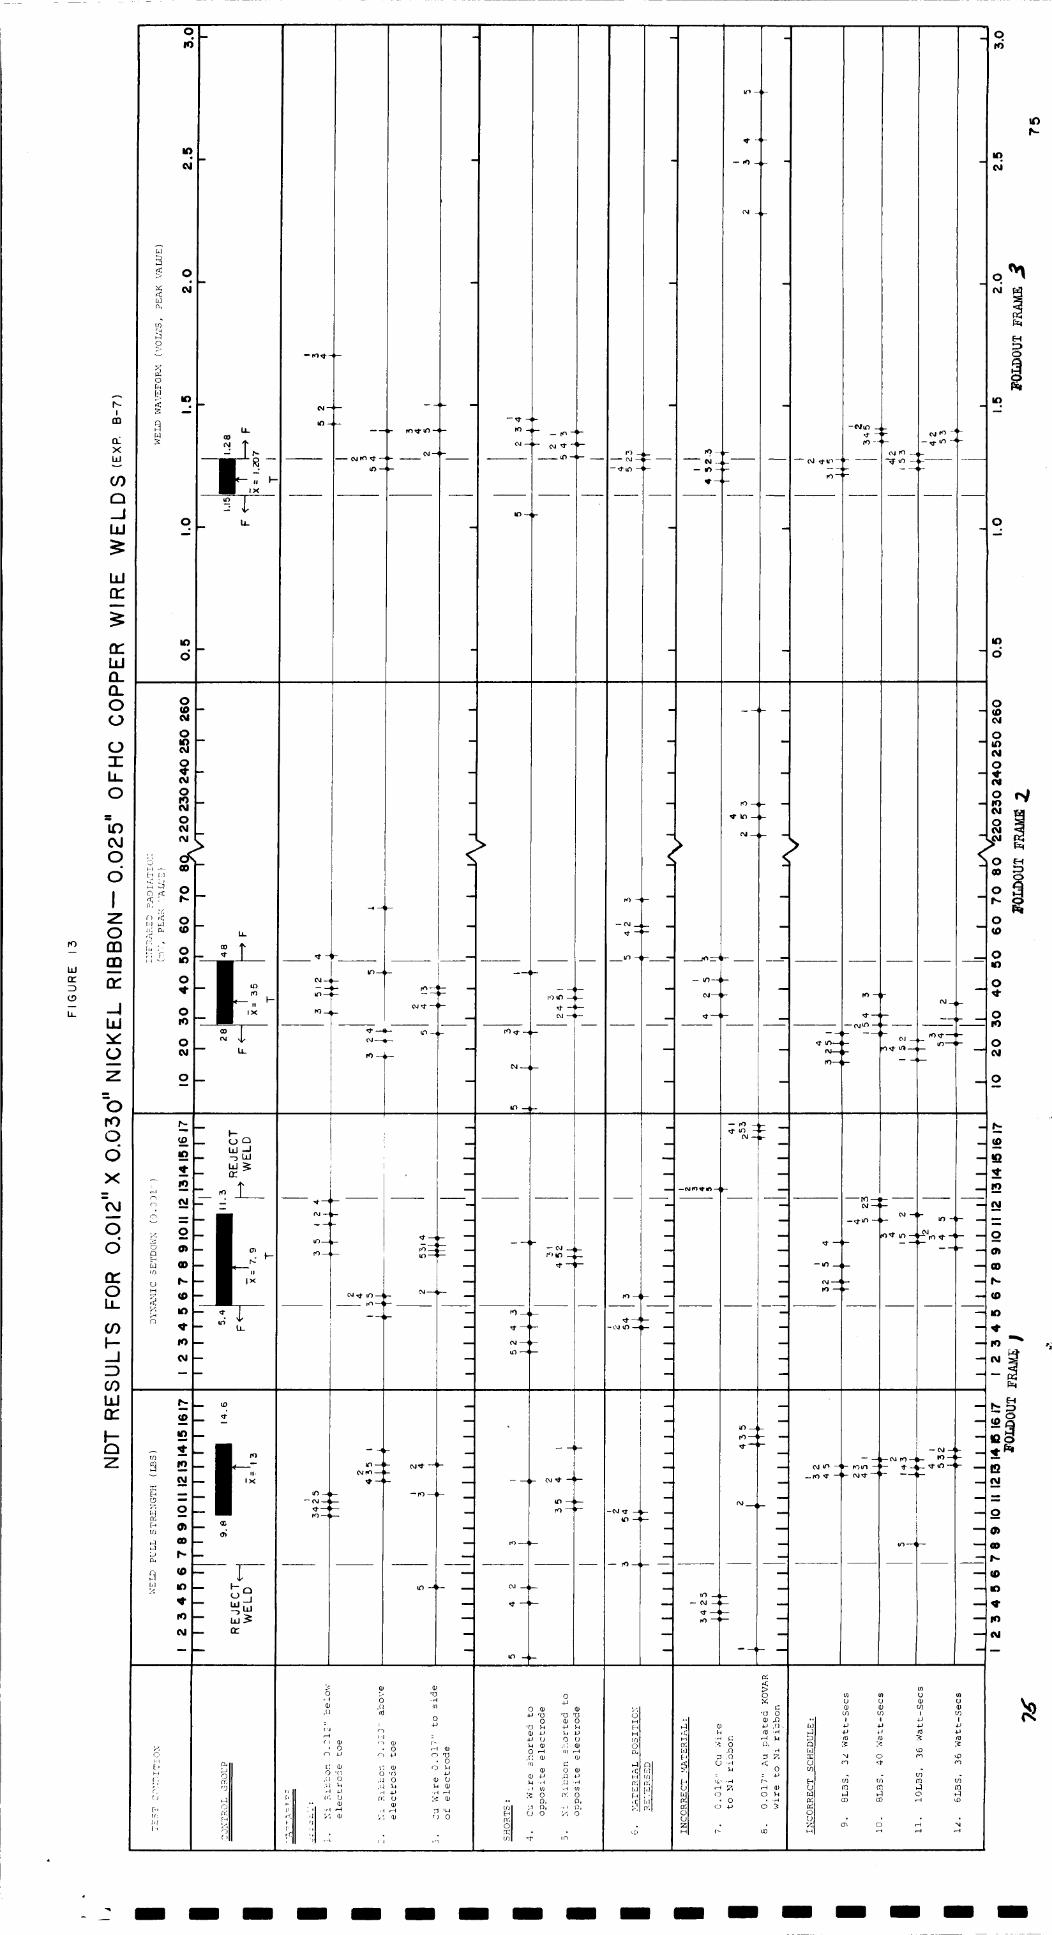
r0
hln"11D(..9
I.L
I
m
xwv
CO
C_
_,.lW
b.l
rr'
oo
od
IZO
rnm
n,"
--,I
v"(,o,
Z
O
o
O
X
('_
Oo
t'Yol,.l,_
0")l--_.lZ)
COW8C
l-(ZlZ
F_Fh
Ch[-4
O2'
O
x
MN
N
O
_4
N - -
O u_
hi}
W) ---_r
F-_
_-g
O
W}
O
8 .... o
O
_- g(',,,I
__ oN
g ,_ g
o ""-_ i o
i! ,,-
ii
O
O _
f,.
_ n
I..L
w_
__ w)
S N_.__£
5 gm _m_ ___ _ _-
×
_1"-- m
C_lm
_ m
_ m ii.
,,¢--q ;--.
-- (,,,j_ _
to-- --
3o
o
g,_
H _o; u
w
F- --
N --
m
m
m
n
l
--o__ _
m
i
m
I
N
m
m
m
m
m
m
m
m
m'9-- F-
(_-
u
I
m
w)
_r_
N
m
o
-- W)
-- _.
--
_ r. __,__.
-__
-- O
m
m
m
m
-- ,¢ -- _
m
P
r_c_r_ o• 0
r_ _J
,i 4-_
• 1 n)
.,-o
o
I-
C3• O
H ,-_
r) O
O4_
h _ ,{: •
(1; • ,cl
,* ul ,_ u)
W,©H
H
P_
A
H {/_(_; (z;
m
m
I
m
N
N
u
u
m
m
_¢)-- --
Q
U .,a., }q
• O
©U
m
m
m
m
m
i
0
'(_ o
r_ ._
0
,--t 19
O _
0 0 O_ 0Cr_ CO I u_
I _ _ o ,a
. . 0
m
E'
F'
hl[,
_9_ww_n,,-
o
0
F_
r)
_N
- _? I I I I I I I I I I I I I I I I I
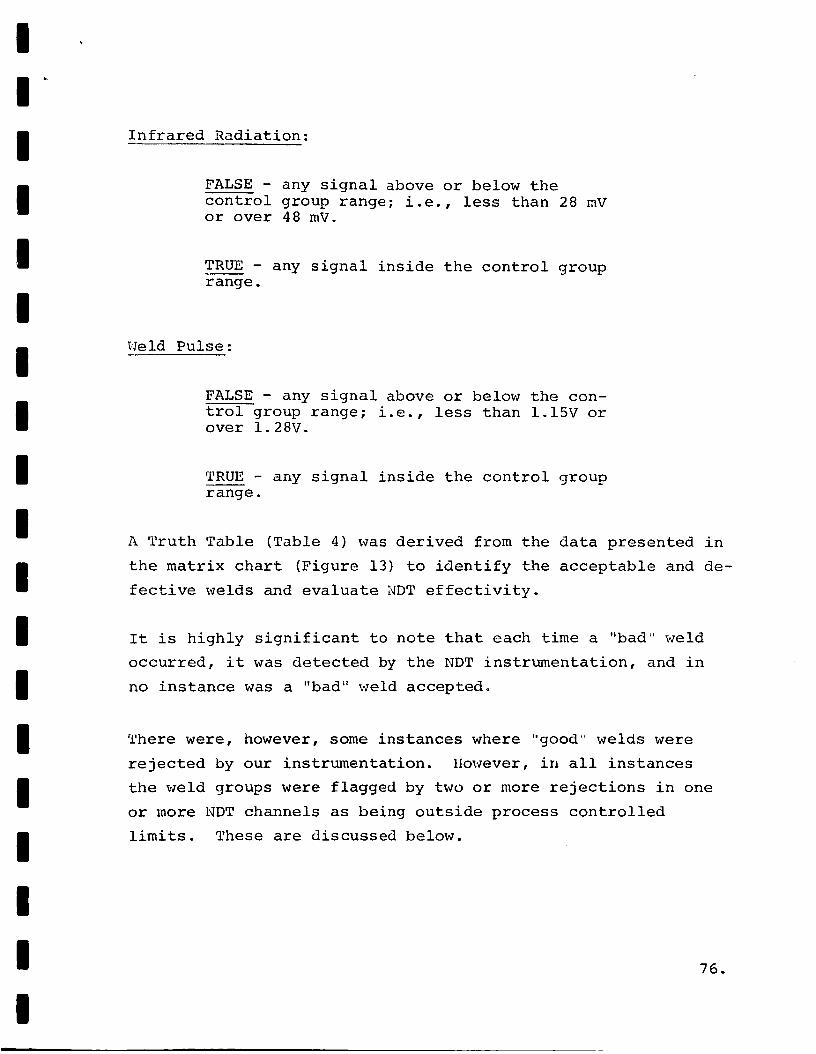
II
I
II
I
II
II
II
II
II
I
I
Infrared Radiation:
FALSE - any signal above or below the
control group range; i.e., less than 28 mV
or over 48 mV.
TRUE - any signal inside the control group
range.
_Teld Pulse:
FALSE - any signal above or below the con-
trol group range; i.e., less than 1.15V orover 1.28V.
TRUE - any signal inside the control group
range.
A Truth Table (Table 4) was derived from the data presented in
the matrix chart (Figure 13) to identify the acceptable and de-
fective welds and evaluate NDT effectivity.
It is highly significant to note that each time a "bad" weld
occurred, it was detected by the NDT instrumentation, and in
no instance was a "bad" weld accepted.
• here were, however, some instances where "good' welds were
rejected by our instrumentation, llowever, in all instances
the weld groups were flagged by two or more rejections in one
or more NDT channels as being outside process controlled
limits. These are discussed below.
76.
!
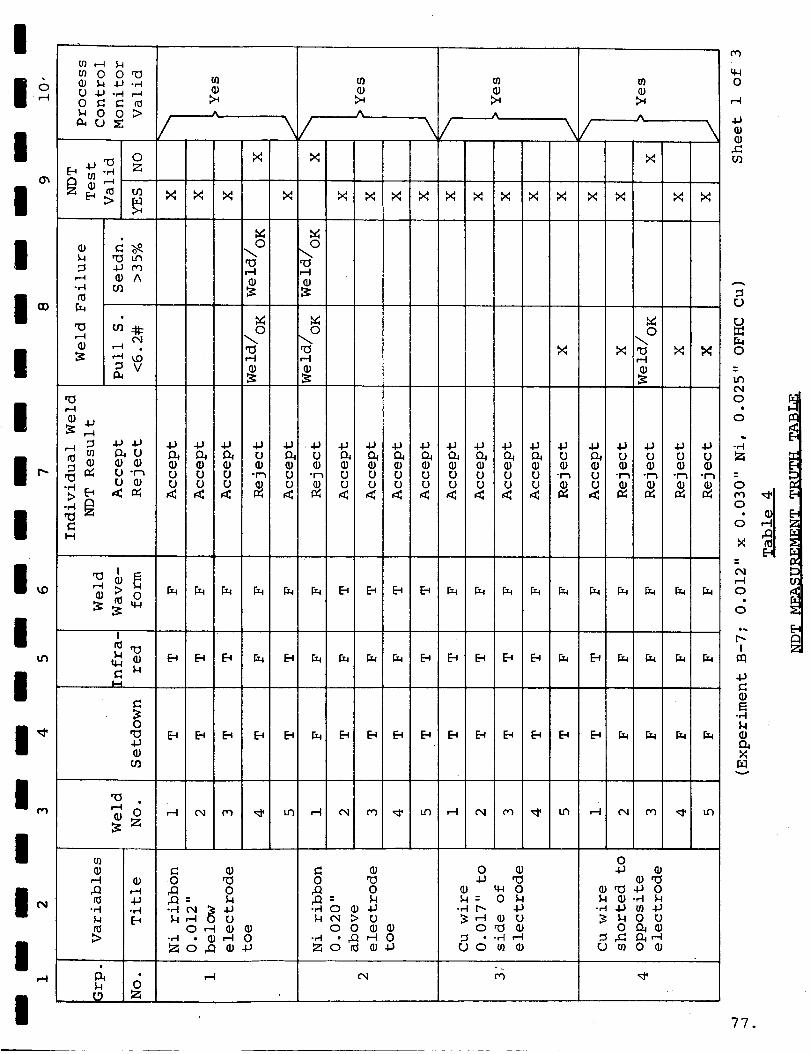
I
I
I
I
I,-4
I
I--4
0
0_n
'D
0
g)0
t
0
I
4.1
0
-,.4
0
X
Z
IZ (D0 "_,._ 0
- 1,4
0,-4 (D ••_ • _-I 0ZO_ O_
OO
-HO O 4J
o O O •
ZO _ O4J
0 •4J
• u_ 0_: 0 _•_ r-- 4J
o_ O• .H ,-I
OO u_ O
OO
O_O_O_O-_
-___00
0_0
omoo
77.
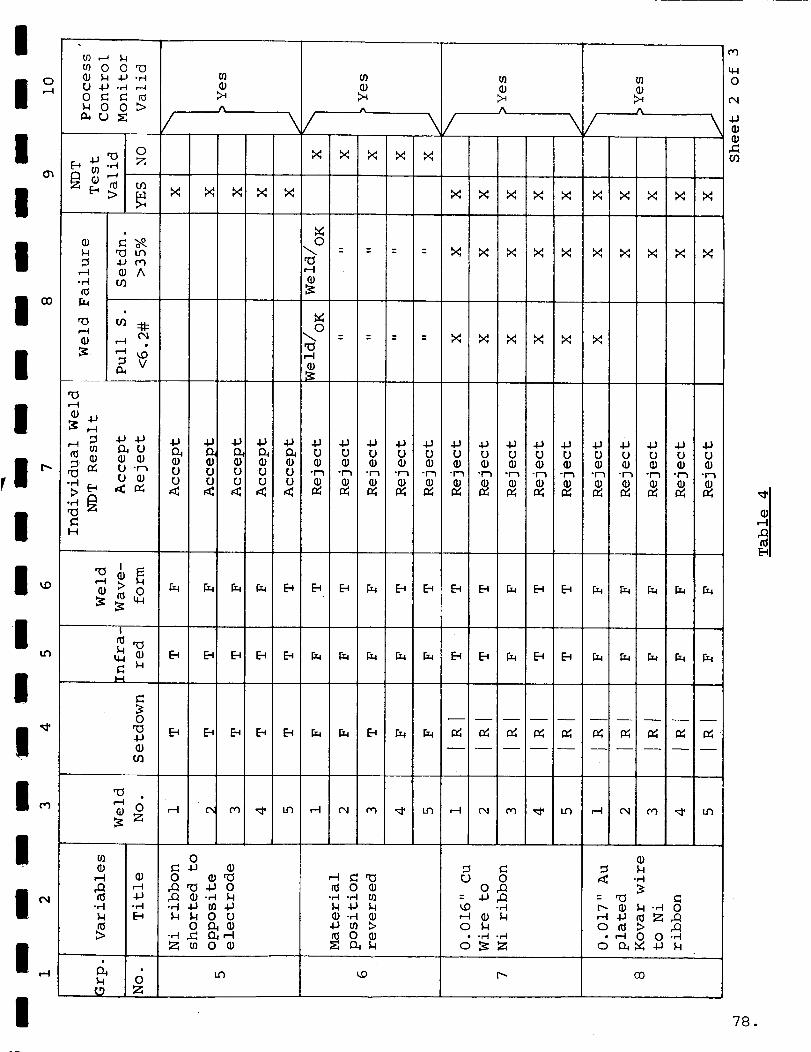
I_ 0 0'_
II _ °_'_0 _ _ __ 0 0 b
I 0
u1X _ X X X X X Ixl X Ixl X X X X X
I i,o ,--t
14-I
| '
0
|,, _,4-10
q-I0
o,I
\° 00
(1}
0
I °0
r--I 0
-,-I -,-I_1 [-I
D Z
I
0-I.J •
0 _"0_ "0 4a 0,.c:l 0-_ 1.4-H -I-I U} -IJI..! I-I 0 O
0 _0
t8 0 _•,-I-_N-I-IN_-,-I
I_I 0 0
Z ZO 0
O#a
_ 4-, ,a-,--t,-I 0 _0 14
0
= ,¢i
o _ _• ,-I 0 0 -,-_
"78.
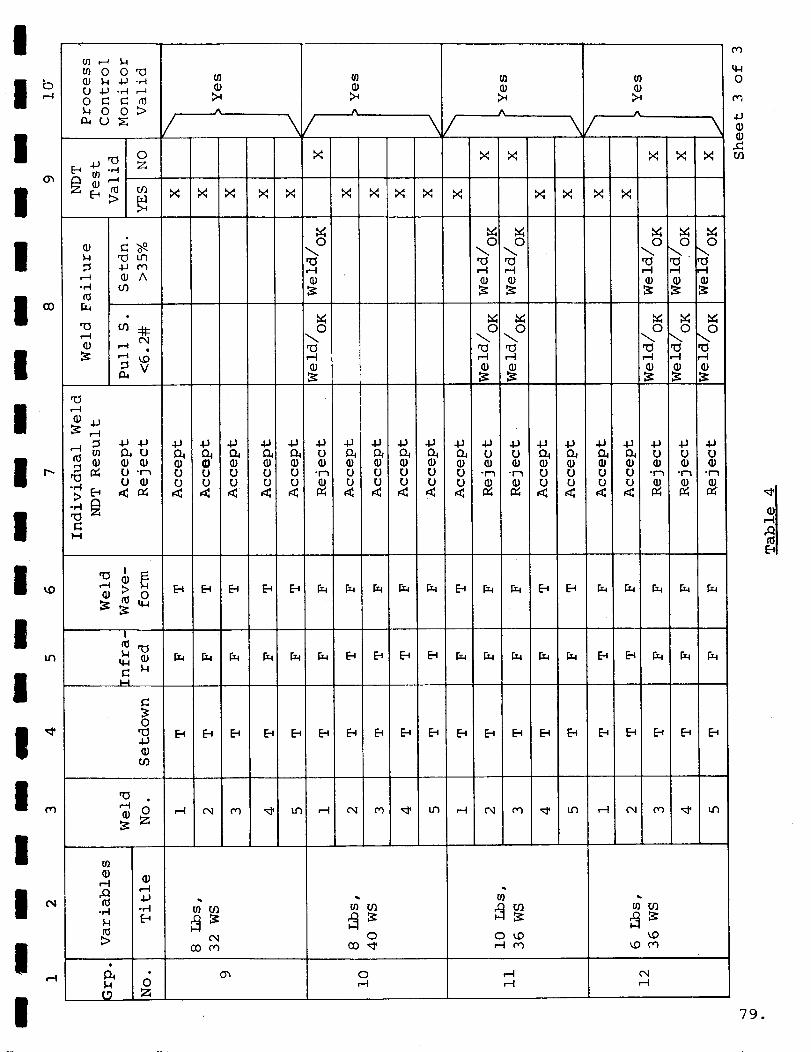
¢1 o_z
I o¢)r-I
rl:l
t_ Z
I
GO m
Oh
o
0
o _o,-.I i-q
_o_o rq
r-I
?9.
I
I
I
II
II
II
II
II
I
II
I
a. Group i, _'_eld #4
This weld was satisfactory in pull strength, but was re-
jected on infrared output and upon weld waveform. As is
evident from the matrix chart, all of the welds for this
group lay well outside the upper limit allowed for weld
waveform. In production, such repeated rejections would
flag an operator or module layout problem. This type of
process control sensitivity will be investigated further
in the production NDT program. For the test group of
welds, the process control rejection is valid.
b. Group 2, Weld #1
This weld showed considerable spitting, as may have been
deduced from the relatively high infrared reading (Fig-
ure 13). The weld pulse voltage exceeded the high limits,
and the dynamic setdown was below the minimum limit. The
weld did, however, meet the criteria established for an
acceptable weld relative to pull strength. The two or
more weld waveform out-of-limit values satisfy the cri-
terion established for showing the process control is un-
satisfactory, such as would occur from operator error, or
from faulty layout.
c. Group 4, Weld #3
This weld yielded a satisfactory pull strength; however,
two or more rejections by individual [_DT channels clearly
indicated the simulated operator error. Further, the
three weak welds fabricated in this group were detected
by the instrumentation.
80.
I
II
I
i
II
II
I
III
II
II
I
I
d. Group 6, _elds #i, #2, #3, #4 & #5
Each of these welds gave satisfactory pull strength re-
sults. Again, however, two or more rejections by indi-
vidual NDT channels would, in a production situation, be
indicative of a process control problem. In such cases,
the welder would be shut down until the cause of the
problem could be resolved. Therefore, the process con-
trol rejection is valid.
This particular test group was designed to simulate a
situation whereby the ribbon had been routed on the
wrong side of the component lead wire.
e. Group i0, Weld #i
Each of these welds gave satisfactory pull test results.
This group was designed to simulate the condition of in-
correct weld energy (40 ,;att-second instead of the 36 watt-
second weld schedule); two or more NDT channel rejections
again indicate lack of process control. This would de-
tect misapplication by the operator of one weld schedule
to a material pair requiring a different schedule.
f. Group ii, Welds #2 & #3
Each of these welds gave satisfactory pull strength re-
sults. This group was designed to simulate the condition
of incorrect weld force (I0 ibs. instead of 8 ibs. weld
schedule); two or more NDT channel rejections again in-
dicate lack of process control.
81.
I
I
I'I
I
II
I
II
III
I
II
II
I
g. Group 12, Welds #3, #4 & #5
Each of these welds gave satisfactory pull strength re-
sults. This group was designed to simulate the condition
of incorrect weld force (6 ibs. instead of 8 Ibs. weld
schedule); two or more NDT channel rejections again in-
dicate lack of process control.
2. E_eriment B-8
The background information pertinent to this specific experi-
ment is tabulated below.
Material.
Average Breaking
Pull Strength of
_laterials_
Weld Schedule
Pulse:
0.012" x 0.030" type A
nickel ribbon
0. 017" Kovar, gold-plated
Nickel - 23.0 ibs
Kovar - 19.4 ibs
6 ibs, ii watt-seconds
Long
Distribution of the measured weld parameters and pull strengths
for the control group of welds at optimum weld schedule are
illustrated in histographic form in Figures 14, 15, 16 and 17.
The statistical information is shown in Table 5.
The NDT measurement results for the complete experiment are
shown in Figure 18. The range of pull strength values and
weld parameter measurements for the control group are repre-
sented by the solid black bars in the control group row of
the chart.
82.
I
I
II
II
I
IoI
-,.-I
!
0
i
III
I
III
16 Experiment B-8
.012" x .030" Ni
to .017" KOVAR
I
i0 12
Mean 14.6 Lbs
I I
14 16
Pull Strength (Lbs)
Figure 14
PULL STRENGTH DISTRIBUTION
I
18 2O
83.

I
n 24
I
I 2O
I
I16
| _o
•a 12
oo
! 8
I
I 4
I
I
!
I
!
5
Experiment B-8
•012" x .030" Ni
to .0i7" KOVARI Mean .0071"
b
I I I I l
6 7 8 9 i0
Dynamic Setdown (. 001")
Figure 15
DYNAMIC SETDOWN DISTRIBUTION
I
ii
84.
I
I20-
I
i 18-
I 16--
I14--
-4
l io-4
I8--
I 4--
I2
I
I
I
I
Experiment B-8
.012" x .030" Ni
to .017" KOVAR
Mean 46.45 mV
35 40 45 50 55 60
Infrared Peak (mV)
65
Figure 16
INFRARED PULSE AMPLITUDE DISTRIBUTION
70
85.
III
I
II
II
II
II
II
II
II
I
-,-I
,--1
-,-IO3
I
:Jou
20- -
18" "
16-"
14--
m
12
i0---
8""
6--"
4- --
2- --
1.4
Experiment B-8
• 012" x .030" Ni
tO .017" KOVAR
Mean 1.62 Volts
I ] I I
1.5 1.6 1.7 1.8
Weld Pulse Peak (Volts)
Fiqure 17
WELD VOLTAGE WAVEFORM - V/PEAK VALUE DISTRIBUTION
!
1.9
86.
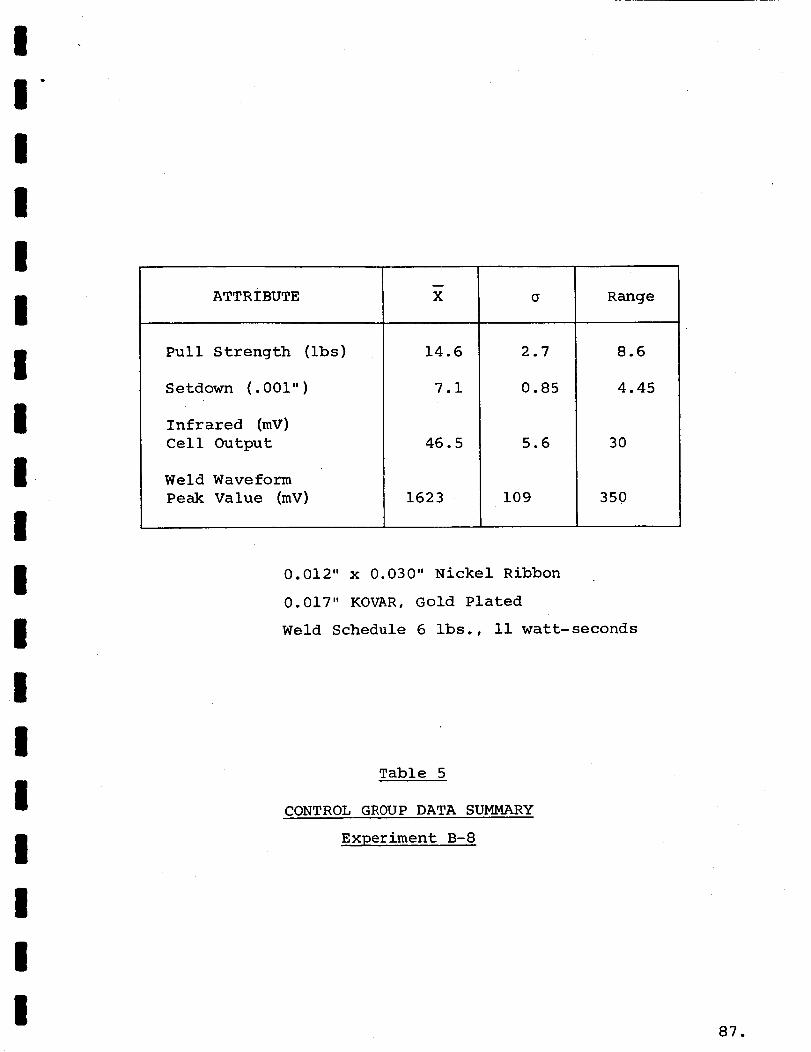
II
II
II
III
II
II
II
III
I
ATTRIBUTE
Pull Strength (ibs)
Setdown (.001")
Infrared (mV)
Cell Output
Weld Waveform
Peak Value (mV)
m
X
14.6
7.1
46.5
1623
2.7
0.85
5.6
109
Range
8.6
4.45
30
350
0.012" x 0.030" Nickel Ribbon
0.017" KOVAR, Gold Plated
Weld Schedule 6 ibs., ii watt-seconds
Table 5
CONTROL GROUP DATA SUMMARY
Experiment B-8
87.

X_o
X0
5
©
:t_,-4o
o
I
ZOmm
u_
W r_
,-;- oo
M
,--to
o
Or..
121Z
o
_L___
< -->
<
©>
_. o© --a_ ---"
<
M
t¢_ IIPI --t_-
--_'f_ IC__ -
o o
O
(M
o
o
oLt3
o
w_M ...... -_ oJO o. O(M - o6 _-- __ ___ -_ oJ
I
_ - ..... ._ ")_
t,- ....... r--- _ -(D _ -- _ (D
-- _--_ -- - 10 -_- - --
tO_ _ _- __ _____ _-i- .....
O _ - - (_ - _-_- --- -L- _-_ O
OD ....... OD
-- t- I_-r-- -- _-- -_ ....
0C3 __ ---_o- ill_ I ..... _)_r - _-_LO .... _ -- - _r
(M ........ (M
N- _ --Nit)- _-
o0 _J4J
_ o_0 _J ,c: rj
o • ._4J
_o _o_ O_ 0 C)_'_ o :< o
• °
:;7C
FH
0_J
P/
[J 0
U o
e_o
_ mo
u) i11
_ rn en en ¢n
O Nr..) _ •
a_
o _m
0 <
O
_9
0_J
o_ _-_
r_ o 14121,--t • 4_,£t _; o tj,Q
_o X_
OH
H
Z0[J
E_
(D
---- n m m _ m m i m m m m m m m mm mm
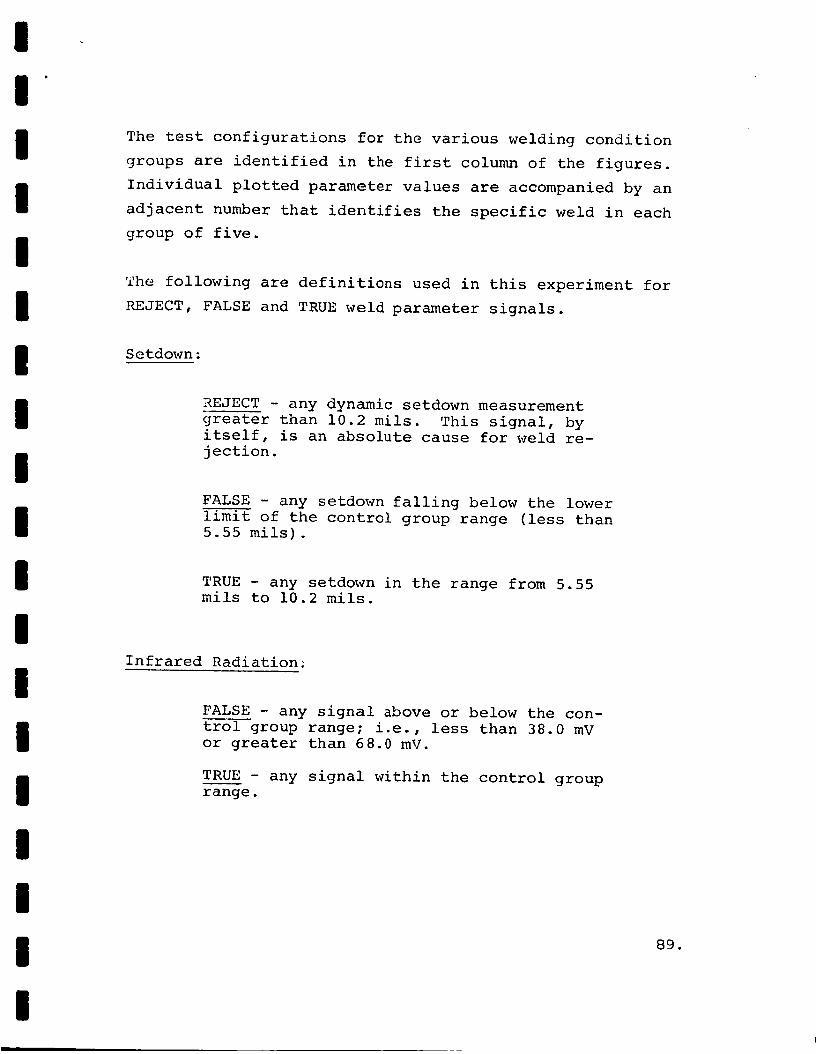
II
I
II
II
II
II
II
II
III
The test configurations for the various welding condition
groups are identified in the first column of the figures.
Individual plotted parameter values are accompanied by an
adjacent number that identifies the specific weld in each
group of five.
• he following are definitions used in this experiment for
REJECT, FALSE and TRUE weld parameter signals.
Setdown:
_EJECT - any dynamic setdown measurement
greater than 10.2 mils. This signal, byitself, is an absolute cause for weld re-
jection.
FALSE - any setdown falling below the lower
limit of the control group range (less than5.55 mils).
TRUE - any setdown in the range from 5.55mils to 10.2 mils.
Infrared Radiation_
FALSE - any signal above or below the con-
trol group range; i.e., less than 38.0 mV
or greater than 68.0 mV.
TRUE - any signal within the control group
range.
89.
I
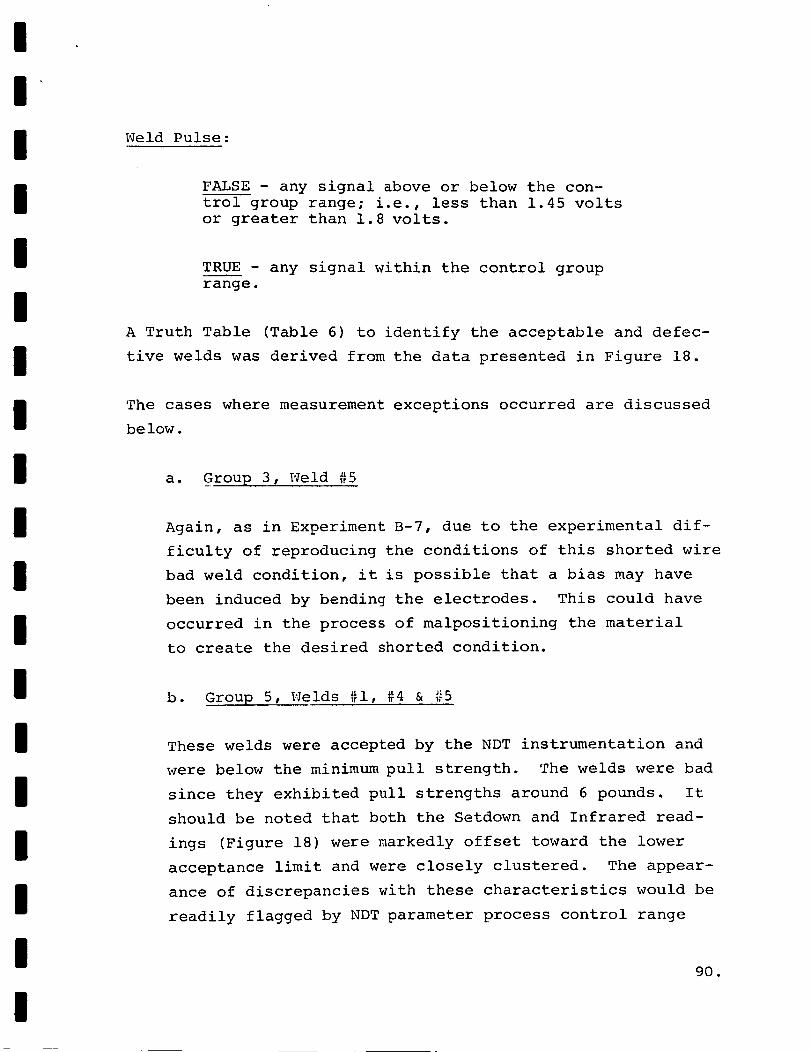
I
I
I
I
II
II
III
I
II
II
III
Weld Pulse:
FALSE - any signal above or below the con-
trol group range; i.e., less than 1.45 volts
or greater than 1.8 volts.
TRUE - any signal within the control group
range.
A Truth Table (Table 6) to identify the acceptable and defec-
tive welds was derived from the data presented in Figure 18.
The cases where measurement exceptions occurred are discussed
below.
a. Group 3, Weld #5
Again, as in Experiment B-7, due to the experimental dif-
ficulty of reproducing the conditions of this shorted wire
bad weld condition, it is possible that a bias may have
been induced by bending the electrodes. This could have
occurred in the process of malpositioning the material
to create the desired shorted condition.
b. Group 5, Welds #1, #4 & #5
These welds were accepted by the NDT instrumentation and
were below the minimum pull strength. The welds were bad
since they exhibited pull strengths around 6 pounds. It
should be noted that both the Setdown and Infrared read-
ings (Figure 18) were markedly offset toward the lower
acceptance limit and were closely clustered. The appear-
ance of discrepancies with these characteristics would be
readily flagged by NDT parameter process control range
90.
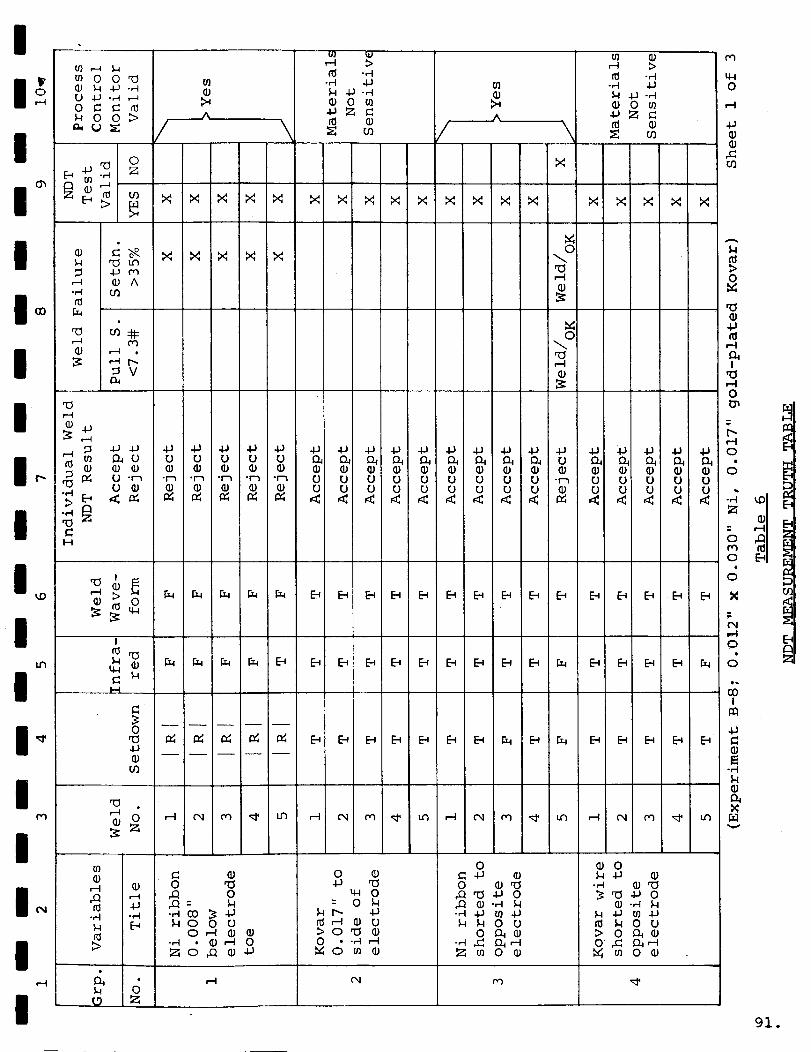
I
I L
91.
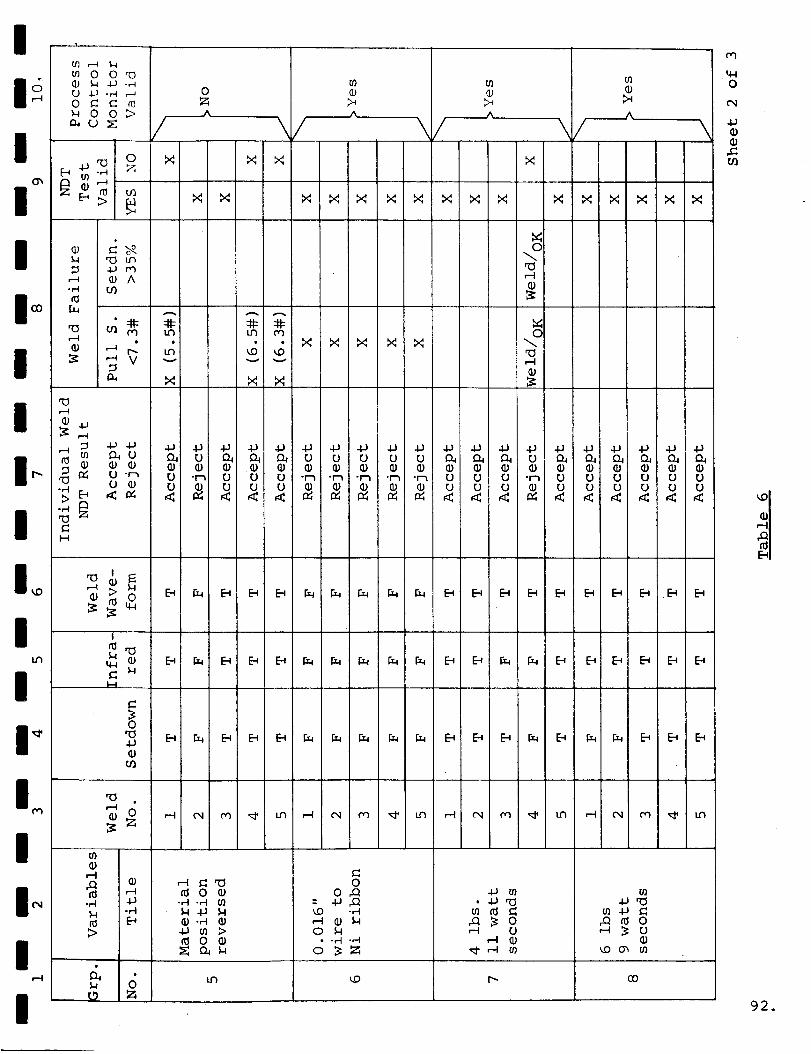
m 0 0 _0_ 4-J .,_
0 _ _ _1_ 0 0 >
0
0
A
X X
X X X X X X X X X X
0
cq
X 4-1
,C
X X X X X X
_ u-_
• A
.,-in_
2_ ,--4 t_N _ V
,--t
e.-t
O
"_ < _
H
,--I
t14
O_
A A A
m m m 0• -- . _ _ _ _ _
m _o _O _J
!
C _H
C>0
,-t_a
>
&
e-,
_ 0 •-_I -_I {_
_-_
_ 0 _
_ o_
0
o_= __) -H
0• -rq -,-I
40
_ Fd _
_)0 _ _ 0
_00_
92.
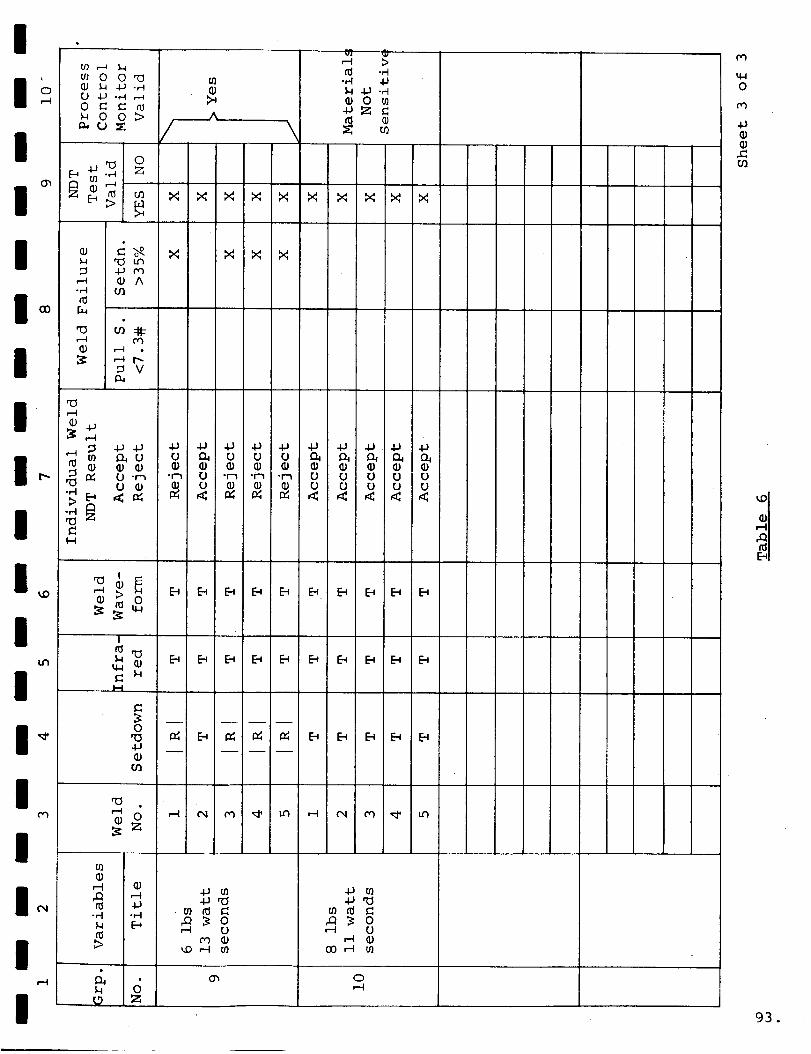
II o
I
u] O O ,'O(]) _ 4J-_U 4J -_ ,.-_
_ 0 0 >
0
_ z
ul.J .,_•_ 4-I
_ 0 _4J_ =
X Ix: _ X X X X X _4 X
,-t i1) A• ,-i u'l
I °
X X X X
I _o _l,O ,-I
IH
I o4-1
G}
I
I-II
B B B B B B B B B B
B B B B B B B B B B
B I_ _ IZ B B B B B
{B
4.1 In _ I::I-,-I -,--I
_-4 Om
t9
4-) In4J
_ 0,--4 U
00 ,-t
o_ o,-4
o_
0
.Cu_
93.
I
I
I
I
I
I
I
I
I
I
I
I
I
I
I
I
I
I
plots (R) which would be maintained continually in pro-
duction welding, as discussed in C, 1 of this section,
last paragraph. This also indicates that the universal
acceptance criteria established for the NDT feasibility
evaluation may require adjustment for optimum effectivity.
This will be considered during the NDT prototype evalua-
tion program to be performed under actual production con-
ditions.
c. Group 7, Weld #4
This weld was made at 4 pounds and ii watt-seconds as com-
pared to the 6 pounds and Ii watt-seconds weld schedule
values. The pull strength was acceptable. As can be seen
from the matrix chart, Figure 18, the Group 7 welds all
tended to cluster toward the low end of the setdown limits,
and toward the high end of the infrared limits. This in-
dicates the NDT measurements to be responsive in trend to
the lighter welding electrode force. Weld firing at low
welder-force is very unlikely, unless there has occurred
some consistent shift in the machine operation. This
trending would appear to provide a valid indication of
change in process parameters, which will be explored
later during production evaluation.
3. Experiment B-9
The background information pertinent to this specific experi-
ment is tabulated below:
Material: 0.012" x 0.030" type Anickel ribbon
0.020" Dumet, gold-plated
94.
I
II
I
II
II
I
III
II
II
I
III
Average Breaking
Pull Strength ofMaterials:
Weld Schedule:
Pulse_
Nickel - 23.0 ibs
Dumet - 21.6 ibs
8 ibs, 16 watt-seconds
Long
Distribution of the measured weld parameters and pull strengths
for the control group of welds at optimum weld schedule are il-
lustrated in histographic form in Figures 19, 20, 21 and 22.
The statistical information is shown in Table 7.
The NDT measurement results for the complete experiment are
shown in Figure 23. The range of pull strength values and
weld parameter measurements for the control group are repre-
sented by the solid black bars in the control group row of
the chart.
The test configurations for the various welding condition
groups are identified in the first column of the figure.
Individual plotted parameter values are accompanied by an
adjacent number that identifies the specific weld in each
group of five.
The following are definitions used in this experiment for
REJECT, FALSE and TRUE weld parameter signals.
Setdown:
REJECT - any dynamic setdown measurement
greater than 11.2 mils. This signal, by
itself, is an absolute cause for weld re-
jection.
95.
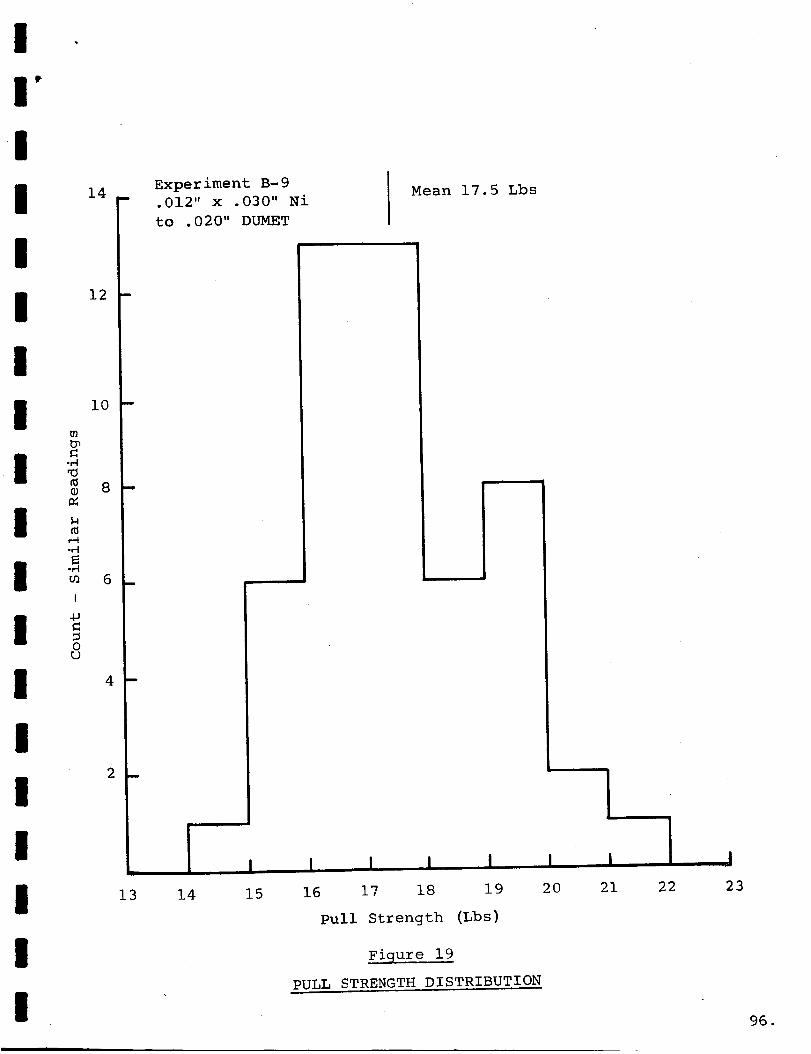
II"
iI
II
I
III
I
III
I
III
I
t_
n_
-PI_n
I
-p
ou
14 _
12 -
i0 --
8 --
6 _
4 --
2_
13
Experiment B-9
•012" x .030" Ni
to .020" DUMET
I I
14 15
Mean 17.5 Lbs
I I I I I
16 17 18 19 20
Pull Strength (Lbs)
Figure 19
PULL STRENGTH DISTRIBUTION
II
21
I22
I
23
96.
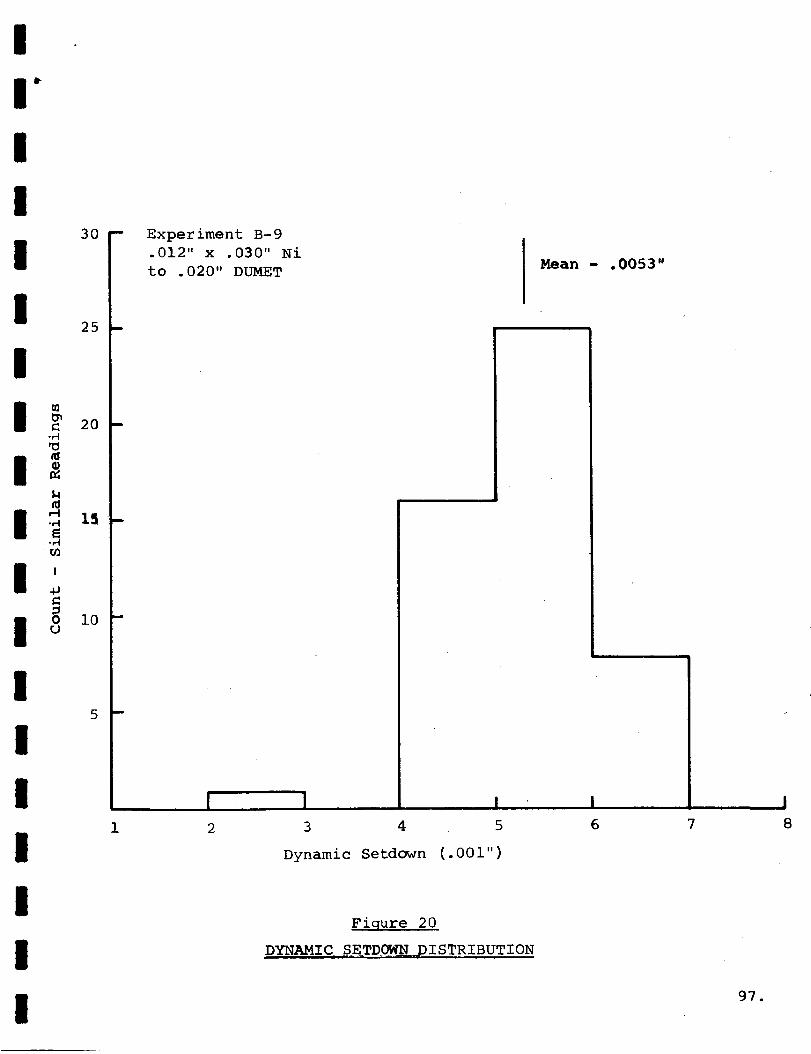
!
!
!3O
!
!25
!
20
-H
I I
| o lO
!5
!
!
!
!
!
!
n
1
Experiment B-9
•012" x .030" Ni
to .020" DUMET
I2
Mean - .0053"
3 4 5
Dynamic Setdown (.00 i" )
6
Fiqure 20
DYNAMIC SETDOWN _DISTRIBUTION
7
97.
I8
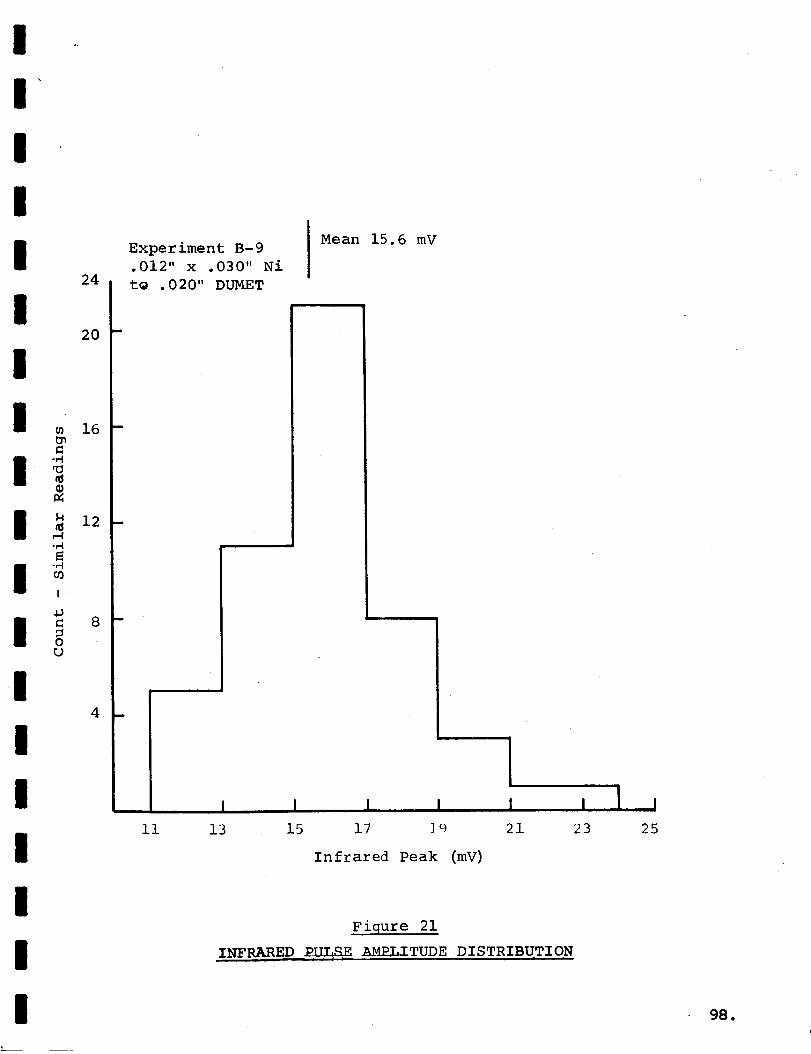
I
I
I
I
I
I
I
I
I
I
I
I
I
I
I
I
I
I
24
2O
16
_ 12r-4
-,-t
I
_ 8
0U
4
Experiment B-9
.012" x .030" Ni
to .020" DUMET
Me an 15.6 mV
ii
i I i I
13 15 17 ] g
Infrared Peak (mV)
II
21
i
23
Figure 21
INFRARED __P_LITUDE DISTRIBUTION
I
25 ¸
98.
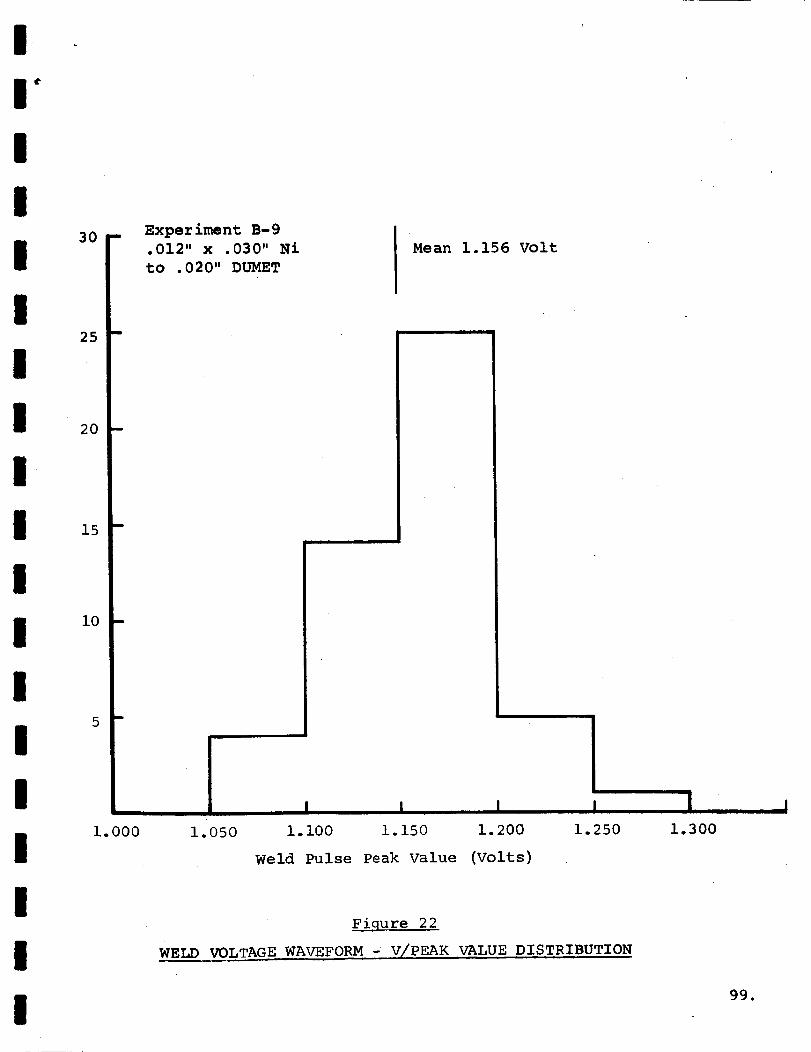
30 --
25 -
20 -
15 -
i0 -
5
Experiment B-9
•012" x .030" Ni
to .020" DUMET
Mean 1.156 Volt
1.000 1.050 i. i00 i. 150 i. 200
Weld Pulse Peak Value (Volts)
1.250 1.300
Fiqure 22
WELD VOLTAGE WAVEFORM - V/PEAK VALUE DISTRIBUTION
99.
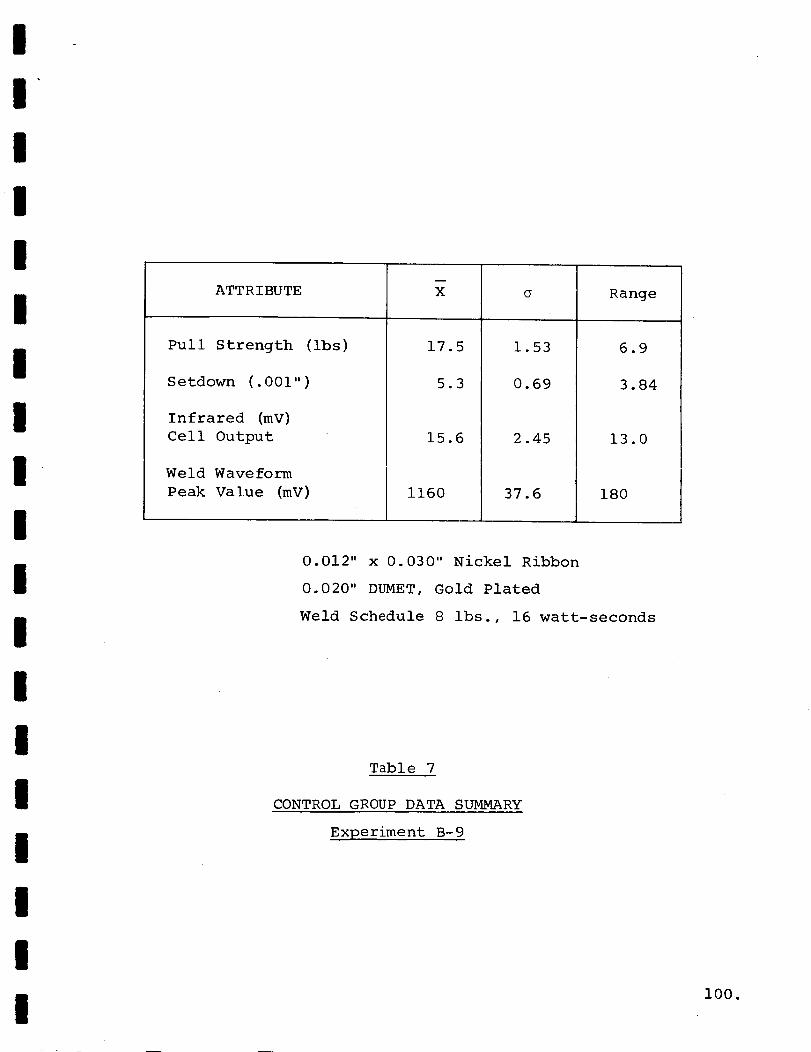
I
II
II
I
III
II
II
II
II
II
ATTRIBUTE
Pull Strength (ibs)
Setdown (.001")
Infrared (mV)
Cell Output
Weld Wave form
Peak Value (mY)
m
X
17.5
5.3
15.6
1.53
0.69
2.45
1160 37.6
Range
6.9
3.84
13.0
180
0.012" x 0.030 °' Nickel Ribbon
0.020" DUMET, Gold Plated
Weld Schedule 8 ibs., 16 watt-seconds
Table 7
CONTROL GROUP DATA SUMMARY
Experiment B-9
i00.
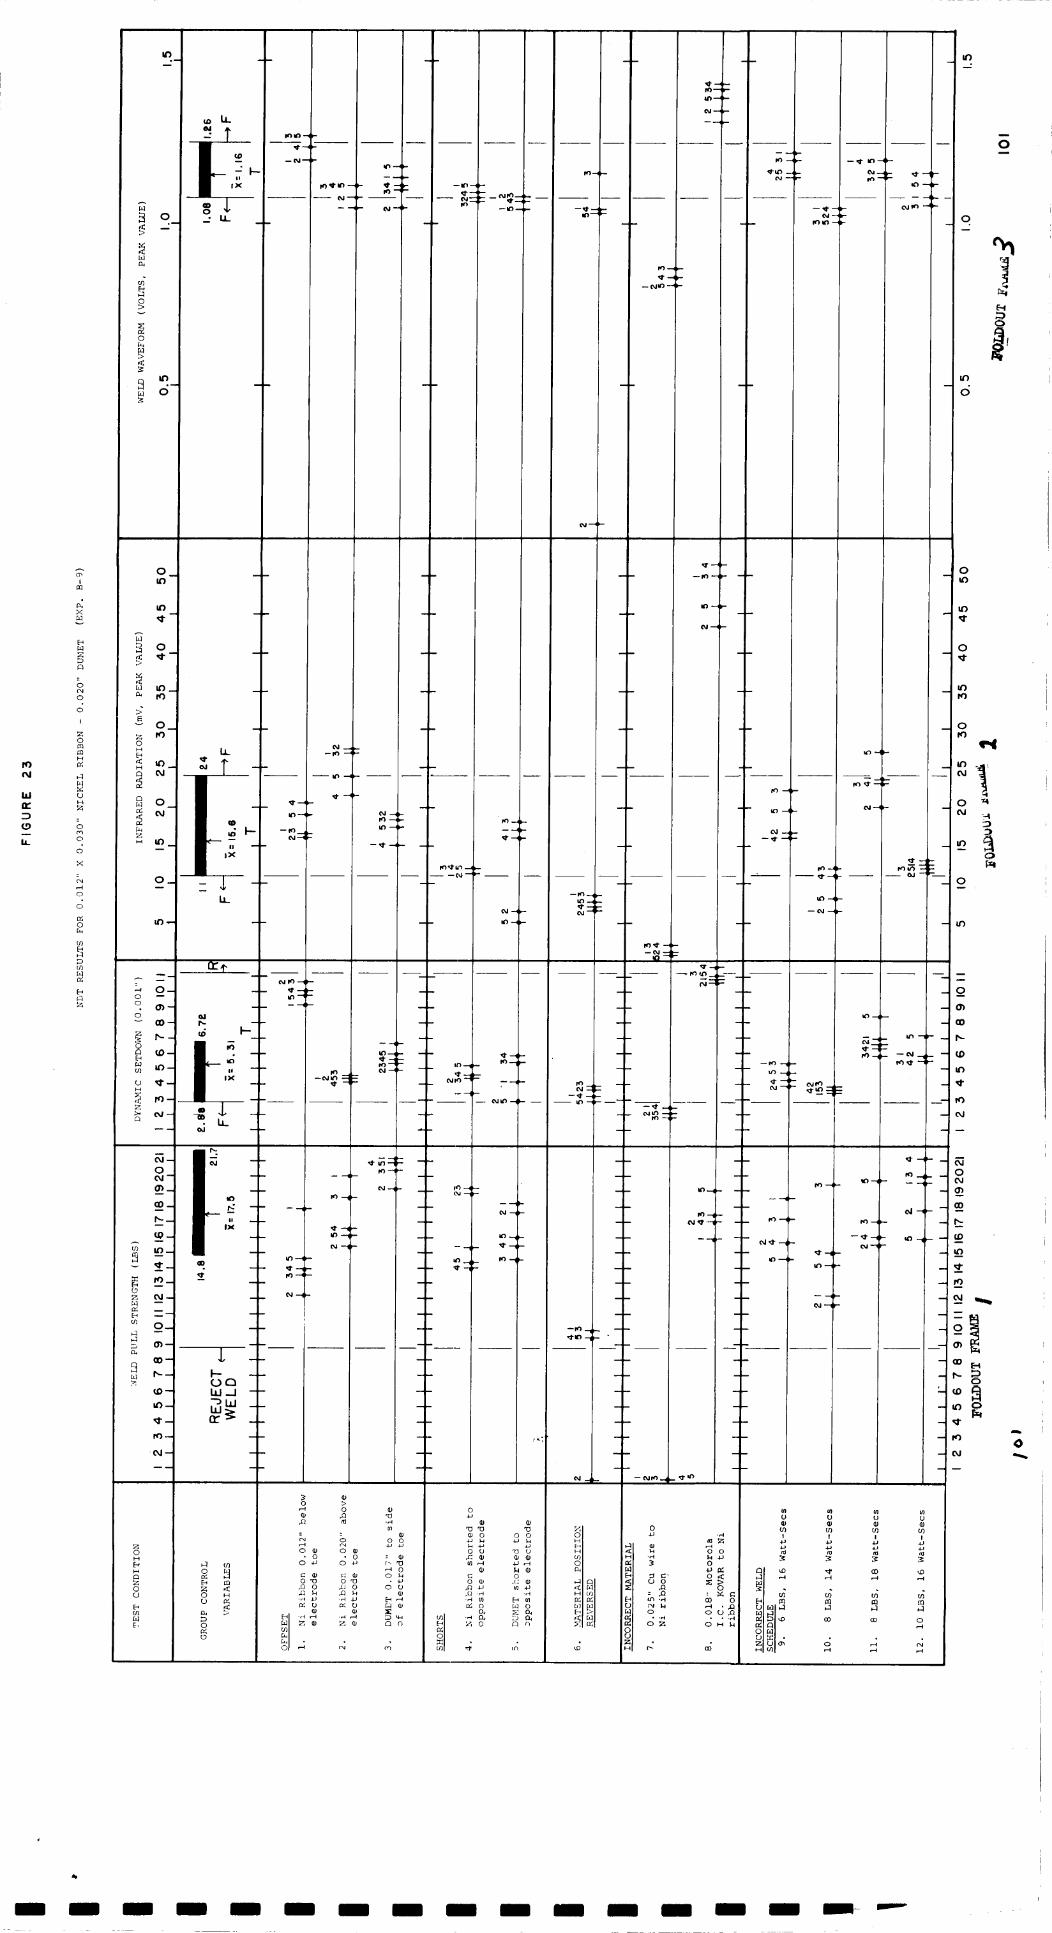
Io
hi
:D(.9
I,i-
D_
M
o.]0
0
I
Z
nn
MMU
Z
bo30
dX
,--Io
o
r_©r_
o3
Z
o
o_0
0
0
m m m m m m m m mm u m m m m m m-
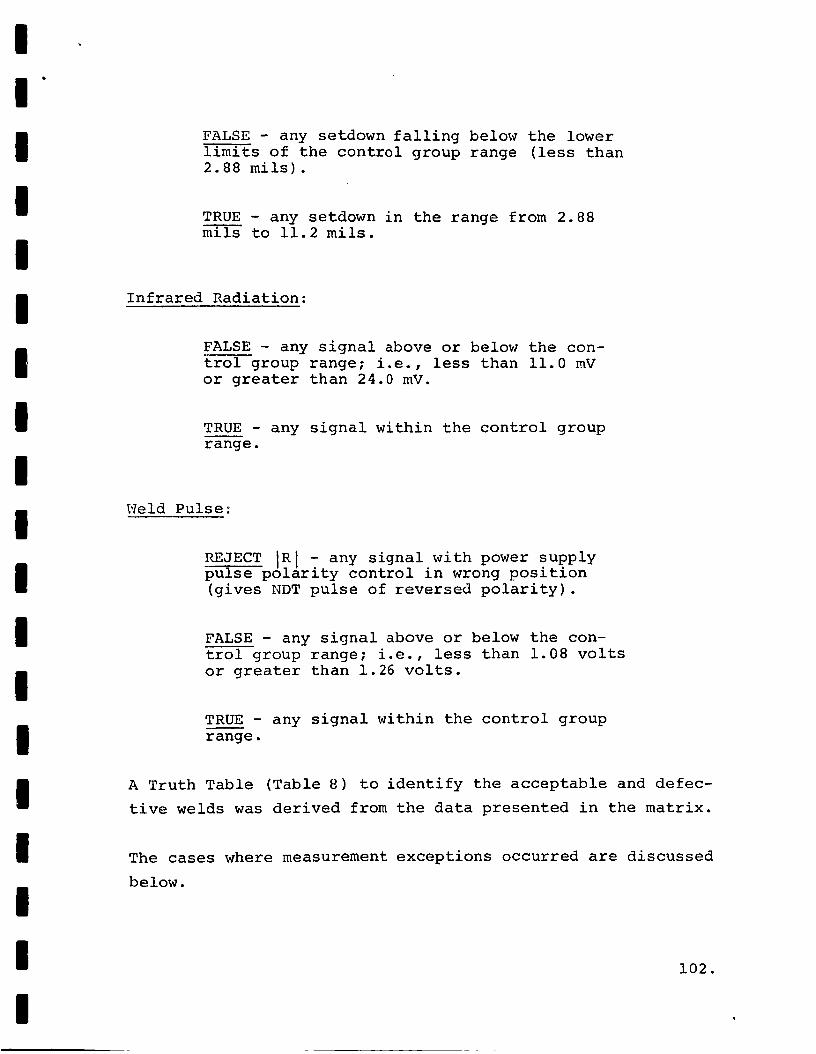
I
I
I
l
I
I
I
l
I
l
l
I
I
l
I
I
I
I
I
FALSE - any setdown falling below the lower
limits of the control group range (less than
2.88 mils).
TRUE - any setdown in the range from 2.88mils to 11.2 mils.
Infrared Radiation:
FALSE - any signal above or below the con-
trol group range; i.e., less than ii.0 mV
or greater than 24.0 mY.
TRUE - any signal within the control group
range.
Weld Pulse;
REJECT IRI - any signal with power supply
pulse polarity control in wrong position
(gives NDT pulse of reversed polarity).
FALSE - any signal above or below the con-
trol group range; i.e., less than 1.08 volts
or greater than 1.26 volts.
TRUE - any signal within the control group
range.
A Truth Table (Table 8) to identify the acceptable and defec-
tive welds was derived from the data presented in the matrix.
The cases where measurement exceptions occurred are discussed
below.
102.
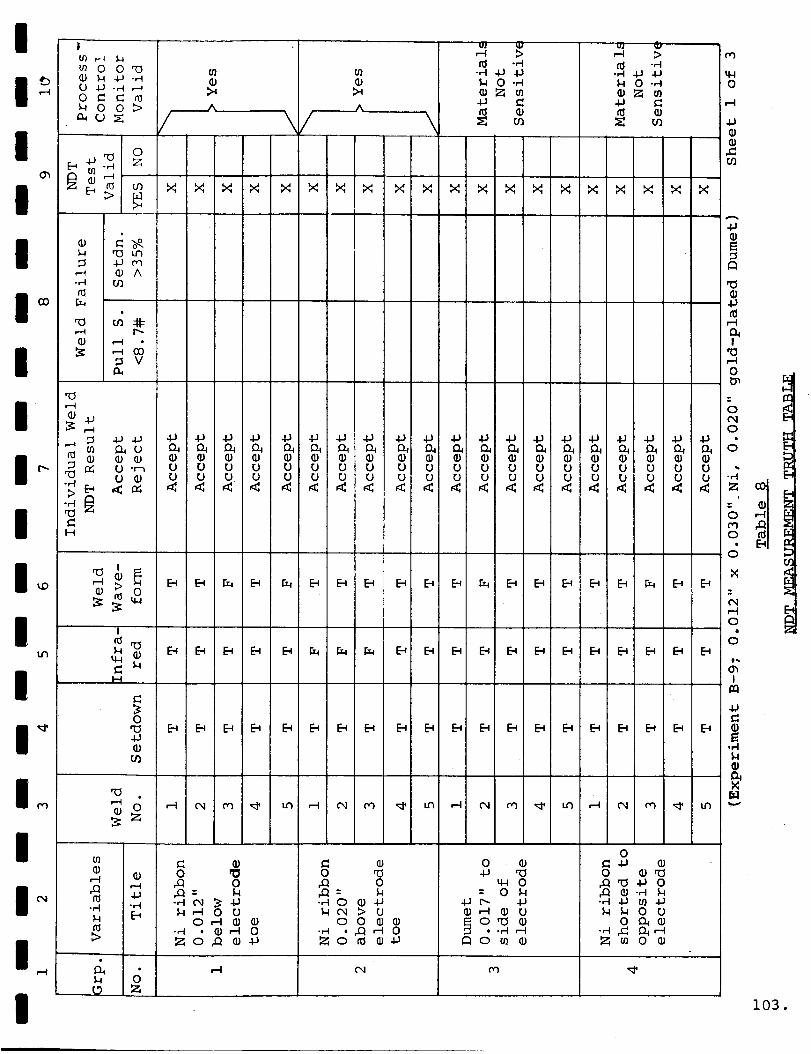
I
I
1
_n 0 0 "0• _ 4J-_
0 C _ r__ 0 O>
\
_u
0-_ _ 0-,4 0
I0
0
103.
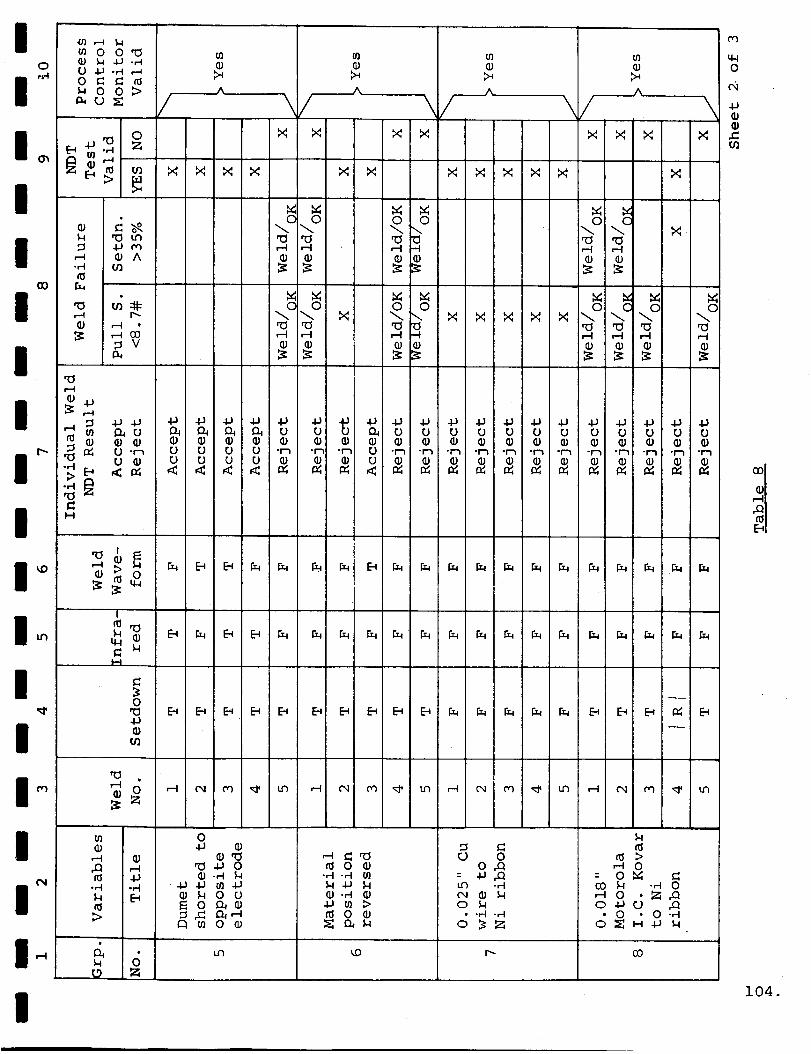
_n 0 0 ,'00 _ _ 4J .4
_ _ ._ ,-_
I "_ 0 _ _ __ 0 O>
_ oIo_I >_
CI)
II
I
II
Ii °
)4
r_ A
r_
v
Q.) Q.)C_ U mn
U •"_ ,_
M
,--4_o
I Lo
I
I
I
F-t
0
4_O
O
I
I
OrM#a
n_>
&_9
4_-M
I
X X _ X
O
\/ _--\/O
_A
\/-_--
u_0
c_
00
r_
o o
"el,-4 ,-i
0 0
"el,-I ,-I
0 0 0 C_._ _
_ r_,--I_-I ,--I r--IO • • •
0 0 C 0 0
,-I r-I ,-I ,-I ,-I ,-I• • • • • •
4_ 4_ 4_ 4_ 4_
• • • • •
U U U U
E_ E_ _ _ E_
04_ •
O__4_ 00-,-t _1
O _ O UE o _o
-,-I -,-I_ J_ _O-_ •
C_ 0 _ >O_ ,-4O
--_ : o_ =co -_ co _ -_ 0
• _ _ 0 ._o _ O4_C;•-r-I-,-I • 0 • 0-,-Io :__; o :_ _ _ _
104.
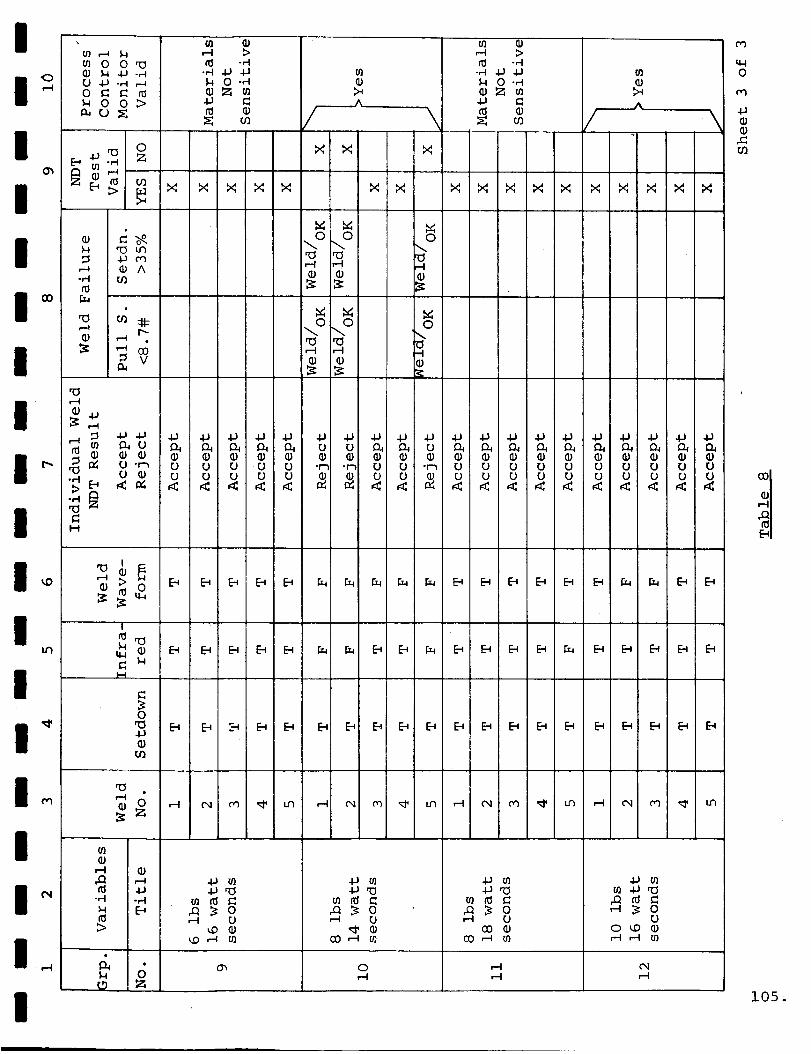
I
I
I
I
i °
{n 0 0 "0
0 4--}.,-_,--_0 IZ _ _hOOD,alO_
0
(If -_
0-_• Z m
X X
X X X _ X X
-,-I-,-I.I-}_
0-,-I{o
>4
X _¢ _¢ >¢ >¢ >¢ >¢ >¢ >¢ >¢
_ o o o_0 u__ m rcI q_
_-_ • A ,-_ _-I .._
0
X 4_
.Cu_
I _o_
IIMI o
0
I _E_ _ _ E_ E_ E_ E_ E_ _ E_ E_ E_ E_ E_ E_
I
>
&
r-_4-1
E_
Z
_)o
o_
4-} {0
_) o
CO _-q U_
0
_)o
oo r-q {0
40 {0
_ _ 0O
0 _0 _,-I ,-I
o,I,.-I
I 105.
I
I
II
II
I
II
III
I
II
II
I
a. Group 5, Weld #5
The pull test results were satisfactory for this weld.
As in B-7 and B-8, due to the experimental difficulty
of reproducing the conditions of this shorted wire bad
weld condition, it is possible that a bias may have been
induced by bending the electrodes. This could have
occurred in the process of malpositioning the material
to create the desired shorted condition.
b. Group 6, Welds #i, #4 & #5
These welds were made with reversed material position, and
were adequate in pull strength, but failed the NDT test.
All of the infrared NDT measurements were out of limit
and four of the weld waveform NDT measurements were out
of limit, thus clearly flagging a process control prob-
lem.
c. Group 8, _elds #I, #2, #3 & #5
All five of the infrared and all five of the weld wave-
form NDT measurements were out of limits, thus flagging
a process control problem, even though the weld strengths
were acceptable. The dynamic setdown NDT measurements
all clustered close to the maximum limit allowed, as may
be observed from the matrix chart.
d. Group i0, Welds #1, #2 & #5
These welds were made at an energy level 2 watt-seconds
under the 8 pound, 16 watt-second weld schedule values.
While the pull strengths are satisfactory, again all five
106.
I
II
II
I
I
II
II
III
I
II
II
I
of the voltage waveform NDT values were below the minimum
limit, and all of the infrared values clustered at the
low end. Both of these are indicative of reduced welder
energy.
107.
I
I
II
II
I
III
I
II
II
III
I
APPENDIX
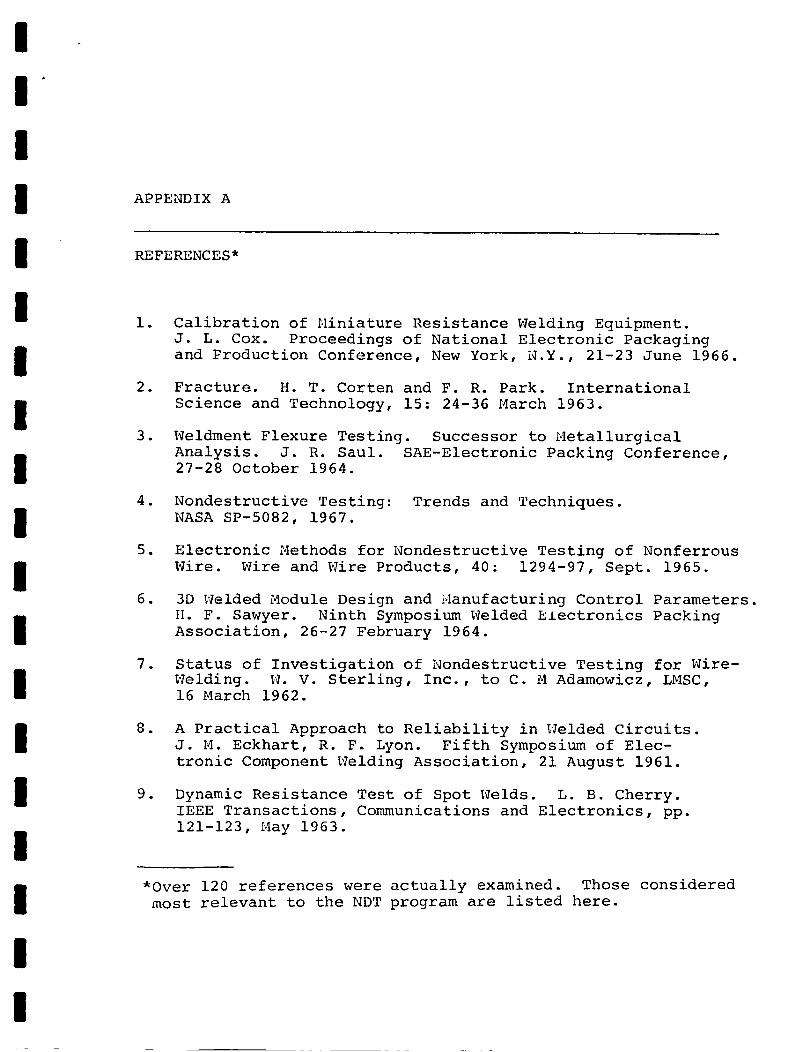
I
I
I
I APPENDIX A
I
I
I
I
I
I
I
I
I
I
I
I
I
I
REFERENCES*
•
•
•
•
So
•
•
•
•
Calibration of Miniature Resistance Welding Equipment.
J. L. Cox. Proceedings of National Electronic Packaging
and Production Conference, New York, N.Y., 21-23 June 1966.
Fracture. H. T. Corten and F. R. Park. International
Science and Technology, 15:24-36 March 1963.
Weldment Flexure Testing. Successor to Metallurgical
Analysis. J. R. Saul. SAE-Electronic Packing Conference,
27-28 October 1964.
Nondestructive Testing:
NASA SP-5082, 1967.
Trends and Techniques•
Electronic Methods for Nondestructive Testing of Nonferrous
Wire. Wire and Wire Products, 40: 1294-97, Sept. 1965.
3D Welded Module Design and _4anufacturing Control Parameters.
If. F. Sawyer• Ninth Symposium Welded Electronics Packing
Association, 26-27 February 1964.
Status of Investigation of Nondestructive Testing for Wire-
Welding. W. V. Sterling, Inc., to C. M Adamowicz, LMSC,
16 March 1962.
A Practical Approach to Reliability in _lelded Circuits.
J. M. Eckhart, R. F. Lyon. Fifth Symposium of Elec-
tronic Component Welding Association, 21 August 1961.
Dynamic Resistance Test of Spot Welds. L. B. Cherry•
IEEE Transactions, Communications and Electronics, pp.
121-123, May 1963.
*Over 120 references were actually examined. Those considered
most relevant to the NDT program are listed here.
I
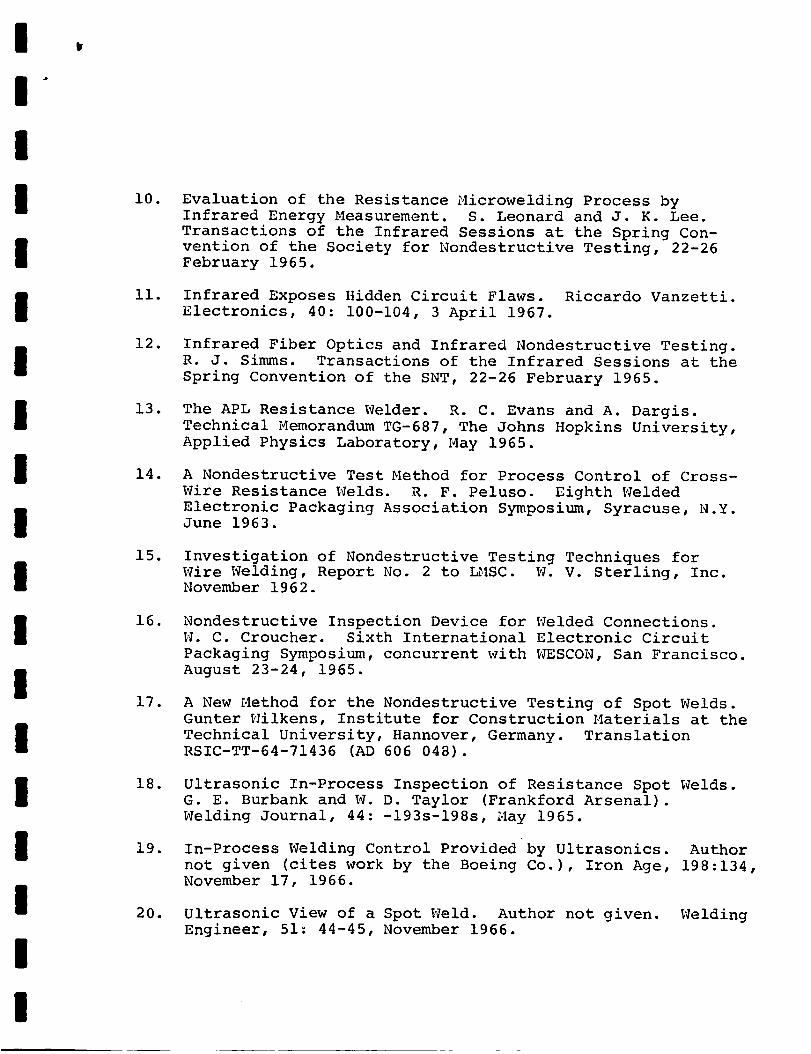
I
II
II
I
II
II
II
II
II
I
i0.
ii.
12.
13.
14.
15.
16.
17.
18.
19.
20.
Evaluation of the Resistance Microwelding Process byInfrared Energy Measurement. S. Leonard and J. K. Lee.
Transactions of the Infrared Sessions at the Spring Con-vention of the Society for Nondestructive Testing, 22-26February 1965.
Infrared Exposes Hidden Circuit Flaws. Riccardo Vanzetti.
Electronics, 40: 100-104, 3 April 1967.
Infrared Fiber Optics and Infrared Nondestructive Testing.R. J. Simms. Transactions of the Infrared Sessions at the
Spring Convention of the SNT, 22-26 February 1965.
The APL Resistance Welder. R. C. Evans and A. Dargis.
Technical Memorandum TG-687, The Johns Hopkins University,
Applied Physics Laboratory, May 1965.
A Nondestructive Test Method for Process Control of Cross-
Wire Resistance Welds. R. F. Peluso. Eighth Welded
Electronic Packaging Association Symposium, Syracuse, N.Y.June 1963.
Investigation of Nondestructive Testing Techniques forWire Welding, Report No. 2 to LMSC. W. V. Sterling, Inc.November 1962.
Nondestructive Inspection Device for Welded Connections.W. C. Croucher. Sixth International Electronic Circuit
Packaging Symposium, concurrent with WESCON, San Francisco.
August 23-24, 1965.
A New Method for the Nondestructive Testing of Spot Welds.Gunter Wilkens, Institute for Construction Materials at the
Technical University, Hannover, Germany. Translation
RSIC-TT-64-71436 (AD 606 048).
Ultrasonic In-Process Inspection of Resistance Spot Welds.
G. E. Burbank and W. D. Taylor (Frankford Arsenal).
Welding Journal, 44: -193s-198s, May 1965.
In-Process Welding Control Provided by Ultrasonics. Author
not given (cites work by the Boeing Co.), Iron Age, 198:134,November 17, 1966.
Ultrasonic View of a Spot Weld. Author not given.
Engineer, 51: 44-45, November 1966.Welding
I
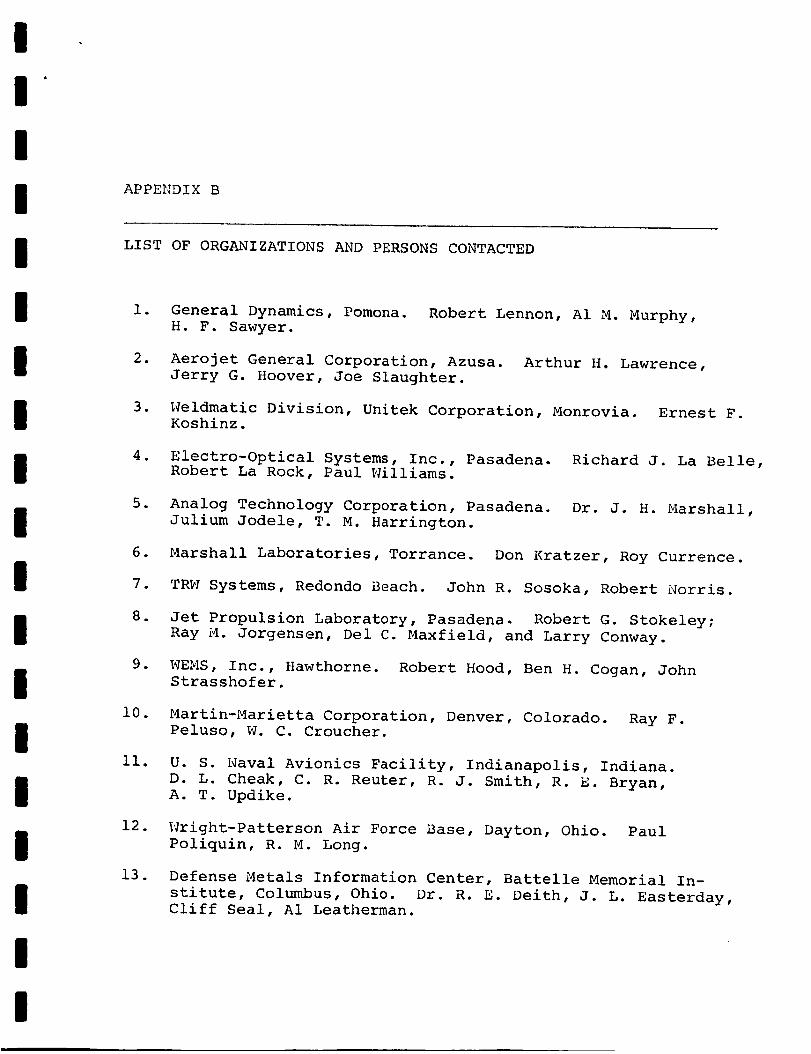
II
I
I AP PE_,_DIX B
II
I
III
II
I
II
III
LIST OF ORGANIZATIONS AND PERSONS CONTACTED
l.
2.
3.
4.
5.
6.
7.
8.
9.
i0.
ll.
12.
13.
General Dynamics, Pomona.
H. F. Sawyer.
Robert Lennon, A1 M. Murphy,
Aerojet General Corporation, Azusa.
Jerry G. Hoover, Joe Slaughter.
Arthur H. Lawrence,
Weldmatic Division, Unitek Corporation, Monrovia.Koshinz.
Ernest F.
Electro-Optical Systems, Inc., Pasadena.
Robert La Rock, Paul Williams.
Richard J. La Belle,
Analog Technology Corporation, Pasadena.
Julium Jodele, T. M. Harrington.
Dr. J. H. Marshall,
Marshall Laboratories, Torrance. Don Kratzer, Roy Currence.
TRW Systems, Redondo Beach. John R. Sosoka, Robert Norris.
Jet Propulsion Laboratory, Pasadena. Robert G. Stokeley;
Ray M. Jorgensen, Del C. Maxfield, and Larry Conway.
WEMS, Inc., Hawthorne.
Strasshofer.
Robert Hood, Ben H. Cogan, John
Martin-Marietta Corporation, Denver, Colorado.
Peluso, W. C. Croucher.
Ray F.
U. S. Naval Avionics Facility, Indianapolis, Indiana.
D. L. Cheak, C. R. Reuter, R. J. Smith, R. E. Bryan,
A. T. Updike.
Wright-Patterson Air Force Base, Dayton, Ohio.
Poliquin, R. M. Long.
Paul
Defense Metals Information Center, Battelle Memorial In-
stitute, Columbus, Ohio. Dr. R. E. Deith, J. L. Easterday,
Cliff Seal, A1 Leatherman.
I
m
I
I
I
I
I
I
I
I
I
I
I
I
I
I
I
I
I
21.
22.
23.
24.
25.
Mechanical Properties of Films, the Dynamic Testing of
Micro Samples. R. S. Jackson & W. Simpson, Journal of
Applied Chemistry, 15: 230-232. May 1965.
Parallel Gap Welding to Copper Printed Circuit Boards.
A. Koudounaris. Report SM-49158, July 1966, Missile and
Space Systems Division, Douglas Aircraft Company, Santa
Monica, California.
Development of Weld Schedules and Process Control.
Gates. Published by Weldmatic Division, Unitek.
J° R°
Application of the Ultrasonic Resonance Technique to
Inspection of Miniature Soldered and Welded Connections.
R. G. Bayer and T. S. Burke. Materials Evaluation,
pages 20-24. January 1967.
Welding for Electronic Assemblies. NASA SP-5011. Tech-
nology Handbook, National Aeronautics and Space Adminis-
tration, November 1964.
It
I
I
II
IlI
II
I
III
*23.
_"26 o
14. Goddard Space Flight Center, Greenbelt, Md. Russell E.Dorrell, Abe Pilch.
15. NASA Headquarters, Washington, D. C. Dr. J. E. Condon,J. R. Miles.
16. AEC, Germantown, Hd. Ken Horton, James Mershon, AEC;
Sam Snyder, NASA.
17. Applied Physics Laboratory, Johns Hopkins University,
Silver Spring, Md. R.W. Cole, Dr. R. C. Evans.
18. Bendix-Pacific Division, Sylmar, California. Ralph Lamm,
George Williams, Karl Stevenson.
19. EPI/Vostron, Anaheim, California. J. R. Gates.
20. Northrop Nortronics, Anaheim, California. Lee Mueller,
Lloyd Scherbinske.
21. Hughes Vacuum Tube Division, Oceanside, California.
C. A. Rollins, D. Blough, _{illiam Hill.
22. Lockheed Missiles and Space Company, Sunnyvale, California.
Dr. Hans M. Wagner, Dale R. Torgeson, Ben F. Juscen, Fletcher
R. Sullivan, Dale Adams.
The Sippican Corporation, Harion, Massachusetts. R.M.
Steigerwald, Winthrop Baylies.
Kulicke and Soffa Industries, Ft. Washington, Pa. Ed Haigler.
U. S. Naval Air Development Center, Johnsville, Pa.
E. R. Mullen.
Massachusetts Institute of Technology, Cambridge, Mass.
Eldon Hall, Ed Duggan.
*Contacts made by telephone.
I