I orschunsbercht 8/2015 - IABdoku.iab.de/forschungsbericht/2015/fb0815_en.pdf · I orschunsbercht...
68
IAB Forschungsbericht Results from the project work of IAB 8/2015 Industry 4.0 and the consequences for labour market and economy Scenario calculations in line with the BIBB-IAB qualifications and occupational field projections Marc Ingo Wolter Anke Mönnig Markus Hummel Christian Schneemann Enzo Weber Gerd Zika Robert Helmrich Tobias Maier Caroline Neuber-Pohl ISSN 2195-2655
Transcript of I orschunsbercht 8/2015 - IABdoku.iab.de/forschungsbericht/2015/fb0815_en.pdf · I orschunsbercht...

IAB ForschungsberichtResults from the project work of IAB
8/2015
Industry 4.0 and the consequences for labour market and economyScenario calculations in line with the BIBB-IAB qualifications and occupational field projections
Marc Ingo Wolter Anke MönnigMarkus HummelChristian SchneemannEnzo WeberGerd ZikaRobert HelmrichTobias MaierCaroline Neuber-Pohl
ISSN 2195-2655

IAB-Forschungsbericht 8/2015 2
Industry 4.0 and the consequences for labour market and economy Scenario calculations in line with the BIBB-IAB qualifications and occupational field projections
Marc Ingo Wolter (The Institute of Economic Structures Research - GWS) Anke Mönnig (The Institute of Economic Structures Research - GWS) Markus Hummel (IAB) Christian Schneemann (IAB) Enzo Weber (IAB) Gerd Zika (IAB) Robert Helmrich (Federal Institute for Vocational Education and Training - BIBB) Tobias Maier (Federal Institute for Vocational Education and Training - BIBB) Caroline Neuber-Pohl (Federal Institute for Vocational Education and Train-ing – BIBB)
Mit der Publikation von Forschungsberichten will das IAB der Fachöffentlichkeit Einblick in seine laufenden Arbeiten geben. Die Berichte sollen aber auch den Forscherinnen und For-schern einen unkomplizierten und raschen Zugang zum Markt verschaffen. Vor allem längere Zwischen- aber auch Endberichte aus der empirischen Projektarbeit bilden die Basis der Reihe.
By publishing the Forschungsberichte (Research Reports) IAB intends to give professional circles insights into its current work. At the same time the reports are aimed at providing researchers with quick and uncomplicated access to the market.

IAB-Forschungsbericht 8/2015 3
Contents
Abstract ...................................................................................................................... 6
Zusammenfassung ..................................................................................................... 6
1 Industry 4.0 leads to various changes ................................................................... 8
2 The path to Industry 4.0 ......................................................................................... 9
3 Methods, factors and assumptions ...................................................................... 15 3.1 Methods: Scenario technique and model application ........................................ 15 3.2 Possible parameters and assumptions ............................................................. 20 3.3 Assumptions – general assessments ................................................................ 23
4 Scenario calculations and results ........................................................................ 24 4.1 Equipment investments (partial scenario 1) ...................................................... 24 4.2 Building investments (partial scenario 2) ........................................................... 27 4.3 Material and personnel costs (partial scenario 3) .............................................. 30 4.4 Occupational field structure (partial scenario 4) ................................................ 39 4.5 Overall effect without additional demand (partial scenarios 1-4) ....................... 43 4.6 Demand (partial scenario 5) .............................................................................. 48 4.7 Industry 4.0 scenario (overall scenario 1-5) ...................................................... 52
5 Conclusions ......................................................................................................... 61
References ............................................................................................................... 63
Table of Figures:
Figure 1 The four stages of the Industrial Revolution .......................................... 10 Figure 2 Horizontal and vertical integration ......................................................... 12 Figure 3 Characteristics of the term Industry 4.0 ................................................. 13 Figure 4 Scenario results ..................................................................................... 17 Figure 5 QuBe project at a glance ....................................................................... 18 Figure 6 IAB/INFORGE at a glance ..................................................................... 19 Figure 7 Schematic diagram of the input-output chart ......................................... 21 Figure 8 Vintage years of retrofitting investments ................................................ 25 Figure 9 Partial scenario 1 – Change in gross domestic product and its
components in comparison with the baseline scenario ......................... 26 Figure 10 Partial scenario 1 – Number of employees by primary occupational
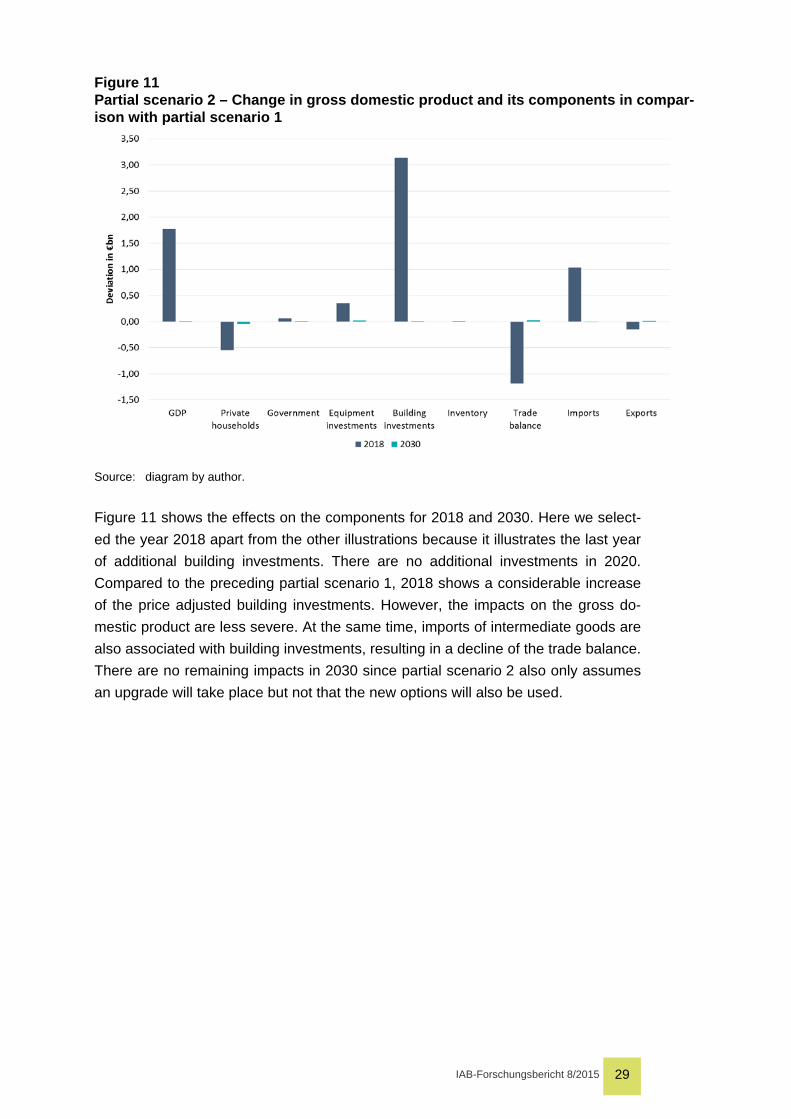
fields in comparison with the baseline study .......................................... 27 Figure 11 Partial scenario 2 – Change in gross domestic product and its
components in comparison with partial scenario 1 ................................ 29 Figure 12 Partial scenario 2 – Number of employees by primary occupational
fields in comparison with partial scenario 1 ........................................... 30 Figure 13 Partial scenario 3 – Change in gross domestic product and its
components in comparison with partial scenario 2 ................................ 35 Figure 14 Partial scenario 3 – Number of employees by primary occupational
fields in comparison with partial scenario 2 ........................................... 36

IAB-Forschungsbericht 8/2015 4
Figure 15 Partial scenario 3 – Number of employees by branches in comparison with partial scenario 2 ............................................................................ 37
Figure 16 Partial scenario 3 – Number of jobs lost and created by branches in comparison with partial scenario 2 ........................................................ 37
Figure 17 Partial scenario 3 – Number of jobs lost and created by occupations in comparison with partial scenario 2 ..................................................... 38
Figure 18 Change in employees by primary occupational fields between 1996 and 2011 ................................................................................................ 40
Figure 19 Partial scenario 4 – Number of employees by primary occupational fields in comparison with partial scenario 3 ........................................... 42
Figure 20 Partial scenario 4 – Number of jobs lost and created by occupations in comparison with partial scenario 3 ..................................................... 43
Figure 21 Overall scenario 1-4 – Change in gross domestic product and its components in comparison with the baseline scenario ......................... 44
Figure 22 Overall scenario 1-4 – Number of employees by primary occupational fields in comparison with the baseline scenario ..................................... 45
Figure 23 Overall scenario 1-4 – Number of jobs lost and created by occupational fields in comparison with the baseline scenario ............... 46
Figure 24 Overall scenario 1-4 – Number of jobs lost and created by branches in comparison with the baseline scenario .............................................. 47
Figure 25 Overall scenario 1-4 – Number of employees by qualification level in comparison with the baseline scenario .................................................. 48
Figure 26 Partial scenario 5 – Change in gross domestic product and its components in comparison with partial scenario 4 ................................ 51
Figure 27 Partial scenario 5 – Number of employees by primary occupational fields in comparison with partial scenario 4 ........................................... 52
Figure 28 Overall scenario 1-5 – Components of the gross domestic product in comparison with the baseline scenario .................................................. 53
Figure 29 Overall scenario 1-5 – Primary inputs and intermediate inputs in comparison with the baseline scenario .................................................. 55
Figure 30 Development of the accumulated profit in agriculture and the manufacturing sector in comparison with the baseline scenario ........... 56
Figure 31 Overall scenario 1-5 – Number of employees by primary occupational fields in comparison with the baseline scenario ..................................... 57
Figure 32 Overall scenario 1-5 – Number of employees by select*) occupational fields in comparison with the baseline scenario in 2030 ........................ 58
Figure 33 Overall scenario 1-5 – Number of jobs lost and created by branches in comparison with the baseline scenario .................................................. 59
Figure 34 Overall scenario 1-5 – Number of jobs lost and created by occupational fields in comparison with the baseline scenario ............... 59
Figure 35 Overall scenario 1-5 – The jobs lost and created by branches and occupational fields in comparison with the baseline scenario ............... 60
Figure 36 Overall scenario 1-5 – Number of employees by qualification levels in comparison with the baseline scenario .................................................. 61

IAB-Forschungsbericht 8/2015 5
List of Tables:
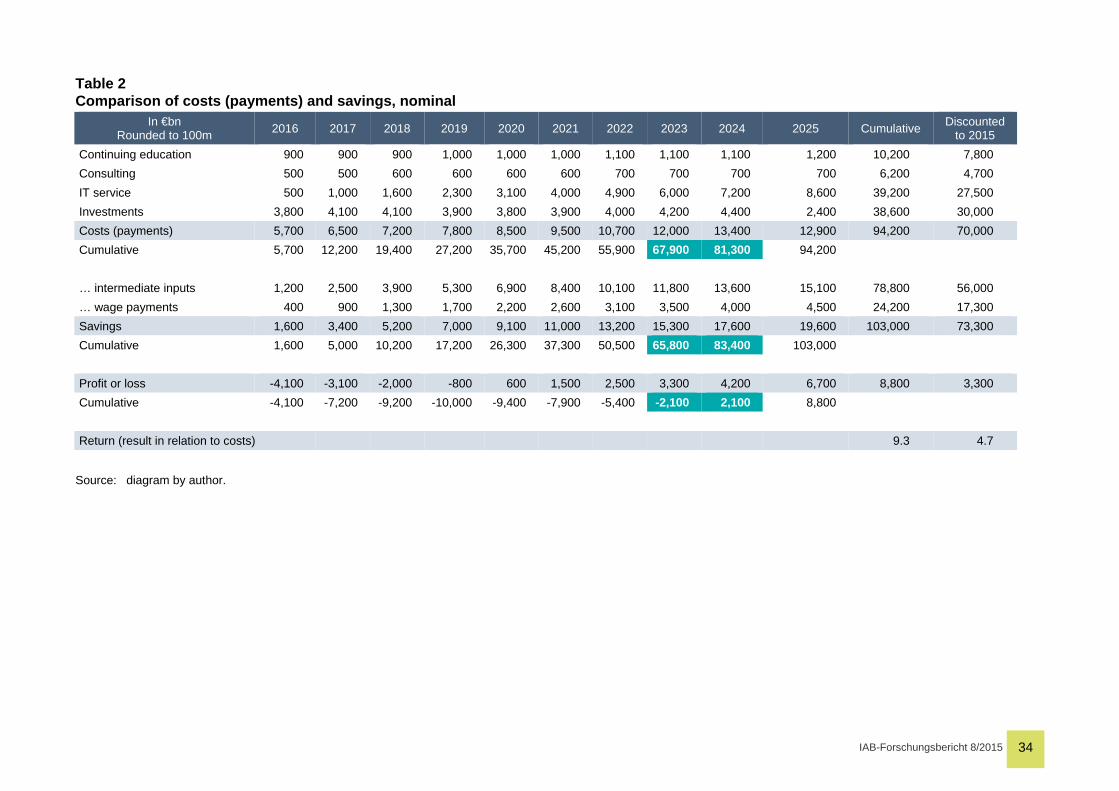
Table 1 List of assumptions ..................................................................................... 24 Table 2 Comparison of costs (payments) and savings, nominal ............................. 34 Table 3 Integration of the routine percentage, model calculation ............................ 41 Table 4 Selection of purposes (highlighted in blue) ................................................ 50 Table 5 Overall scenario 1-5 Effects on the components of the gross domestic
product in the partial scenarios and overall ................................................ 54

IAB-Forschungsbericht 8/2015 6
Abstract
This study focuses on the economic effects of the phenomenon of “Industry 4.0”, the digitalisation of the production processes. These developments involve considerable challenges for companies as well as on a political level. This five-step scenario analysis begins with the impacts of increased investments in equipment (1) by com-panies and in the network infrastructure (2) by the government on the overall econ-omy and the labour market. On this basis, we continue to model the consequential personnel and material costs of the companies (3) and a changed pattern of de-mand according to occupations and skills (4). The cumulative effects of these four partial scenarios are compared to a baseline scenario, which does not contain an advanced developmental path to Industry 4.0. In another scenario, the effects on the labour market of a potentially increasing demand for goods (5) are taken into con-sideration and also contrasted with the baseline scenario.
The results show that Industry 4.0 will accelerate the structural change towards more services. In the process, labour force movements between sectors and occu-pations are significantly greater than the change of the number of employees over-all. The turnover on the labour market is accompanied by an increasing added val-ue, which not only leads to more economic assets but also – due to greater de-mands on the labour force – to higher aggregate wages.
The underlying assumptions have a positive effect on the economic development. However, that also means that, given a delayed implementation, the assumptions are turning against the business location Germany: We will export less and demand more “new” goods from abroad.
In order to continue to improve the economic findings on the effects of digitization, a further development of the QUBE-I4.0-project is planned.
Zusammenfassung
Mit diesem Forschungsbericht liegt die erste modellbasierte Wirkungsabschätzung von Industrie 4.0 auf Arbeitsmarkt und Wirtschaft in Deutschland vor. In einer 5-stufigen Szenario-Analyse werden zunächst die Auswirkungen von erhöhten In-vestitionen in Ausrüstungen (1) und Bau für ein schnelles Internet (2) auf die Ge-samtwirtschaft und den Arbeitsmarkt dargestellt. Darauf aufbauend modellieren wir den daraus folgenden Personal- und Materialaufwand der Unternehmen (3) und eine veränderte Nachfragestruktur nach Berufen und Qualifikationen (4). Die kumu-lativen Effekte der vier Teil-Szenarien werden mit einem Referenz-Szenario, das keinen fortgeschrittenen Entwicklungspfad zu Industrie 4.0 enthält, verglichen. Dar-über hinaus werden in einem weiteren Teil-Szenario Arbeitsmarkteffekte einer mög-licherweise steigenden Nachfrage nach Gütern (5) in den Blick genommen und ebenfalls am Referenz-Szenario gespiegelt.

IAB-Forschungsbericht 8/2015 7
Im Ergebnis zeigt sich, dass Industrie 4.0 den Strukturwandel hin zu mehr Dienst-leistungen beschleunigen wird. Dabei sind Arbeitskräftebewegungen zwischen Branchen und Berufen weitaus größer als die Veränderung der Anzahl der Erwerb-stätigen insgesamt. Mit den Umwälzungen auf dem Arbeitsmarkt geht eine zuneh-mende Wertschöpfung einher, die nicht nur zu mehr volkswirtschaftlichen Gewinnen sondern – aufgrund höherer Anforderungen an die Arbeitskräfte – auch zu höheren Lohnsummen führt.
Die getroffenen Annahmen wirken zu Gunsten der ökonomischen Entwicklung. Das bedeutet aber auch, dass bei einer verzögerten oder gar verschleppten Umsetzung, die Annahmen sich gegen den Wirtschaftsstandort Deutschlands wenden: Wir wer-den weniger exportieren und mehr „neue“ Güter im Ausland nachfragen.
Um ökonomische Erkenntnisse zu den Wirkungen der Digitalisierung weiter zu ver-bessern, ist eine Fortentwicklung des QuBe-I4.0-Projekts geplant.
Ein „Aktueller Bericht“ fasst die wesentlichen Ergebnisse dieses Forschungsberichts zusammen. Sie finden ihn unter „Aktueller Bericht 16/2015“.

IAB-Forschungsbericht 8/2015 8
1 Industry 4.0 leads to various changes Economic development is always characterised by change. For instance, the pool of employees in the overall economy of the industries changes continuously in line with the economic structural change. The percentage of employees working in agricul-ture and the manufacturing sector is steadily declining but increasing in the service sector. This report examines whether improvements expected in connection with Industry 4.0 will accelerate this structural change and significantly affect the work environment with regard to the occupational and qualification structure. Which ef-fects the transition to Industry 4.0 will have on the economic development and the number of employees collectively is also key.
We distinguish between the terms “Industry 4.0” and “Economy 4.0”; the latter hav-ing a much greater scope. While we interpret “Industry 4.0” as interactive intercon-nectedness between analogue production and the digital world, “Economy 4.0” de-fines the factor that digitisation not only results to a change in industrial production but all service sectors, and will therefore affect all spheres of life. Accordingly, the consequences of “digitising work” discussed publicly, like the Green Paper “Work 4.0” (BMAS - Federal Ministry of Labour and Social Affairs 2015), accordingly refer to Economy 4.0.
We identify determining factors (parameters) which will change in line with the tran-sition to Industry 4.0. In line with a scenario analysis, which is based on the methods and results of the QuBe project (www.qube-projekt.de), the consequences the amended parameters have on qualifications, occupations, sectors and the macroe-conomic development are identified. The overall scenario is worked out step-by-step through the following five partial scenarios:
(1) Consequences of increased equipment investments
(2) Consequences of increased building investments
(3) Results of the change in material and personnel costs
(4) Results of the change in the structure of occupational fields
(5) Consequences of an increasing demand for new goods
Due to the step-by-step structure of the scenarios, this report follows a chronological structure of investments and their results. The results of the individual scenarios are therefore always compared to the results of the preceding partial scenario. Further-more, the impact the cumulative effects have on the partial scenarios 1 to 4 or 1 to 5 is also reflected in the baseline scenario of the 3rd phase of the QuBe project (Maier et al. 2014a).
Key results of the study show that although the transition to Industry 4.0 can on one hand in fact yield an improvement in the economic development, on the other hand, however, based on the assumptions made in ten years there will be 60,000 fewer jobs than in the baseline scenario. At the same time, 490,000 jobs will be lost, par-ticularly in the manufacturing sector, and approximately 430,000 new ones will be
IAB-Forschungsbericht 8/2015 9
created. To a great extent, jobs “switch” between sectors, occupations and qualifica-tions.
As a basic principle, the results from the scenario analyses depend on the assump-tions made. The project partners will therefore continue to refine this study in the future. This will then focus on the modelling type and additional information, e. g. from company surveys. We will also pursue broadening it from “Industry 4.0” to “Economy 4.0” to gain further insight into the consequences digitisation has on the labour market and the economy.
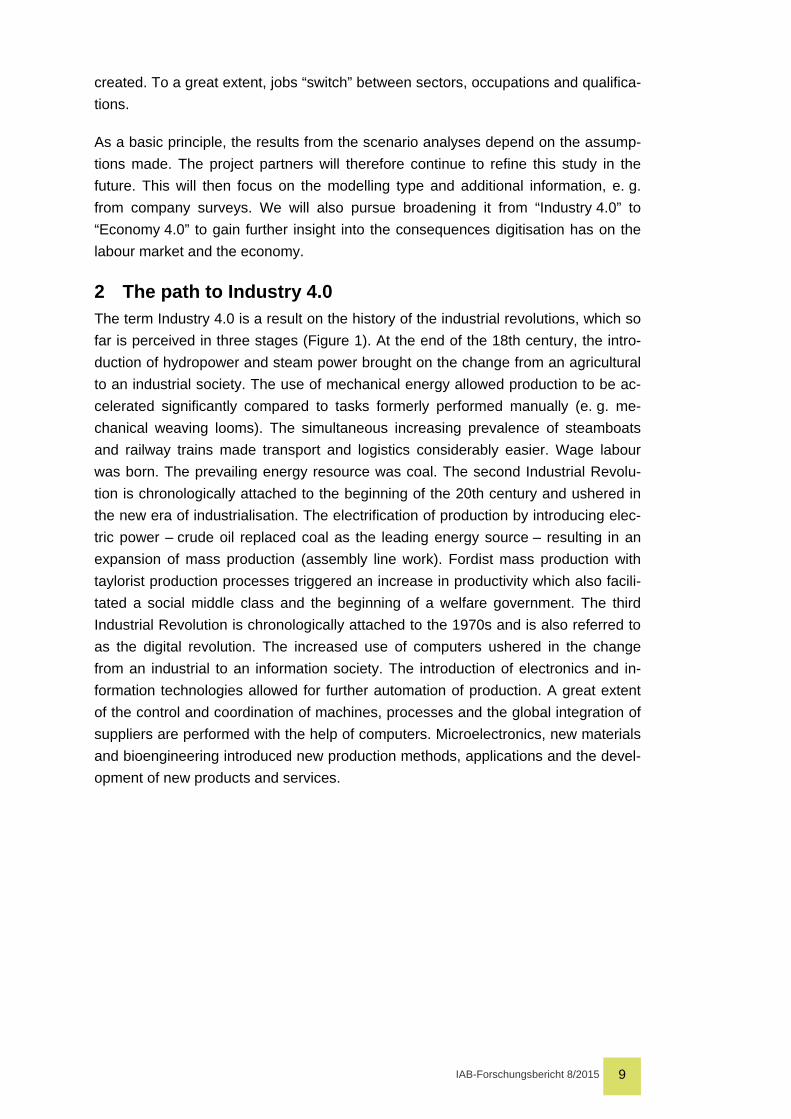
2 The path to Industry 4.0 The term Industry 4.0 is a result on the history of the industrial revolutions, which so far is perceived in three stages (Figure 1). At the end of the 18th century, the intro-duction of hydropower and steam power brought on the change from an agricultural to an industrial society. The use of mechanical energy allowed production to be ac-celerated significantly compared to tasks formerly performed manually (e. g. me-chanical weaving looms). The simultaneous increasing prevalence of steamboats and railway trains made transport and logistics considerably easier. Wage labour was born. The prevailing energy resource was coal. The second Industrial Revolu-tion is chronologically attached to the beginning of the 20th century and ushered in the new era of industrialisation. The electrification of production by introducing elec-tric power – crude oil replaced coal as the leading energy source – resulting in an expansion of mass production (assembly line work). Fordist mass production with taylorist production processes triggered an increase in productivity which also facili-tated a social middle class and the beginning of a welfare government. The third Industrial Revolution is chronologically attached to the 1970s and is also referred to as the digital revolution. The increased use of computers ushered in the change from an industrial to an information society. The introduction of electronics and in-formation technologies allowed for further automation of production. A great extent of the control and coordination of machines, processes and the global integration of suppliers are performed with the help of computers. Microelectronics, new materials and bioengineering introduced new production methods, applications and the devel-opment of new products and services.
IAB-Forschungsbericht 8/2015 10
Figure 1 The four stages of the Industrial Revolution
Source: based on BITKOM 2014 – diagram by author.
The fourth stage of the Industrial Revolution can be perceived as a continuation or rigorous implementation of the ideas and technologies from the third Industrial Revolution. In addition to fundamentally rethinking the functionality of production facilities, it will also lead to changes in the work environment.
Changes in the economy and society, which can already be observed today, will accelerate the trend towards Industry 4.0: So far, the powerful, export-oriented sec-tors of machine building, automotive and chemicals industry have been able to sus-tain their position internationally, mainly due to high product quality. Globalisation improves the comparability of services and increases competitive pressure. Compa-nies must constantly defend their competitive advantage. Hence, product and pro-cess innovations are vital, particularly because the value chains continue to be more detailed and more complex. Not only must national limits be overcome but the inter-action of a variety of different, in part highly specialised suppliers must also be coor-dinated. Aspects of industrial production processes already highly developed today becomes more and more relevant for sectors such as commercial companies and the shipping industry or agriculture due to the urbanisation and the continued (worldwide) population growth. On one hand, more and more foods must be pro-duced with limited space and more efficiently, and on the other hand, urbanisation poses new challenges for trade and transportation in terms of prompt and continu-ous provision of products and services. Furthermore, the demand for customised products will increase with the individualisation of society. Ultimately, the shortage of re-sources will also have to result in optimising production process.
All in all, in the future, continuous innovative activities must be aligned with an in-creasing complexity and dynamic in the value chains, which must result in rethinking the entire production control system across all economic sectors. This rethinking is defined using the keyword “Industry 4.0”.

IAB-Forschungsbericht 8/2015 11
However, to date there still is no standard and distinct definition of how exactly to interpret the term Industry 4.0 (DBR 2014). This not only becomes clear in the few German studies which have dealt with this topic (BITKOM 2014; PWC 2014; DBR 2014). A survey conducted on behalf of WELT (2014) also confirms that 64 per cent of companies surveyed were not familiar with the term Industry 4.0. Nevertheless, Industry 4.0 is an idea which not only large industrial concerns and associations are committed to. The motto at the 2015 Industrial Trade Fair’s in Hannover was Indus-try 4.0; many big corporations (e. g. Bosch, Audi (Reflex Verlag 2015; Die WELT 2014) are already investing in Industry 4.0 technologies. The large industrial associ-ations Bundesverband Informationswirtschaft, Telekommunikation and neue Medien e. V. (Federal Association for Information Technology, Telecommunications and New Media - BITKOM), Verband Deutscher Maschinen- und Anlagenbau (VDMA - German Engineering Federation) and Zentralverband Elektrotechnik- und Elektroni-kindustrie e. V. (ZVEI - German Electrical and Electronic Manufacturers’ Associa-tion) have initiated a website1 on Industry 4.0 together with the Federal Ministry for Economic Affairs and Technology (BMWI) and the Federal Ministry of Education and Research (BMBF). It is part of the BMBF’s high-tech strategy (2014) and the Federal Ministry of Labour and Social Affairs has also addressed this topic in the Green Pa-per “Work 4.0” (BMAS 2015).
Despite the many studies and forums it’s usually unclear what Industry 4.0 actually means. It is more than “just-in-time production” and more than “lean production”2 – keywords from the 90s. “Digital sub-projects” are often “referred to as Industry 4.0” (Professor Schuh of RWTH Aachen in DIE WELT 2014). However, it is in fact about an “industrial domino effect” (DIE ZEIT 2014) where parts exchange data fully auto-matically across all industrial and production boundaries. At least awareness of In-dustry 4.0 should be higher now than it was in 2014.
Industry 4.0 stands for an interactive networking between analogue production and the digital world. This transformation includes elements such as big data, autono-mously operating systems, Cloud computing, social media, mobile and self-learning systems. This development is more of an evolutionary process than a revolution. The following provides a standardised definition based on available (German) litera-ture. Forschungsunion Wirtschaft und Wissenschaft (German Science-Industry Re-search Union 2013) provides the following definition:
1 www.plattform-i40.de 2 Lean production traces back to the Toyota production system, which aims at avoiding or
optimising any kind of “waste” (reworking, warehousing, overproduction, transport,...). It is controlled via the Kanban method and a milk run concept. The milk run concept requires the one-time provision of lot sizes based on demand. The Kanban method communicates the demand using electronic signal cards.

IAB-Forschungsbericht 8/2015 12
Industry 4.0 essentially refers to the technical integra-tion of CPS3 into production and logistics as well as applying the Internet of things and services4 in indus-trial processes – including the resulting impacts on the value chain, business models, as well as downstream services and work organisation. (Forschungsunion & acatech 2013)
Developing and implementing new cyber-physical systems innovative paths in pro-duction. Even today, there are discussions about individual serial production, im-proved production planning using near real time data and the resulting increase in production flexibility or businesses being better fit to respond to market fluctuations. The high degree of volatility of “on demand” production leads to a more a flexible utilisation of production facilities as well as company employees (Spath et al. 2013).
However, Industry 4.0 not only means an intelligent control and planning of produc-tion within a company (vertical integration), but also beyond the company (horizontal integration). The interface between horizontal and vertical integration lies in plan-ning, purchasing, production and logistics (Figure 2).
Figure 2 Horizontal and vertical integration
Source: PWC 2014: 21 – diagram by author.
3 CPS – Cyber-Physical Systems – designates a link between physical elements and the
virtual world. That is, linking between humans, machines, products, objects and ICT sys-tems. Tools, containers and other aids are designated as objects, which mutate from passive to active resources in production through bar codes, sensors and actuators. In addition to communicating with the operator (= human) and other machines, machines can also communicate with the objects and products, creating a steady streams of infor-mation, e.g. via order status, material or maintenance requirements.
4 Refers to merging the Internet with the object or service. The computer is no longer an “auxiliary” device but an integral component (“embedded system”). Products are linked with additional information via bar codes, radio frequency identification (RFID), sensors or actuators. Online parcel tracking is an example.
Supplier
Supplier networkCooperating partners
Enterprise
PlanningPurchasingProductionLogistics
Customer
Customer network
Horizontal integration
• Sales
• Product engineering
• Planning
• Purchasing – Production – Logistics
• Service
• IT, shared services
• Finance, taxes, law
Vert
ical
inte
grat
ion

IAB-Forschungsbericht 8/2015 13
Horizontal integration refers to the cross-industry linking of production processes. The work required from the machines is assigned via hubs. They autonomously cal-culate the requirements for basic materials, tools and personnel, identify utilisation and autonomously reorder materials from upstream entities. The objective is to op-timise the flow of goods and information within the value chain. Vertical integration on the other hand defines optimising the flow of in-house goods and data with the objective of increasing quality and flexibility. For both aspects of Industry 4.0 it’s crucial information can be processed in real time, all processes along the value chain to be linked, communicating, and furthermore to be able to take self-organised action. Self-organisation in particular shows Industry 4.0 will not have hierarchically and centralistically planned production management, but rather the product knows how it is to be processed, what it is needed for and where it needs to be transported. In summary, this results in the following four key characteristics for the term Indus-try 4.0 (Figure 3):
Figure 3 Characteristics of the term Industry 4.0
Source: diagram by author.
During the transition to Industry 4.0, the change in production structure will surely have consequences. With regard to the working and professional world, according to the assumptions, work will become more challenging and have more informal qualification requirements such as the ability to act independently, self-organisation, abstract thinking-skills (Forschungsunion & acatech 2013). In line with qualitative preliminary studies BIBB and IAB conducted with companies which have already

IAB-Forschungsbericht 8/2015 14
intensively involved with the implementation of Industry 4.05, results show there will particularly be less need for simple, repetitive tasks and special knowledge applied.
According to the individuals interviewed, start-up companies utilising the potentials digitisation has to offer are able to manufacture more flexible and individualised products, will form and occupy new market niches. They in particular require their specialists to hold special professional skills, which must be accompanied by exper-tise in dealing with digital media and networks, as well as distinctive soft skills in communication and especially in teamwork. Expertise in problem solving, which is coordinated within the processes among the team but also implemented inde-pendently, is vital for the companies.
Though according to these companies, fundamentally new skills or activities which would result in new job descriptions, are not expected. In fact, the previous occupa-tions are sufficiently established. However, it is emphasised require even greater and virtually end-to-end IT skills are required here.
According to these companies, a decline in the demand for specialists in the area of intermediate skills is not inevitable. Although the requirements placed on employees are increasing, particularly in the development phase of new processes and prod-ucts, this can only result in a short-term shift towards requiring academic degrees. This shift would settle down again during the implementation phase since more people with training qualifications would then be in demand again. On the other hand, the employment situation for low-skilled workers remains problematic in the long run.
However, manpower may not be the only thing reduced or restructured over the course of Industry 4.0. Material, inventory and movement sequences will also be-come replaceable by real time production (BITKOM 2014). Increased efficiency can be attributed to labour- as well as material productivity. Internal operating costs are reduced by digitising the value chains (Forschungsunion & acatech 2013). The as-sumption is, inventory can be reduced; in extreme cases, even be completely elimi-nated. Increased energy efficiency can also be achieved due to coordinated activa-tion and deactivation of machine components (Forschungsunion & acatech 2013). In addition to cost savings, a greater sales volume is expected “due to addressing a wider market and an increase in customer satisfaction” (Forschungsunion & acatech 2013). Furthermore, the production location Germany can benefit as a whole be-cause production also remains appealing in high-wage countries.
The positive effects (avoiding costs, improving sales potential) are accompanied by various additional expenses. The need to invest is great and poses challenges for
5 To date, BIBB and IAB have interviewed a total of six companies as well as two trade
resp. professional associations in the field of software, electrical engineering, electronics, logistics and vehicle construction in line with qualitative guided interviews.

IAB-Forschungsbericht 8/2015 15
companies where safety, disclosure and standardisation are concerned. The need for high employee qualifications is also seen (VDE 2013). The introduction of Indus-try 4.0 will therefore be a long and gradual process. According to a VDE study (2013), the companies interviewed do not expect a complete realisation before 2025.
Particularly younger companies and start-ups will turn to this development. The more specialised a company, the more difficult it will be to further automate the val-ue chain (Heng 2014). Transitioning existing machinery and production facilities will therefore play an important part for established companies. Automation through In-dustry 4.0 will be very flexible and can be implemented specifically depending on the sector and company. For example, the introduction of new innovative processes will more likely ensue in the automotive industry with its high degree of individualisation, according to Heng (2014), whereas pure process industries, e. g. the pharmaceuti-cal industry, will not implement these innovations as quickly. Areas such as machine building (automation, process engineering, production engineering) and information and communications technology (ICT) and the associated services will particularly be affected, given that these will be primarily responsible for developing the infra-structure for Industry 4.0 (VDE 2013).
3 Methods, factors and assumptions 3.1 Methods: Scenario technique and model application The scenario technique is applied to illustrate the consequences of a transition to Industry 4.0. For this purpose at least two scenarios are assessed, which are e. g. compared absolutely or relatively for a selected future period. This requires a base-line scenario, which describes a currently plausible and consistent future trend and an alternative scenario which documents a different trend. Both scenarios can differ in regard to their assumptions on exogenous parameters (e. g. population trend) or endogenous behaviour (e. g. production methods). In order to be able to quantify the effects of the assumptions on economic parameters, this also requires a model which can assess the baseline as well as the alternative scenario.
The BIBB-IAB qualifications and occupational field projections, published in line with the 3rd phase of the QuBe projections (Maier et al. 2014a, method box 1), serve as a baseline scenario. The trend described in said projections of course contains technological advancement, however, this rate of progress is geared toward the normal development apparent from the empiricism. For Germany to assume a worldwide pioneering role in the transition to Industry 4.0, as assumed in this report, additional efforts or investments are also required, which are shown in an extensive scenario specification.
The Q-INFORGE model used to compile the baseline scenario will also be used to calculate the Industry 4.0 scenario. The Q-INFORGE model is based on the IAB/INFORGE model (Schnur/Zika 2009; Distelkamp et al. 2003; method box 2), which was significantly extended in the area of the labour market (method box 1) in

IAB-Forschungsbericht 8/2015 16
line with the QuBe project. The QuBe project’s mission is to regularly project qualifi-cations and occupations and in doing so, continue to develop methods and analyses (Helmrich/Zika (ed.) 2010; Zika/Maier (ed.) 2015).
The detailed modelling of the sectors with their cost structures based on the input-output calculation by the Federal Statistical Office and the finely structured illustra-tion of the 54 occupational fields (Tiemann et al. 2008) according to 63 industrial sectors based on microcensus data are valuable for the following scenario analysis, as it allows for changes in production methods in agriculture and the manufacturing sector as well as the occupational structure by sectors to be illustrated.
The operationalisation of the Industry 4.0 scenario is based on assumptions and quantitative approaches, which, in addition to the required investments, concern components on the consumer demand end, the cost structure of individual sectors, as well as the type and extent of the labour market. The complexity of this scenario therefore requires a multitude of interventions, the macroenomic effects of which are overall hard to quantify by “contemplating” without a theoretical background on the model. When the parameters are set, the complex modelling approach of the QuBe project allows for a concurrent, dynamic assessment of the effects on the overall economy and the labour market.
Here, we must again emphasise that the consequences of Industry 4.0 are estimat-ed, not the “digitisation of work”, which goes beyond that, which would be synony-mous with Economy 4.0.
The parameters and their quantification are the result of an extensive foundation, intended to deal with the current uncertainty as best possible. First, literature on studies dealing with Industry 4.0 and its effect on the national economy and individ-ual sectors was studied. Unlike the existing scenario, all studies uses are based on the results of surveys. Moreover, BIBB and IAB conducted qualitative interviews and in-depth discussions with companies based on a questionnaire developed mutually. Furthermore, information events, e. g. in line with the Hannover Trade Fair, were used get into conversation with companies of all sizes.
Five partial scenarios were assessed, which are based on each other, due to the high level of complexity of an Industry 4.0 scenario. Each is compared with the pre-ceding partial scenario (Figure 4). The partial scenarios describe the changes in equipment investments and building investments, the resulting material and person-nel costs, the adaptations to the occupational field structure of branches of produc-tion in the manufacturing sector and agriculture, and lastly the effects on the remain-ing demand components. The adaptations of the cost and occupational field struc-ture also include material and labour costs as well as changes in occupational field structures within the investing sector. Given that the effects on demand are extreme-ly uncertain, the overall scenario is compared to the baseline scenario with and without this shift in demand.

IAB-Forschungsbericht 8/2015 17
Figure 4 Scenario results
Source: diagram by author
Method box 1: QuBe project
The BIBB-IAB qualifications and occupational field projections (QuBe project), de-veloped in collaboration between the Institute of Economic Structures Research (GWS) and the Fraunhofer Institute for Applied Information Technology (FIT), show how supply and demand for qualifications and occupations can develop on a long-term basis using model calculations. This case is based on data from the microcen-sus (in the available projection up to 2011): official representative statistics from the Federal Statistical Office on the population and the labour market, in which one per cent of all German households participate each year, adapted to the parameters of national accounts (in the available projection up to 2012). Wage information origi-nates from the employee history of the employees subject to social insurance con-tribution (in the available projection up to 2011). A standard occupational field sys-tem for distinguishing occupations was developed by BIBB, which groups occupa-tions at a three-digit classification level of occupations according to activities (Tie-mann et al. 2008). For illustration purposes, these 54 occupational fields are aggre-gated into 12 primary occupational fields (MOF) (see chart 4 in Maier et al. 2014b).

IAB-Forschungsbericht 8/2015 18
Figure 5 QuBe project at a glance
Source: diagram by author
These results are based on the baseline projection (baseline scenario) of the third projection phase. These are based on the methods of the first (Helmrich/Zika 2010b) and the second phase (Helmrich et al. 2012; Zika et al. 2012) and also includes oth-er innovations. Therefore, the previous IAB/INFORGE model (Hummel et al. 2010; Schnur/Zika 2009) is expanded on the demand side by including the available job-related labour supply in numbers and hours in determining wages for the occupa-tional fields. On the supply side, the advantages of both previous supply models BIBB-FIT (Kalinowksi/Quinke 2010) and BIBB-DEMOS (Drosdowski/Wolter 2010) are combined into one supply model while modelling wages depending on occupa-tional flexibilities, which allows the labour supply to respond to the changing wages in the occupational fields. However, the QuBe project pursues an empiricism-based concept in the baseline projection: only the previously proven behavioural patterns are projected to the future. Consequently, past unascertainable behavioural chang-es are not part of the baseline projection. This also applies to the modelled market adaptation mechanisms. All innovations in the modelling are detailed in Maier et al. 2014b. Figure 5 provides a rough overview of the functionality of the model.
Further information at www.QuBe-Projekt.de.

IAB-Forschungsbericht 8/2015 19
Method box 2: The IAB/INFORGE model
The IAB/INFORGE model is an extremely disaggregated and econometric forecast and simulation model for Germany by branches of production and categories of goods, which was developed by the Institute of Economic Structures Research (GWS) and has been continuously pursued and updated since 1996 (Schnur/Zirka 2009). This model is based on the “bottom-up” and “complete integration” design principles.
Figure 6 IAB/INFORGE at a glance
Source: diagram by author
“Bottom-up” implies that the individual sectors in the national economy are modelled in great detail and the macroeconomic variables are formed through aggregation in the model context. This enables a complete depiction of the individual sectors in a macroeconomic context and in the intersectoral integration, as well as an explana-tion of macroeconomic correlations, which the national economy conceives as the sum of its sectors. “Complete integration” refers to a model structure with the illus-tration of inter-industry integration and an explanation of how private households use income generated by the individual sectors (Figure 6). Export demand is deter-mined through Germany’s foreign trade relations with the rest of the world. The fore-casted import demand from 60 countries and regions determines the goods specific exports from Germany via bilateral trade matrixes.
Although the IAB/INFORGE model does indicate a very high degree of endogenisa-tion, it cannot do without an exogenous setting: In addition to the instrument varia-bles in fiscal policy such as tax rates, this includes the central bank interest rates of

IAB-Forschungsbericht 8/2015 20
the European Central Bank, the exchange rate, as well as the price trend of raw materials. The development in other countries represents an exogenous parameter for determining German exports just as the demographic development and its age structure does for labour demand.
3.2 Possible parameters and assumptions In line with the effects and correlations discussed above, the parameters in the Q-INFORGE model of the QuBe project for implementing Industry 4.0 in agriculture and the manufacturing sector in Germany are described below. The parameters discussed below refer to the national accounts of the Federal Statistical Office, which the model is based on.
Interventions are addressed alongside the input-output chart in Figure 7. The re-spective interventions in the input-output chart are explained below and can be lo-cated using the respective numbers in the input-output chart. The input-output chart serves as an orientation grid, given that only this chart can provide an industry-specific image of demand, intermediate input and production, and the structural consequences of Industry 4.0 can only be explicitly addressed and classified in a macroeconomic context here.
Introducing Industry 4.0 into the national economy has an impact on the indicated areas. On one hand, building investments ❶ are affected. Among others, these include underground engineering, which includes expanding the line network (“high-speed Internet service”). Equipment investments ❷ not only provide information on machine purchases in the machine building industry but also on required IT and information services. Both parameters will change in connection with the introduc-tion of Industry 4.0. The changes in inventory represent another part of the gross fixed capital formation ❸: They provide information on the change in inventory: negative values represent a reduction in stock. In the course of applying new tech-nologies, a change in inventory is basically conceivable.
While items ❶ to ❸ primarily describe the required investments, the following items revolve around a change in the demand for goods. This can be caused by a change in pricing: Products can become less expensive. Furthermore, new products or a change in quality can generate additional demand. In conclusion, there is “collateral” demand, which is for example expressed in a greater demand for continuing educa-tion.
Germany’s exports ❹ are, simply put, characterised by the trend of other countries’ import demand and the competitiveness of prices for German products. There are also long-term relationships between supplier and consignee, and differences in the quality of German products. The latter becomes clear in the goods structure of Ger-man exports, which are mainly in the chemical, machine building and automotive industries. This concentration cannot solely be attributed to cost-based competitive advantages.

IAB-Forschungsbericht 8/2015 21
There can be direct and indirect impacts on exports in line with transitioning to In-dustry 4.0. On the one hand, changes in demand can arise due to new qualities or products, and on the other hand, the production process is also modified, so export prices are subject to change.
The same applies to private household demand ❺: New demand can arise or con-sequences based on new price trends can result. There also are self-motivated costs for continuing education in private households to keep up with technological advances. Government spending ❻ includes costs for education, among other things. This also includes the activities of the Federal Employment Agency, which the government considers part of social insurances in line with national accounts. Increased initiatives for continuing education are also conceivable here.
Figure 7 Schematic diagram of the input-output chart
Source: diagram by author.
The intermediate input ❼ among branches of production provides information about the supplies (“Which goods are supplied to which branch of production?”) (line) and the cost structure (column). The latter indicates the amount of goods and services, which must be used to facilitate production. Industry 4.0 will bring a lasting change to these supply structures. We must therefore assume that to some extent, less (raw materials, semi-finished products) and/or other (electronic products) goods will need to be used. At the same time, there may be more demand for services (ICT). Since by definition, production minus intermediate input equals the added value, changes
Ʃ ƩƩ
Ʃ
complies roughly with the gross domestic product
❿ƩƩ
Inve
ntor
ies ❸
Expo
rts ❹
Appr
opria
tion
Intermediateinput ❼
Build
ing
inve
stm
ents
❶
Application
Supp
lies
Priv
. hou
seho
ld co
nsum
p
Gov
ernm
ent c
onsu
mpt
io
Equi
pmen
t ❷
Production
Imports
Revenue
Gross value added
Last appropriation
Depreciations❾Net operating surplus
Employee compensation ❽
Output
Inpu
t

IAB-Forschungsbericht 8/2015 22
in the cost structure have an immediate effect on it. From a company’s microeco-nomic perspective, decreasing material costs, which also include acquired services, results in an increase in gross profit for an unchanged sales volume.
For the purpose of simplification, the added value itself is split into employee com-pensation ❽ (personnel costs), depreciations ❽ and net operating surplus (similar to profit). Employee compensation is affected by several factors. If production is reduced, less employees will be required for the same production methods. This situation can arise if there is less demand for own goods due to the change in cost structures of other branches of production. However, there can also be changes in labour productivity; Industry 4.0 may require less employees without a change in production.
Depreciations ❾ are directly affected by investments ❶&❷: For instance, expendi-tures for new machinery are depreciated over the useful economic life and recorded in the form of depreciations on the cost side. At the same time, technological pro-gress can lead to machinery no longer being used because it is no longer profitable for production to use it or the goods produced with the machinery are no longer in demand. In both cases, extraordinary depreciations due to a reduction in the useful economic life can occur.
The remaining parameters not mentioned above are usually affected indirectly. This applies to e. g. imports. Production is the result of supply (price setting) and demand (❶ to ❻). Prices can be set by calculating the unit costs, which is a result of the ratio between the intermediate input plus wage and depreciation relative to price adjusted production.
Due to the abundance of impacts Industry 4.0 has on the economic process, no conclusion can be drawn on the overall result, i. e. the change in gross domestic product and the number and structure of employees, a priori. All consequences of Industry 4.0 addressed ultimately have an effect on the overall appropriation or the total revenue. After all, revenue and appropriation of each produced commodity must be the same due to the double-entry bookkeeping behind the input-output chart ❿. Consequently, changes in demand as well as supply will lead to a new result.
The illustration selected is a simplified version. Thus, wage and profit are changed by the interventions discussed. This results in consequences for the government budget (direct and indirect taxes) and the budget of private households (discretion-ary income). At the same time, the labour market changes. The number and com-pensation of employees are subject to change, which results in impacts on unem-ployment and the financial provisions of social insurances. Even if these and other correlations are not illustrated, they are indicated in the applied Q-INFORGE model (Maier et al. 2014b).

IAB-Forschungsbericht 8/2015 23
3.3 Assumptions – general assessments As in the publications available on the topic of Industry 4.0, the scenario illustrated here also assumes that Industry 4.0 will not be introduced ad-hoc but that the transi-tion will be a long-term process, which will take until 2025.6 Industry 4.0 is regarded fully implemented at such time and will persist until the end of the projection hori-zon – 2030.
Industry 4.0 will not only be relevant to industrial companies but also to service companies – though perhaps to varying degrees. Consequently, a complete imple-mentation of the fourth Industrial Revolution would signify structural changes for all sectors of the national economy. In view of a lack of available baseline calculations and in view of the special relevance Industry 4.0 holds for companies in the manu-facturing sector, the scenario focuses on sectors in the manufacturing industry and agriculture. These sectors are, on the one hand, usually characterised by a high reliance on export and a large workforce, and/or will be manufacturing many of the components or machinery required for Industry 4.0. The cost structures and there-fore the supply relationships between sectors are explicitly changed for these sec-tors.
Creating of new business models, products and services for final demand are regu-larly mentioned in literature with regard to the opportunities and potential of Indus-try 4.0. The possibilities applying Industry 4.0 technologies have to offer are beyond dispute. However, whether the demand will also be created for the new business models and to which it extent, is uncertain. Therefore, the effect on the demand side due to new supplies (so not based on a change in demand due to a price setting) usually illustrated quite abstract in the aforementioned studies, is therefore not real-ised in this scenario through assumed trends until the last partial scenario.
One consequence of the cost reduction resulting from Industry 4.0 technologies is a relative cost advantage of products produced in Germany. This can infer a repatria-tion of production processes relocated abroad, which would be expressed in a re-duction of the intermediate input imports. This scenario does not act on the assump-tion that production sites will return to Germany because there was no indication of a trend in the above mentioned in-depth discussions.
Furthermore, this scenario assumes that Germany will begin introducing and imple-menting Industry 4.0 very early compared to all other countries. That is the only way to successfully generate “temporary monopoly profits” when dealing with foreign competitors. In principle one must assume, as established by international studies (Berger 2014), that Germany is not the only country pursuing the fourth Industrial Revolution. Efforts to realise the productivity potential of Industry 4.0 technologies can also be observed in the USA and China. One possible consequence of a quick
6 Later points in time are also given for a complete implementation.

IAB-Forschungsbericht 8/2015 24
implementation of Industry 4.0 abroad could be that Germany’s import structure would need to change. This assumption can therefore lead to an overestimating the actual consequences.
4 Scenario calculations and results A series of assumptions based on the depicted correlations are used in the QuBe model (Q-INFORGE; Maier et al. 2014a) below. For clarity purposes, the assump-tions are listed in Chart 1 and allocated to the individual partial scenarios (PSC) and overall scenarios, described and the results of which are addressed below. The de-tailed description of the assumptions is provided in the respective partial scenario. Here the respective assumptions refer to the corresponding number in Table 1.
Table 1 List of assumptions
Source: diagram by author.
4.1 Equipment investments (partial scenario 1) One deciding factor for economic development is how many additional investments in equipment will be needed and over which time, when transitioning to Industry 4.0. This question cannot be answered conclusively since newly purchased equipment may already have the required features but may have been purchased again in line with general replacement processes. We can therefore only attempt to make as-sumptions on the additional investments, taking plausibility into consideration.
(Assumptions ❶ and ❷) Part of the existing equipment is retrofitted or upgraded by replacing the control units and procuring the IT services required for this purpose.
Measured relative to the capital stock for equipment, equipment investments have an approx. 10 per cent stake. That means, the capital stock is normally replaced every ten years. It is assumed that of the last ten model years invested in, only the
AssumptionsPartial
scenariosOverall
scenario 1Overall
scenario 2Equipment investments❿ Additional investments❿ Conversion of capital stock sensor technology❸ Conversion of capital stock IT servicesBuilding investments❸ Capital expenditure “high-speed Internet”❸ … and distribution❸ Balanced Government budgetMaterial and personnel costs❸ … Continuing education❸ … consulting services❸ … digitisation❿ … proportional decrease in raw materials and supplies as well as purchased services ❿ … increasing labour productivityChange in the structures of occupational fields❿ Adjustment in occupational structure with industrial sectors considering routine❿ Adjustment in labour productivityIncreases in demand❿ … increases in export❿ … additional demand from Private households
PSC 1
PSC2
PSC3
PSC5
Comparison with the baseline scenario (baseline projection) QuBe project
PSC4w
ithou
t a sh
ift in
dem
and
with
a sh
ift in
dem
and

IAB-Forschungsbericht 8/2015 25
five more recent years will be equipped with Industry 4.0 compatible control instru-ments in the coming years. It is no longer profitable with older equipment, since it will be replaced in the next five years as scheduled. It is further assumed that not only control instruments, but IT services are also required to integrate the respective machinery into the new production process.
According to the input-output table 20107, of the € 193 billion invested in equipment, a total of € 7.7 billion will be spent on “measuring/control instrument among other instruments and equipment, electro-medical devices as well as data carriers”. An-other € 21.1 billion account for “IT and information services”. The combined amount to approximately 15 per cent of the total equipment investments.
Since the production statistics do not provide any information on how many percent of the € 7.7 billion apply to measuring and control instruments required for data ex-change with the machine, we are assuming a volume of 25 per cent. The same per-centage is assumed for IT services (total of € 21.1 billion). Therefore, approximately € 7.25 billion, or 3.75 %, are allocated to required sensor technology and IT services for a “normal” investment year of 193 billion.
It is further presumed only 50 per cent of the machines in question will actually be retrofitted. That results in an annual investment amount of approx. € 3.6 billion, which would then have to additionally be invested. It is further assumed that today’s five year old machines will be retrofitted in the next five years. This also applies to the four following years, but respectively moved back by one year. The investments required for retrofitting in the amount of approx. € 18 billion adjusted for price are therefore extended to nine years. Consequently, retrofitting costs apply to the years 2016 to 2024 (Figure 8).
Figure 8 Vintage years of retrofitting investments
Source: diagram by author.
(Assumption ❸) In addition to investments required to upgrade existing equipment, the current investments totalling approx. € 300 billion annually adjusted for price are being increased by an additional 0.5 per cent for Industry 4.0 retrofitting measures. In the course of the baseline, the investments increase until 2025, adding an aver-
7 Input-output chart 2010 prior to the revision of the national accounts.
2016 2017 2018 2019 2020 2021 2022 2023 2024 2025Investment year 2010Investment year 2011Investment year 2012Investment year 2013Investment year 2014
IAB-Forschungsbericht 8/2015 26
age of another € 15 billion adjusted for price over the years, i. e. € 1.5 billion per year.
This corresponds to additional investments amounting to € 22.5 billion over the course of the entire projection period (2016-2030). The investing industrial sectors (simplified: sectors) are in the manufacturing sector and in agriculture. For the pur-pose of allocating investments of the sectors to the assets invested, it is presumed that only categories of goods (CG) are affected, which actually guarantee Indus-try 4.0 competence. These include the following categories of goods:
(1) CG 27 - electrical equipment (2) CG 28 - machinery
(3) CG 33 - repair, maintenance and installation of machinery and equipment
(4) CG 62-63 - IT and information services
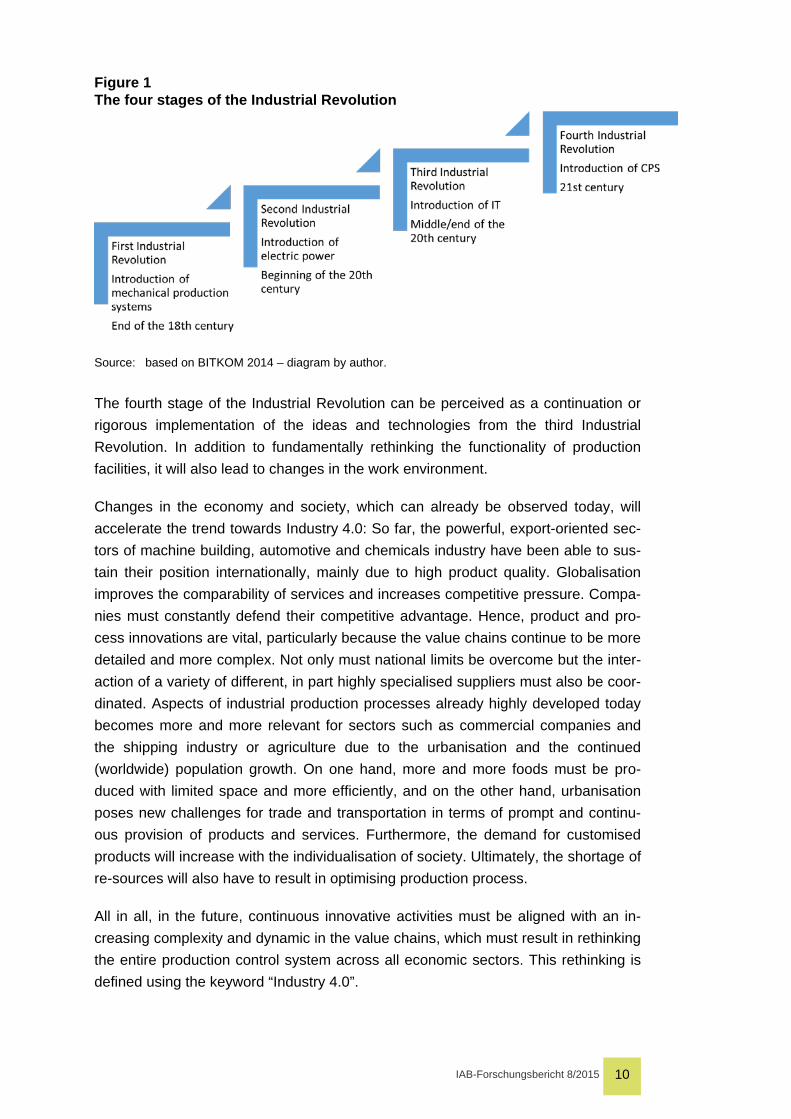
A total of (assumption ❶ - ❸) approximately € 33 billion adjusted for price more will be invested in 2016 to 2025 than in the baseline scenario. This value consists of a price adjusted investment volume of €18 billion in sensor technology and IT services as well as an additional € 15 billion (adjusted for price) through additional invest-ments amounting to € 1.5 billion annually. During the period 2026 to 2030 the gen-eral additional annual investments continue, so that the total investment volume increases by another € 7.5 billion to € 39.5 billion by 2030. Furthermore, additional investments caused indirectly ensue in the model context. The investments are fi-nanced via depreciations, which either reduce the profit of the companies or result in shifting to ex-factory prices.
Figure 9 Partial scenario 1 – Change in gross domestic product and its components in compar-ison with the baseline scenario
Source: diagram by author.

IAB-Forschungsbericht 8/2015 27
A look at the components of the gross domestic product (Figure 9) shows the equipment investments are in fact still higher than in the baseline scenario after completing the retrofitting phase in 2024, but the gap is smaller. The gross domestic product in 2030 is even lower than in the baseline scenario because the additional investments for 2016 to 2024 still lead to costs in form of depreciations. Export also suffers because of production prices increasing due to depreciations in comparison to the baseline scenario.
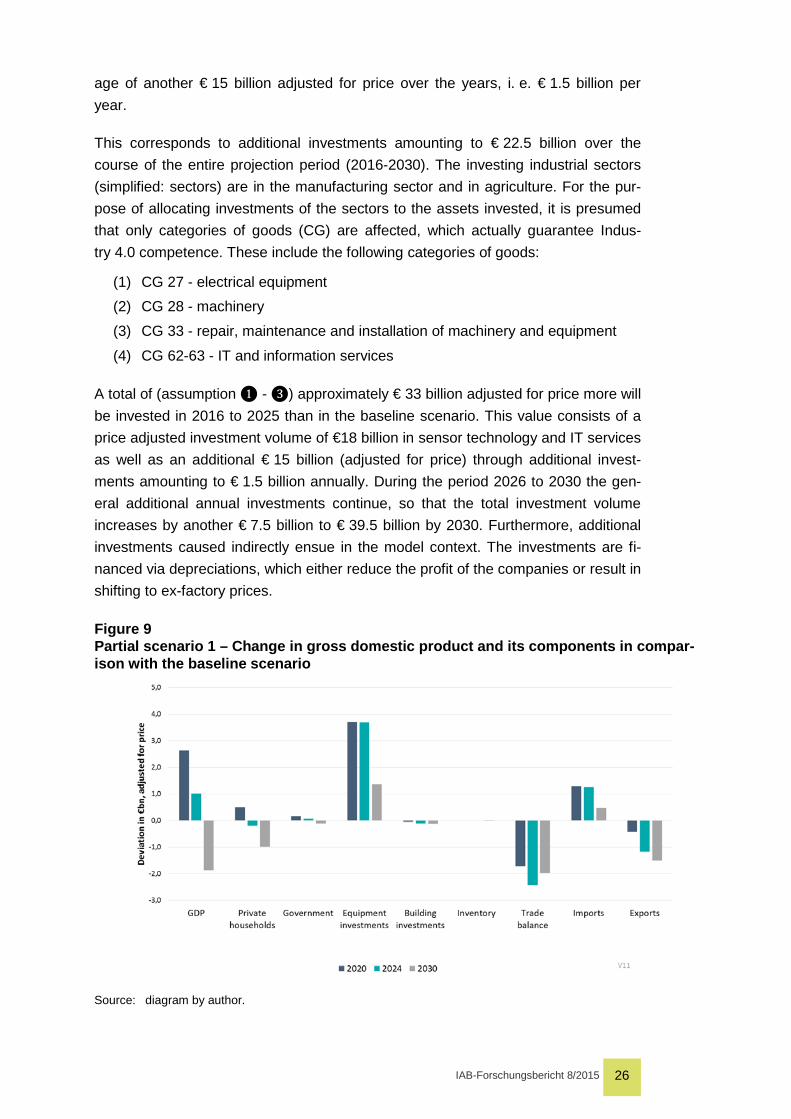
The result is not surprising given that partial scenario 1 by itself is incomplete: To date, the model only includes costs, no revenues. Nevertheless, initial changes in the occupational field structure can be seen (Figure 10). With the increase in in-vestments and the overall higher rate of growth things brings, in the beginning, par-ticularly IT & scientific professions (MOF 14) and professions in media science/ humanities (MOF 17) (incl. design) as well as management professions (MOF 16) will be in higher demand. The increase in MOF 14 will be primarily initiated by the specific IT services addressed.
Figure 10 Partial scenario 1 – Number of employees by primary occupational fields in compari-son with the baseline study
Source: diagram by author.
4.2 Building investments (partial scenario 2) Although this study focuses on the effects of Industry 4.0 and not Economy 4.0, for industrial companies, upgrading to a “high-speed Internet” is also key for implement-ing a digital economy. According to a study conducted by TÜVRheinland on behalf of BMWi (TÜVRheinland 2013), the costs for the upgrade amount to approx. € 20 billion to ensure 100 per cent of households have a 50 Mbit/s connection. The costs amount to € 12 billion for a supply goal of 95 per cent.

IAB-Forschungsbericht 8/2015 28
(Assumption ❹) The upgrade requires € 4 billion to be invested annually for the next three years in order for approximately 95 per cent of all households to have a 50 Mbit/s connection by 2018.
According to the study, the goal of to provide a nationwide network (i. e. 100 per cent) is to be achieved by 2018. Assuming that hardly any additional investments were made in 2014 and 2015, this leaves only 2016, 2017 and 2018. Due to the time constraints and the high demand for investments, a 95 per cent development will probably only be achieved by the end of 2018, so that an additional 4 billion Eu-ros annually will have to be invested for the next three years.
(Assumption ❺) Normally, cable-based technologies (TÜVRheinland 2013) will be used. Consequently, civil engineering work and the application of electronic equip-ment (cables among others) will be affected. The electronic equipment only repre-sents a small percentage of the building investments: According to the input-output calculation by the Federal Statistical Office, approximately 1 per cent. Therefore, it is assumed that a large part of this portion investments was already previously used for network upgrades and will now increase by 100 per cent (i. e. approx. € 1 billion annually). The remaining € 3 billion will be spent for civil engineering work. The off-setting entry is fully recognised in the government’s investments.
(Assumption ❻) The government will not finance the required investments by incur-ring additional debts. On the contrary, it is assumed that the government’s budget will remain balanced.
For example, additional tax revenue accrued over time could be used for financing. However, if sufficient additional tax revenue cannot be obtained in comparison with the baseline scenario, taxes must be raised (or scheduled reductions must be post-poned), to avoid a change in the budget balance. Contrary to this, financing by means of debts or from surpluses, which are then not used for amortisation, would result in a more severe outcome.
IAB-Forschungsbericht 8/2015 29
Figure 11 Partial scenario 2 – Change in gross domestic product and its components in compar-ison with partial scenario 1
Source: diagram by author.
Figure 11 shows the effects on the components for 2018 and 2030. Here we select-ed the year 2018 apart from the other illustrations because it illustrates the last year of additional building investments. There are no additional investments in 2020. Compared to the preceding partial scenario 1, 2018 shows a considerable increase of the price adjusted building investments. However, the impacts on the gross do-mestic product are less severe. At the same time, imports of intermediate goods are also associated with building investments, resulting in a decline of the trade balance. There are no remaining impacts in 2030 since partial scenario 2 also only assumes an upgrade will take place but not that the new options will also be used.

IAB-Forschungsbericht 8/2015 30
Figure 12 Partial scenario 2 – Number of employees by primary occupational fields in compari-son with partial scenario 1
Source: diagram by author.
Likewise, the changes in primary occupational fields also only provides a picture of the exclusive impacts of building investments (Figure 12). However, it becomes ap-parent that the specific intervention in building investments (civil engineering and electronic equipment) primarily addresses professions in the building sector but also those in metal construction and systems engineering.
4.3 Material and personnel costs (partial scenario 3) Material and personnel expenses for the investing branches of production are intro-duced in the following partial scenario 3. Until now, the companies have invested (partial scenario 1&2). Earnings from the investments were not yet taken into ac-count. Nevertheless, a cumulative additional € 33 billion adjusted for price are as-sumed to be spent by 2025. However, additional costs for continuing education, consulting services and IT services are required for the best possible utilisation of potential gains in efficiency. Ultimately, the return on investment is reflected in the changed expense situation. Five interventions are taken for this purpose. Three re-fer to the additional costs (cost increases) and two are potential savings (cost reduc-tions). The result shows a change in material and personnel costs for the company:
Cost increases: (1) Increase of the companies’ (branches of production) proportional costs for
continuing education,
(2) Increase of the companies’ cost fractions for consulting services and
(3) Massive use of additional IT services.

IAB-Forschungsbericht 8/2015 31
Cost reductions: (4) Reduction in the material cost ratio (material costs relative to sales volume)
by reducing wear and waste,
(5) Reduction in the personnel cost ratio by improving labour productivity.
While the assumptions for continuing education (see above), consulting services and the use of additional IT services can still be estimated relatively well, the sav-ings for materials and work input depends on numerous factors, which are not taken into account here. For instance, it must be assumed the branches of production have different percentages of waste (e. g. surface finishing, production of forgings, pressed parts, drawn parts and stamped parts as well as metal tanks) between 2 to 6 per cent (Emec et al. 2013). Moreover, some trades produce more waste than others. Manufacturing wooden window frames can generate up to 50 per cent waste (Mantau et al. 2013).
At the same time, the great uncertainty regarding the assumptions (4 & 5) is associ-ated with significant impacts on added value and distribution. For instance, the sec-tors of the manufacturing industry supplied each other with intermediate inputs amounting to € 720 billion in 2010 according to the input-output chart. Provides that nothing else changes (ceteris paribus assumption), savings of merely one per cent would imply a growth in value amounting to € 7.2 billion in one year. Applied to the gross domestic product, that is a growth of approximately 0.3 per cent. The ad-vantage of reduced material costs due to a new production process then applies to all subsequent years. Over ten years this would generate a growth in added value of € 72 billion, which would then already exceed the investments totalling € 33 billion (adjusted for price). In order to make an appropriate assumption which is not overly optimistic, it seems reasonable to first take a look at the three assumptions regard-ing the cost increases.
(Assumption ❼) Agricultural companies and those in the manufacturing sector must invest additional money in continuing education in years to come in order to be able to utilise the advantages of Industry 4.0. Additional costs amounting to € 1,000 per employee are estimated.
Approximately 7 million people work in the manufacturing sector. Training each one means an additional € 7 billion over the next ten years, or € 0.7 billion annually. Ac-cording to the input-output chart 2010, approximately € 1.2 billion per year are al-ready being spent now on training from outside providers. Furthermore, we also assume that companies spend the same amount for in-house training. Thus, all companies spend approximately € 2.4 billion. Therefore, the increase of € 0.7 billion represents a growth of nearly 30 per cent. It is furthermore assumed that the cost per training unit will increase over the next ten years. This cost increase complies with the price development in the teaching and education sector. It will amount to approximately 20 per cent for 2010 to 2016.

IAB-Forschungsbericht 8/2015 32
(Assumption ❽) 1.5 per cent in additional consulting services are required to im-plement the new production methods in a company.
According to the input-output chart, the manufacturing sector acquires approximate-ly € 26 billion in outside services. 1.5 per cent higher costs for consulting services corresponds to approximately € 0.4 billion more for a production value of € 1,600 billion for the concerned sectors (agriculture and manufacturing sector). The costs will continue to rise until 2025 due to price trends and will further increase the amount.
(Assumption ❾) The digitisation rate within the manufacturing sector will increase from 20 per cent today to 40 per cent.
According to PricewaterhouseCoopers Aktiengesellschaft (PWC 2014), a digitisation rate of 80 per cent is necessary for the implementation of Industry 4.0; therefore, based on today’s costs of IT services, an increase of costs by four-fold would have to be assumed for linear relationships. However, this appears to be an extreme as-sumption, which is why we will only “only” assume it doubling. In 2010, the branches of production in the manufacturing sector spent approximately € 7.6 billion according to the input-output chart. Doubling this implies an increase to € 15 billion under oth-erwise identical conditions. The transition begins in 2016 and ends in 2025. There are also price trends, so that the nominal additional costs in 2025 exceed € 7.6 bil-lion.
To obtain an overview of the costs and investments of companies in the manufactur-ing sector, the implicit cash flows are examined coherently. In order for the costs (assumptions ❼❽❾) and investments in equipment (assumptions ❶❷❸) to be profitable, the cost savings associated with material and personnel costs must at least cover the additional costs over the next ten years.
(Assumptions ❿ & ⓫) The costs paid generate a return of 9.3 per cent (discount-ed: 4.7 per cent) and savings required for this purpose of 1.2 per cent in 2025 ac-crue for intermediate inputs in the area of raw, semi-finished and finished products for power and water as well as work input on a pro rata basis.
Therefore, 1.2 percent less is used for raw, auxiliary and operating materials as well as for procured goods in each production process in agriculture and the manufactur-ing sector, to ensure production is unchanged (Table 2). Based on labour costs, this means that the workforce can be used more efficiently and therefore, that labour productivity increases by 1.2 per cent. The number of hours used for production in a branch of the manufacturing sector or in agriculture decreases by 1.2 per cent.
In 2024, the accumulated savings will exceed the accumulated costs (payments) for the first time. The depicted payments include price changes and indirect impacts.

IAB-Forschungsbericht 8/2015 33
Unlike the microeconomic perspective, the result of the assumptions is not a zero sum game in macroeconomic terms, given that Germany is not a closed economy: Although the investing companies can record an additional profit according to the trend shown in Chart 2, additional demand is also generated in other sectors (e. g. ICT). Furthermore, there will not only be cost savings for German suppliers but also for foreign suppliers. Imports drop. Moreover, costs per unit are reduced for compa-nies in agriculture and the manufacturing sector, so that competitiveness is im-proved and e. g. more exports can be achieved. Figure 13 shows the effects of par-tial scenario 3 on the components of the gross domestic product in comparison with partial scenario 2.
IAB-Forschungsbericht 8/2015 34
Table 2 Comparison of costs (payments) and savings, nominal
In €bn Rounded to 100m 2016 2017 2018 2019 2020 2021 2022 2023 2024 2025 Cumulative Discounted
to 2015 Continuing education 900 900 900 1,000 1,000 1,000 1,100 1,100 1,100 1,200 10,200 7,800 Consulting 500 500 600 600 600 600 700 700 700 700 6,200 4,700 IT service 500 1,000 1,600 2,300 3,100 4,000 4,900 6,000 7,200 8,600 39,200 27,500 Investments 3,800 4,100 4,100 3,900 3,800 3,900 4,000 4,200 4,400 2,400 38,600 30,000 Costs (payments) 5,700 6,500 7,200 7,800 8,500 9,500 10,700 12,000 13,400 12,900 94,200 70,000 Cumulative 5,700 12,200 19,400 27,200 35,700 45,200 55,900 67,900 81,300 94,200 … intermediate inputs 1,200 2,500 3,900 5,300 6,900 8,400 10,100 11,800 13,600 15,100 78,800 56,000 … wage payments 400 900 1,300 1,700 2,200 2,600 3,100 3,500 4,000 4,500 24,200 17,300 Savings 1,600 3,400 5,200 7,000 9,100 11,000 13,200 15,300 17,600 19,600 103,000 73,300 Cumulative 1,600 5,000 10,200 17,200 26,300 37,300 50,500 65,800 83,400 103,000 Profit or loss -4,100 -3,100 -2,000 -800 600 1,500 2,500 3,300 4,200 6,700 8,800 3,300 Cumulative -4,100 -7,200 -9,200 -10,000 -9,400 -7,900 -5,400 -2,100 2,100 8,800 Return (result in relation to costs) 9.3 4.7
Source: diagram by author.

IAB-Forschungsbericht 8/2015 35
Figure 13 Partial scenario 3 – Change in gross domestic product and its components in compar-ison with partial scenario 2
Source: diagram by author.
The trade balance improves; the positive impulses increase via income cycles of the private households’ consumer demand. Furthermore, the tax revenue (direct and indirect) and consequently, the government’s financial power can increase. Overall, the gross domestic product is significantly higher. The effect increases over time, all cost savings have not been completely implemented until 2025.
The structure of the primary occupational fields has also changed. Overall, demand for service professions increases at the expense of professions in the manufacturing sector. In particular, IT and scientific professions (MOF 14) can benefit. Teaching professions (MOF 20) take second place, which not only include teachers at gen-eral-education and vocational schools but also persons working in adult education (Figure 14).

IAB-Forschungsbericht 8/2015 36
Figure 14 Partial scenario 3 – Number of employees by primary occupational fields in compari-son with partial scenario 2
Source: diagram by author. In particular, the primary occupational fields “resource extraction professions (MOF 1)”, “auxiliary workers/caretakers (MOF 2)”, “metal construction, systems en-gineering, sheet metal construction, installation, assembly workers, electrical trades (MOF 3)”, “other processing, manufacturing and repair professions (MOF 5)” as well as “system and machinery control and maintenance professions (MOF 6)” and “technical professions (MOF 15)” are affected by declines. This results directly from the change in cost structure: The sectors supplying intermediate inputs have to sup-ply less for the same output of the subordinate sector. They themselves require less raw materials. At the same time, labour productivity in agriculture and the manufac-turing sector increases, which leads to further drops in demand. Imports decrease and the orders from subordinate sectors do as well. Consequently, there is less work to be done. The “traffic-related, warehousing and transport professions (MOF 9)” are also affected negatively. The use of smaller quantities of material also leads to a reduction of quantities to be transported. On the other hand, the decline in catering professions (MOF 8) is indirectly associated: Less people need to be ca-tered to in canteens, cafeterias, etc. Furthermore, cooks are part of the catering pro-fessions; however, cooks are also employed in the food industry. An increase in labour productivity is also assumed there.
The assumptions ❼-⓫ trigger the change even more distinctly: The manufacturing sector (CA to CX) and agriculture (A) lose jobs (Figure 15). The information and communication (J) sectors have a considerable increase in employees. Other posi-tive, although minor, effects can be identified in the remaining service sectors (M to P). The other services (NX) not including the supply of temporary workers 78 may also increase. Special mention must be made to the education sector (P), which can record significant increases, above all in the first years.

IAB-Forschungsbericht 8/2015 37
Figure 15 Partial scenario 3 – Number of employees by branches in comparison with partial scenario 2
Source: diagram by author.
What are the consequences for the employees? Do they have to change sectors? Or their occupation, or both? For this purpose, the changes in industrial sectors and occupational fields are examined. The net changes (sum of all) are compared to the respective positive and negative gross changes (sum of all negative and all positive changes).
Figure 16 Partial scenario 3 – Number of jobs lost and created by branches in comparison with partial scenario 2
Source: diagram by author.

IAB-Forschungsbericht 8/2015 38
Figure 16 shows that compared to partial scenario 2, no jobs are lost in 2020 in terms of the overall economy. The number of employees remains the same. None-theless, there are consequences for the work environment: Approximately 50,000 jobs are lost in the sectors with a decline in employment figures. Other sectors can hire a total of 50,000 additional employees. Therefore, 100,000 jobs are affected. In 2030, all structural changes are in effect; there are then approximately 20,000 fewer jobs than in partial scenario 2. However, the change in the work environment is far greater: The negatively affected sectors cut 100,000 “old” jobs, the benefiting sec-tors can provide 80,000 “new” jobs at the most.
The change in the sectors, which is caused by the integration of changed material and personnel costs, not only leads to effects on the work environment based on sectors but also with respect to occupational fields: Sectors are distinguished by the occupations required in order to produce. A change in the structure of the sectors also entails a new structure of the employees by occupational fields.
Figure 17 Partial scenario 3 – Number of jobs lost and created by occupations in comparison with partial scenario 2
Source: diagram by author.
Figure 17 shows the same changes for employees in total (net total) as shown in Figure 16, however, profit and loss are significantly lower: Based on occupational fields, 70,000 jobs are lost in 2025 and 2030 – based on sectors, it was 100,000 (see Figure 16). As a result, the jobs change more excessively between sectors than between occupations. This is also due to the fact that no change in occupa-tional structure within a sector has been modelled based on the introduction of In-dustry 4.0. This is taken into account in the fourth partial scenario.

IAB-Forschungsbericht 8/2015 39
4.4 Occupational field structure (partial scenario 4) In addition to the effect of the economic structure, which results from the integration of material and personnel costs, there is also the effect of the occupational field structure. Therefore, the fourth partial scenario deals with the changes in the occu-pational field structure within the sectors. Vital for the following is the assumption, that not only the sector but also the structure of the occupations to be employed change in the course of the implementation of Industry 4.0. In order to be able to assess the resulting dynamics, the past change in occupational fields from 1996 to 2011 is depicted (Figure 18).
In the past, significant changes have taken place over 15 years. The number of em-ployees increased by +10 % from 1996 to 2011. At the same time, a substantial structural change took place. Occupations which are often found in the manufactur-ing sector sustained losses.
(1) MOF 3 metal construction, system engineering, sheet metal construction, in-stallation, assembly workers, electrical trades
(2) MOF 4 construction trades, wood, plastics processing and treatment
(3) MOF 5 other processing, manufacturing and repair professions
(4) MOF 6 machine and systems control and service professions
Contrary to this trend, MOF 14 “IT and scientific professions” was able to record growth. Many occupations which can be classified as services (including health ser-vices) could grow:
(1) MOF 11 catering professions
(2) MOF 12 cleaning and disposal professions
(3) MOF 16 legal, management and economic professions
(4) MOF 17 media science professions, professions in humanities and social sciences, artistic professions
(5) MOF 18 healthcare professions
(6) MOF 19 social professions
(7) MOF 20 teaching professions

IAB-Forschungsbericht 8/2015 40
Figure 18 Change in employees by primary occupational fields between 1996 and 2011
Source: diagram by author. Which effects the transition to Industry 4.0 will have on the structure of the occupa-tional fields in a sector is unknown. Assuming that as a result of the transition to Industry 4.0 primarily occupations with a high percentage of routine jobs will be cut back and occupations with a low percentage of routine jobs will increase (Author et al. 2013; Bonin et al. 2015; Bowles 2014; Brzeski/Burk 2015; Frey/Osborne 2013), the possible effects of Industry 4.0 for employment in the sectors can be as-sessed. For this purpose, the percentages of routine jobs identified by Dengler and Matthes (2015) are used in the BIBB occupational fields based on the occupational data from the expert databank BERUFENET of the Federal Employment Agency.8 In this connection, job tasks which “can be conducted according to programmable standards” are described as routine jobs; “while non-routine [jobs] can merely be supported by computers” (ibid.).9
(Assumption ⓬) The higher the percentage of non-routine jobs in an occupational field relative to the sector average, the more an occupational field benefits from transitioning to Industry 4.0.
For instance, if the sector average of non-routine jobs in an occupational field is 40 per cent and 80 per cent for an occupational field within the same sector, the num-ber of employees in the occupational field with a higher percentage of routine should
8 Cf. Tiemann 2008 for the BIBB occupational fields. Similar routine percentages can be
determined for the 54 occupational fields based on the collective employee survey con-ducted by the Federal Institute for Vocational Education and Training and the Federal In-stitute for Occupational Safety and Health.
9 We would like to take this opportunity to thank Dengler and Matthes for calculating the routine percentages by occupational fields.

IAB-Forschungsbericht 8/2015 41
show a greater decline in line with the transition to Industry 4.0. However, because there are also numerous reasons, which argue against a complete adaptation ac-cording to routine percentages, it is furthermore assumed that merely half the rou-tine jobs can be saved by technological progress, at the most. Nevertheless, which routine percentages can actually be saved cannot be determined in advance be-cause in addition to the assumptions made, further changes in the occupational field structure result from the model – for instance due to varying wage growth. (Maier et al 2014b).
The changes in the occupational field structure resulting which result in the course of the transition to Industry 4.0 have consequences: Along with assigning more complex work, the percentage of occupations with higher wages increases. There-fore, the average wage costs of the sector increase.
(Assumption ⓭) Labour productivity increases by 0.9 per cent based on the restruc-turing of the occupational fields, so that wage costs and profit remain the same.
As in the assessment of the material and personnel costs it is again assumed that the companies will not make any changes which reduce their profit. Therefore, in line with assumption ⓭, the assumption is made that labour productivity will in-crease by another 0.9 per cent by 2025. The 0.9 per cent correspond to the increase in wage costs in the selected sectors for an exclusive restructuring of the occupa-tional fields.
In other words: The occupational fields, which are considerably above the average routine percentage in their sector, lose; occupational fields with a relatively low rou-tine percentage compared to the sector average will win. Overall however, employ-ment in the sectors in which investments were made will decrease in equal measure due to the assumed increase in labour productivity.
Table 3 shows a fictitious example of a sector with four occupational fields, which is used to explain the approach.
Table 3 Integration of the routine percentage, model calculation
Occupational fields
1 2 3 4 Total Average Employees in 2015 in persons 1,000 1,000 3,000 5,000 10,000 .. in % in % of total 10 10 30 50 100 Routine percentage of the job in % 10 70 80 90 77 Halving of the routine percentage in % 5 35 40 45 Percentage of the complex jobs at halved routine percentage in % 95 65 60 55 61.5
Bonus/malus: In relation to the industry sector average, scaling factor Factor 1.54 1.06 0.98 0.89
Employees considering the bonus/malus factor in 2025 in persons 1,545 1,057 2,927 4,472 10,000
Considering the increase of labour produc-tivity by 1.2 % in persons 1,526 1,044 2,892 4,418 9,880
Source: diagram by author.

IAB-Forschungsbericht 8/2015 42
To uncover the consequences for the occupational fields, these are compared to the preceding scenario. Figure 19 shows the changes in primary occupational fields, which solely trace back to the assumptions ⓬ and ⓭.
Figure 19 Partial scenario 4 – Number of employees by primary occupational fields in compari-son with partial scenario 3
Source: diagram by author.
It is quite apparent that the system and machinery control and maintenance profes-sions (MOF 6) decrease; they lose up to 12 per cent in the course of transition. However, compared to the previous shifts in the occupational fields over time (Figure 18), this is still a comparatively minor change, but it must be taken into ac-count that Figure 19 only depicts scenario effects beyond the basic development of the baseline scenario. The IT and scientific professions (MOF 14) benefit most. However, so do the construction trades (MOF 4), for which only small routine per-centages are indicated according to Dengler and Matthes (2015).
In conclusion, the gross flows within the occupational fields are looked at. The fluc-tuations for the primary occupational fields in partial scenario 3 were less than those for the sectors, but partial scenario 4 shows significantly greater fluctuations (Figure 20).

IAB-Forschungsbericht 8/2015 43
Figure 20 Partial scenario 4 – Number of jobs lost and created by occupations in comparison with partial scenario 3
Source: diagram by author.
In 2025 and 2030 a total of 700,000 employment relationships will be impacted by the assumption made. The balance for these years shows a numerical loss of 70,000 to 80,000 employees. This decline is attributed to the macroeconomic con-sequences of the occupations being reallocated and the again increasing labour productivity.
4.5 Overall effect without additional demand (partial scenarios 1-4) Until now, the scenarios were compared step by step to be able to identify the iso-lated effects. In the following, the interferences in the first four partial scenarios will be compared to the baseline scenario (Figure 4). The difference between the QuBe baseline scenario and the overall scenario without shifts in demand is therefore at-tributed to all previous interferences (assumption ❶-⓭). The consequences for the gross domestic product and its components are illustrated in Figure 21. The gross domestic product will increase less in the beginning but more during the last five years. Even without any other interferences in the area of consumption and export, there will be an increase in export and consumption due to cyclical flow effects (cy-clical flow of income) and due to improved competitiveness (lower manufacturing costs). The decreasing import demand is also important for the result, which is caused by less demand for imported intermediate inputs for raw, semi-finished and finished products in agriculture and the manufacturing sector. The gross domestic product will exceed the gross domestic product in the baseline scenario from 2025 to 2030 by approximately € 20 billion each year. Therefore, an additional price ad-justed added value of more than € 120 billion will be created in those six years. The average growth rate over the entire period (growth path) increases by 0.05 %. Over-all, the effect on the gross domestic product is slightly smaller than when only exam-

IAB-Forschungsbericht 8/2015 44
ining the material and personnel costs (partial scenario 3). The reason lies in the financing of investments (partial scenarios 1&2), which provides for negative growth impulses after 2025. Furthermore, the reallocation of the occupational fields in sec-tors with a higher demand for highly qualified manpower provides for a slight in-crease in average hourly wages.
Figure 21 Overall scenario 1-4 – Change in gross domestic product and its components in comparison with the baseline scenario
Source: diagram by author.
Based on the structure of the occupations, there are conflicting influences in the manufacturing sector (Figure 22): The increase in equipment investments has posi-tive effects on employment, at least until 2024. The consequences of the changes in cost structure and increasing labour productivity counteract this.

IAB-Forschungsbericht 8/2015 45
Figure 22 Overall scenario 1-4 – Number of employees by primary occupational fields in com-parison with the baseline scenario
Source: diagram by author.
A look at the structure of the primary occupational fields shows that above all, manu-facturing professions decrease and service-oriented professions increase. Special attention must be given to construction trades, which are affected positively. The high initial investments yield the positive result. Given that there are no private in-vestments in the construction sector and therefore no productivity gains, there is no long-term decline in employment figures shown in comparison with the baseline scenario. Moreover, in the sectors directly addressed by the Industry 4.0 modelling, the low routine percentages in the construction trades lead to slight increases com-pared to other occupational fields. The “machine and systems control and service professions” (MOF 6) show the relatively highest increase. “IT and scientific profes-sions” (MOF 14) can relatively increase the most due to the higher equipment in-vestments and due to the degree of digitisation in agriculture and the manufacturing sector. The “teaching professions” (MOF 20) benefit from the increased rise of the companies’ costs for continuing education.

IAB-Forschungsbericht 8/2015 46
Figure 23 Overall scenario 1-4 – Number of jobs lost and created by occupational fields in com-parison with the baseline scenario
Source: diagram by author.
There will be 40,000 fewer jobs in 2020 (Figure 23). Furthermore, the negatively affected occupational fields lose approximately 240,000 jobs; on the other hand, 200,000 jobs are created in other occupational fields: Therefore, 440,000 jobs will see a change. Some will be lost, others created. In 2025 and 2030 there will be 820,000 resp. 760,000 jobs affected by the changes. A total of 100,000 jobs will be lost.
An examination by sectors now shows a smaller transition between jobs (Figure 24). In 2025 and 2030, there will be 100,000 fewer people employed again. However, 200,000 or 190,000 jobs will be eliminated and 100,000 or 90,000 will be created elsewhere. That means that approximately 300,000 jobs from the previous scenario settings will be shifted between the sectors.

IAB-Forschungsbericht 8/2015 47
Figure 24 Overall scenario 1-4 – Number of jobs lost and created by branches in comparison with the baseline scenario
Source: diagram by author.
In conclusion, a look at the formal qualifications (Figure 25). Each occupational field has a different qualification structure, which is also projected for the future (Maier et al. 2014b). Due to the new resulting occupational field structure, the qualification structure of the national economy changes as well. The demand for persons with a university or advanced technical college degree increases, given that cognitive oc-cupations with small routine percentages are in higher demand. Persons who have completed vocational training are in less demand due to the relatively higher routine in their jobs. In 2025 as well as 2030 approximately 150,000 fewer persons with these qualification are required.

IAB-Forschungsbericht 8/2015 48
Figure 25 Overall scenario 1-4 – Number of employees by qualification level in comparison with the baseline scenario
Source: diagram by author.
Results part 1:
(1) Industry 4.0 accelerates structural change in services. At least 11 per cent of jobs in the selected sectors will also change.
(2) Although the added value will increase due to increasing competitiveness and a reduction in imports, there will still be approximately 100,000 less persons em-ployed than in the baseline scenario in the overall course of time.
(3) IT professions and teaching professions benefit from the investment on a long term basis.
(4) The demand for highly qualified manpower increases at the expense of persons with training qualification and routine jobs.
(5) The effects on the number of jobs overall are moderate compared to “common” changes in employment figures in business cycles.
(6) Nonetheless, 760,000 jobs will shift between occupational fields by 2030.
4.6 Demand (partial scenario 5) Consumer demand from private households and the export demand are incorpo-rated in the following scenario. Additional demand can arise from private households due to the new options of Industry 4.0.
(Assumption ⓮) Germany has a worldwide pioneering role in the transition to Indus-try 4.0 and foreign countries react with a five-year delay. Therefore, international demand for machinery and measurement technology takes place five years later (i. e. 2020) than in Germany and then also continues for ten years. For a plausible

IAB-Forschungsbericht 8/2015 49
increase in export demand it is assumed the investment increase for this scenario (approx. € 3.2 billion) is correlated with the domestic production: In 2012, the pro-duction value in machine building and electronic products amounted to a total of approximately € 340 billion. Given that the additional demand for investments par-ticularly focuses on both of these branches, this increases the production by approx-imately 1 per cent. It is assumed that the demand will increase similarly worldwide and German exports will increase accordingly.
(Assumption ⓯) Private households are interested in the new consumption oppor-tunities which result after the transition to Industry 4.0. Products can be customised to individual needs, the interest in new things and a push in networking of previous end devices with home or a car, for example, may be potential causes. The dynam-ics and the extent of this additional demand is difficult to assess. It is therefore as-sumed that demand will only increase by 2 per cent by 2025 for selected consumer purposes. The selection of the respective purposes follows the products produced by the industrial sectors in the manufacturing sector, that is, which have changed their production method in line with the scenario analysis and therefore can also produce customised products. Food and beverages represent an exception because we do not assume additional food consumption. Furthermore, in addition to the ex-port assumption (pioneering role), it is consequently assumed that the new goods can only be acquired domestically, i. e. import is not possible. Therefore, for goods with a high import percentage it is assumed the demand for imported finished prod-ucts will not increase until 2020. This applies to clothing, furniture and automobiles. The imported intermediate inputs (raw materials and semi-finished products) were left unchanged, given that it is assumed that these will not be enhanced and are pro-cessed inside the country.
The selected purposes (Table 4) always deal with goods which characterise the domestic consumption of private households. Goods and services cannot always be clearly distinguished. Therefore, the purpose “goods and services for the operation of private vehicles” is not selected because in this case, fuels are usually recorded.

IAB-Forschungsbericht 8/2015 50
Table 4 Selection of purposes (highlighted in blue)
Purpose 1 Food products 2 Non-alcoholic beverages 3 Alcoholic beverages 4 Tobacco products 5 Clothing 6 Shoes 7 Actual rent payments 8 Alleged rent payments 9 Routine maintenance and repair of residences
10 Water supply and other services associated with the residence 11 Electricity, gas and other fuels 12 Furniture, interior design, carpeting and similar 13 Home textiles 14 Household appliances 15 Glassware, dishware and other domestic consumer goods 16 Tools and equipment for home and garden 17 Domestic goods and services 18 Medical products, devices and equipment 19 Outpatient medical services 20 Inpatient medical services 21 Vehicle purchases 22 Goods and services for the operation of private vehicles 23 Transportation services 24 Postal and courier services 25 Telephone and fax devices, incl. repairs 26 Telephone and fax services, Internet 27 Audiovisual, photographic and information processing equipment and accessories, including repairs 28 Other durable consumer goods for recreation and culture (incl. repairs)
29 Other devices and products for recreational purposes (including repairs), garden products and consumergoods for garden maintenance, pets
30 Leisure time and cultural service 31 Newspapers, books and stationery supplies 32 Package holidays 33 Education 34 Food services 35 Lodging services 36 Personal care 37 Personal commodities 38 Services from social institutions 39 Insurance services 40 Financial services 41 Other services, not otherwise specified
Source: Federal Statistical Office, diagram by author.
Illustrating the sole effects of the changes in demand on the components of the gross domestic product yields Figure 26.

IAB-Forschungsbericht 8/2015 51
Figure 26 Partial scenario 5 – Change in gross domestic product and its components in compar-ison with partial scenario 4
Source: diagram by author.
Exports and consumption of the private households are higher after 2020 than be-fore because exports do not pick up until later (2020) and consumer demand is con-tinuously increased. Imports increase significantly, given that many audiovisual end devices are not produced in Germany and must be imported accordingly. Further-more, demand for services by private households, which has a serious domestic impact (e. g. rent payments or personal hygiene), is not directly affected by the sce-nario assumptions. Ultimately, additional exports are also associated with additional imports. Therefore, despite increasing exports, the overall foreign trade balance is negative compared to partial scenario 3.
The consequences of partial scenario 5 for the primary occupational fields are far less specific than the preceding ones (Figure 27). Due to the consumption of private households, the demand for “professions in merchandising – service and sales (re-tail trade) (MOF 7)” increases the most. Overall, service professions are somewhat more in demand than professions in the manufacturing sector. The hotel and restau-rant industry records a slight loss. It is not part of the selected purposes.
It is apparent that in Economy 4.0 the retail trade (“Trade 4.0”) can also be organ-ised differently. However the preceding scenario only examines industrial digitisa-tion.
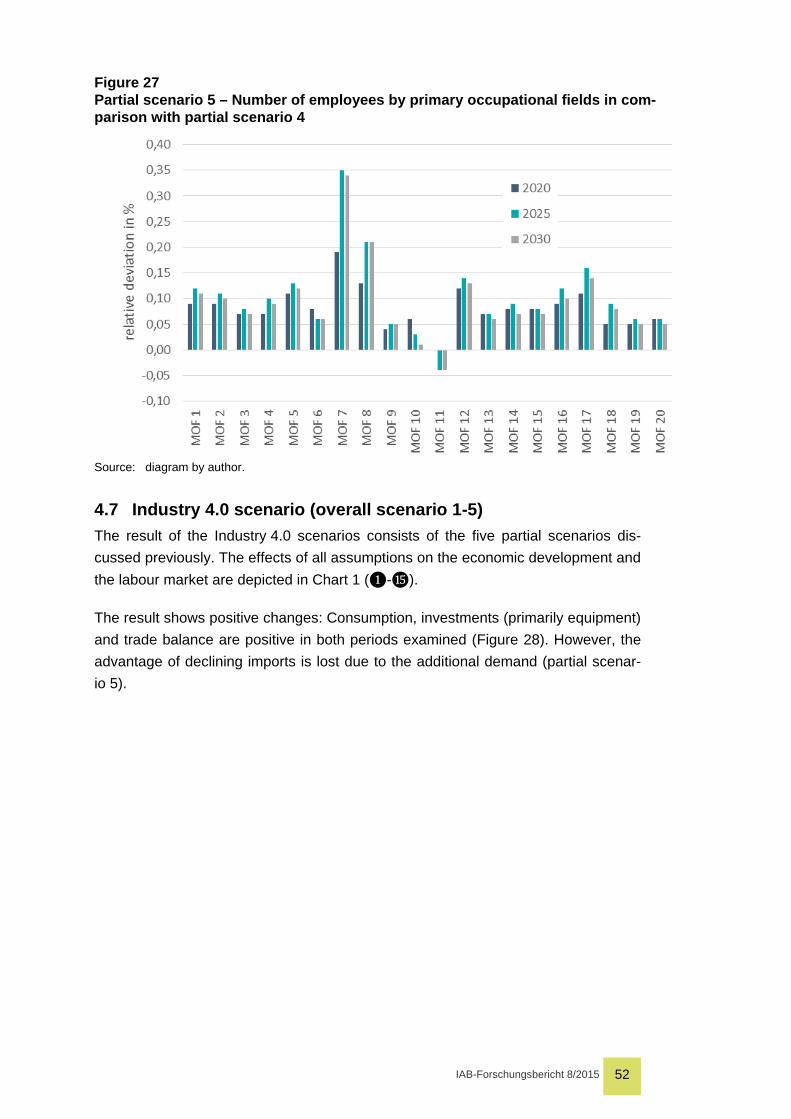
IAB-Forschungsbericht 8/2015 52
Figure 27 Partial scenario 5 – Number of employees by primary occupational fields in com-parison with partial scenario 4
Source: diagram by author.
4.7 Industry 4.0 scenario (overall scenario 1-5) The result of the Industry 4.0 scenarios consists of the five partial scenarios dis-cussed previously. The effects of all assumptions on the economic development and the labour market are depicted in Chart 1 (❶-⓯).
The result shows positive changes: Consumption, investments (primarily equipment) and trade balance are positive in both periods examined (Figure 28). However, the advantage of declining imports is lost due to the additional demand (partial scenar-io 5).

IAB-Forschungsbericht 8/2015 53
Figure 28 Overall scenario 1-5 – Components of the gross domestic product in comparison with the baseline scenario
Source: diagram by author.
The result cannot be determined until the partial scenarios are examined together (Table 5). The overall scenario has a positive effect on the consumption of private households; this is caused by increasing demand (partial scenario 5) and effects resulting from the cyclical flow of income (partial scenario 1 & partial scenario 3). Government consumption can achieve an overall positive result in the second peri-od. The effects are only minor in the partial scenarios; a positive effect only results in the synopsis.
The equipment investments are either directly initiated (partial scenario 1) or are increased based on cyclical flow relationships (partial scenario 5). Overall, the result is positive. In contrast, building investments only achieve noteworthy positive values (by 2018) in partial scenario 2. The changes in inventory are not part of a scenario and they are also not able to achieve a positive change through indirect effects.
There is a noteworthy increase of imports overall. However, partial scenario 4 shows obvious declines due to the low demand of raw and semi-finished products. This can lead to an overall positive change in the trade balance, given that exports indicate consistent positive results with the exception of the first partial scenario.

IAB-Forschungsbericht 8/2015 54
Table 5 Overall scenario 1-5 Effects on the components of the gross domestic product in the partial scenarios and overall
Equipment investments
Building investments
Material and personnel costs Occupational fields Demand Industry 4.0
Partial scenario 1 Partial scenario 2 Partial scenario 3 Partial scenario 4 Partial scenario 5 1 to 5 2016-25 2026-30 2016-25 2026-30 2016-25 2026-30 2016-25 2026-30 2016-25 2026-30 2016-25 2026-30 Gross domestic product + - + O + + O + + + + + Consumption of private households O - O O + + O + + + + + Government consumption O O O O O + O O O O + + Equipment investments + + O O + + O O O + + + Building investments O O + O O O O O O O + O Inventories O O O O O O O O O O O O Trade balance - - - O + + O O O - + + Imports + O + O - - O O + + + + Exports O - O O + + O O + + + +
“O” +/- one bn.; “+” > 1bn.; “-” < 1bn Source: diagram by author.

IAB-Forschungsbericht 8/2015 55
Figure 29 shows the effect on production. As per definition, production consists of the produced intermediate inputs and the generated added value. These in turn can be broken down into employee compensation, depreciations and net operating sur-pluses (profit). Overall, production increases over the years. In 2020, it can increase by approx. € 22 billion – in 2025 and 2030 even by more than € 30 billion. While the demand increases in the beginning and the cost structures change, all effects are simultaneously and consistently active as of 2025.
Figure 29 Overall scenario 1-5 – Primary inputs and intermediate inputs in comparison with the baseline scenario
Source: diagram by author.
Essentially, the added value of the national economy consists of profit, employee compensation and depreciations. Added value also predominantly defines the gross domestic product. In terms of the composition of the additional production, it must be pointed out that the intermediate inputs are in fact higher but do not continue to in-crease after 2025. This is due to the gains in efficiency which, among other things, lead to a more efficient use of raw, semi-finished and finished products.
Furthermore, significant increases in employee compensation can be identified. The reduction of routine jobs and increasing labour productivity in the manufacturing sector favours occupational fields with a higher level of qualification and higher wages. The assumed increase in labour productivity results in wage increases for employees under productivity-oriented wage policy.
Ultimately, depreciations will increase over time: Even after the last investments have been made, depreciations will continue. Given that depreciations for the in-vestment years (vintage years) accumulate, the highest depreciations will accrue after the peak investments, i. e. after 2025, during the second period. At first glance,

IAB-Forschungsbericht 8/2015 56
additional profits appear minor. However, the profit in the past is also less than half of employee wages with regard to the economy as a whole.
Figure 30 Development of the accumulated profit in agriculture and the manufacturing sector in comparison with the baseline scenario
Source: diagram by author.
Profit development in agriculture and the manufacturing sector is examined sepa-rately (Figure 30). When taking the variations from the baseline scenario into ac-count, positive profits are consistently identified from 2016 to 2025; if these are ac-cumulated, an accumulated difference in profit amounting to € 12.5 billion is achieved by 2025. That is more than was previously determined in the calculation for partial scenario 3 (€ 8.3 billion, Chart 2). The losses there do not occur in the overall scenario because consumption growth and later on, increases in export de-mand are added. In the years following 2025, the profits can then be further in-creased: The transition has taken place and the market pull persists.

IAB-Forschungsbericht 8/2015 57
Figure 31 Overall scenario 1-5 – Number of employees by primary occupational fields in compar-ison with the baseline scenario
Source: diagram by author.
A look at the primary occupational fields shows that occupations found in the manu-facturing sector in particular (especially “system and machinery control and mainte-nance professions”), are affected negatively despite the implementation of additional demand (Figure 31). The increase in demand cannot even compensate for the con-sequences of the changed intermediate inputs and the change in the occupational field structure in partial scenario 5. Occupations which benefit most from the scenar-io are in the area of technology and sciences (MOF 14), in the area of business consultancy (MOF 16), teaching professions (MOF 20) and construction trades (MOF 4). The positive effects on the professions in media and the arts (MOF 17) depend on the demand for design and are characterised by the general macroeco-nomic developments.
The level of the 54 occupational fields is examined in the following (Figure 32). For clarity purposes, only the occupational fields with a positive or negative deviation from the baseline scenario of more than 3.5 per cent are selected. The most severe deviations are negative. These occupational fields can normally be attributed to the manufacturing sector. In particular, the professions in chemicals and plastics (MOF 4) are seriously impacted. This is not surprising given that they are greatly affected by the restructuring of the production processes as well as by the rear-rangement of the occupational situation because the routine percentage is very high according to Dengler and Matthes (2015).

IAB-Forschungsbericht 8/2015 58
Figure 32 Overall scenario 1-5 – Number of employees by select*) occupational fields in compar-ison with the baseline scenario in 2030
*) selection criterion: Deviation according to amount > 3.5 per cent. Source: diagram by author.
The change amongst jobs by sectors has continued to increase in the overall sce-nario with the changes in demand (Figure 33). The sectors with declining employ-ment figures will have cut back 200,000 jobs in 2025. The other sectors can create approximately 140,000 new jobs by 2025. A total of nearly 60,000 jobs are lost. The sectors with job losses are in agriculture and the manufacturing sector. An overall additional demand for employees results due to higher consumption by private households, but mainly in service sectors (retail, among others).

IAB-Forschungsbericht 8/2015 59
Figure 33 Overall scenario 1-5 – Number of jobs lost and created by branches in comparison with the baseline scenario
Source: diagram by author. The reallocation amongst the 54 occupational fields is also greater than before (Figure 34). It is also still greater than amongst the branches. A total of approximate-ly 450,000 jobs will be lost by 2025 based on the occupational fields, with 390,000 jobs created elsewhere. In the case of an increasing demand for products, the loss of jobs would be reduced from previously 100,000 (compare section 4.5) to approx-imately 60,000.
Figure 34 Overall scenario 1-5 – Number of jobs lost and created by occupational fields in comparison with the baseline scenario
Source: diagram by author.
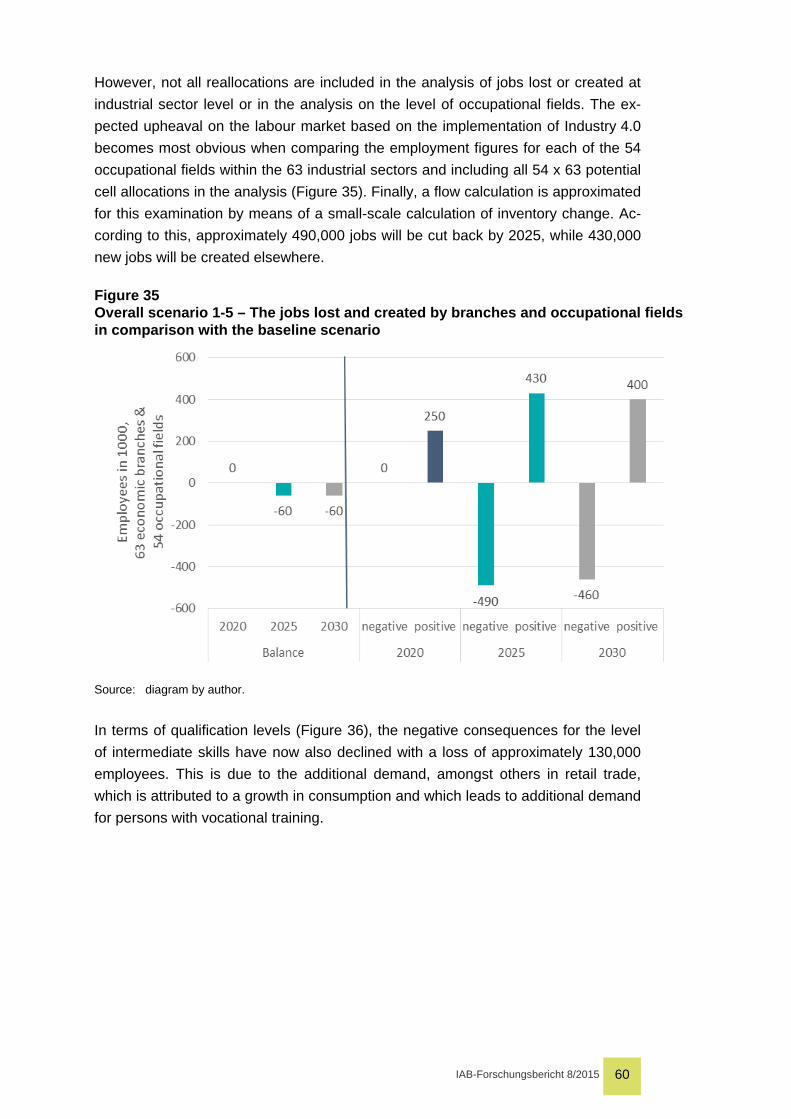
IAB-Forschungsbericht 8/2015 60
However, not all reallocations are included in the analysis of jobs lost or created at industrial sector level or in the analysis on the level of occupational fields. The ex-pected upheaval on the labour market based on the implementation of Industry 4.0 becomes most obvious when comparing the employment figures for each of the 54 occupational fields within the 63 industrial sectors and including all 54 x 63 potential cell allocations in the analysis (Figure 35). Finally, a flow calculation is approximated for this examination by means of a small-scale calculation of inventory change. Ac-cording to this, approximately 490,000 jobs will be cut back by 2025, while 430,000 new jobs will be created elsewhere.
Figure 35 Overall scenario 1-5 – The jobs lost and created by branches and occupational fields in comparison with the baseline scenario
Source: diagram by author.
In terms of qualification levels (Figure 36), the negative consequences for the level of intermediate skills have now also declined with a loss of approximately 130,000 employees. This is due to the additional demand, amongst others in retail trade, which is attributed to a growth in consumption and which leads to additional demand for persons with vocational training.

IAB-Forschungsbericht 8/2015 61
Figure 36 Overall scenario 1-5 – Number of employees by qualification levels in comparison with the baseline scenario
Source: diagram by author.
Results part II
(1) Additional demand can in fact improve the labour market figures overall, how-ever, this will lead to even greater changes in the labour market. Structural change to more services accelerates.
(2) The occupations in the manufacturing sector continue to be those most affected by job cuts.
(3) The additional added value in the manufacturing sector as part of production, however, increases the economic profits as well as wages. The increases in productivity in the manufacturing sector and in agriculture provide for increased wages. The wage gaps between the manufacturing sector and the service sec-tor increase.
5 Conclusions The overall effects of the Industry 4.0 scenario on the demand for labour are rela-tively moderate: From 2000 to 2010, hourly productivity of labour increased by ap-proximately 15 per cent, i. e. by approximately 1.5 per cent annually. The derived assumptions pertaining to the increases in productivity (1.2 per cent in partial sce-nario 3) are based on these assumptions. Furthermore, partial scenario 4 implies that labour productivity increases by an additional 0.9 per cent. Both labour produc-tivity increases enhance the productivity path already included in the baseline sce-nario. Jobs with routine tasks in the manufacturing sector, which are lost due to the increases in productivity, are accompanied by a growth in occupations with non-
IAB-Forschungsbericht 8/2015 62
routine tasks, which on average require a higher level of qualification. When assum-ing that a new demand for products is generated through the implementation of In-dustry 4.0 (partial scenarios 1 to 4), more than 490,000 jobs which previously exist-ed will be lost by 2025, however, 430,000 new jobs will also be created. A shift to-wards a service-based economy is improved by the transition to Industry 4.0. Fur-thermore, there are also consequences for other existing jobs: Extensive initiatives for continuing education have already been taken into account in the scenario. Therefore, the transition to Industry 4.0 is associated with adjustments for persons remaining in their jobs. There will be new work flows and tasks and others will be eliminated.
Due to the demographic change shown in the model processes, a tendency towards shortages in the segment of intermediate level skills result in the QuBe baseline scenario. The considerably increasing supply in the area of academic skills is not entirely included according to the anticipated trends formalised in the model. The Industry 4.0 scenario counteracts this change in labour supply because the demand for personnel in the upper segment – in particular for MINT professions (German acronym for jobs in mathematics, informatics, sciences and engineering) – increas-es and declines in the intermediate segment. However, underemployment for per-sons without vocational training will increase even more.
An implementation of Industry 4.0 is also profitable without the modelled “additional” demand for new products. Stronger economic growth is achieved; at the same time however, imports decline. Given that Germany is a country lacking natural re-sources, a large part of the imports can be directly or indirectly (semi-finished prod-ucts) attributed to the supply of raw materials. An increase in average wages can be noted; this is caused by increasing labour productivity and including the routine per-centages of the occupational fields.
The results of the previous studies indicate that digitisation requires complete im-plementation. Although digitisation yields positive results in agriculture and the man-ufacturing sector in the opinion of the companies involved, the whole economy falls short of its full potential. The demographic trend depicted in the model still assumes a net annual migration gain of approximately 200,000 persons. Therefore, in view of the current net migration, the indicated development trajectory remains below the overall economic growth, which is stunted in the model by the comparatively small labour force. The growth path can in fact be increased by the assumed changes in labour productivity with virtually unchanged employment figures however, it could be even higher under the assumptions made if the productivity advances in the service sector are also increased.
However, the scenario calculations and the assumptions clearly show: Ultimately, there is no other way – if Germany is not capable of implementing Industry 4.0, oth-er countries will still do so. And, the assumptions, which have a positive effect on Germany in the aforementioned scenario (pioneer, additional demand from abroad,

IAB-Forschungsbericht 8/2015 63
competitive advantages) are then directed against a business location here. De-clines in production and additional unemployment will result. This is caused by los-ing the competitive position and domestic demand shifting to imported products. Therefore, the task can only be to organise the transition in the most effective way possible.
In principle, higher increases in productivity than those modelled are also conceiva-ble. Likewise, the costs considered for digitisation can also be higher. Here, twice the amount was assumed, however, studies (as already defined) even assume four times the costs. The assumed changes in occupational structures in the sectors lead to significant shifts between occupational fields. All three factors can at least signifi-cantly increase the effect of the transition between new and old jobs. To date, the positive employment trend in Germany is taking place at a slow rate in economy and the labour market (Klinger/Weber 2015). Therefore, a more intense growth in in-vestments and productivity could invigorate the basis of this trend.
In light of this, the assumptions and modelling made must be critically reviewed. Should new findings regarding the transition to Industry 4.0 arise, the scenarios would need to be adapted or even upgraded accordingly. Therefore, the scenario presented can only represent a first step in illustrating the impacts Industry 4.0 has on the labour market and the economy. At the moment, there is no answer to much the implementation of Industry 4.0 in other regions (USA, EU, BRICS10) will impact Germany as an industrial location. Furthermore, information must be obtained on to which extent trade-specific structural changes regarding occupations or even com-pany organisations actually take place and whether or not potential demand for new occupations arises.
In order to comply with these and other requirements, additional data sets will have to be evaluated and for instance, in the future results from additional company sur-veys will have to be included in creating the scenario. Ultimately, it makes sense to analyse a digitisation of the overall economy. Precise links or recommendations for government or corporate actions could be derived from this.
References Author, David H.; Levy, Frank; Murnane, Richard J. (2013): The Skill Content of Re-cent Technological Change: An Empirical Exploration. In: The Quarterly Journal of Economics, page 118(4).
Berger, Roland (2014): INDUSTRY 4.0 The new industrial revolution. How Europe will succeed.
BITKOM (2014): Industrie 4.0 – Volkswirtschaftliches Potenzial für Deutschland. Study.
10 BRICS is the acronym for the five countries: Brazil, Russia, India, China and South Africa.

IAB-Forschungsbericht 8/2015 64
BMAS (2015): Arbeiten weiter denken. Green Paper. Arbeiten 4.0. Federal Ministry of Labour and Social Affairs.
BMBF (2014): Zukunftsbild Industrie 4.0. Hightech-Strategie. Federal Ministry of Education and Research.
Bonin, Holger; Gregory, Terry; Zieran, Ulrich (2015): Transfer of the study from Frey/Osborne (2013) to Germany. Expert synopsis on behalf of the Federal Ministry of Labour and Social Affairs.
Bowles, Jeremy (2014): The computerisation of European jobs-who will win and who will lose from the impact of new technology onto old areas of employment?, Brus-sels: Bruegel.
Brzeski, Carsten; Burk, Inga (2015): Die Roboter kommen. Folgen der Automatisie-rung für den deutschen Arbeitsmarkt. INGDiBa Economic Research.
DBR (2014): Industrie 4.0 – Upgrade des Industriestandorts Deutschland steht be-vor. Current topics. Deutsche Bank Research. February 2014.
Dengler, Katharina; Matthes, Britta (2015, forthcoming): Substituierbarkeit von Beru-fen durch Computerisierung in Deutschland (IAB research report), mimeo.
DIE WELT (2014): Deutschland droht die Zukunft zu verschlafen. 12/9/2014. URL: www.welt.de/135151615.
Die ZEIT (2014): In der Zukunftsfabrik. 01/23/2014.
Distelkamp, Martin; Hohmann, Frank; Lutz, Christian; Meyer, Bernd ; Wolter, Marc I. (2003): The IAB/INFORGE model: Ein neuer ökonometrischer Ansatz gesamtwirt-schaftlicher und länderspezifischer Szenarien. In: Beiträge zur Arbeitsmarkt- und Berufsforschung (BeitrAB), volume 275, Nuremberg.
Drosdowski, Thomas; Wolter, Marc Ingo together with Helmrich, Robert; Maier, Tobias (2010): Entwicklung der Erwerbspersonen nach Berufen und Qualifikationen bis 2025: Modellrechnung mit dem BIBB-DEMOS-Modell. In: Helmrich, R.; Zika, G. (2010): Beruf und Qualifikation in der Zukunft, Bonn.
Emec, Soner; Stock, Tim; Bilge, Pinar; Tufinkgi, Philippe; Kaden, Cornelia; Seliger, Günther (2013): Analyse von Potenzialen der Material- und Energieeffizienz in aus-gewählten Branchen der Metall verarbeitenden Industrie. Berlin.
Forschungsunion & acatech (2013): Deutschlands Zukunft als Produktionsstandort sichern: Umsetzungsempfehlungen für das Zukunftsprojekt Industrie 4.0. Final re-port of the Industry 4.0 study group Sponsored by the Federal Ministry of Education and Research.
Frey, Carl Benedikt; Osborne, Michael A. (2013): The Future of Employment: How Susceptible are Jobs to Computerization?, University of Oxford.
Heng, Stefan (2014): Industrie 4.0 - Upgrade des Industriestandortes Deutschland steht bevor. Deutsche Bank Research.
Helmrich, Robert; Zika, Gerd [ed.] (2010): Beruf und Qualifikation in der Zukunft, BIBB-IAB-Modellrechnungen zu den Entwicklungen in den Berufsfeldern und Quali-fikationen bis 2025, publication series from the Federal Institute for Vocational Edu-cation and Training, Bonn.

IAB-Forschungsbericht 8/2015 65
Helmrich, Robert; Zika, Gerd; Wolter, Marc Ingo; Schandock, Manuel; Maier, Tobi-as; Kalinowski, Michael; Hummel, Markus; Hänisch, Carsten; Drosdowski, Thomas; Bremser, Felix; Bott, Peter (2012): Shortages on the labour market: Changes in ed-ucation and employment behaviour will mitigate shortages of skilled workers. BIBB-Report 18/12, Bonn.
Hummel, Markus; Thein, Angela; Zika, Gerd (2010): Der Arbeitskräftebedarf nach Wirtschaftszweigen, Berufen und Qualifikationen bis 2025, IAB model calculations. In: R. Helmrich & G. Zika (ed.), Beruf und Qualifikation in der Zukunft. BIBB-IAB-Modellrechnungen zu den Entwicklungen in den Berufsfeldern und Qualifikationen bis 2025, (reports on vocational training), Bielefeld. Bertelsmann, pages 81–102.
Kalinowski, Michael; Quinke, Hermann (2010): Projektion des Arbeitskräfteangebots bis 2025 nach Qualifikationsstufen und Berufsfeldern. In: Helmrich, R.; Zika, G. (2010): Beruf und Qualifikation in der Zukunft, Bonn.
Klinger, Sabine; Weber, Enzo (2015): GDP-Employment decoupling and the produc-tivity puzzle in Germany. University of Regensburg working papers in business, economics and management information systems, 485.
Maier, Tobias; Zika, Gerd; Wolter, Marc Ingo; Kalinowski, Michael; Helmrich, Robert (2014a): Shortages in the medium qualifications area despite increased immigration. Latest results from BIBB and Institute for Employment Research (IAB) qualifications and occupational field projections up until the year 2030 taking wage developments and occupational flexibility into account. In: BIBB-Report 23/14, Bonn.
Maier, Tobias; Zika, Gerd; Mönnig, Anke; Wolter, Marc Ingo; Kalinowski, Michael; Hänisch, Carsten, Helmrich, Robert; Schandock, Manuel; Neuber-Pohl, Caroline; Bott, Peter; Hummel, Markus (2014b): Wages and occupational flexibilities as de-terminants of the interactive QuBe labour market model. A methodological report on the basic projection of the 3 wave of the BIBB-IAB qualifications and occupational field projections. Wissenschaftliche Diskussionspapiere BIBB issue 149.
Mantau, Udo; Döring, Przemko; Hiller, Dirk (2013): Holzeinsatz im Bauwesen – Verwendungsstrukturen nach Gebäuden und Gewerken. In: Weimar, H. & Jochem, D. (ed.): Holzverwendung im Bauwesen – Eine Marktstudie im Rahmen der „Charta für Holz“. Thünen Report 9.
PWC (2014): Industrie 4.0 – Chancen und Herausforderungen der vierten industriel-len Revolution. Study. October 2014.
Reflex Verlag (2015): Industrie 4.0 Die vierte industrielle Revolution. Insert in the Handelsblatt March 2015.
Schnur, Peter ; Zika, Gerd (ed.) (2009): The IAB/INFORGE model. Ein sektorales makroökonometrisches Projektions- und Simulationsmodell zur Vorausschätzung des längerfristigen Arbeitskräftebedarfs. IAB library 318, Nuremberg.
Spath, Dieter (ed.); Ganschar, Oliver; Gerlach, Stefan; Hämmerle, Moritz; Krause, Tobias; Schlund, Sebastian (2013): Produktionsarbeit der Zukunft – Industrie 4.0. Fraunhofer Institute for Industrial Engineering (IAO).
Tiemann, Michael; Schade, Hans-Joachim; Helmrich, Robert; Hall, Anja; Braun, Uta; Bott, Peter (2008): Berufsfeld-Definitionen des BIBB auf Basis der KldB1992. Fe-deral Institute for Vocational Education and Training.
TÜVRheinland (2013): Szenarien und Kosten für eine kosteneffiziente flächende-ckende Versorgung der bislang noch nicht mit mindestens 50 Mbit/s versorgten Re-gionen. Study on behalf of the Federal Ministry of Economics and Technology. Abstract.

IAB-Forschungsbericht 8/2015 66
VDE (2013) VDE study: Industrie 4.0 lässt vorerst auf sich warten. Asscociation for Electrical, Electronic and Information Technologies. Press release 32/2013 dated April 8, 2013.
www.plattform-i40.de.
Zika, Gerd; Helmrich, Robert; Kalinowski, Michael; Wolter, Marc Ingo; Hummel, Markus; Maier, Tobias; Hänisch, Carsten; Drosdowski, Thomas (2012): In der Ar-beitszeit steckt noch eine Menge Potenzial. Qualifikations- und Berufsfeldprojektio-nen bis 2030. In: IAB Kurzbericht 18/2012, pages 1–12.
Zika, Gerd; Maier, Tobias (ed.) (2015): Qualifikation und Beruf in Deutschlands Re-gionen bis 2030. Konzepte, Methoden und Ergebnisse der BIBB-IAB-Projektionen. IAB library 353, Institute for Employment Research (IAB), Nuremberg.

IAB-Forschungsbericht 8/2015 67
Recently published
No. Author(s) Title Date 12/2014 Brussig, M.
Stegmann, T. Zink, L.
Aktivierung von älteren ALG-II-Beziehenden mit mehrfachen Vermittlungshemmnissen: Der Einfluss lokaler Umsetzungsstrategien
11/14
13/2014 Kropp, P. Danek, S. Purz, S. Dietrich, I. Fritzsche, B.
Die vorzeitige Lösung von Ausbildungsverträ-gen: Eine Beschreibung vorzeitiger Lösungen in Sachsen-Anhalt und eine Auswertung von Bestandsdaten der IHK Halle-Dessau
11/14
14/2014 Bechmann, S. Dahms, V. Tschersich, N. Frei, M. Leber, U. Schwengler, B.
Betriebliche Qualifikationsanforderungen und Probleme bei der Besetzung von Fachkräfte-stellen: Auswertungen aus dem IAB-Betriebs-panel 2013
11/14
15/2014 Grgic, M. Matthes, B. Stüber, H.
Die Fachkräftereserve in der Kinderbetreuung und -erziehung: Ergebnisse für Deutschland und die Bundesländer
12/14
1/2015 Schwengler, B. Eigenhüller, L. Bellmann, L.
Fachkräftebedarf und betriebliche Aus- und Weiterbildung in der Metropolregion Nürnberg: Auswertungen aus dem IAB-Betriebspanel 2013
2/15
2/2015 Hohmeyer, K. Wolff, J.
Selektivität von Ein-Euro-Job-Ankündigungen 3/15
3/2015 Daumann, V. Dietz, M. Knapp, B. Strien, K.
Early Intervention - Modellprojekt zur frühzeiti-gen Arbeitsmarktintegration von Asylbewerbe-rinnen und Asylbewerbern: Ergebnisse der qualitativen Begleitforschung
4/15
4/2015 Bernhard, S. Grüttner, M.
Der Gründungszuschuss nach der Reform: Eine qualitative Implementationsstudie zur Umsetzung der Reform in den Agenturen
4/15
5/2015 Evers, K. Schleinkofer, M.
Der Gründungszuschuss vor und nach der Reform: Same same, but different: Ein Ver-gleich der Teilnehmerstrukturen
5/15
6/2015 Fertig, M. Quantitative Wirkungsanalysen zur Berliner Joboffensive Endbericht zum 5. Mai 2015 vorgelegt von ISG Institut für Sozialforschung und Gesellschaftspolitik GmbH, Köln
8/15
7/2015 Diener, K. Götz, S. Schreyer, F. Stephan, G. Lenhart, J. Nisic, N. Stöhr, J.
Rückkehr ins Berufsleben nach familienbe-dingter Unterbrechung: Befunde der Evaluati-on der zweiten Förderperiode des ESF-Programms „Perspektive Wiedereinstieg“ des Bundesministeriums für Familie, Senioren, Frauen und Jugend
9/15
As per: 2015-10-14
For a full list, consult the IAB website http://www.iab.de/de/publikationen/forschungsbericht.aspx

Imprint
IAB-Forschungsbericht 8/201516 December 2015
Editorial addressInstitute for Employment Research of the Federal Employment AgencyRegensburger Str. 104D-90478 Nuremberg
Editorial staffRegina Stoll, Jutta Palm-Nowak
Technical completionGertrud Steele
All rights reservedReproduction and distribution in any form, also in parts, requires the permission of IAB Nuremberg
Websitehttp://www.iab.de
Download of this Forschungsberichthttp://doku.iab.de/forschungsbericht/2015/fb0815_en.pdf
ISSN 2195-2655 For further inquiries contact the authors:
Enzo WeberPhone +49.911.179 7643E-mail [email protected]
Gerd ZikaPhone +49.911.179 3072E-mail [email protected]