I M -lilu.-
92
I M - lilu.- AD-768 049 USER'S MANUAL FOR ILSLOC: SIMULATION FOR rK DEROGATION EFFECTS ON THE LOCALIZER PORTION OF THE INSTRUMENT LANDING SYSTEM G. Chino et al Transportation Systems Center Cambridge, Massachusetts August 1973 DISTRIBUTED BY: Natmml Technial Illfiuu Servic U. &. DEPARTMENT OF CMMNERCE 5285 Port Royal Road, Springfield Va. -- "151
Transcript of I M -lilu.-
I M - lilu.-
AD-768 049
USER'S MANUAL FOR ILSLOC: SIMULATION FORrK DEROGATION EFFECTS ON THE LOCALIZER
PORTION OF THE INSTRUMENT LANDING SYSTEM
G. Chino et al
Transportation Systems CenterCambridge, Massachusetts
August 1973
DISTRIBUTED BY:
Natmml Technial Illfiuu ServicU. &. DEPARTMENT OF CMMNERCE5285 Port Royal Road, Springfield Va. --"151

BestAvai~lable
Copy

rP- - -- ~-.~--- -
TECHNICAL REPORT STAN(rARO TITLE PAW~
1. Report No. 2. Government Accession No. 3 eciplent's Catalog No. 1
;7 4 T-19 ad $ #oil S.Repott Do#*'~"~"" USER'S MANUAL FOR ILSLOC: uut,17
SIMULATION FOR DEROGATION EFFECTS ON THE Auut P97
LOCALIZER PORTION OF THE INSTRUMENT LANDING .*fomn enzo Cd
L. Jordan, D. Kahn, S. Morin, D.PorminTSC-FAA-73-epor1 NoID. Newsom, A. Watson T-SFA731
9. Poritirming OgnztoNmendA rss10. Work Unit No.
Department of Transportation R3117/FA3071.Contract Grant No.
Kendall SquareCambirl~ MA 4?13. Typo of Report and Perrod Covered
12. Sponsoring Agenicy Name and Address
Department of Transportation Operational HandbookFederal Aviation Administration_____________Systems Research and Development Service 14. Sponsoring Agency Cod*
IWashington, D.C. 20591____________1S. Supplempentary Notes
Ab~tpcThgis manual presents the complete ILSLOC computer programIpackge.In addition to including a thorough description of the
program itself and a commented listing, the manual contains abrief description of the ILS system and antenna patterns. ToIillustrate the program a test case was created and the figuresof the case are incorporated in the report. Program DYNM andprogram ILSPLT are included as Appendices. The 'LSPLT, completewith sample graphs, is a plotting routine for ILSLOC.
For a technical mathematical analysis of the system, theIFAA report "Instrument Landing System Scattering" No. FAA-RD-72-137 should be consulted. -
Reproduced by
NATIONAL TECHNICALiNFORMATION SERVICE
U~ r S eprtat of CommerceSp~glId VA 22151
17. Key Words 18. Distuibutlon Statement
DOCUMENT IS AVAILABLE TO THE PUBLICIS, DeoaioC THROUGH THE NATIONAL TECHNICAL
ILS erogtionCDIINFORMATION SERVICE. S.ARINGFIELO.Locali zer VIRGINIA 22151. V
-419. Security cloself. (of this reperI) 20. Security Cossif. (of this pege) 21. Me. of Pages 22. Price
Unclassified Unclassified
Fen. DOT F 1700.7 isst
II

PPEFACE
As part of the ILS Performance Prediction program (PPA No.
FA307), a first phase ILS Localizer performance prediction computer
program package has been prepared. This package consists of the
computer program and the present document which describes the
capabilities and limitations of the computer model as well as
7- the step by step running of the computer program.*
2 The computer program is intended as an aid in predicting the
performance of different ILS Localizer antenna candidates for a
proposed runway instrumentation or for the upgrading of an already
instrumented runway. It is also intended to provide a relatively
inexpensive means by which the effect of any proposed changes to
an airport environment (addition of terminal buildings, hangars,
etc.) on ILS performance may be predicted.
This document was prepared for TSC by D. Newsom assigned
full time as a programmer to the ILS Performance Prediction
program and by A. Watson who helped in its writing. The document
and attached computer program are based on the theories and
analyses developed by the TSC group (Chin, Jordan, Kahn and Morin)
for the ILS program sponsored by H. Butts of the Systems Research
and Development Service of the FAA.
i-iA
af
CONTENTS
Section Page
1. DEFINITION OF INSTRUMENT LANDING SYSTEM ........ 1
2. ANTENNA PATTERNS ............................... 3
3. ILS SIMULATION DESCRIPTION ..................... 6
4. TEST CASE FOR THE ILSLOC COMPUTER PROGRAM ...... 8
APPENDIX A MAIN PROGRAM LISTING INCLUDING COMMENTSEXPLAINING TIlE PROGRAM ..................... 26
APPENDIX B DYNAMIC SIMULATION PROGRAM DYNM LISTING.... 64
APPENDIX C ILSPLT PLOTTING ROUTINE .................... 67
Preceding page blankv
4

RE
LIST OF ILLUSTRATIONS
Figure Page
1 ANTENNA PATTERNS SKETCH ....................... 4
2 SIMULATION AIRPORT ........................... 9
3 PATTERN CARD TEST CASE LISTING ................ 14
4 ILLUSTRATION OF ORIENTATION NOMENCLATURE FORRECTANGULAR SURFACE ........................... 20
5 FLIGHT CASE INPUTS ............................ 2S
vi

1. DEFITION OF INSTRUMENT LANDINA SYSTEM
The ILSLOC program has been written to simulate certain air-
port conditions which affect the localizer portion of the Instrument
Landing Sjstem. The ILS is used to provide signals for the safe
nsvigation of landing aircraft during periods of low cloud coverand other conditions of restricted visual range. Separate systemsare used to communicate vertical and horizontal information; the
horizontal system is called the "localizer".
This system operates by the transmission of an RF carrier,amplitude modulated by two audio frequencies, beamed to approachingairborne receivers. In an instrumented aircraft, the localizer
receiver serves to demodulate the RF signal, amplify and isolate
the correspording audio signals and derive a signal to drive theILS horizontal display in the cockpit. The pilot, by reading the
display, can determine if he is on course, to the left of the
runway, or the right of the runway. These signals must be strong
enough to cover a radius of twenty-five miles around the antenna.
The directional information is determined by the relative
strengths of the transmitted sideband signals. The audio frequency
modulations, which are fixed at 90 H and 150 Hz, are radiatedin different angular patterns with respect to the runway centerline
extended. The 'course" is defined as the locus of points where the
amplitudes of the two modulations are equal. The display of adifference of the amplitudes (90 11z and 150 Hz) of the sidebandsis referred to as the Course Deviation Indication. Thus, the
CDI is the pilot's indication as to what his bearing is relativeto the center line of the runway. The CDI is measured in microamps.
The actual course generated by any particular ILS installation will
deviate from the ideal due to the interference of spurious re-
flections from buildings present in the range of the transmitting
antenna. The deviation, caused by these buildings, or scattererq
of the CDI from what the receiver should read ideally at that
point in space (e.g., on the center of the runway and CDI reading
other than 0) is the derogation effect.
1
The Localizer system transmits an asymmetrical pattern by
beaming a "carrier plus sideband" pattern and a "sideband only"pattern, the composite of which gives the desired effect. If a
specific localizer system uses two antenna arrays, four sets ofsignals will be transmitted; if the system uses a single antenna
array, two sets will be transmitted.
2

= 12I
26 ANTEflNA PATTERNS j
The proper angular variation of the transmitted 90 Hz and
the 150 11z modulation is achieved by the radiation of two independent
sideband patterns by the transmitting antenna arrays. Equal
magnitudes of 90 Hz and 150 1lz modulation are transmitted in each
of these patterns, however with different relative phases. One
of the patterns is symmetrical with respect to the prescribed t
course. An unmodulated carrier wave is transmitted with the same
pattern and the combination is commonly referred to as the "car-
rier plus sidebands" (C + S) signal. The other signal is trans-
mitted in an "anti-symmetrical" pattern and is referred to as the
"sidebands-only" signal.
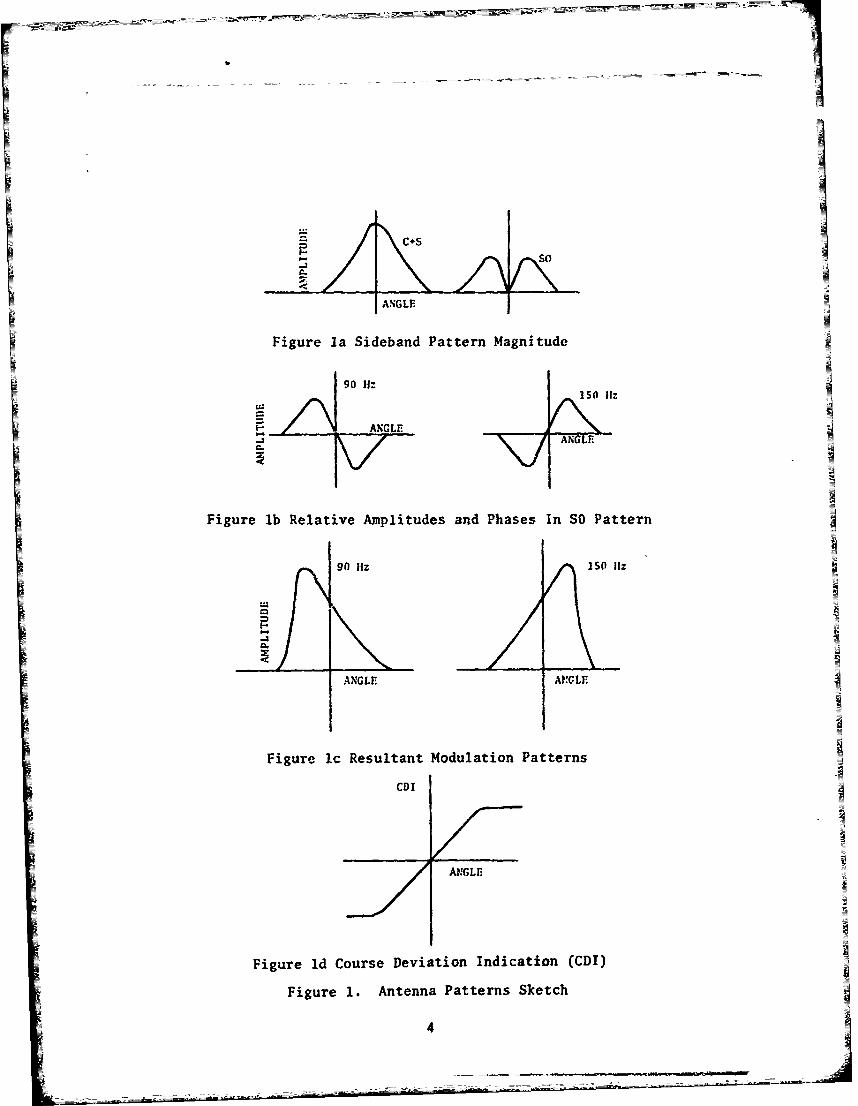
Figure 1 illustrates how these features are used to obtain
the desired directional CDI. The magnitudes of the C + S and SO
sideband patterns as functions of angu ir deviation from the
course are illustrated in Figures la. T;ie sideband amplitude of
the C + S pattern represents 20% modulation of the carrier wave -
(or a "depth of modulation" of 0.2) at both 90 Hz and 150 Hz.
Considering the phases of both modulations of the C + S signal to
be positive, the relative phases and typical amplitudes of the two i
SO modulations are as shown in Figures lb. The resultant 90 Hz
and 150 Hz modulation patterns in the total ILS signal are obtained
by algebraically combining the respective C + S and SO sideband
patterns (Figures lc). The evident consequence is that the depth
of modulation is greater for 90Hz than for 150 Hz to the left
of the course as seen from an approaching aircraft, and the ov-
posite is true to the right of the course. This difference when
properly calibrated in relation to the total modulation (90 Hz
+ 150 Hz) reaching the aircraft receiver gives the CDI as appears
in Figure Id.
Since the strength of C + S and SO signals fall off at the
same rate with distance from the transmitting antenna, the CDI
is independent of range. i
3I
II
ANGLE.
Figure la Sideband Pattern Magnitude
90 II:150 11,
ANGLEANGLE
Iv
Figure lb Relative Amplitudes and Phases In SO Pattern
90 11z ISO 1iz
ANGLE AtTLE
Figure lc Resultant Modulation Patterns
CDI
ANGLE
Figure id Course Deviation Indication (CDI)
Figure 1. Antenna Patterns Sketch
4
FAA standards for the ILS specify that within a certain nar-
row angular range about the course, the CDI shoulo be close'y
proporticnal to the aircraft's angular deviation from course. This
sector near the ideal approach is termed the "course sector" and
usually extends between 1 1/20 and 30 to either side of the runway
centerline. The wider sectors on either side of the course sector
are called the "clearance sectors". In these sectors, which extend
a minimum of 350 from the course, the CDI is required to always
exceed a certain minimum magnitude. The presence of structures
in the clearance sectors which scatter spurious signals into the
course sector is the primary cause of derogation of the localizer
CDI. Such structures are illuminated by carrier and sideband
signals. The ratios of 150 Hz modulation to 90 Hz modulation in
these signals are determined by the angular position of the
structure with respect to the runway. In general these ratios are
different from those transmitted toward the aircraft, due to the
difference in angular position. The signals transmitted toward
the scatterer will be reflected toward the aircraft. Thus the
aircraft will receive the summations of the direct and scattered
signals. Since, in general, the scattered signals will have im-
proper ratios their effect is to distort the CDI. To combat this
problem several new antenna systems have been designed. Two basic
systems are used: the single antenna, and the "capture effect
system."
The single antenna system radiates two patterns from one
antenna array. The signal generated in the course sector is
stronger than that generated in the cl-arance sector. However,
because of the derogation effects, the signals are often not ac-
curate enough to meet category II or III requirements and the
more accurate "capture effect system" is used. This system uses
one antenna array to broadcast a very narrow, powerful beam in
the course sector. The second antenna array broadcasts a broader
pattern, at a slightly different carrier frequency, which covers
the clearance area. This system diminishes the derogation effects
because of the dual frequency. The term "capture effect" has
been used to describe this two antenna array system because the
airplane receiver is "captured" by the stronger transmission signal.
S
3. ILS SIMULATION DESCRIPTION
The ILS simulation program makes it possible for airport
planners to determine what the effects of potential airport
buildings on the ILS performance are going to be. Thus, for
example, if a new terminal or hotel is planned, the informationas to size and location of the building can be input to the programand the derogati.on effect of that building can be determined.Because the derogation effect of these scatterers is so important,
the program can warn the planner ahead of time to change theorientation or location of the building, or it can assure him
that the building would not jeopardize the airport's current
FAA rating.
The output of this program is a magnetic tape of values of
the CDI. Graphs are generated by a plotting routine (using the
values derived from the ILSLOC program) to show the CDI in micro-
amperes, along a flight path, for the scattering surfaces input.
These generated graphs would serve the same purpose as the FAA
strip charts which are generated for a certifying flight. The
simulation graph differs from the actual recorded measurements
due to limitations of the program which will be explained later
in the text.
The ILSLOC program simulates: transmission from the various
types of localizer antenna systems; the trajectory of an aircraft
flight ever which the CDI is to be determined; and the scattering
from rectangular and cylindrical surfaces. The program permits
various simulated flight paths.
The program is not an exact simulation of the certifying
flight, due to certain simplifying assumptions which were made.
These assumptions include:
a. A flat perfectly conducting ground plane
b. Perfectly conducting reflectors
6
c. Far field scattering -ali scattering from a surface
is assumed independent of all other surfaces, thusmultiple reflections from walls and near field
interactions are ignored.
d. A noise free environment
e. Relative field strenpths - the absolute field strengthsinvolved are not calculated. Thus while we can calculatethe CDI's in microamperes we do not ascertain the
absolute electric field intensities.
f. An idealized ILS receiver model.
In addition to these assur3tions the approximations of thescatterer can lose accuracy when the dimensions approach lessthan a few wavelengths. Since the program determines the scat-tering from a surface independently from all other scatterers, theshadowing of one structure on another is not included. Thus ifone building is between the antenna system and another building,it will shield the second one from some or all of the ILS signal.The amount of energy reaching the second building will depend upondiffraction effects which are, in general, too complicated toanalyze. It may be noted, however, that diffraction effects
themselves are included as part of the physical optics approxima-tion used (Ref. 1). By using rule of thumb approximations theanalyst can determine roughly how much power will reach the
second building. If the level is small the building may beignored completely. If on the other hand the power level islarge then the structure should probably be included as thoughthere was no shielding effect. This will give a conservativeCDI estimate (i.e. larger derogation than actual), but thiswill serve for most purposes. If the situation is critical,that is near category limits, then other means of analysis must
be used.
Ref. 1 "Instrument Landing Systems Scattering" ReportNo. FAA-RD-72-137 (1972)

IVI
4, TEST CASE FOR THE ILSLOC COMPUTER PROGRAMA
To illustrate how the cemputer program is operated a very
simple test case (with only 2 scatterers) has been created and
run. For this simulated airport the program computed the course
width as 4.01 degrees. Both anterna arrays were set at an eleva-
tion of 13 feet above the ground plane. The clearance antenna
arra% was used as the origin for the coordinate system. An A
80'xlOO'x60' hangar and 75'x110' cylinder were placed on opposite
sides of the 9,350 ft. runway. In this case the threshold is
10,000 ft. from the course antenna. (See illustration - Figure 2).
Based on the size and location, of these two buildings, the model
predicted the CDI on the runwa) centerline and for a clearance
run at 10,000 ft. range.
Using this model for input values, the following section V
presents a detailed follow through of the main program steps.
The Mode Card
The first input is the mode card. This card contains informa-
tion on the type of localizer antenna used, the frequency of thiILS, the length of the runway, and the height of the antenna.
The card format is:
Col. Symbol U
1-2 Mode = 1 (V-RING)= 2 (8-LOOP)= 3 (WAVEGUIDE)= 4 (VACANT)= S (MEASURED PATTERN) indicates= 6 (MEASURED CAPTURE antenna
EFFECT PATTERNS) type= 7 (THEORETICAL PATTERN)= 8 (THEORETICAL CAPTURE
EFFECT PATTERNS)=-1 (V-RING CLEARANCE)=-2 (8-LOOP CLEARANCE)=-3 (WAVEGUIDE CLEARANCE)=-4 (MEASURED CLEARANCE
PATTERNS)
11-20 FRQ Frequency of ILS in Mega Hz
8

V
e-7-
L 4
4
obt'tb I I4-I 4.o
cn
A ' '-.
In order to effectively use the rest of the mode card
columns it is important that the user understand the coordinate
system used.
The x-axis is along the center line of the runway, the
threshold being in the positive direction. The z-axis is vertical,
positive z being in the up direction. The y-axis completes a
right handed coordinate system: so that when one is standing
at the origin facing in the x-direction positive y is to the
left. The origin is used as a reference to define the location
of scatterers, antenna system components, and flight path sample
points. The antennae are located along the x-axis, they need not
be at the origin; as in our test case, it is usually convenient
to place the course antenna at the origin.
Col. Symbol Usage
21-30 XTH Distance from the origin tothe threshold of the runway,in feet. This number is usedfor both flight path orientationand for course width determination.The distance is given in feet.
31-40 ZA(l) There is always a non-zeroantenna height, and it is
- input here.
41-50 ZA(2) This will be the clearanceantenna height if a two antennasystem is used.
Modes 1, 2, and 3 provide for standard localizer antenna
array types. These antenna arrays are predetermined, the only
variable being course width, the adjustment of which is controlled
by the course width card.
When any array type other than mode 1, 2, or 3 is used, ad-
ditional antenna array description cards must be included. Mode 5
permits the input of a measured pattern for special cases on
theoretical studies. When this mode is selected additional
pattern cards are required. One pattern card must be used for
each measurement. The angles must be given in ascending order.
A maximum of fifty measurements may be given; if less than fifty
cards are used a termination card with an angle greater than 360
degrees must be inserted.10

Format of Pattern Card(s)
Col. Symbol Usage1-10 ANG Angle of measurement, in degrees
11-20 AFPP Amplitude of sideband only pattern,in relative units
21-30 AGPF Amplitude of carrier plus sideband
pattern, in relative units
Mode 7 allows the generation of a theoretical array pattern
from assumed element contributions. The antenna is to be a linear
array of elements with identical radiation patterns. Each element
has an arbitrary magnitude and phase for both carrier plus sideband
and sideband only currents. The arrays are assumed to be aligned
parallel to the y-axis. All elements have the same height, as
given in the mode card. All elements have the same x-coordinate as
given on the course width card. The y-coordinate, in wavelengths,
is given foi" each element on the element description card. There
must be one card for each element in the array, to a maximum of
26 elements. The format for the element description card is:
Col. Symbol Usage
1-10 DT Element displacement in they-direction given in wavelengths
11-20 CT Carrier plus sideband amplitude,in relative units
21-30 PC Carrier plus sideband phase, indegrees
31-40 ST Sideband only relative amplitude
41-50 PS Sideband only phase, in degrees
The phase of the sideband only currnts is ideally in quadrature
to the ::rier pi65 $he sideband currents. Thiz 9u degree shift
is added by the program. Thus a "PS" inputted as zero degrees is
internally converted to 90 degrees out of phase with the sideband
portion of the carrier plus sideband. To indicate terminationwhen there are less than 26 elements used, an element card is
placed with a carrier plus sideband phase value (PC) of more than
500.

The next step for this mode must be the input of the horizontal
radiation pattern for the individual element. This pattern will be
used for each of the elements previously described. The input is
the relative signal strength measured every 100 starting at 0 and
proceeding until 1800. This is a total of nineteen amplitudes;
the values are read in, in records of 8F10.4 format, for a total
of 3 recerd3. This gives the pattern for angles from, 00 to 1800
and since the pattern is assumed to be symmetric the value for the
negative angle will be the same s a positive one of equal
magnitude.
There are two methods of inputting capture effect system
descriptions. The most general way is to input each antenna array
separately. When using this method the clearance array must be
input first. This input will follow the same steps as a single
array system except that the mode number will be a negative. The
negative mode card and the pattern or element cards (if any) must
be followed by another mode card. This mode for the course array
must be positive, and followed by the necessary pattern or element
cards.
There are two cases for the second method of inputting antenna
array descriptions. The first case is used if both course and
clearance antenna array are to be given as measured patterns; a
single mode 6 card is used followed by two sets of pattern cards:
the first set is for the course antenna array: and the second
set for the clearance antenna array. The mode 6 is converted in-
ternally to a mode 5 for each array and these values will appear
in the output listing. In the second case, for a capture effect
system which uses two theoretical arrays, a mode 8 is used. This
card is followed by the course antenna element description cards
and the element radiatioi. cards; a second! set of array description
cards is used in the clearance antenna. As in the mode 6 case,
the mode 8 is converted internally to two mode 7's. These mode
7's will appear in the output listing.
12

In our test case:
Mode Card:
Col. 1-2 6
11-20 110.
E 21-30 100000.
F31-40 13.
41-50 13.
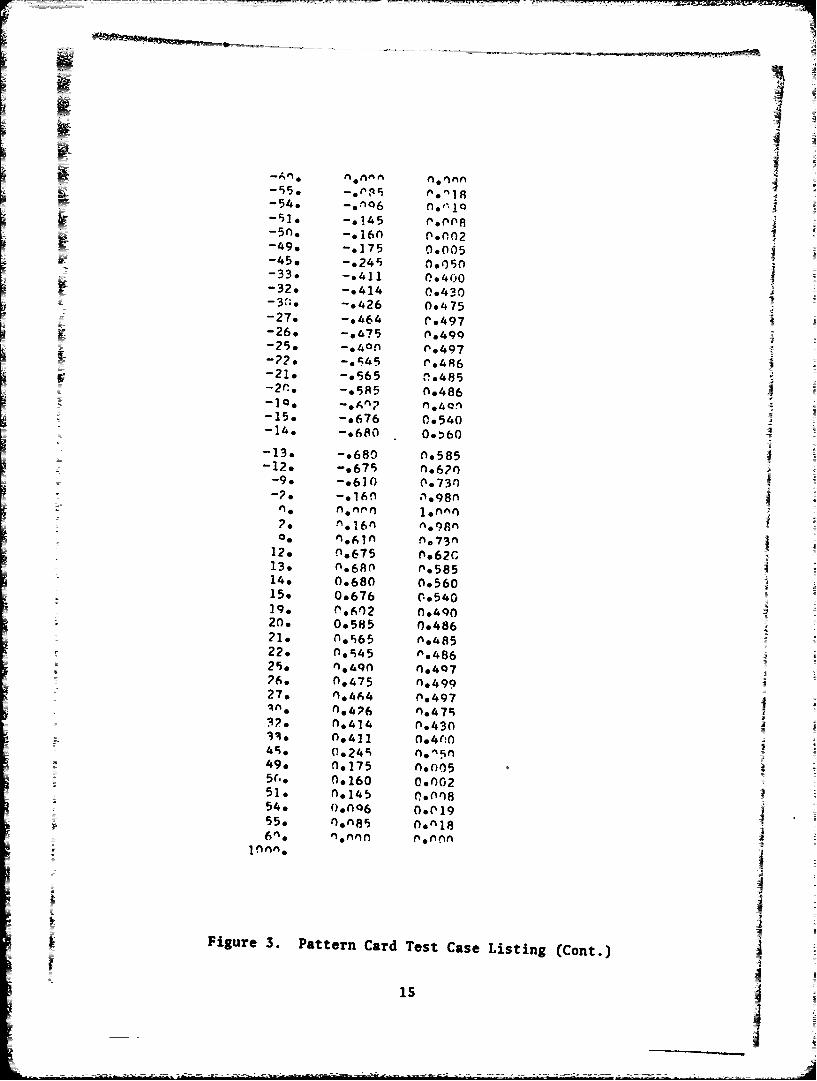
Pattern Cards: see attached Figure 3 for test case listing.
The antenna description cards are followed by the course A
width card. The format for this card is:
Col. Symbol Usage
1-10 XXA(l) Course array x-coordinate,in feet
11-20 XXA(2) Clearance array x-coordinate,in feet
31-40 CW Course width in degrees
41-50 CLS Clearance signal strengthrelative to the course signal
If CW is greater than 30 this value is used as the course
width and the signal strengths of the course antenna are auto-
matically adjusted to produce this value.
If CW is less than 3* the course width will be set to the
FAA specification for a threshold to antenna distance, given by
XTH, and the signal levels will be set accordingly.
CLS is the ratio of clearance signal strength to course
signal strength.
The test case course width card -ould read:
1-10 0.
11-20 -200.
31-40 0.0
41-50 .315
13i -
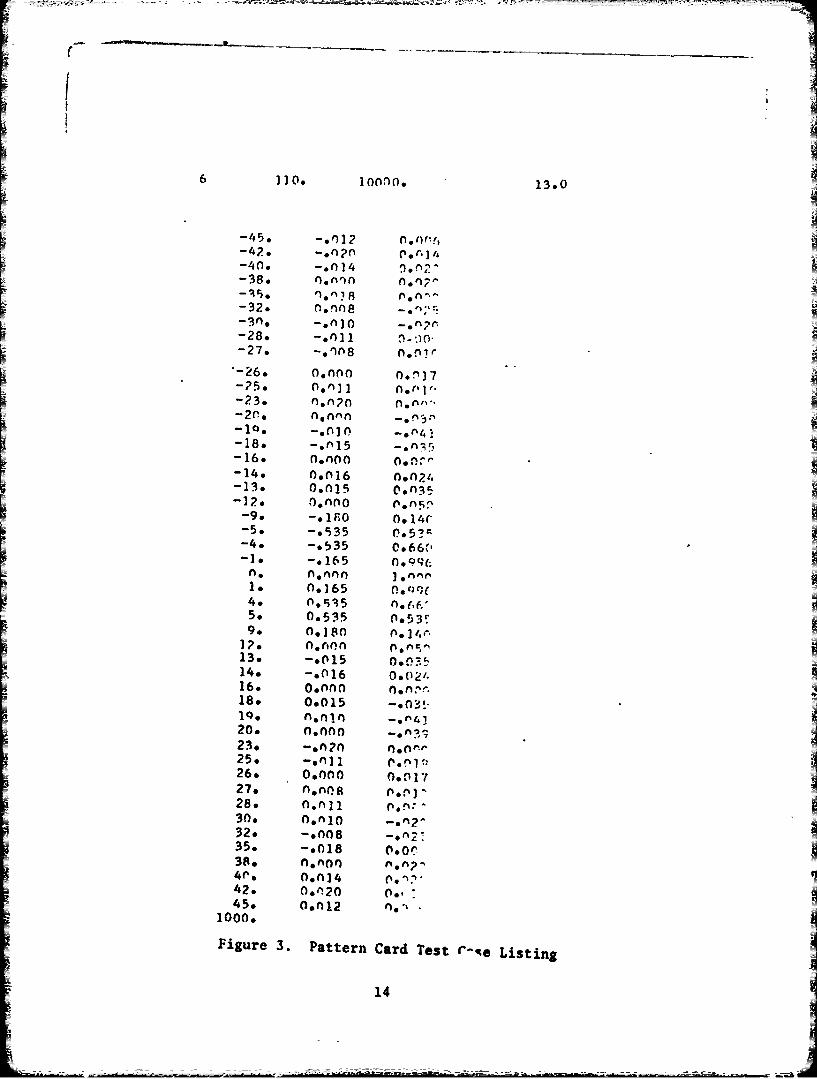
6 110. 100n0. 13.0
45o o.0 12-42. 92-40. -. 014 1-38. o n, n
-32. O~nne-3n, -. n10-28.0 .127. -.oon002
-26. 0.000 0"1
-23. non?0V - 20.o 0.or~o
-18o -. 15-16o n0.0n00-14. 0.016 001-13. 0.015 O.035
F-12. 0Olno-90 -10 0.O14r-5o -. 535 0.*5?-4o -. 535 0*66f-
1. -. 165 n0. 9q(-
16.6 0.a0ell18. 0.9155o. 0.053 -. f'4]
13o -.001 0 .,~25. -. 011 60~
28. 0.011
3. 0.010 .nn
32. -. n0835o -. 018 0038o 0.000
42. 0.0120 0.45. 0.012 n,
1000.
Figure 3. Pattern Card Test r-%e Listing
14
-49* o175 0*005
-45o -*(4.0080
-33. -. 411 0.400
-27. -. 464 ('.497-26. -o475 ()*499-25o -o40nl ('497
-2o -*545 Po486-21o -. 565 n.485
-2r, -05R5 0.486
-150 -o676 0. 540
-13. ('.680 N.585
29. "'.490 0047
2. (164n .9
1?o .4680 0.43010 0*676 0.40
49 .175 O.00521. 0.1,60 0.482
54. n,545~ f0985. fl4n5oQ6. n.475 N49
10%11 0..49), *24c n,,- rr
4iur o3 Patter CadTetCaeLitng0on55r., 9160 o~nG
is

1
The label card follows the course width card. This card isput on the output tape ahead of the CDI records for this flight.It serves as an identifying record and is the label placed on thegraph. Columns 1-80 are used. In our test case this card reads:THIS IS A DEMONSTRATION CASE OF STRAIGHT LINE FLIGHT.
The program calculates the CDI at a point in space: for
convenience, the program will permit calculation for a seriesof points. This set of points represents samples of a simulated
flight path.
The program allows two types of flight paths. A straight
line flight and a circular orbit. The flight path card has oneof the following formats: I
Straight Line Flight
Col. Symbol Usage
1-10 XMIN Starting distance from origin,in feetA
11-20 DIAX Ending distance from origin, in
21-30 DXR Spacing between sample points,in feet
31-40 PHIR Angle of approach, in degrees
41-50 PSIR Glide angle, in degrees
61-70 ZUP Height of aircraft at threshold,in feet
XMIN is the x-coordinate of the starting location of the
aircraft and XMAX is the x-coordinate of the ending location.The sample points are spaced along a straight line so that thedifference in x-coordinates between successive samples is DXR.The sign of the DXR will be set by the program so that theflight goes from XMIN to XMAX regardless of flight direction.If the DXR value would require more than S00 points the programwill adjust the magnitude of DXR to give only 500 points. In
some cases a flight will require more than 500 points. If thisis necessary the flight must be broken up into smaller segments
16

or e t di°p ce s h t a xt n i n o h p t r s e hof not more than 500 points each. The procedure for doing this
is explained in the control card section. The flight path is~~oriented in space so that an extension of the path crosses the
threshold at the altitude of ZUP and intersects the z-axis. PHIR
is the angle between the flight path and the vertical plane through
the runway centerline. It is zero for a flight path along the
centerline of the runway and is positive for an incoming flight
(XMIN greater than XMAX) with decreasing y-displacement. PSIR
is the glide angle between the flight path and the horizontal
plane. It is zero for level flight and positive for a normal
landing approach. The flight path is a straight line as de-
scribed above except when the x-component is less than XTH, that
is if the aircraft is on the antenna side of the threshold. In
that case the aircraft altitude will be set up to ZUP.
Thus the values used in the test case would read:
Col. 1-10 40000.
11-20 20000.
21-30 -40..-40 0.
41-50 2.5
51-60 50.
The arc flight is a series of points at a constant height
of ZUP and at a constant horizontal distance from origin of R.
MIND is the starting angle for the arc, that is, the line of
sight from the origin to the point makes a horizontal angle of
MIND degree with the x-axis. The sample points are spaced at
equal angles of DXR until the termination angle of MIND is
reached. As in the straight line flight the sign of DXR will
be adjusted appropriately. Likewise the magnitude of DXR will
be set to yield not more than 500 points. Column 74 must be
set to 1 to indicate a circular arc.
Circular Orbit Case
Col. Symbol Usage
1-10 MIND Starting angle, in degrees
11-20 MAXD Ending angle, in degrees
17
_______JAN

Col. Symbol Usage
21-30 DXR Angular spacing between samples,in degrees
51-60 R Radius of orbit, in feet
61-70 ZUP Height of orbit, in feet
74 ICF Must be set to 1 to indicateorbit case
Following the flight path card must be the velocity card
in the following format:Col. Symbol Usage
1-10 VEL Velocity of aircraft, in feet/sec.This is used for the Doppler Effecton the receiver. The sign of thevelocity will be made to agree withthe directional motion from DXR.Test case assumes velocity of200 ft./sec.
At this point we have described the antenna system and the
trajectory of the aircraft; the derogating surfaces in proximity
to the ILS must now be described. The program will simulate
scattering from rectangular or cylindrical surfaces. We will now
describe the method of inputting scatterers to simulate derogating
structures.
The next card describes either the scatterer(s) or output and
control. The usage is determined by the value of the ID field
in columns 1 to 2. An ID of -1, 1 or 2 is used for scatterers,
while the other values are used for control.
An ID of I is used for a rectangular scatterer and has the
fo1l-: ng format:
Col. Symbol Usage
1-2 ID Must be 1 for rectangle
3-8 XW(l) X-coordinate of reference point,in feet
9-14 XW(2) Y-coordinate
18
A./

. -_ - .. ..
Col. Symbol Usage
1 IS-20 XW(30 Z-coordinate
26-30 ALPHA Angle between base and x-axis, indegrees
31-5 DELTA Angle of tilt, in degrees
36-45 WW Width of rectangle, in feet
C 46-55 HW Height along rectangle, in feet
The scatterer is a rectangle with the reference point at theI middle of the base. The rectangle is assumed to be of infinite
conductivity and zero thickness. It also has only one side. This
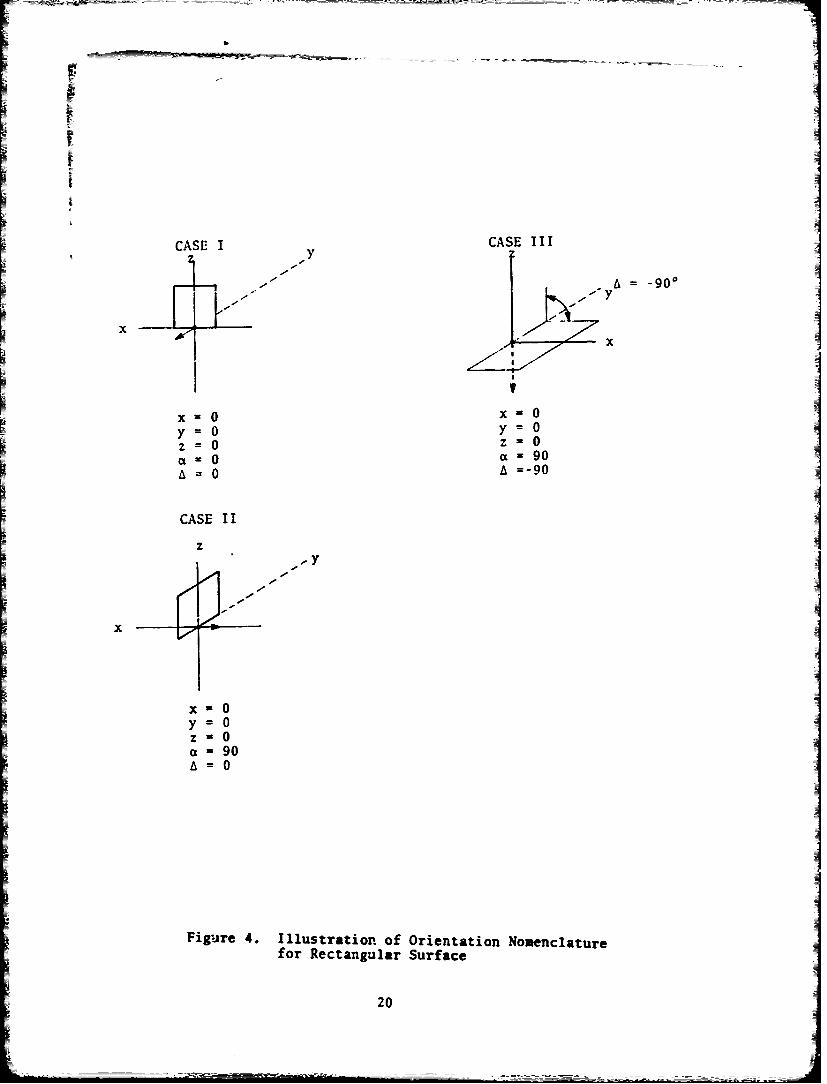
can be thought of as the front surface of a metal wall. A wallwith zero x-, y-, and z coordinates and an alpha of zero is located
at the origin with surface of the wall facing in the negative y
direction (Figure 4, case I). A positive increase in alpha rotates
the wall about the z-axis in a counterclockwise direction when
viewed from above. Thus an alpha of ninety degrees faces the wall
in the positive x direction (Figure 4, case II). Alpha is theangle between the vertical projection of the base of the wall in
the xy-plane and the x-axis, measured in degrees. Delta is the
angle between the surface of the wall and the vertical direction,
in degrees. A delta of zero is a wall perpendicular to the ground
and a decrease in delta rotates the wall about the baseline in a
direction so that a delta of minus ninety is a horizontal wallfacing down (Figure 4, case III). WW is the width, in feet, of
the wall measured along its base and HW is the height measured
along the surface at right angles to the base. If the wall is
oriented in such a fashion that the line of sight from the antenna
to the wall passes through the back and not the front of the wall,
=the program will ignore the wall in the simulation.
An ID of -1 is used with the above format to describe a
negative wall. This ID is used, for example, to create a wallwith a rectangular hole in it. The entire surface is used; the
hole is then subtracted by inputting a second card with an ID of-I and the size, location, and orientation of the hole.
19
CASE I CASE II I-y
- A =-900I -- y
x
x= 0 x- 0y O y= 0Z 0 z 0a G a =90A 0 A =-90
CASE II
z
--- y
x
x= 0y= 0Z~ 0
ci 90A 0
Figure 4. Illustration of Orientation Nomenclaturefor Rectangular Surface
20

An ID of 2 is used for a cylindrical scatterer with the
following format:
Col. Symbol Usage
1-2 ID Must be a 2
3-8 XW(l) x-
9-14 XW(2) y- coordinates of thereference point, in feet
15-20 XW(3) Z-j
36-45 WW Diameter of cylinder, in feet
46-55 HW Height of cylinder, in feet
The reference point is located at the base of the cylinder on
the axis of rotation of the cylinder. The diameter is *W feet, with
the base parallel to the xy plane at an altitude of XW(3) feet. The
cylinder extends upward for HN feet with the axis of rotation in the
vertical direction. The cylinder is assumed to have infinite
conductivity.
After an ID of -1, 1 or 2, the program will calculate the
electric field at the surface of the scatterer. This will be
calculated from the signal from the transmission antenna array
and from the ground reflection of the transmitted signal. Then,
for each receiver point along the flight path, the program will
calculate the electric field at that location from the scattered
signal: from both the scatterer and reflected from the ground.
Thus, the signal is received from four paths: transaission
antenna to scatterer to receiver; antenna to ground to scatterer
to receiver; antenna to scatterer to ground to receiver; and
antenna to ground to scatterer to ground to receiver. This
signal is decomposed into complex components induced in the
receiving antenna at the different carrier and sideband fre-
quencies. The program then :oops back to read in another ID
card, permitting the summation of the effects of many scatterers.
This allows the simulation of complex structures by breaking
them up into cylinders and rectangles.
21
__ _- , '-' ----- __ ---- --- _ -. . . .
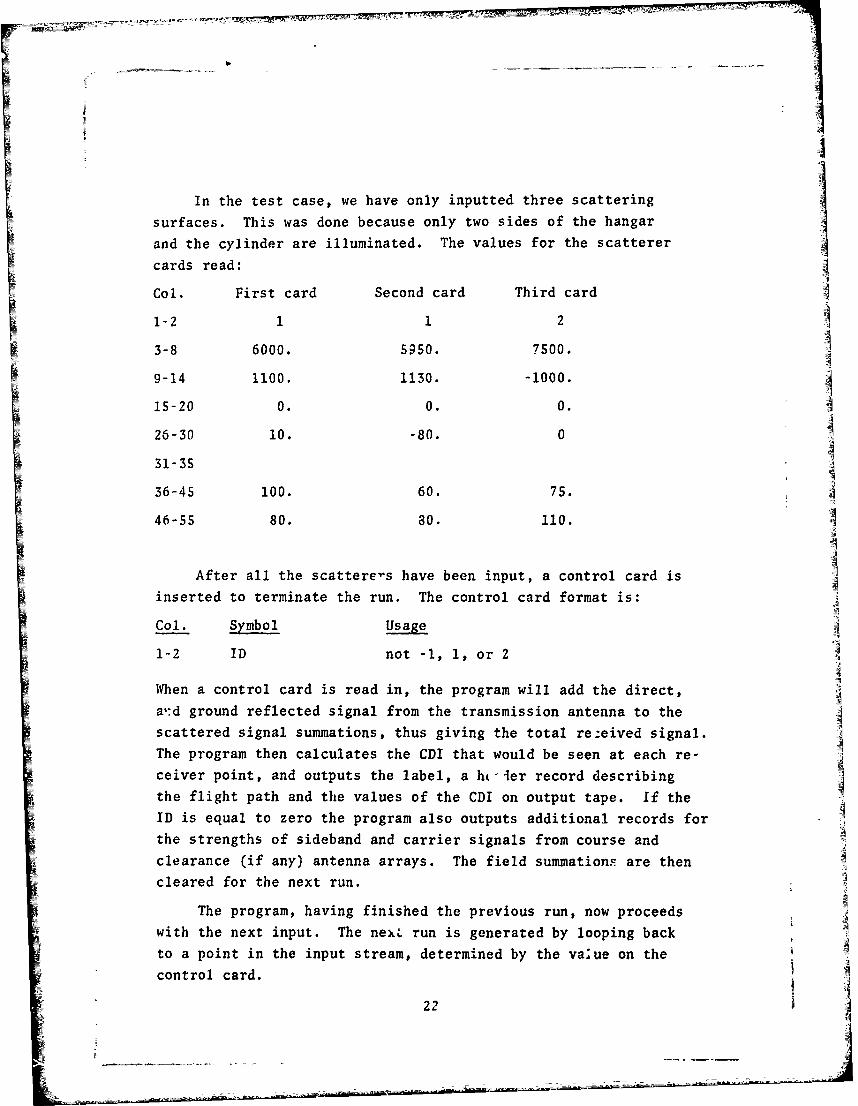
In the test case, we have only inputted three scattering
surfaces. This was done because only two sides of the hangar
and the cylinder are illuminated. The values for the scatterer
cards read:
Col. First card Second card Third card
1-2 1 1 2
3-8 6000. 5950. 7500.
9-14 1100. 1130. -1000.
15-20 0. 0. 0.
26-30 10. -80. 0
31-35
36-45 100. 60. 75.
46-55 80. 80. 110.
A
After all the scattere's have been input, a control card is
inserted to terminate the run. The control card format is:
Col. Symbol Usage
1-2 ID not -1, 1, or 2
When a control card is read in, the program will add the direct,
a:d ground reflected signal from the transmission antenna to the
scattered signal summations, thus giving the total rezeived signal.
The program then calculates the CDI that would be seen at each re-
ceiver point, and outputs the label, a ht-ier record describing
the flight path and the values of the CDI on output tape. If the
ID is equal to zero the program also outputs additional records for
the strengths of sideband and carrier signals from course and
clearance (if any) antenna arrays. The field summations are then
cleared for the next run.
The program, having finished the previous run, now proceeds
with the next input. The next run is generated by looping back
to a point in the input stream, determined by the vaue on the
control card.
22 j
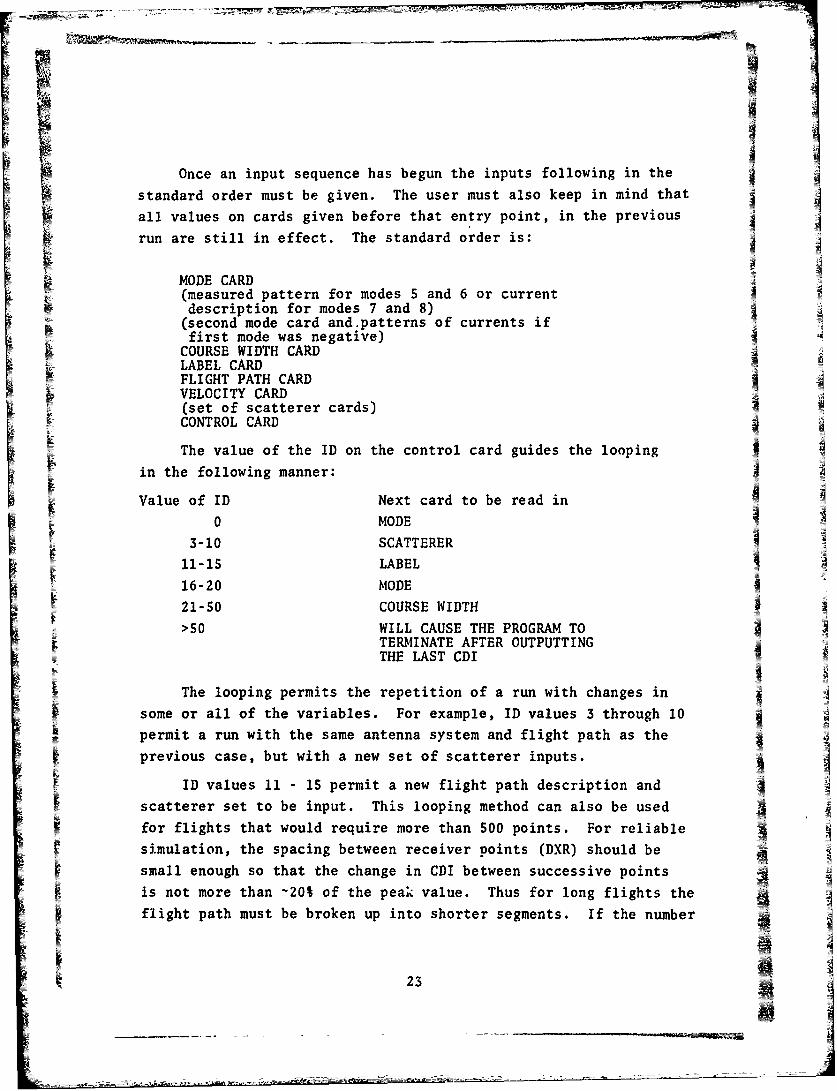
Once an input sequence has begun the inputs following in the
standard order must be given. The user must also keep in mind that
all values on cards given before that entry point, in the previous
run are still in effect. The standard order is:
MODE CARD(measured pattern for modes 5 and 6 or currentdescription for modes 7 and 8)(second mode card and.patterns of currents iffirst mode was negative)COURSE WIDTH CARDLABEL CARDFLIGHT PATH CARDVELOCITY CARD
V(set of scatterer cards)CONTROL CARD
The value of the ID on the control card guides the looping
in the following manner:
Value of ID Next card to be read in
0 MODE
3-10 SCATTERER
11-15 LABEL
16-20 MODE
21-50 COURSE WIDTHF >50 WILL CAUSE THE PROGRAM TO
TERMINATE AFTER OUTPUTTINGTHE LAST CDI
The looping permits the repetition of a run with changes in
some or all of the variables. For example, ID values 3 through 10
permit a run with the same antenna system and flight path as the
previous case, but with a new set of scatterer inputs.
ID values 11 - 15 permit a new flight path description and
scatterer set to be input. This looping method can also be used
for flights that would require more than 500 points. For reliable
simulation, the spacing between receiver points (DXR) should be
small enough so that the change in CDI between successive points
is not more than -20% of the peak value. Thus for long flights the
flight path must be broken up into shorter segments. If the number
23

of segments of this path does not exceed 4, the plotting program will
connect them on a single graph. The control for this joining is the
ID number. If the flight path finishes with an ID of 11 - 13, the
graph of the next flight will continue the line of the graph. A
long flight may be broken up into as many as four segments: with
three segments terminating in 11 - 13 and a fourth, and final seg-
ment, terminating in 14 or 15. The flight segments must appear in
the order in which they are to be flown, so that the XMIN of onesection is the XMAX of the previous section. For each segment
the programmer must re-input the same scatterers. If only one
segment is to be plotted the control card should read 14 or 15.
ID's 16 through 20 start inputting at the mode card, thusllowing a completely new run.
An ID of 21 through 50 uses the same antenna description, but
starts the inputting at the course width card. This permits the
course width, clearance strength and antenna location to be
varied.
The program is terminated after an ID greater than 50 is en-
countered. The direct signal will be added, and the CDI will be
outputted before the program stops. The program will also stop
if an end-of-file is encountered while the program is attempting
to read any input card, or if certain of the variables are of im-
proper value. In these cases the program terminates immediately,
without outputting the last case.
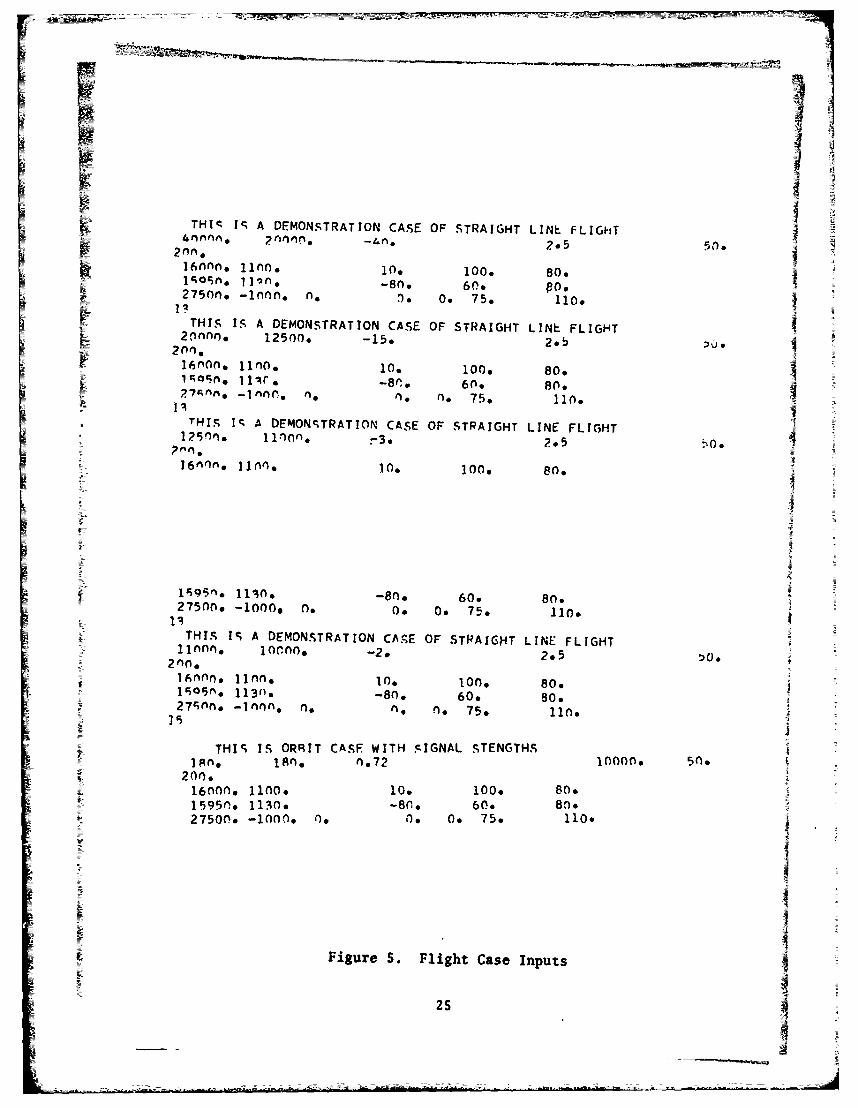
The input of the test case flight path was done in four
segments. The first segment is from 40,000' to 20,000', the
second segment is from 20,000' to 12,500', the third segment is
from 12,500? to 11,000' and the last is from 11,000' to 10,000'.
An additional case for a simulated clearance flight by a circular
orbit has also been included. The input cards for these test
case flights are shown in Figure 5.
24
THIq IS A DEMONSTRATION CASE OF STRAIGHT LINE FLIGHT4n~n 2nnn(% -'"'. 2.5 5 1).a
2nn,16nnn, l*n, I. 100, 800
275nn -lnnn, no Is 0, 75. 110.
THIS IS A DEMONSTRATION CASE OF STRAIGHT LINE FLIGHT2onnno 12500. -15. 2.5 u,
l . -8r. 60. 80.
1251)no 11non,-3. o7fin16nnn, 11n0 10. 100. 80.
y 19 5n*. 110. -80, 609 80.27500. -1000. o . 0. 0. 75o 110.
THIS I A DEMONSTRATION CASE OF STPAIGHT LINE FLIGHT0lnn, 1on0. -2, 2.5 o.~2nn,
2 0 0 .mi , o , 015l t~1 113n, -8n, 60. S0.27S nn -lnnn. n. n, 0. 75. i10.
THIS I5 ORRIT CASF WITH SIGNAL STENGTHSI Ano lno. n.72 100009 5n,
20n.16no, I100. 10. 100. 80.1595n, 1130. -80, 60. 80.27500. -1000, 0. 0. 0. 75. 110.
Figure S. Flight Case Inputs
2SS

APPENDIX A
MAIN PROGRAM LISTING
INCLUDING COMMENTS EXPLAINING
THE PROGRAM
26
@4
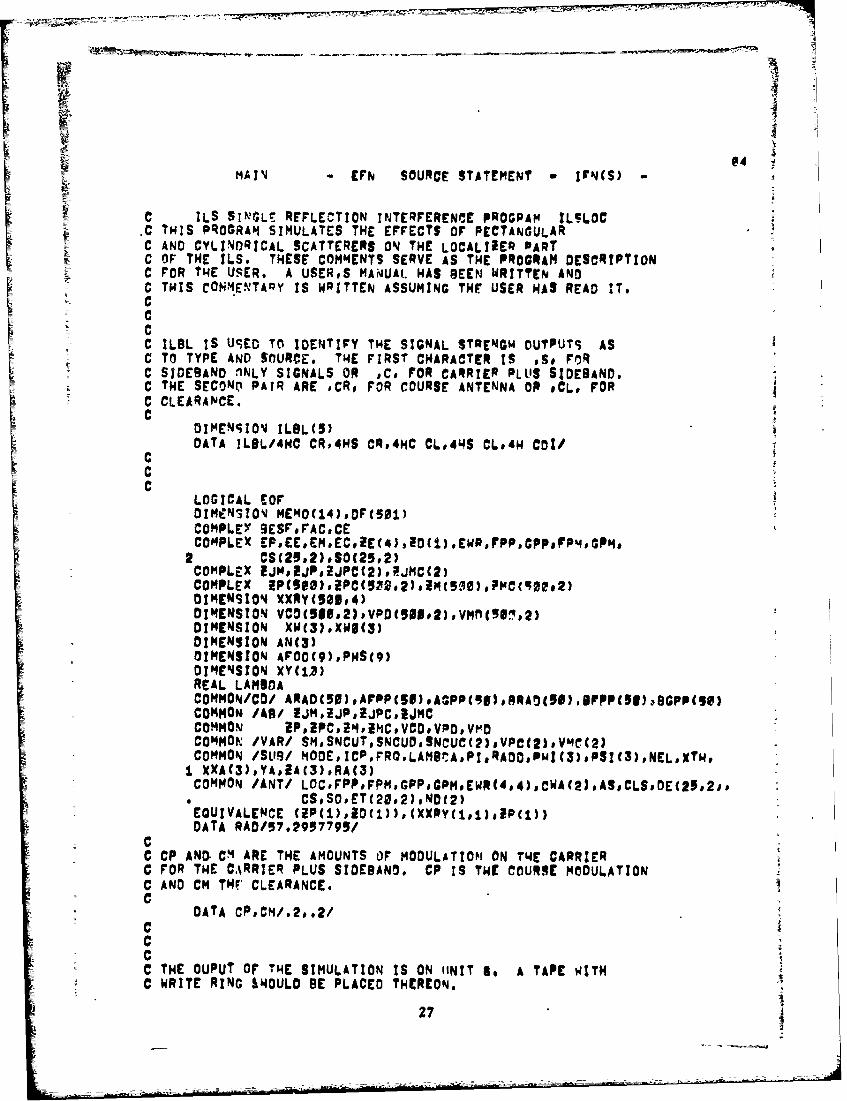
MAI4 -EFN SOURCE STATEMENT IrNCS -
C ILS SIfkGLE REFLECTION INTERFERENCE PROGPAM ILSLOCt C THIS5 PROGRAM SIMULATES THE EFFECTS OF PECTANCULAR
C AND CYLINDRICAL SCATTERERS ON THE LOCALIIER PARTC OF THE ILS. THESE COMMENTS SERVE AS THE PROGRAM DESCRIPTIONc FOR THE USER. A USERPS MAN'UAL. HAS BEEN WRITTEN ANDC THIS COMETARY IS WPITTEN ASSUMING THE USER HAS READ IT,K C
C ILBL IS USED TO IDENTIFY THE SIGNAL STRENOM OUT'PUT% ASC TO TYPE AND SOURCE. THE FIRST CHARACTER 1S .So FORC SIDEBAND flNLY SIGNALS OR DCs FOR CARRIER PLUS SIDEBAND.C THE SECOND PAIR ARE .CRs FOR COURSE ANTENNA OR #CL# FORC CLEARANCE.C
DIMENSION ILBL(5)DATA ILBL/4H0 CR,4HS CRv4HC CLi4I4S CL#4H COJI
CCC
LOGICAL COF
COMPLEX EP,EEEM.EC.IE(4)91D(),EWRP,'PP,GP.P'FP4GPMs2 CSC29#2)#SO(25*2)COMPLEX IJM#EJP#IJPC(2)ofJMC(2)COMPLEXDIMENSION XXRY(SOI#4)DIMENSION VCO(593.2),VPDCSE,*2),VMO(5S'.2)DIMENSION XW(3),XWI(3)DIMENSION AN(3)DIMENSION AFOOC9).P145C9)DIMENSION XYC12)
= REAL LAM9DACOMMON/CO ARAD(50)DAFPPC5I)*AGoPPCSI),BRAOSB)B'PP(5U)aBGPP(5S)COMMON /As/ EJiJlPliJPCoiJmCCOMMON lP#?PC.aMImc#VaD.VPn$VmOCOMMON~ /VAR/ SM.SNCUT.SNCUO.SNCUC(2),VPC(2),VMC(2)COMMON /SLIR/ MODE.ICP,FRO.LANBICA,PI.RADD.PwI(3)ePS!C3),NELKT4.I XXAC3),YA#EA(3)#RA(3)COMMON /ANT/ LOC.FPP.FPMGPPeGPMeEWR(4e4) .CWA(2) .ASCLS.DEC2S,2,.
CS#SO,ETC2092)#N02)EQUIVALENCE (lPCI)slD(12,)(XXRYCIDI)sfPC±))DATA RAO/57.2957799/
CC CR AND CM ARE THE AMOUNTS OF MODULATION ON THE CARRIERC FOR THE C,%RRIER PLUS SIDEBAND. CR IS THE COURSE MODULATIONC AND CM THF' CLEARANCE.C
DATA CPPCM/.2#o2/CCCC THE OUPUT OF THE SIMULATION IS ON tINIT S. A TAPE WITHC WRITE RING &IOULO BE PLACED THEREON.
27
24- EFN SOURCE STATEMINT j Ft -
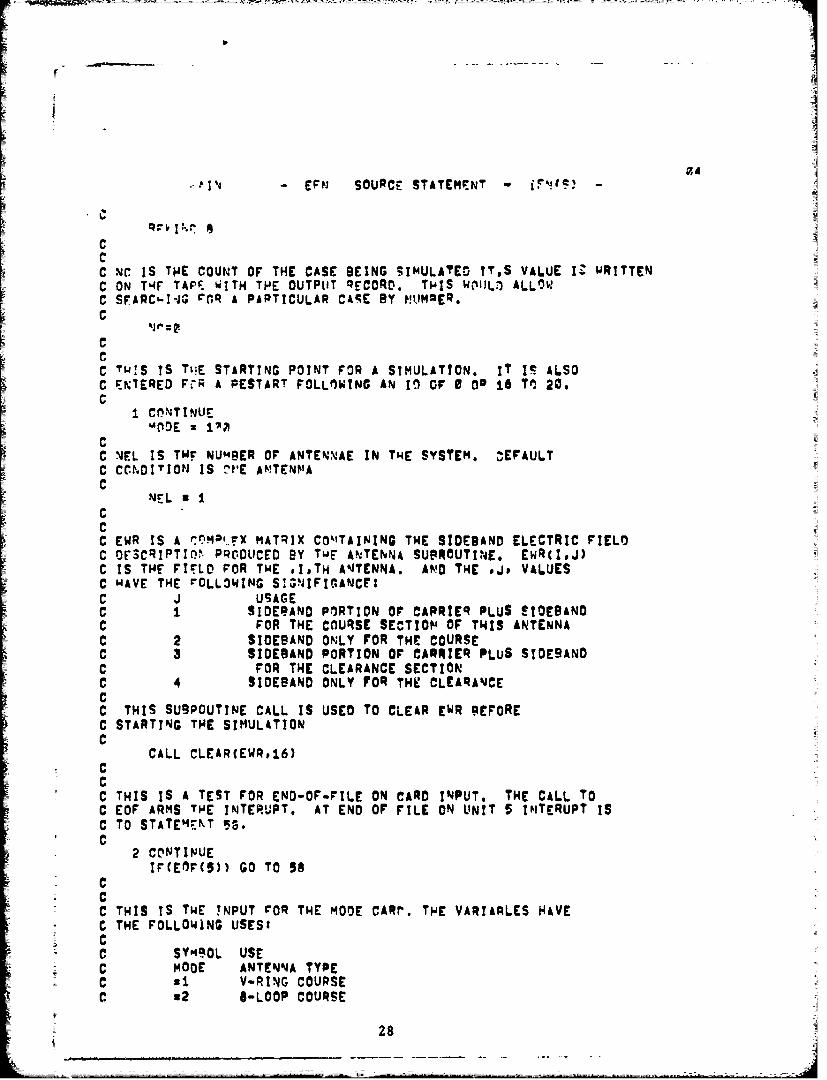
C
C .l IS THE COUNT OF THE CASE BEING SIMULAED IT,S VALUE IZ WRITTENC ON T4F TAPE WITH THE OUTPUT QECORD. THIS WI1 ALLOWC SFARCiII O Q A PARTICULAR CASE BY ppjM*Eq.C
z CC THIS ;S TWE STARTING POINT FOR A SIMULATION. IT IS ALSO
C ENTERED F:7 A RESTART FOLLnWNC AN 11 or 0 00 0 Tl 20o
1 CONTINUE
CC NEL IS TWF NUmBER OF ANTENNAE IN THE SYSTEM. 3EFAULTC CC0.0OION IS IVE AMTENMAC
NEL ICCC EWR IS A MATRIX CO%TAINING THE SIDEBAND ELECTRIC FIELDC DFSCRIPTI' PRODUCED BY TuE ANTENNA SUPROUTINE. EwR(I,J)C IS THE FISLO FOR THE *I#TH AqTENNA. AND THE *is VALUESC WAVE THE rOLLOWING SIAGNIFICANCE:C J USAGEC i SIDEPAND PORTION OF CARRIER PLUS SIOEBANDC FOR THE COURSE SECTION OF THIS ANTENNAC 2 SIOEBAND ONLY FOR THE COURSEC 3 SIDEBAND PORTION OF CARRIER PLUS SIDESANDC FOR THE CLEARANCE SECTIONC 4 SIDEBAND ONLY FOR THE CLEARANCECC THIS SUBPOUTINE CALL IS USED TO CLEAR EWR PEFOREC STARTING THE SIMULATIONC
CALL CLEAR(EWR,#16)CCC THIS IS A TEST FOR END-OF-FILE ON CARD INPUT. THE CALL TOC EOF ARMS THE INTERUPT. AT END OF FILE ON UNIT 5 ImTERUPT ISC TO STATEM7IKT 5$.C
2 CONTINUEIF(EOF(9)) GO TO 58
CCC THIS IS THE !NPUT COR THE MODE CARr. THE VARIARLES HAVEC THE FOLLOWING USES:CC SYM9OL USEC MODE ANTENNA TYPEC uI V-RING COURSEC 82 @-LOOP COURSE
28

MA14 EFN SOURCE 4TATEMENT IFNCSi
C X3 WAVEGUIDE COURSEC v4 NOT USEDC 83 MEASUQED COURSE PATTERNC 86 MEASURED COURSE AND CLEARANCE PATTEqNSC 87 THEORETCAL COURSE ADRAYC 25 TWEORETICAL COURSE AND ILEARAR'CE ARRAYC g- V-RING CLEARANCEC G- $-LOOP CLEARANCEC e.3 WAVEGUIDE CLEARANCEC 8-5 MEASURED CLEARANCE PATTFRNC a-7 THEORETICAL CLEARANCE ARRAYCC FRO FREOUENCY Of TRANSMISSInNC xTH DISTANCE TO THRESHOLDC !A(I) ,I.TH ANTENNA HEIGHT
C ORIGIN IS AT THE CENTER OF COORDINATE SYSTEM.C X-AXIS 13 ALONG RUNWAYC I-AXIS 1S STRAIGHT UPC Y-AXIS COPLETES A RIGHT HANDED SYSTEMC
READ C5,1R!0) MODE#FRQXT4IACCC THIS IS A TEST FOR INVALID ANTENNA TYPE. THE PROGRAM ABORTS IN CASEC OF ERROR. TWtS IS USUALLY CAUSED RY OMISSION OF OTHER CARDSC WHICH CAUSE SOMETHING OTHER THAN A MODE CARD TO 9E READ ATC THIS POINT.C
IF( MOO .GT. 8 ) GO TO 58IF( MOCE .LT. -7) GO TO 58Irt MODE .EQ. 0) GO To 96
CCC THIS IS TCST FOR NEGATIVE MOOE INnICATING CLEARANCE ANTENNA.C IF MODE IS POSITIVE FLOW IS TO STATEMENT 4C
IF( NODE .GT. 0 ) GO TO 4CC ICP IS THE.ANTENNA TYPE FOR THE CLEARANCE ANTENNAC lOP -MODE
C
C IF THERE IS A CLEARANCE ANTENNA THEN THE NUM9Ev Or ANTENNAEC 1S SET TO 2.
MEL a 2CCC IF THE CLrARENCE ANTENNA IS SPECIFIEO BY A MEASURED PATTERN IT ISC NOW READ IN SY SUBROUTiNE PATTRN,C
IF( ICP .EQ. S ) CALL PATTRN(PRADPFPP,6RP)C iC
ig4

!A 1'J EFN SOURCE! CTATFtdENJ1 IFN(S)-
C 1 T.4eCcLrA47rICE A.qsENNA IS SPECIPIE0 Ple AORAY PARAMETERS THE INPUTC Th'TA rOO 'H7E t~AY IS .'JfW REA0 IVJ PY CPRNJTS.C
WCIe~ EO.7) CALL CRQNTS fCe.S12eo,2cj2)gr()
CCW 71. Fi*9 I O ACi( TO STATEPMENT 2 TO READ IN
C E -AQ!A) FOC f-tlIQSE ANTEN-A.C
G" TO ?'
lz ~ C 1TS fS T'4E INPUT SECTION FOR THE r.OUPAE ANTEt,!,A IF PATTERNS ORC ARPAY .7r~rOIDTlON MU5T BE 31VEN, OTH!RvISE FLOW IS Tn THEC ImITIALIiATION SECTION*C
4 IF(C411CE.LT. n GO TO A
C THIS STATrmE J1 CONTROLS THE INPUT "ETWOD. PATTERN OR ARRAY,C ArCO'4nINdG To MODE TYPE.C
IF CMflDE *rT. 6) GO To 5CALL P4TTz*NCARAOAF9P.AGPP)
CCC THIS 13 T-7 INPUT TuE- SECOND PATTERN rOP CLEARANCE ANTENNA IFC vnDE !S 6.C
IF( 400E .EQ. 5) GO TO 62ALL PATTRK(PPAD.BFPP,9GPP)
CC THFf MUMBER OF ANTENNAE AND TWlE ICP TYPE ARE qET# TWESI1 FLOW IS TOC INIT[LAIEATION.
NEL a 2
Gn TO 6CCC THIS IS T4t 14PUT FOR COUrSE ARRAY DATA.C
L:CA CRNTS ffOECS.OETtJO))CCC THIS TEST IS rOR CLEARANCE ARRAY IF MOPEC IS TYPE eC
IF C MODE .EO. 7) GO TO 6CALL CPRNTS(OC,)CC,)SC.)T(2,N,)3ODE 37ICP87NELm2
CC
30
EFN q'UPCr STATEMEFNT IF'JCS)- ,i I
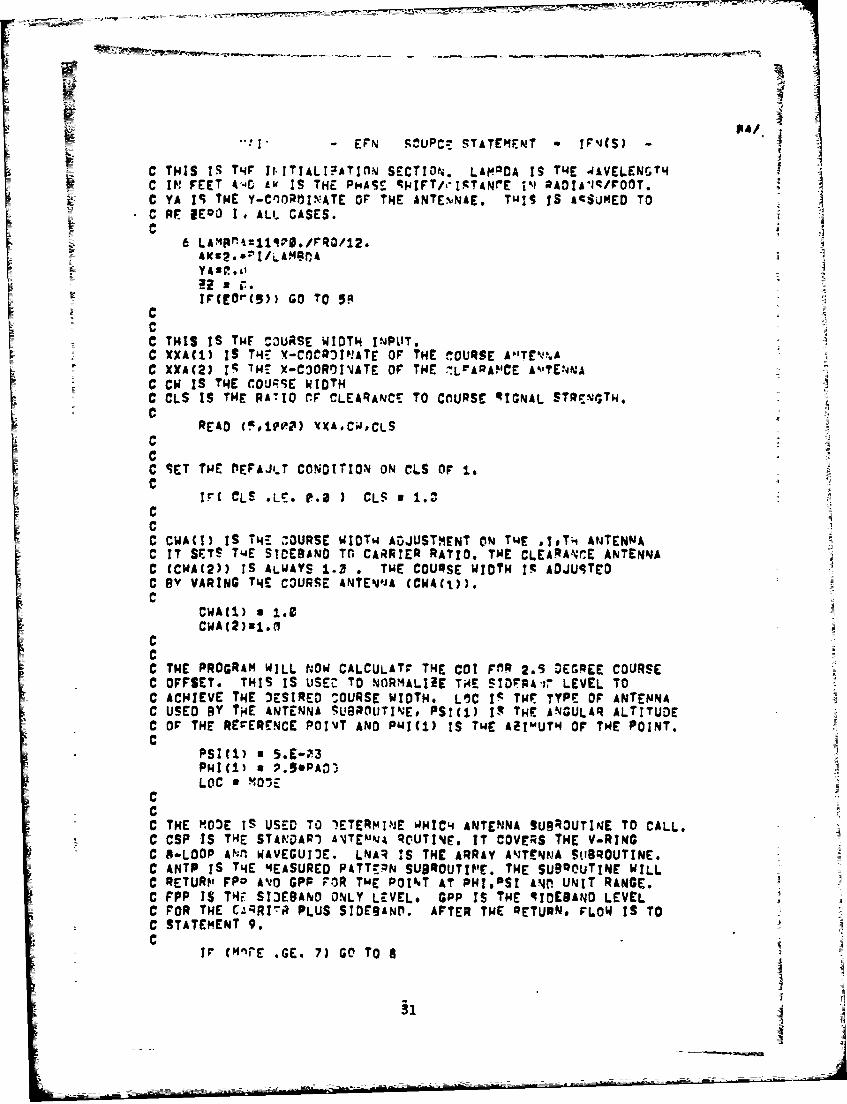
C THIS IS T'r Ir. ITIALTATInN SECTION. LAMODA IS T 4E 4AVELENGTHC IN! FEET 4"40 Aw IS THE PMAE HIFT/-I9TANf*E i ! aAOIA1/FOOT.C YA IS THE Y-CnOROINATE OF THE ANTENNAE, TUIS IS A9SUMED TO
C RE lEOO I, ALL CASES.
C
C THIS IS TUF URSE WIDTH IPL'T.+ C XXAI) IS T'4 X-COCTRIATE OF THE OURSE A"'TE AfC XXA(2) I THE X-C OROI lATE OF THE LPA A ,CE A ,TE aJ
i C cw IS THE COU 5E WIDTH' C CLS IS THE RA IO ( F CLEARANCE TO CnURSE IGNAL STRenGTN.
READ c',jQ ) 'XACW,CLS
g C ET THE flEFAJLT CONDITION ON CLS OF 1. ;
c
C
C
C CUACI) 1S THE XCORIDAThDUSN OF ~ TH hOR E 01TENIA TENC IT s(rS 19. IEBN T-0O AER ATIO TUAAE CLAAATENNAC CWA) 13TECS WY . U ORE WIDTH RAJTEC CLS VIN THE RTOr LNCTOCOURSE ANTENJA CCWACU).
C
R CHEAD TFvF90 WXSIRED OUS IT.LCI w Y O N
C USET TE ATECNDIIO UBON E CLSI) OF T1.NU~qATT
IF OrE LS.Rf~eC P-0N CND PI.- STEtIUT FTEPIT
CC
= C
C OTFSET IS USED TO NTORMAIE RAIO TE CIR LNCE TOENA
C CHIEVE THE ASIAD 'ZTO URSE WIDTH L, ITaVR T1 E OFANTSTC USED IN V .THE ARRS ANTENNA S) TUROTITE
C ONT F THE E SUCE PITTAN PUCOUI' TwE ZIUHOFUTIE POINT,
C
CC
C THFET THOEIS S TO7 ETO RMALEDIE TENN SUBROU-j- E TOCAL
C ACHLOOE THA DSRE US WIDTH-E LNC 1S T OE YPEAY ANTENNA IRUIEC USTD 9Y THE ANEAE SPATE SOUTP1 THE AULARJIN ALILLD
C RETURE WP AN GPP FOR TWE POINT AT HI, ST AIN UNIT RANGE.
C FPP IS THF SIJEBAND ONLY LEVEL. GPP IS THE SIDEBAND LEVELC FOR THE CarRIeR~ PLUS SIDEBAND. AFTER THE QETUPND FLOW IS TOC STATEMENT 9,
C
C ITH ME GUED 7)TO EMN HC NEN URETO CALC CS ISTHESTADARIANTmNAQCU14E IT OVES TE VRINC A-OOPA~n AVEU~lE LNq I THEARRY ANENN SlIROUINEC ANP I T4 MESURD PA~r~N SBROTIP. TH SUROUINEWIL
C REURMFPO VO PF IR TE PINTAT PI,0I An UNT RNCE

A4 Iv - ErF SOURCE STATEMENT - IFNCS) -
IF~~mOLE ,GE. 5) '90 TO 7CALL :SP-t TO 9
7 CALL AVTO (FPPG=PARA0,AFPPpAPP)3n TD 9
S CaLL 1'AQ ( FPP.GPPoHI,!)E#CS*SO.ETNO)
C
C THE STGNAL LEVELS ARE IN FPP AND GPP* TEMP IS THE APPARENTC COURSE WIDTH WITH CWAsS OF 1.C,C
9 TEMPs 1.9375/REAL(FPP/GPP)CCC THE COURSr wInTH REAl IN IS USED IF IT IS LARGER THAN 3 DEGREESC OTHERWISE THE STANDARD VALUE BY FAA SPrCIFICATiONS ISC OFTERM!NE! ANn THIS VALUE USED. THE COURSE wInTm IS LIMITEDC TO A RANGE Or 3 TO 6 DEGREES.
IF( C W - 3.0 ) 10alfal1
13 CW a 7.*ATAN(350./XTH ) * RADIF( CW -L7. 3.5 ) CW s 3.?i+ IF(CW .GT. 6*0) Pws6-2
CCC THE CWA(t) IS ADJUSTED TO PRODUCE THE DESIREO COURSE WIDTH.
'411 CWA(T) x TEMP/CW
C THE VALUES# READ IN AND CALCULATED# FOR THE ANTENNA SYSTEM($)C ARE OUjTPUT 04 THE LINE PRINTER (ASSUMED TO Ot UNIT 6)
+ WRITE(5,1193) MODE ICIP FR~oXTHIA#XXAseW~WRtTE(6,1091) TEMPCWA
WRITE(6,*10S) CLS
CC THIS IS THE LOOP BACK POINT FOR NEW FLIGHT PATH. IGPS 11 TO 15.C MEMO IS THE LABEL.FOR HEADER RECORDS AND GRAPHS.C INPUT DATA FOR FLIGHT PATHIC WN STARTING POINTC XNAX ENDING POINTC DXP SAMPLE POINT SPACINGC PHIR ANGLE OF APROACHC PSIR GLIDE ANGLEC R RADIUS OF ORBITC EUP ALTITUDE AT THRESHOLD OR OF OQRiTC ICF FLAG 0 FOR STRAIGHT LINE, I FOR ORBITC
14 CONTINUEREAD (g,1615) MEMOIWRIT(6*$i44) MEZOREAD (goISI6t XM!NXMAX.DXRPHIR.PSIRRIUPICF
32

74/;-EF'j SOUQr.- ITiTEP4ENT IFN'~(R)
CC THlE S1'vN '" IXR IS ADJUSTEI CDR FLIG-4T FROM -MI!N TO XMAX.
C
C
STier VrLO!WC1TY LF THE AIRCRAFT IS IPUT.
QrAO (5#1816 VELWRITE (6,3227) VEL
CC THE SIGN flF TH~E VELOCITY IS SET TO AC-CEE WITI' TWAT Or OXR.C
VrLwS:q' C L. XR)
C TP.E NUMiQ!D 0' RECEIVER P0JAITS IS D7TFPPIE0. IF TOI ISC LESS Ti*A' F02 FLOW PROCEEng TC STATE4EP~T 14. OT4ERwISE TWlEC MAGNITUDE OF nXR IS INCREASVF! TO GIVE CNLY 901 PO!ITS,
NJR sIFIXC (XMAX-XM'),/w' * 1:: (N -L.1 GO TO
!FCNRT(R . LT. -) GO TO 46
16CONTINIUECCC THE FLIGH~T PATH DESCRIPTIOv. IS OUTPUT, lTdS rQAMA? SE!IJG OETERMTI~rOC BY T4E TYPE OF FLIGHT. IN T4E CASE OF STRAIGHT LI-iC THEC NECESSARY CON~STANTS COP DOPPLER EFFECTS AND MOSITION AREC DETERMINED.C AFTER OUTPUT FLOW IS TO STATEMENT 19.C
IF (CF) 14#1R,1717 WRITE C6*1fl19) Xm!NsX4AX,DXR.XTH.IUP#ICF
GO TO 19is CONTIN~UE
WQITt*C6*l139) XMJN,XUAX,DXR.P;41RPSIRXTWiUPPHIRePWIR/RADPS! RIPS! '/RA 0SPSI a SINCPSIR)TANSRESPST/COSCPSIR)TA'JR2SNPNIR)/COS(PwIR)VXsVEL*C0SCPSIR)*CCSCPIQ)VYEVEL*COSPSIR)*INPII)V~sVELOSINCPSTR)
19 C04'TINUE
C THESE CONSTANJTS ARE FILTER FACTORS FOR THE ASSUMED MODULATIONC FILTERS.
33

b
- £FN SOURCr STATEMENT - IFN(S) -
v F107AA1.IOT = 6v.*PTAq'"T = 91*.PTA
CCC THIS Tt T';E LIOP AACK P014T TC START A NEW SIMULATION WITHC ORSVI $ sT-"NA SYSTEM AN rLIGHT PATH. THE COMPLEX FIELDC ShIKAT10% MAT %ICIES &RE CLEAQED, T4E CASE UPq~rR ISC INCREMEPTFC 4" ONE ANID THE LIt!EPRINT!R HEADE$ ARE WRITTEN.C
71 CINTINUE'ALL ~E~~.53
= Jr a *J jWD"ITE (6si±1N)
CCC THIS IS TwE INPUT FOR A NEW SCATT[CER OR CONTROL CARD, THEC Fr*RMAT A'JT USAGE OF T4lE VACIAPLES WILL BE rOUNC IN TilE USERvS PANUAL.C
21. PEAD (5,1 12) IO,XWCi).XWC2)9XWC3),ALP'sA*DELTA.W.HWCCC A NEGATIVE 1: IS USED ON A SCATTERCR TO CAUSE THE FIELDS TOC 9 SURTRACTE) FROM THE SUP. THUS IDA IS USEO TO DETERMINEC THE TYPE Or S'ATTERER AND THE SIGN OF in IS USED VOR THEC SIGN nTERMINATrION OF THE FIELDS,C !DAUIAmSC 10)
C
C THE RECEIVER POINT LOCATION VARIABLES ARE INIT!ALIZED. XR ISC THE X- OOROIVATE OF THE LOCATION. IR IS THE I-COORDINATEC AND COEG TS THE AZIMUTH. THE USE OF THESE VARIABLES IS CONTROLLEDC BY THE VALUE OF ICF.C
IF (ICF) 23e23,2222 CDEGBXIN-"XR
Go TO 2423 XPsXmINft*XR24 CONTINUE
C
C IF IDA IS NOT I OR 2 THEN THIS CARD IS A CONTROL CARD AND0 FLOW PASSES TO STATEMENT 43 TO OUTPUT THE CO AND FORC LOOPING CONTROL.
IF(IDA .9T. 2) GO O 43It(IDA .Ea. 9) G0 TO 43
C
C XV IS AN ARRAY Or DATA ON THE ANTEyNA ANO FLIGHT PATH AND ISC OUTPUT AS PART Or THE HEADER RECORD ON THE OUTPUT TAPE.C
34

-A-1 EFN SOURCE STATEMENT ItJCS)-
XYC2) s OSIRXY(3) x 3'jPVY(4) 2 LOAT(:JC)xvcS) s VEI.
TY6 2 r*-AT(aqODE)
vv(?) 2 -L'AAT(ICP)
CTHIS SETn SESCq4KVVALSPO H:CLNE AE
C AXA IS A cONSTANT USED IR' THE SCAT tQERI'0 ANJD DELTA IS SET TOC ZERO FOR f Vz-TICAL CYLINGER,C
IFCIt'A Nr.~ 2) 20 TO 25
AXAnMdJ*A'(/2.25 CO'JTI'AL'E
CC
CT- I4iT A4ZLFS AtE CO4VEPTt- TO PAftIANS A%.OC THEIR SI%7q Ahn Cl SIVSS AR-- CALCULATED.C
Al PHA*ALwi'/fAr0ELTA~flELIA/RA0
5IuO3S!4fELTA)
SPS!!RCN4)EA)
C ECAUSE kCT CERTAIN APPROXIM4ATIONS "ADE IN THE ANALYSIS
C THERE IS % LIMIT ON THE SIZE OF Twr SCATTER[PS TWAT MAYC Or SIMULATED. TO AVOID T'41S PROBLEM AS MUCH 49C POSIBLE& F~OR THE RECTANGULAR SURrACE.C THE PROCRAR WILL BREAK UP TOO LAWG A WALL IFPTO
C SPALLrR PIECES. TO AVOID ORflRLEMS WITW OTHER TYPESOF SCATTERMR THE VARIABLES INVOLV9D ARE SET TO DEFAULTI
CC VALUES AND TWE BREAKING UP SECTION IS SKIPPrO.
= Ivalowe#.
-DY~sU.AIF .AA. 1)GO TC 26
CCC TEMP IS THE 4AIxIUM DISTANCE FROM THE REFERENCE PCINT ON THEC WALL THAT 4ILL GIVE A RE4SINABLE ERROR IN TWE APPROXIMATION.
TEMPe40OR?LAOASCRTCXXA()Wt1)..02.yA-mXWC2).o02))/5
3S

E EFIN SOURCF STATEMENT -IFN(SQ)-
C I~ q T,4E JU41'ER r'.r DIECES HI12,IT'ALLY INTO WjlCw T4E WALL MUST E
CC
4PTTEc('.1?'j3, TD.gw(1;,XW(2).X.%c3),ALPp.A#o!LTAWWVw.I, IoVC :'Afl Hw ARF RET 1 --,W VALUJES, TI-ESE ARE THE SIZES OF THC lVES y A-4r, Oy ARE THE CHANGF IN X- Amn4 Y-COORDINATES BETWEENC PIECES I' THE wOIPIONTAL RQ'PS. D? IS THE CHANGE IN ELEVATIONC RETWEEk' IIVS vrRTICALLY- OY AND DYE ARE THE cHAf~GE IN X AND YC mrTWEE', ;.'IS. TWIS CHANJGE fl*CURS 'NLY IN TILTED WALLS (SINDC ,MT £EJAL. TC rRnI).C
-X3A8S (C:jSA*WW)XW(l)S)yW(l)-A8S(COSA*TrMP)nYtSIGN(SINA.WW,X(Wt2))YWC2)ZXW(;)*SIGN( C-SINA*TEMP) , W(2))HWW/F-AT( IV)
OX? uS!N~D *4HW *SI NADYE 9S I lNO*iW*COSAGI TnI 27
CCC XW IS THE COORDINATE VECTOR USED FOR THE LOCATION OF THEC REFERENCE POINT OF EACH PIECE OF THE WALL, Xw IS USEDC AS ORIGIN OF THE WALL, AS EACH PIECE IS USED FOR THEC SCATTERING XW IS INCREMENTEO, XWo IS USED To RESET XwC FOP LOOPING ON ROWS,C
26 WIT(6.1013) .ID.XW(1)eXW(2),XW(3),ALPWAOELYA,4JWHW27 XWlCi)xXWft)-DX.OX?
XW0C3)xXWC3)-Ol
C
00 42 lesi.IV
X H04(2). X 4 (2). DYX40C3) EX WI(3) .01
XW(2)2XW3(2)XW(3) sXW) (3)
C
36

"% EFN SOURCF STATEMENT - F(S
-F,€ ---
C THIS LOOP IS WITHIN EACH RO AND IS FOP WORIPONTALLY SePARATEO
00 41 IAgi,IH
C XW IS THE COORnINATE VECTOR OF THE REFR ENCr 00'1#'T ON THFC PECE -EING S!MULATTr.
Xw(2)=XW(2),OYCCC SLISROUTItrJ FL, I USED TO CALCULATF THF fIELMS GENERATEn BY THEC ANTNNtE SYSTE- AT THE REFERENCE POINT. AFTrR THE CLLC THE rIELDR AT THE REFERENCE POINT FOR ALL ANTENNAE ARE INC Ewp.C
CALL FLC(XW(1),XW(2),xq(3))C THIS LOOP IS n' THE ANTENNAE. FOR EACW PIECE THE PROGRAMC CALCULATES TWF SCATTerED rIEL FROM ALL ANTENNAE.C TEL IS THF NMFER OF THE ANTENNA BFING SIMULATED.CC
DO 40 IELuI,NEL
C XA#YAHA ARE THE X-#Y- AND I- COOROINATES OF THEC ANf[NkA.C
XA XXA(TEL)C ._A*IA(IEL)
11fI IH cTION INITIALIEES THE RECEIVER POINT0 LOCATION VARIABLES. IR IS TUE NUMRER OF THE RECEIVER POINT.IRao
IOCICr.£E.m) GO TO 29COEG a XM!N - DXR0 TO 30
29 XR a XMIN - OXR36 CONTINUE
IF(M0)E.GT.6) Of 0 ZACIEL)CCC DW IS THE HORIZONTAL DISTACE FROM THE ANTEN4A TO THEC REFERENCE POINT,C
OW • SORT((XW(1).XA)e*2 * (XW(C).yA)..2)CCC AN IS A VECTOR WHOSE COORDINATES ARE THE DIRfCtION COSINESC FROM THE REFERPNCE POINT ON THE SURFACE OF THE SCATTERER TO
37

- EFN SOIJRCF STATEMENkT - IJF(S): C T ~Ar ' ": ,,. T.F RErRE.C vCSTE4 tjcErn IS ALItGE' ITMC lrE 11"Ee : " EC'A',GLE AJC THE THIRD AVIS IS
C TWE eT AL. It, TA 1 'ASE '4" THe fYLI'JDF R T EC ',P;MAL I q -SS'J'En TO LIE I' A HOP1 2 0,TAL PLAVE ANIC T^ POT.'IT AT Tqr A\TE A.C IF(T .N:. 1) GO TO 3'
II ~A(2)s=( YA.-YW(2))/GWa
.G TI 3332 C.)t, T Z ,!E
*A,,C(2 ):-C05A
A?'(3) ::"
13 CTIIUECCC THE HrI NT,:. ANGLE 9WTE..N TWE NMRMAL TO THE SUFFACE ANDC THE LINE -r SIGHT TO T4E AN'TEN'NA IS GAPMA. SING A;D COSGC ARE TwE -TiE 01;O COSINE OF GAMMA.
ST:G a (-AN(2)*(YW(j)-XA) + /%(l)*(XW(Z,.-yW/DwCCC IF THF COqG Iq NEGATIVE TH3N TE LINE OF SIGT ISC TmRU THE qAC,( IF THE SCATTERER AND TRE ILLUMINATICvJ ,nC THE FRONT SURraCE IS ASSUMED 'TO BE OP PERO INJTENSITYC AND THE FILLI FROM T41S SCATTERING 19 IG41ORED.
34 WRIIE (6#,14.7) IAI9,IELGO TO 40
35 C0A.TI ".'ECC
C THIS IS TWE LOOP RACK POINT FOR THE RECEIVrR POINTS.C FOR EACH PIECE OF SCATTERER AND FOD EACH ANTENmAC THE PROGRAM CALCULATES ALL THE FIELDS AT ALL TWCC RECEIVER POINTS BEFORE GOING ON TO THE NEXT PIECEC OR ANTENNA. XHYR, AND IR ARE THE COORDINATESC OV THE RECEIVFR LOCATION. VXVY AND V1 ARE THEC VELOCITIES IN THOSE DIRECTIOIt, THE LOCATIONC IS DETERMItO BY SLIGHTLY DIFFERENT METHODS DEPENDINGC ON THE FLIC-HT TYPE. THE VALUE OF lCr IS THE CONTROL., IR IS THE PECFIVER POINT NUMIEP ANn IS USED TO
C OFTERMINE ' :WE THE FIELDS FloM Twr SCATTERI!GC ARE To BE qUOMED.C
36 CONTINUEIF(ICF ,LE. 0) GO TO 37CnEGuCDEG.DXRIJr (rDOEG-YMAX)*DXR .GE. g,) GO TO 40XRs ,C0'S (CflEG/RAD)YRUR*SIN CCDEG/RAD)
38

.-AIlk! -ErIf. SOUPCF 3TtTrMENT !F%
vy a* - ?*Y4/74
VY' VrL*XR/R
37 COrNT I.
IF( Cv -yt'i)CXQ *GE. V)GO TO 4P'
TF(XR .LT. NTH) GOl T-)~aP x 9 (XP-XT4)*TA~qR
r..GO TnS9
39 CO"4TI;"'E[ Ir(IR -GT. 490) GO TO 40IRqgz-i
C
C Rw IS TkE !I-,TAN'CE rPP T,.' QFCEIvrR PrJ!.*T t T*4CC~ SCATTERER kErEPEflCE 20INT.C
C WSPCXX~)*2(QX()*ptox()*2C
C RI TH HOIZTA FROMTIWANTFROM TOE TECE PT H
* C RECEIVEPC POIT.C
= C
C TN LINE ^F1J ARE T THE PEATIVER FPOINT. SIFTS AND T3 OPLEC AE E SI~NE A OINPDAF VEIT.
C
OR A'RT(CY-XA)c 4 V(YR-YA) * V.CR2)
c3 CJ

- rh £ OPC souc ATINENT - !r(S) -
Ct C
C THES7 'CDISTAvTS ARE H.E CAIl FACTOqS FOP THE V*RII-jS CROSSTALKC CASES.
r ~ ~ 9Tz( 0oIJ'0.PHID)J*-'A/2.ShlrUCC1I) xxSt;j JluT+.97 I)**?SNCUC(2) --SINC(UT+Wl341)#*2St!CuT aS!NC(LjT)SN~cur) v SFINC(uT+W8OT)
CCC THIS SECTION CALCULATES THE GAIN FOR THE ACTUALC StATTERING.C
AxAK*(S'IN#'(COSGCOS)ICOSO(W(3)HA)/w.(XW3)-..~)/RR))3=A#?.*A(*NA*COSO/DWFACxCX-P(CMPLX(0. ,RWOAK) ).((CEXP(CMPLX(I. .A*WW) )Cj. D0. ))/A-,CEXP(ZMPLXC0.s2..AKI4A.XW(3)/DWq))*(CXP(CPLX('.,B.HW))-(..f.))
F ACsF A C/RW
A.AKOcSIN.(COSGCOSB)COD*((W(3)HA)/DW+tXW(3).?R)/RR))
RWPxSlT(4PRORR(-?R-XW(3) )f*2)i-AC3FAC-(CEXP(CMPLX(0. ,RWP*AK) )*( (CEXP(CMPLX(Pk. A@HW) ).CI. D@) )/A-.CFXP(CAMPLX(0.,2..AK0'4A.XW(3)/D.-) ).(CE)PCCMPLX(i.,o*HW)).C1..g.))
FACv-rAC*AI(*WW.COSD/PI/2,CCC ALL STATEr4!NTS FOR CALCULATING THE SCATTERING FROm RECTANGLES ANDC CYLINDERS ARE THE SANE WITH THE EXCEPTION OF THE FILLOWING STEP.C IDA IF ONE FOR THE RECTANGLE AND Two FOR THE CYLINOER*C
IF(IOA .EQ. 1) FACSFAC*COSI*SIJC(AVtOWW.(SIIJG.SINB)/2.)IF(IOA .EG. 2) FACsFAC.BESr(AK&.COSqSINR)/2.
CCC IF ID IS NEGATIVE TH GAIN IS TAKEN IN THE OPPOSITEC SENSE.C
IF( ID .LT. 8) FACswFACCCC THE GAIN IS MULLTIPLIFD By THE SIGNALS AT THE REFERENCEC POINT To CIVE THE SIGNALS AT THE OrCEIVER, THESE SIGNALS ARE COH'LEXC MAGNITUDES. EP IS THE SIDEAND PORTtOP' OF THE CARRIERC PLUS SIDEBAND FOR THE COURSE ANTENNA AND Et Twt SIDEBANDCONLY. EM 1S THE SIDEBAND PORTION OF THE CAPRIfR PLUS SIDEBANDC FOR THE CLEARANCE AND EC THE SIDEBAND ONLY.C
EP a FAC*EWRCIEL#I)EE a FACOEWR(CL-2)EN a rAC*EWR(IEL,3)
40
MAIN - EFN SOURCr STATEMENT - IFN(S) -
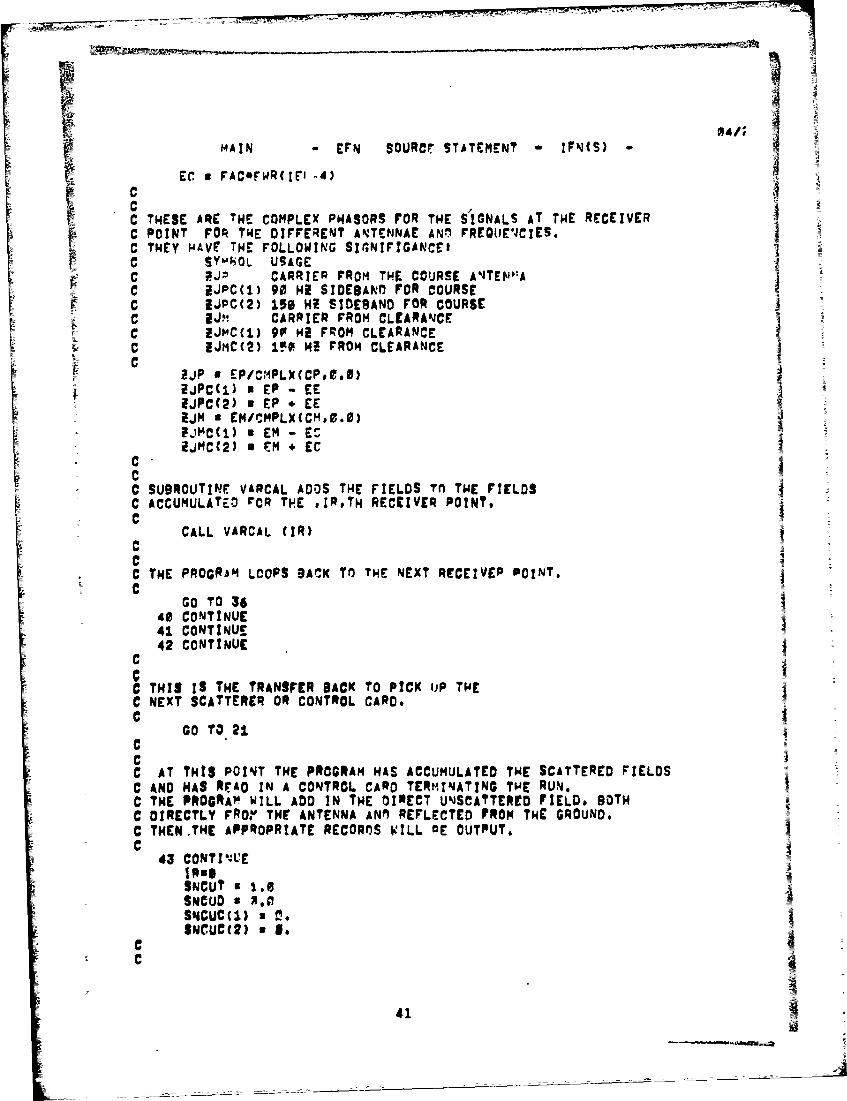
ME E FAC*FWR(F -4
C
C THESE ARE THE COMPLEX PHASORS FOR THE SIGNALS AT THE RECEIVERC POINT FOR TWE DIFFERENT ANTENNAE AN- FREOtJE'JCIES.
V-- C THEY HAVE THE FOLLOWING SINIFIGANCEIC SY'i OL USAGEC l CARRIER FROM THE COURSE ANTEN:AC lJPC(1) 90 Hl SIDEBAND FOR COURSEC IJPC(2) 158 Hf SIDEBAND FOR COURSEC aim CARRIER FROM CLCARANCE .
C IJMC(t) 9F HE FROM CLEARANCEC IJMC(2) 10 41 FROM CLEARANCEC
ZJP a £P/CMPLX(CP*e.0)ZJPC(l) 8 EP - EEIJPC(2) a EP * EZJM • EM/CMPLX(CM.s.0)
P.jMC(t) a EM - El*2iMCC2) n CM + EC
CcC SUBROUTINE VARCAL ADDS THE FIELDS TM TWE FIELDSC ACCUMULATEO rCR THE ,IR9TH RECEIVER POINT,C
CALL VARCAL CIR)
CIL CC THE PROGRsM LOOPS BACK TO THE NEXT RECEIVEP POINT.cGO TO 36
40 CONTINUE41 CONTINUE42 CONTINUE
C
C THIS IS THE TRANSFER BACK TO PICK UP THEC NEXT SCATTERER OR CONTROL CARD.c
GO TO 21CCC AT THIS POINT THE PROGRAM HAS ACCUMULATED THE SCATTERED FIELDSC AND HAS REAO IN A CONTROL CARD TERMINATING THE RUN.C THE PROGRAM WILL ADD IN THE OIECT UNSCATTERED FIELD. BOTHC DIRECTLY FROr THE ANTENNA ANn REFLECTED fROM THE GROUND,C THEN.THE APPROPRIATE RECORDS WILL ME OUTPUT.C
43 CONTINUE
SNCUT s 1.0SNOUD a *SNCUCCI) aSNCUC(2) a 9.
C
41
re EFN SCURCr qTATEMSNT -IF\;(S)-
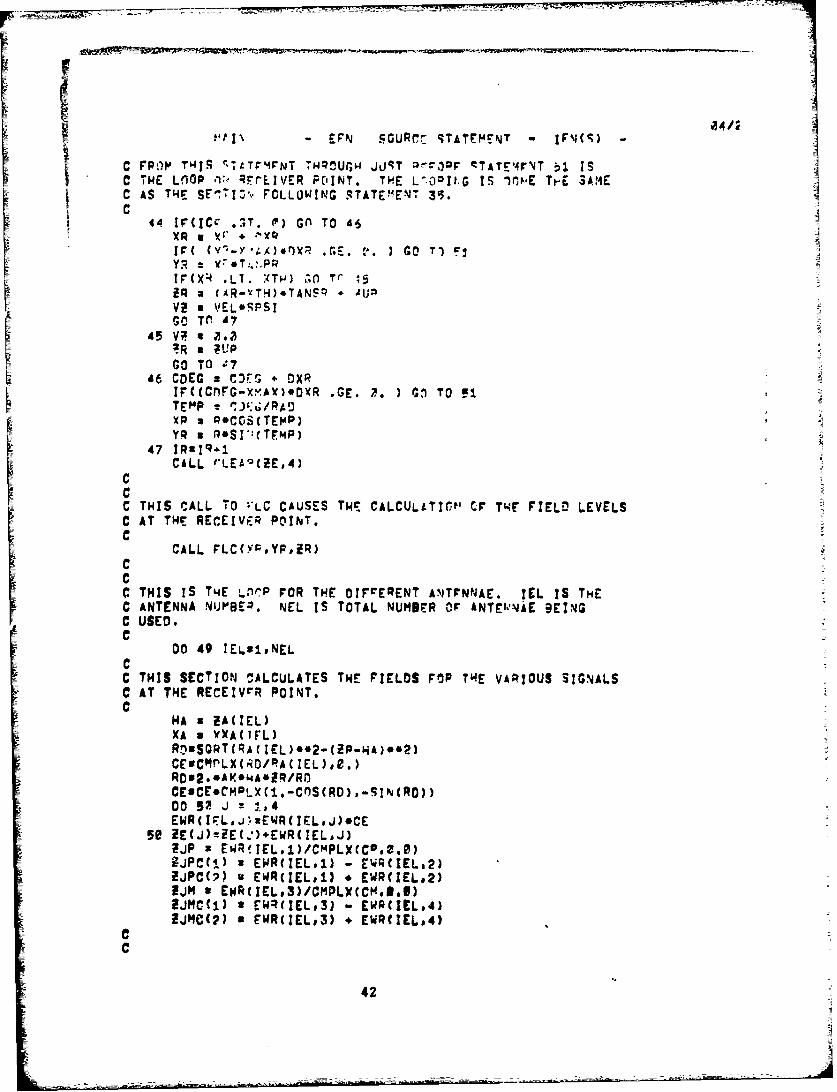
C FPOTh TW4TS 'TITF9NT T~UrGW JtJqT P-710F qTATE4rNT 51 ISC TWE 00iP 1, ;FrIVER PO'INT. THE LSO2It.-G IS ln -E Tt-E SAMEC AS TH~ E~I FOLLOWING STATEMENT 353.
44 Ir(ICc I~T. M') Gfl TO 46XR a ~*'IF( (v---Y* 4.A).')XP nc. ~.~GO Tj) Fj
i Q a (AR-YTH)*TANSP 'JUOV? Ta V~ESPSI
Ia ?V
GO TO .?746 COEG +J DXR
IF((nFG-XAY)DX.GE. 7. )Gn TO 55.
47IRz~q-1CALL LA(E4
C HSCALL TO LCCAUSES TWI CALCULtTiopM CF TLWE FIELD LEVELS
CTHIS IS TL4E Lnf!P FOR THE OIFrEPENT AsJTTNNAE. IEL IS TmECANTENNA N'.WBE4. NEL IS TOTAL NUMOCR Or ANTEpi~vE 9EINGCUSED.
CAT THE RECEIVrR POINT. T. AIU INL
HA a WAIEL)XA a YWA(TFL)ROUSORTCRAC IEL)**2-(ZP-HA..*2)CEsCM!PLXC(O/RAC IEL),0.)RD82. .AK#WA.lR/Rn
00 52 J m1#4EWR(IFLJlEWR(IEL#J)*CE
50 ZE(j)miE(.,)+EWRCIELoJ)EJP a EWfIELj)/CMPLX(CcP,.0)
9JPC(I) 2 EWR(IEL#1) *EWRCIEL&2)lJPC? a EWCIELi)/CML Wc4.3IE#)
ZJMC(j) t EWq(IEL#3) EWPCIEL.4)EJMCC2) a EWR(IEL#3) *EWRCIEL,4)
C
42
p4/; I
MAIN - EFN SOURCK STATEMENT IFN(S)
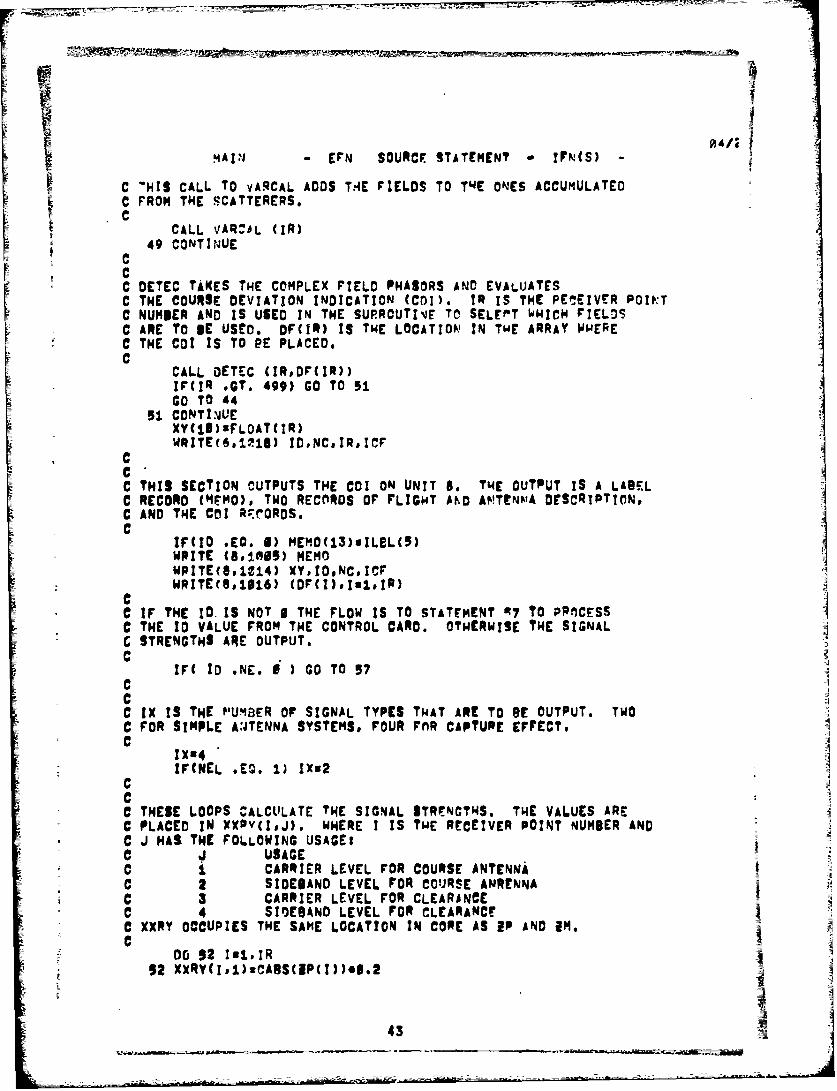
C -HIS CALL TO VARCAL ADDS TAE FIELDS TO THE ONES ACCUmULATED
C FROM THE SCATTERERS.
CALL VAR:AL (IR)I 49 CONTINUECCC DETEC TAKES THE COMPLEX FIELD PHASORS ANO EVALUATESC THE COURSE DEVIATION INDICATION (CDI). IR IS THE PEOEIVER POI:TC NUMBER AND IS USED IN THE SURROUTIVE TO SELEPT WHICH FIELDSC ARE TO BE USED. OF(IR) IS THE LOCATION IN THE ARRAY WMEREC THE CoI IS TO eE PLACED.C
CALL DETEC (IRDF(IR))IFCJR GT, 499) GO TO 51GO TO 44
51 CONTINUEXY(13)sFLOAT(IR)WRITECv.1(I18) ID,NC.IRICF
CCC THIS SECTION CUTPUTS THE COI ON UNIT B. THE OUTPUT IS A LABELC RECORD (MMO), TWO RECORDS OF FLIGHT AtD ANTENNA DESCRIPTION,C AND THE Col R rORDS.C
IF(ID .EO. 1) MEMO(13),ILBL(S)WRITE t8,IAIS) MEMOWPITE(8,114) XY,IDNCICFWRITECOA616) CDF(I),Iul,IR)
C IF THE ID IS NOT B THE FLOW IS TO STATEMENT R? TO PROCESSC THE ID VALUE FROM THE CONTROL CARD. OTHERWISE THE SIGNAL
C STRENGTHS ARE OUTPUT.C
IF( IO .NE. I ) GO TO 97CCC IX IS THE P'UM8ER OF SIGNAL TYPES THAT ARE TO BE OUTPUT. TWOC FOR SIMPLE A:JTENNA SYSTEMS* FOUR FMR CAPTURE EFFECT,C
IX84
IFtNEL .EO. 1) IX,2
C
C THESE LOOPS CALCULATE THE SIGNAL STRENgThS. THE VALUES AREC PLACED IN XXOV(IJ). WHERE I IS TWE RECEIVER POINT NUMBER ANDC J HAS THE FOLLOWING USAGE,C USAGEC CARRIER LEVEL FOR COURSE ANTENNAC a SIOEBAND LEVEL FOR COURSE ANRENNAC 3 CARRIER LEVEL FOR CLEARANCEC 4 SIOEBANO LEVEL FOR CLEARANCEC XXRY OCCUPIES THE SAME LOCATION IN CORE AS IP AND IM.€
D 92 Isl.IR52 XXRY(I,1)tCA8S(IP(I))g.2
43

M AI° -rpm SOURCE STATEMENT -IFN(S)-
53 XwqYCT,2lsrARS(EPC(I,1)-?pc(102))/P.: 01 54 lslZR
54 XVQY(I,3)zCAqS(M(I))e*,20 55 IslIR
SXY~YC1,4)uCASStIMC(1,t)-IpqC(1.2))/2.
C THIS LOOP OUT*UTS THE APPROPRIATE NUMPER Or SIGNALS ON UNIT S.C THE LABEL RECORD FOR EACH CASE IS ALTERED SLIGHTLY AS EXPLAINEnC IN THE DATA STATEMENT FOR ILOL.C
00 96 J a IfiXmEO(13)2ILBL(J)WRITE(S.oIMS) MEMOMRITE(8,1014) XY&ID#NCICF
56 WRITE(8*1916) (XXRYCI,J),oulIR)CCC THIS SECTION CONTROLS T4E FLOW OF THE PROGRAM AFTER THE OUPUTC FOR TIE CASE TS FINISHED. THE CONTROL IS BY THE VALUE OF THEC ID READ IN ON THE LAST CONTROL CARD. THIS ABSOLUTEC VALUE OF 10 IS IN IDA, DEPENDING ON TwE VALUE OF IDA THE
C PROGRAM LOOPS PACK AND READS IN THE "EXT DATA CARD FOR THEC NEXTCASE TO f RUf4. THE VALUE WILL CAUSE THE TRANSFR INC THE FOLLOWINCsC IDA NEXT TYPE OF CARD RIAO
C 3-il SCATTERERC 11-19 LABELC J6-28 MODE
C
€ l-D& CLORSEO TODT657 CONTI*JUE
IE(INO LE. F) GO TO IIF(IDA .LE. 10) GO TO 20IF(IDA .LE. 15) GO TO 14IF(IDA .LE. 21) GO TO IIF(IDA *LE. 9f) GO TO 6
58 CONTINUEEND FILEPEW!INr ISTOP
1030 FORMAT (WF1.3)1031 FORMAT(I2,2X,6XTFlIO3)1032 FORMAT(59V4HCLSuF9.4)1033 FORMAT(gWOMODE * 214118H FRO m?.
1 OH XT : F9.2/ INA A 31P9.212 8 XA a 3F9.2/14H COURSE WIDTH r?.2,sW DEGREES
1034 FORMAT (3X,13A6,A2)1095 FORMAT (13A6,A2)1036 rORMA1 (7CT1.I,2X,312)1337 FORMAT(WSO VELB*Ell.4)1438 FORMAT(26h OVER 530 RECEIVER POINTS I1039 FORMAT(6NPXMIN.lE1.471H XMAX.,ElIl4,?H OXRB*Ifl.4,?H PHIROEll
X.4#71 PSIRaEll.4,#I XTHs.EII.4,SH IUPu.111.4)
44

PA I bi I- F ----- U-C-. eZT&TIMENT IF-
1810 FOPMATld.'? STqUCTIRE D~ATA)±1.1i FORPOAT(964 10 Xw vp it 1w 1~
X*6woEL7A 5,!X23H W~W *'JI4i4f XsSX.13H V! SECTIONS)
1012 FORMAT (12s3r .9.5X#2F5.P#3F15.0,
1017 FORMA (27- SURFACE IS NC' ILLU~j'.:ATVXSHN .2#12#5H Vx#12.64 IELs.12)
t
4S
-up EFVJ SOURCE STATrI4EN? IT'a(S -'
CC TwIS SUORrJ.,TIA!E IS USED To 3ERO OUIT THfr CONVTENTSg OFC VARIOUS M ATIRA!?ES.C
S!QP~dtTI&, CLEAR (X,N)~~.!-PLSY XCi)
II~l
46

ISUB; - EF*t COURCE tT#TEMNT - C -
CCC THIS SUPROUTIME IS USED TO INDUT DATA rOR CALCLLATIPG THFORECTICALC PATTER-S rOR ARRAY TYPE ANTEvw'E.C
SI'PR'3uTP4: CRRt"TS( 0, 1, S, ET. VF~LOGICAL E-FOImEtJSIO* ET(19),DC1)COMPLEX CC1).S11)COMMON /SUO/ MDnEICPFR. LAMOSAPI.tAoPUI(3).PSI(3),NEL,XT"IFCEOFCS)) GM TO 3
CCC THIS IS THE INPUT FOR THE ELEmENT LOCATION AND CURRENT DESCRIPTIONC DT IS THE ELEMENT DISPLACEMENT IN THE Y-DIRECTIONs F SUREOC IN WAVELENGTHS.C CT IS THE CAP2IER PLUS SIOEBAC O AMPLITUr, IN PELATIVE UNITSC PC IS THE CARRIER PLUS SIDEBAND PHASE, IN CEGMEESC ST IS THE SI3EgAND ONLY AMOLITUOE, 1I- DELATIVE UNITSC PS IS THE SJIEPAND ONLY PHASE, IN tGRFESC
I READ (5,1 0I) OT. CT# PC, ST. SCC THIS TEST IS TO SEE IF THE ENO OF THlE rLEMENT rAROS 4AS REENC RACwED. Ir TOE CARRIER PwtSE IS REATER THAN 50A rLO4C IS TO THE ELEMFNT PATTERN SECTION.C
IF( PC .30T. 50* GO TI1 2CC THIS IS THE 92 DEGREE PHASE SHIFT FOR THE -UAPATURE OFC THE STDEPAND ONLY TO THE SIDEBAND IN TV'E CAROIFR PLUQ $IQrRAt!D.
CPS a PS*98,3WRITE (6#110) DT#CT,PC.ST.PSD(I) z DT*2.ePIC(I)wCTeEXP(CMPLXQ..PCeRAOO))W(I) ST*CENP(CMPLX(P.,PS*RAC%))
CCC THIS STATemENT LOOPS BACK rOR THE IENT ELEfEr' I' T' TOTAL
C NUMPER OF ELE"ENTS DOES NOT EXCEED THE AVAILABLE SPACE.tIF I ,LT. 26) 0 TO 1
CCC THIS SECTtrN QrFAS IN THE PATTERN FOR THE ELME'TS. NE IS TwEC NUMBER OF FLEMFUTS. ALL ELEMENTS ARF ASSUPEM TO HAVE THE SAMEC PATTERNS.C
2 NE I I - ICCC ET WILL Cn"ITaT i THE ELEMENT PATTERN. THE VALUES ARE INC RELATIVE AMPLITUDES. ET(l) IS THE VALUE AT ;ERO DEGEES AND
47

rb
L92 ° EFN SOURCE STATEMEP N - ) - IC SUCCESSIVr VALLVE ARr AT 12 OEGREE SPACING U0 TO ii". TPUSC TIEQE ARE 19 kOJNTS GIVEN. TWE PATTERN IS SY4ETRIC AROUTC THE ?FPO -EGtFE POINT.C
REAb (5*1?,29) ET
3 WRIT£Ec,?~..)
Ek! rLE Sstop
1~ FORMAT (2H ARRAY DATA nTSSPIG )END
A
48
qU*3 -EFN SOURCE STsTFMEpNT iru(S)-
CCC THIS SUSRGUTINE INPUTS T'4E A'JTENNA PATTERNS FOR THE M4EASUREDC P&T1ERI A4TEXA CASES.
SUt9qo'fTIvrF PATTR4 &AD.Q AFPP. 4GiP )LOGICAL E'iVDIMENSIONd ARAO(5-)* AFPP(52), AG'mPf5?)DATA RAO /' 57.2957795
li U(r5V) GO TO 4I READ(5l1?PS) AlEC. AFOPC!Y), AGOP(IY)
AFPP( IY)xAF'PPCIX).'ll96?C.AGPP(IX)GAGPPCIX)OIN361I.ARAD(tX)SANC /PAD
IF( i -3E 51 GO TO 2IF( IX L~E. 21) GO TO 2
2WRITE (Gsifft N.APP!.APPI
4 RITE (6#1?824
GOTO
1P6 FORMAC5$FjP.@161 FORMATC26WANTEN!A, PATTERN MEASUREMENT)
1632 7(ORMAI(34H ANGLE READ SIDEBAND CARRIER)1393 rORKAT (3E12.4)1954 FORMAT (3314 MEASURED ANTENNA PATTERN MISSING)
END
49

iUS4 -EFkN SOURCS STATEMENT IFVN(S)
CCC THIIS StiPR1LTINE SIMULATES TWE REHAvIOR Or THE ILS ;ECEIVZRC SYTM *3R THE IRe fl PECEIVER POINT IT CALCULATES THE COIC THAT w'JUL?. BE 09SERVED WITW THE FIFLD LEVELS IN RP.?IMC Z P! AND F!X.
qvsRflUTINF DETEC (IR#COI)linURLE PRECISION G(R0QREAL NCIMPLFX ZP(50),ZPC(9~00,2)*2 W9(00)PIMC(90002)
DT.MENSIOVi VCD(500,2),VPO(500.2).VMD(SOO,2)OT'IENSION VMP)GMOC26)COMt4o', 104PC,M,aMCVCDVPDVmOCO' MON /VAR/ SM.SNCUT.SNCU0,SNCU(2),VPC2)VMC(l)DATA jG /q/DATA GONP/ .0001-200140
1-. 672012997656250-.02,4626274i06686?0-02. "I337529162434080-02*1-.25?i0230693221D-0~2...202349037863310m62,..16339684807463D-02,
1: .827t8893239079D-03-.,719654371145180-13 -,631615937167980-03,1 .959146169754D-03#-.49828577026289O03#-#44646985629529D0.3,
* .4I3M2675i6463iO-03,. 36532323235967O-fl, * 332678129466020.03.1-.30422125733489D-03.-.2792656073i9l4DO3,..25725947746239D-03/CALL 'ITCCP(!R)#V:?,VPC)CALL 0TCi(91(IR)sVM#VMC)81(2 a 4.fl.VP*VM/(VP*VM)e#2
CF( UY QM)G TO2
Ni. Ni + I
I F NOE#3 0 TO 32CCu 1.0K2+
2p CC 1.0
3 00 4 1 8 1#2Vin2I a CP*CP*VPD0URoI) + CM*CM*VMDCPI * CCOcC.VCD(IR.1)VCI CP*VPCCZ) * CM*VMC(Z)
4 V(T) x SORT( VC?*VCl + V02 )C01 9 M*(V(2)-V(1))/iV(2)*V(1))qg TUR%!ENO
so

-V- ty
Rs -BI E F.i SOURCE STATIMENT 04/i~ -4
C T14IS SURRCUTINJE SIMULATES Thi- EFFECTS ,F PHASE SIPT iP:TWEEN
S iiJ1R 0.,,Tl%:* DTC ZNVN, VN'C
DIMENSIONj 2N(5C0D1),VNC(j) A
Pw 4[ cosp = cnscpm:
SINPXSIN(Ow)
LEND
51
--- :7:, Z -
s64/suse - EFN SOURCE STATEMENT * IPN(3) -
CCC THIS OUPROUTINE ADDS THE FIELDS IN ZJP, ZJM. ZJPC, AND ZJMCC TO THE SUMMATIONS IN ?0C. ZMC. VOD. VPO AND VMO. THE ARRAYSC CONTAIN THE COMPLEX SUMS FOR EACH RECCIVER POINT. THE SYMBOLSC HAVE THE FOLLOWING USAGE:C SYM9OL USAGEC IP CARRIER FROH COURSE ANTENNAC aM CARRIER FROM CLEARANCEC zPC R.i) 90 HZ SIDESAND FROM COURSEC fPc(IR,2) 190 HO SIDEBAND PROM COURSEC IMC(IRI) 90 HI SIDERAND FROM CLEARANCEC IMC(IR,2) 150 H SIDEBAND FROM CLEARANCEC VCD(IRi)C VCO(IR,2)C VOcIR1) * THESE ARE INTERNAL VARIABLES USED FORC VPD(IR,2) * DOPPLER EFFECTS. 7HEY HAVE NO DIRECTC VMD(IR,1) * PHYSICAL MEANING.C VMoCIRD2) 0CC SNCUT IS THE GAIN FACTOR FROM THE DIFFERENCE O THE SCATTEREDC SIGNAL FROM THE DIRECT SIGNAL FREQUENCY. THIS FREQUENCYC SHIFT IS CAUSED BY THE DIFFERENT VELOCITIES Or THE AIRCRAFTC RELATIVE TO THE ILS ANTENNA AND THE SCATTERERS. SNCUC(C) ISC THE GAIN OF THE CROSS TALK FROM THE CARRIER THROUGH THE 96 HC FILTER. SINCUC(2) IS THE CROSS TALK AT 190 H.'C SNCUO IS THE CROSS TALK FACTOR BETWEEN THE 93 HE AND 156 HEC SIGNALS FROM THE DOPPLER SHIFT*C
SUBROUTINE VARCAL (IR)tOMPLEX aCOMPLEX ZP(906),iPCC(S3@ )#
2 lM(sf8),?MC(9III2)DIMENSION VCO(510.2).VPOCSIg.t).VMOCSI,2)COMMON aPiPColMeaMCVCOVPDVMOCOMMON /VAR/ SMSNCUT.SNCUDOSN8UC(2)COMAEX EJMtEJPZJPC(2)tIJMC(l)COMMON /48/ EJMIJPOIJPC#IJMC'CAlltE) * REALCI*CONJGC())P(IN) a EPCIR) * ijPIM(IR) • IMCIR) + 9JM00 1 u1ls 2lPC(IR.I) a EPC(IR#I) # ZJPC(1)*INCUYIMC(lR.I) a IMC(IR.I) + IJMC(I)*SNCU?VCOCIRI) a VCD(IRI) * (CAB2(iJP I * CAS2(ZJM ))*SNCUC(I)
$NCU42 a SNCUD*BNCUDVPD(Irl#J) a VPD(IRPJ) + CAl2(lJPC(I)) *SNCUO2
I VMN(II.J) a VMDOIR.J) + CAI2(IJMC(I)) *SNCUO2RETURNENO
S2
++ _ + + -+++ -+.A

041qU97 -EFN SOURCE STATEMENT I FNI(S)-
.C THSSURUTINE CALCULATES THE ELECTRIC r7ELnS FrOR Ti.E
C SDEBNDSAT LOCATION (Xl#Y... AR~R E IS THE SAME ASC ARRAY EWP TN THE MAIN PROGRAM,
SU9ROuTINp FLC(Xl.YoZ)C04PLF.X E,F#FPP.GPP#C(25*2)#S(25#2)
LCOMMOJ/ClI/ ARAO(50)s P(2#GOSM#~DS)BPP5~8P(PCOMMOil /SUR/ LC(2),FRfUWANDA9PI.RAfl0,Pwi.P(2).PSITTC2),NELXT4,1 XXAC3)#YA.9jA(3),RA(3)
zOmmoo'. /ANT/ LOC.FPPC2)iGPPC2),EC4,4),CWA(2),AS(2)eD(25,2)eCS,2 ET(20,2.ND(2)AK*?.OPI/i4AMOAJA2.
THIS IS T4E LOOP ON ANTENNA NUMBER.4
Cr 'OI ),sEL
C AL 'LEAO CFPPp4),C
C LOC IS TWF '4PE FOR ANTENNA sj,
C
C STHE OISTANCE FROM THE ANTENNA TO THE POINT-C
X 8 WI. - XXA(J)R*SQRT (X#*2+Y**2. (i-NACJ)) .2)RAWJ)*P14 IATAN2(CYeK).PSI a ATAN2(1-14A(J)*X)JA*1*i~f*CJ-1)IF( LflC .LT. 4) CALL CSPIF(LOC tCO. 5) CALL ANTP(rPPCj),GPPCJ),ARAO(JA),AFPP(JA),AgPPCJA))IF(LOC ADO. 7) CALL LNAR(FPP(J).GPPCJ).PWI,0(,J),CCI.J).
*SC 1, )#,ET CI.J)pNO(J) )CON3 a AI(*R
C=C F IS THE COMPLEX GAIN FACTOR FOR THE TRANSMISSION LOSS FROM THE
C ANTENNA To THE POINT.C
F a CF:XPCMPLXI.#C0N3))/R= 00 1 JC8uI2
jetloJC-I
C GPP IS THE SIGNAL LEVEL FOR THE4 SIOE9AND PORTION OF THE CARRIER*C PLUS SIOERAND.
GPP(JC)a GPPCJC)*AS(JC)
S3
~ -EFN SOURCE~ STATEMENT -IFNCg)-
C P ST' OMLE P'4ASOR FOR THE SIDERAND ONLY,
rP C c )B JC)*C AJC) *AS CJC)ECJ#JB)oGPP(JC,*F
I. E(J#JR+1)z FPP(JC).FRETURkIEND
54
- .- ~- - -- - - -
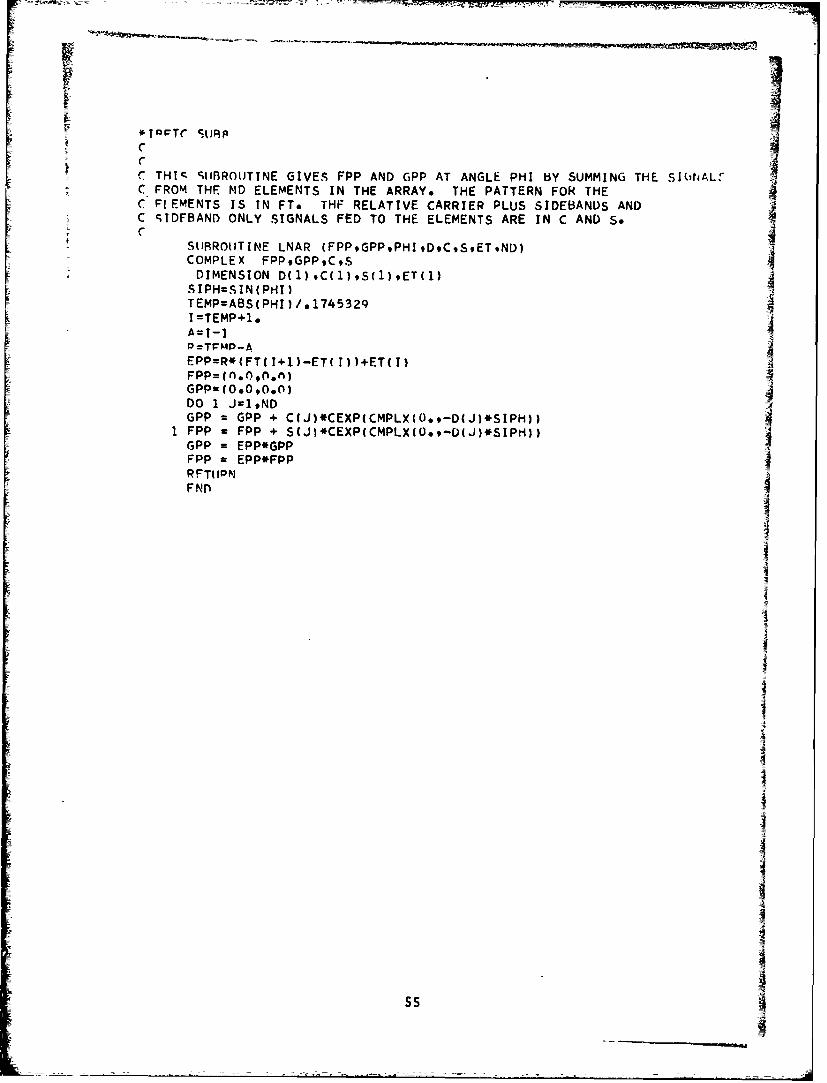
r THIC r,(IBROT)TNE GIVES FPP AND GPP AT ANGLE PHI 13Y SUMMING THE SlbhtALC FROM THE ND ELEMENTS IN THE ARRAY* THE PATTERN FOR THEC FtEMENTS IS IN FT. THF RELATIVE CARRIER PLUS SIDEBANUS ANDC qTDFBAND ONLY SIGNALS FED TO THE ELEMENTS ARE IN C AND So
SLIRROIITINE LNAR (FPPGPP,PHID9C9S9ETND)COMPLEX FPPGPPCSDIMENSION D(l) ,C(1),S(1)9ETcl)S IPH=S IN (PHI)TEMP=ABS(PHI)/.1745329I=TEMP+loATI-I
P=TFMPaEPP=R*(FT(1+1)-ET( T))+ET(I)FPP=(O.OOnri)GPPO(O.OO.O)DO 1 J1,*NDGPP =GPP + C(J)*CEXP(CMPLX(0.,-D(J)*SIPH))
1 FPP z FPP + S(J)*CEXP(CMPLX(Oat-D(J)*SIP1))= GPP = EPP*GPP
FPP = EPP*FPPRFTtIDN1FIN Nr
ss4

-EFk SORC STATEMENT - -(S
C
C TIS At'TFN'NA SUBROUTINE GIVES FPP ANO CPO FOR ANGLE Pq' BC INTEROOLATION IN TABLES ANT ANDJ ACP. ANGLE PHI1 IS INC RADIANS. THE SURROUTINE WILL INTE4PfJLATf 9ETWEEN VALUESC PR~ACIETTING TPHI. IF PHIl IS OUTSIDE TOJE RANGE OF TH4E TAVLC THEN EXTRAPOLATION. FROM4 THE LAST TWO VALUES WILL PE USED.C
SUBRO,JTIVtE ANTP (FPP#GPP*ANG#ANT#ACPIDIMENSIOV ANG(50), ANTM)s ACP(56)COMMON /SUR/ LCC2).FRQ,WAMOAPI.RAOP41,,9(2).DS.T(2),NARXT4.
I XXA(3),YA#NA(3)#RA(3)On I812#5!KulIF(AIJI(I) .GE. &,J) GO TO 5
I~(N~()-PI)1,3#21 CONTINUJE2 FPPaAI)TC(-1)(ANT(K)-APJTf(-1)).CPNI .A;fGtK.Li))/CANGcK)-ANG(K(-1))
GPPuA"P('(-1).(ACPCK)-AC-POK-1))CP4I -ANG(K4))/(ANdG(K)-ANG(K-i))GO TO 4
3 FPPxAJ4TC)GPPsACP(9)
4 RETUP'j5 Ku'(-l
GO TO 2END
S6
4'
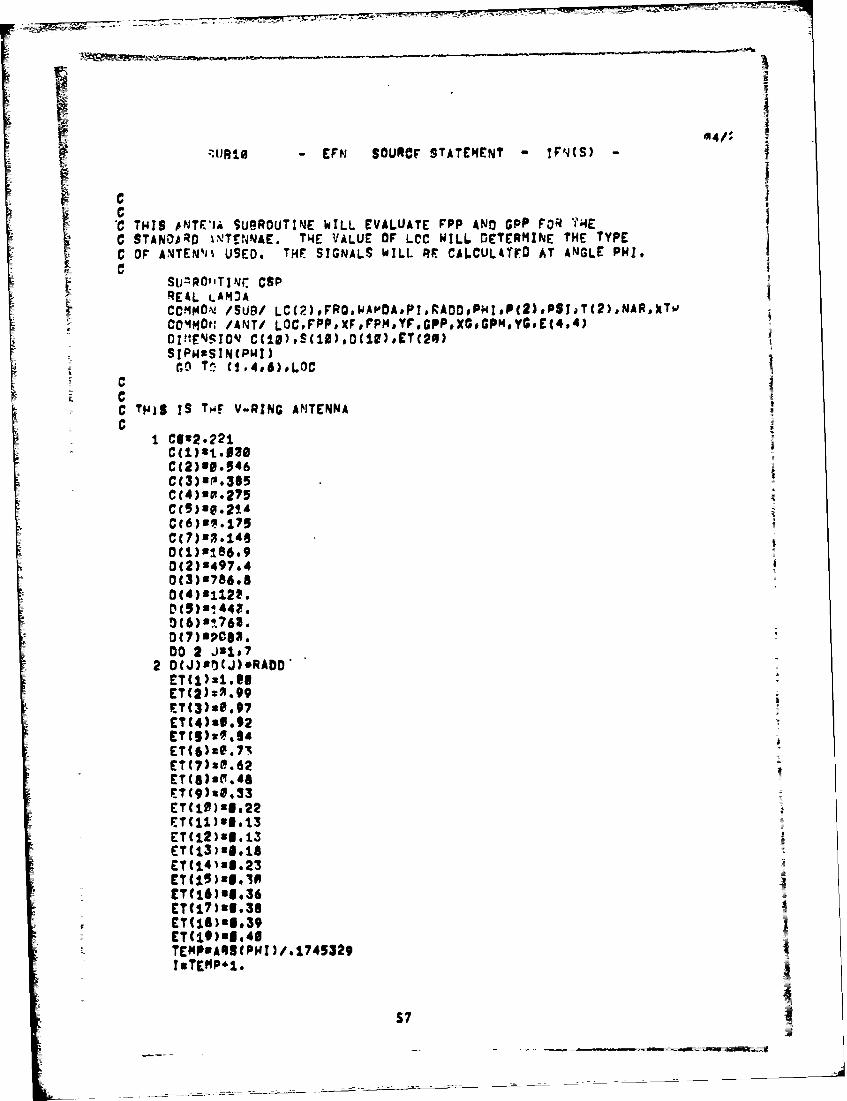
~UR1.8 - LEN SOURCF STATEFIENT -!tJS
C TIlS oNTPE'li SUROUTINE WILL EVALUATE FPP AM) GPP FOR NEz C STANDARD INTENNAE. T4E VALUE OF LCC WILL DETERMINE THE TYPE
C OF ANTEN41i USED. THE SIGNALS WILL RE CALCULAYFD AT ANGLE PHI1.c
SUmP01"TINC CSPREAL LAM3ACOMMON' /SUB/ LC(2)DFRO:WAPDADPI,RAOPNI.P(2),PSIaT(2),NAR,XTJCOMIMON: /ANT/ LOC,FPP,XF,FPMYF.GPP,XCeGPM*YGDEC4.4)
SJPN:SINCP4I)40 T - CI.4#6)#LOC
C
C THIS IS ToF V-PING ANJTENNAC
I C182.22.
C(2)20.546C (3)sm1* 365C(4)20.275
= Cc5)2e.21'C(6)81'.175
0C2)2497.40(3)s786o80(4)21122.
= DC6) 81763.D(I)3SC82.00 2 J21p;
2 D(J)*nCj)*RADO*ETCI)xl.lfCT(C2)xP. 99
ETC4)*9.92
ETC G) 0.71= ETC7)xM.62
ETC 5) a(I*48ETC9)%0.33ETC 19) 36 ,22ETC 11) 33.3ETC 12) 36. 1ETC1341I1s2ET(15'x@#23
ET(16)91*36ET (1? ) ml36ET (IS )afS39LTCI9)*.40TE#PASPHI)/o1745329I*TEMP*1,
57
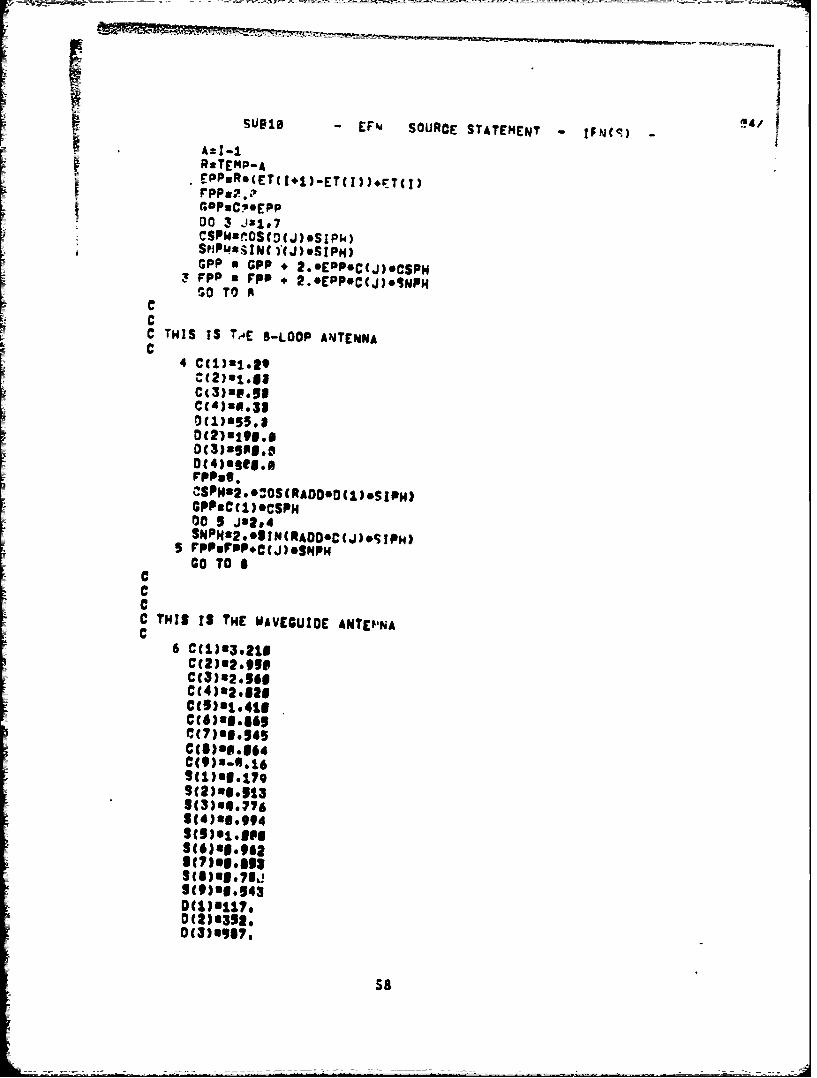
LSusie -EF'dI SOURCE STATEMENT Ih('q)- 4
R*TEMP-ArPPwR*(ET(I+1)..ET(I))+rTCI)rppap..sGopuCp*EppDO 3 !1.#7CSPI4CSSD(J)*SIpk,
GPP 9 GOP . 2.*EDP*C~j)oeSpNI VPP a P 2PP *EP*()lP
SO TO A
CC THIS IS TAE S-LOOP ANITNNAC
4 C(1)SI.20
Cc 3) ap.5gc (4) u * 33
GPPBC (1) 35PM00 5 J82#4
5 FPPouPPPCtjesNpWG0 T0 a
C= C
C THIS IS THE WAVEGUIDE ANTEPNAC
6 Ctl)@S*21eC(2)82*990C(3)n2,5&oC(4)42*hleC(5)81,411
= C7)g.945
C(9)6-4.169(1)a1. 1799C2)89-513
8(4)86-.994
9(9)80.9430(l)317O(3)qgg*
0(3)a55a

SL irE' SOURCE STATEMENT - J.(S) /
sr 4 *
05)3'.
GPPxG*!:joep
7 VPPwFDPP.5J)SNPHa RETURmIK1

sUalt EFu qOURCr SATEMENT *IFN(S -
C
C THIS FUNCTIO'J EVALUATES THE WEIGHTED SUM OF A SERIES OFC BESSEL FUNCTIONS. IT IS USED TO CALCULATE TWE SCATTERINGC FROM A CYLINOEF.C
COMPLEX rUt4CTION BESFVAKAINCR.XS4)COmPLCX SimDATA P1 ,rE/3.14159265.2.71828103/cauxC9
IF(C *LT. -. 99996) GO TO 6SqsKSq
V182e/v
PRIJOV-78539816-XI.C.14166397.Xl.C.IeeS3@54-Xle(
rO..79708456-x( .0809077*XIOC .q955274g*Xt*e
BJnFQ*COS(PNI )/SQRT(V)'GO TO 21XISVOV/9.
.60444479-XleC .0139444-"IeC .36321))))))
SERxI.FNBFN.1S.EJS((1.-1./Ft4).e(FN-.39))OEE*V/2./FNOjel.
3 Fj -riNoJpdVI4OJ*AMGASS(FJ)*ASOJ)EJUOJ/ANOjnFJ/A9PnufN-1.IFCPN OfT. FH-.S) 00 TO 3BeATAN2t$B#CS)
ClnCOS( (VN.2. )4B/2#)S2*11*CS-Cl*SSC22CI.Ces.*sB
4 YI'7t4InFNd.2.SERvSER#EJ*CC2/YI-Cl/lI)IF(Vti *LT. 2.) GO TO 9duactSisST(HpsC2oCS.S2.S9SSl.2CB-C2*SSClwTtMP
60

Qui EFN SOURCt STATEMFNT - z7'(Si
E:jvOJ
O'UPS J RSCF)
FNxFN-.
SERnStc/44EJUOJ/AMOjzFPJ /A 9GO TO 4
5 Ais-EJ*FV*VJ.ojOJsojoeJ/AjSEASSFc*@J/AJ
C19-PIOC92*OJSUMBCMIPLKX CR!C)
6 BESFOSUMq
['40
61

-UB - EFN SOURCE ITATEENT - -
CCC THIS IS THE 3IN~C FUNCTION. IT IS OEFIVED AS TWE SINE: orC X DIVIDED PY X. SINC OF IERO IS TAKEN TO RE ONE,C
FUNCTION SINCX)XXUABS(X)IF(XX .LT. .401220703) WX0.BIRISINCsc-INCXX)/XX
QETURfiEND
62

SUBi3 -EFri SOURCE STATEMENT IF-I(S)-
8LOCK DATACOI"PLEX I-JM#IJP*ZJPC(2)#iJMC(2)COMMON /AS/ ZJP,ZJP#ZJPC*ZJHC
IF COMMON /VAR/ SM,SNCUT.SNCUO.SNCUC(,).VPCC2,,VMCC2)C0P9M04 /SUR/?tU)*Y(4) P1 .QADDCOMM4ON /ANT/0LJMC43)#ASC2)
flATA S'4i397.1DATA iJ"*ZJP*ZJPC#EJHCI4(../DATA PI&RACO/3.14159265#.317453292,END
63

DYAI It;LAIOPROGRAM~~ DYMLITN
644
IAx
The ILSLOC program calculates the CDI at each point in
space; this CDI includes the Doppler effects from the velocityof the aircraft. In the simulation, the receiver system isassumed to generate the CnI value instantaneously. In the real
case, the inertia of the electrical and mechanical .ortjons of
the system limit the rate of change of the CDI. Thus the realobserved CDI appears to have been low-pass filtered from the
instantaneous CDI.
The program DYNM takes the output tape generated by programILSLOC and converts it to observed CDI by simulating the effectof a low-pass filter. The variable TAU is the time constant of
the effective filter.*
Note: When a flight path has been segmented, the low-passfilter will operate continuously over the entireflight path.
65

19IPFTC MATNC THIS PROGRAM SIMULATES THE EFFECT OF THE MECHANICAL AND ELECTRICALC INERTIA OF THE ILS RECEIVER ON THE CDI. THIS EFFECT IS EQUIVALENTC TO A SIMPLE R-C LOW PASS FILTER. THE VARIABLE TAU IS THE TIMEC CONSTANT OF THE EFFECTIVE FILTER. A TYPICAL VALUE IS o4 SECONDS.C THE INPUT TAPE IS ON UNIT 11, THE OUTPUT ON UNIT 12.CC
DIMENSION XY(10)9DEF(501)9MEMO(14)LOGICAL FOFDATA ILPL/4HDYNMIDATA TA(U/Q*4/IF(EOFfli)) GO TO 4
1 1T=O)DELC=C.
2 READ(1191000) MEMOXYIDtNCoICFWRITE(6,1003) MEMO.XYIDoNCPICFDEFK=ABS(XY(9) /XY(5)/TAU)TR=IFIX(XY( 10)+*1)READ( 11,1001) (DEFC J)tJllIR)1Ff IT .EQ. 0) CEF2=DEF(1)IT=lDO 3 I11IRCEF2=CEF2+DELCDELC=( DEFf I)-CEF21 *DEFK
3 DEF(I)=CEF2MEMOf 13) uILBLWRITE(1291000) MEMOXY9IONCPICFWRITE(1291001) (DEF(I),Iz1,IR)IF(JD .GT. 13) GO TO 1IF( ID .EQ9 0) GO TO 1GO TO 2
4 REWIND 11END FILE 12REWIND 12CALL XIYT
1000 FORMAT(13A6,A2,/,1X,7FiS.99,/,3F18.91O,1OX,2I10)1001 FORMAT(7E15.8)1003 FORMAT( 1X.13A6.A2./,lX,7Fl899/,3Fl8.9,IlO~lOo.2110)
STOP.END
66
411
APPENDIX C
ILSPLT PLOTTING ROUTINE
67
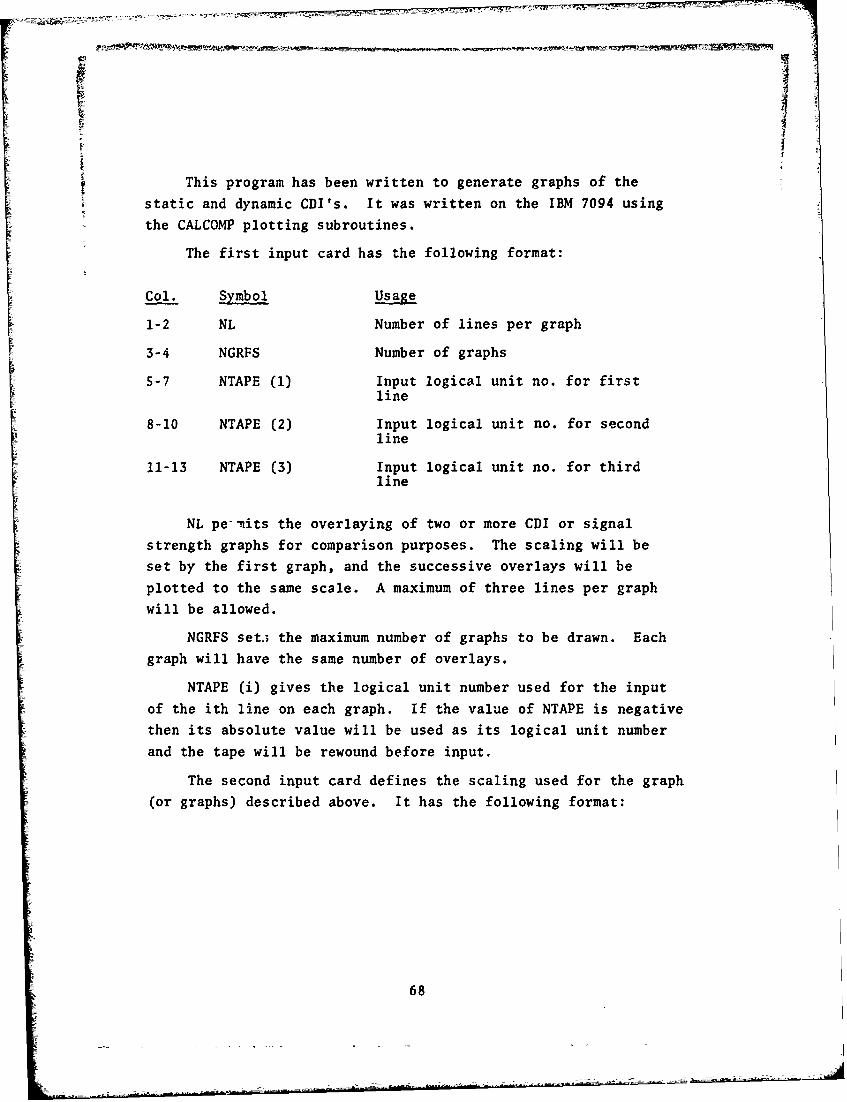
This program has been written to generate graphs of the
static and dynamic CDI's. It was written on the IBM 7094 using
the CALCOMP plotting subroutines.
The first input card has the following format:
Col. Symbol Usage
1-2 NL Number of lines per graph
3-4 NGRFS Number of graphs
5-7 NTAPE (1) Input logical unit no. for firstline
8-10 NTAPE (2) Input logical unit no. for secondline
11-13 NTAPE (3) Input logical unit no. for thirdline
NL pe'-nits the overlaying of two or more CDI or signal
strength graphs for comparison purposes. The scaling will be
set by the first graph, and the successive overlays will be
plotted to the same scale. A maximum of three lines per graph
will be allowed.
NGRFS set.; the maximum number of graphs to be drawn. Each
graph will have the same number of overlays.
NTAPE (i) gives the logical unit number used for the input
of the ith line on each graph. If the value of NTAPE is negative
then its absolute value will be used as its logical unit number
and the tape will be rewound before input,
The second input card defines the scaling used for the graph
(or graphs) described above. It has the following format:
68
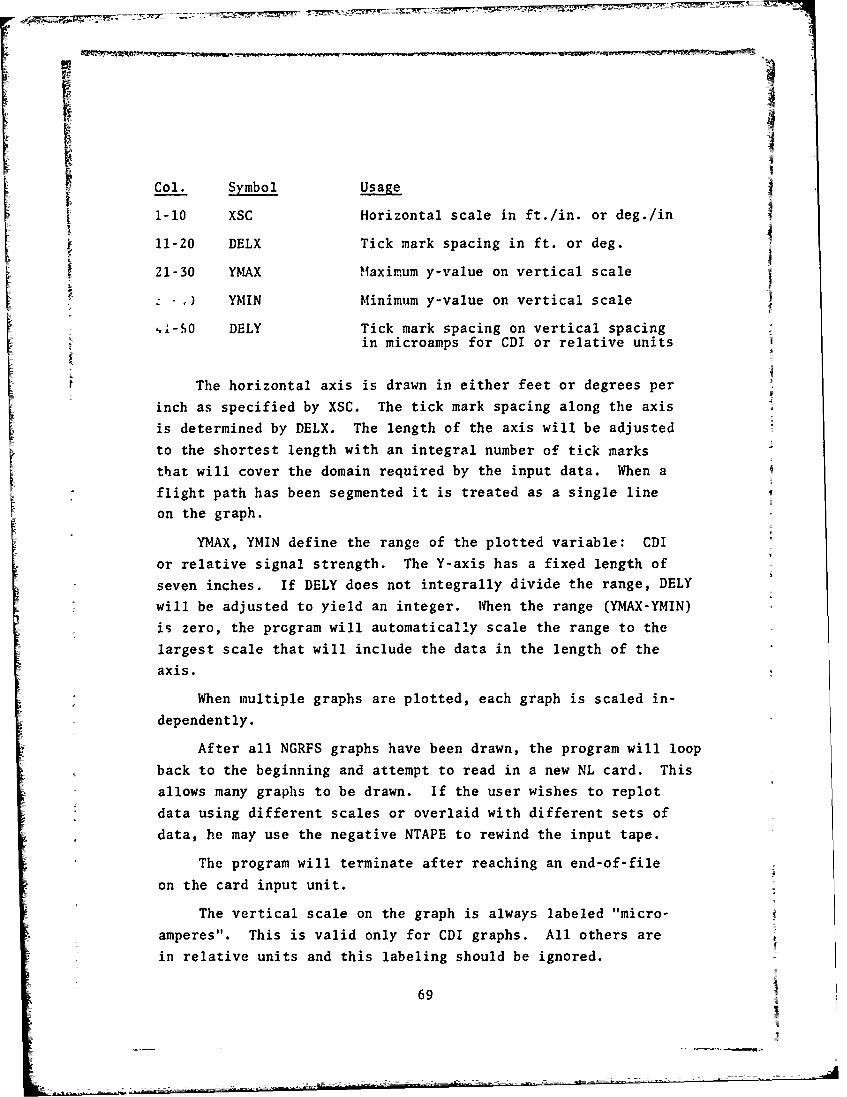
'I
Col. Symbol Usage
F 1-10 XSC Horizontal scale in ft./in. or deg./in
11-20 DELX Tick mark spacing in ft. or deg.
21-30 YMAX Maximum y-value on vertical scale
* .) YMIN Minimum y-value on vertical scale
.'l-S0 DELY Tick mark spacing on vertical spacingin microamps for CDI or relative units
The horizontal axis is drawn in either feet or degrees per
inch as specified by XSC. The tick mark spacing along the axis
is determined by DELX. The length of the axis will be adjusted
to the shortest length with an integral number of tick marks
that will cover the domain required by the input data. When a
flight path has been segmented it is treated as a single line
on the graph.
YMAX, YMIN define the range of the plotted variable: CDI
or relative signal strength. The Y-axis has a fixed length of
seven inches. If DELY does not integrally divide the range, DELY
will be adjusted to yield an integer. When the range (YMAX-YMIN)
is zero, the program will automatically scale the range to the
largest scale that will include the data in the length of the
axis.
When multiple graphs are plotted, each graph is scaled in-
dependently.
After all NGRFS graphs have been drawn, the program will loop
back to the beginning and attempt to read in a new NL card. This
allows many graphs to be drawn. If the user wishes to replot
data using different scales or overlaid with different sets of
data, he may use the negative NTAPE to rewind the input tape.
The program will terminate after reaching an end-of-file
on the card input unit.
The vertical scale on the graph is always labeled "micro-
amperes". This is valid only for CDI graphs. All others are
in relative units and this labeling should be ignored.
69

MAIN4 - FN SOURCE STATEMENT - FN(S)-041
COMMCNTEST/XMINOXRtNTOTNPLOGICAL EOFDIMENSICN 1301I1000)ni4ENSICN NTAPE(3),'4EMO(14)tMf14)
CCt4MCN /PDF/ CF(2000)tXLFNNSTEPSIDEF,IDENT,DX(10,tNPTS(10)CJMON /PRINT/ HLtXSCDELXYMAXqYMINvOELYIC-CALL PLOTS( IBUF, 1000)CALL FLCT(fl.0t-12.t-3)CALL FACTOR (0.4)!LBL-l
60 CONTINUEIF(EOF15)) GO TO 55RFAD(5,100) NL*NGRFSNTAPEWRITE(6tl0'J NLNGRFStNTAPEF IF(IiGRFS*LE.C) NGRFS=3
100 FOR'4D7(212,313DO 40i IsI,NLIF(NTAPF(I).GE.O) GO TO 401NTAPE( I)a-NTAPE( I)NU=NTAPE( I)R.ZWIND NU
401 C34TINUEREAD(5,1G1) XSCOELXtYI4AXtYMINtOELYWRITE(69101) XSCt0ELXipYMAXtYI1NqDELY
101 FORMAT(8F10).0)TEMP-AMINI (YAK NYtAX)Y'AXAMAX1 CYMIN, YMAX)Y MI NwTEMFPTEMP=YI'AX-YMINIF(TEMP .NE. 0.) DELY=TEMPI(FLOAT(IFIX(TE4P/DELY..5)))
NPLT aINP xI =1NI = LNTOT z0
10 NU =NTAPE(NP)IF(EOF(hU)i GO TO 50READ(NU#500) M#XO9OXRtXYZDtIOEFtIDENTtICFIF(ICF .NE. 0) IC~wlWRITE(6#6001 MEMOXODXRXYIOIDEFIOENTICFIF(ILBL .NE. I? GO TO TOILBL=OCALL SYMBOL(0.,O*9.14,MEM0990*980)CALL PLOT(3.90.,-3)
T0 CONTINUEIR =TFIXI XYG.1)NT3T - NTOT + IRIF(I.EQ.1) XMIN a XO
500 FORAIATM1AE,A2t/t/,3F18.9#41101600 FORtMAT(2X, 13A6,A2,/,3F18.9'.I 10
501 FCAMATUEI5*8)502 FORMAT( lX,7E15.81
REAO(NU95O1)(DFlJ )tJ-NlNTtb.)WRITE(6,502) IOFIJhtJuN1,NTCT)
70.
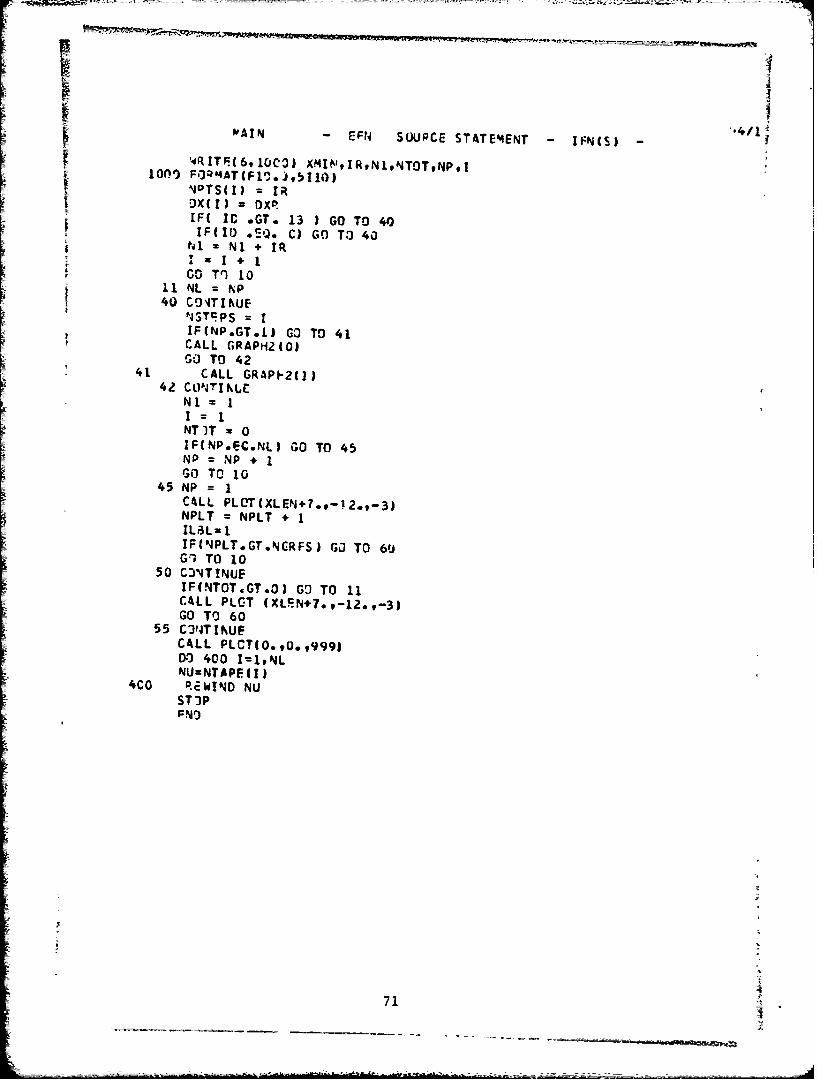
'VAN -EFN SL)UPCE STATE4ENT IFN(S)-WRITF(6910CO) XMU~leIRtN1,NTOT,NPvI
£ 1001) F0QM'AT(Fl-.),5I~I))'JOTS(l) I R)X (I) = O~XqIF( IC .GT. 13 J GO TO 40I FU 10 Q C) GO TO 40
Ni+ IR
GO T9 1011 NL = NP40 CO'ITIKtJE
P'43TCPS = IIF(NP.GT.1) GO3 TO 4.1CALL GRAPH2(0)GO. TO 42
41 CALL GRAPI-2(l)F42 CLP4TIKA:
K- NT)? 0IF(NP.EC.NLI GO TO 45NP = NP + 1GO TO 10
45 NP=C4LL PLOT(XLErj+?.9-12*.
3)NPLT = NPLT + IILt3L= IIF(NPLT.GT.NCRFS) GO TO 69iG~I TO 10
50 C3'lT!NUEIF(NTOT.GT.0) G9 TO 11CALL PLCT (XLEN+7.v-1z.,t3)GO TO 60
55 C)'JTI NUECALL PICTIO. .0. .9991DO 400 Z1x,NLNU=NTAPE~l)
4C0 REWIND NUST )P
71

04/1SUBi I EFN SOURfCE STATEMENT -IFN(S -
S'JOPCtLTINE GRAPH2(ITL)D14 ENSICN XLASM4CQMMON/TEST/X0,flFLTAXNOELTA ,NPDATA XLAO/24*.OISTANCEtFT. DEGREESDIMENSICN TYPE(31DIMENSION X(31,NC(3)CcY4MCN /POF/ GF(200),9XLENNSTEPSIOEFIOENT,DX(IO),NPTS(lO)C04MCN /PRIKTI NL,XSCDELX,YPAX,YAINtDELYtICFDATA X /-5,#5.t,/DATA KC /1,5,4/IF(ITL .NE* C) GO TO IELX=DELXlr(DELTAX.LT.O.) ELX a -ABS(OELX)'RANGE=0.
D3 11 11NSTEPS11 RANGE=RANGE.FLOAT(NPTS(l) )*CX( I)
TIXmIFIX(RANGE/ELX+.9)7 XLFN = AOS(ELX/XSC*OTIX)
IF(XLEN .GT. 40.) GO TO 9IF(XLEN .GT. 5.) GO TO 6
9 XSC-AeS(RA4GE/20.1XLE4=ABS (ELX/XSC*T1XJWRITF(6,8) xSC
8 Ft3RMAT(25H AxIS OUT OF RANGE SCALEw,El2,5,8H FT./IN. /J6 COAJTINUFX14AXTIX*LcX0XXMIN = AtINJ(XO,XMAX)X'4AX = AIJAX1(X0,XMAX)ND =2PW4R a 0.CALL PLCT(O.,.5,-31AMIN-YPINA'IAX-YPAXIF(Yt4AX .EQ. YMIN) CALL SCLAX(?.PDFNOELTAAMAXAMINDELYNDPWR)CALL AXIS3 (E.PO,,AMAXAINELY7.12HMTCPOAMPERES12NDPWIROELN)YSC = DEINIXLAS-2*ICF+lIKSC=-1IF(ABS(CLX) *LT. 10.) IXSC-ICALL AXIS3 IO.,O.XMIAXtXMINELX,.XLENXLAB(IXLAS),LZ ,IXSCI0.* ,OELN)XSC a DL4XT =XLEN/2. - 2.IF(AMIN*AM4AX.GT.O.) GO TO 2IF( AMIN .EQ. 0.) GO TO 2LERO= (0.-AMIN1 I.**PWR) /YSCCALL PLOT (O.9lER093)CALL PLCT(XLEN*ZERO,2)
2 CONTINUEI CONTINUE
XIO0.IF(DELTAX .LT. 0.) X!-XMAX-XMI'4Jul0) 5 I-104STEPSDELTAX z XT
72

04/1
NX=%4PT SC!)IF(I .LT. NSTrPS) -*X=NX41YM=AFJ/10.**PWR
CALL XCLI~4(XI,DELTAXDF(J),NX,0.,XSC,YM,YSCNC(NP))
IJJNPTS (I)'I=XCXtC(I )*FLCtT(NPTS(l1))5 COATI NUF
END
73

SUB3 -EFN SOUPCE STATEMENT -IFN(S) 04/
SLJRROLTINE XCLINE(XIOXYNtX~',OELEYMODELYNC)DIM4ENSION Y( 1) IPEN(4)PEAL L(494)#LL(4J
DATA IPEN/2#3*2t3/
x XI2 IC =NC -I
xPI = (X-XCM)/DELXYPJ=(Y(l)-Y4)/DELY
CA0 D FXPC-XPI@YI3
IF(I.G.LL(GO TO T100
GF(ICTO 4 1 Cz
xPI (X-XM)/DELXYPlw (Y(2I)-YM4)/OErLY
5CALL PLCTIXP29YPI2)lE()
REITURN EUR
x- -x +-o

SCLX -F.Fi SO&JRCE STATEMENT -IFN( S)-
S!F;3r--UTNeF- S''LXA*C#A*YPA*MN0L$tD
CAXLEN =AIKCHVMAX z vhkt1)
09 40 1=29NV'4AX - AMAX1(VAAAX#VAl(I))
4L VIIN = Av!Nl(VF-tNNVAkIJN= C
NE =0
TITAL = VhIAX - V4IINC DETER~MINE EXPONENT AND INCREMJENT/INC14
V4I = AMAX1(ABS(VMX)qARS(V4IN))= Ir-(VM4AX*VMIIVI 6,5,7
7 VAV - ARS(VMEX4VMIN)/2.DELTA =T:JT4Lft.XLEI%!F-(Tn'TtL.GT.0..ANO.TCTAL/V'4,LT..75) GC TO 4IF(VMAX*EI.V4) VMII=0.1F(VPrN.FJ-V') VMAX=OoGfl Til 5
6 AXIEN =AXLEN*V4/TOTAL5 DELTA =Vv/4XLEN
VAV aV'417.C TEST FOR VAV BETWFEN .01 AND 11)01.
4 IF(VAV.L.1E-11) GC TO 21IF(VAV - .01) 3,10,1
41 !F(VAV - 1.) 391'ZPIOI IF(VAV - 1O3 ;.) 1092t2
C VAV GE 1CCC.2 IF(NE.FC.al V4kV = VM
= VAV 0 V#1i1030.NE NE - 3
G.1 TO 1C VAV LT 1.
3 VAV =VAV*10Z#OoNE =NE + 3r,3 TO 41
C DETERMIINE DECIMAL PLACES IN DELTAIC IF(OELTA.LT.VwfI.E4) GO TO 21
D)ELTA a DELTAO10.**NF11 IF(DELTA - 1.) 12919t1312 D LT* = CtfLTA*10.
NO a ND + IGO TO 11
13 IFtOELTA - 10.) 1598,1414 DELTA = OLTA/1C.
NO0 a NO IGO TC13
C DELTt NO%~ BETWEEN I AND 1015 IF(DELTA -5.) 161l7t1?16 !F(DOLTA - .) 1,18,18l
GO TC 20
7S

SCLX -EFN SOURCE STATEMENT -IFNIS)-
1a3 DELTA - 2./10.**(ND4NE)
GO TO 208 NJ) aNO - 1
19 OELTA - ./10.**INDNE)C RESET VMIN (FIRSTV) FOq AXIS
20 AK( VMIN1/OELTA + .01K z(IFIX(AK)/M)*04
IF(VOIN.LT.0.) KwK-MV041N - ELTA*FLOAT(K)NOIV - MYAX - VKII/),ELTA +.9IF(PLOAT(P4OIV).GT.AINCH*2.1 DELTAsDELTA*AIIAX1(2.,FLOATP4)/2.)IF(NO.LEO0) ND4- -1
21 EKp = NFwqI1'E(6910O2) VRAXVI'INDELTANDNERETURN
1002Z r-3R4AT(1W~,3El3.3*317If)
76

^4/1AX3 -EF4 SOUPCE STATFMFNT -IFN(S)
SJ64fJUTIPJr: AXI 53( X0,YOeVMAXVUINOELVAINCH,8CONC~.NOECtPWkVSC)F4SCT(?R = lfl.*'PWP.
AMN= VHiK*FACTJR
DtX=AeS(CELV)*FACTOR
NEXP zE NCN:IABS(NCRI
IF(P.NE.J.*3* NEXP 6cqCt*=ACsAI (A INCH)IF((VDIAX-V'411)/A4AX(VM4AX,-VMINdj.LT.1.E-6) GO TC 50IF((Ab1AX-0b41N)/(0FLX+1.F-8).GT8 3*Cl4iCH) OlrLX = (A!14AX-A'IN)/CJCHIF(DELX.GT.AwdAX-4MIN) DELX A14AX AM4INIF(NZR.LT.01 W3 = 1.fV914z (A4AX-AMtI')/nELX*1.9ANCZCINCN/FLCAT (tUI@-1)IF(AINCH.LT.C.)GC T') 5IdZzl.GI3 T-1 10
5 udl~l.13 CALL FLCTIX3,YO93)
VSC =DELX/FAC!C;R/ANCASP~4"AMN-DELX
Y=3.X:4=03.OFF = 0on, 40 11,MPA4JM=ANJ14.DELX11-3
25 IF(ABSfAKUM)/10.**IJLT.1.IGO TO 2011-11+1Gn TC 25
20 IF(ANUP'.LT.C.)!I=1141
I 3ROXNCEC.1
IFIIFIX(wl)*[.EQ.11 HT -AMIN1(HT ,ANC/FLOAT(I1.2))14L = APAXl(.12,1.2*WlJC!:TEP =FLCAT(111*N4T/tl.eWl)XC = X CFNTER - W2*.15IF(XC.LT.AI') A4 = CIF(wdZ*wE3*GT.C.) XC =.15IF(AqS(XC).GT.A!3SX4)j XK4 = XCYC - - 41*(HT +.15 - %43*(tlT..3)) - W?*OFFCALL PL071(%'#X*YOGY92*CALL PLOT(X)*X4.l*v#2,YO+Y+.1'wl*3)CALL PLTX+-.*~tOY-*I2CALL NUb '~q(XOtXCtv0.VC.HT,ANw4,O.,NOEC)CALL FLCT(XO.X,YO#Y,3)X=X. A%'Coki
77
04/1AX3 -EFN SOURCE STATEMENT -IFN(S)-
Y=Y4ANC*W2qC CONTINUE
AST (CINCH -FLOAT(NCH+NEXP)*HLI/2.
IF-- -1.1. XM = -XM- "(XO + BST) + W2*(XO +Xl* - OFF + W3*(2.*OFF.HL)i
'-(YO + YC - 1.5*HL + W3*(HT + 2.*IIL)l + WZ*(YO+RST)- -JfL(XXCtYYCtHLBCD,90.*W2,NCH)
.,.EQ.O.) RETURNCALL SYM8qCL(999.t999.,I4Lt5H * IC99C.*W2951
X = 99o +(XXC-*66%*HL-999.)*W2Y 59. + (YYC+o66*HL-999.)*WlCALL NUMqER(XtYt.75*HLtPWR,90.*W2,-1J[ RETURN
5C VSC = (VMAX-VMIN41*E-6/FACYCR)/CINCHWRITE(6, 1000)
1000 FnRMAMH1t027HINSUFFICIENT RANGE FOR AXISRETURNEND0
78

[ 4
ii
I- II)
I1; +11
ILzr
o ~~. ~
=t.
C
-CuF'ca a-
o -~u ~
*~: U:' 3- 3 3
C - -
iqild ~n sr a N2 #e m.8,a S S S ~
79IL - -- ~~-~ ~-

rn r
04(80

Cr-
I
InI
gaa
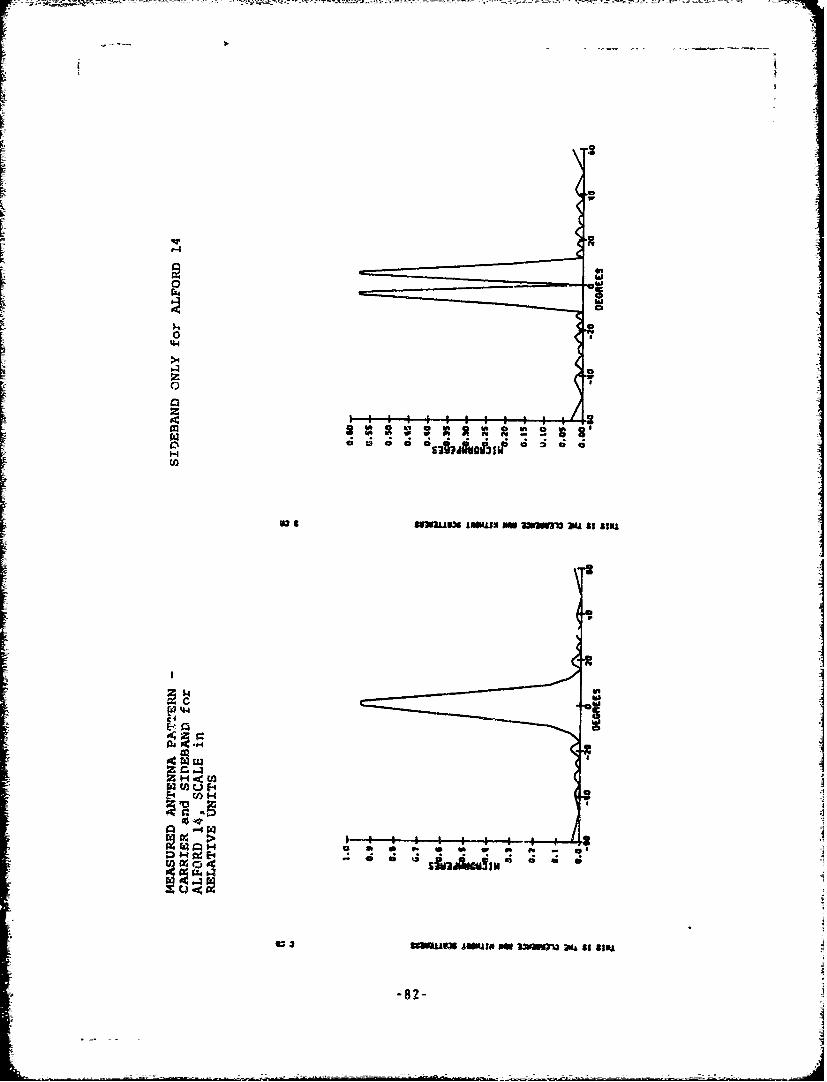
w
rzd
a' -R ~0 0
o a a 0
-82-

0.30 c:>
En W~ H a C0.25..t
~
0.20- cfl2n
Ic >IL rri
0.00 0I
t-IIt- m tI>3 ti
0.1 000DEGEE
*1n
V12w-01
U 20
-83-_j

4U0
E-4
rza
rid
razE-H
0
H
U,
se l xUua zlLaw ZHo S
"-84
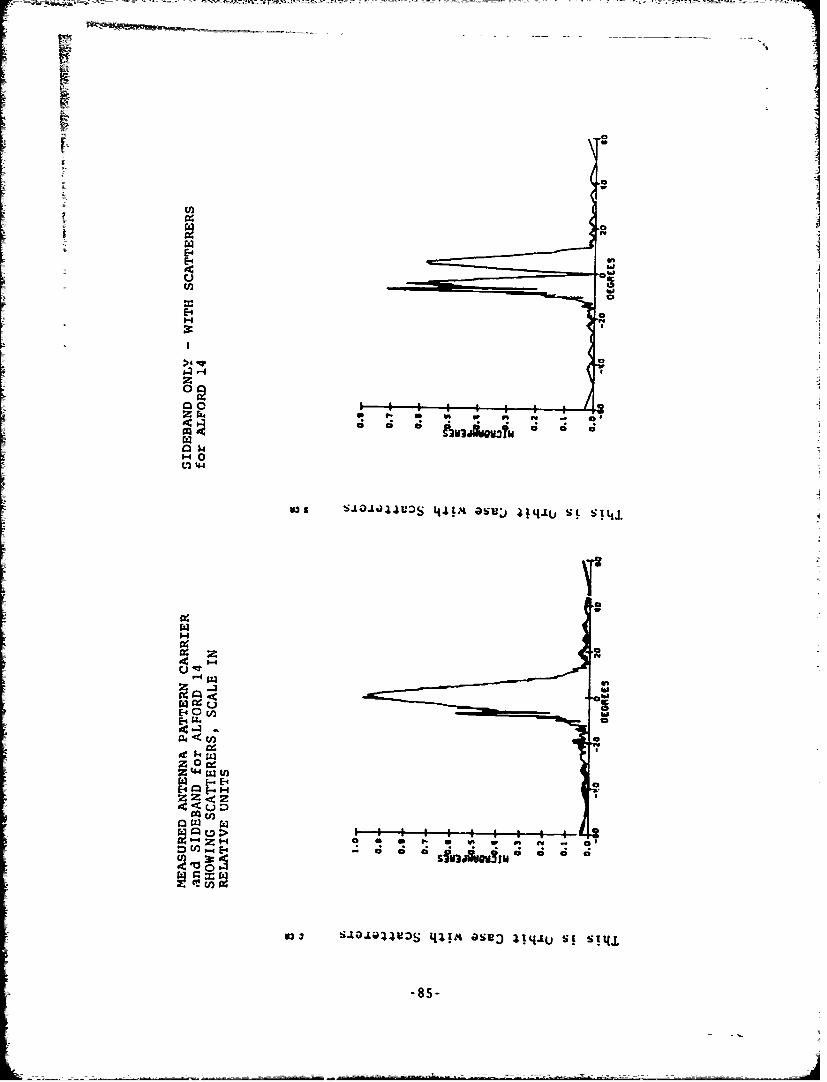
a
>4
z
'-0
V)44
-Iw
E-4 0 C
z 0Oce
Z H . a wCP-4 -4 C C;C; C a
t44 c zinimn
-85-

43-
E-I
E-41
W 0
E-4 4 OU
0.4 0
E4 %D H
r4 H