i m er s Dis a Swart et al, Alzheimers is Parkinsonism 21, : h ... blot (WB) and immunofluorescence...
8
Volume 7 Issue 4 • 1000337 J Alzheimers Dis Parkinsonism, an open access journal ISSN: 2161-0460 Open Access Research Article Swart et al., J Alzheimers Dis Parkinsonism 2017, 7:4 DOI: 10.4172/2161-0460.1000337 Journal of Alzheimer’s Disease & Parkinsonism J o u r n a l o f A l z h e i m e r s D i s e a s e & P a r k i n s o n i s m ISSN: 2161-0460 *Corresponding author: Chrisna Swart, Faculty of Science, Department of Physiological Sciences, Stellenbosch University, Cape Town, South Africa, Tel: +27 21 808 3151; Fax: +27 21 808 3145; E-mail: [email protected] Received June 01, 2017; Accepted June 13, 2017; Published June 20, 2017 Citation: Swart C, Khoza A, Khan K, Roux SL, du Plessis A, et al. (2017) Investigating Basal Autophagic Activity in Brain Regions Associated with Neurodegeneration using In Vivo and Ex Vivo Models. J Alzheimers Dis Parkinsonism 7: 337. doi: 10.4172/2161-0460.1000337 Copyright: © 2017 Swart C, et al. This is an open-access article distributed under the terms of the Creative Commons Attribution License, which permits unrestricted use, distribution, and reproduction in any medium, provided the original author and source are credited. Keywords: Neurodegeneration; Autophagy; Alzheimer's disease; Parkinson's disease; Hippocampus; Cerebellum Introduction Improved medicinal care has led to a profound increase in the aging population and along with it, the prevalence of age-related neurological decline. Statistics indicate an estimated 75.6 million individuals suffering from Alzheimer's disease (AD) by 2030 (Prevalence of dementia; alzheimers.org.za). Diseases such as AD and Parkinson's disease (PD) present a great burden, both socially and economically and although progress has been made in dissecting the molecular underpinnings, the exact aetiology remains in contention. Key pathological hallmarks are shared amongst most neurodegenerative diseases and include aggregation of misfolded proteins and mitochondrial dysfunction leading to oxidative stress [1,2]. Furthermore, it remains unclear is why certain brain regions are more susceptible to proteotoxicity and neuronal degradation, such as the hippocampal regions in AD and the midbrain in PD, while others are largely spared in decline, or at least, initially spared in disease, such as cerebellar regions. Macroautophagy (hereaſter referred to as autophagy) represents the main cellular catabolic route through which eukaryotic cells degrade misfolded proteins and impaired cytoplasmic organelles [3,4]. rough selective lysosomal degradation, autophagy is essential for neuronal homeostasis [5,6] and has become an attractive target to treat neurodegenerative disorders [7]. e emerging theory indicates that autophagy plays a dual role in neurodegeneration causing a downstream effect by promoting degradation and an upstream effect where the deregulation thereof disrupts proteostasis, leading to protein aggregation and toxicity. Autophagy is a highly dynamic process regulated at multiple steps and defects in autophagic flux have been linked to a number of different human disorders [8]. Here, we speculate that increased sensitivity to variations in autophagic flux may render certain brain regions more prone to protein aggregation and subsequent cellular decline than others [9]. Certain neuronal cell types may be less able to compensate for (even subtle) imbalances in the autophagic process/protein turnover, possibly lacking fully functional compensatory mechanisms to shiſt the protein balance back before aggregated proteins are able to exert intracellular toxic effects [10]. erefore, exact and well quantifiable measurements [11] and comparison of autophagic activity variations in different neural tissues is required, as it may advance our understanding of the correlation between autophagy, proteotoxicity, Abstract Objective: Autophagic maintenance of protein turnover for neuronal homeostasis is of critical importance. Although autophagy dysfunction contributes to neurodegenerative pathology, it remains unclear why certain brain regions are initially targeted compared to others. In Alzheimer's disease, the hippocampus appears to be most severely and initially affected compared to regions such as the cerebellum, which seem to be spared initially and are only targeted during later stages of neurodegeneration. Here we hypothesize that brain-region specific variations in basal autophagic activity may underlie sensitivity to proteotoxicity and contribute towards pathology. We investigated the abundance of key autophagic markers in different regions of the mouse brain to determine whether variations in basal autophagic activity may underlie brain-region susceptibility to neurodegeneration. Methods: Autophagic lysosomal degradation was inhibited using chloroquine in vivo and bafilomycin ex vivo. We investigated the accumulation of LC3-II and p62 protein levels in different regions of the mouse brain following inhibition using western blot analysis, immunofluorescence and micro-computed tomography imaging techniques. Results: Results indicate clear and robust variation of autophagic marker abundance between different regions of the mouse brain, both in our in vivo and ex vivo models. Increased protein levels were particularly observed in the cerebellum compared to the hippocampus region, suggesting distinct and region specific changes in autophagic activity. Conclusion: Functional specificity and metabolic demands of different brain regions may translate into differential autophagic activities, which may vary from one region to the next. Here we report regional variations of key autophagic markers between different regions of the mouse brain when autophagosome degradation was inhibited. These findings indicate enhanced basal autophagic activity in the cerebellum compared to the hippocampus. We therefore conclude that enhanced basal autophagic activity may render certain brain regions better equipped to deal with imbalances in protein degradation and that lower levels of basal autophagic activity may underlie regional susceptibility towards pathological decline. Investigating Basal Autophagic Activity in Brain Regions Associated with Neurodegeneration using In Vivo and Ex Vivo Models Chrisna Swart 1 *, Akile Khoza 1 , Khaalid Khan 1 , Stephan Le Roux 2 , Anton du Plessis 2 and Ben Loos 1 * 1 Department of Physiological Sciences, Stellenbosch University, Cape Town, South Africa 2 Central Analytical Facility, Computed Tomography Unit, Stellenbosch University, Cape Town, South Africa
Transcript of i m er s Dis a Swart et al, Alzheimers is Parkinsonism 21, : h ... blot (WB) and immunofluorescence...

Volume 7 Issue 4 • 1000337J Alzheimers Dis Parkinsonism, an open access journalISSN: 2161-0460
Open AccessResearch Article
Swart et al., J Alzheimers Dis Parkinsonism 2017, 7:4DOI: 10.4172/2161-0460.1000337Journal of
Alzheimer’s Disease & ParkinsonismJour
nal o
f Alzh
eimers Disease &
Parkinsonism
ISSN: 2161-0460
*Corresponding author: Chrisna Swart, Faculty of Science, Department ofPhysiological Sciences, Stellenbosch University, Cape Town, South Africa, Tel: +27 21 808 3151; Fax: +27 21 808 3145; E-mail: [email protected]
Received June 01, 2017; Accepted June 13, 2017; Published June 20, 2017
Citation: Swart C, Khoza A, Khan K, Roux SL, du Plessis A, et al. (2017) Investigating Basal Autophagic Activity in Brain Regions Associated with Neurodegeneration using In Vivo and Ex Vivo Models. J Alzheimers Dis Parkinsonism 7: 337. doi: 10.4172/2161-0460.1000337
Copyright: © 2017 Swart C, et al. This is an open-access article distributed under the terms of the Creative Commons Attribution License, which permits unrestricted use, distribution, and reproduction in any medium, provided the original author and source are credited.
Keywords: Neurodegeneration; Autophagy; Alzheimer's disease;Parkinson's disease; Hippocampus; Cerebellum
IntroductionImproved medicinal care has led to a profound increase in the aging
population and along with it, the prevalence of age-related neurological decline. Statistics indicate an estimated 75.6 million individuals suffering from Alzheimer's disease (AD) by 2030 (Prevalence of dementia; alzheimers.org.za). Diseases such as AD and Parkinson's disease (PD) present a great burden, both socially and economically and although progress has been made in dissecting the molecular underpinnings, the exact aetiology remains in contention. Key pathological hallmarks are shared amongst most neurodegenerative diseases and include aggregation of misfolded proteins and mitochondrial dysfunction leading to oxidative stress [1,2]. Furthermore, it remains unclear is why certain brain regions are more susceptible to proteotoxicity and neuronal degradation, such as the hippocampal regions in AD and the midbrain in PD, while others are largely spared in decline, or at least, initially spared in disease, such as cerebellar regions. Macroautophagy (hereafter referred to as autophagy) represents the main cellular catabolic route through which eukaryotic cells degrade misfolded proteins and impaired cytoplasmic organelles [3,4]. Through selective lysosomal degradation, autophagy is essential for neuronal homeostasis [5,6] and has become an attractive target to treat neurodegenerative disorders [7].
The emerging theory indicates that autophagy plays a dual role in neurodegeneration causing a downstream effect by promoting
degradation and an upstream effect where the deregulation thereof disrupts proteostasis, leading to protein aggregation and toxicity. Autophagy is a highly dynamic process regulated at multiple steps and defects in autophagic flux have been linked to a number of different human disorders [8]. Here, we speculate that increased sensitivity to variations in autophagic flux may render certain brain regions more prone to protein aggregation and subsequent cellular decline than others [9]. Certain neuronal cell types may be less able to compensate for (even subtle) imbalances in the autophagic process/protein turnover, possibly lacking fully functional compensatory mechanisms to shift the protein balance back before aggregated proteins are able to exert intracellular toxic effects [10]. Therefore, exact and well quantifiable measurements [11] and comparison of autophagic activity variations in different neural tissues is required, as it may advance our understanding of the correlation between autophagy, proteotoxicity,
AbstractObjective: Autophagic maintenance of protein turnover for neuronal homeostasis is of critical importance.
Although autophagy dysfunction contributes to neurodegenerative pathology, it remains unclear why certain brain regions are initially targeted compared to others. In Alzheimer's disease, the hippocampus appears to be most severely and initially affected compared to regions such as the cerebellum, which seem to be spared initially and are only targeted during later stages of neurodegeneration. Here we hypothesize that brain-region specific variations in basal autophagic activity may underlie sensitivity to proteotoxicity and contribute towards pathology. We investigated the abundance of key autophagic markers in different regions of the mouse brain to determine whether variations in basal autophagic activity may underlie brain-region susceptibility to neurodegeneration.
Methods: Autophagic lysosomal degradation was inhibited using chloroquine in vivo and bafilomycin ex vivo. We investigated the accumulation of LC3-II and p62 protein levels in different regions of the mouse brain following inhibition using western blot analysis, immunofluorescence and micro-computed tomography imaging techniques.
Results: Results indicate clear and robust variation of autophagic marker abundance between different regions of the mouse brain, both in our in vivo and ex vivo models. Increased protein levels were particularly observed in the cerebellum compared to the hippocampus region, suggesting distinct and region specific changes in autophagic activity.
Conclusion: Functional specificity and metabolic demands of different brain regions may translate into differential autophagic activities, which may vary from one region to the next. Here we report regional variations of key autophagic markers between different regions of the mouse brain when autophagosome degradation was inhibited. These findings indicate enhanced basal autophagic activity in the cerebellum compared to the hippocampus. We therefore conclude that enhanced basal autophagic activity may render certain brain regions better equipped to deal with imbalances in protein degradation and that lower levels of basal autophagic activity may underlie regional susceptibility towards pathological decline.
Investigating Basal Autophagic Activity in Brain Regions Associated with Neurodegeneration using In Vivo and Ex Vivo ModelsChrisna Swart1*, Akile Khoza1, Khaalid Khan1, Stephan Le Roux2, Anton du Plessis2 and Ben Loos1*1Department of Physiological Sciences, Stellenbosch University, Cape Town, South Africa2Central Analytical Facility, Computed Tomography Unit, Stellenbosch University, Cape Town, South Africa

Citation: Swart C, Khoza A, Khan K, Roux SL, du Plessis A, et al. (2017) Investigating Basal Autophagic Activity in Brain Regions Associated with Neurodegeneration using In Vivo and Ex Vivo Models. J Alzheimers Dis Parkinsonism 7: 337. doi: 10.4172/2161-0460.1000337
Page 2 of 8
Volume 7 Issue 4 • 1000337J Alzheimers Dis Parkinsonism, an open access journalISSN: 2161-0460
disruption in proteostasis and neurodegeneration and may provide better means of not only controlling, but ideally preventing or halting disease progression.
The two main methods currently utilized for monitoring autophagic flux are assays based on LC3 turnover and p62 degradation. The microtubule-associated protein 1 light chain 3 (MAP1-LC3/Atg8/LC3) is specifically cleaved at the C terminus to LC3-I, which in turn is conjugated to form LC3-II [12]. Given that LC3-II is recruited to the autophagosomal membrane and hence correlates with the number of autophagosomes, the level of LC3-II is widely used as a marker for monitoring the autophagic process [13]. Through the application of lysosomal deacidifying agents (such as chloroquine) or specific inhibitors (such as bafilomycin A1) and autophagy inducers (such as rapamycin) autophagic flux can be detected by assessing LC3-II turnover, hence the blocking and inducing of LC3-II degradation will affect cellular levels thereof which can be monitored [14]. P62, also known as SQSTM1/sequestome 1, serves as a link between LC3 and ubiquitinated substrates and is efficiently degraded via autophagy [15]. Therefore, the level of p62 proteins can also be used to monitor autophagic flux, where autophagic suppression correlates with increased levels of p62 and autophagic activation is associated with decreased levels of p62 [16].
In this study, abundance and distribution of LC3-II and p62 were analysed in different regions of the mouse brain using a unique micro-computed tomography (micro-CT) approach, along with western blot (WB) and immunofluorescence (IF) techniques. Specific focus was given to regions that are initially and mostly, targeted by neurodegeneration [17-19], such as the olfactory bulb, cortex, hippocampus and the midbrain. The cerebellum was also included as a region that seems initially protected against neurological decline for comparison. The results presented here indicate regional variations in key markers of autophagy under basal conditions, revealed by assessing basal autophagic activity. In vivo and ex vivo inhibition of end-stage autophagy, i.e., lysosomal degradation, using chloroquine (CQ) treatment and bafilomycin A1 (BAF), respectively, resulted in minimal responses of marker variation in the hippocampus, compared to robust responses in the cerebellum. The results suggest that highly susceptible brain regions contain lower autophagic activity at basal levels compared to other regions and therefore may be less able to maintain sufficient proteostasis to compensate for increases in protein accumulation leading to cellular decline. This study represents, to our knowledge, the first of its kind investigating brain-region specific basal autophagic activity, a potential underlying factor contributing towards neurological decline associated with protein aggregation and protein dyshomeostasis and may hold promise for the advancement of therapeutic strategies to halt or prevent neurodegenerative disease progression. This may include interventions that allow the fine control of neuronal autophagic flux, so that the clearance of toxic proteinaceous cargo can be aligned with the required region specific autopphagic activity [9].
MethodologyAnimals, treatments and tissue collection
Ethical approval for the study was granted through the Division of Research and Development at Stellenbosch University (SU-ACUD15-00023). Animals were housed at a room temperature (RT) with an approximate humidity of about 50% and a 12 h light/dark cycle. All animals had free access to food and water; no dietary restrictions were required. Animals used were 3-4 months old male BALB/C mice randomly allocated into two treatment groups: control
group vs. chloroquine (CQ)-treated group (n=3 per treatment group) for in vivo treatment for analyses; and control vs. bafilomycin (BAF)-treated group (n=3 per treatment group) for ex vivo analyses. For in vivo treatment application, 100 mg/kg CQ (Sigma) was applied as determined by Haspel et al. [20], versus control (vehicle only; Hank’s Balanced Salt Solution). CQ serves as a deacidification agent; hence it deacidifies lysosomal hydrolase enzymes and thus diminishes their degradative capacity. In vivo treatments were administered for 6 hours prior to sacrifice and sample collection. Following in vivo treatments, animals were sacrificed via cervical dislocation and brain extractions and dissections proceeded. Mouse brains were dissected into regions associated with neurodegeneration (olfactory bulbs, midbrain, cortex, hippocampus) and the cerebellum region. Extracted brain tissue was either snap-frozen in liquid nitrogen and stored at 80°C for western blot analyses, or fixed in 10% formalin for immunohistochemical and fluorescent microscopy analyses of autophagic markers. For ex vivo analyses, animals were first sacrificed via cervical dislocation followed by brain extractions and dissections into regions for interest. Dissected brain regions were treated with 400 nm BAF in Dulbecco's Modified Eagle Medium (DMEM; consisting of 10% fetal bovine serum and 5% penicillin/streptomycin) for 4 h. Following ex vivo treatment, regions were either snap-frozen in liquid nitrogen and stored at 80°C for western blot analyses, or fixed in 10% formalin for immunohistochemical and fluorescent microscopy analyses of autophagic markers. A small subset of samples (n=3/treatment group; controls versus CQ-treated) was subjected to micro-CT analysis using a unique silver-based immunostaining technique.
Whole-mount immunostaining for micro-CT
Immunostaining procedures and micro-CT analyses were adapted from a study by Metscher and Müller [21]. Primary antibody used was rabbit anti-microtubule-associated protein 1A/1B-light chain 3 (LC3-II; Cell Signalling Technology). Treatment groups analysed with this procedure include CQ-treated and control groups. After brain extractions, each mouse brain was fixed for 2-3 h at room temperature (RT) in a glyoxal-based fixative (Shandon Glyo-Fixx, Thermo Scientific). All samples were rinsed in methanol and transferred to 100% methanol for storage at -20°C. For immunological staining, mouse brains were treated with 3% hydrogen peroxide for 30 min to eliminate any endogenous peroxidase activity, followed by rehydration through a series of methanol treatments (75%, 50%, 25%, 10 min each) to MABT (100 mM maleic acid, 150 mM NaCl, 0.1% Triton X-100, pH 7.4). Samples were washed in MABT+0.1% saponin and then blocked for 1 h or more at RT using a blocking solution (MABT with 0.1% saponin, 10% donkey serum, 0.5% Roche Blocking Reagent and 1% dimethylsulfoxide), followed by overnight incubation (or longer) in primary antibody diluted 1:1000 in the same blocking solution. The following day, samples were incubated in blocking solution again, but only briefly, followed by incubation with secondary antibody (goat anti-rabbit IgG HRP conjugate for both primary antibodies used, Invitrogen) diluted at 1:1000 in blocking solution for at least 4 h. Excess antibody was washed out with 5 or more washes with MABT with one wash left overnight at RT. Samples were then post-fixed in 10% formalin in MABT for 20 min at RT followed by 3 wash steps with double distilled water (ddH2O) for 10 min each, then changed to 0.1% Triton X-100 in ddH2O.
Contrasting molecular probes for x-ray imaging
To ensure sufficient x-ray density to conventional whole-mount immunostaining for micro-CT imaging, a metal-conjugated system

Citation: Swart C, Khoza A, Khan K, Roux SL, du Plessis A, et al. (2017) Investigating Basal Autophagic Activity in Brain Regions Associated with Neurodegeneration using In Vivo and Ex Vivo Models. J Alzheimers Dis Parkinsonism 7: 337. doi: 10.4172/2161-0460.1000337
Page 3 of 8
Volume 7 Issue 4 • 1000337J Alzheimers Dis Parkinsonism, an open access journalISSN: 2161-0460
was applied using an “enzyme metallography” kit (Nanoprobes EnzMet 6010 from Nanoprobes Inc. for chromogen reactions. The staining product of the EnzMet kit consists of reduced silver deposited at sites of bound secondary antibody-enzyme conjugate. The patented procedure that exploits the chemical reduction in peroxidase reactions to reduce dissolved silver ions (Ag.) to insoluble metallic silver (Ag0), precipitates in the immediate proximity of the enzyme conjugate. This allows a peroxidase-conjugated secondary antibody to be visualized by applying a metal ion solution (e.g. silver acetate), followed by a reducing agent (e.g. hydroquinone), followed by an electron acceptor (e.g. hydrogen peroxide). For this study, the kit was specifically adapted for use in whole-mount immunostaining [21]. Immuno-labelled samples in 0.1% Triton X-100 was transferred to clean, 1.5 ml tubes for staining. The Triton solution was replaced with 300 ml fresh 0.1% Triton. From the EnzMet kit, 600 ul of solution A was added to each sample and mixed gently for 4 min, then 200ul of solution B was added and mixed for 4min, after which 200 ul of solution C was added and mixed. Samples were incubated at RT for 5-10 min while the staining is monitored under a dissection microscope. As soon as nonspecific precipitation of silver is indicated (solution will begin to appear slightly grey), the samples were changed to 1% sodium thiosulfate in 0.1% Triton for 10 min in order to stop the reaction and remove unreduced silver ions. For post-fixation, the thiosulfate was rinsed out with dH2O for 5 min and samples were changed to 75% methanol followed by 100% methanol.
Micro-CT analysis of extracted mouse brains
Micro-CT was applied to produce 3D images of silver immunostained samples via a metal-based conjugated secondary antibody system in order to analyse and quantify the specific autophagy marker, LC3-II, to be able to assess whether levels of LC3-II differ between different brain areas. Parameters for CT acquisition were adapted from a protocol used by Metscher and Muller [21] and were optimized for application on brain tissue. The high resolution micro-CT scans were performed with a GE Phoenix Nanotom S at the Stellenbosch CT Scanner Facility [22,23]. Each sample was scanned at 3.5 µ resolution at 50 kV and 320 µA the image acquisition timing was 500 ms, averaging 5 and a skip of 1. The data reconstructions were performed with the proprietary Datos Rec software coupled with the CT system and all the data and image analysis was performed with Volume Graphics VGStudio Max 3.0.
Western blot analysis of key autophagic markers of in vivo and ex vivo treatment groups
40ug of proteins from brain samples were separated by 12% SDS-polyacrylamide gel electrophoresis (BioRad Fast Cast Stain Free-gel) at 100-120 V and transferred to a polyvinylidine fluoride membrane (PVDF) (Immobilon-P® Merck Milipore). Membranes were blocked with 5% fat-free milk in Tris buffered Saline-Tween 20 (TBS-T) for 1 h at room temperature (RT) and incubated individually overnight at 4°C with primary antibodies: anti-LC3B rabbit monoclonal antibody (Cell Signaling), anti-SQSTM1/p62 rabbit polyclonal antibody (Abcam) and anti-β-actin rabbit monoclonal antibody (Abcam); at a dilution of 1:1000. After three washes with TBS-T, the membranes were incubated for 1 h at RT with secondary antibody horseradish peroxidase-conjugated anti-rabbit (1:5000; Amersham Life Science). Membranes were developed with Clarity western-enhanced chemiluminescence substrate (Bio-Rad) acquired with Chemi-Doc MP (Bio-Rad) and analyzed using Image Lab software (Bio-Rad) that allows the normalization of specific protein signal with proteins total load, or in comparison with loading control β-actin obtained by fluorescent detection of monodimensional proteome on TGX stain free gels.
Immunofluorescence analysis of brain region structure and key autophagic of in vivo treatment group
Extracted and dissected brain samples were preserved in 10% formalin (in 0.1 M phosphate buffer; pH 7.4) for 48 h after which they were embedded into paraffin wax. Microtomed sections (9 μm thick) were placed to dry on microscope slides followed by a series of deparaffinization and dehydration steps to prepare samples for staining. A subset of sections underwent basic hematoxylin and eosin staining in order to visualize various structural and cellular characteristics unique to each region of interest. Trypsin incubation (0.1%) allowed retrieval of antigen binding sites and the addition of a blocking step (5% donkey serum) prohibited non-specific antigen binding of sections undergoing fluorescent immuno-staining. These sections were incubated overnight at 4°C with primary antibodies (1:200): anti-LC3B rabbit monoclonal antibody (Cell Signaling), anti-SQSTM1/p62 rabbit polyclonal antibody (Abcam). After sufficient washing, sections were incubated with Alexa Fluor®568-linked anti-rabbit antibody (Life Technologies) secondary antibody (1:500) for 45 min at RT in a moist, dark chamber. After secondary antibody incubation and wash steps, sections were counterstained with Hoechst 33342 dye for nuclei visualization. Sections were mounted with Dako fluorescent mounting media (Dako Cytomation). Once dried, sections were ready for fluorescent microscopy imaging using the Olympus CellR system attached to an IX 81 inverted fluorescent microscope equipped with an F-view-II cooled CCD camera (Soft Imaging Systems). Another subset of sections was stained with acridine orange (AO; 1:500; Sigma) in order to visualize acidic compartments within the cell layers of each brain region. AO stains acidic compartments such as lysosomes and stand as an indication of the digestive capabilities (via autophagy) within a cell. AO was also used as an indication of whether CQ treatment, which is a deacidifying agent, was sufficient in inhibiting autophagic degradation via lysosomes. Given the major role of autophagy in degrading dysfunctional mitochondria (via mitophagy), thus maintaining a healthy mitochondrial pool, we also stained some sections with antibodies against mitochondrial marker TOMM20 (anti-TOMM20 rabbit monoclonal antibody; 1:200) to investigate mitochondrial abundance between regions, as well as the effect of CQ inhibition on mitophagy.
Statistical analysis
The Unpaired t-test was conducted using Graph Pad Prism 7.02 software to assess significant differences between treatment groups. Measurements of p<0.05 were considered as statistically significant. All data are expressed as mean ± SEM.
Results Western blot analysis of autophagy-related marker distribution and abundance in different regions of the mouse brain
Data from the western blot analyses of key autophagy makers indicated clear variation in abundance of both LC3 and p62 in different regions of the mouse brain (Figure 1). Both in vivo and ex vivo inhibition of lysosomal degradation via CQ and BAF treatment, respectively, resulted in different levels of LC3 protein levels (relating to autophagosomes) and p62 protein levels (relating to undigested ubiquitinated cargo) accumulation in different brain regions. Interestingly, with regards to p62 reactivity especially, a marked difference was observed when comparing the hippocampus with the cerebellum (Figures 1 and S1). The p62 levels of the hippocampus

Citation: Swart C, Khoza A, Khan K, Roux SL, du Plessis A, et al. (2017) Investigating Basal Autophagic Activity in Brain Regions Associated with Neurodegeneration using In Vivo and Ex Vivo Models. J Alzheimers Dis Parkinsonism 7: 337. doi: 10.4172/2161-0460.1000337
Page 4 of 8
Volume 7 Issue 4 • 1000337J Alzheimers Dis Parkinsonism, an open access journalISSN: 2161-0460
show barely any change compared to the cerebellum post-treatment following lysosomal inhibition, both in vivo and ex vivo. This indicates that basal autophagic activity is very low in the hippocampus compared to the cerebellum. No clear trend can be seen for LC3 distribution and thus warrants further investigation.
Immunofluorescence analysis of autophagy-related markers in different regions of the mouse brain
By means of basic haematoxylin and eosin staining different structural layers within each brain region can be noted (S2). Each regional cell layer contains variable cell densities, which should be taken into account when investigating fluorescence signal correlating with specific protein markers. A clear signal distribution can be seen between the various cell layers within the olfactory bulb, the cortex, the hippocampus and the cerebellum. Unique to the olfactory bulb are the glomerular layers and the mitral cell layers. Other distinguishable layers include the large Purkinje cells of the cerebellum (S2). Immunofluorescence staining of LC3-II and p62 also indicated a clear distinction in localization of autophagic markers according to the different cellular layers within each region, as well as variation in cross-regional abundance of markers (Figure 2). Control samples without primary antibody staining were included as negative-controls, to confirm the absence of non-specific binding (S3). No major changes in fluorescence intensity were observed when comparing fluorescence
microscopy (FM) images of control samples for each region to CQ-treated (in vivo) samples (CQ-treated FM data not shown). However, FM data from control samples did indicate increased fluorescent signal intensity correlating to higher abundance of LC3 in the cerebellum compared to hippocampal region (supplementary data Figure D). The LC3 signal correlating with autophagosomes can be seen as clear individual puncta, displaying with increased density, in the cerebellum compared to the hippocampus (S4). Acridine orange (AO) staining of acidic lysosomal compartments also indicated increased fluorescent signal correlating with lysosomes in the cerebellum compared to the hippocampus (S5), especially concentrated within the layers of large Purkinje cells (indicated by white arrow in S5). Given that the Purkinje cells of the cerebellum contain large numbers of mitochondria [24], this data could indicate increased basal autophagic activity in the form of mitophagy within these cells in order to maintain a healthy mitochondrial pool size. The large mitochondrial pool is also evident in the data displaying mitochondrial marker, TOMM20, abundance (S6), where a clear increased TOMM20 signal intensity can be seen in the cerebellum region compared to the hippocampal regions of control samples.
Micro-computed tomography analysis of regional distribution of autophagy marker, LC3, abundance with the mouse brain
The variability of the distribution of autophagic marker LC3
Figure 1: In vivo and ex vivo western blot results of autophagic marker abundance in different regions of the mouse brain. Data show clear variation of protein levels (p62 and LC3-II) following lysosomal inhibition (n=3 for all in vivo blots; n=3 for all p62 ex vivo blots except the olfactory bulb; n=2 for LC3-II blots of the hippocampus, mid-brain and cerebellum). In particular, cerebellar and hippocampal regions are characterized by distinct autophagic activities, which appear highest in the cerebellum and lowest in the hippocampus.

Citation: Swart C, Khoza A, Khan K, Roux SL, du Plessis A, et al. (2017) Investigating Basal Autophagic Activity in Brain Regions Associated with Neurodegeneration using In Vivo and Ex Vivo Models. J Alzheimers Dis Parkinsonism 7: 337. doi: 10.4172/2161-0460.1000337
Page 5 of 8
Volume 7 Issue 4 • 1000337J Alzheimers Dis Parkinsonism, an open access journalISSN: 2161-0460
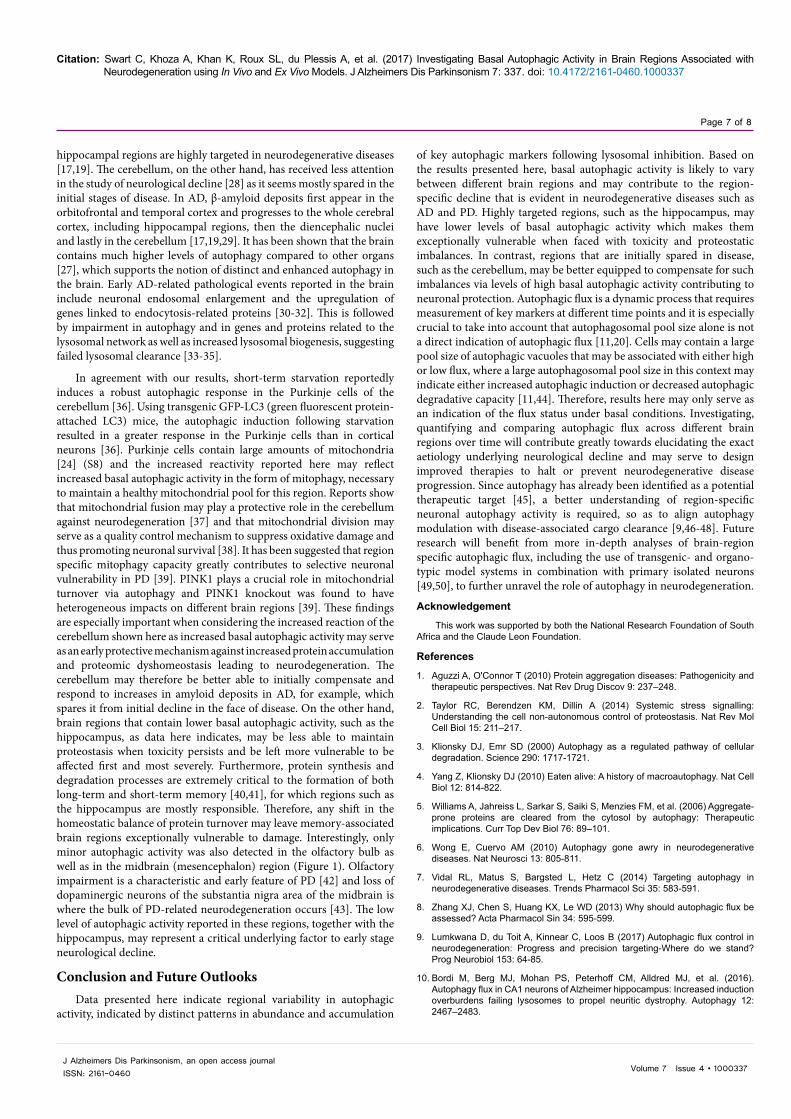
throughout the mouse brain was further reflected in the micro-CT data (Figures 3 and S7). Here, silver signal intensities representing LC3 abundance increased following CQ treatment in vivo. This could indicate possible accumulation of undigested autophagosomes resulting from CQ-induced lysosomal inhibition (Figure 3). LC3 abundance appears more prominent in the cerebellum, both before and after CQ treatment, compared to other areas such as the hippocampus and midbrain regions (Figure 3). These findings were evident both in the frontal view and mid-sagittal-based micro-CT images of the brain (Figures 3 and S7).
Discussion The functional specialization of different brain regions means
that each region is associated with specific functional requirements and subsequent underlying molecular characteristics [25]. However, whether key neuronal homeostatic processes, such as autophagy, vary from region to region remains currently unknown. Recent studies support the notion that the autophagic flux response following brain injury, may vary (i.e., be either increased or decreased) depending on the location and severity of the trauma [26]. The regulation of autophagy
has also been shown to be organ dependent [27]. It is important to note that basal autophagic flux or basal autophagic activity represents the degradation of cargo under basal conditions. Here, we assessed basal autophagic activity in the mouse brain, by assessing key susceptibility regions for markers of autophagy, using an in vivo and ex vivo approach. By using CQ and BAF to inhibit end-stage autophagic degradation via lysosomal deacidification, we are able to assess the amount of marker accumulation, where LC3-II serves as indication of accumulated autophagosomes and p62 of accumulated ubiquitinated cargo tagged for degradation.
The western blot and micro-CT data reveal a distinct, variable reactivity between the olfactory bulb, cortex, hippocampus, midbrain and cerebellum, following inhibition (both in vivo via CQ and ex vivo via BAF) (Figures 1 and 3). The greatest differences in autophagic activity can be noted when comparing results for the hippocampus with that of the cerebellum (Figures 3 and S1). Following lysosomal inhibition via CQ or BAF, no major increase in autophagic marker accumulation can be noted in the hippocampus (Figures 1, 3 and S1). In sharp contrast, the cerebellum shows a pattern of increased accumulation of both p62 (S1) and LC3 (Figure 3). This result is especially interesting given that
Figure 2: Fluorescence microscopy images of key autophagic marker distribution in control samples of each brain region of interest. Cross-regional variation in signal intensities can be observed for both p62 and LC3-II. Scale bar 200 μm

Citation: Swart C, Khoza A, Khan K, Roux SL, du Plessis A, et al. (2017) Investigating Basal Autophagic Activity in Brain Regions Associated with Neurodegeneration using In Vivo and Ex Vivo Models. J Alzheimers Dis Parkinsonism 7: 337. doi: 10.4172/2161-0460.1000337
Page 6 of 8
Volume 7 Issue 4 • 1000337J Alzheimers Dis Parkinsonism, an open access journalISSN: 2161-0460
A
B
Figure 3: Micro-CT images showing silver signal correlating to LC3-II in the mouse brain. Images (A) and (B) represent micro-CT images of the dorsal view and sagittal view of the mouse brain, respectively (nominal spot size of 3.5 μm, set at 50 kVp and 320 μA). An intensity chart has been used in order to better reveal areas of high (red) versus areas of low (yellow) signal, reporting on the concentration of silver correlated with LC3-II abundance. CQ-treated samples displayed increased LC3-II signal compared to control samples. From images (A) and (B) it is clear that the cerebellum contains higher abundance of LC3-II both before and after CQ treatment, compared to the area of the brain correlating with the hippocampal and midbrain regions.
Citation: Swart C, Khoza A, Khan K, Roux SL, du Plessis A, et al. (2017) Investigating Basal Autophagic Activity in Brain Regions Associated with Neurodegeneration using In Vivo and Ex Vivo Models. J Alzheimers Dis Parkinsonism 7: 337. doi: 10.4172/2161-0460.1000337
Page 7 of 8
Volume 7 Issue 4 • 1000337J Alzheimers Dis Parkinsonism, an open access journalISSN: 2161-0460
hippocampal regions are highly targeted in neurodegenerative diseases [17,19]. The cerebellum, on the other hand, has received less attention in the study of neurological decline [28] as it seems mostly spared in the initial stages of disease. In AD, β-amyloid deposits first appear in the orbitofrontal and temporal cortex and progresses to the whole cerebral cortex, including hippocampal regions, then the diencephalic nuclei and lastly in the cerebellum [17,19,29]. It has been shown that the brain contains much higher levels of autophagy compared to other organs [27], which supports the notion of distinct and enhanced autophagy in the brain. Early AD-related pathological events reported in the brain include neuronal endosomal enlargement and the upregulation of genes linked to endocytosis-related proteins [30-32]. This is followed by impairment in autophagy and in genes and proteins related to the lysosomal network as well as increased lysosomal biogenesis, suggesting failed lysosomal clearance [33-35].
In agreement with our results, short-term starvation reportedly induces a robust autophagic response in the Purkinje cells of the cerebellum [36]. Using transgenic GFP-LC3 (green fluorescent protein-attached LC3) mice, the autophagic induction following starvation resulted in a greater response in the Purkinje cells than in cortical neurons [36]. Purkinje cells contain large amounts of mitochondria [24] (S8) and the increased reactivity reported here may reflect increased basal autophagic activity in the form of mitophagy, necessary to maintain a healthy mitochondrial pool for this region. Reports show that mitochondrial fusion may play a protective role in the cerebellum against neurodegeneration [37] and that mitochondrial division may serve as a quality control mechanism to suppress oxidative damage and thus promoting neuronal survival [38]. It has been suggested that region specific mitophagy capacity greatly contributes to selective neuronal vulnerability in PD [39]. PINK1 plays a crucial role in mitochondrial turnover via autophagy and PINK1 knockout was found to have heterogeneous impacts on different brain regions [39]. These findings are especially important when considering the increased reaction of the cerebellum shown here as increased basal autophagic activity may serve as an early protective mechanism against increased protein accumulation and proteomic dyshomeostasis leading to neurodegeneration. The cerebellum may therefore be better able to initially compensate and respond to increases in amyloid deposits in AD, for example, which spares it from initial decline in the face of disease. On the other hand, brain regions that contain lower basal autophagic activity, such as the hippocampus, as data here indicates, may be less able to maintain proteostasis when toxicity persists and be left more vulnerable to be affected first and most severely. Furthermore, protein synthesis and degradation processes are extremely critical to the formation of both long-term and short-term memory [40,41], for which regions such as the hippocampus are mostly responsible. Therefore, any shift in the homeostatic balance of protein turnover may leave memory-associated brain regions exceptionally vulnerable to damage. Interestingly, only minor autophagic activity was also detected in the olfactory bulb as well as in the midbrain (mesencephalon) region (Figure 1). Olfactory impairment is a characteristic and early feature of PD [42] and loss of dopaminergic neurons of the substantia nigra area of the midbrain is where the bulk of PD-related neurodegeneration occurs [43]. The low level of autophagic activity reported in these regions, together with the hippocampus, may represent a critical underlying factor to early stage neurological decline.
Conclusion and Future OutlooksData presented here indicate regional variability in autophagic
activity, indicated by distinct patterns in abundance and accumulation
of key autophagic markers following lysosomal inhibition. Based on the results presented here, basal autophagic activity is likely to vary between different brain regions and may contribute to the region-specific decline that is evident in neurodegenerative diseases such as AD and PD. Highly targeted regions, such as the hippocampus, may have lower levels of basal autophagic activity which makes them exceptionally vulnerable when faced with toxicity and proteostatic imbalances. In contrast, regions that are initially spared in disease, such as the cerebellum, may be better equipped to compensate for such imbalances via levels of high basal autophagic activity contributing to neuronal protection. Autophagic flux is a dynamic process that requires measurement of key markers at different time points and it is especially crucial to take into account that autophagosomal pool size alone is not a direct indication of autophagic flux [11,20]. Cells may contain a large pool size of autophagic vacuoles that may be associated with either high or low flux, where a large autophagosomal pool size in this context may indicate either increased autophagic induction or decreased autophagic degradative capacity [11,44]. Therefore, results here may only serve as an indication of the flux status under basal conditions. Investigating, quantifying and comparing autophagic flux across different brain regions over time will contribute greatly towards elucidating the exact aetiology underlying neurological decline and may serve to design improved therapies to halt or prevent neurodegenerative disease progression. Since autophagy has already been identified as a potential therapeutic target [45], a better understanding of region-specific neuronal autophagy activity is required, so as to align autophagy modulation with disease-associated cargo clearance [9,46-48]. Future research will benefit from more in-depth analyses of brain-region specific autophagic flux, including the use of transgenic- and organo-typic model systems in combination with primary isolated neurons [49,50], to further unravel the role of autophagy in neurodegeneration.
Acknowledgement
This work was supported by both the National Research Foundation of South Africa and the Claude Leon Foundation.
References
1. Aguzzi A, O'Connor T (2010) Protein aggregation diseases: Pathogenicity and therapeutic perspectives. Nat Rev Drug Discov 9: 237–248.
2. Taylor RC, Berendzen KM, Dillin A (2014) Systemic stress signalling: Understanding the cell non-autonomous control of proteostasis. Nat Rev Mol Cell Biol 15: 211–217.
3. Klionsky DJ, Emr SD (2000) Autophagy as a regulated pathway of cellular degradation. Science 290: 1717-1721.
4. Yang Z, Klionsky DJ (2010) Eaten alive: A history of macroautophagy. Nat Cell Biol 12: 814-822.
5. Williams A, Jahreiss L, Sarkar S, Saiki S, Menzies FM, et al. (2006) Aggregate-prone proteins are cleared from the cytosol by autophagy: Therapeutic implications. Curr Top Dev Biol 76: 89–101.
6. Wong E, Cuervo AM (2010) Autophagy gone awry in neurodegenerative diseases. Nat Neurosci 13: 805-811.
7. Vidal RL, Matus S, Bargsted L, Hetz C (2014) Targeting autophagy in neurodegenerative diseases. Trends Pharmacol Sci 35: 583-591.
8. Zhang XJ, Chen S, Huang KX, Le WD (2013) Why should autophagic flux be assessed? Acta Pharmacol Sin 34: 595-599.
9. Lumkwana D, du Toit A, Kinnear C, Loos B (2017) Autophagic flux control in neurodegeneration: Progress and precision targeting-Where do we stand? Prog Neurobiol 153: 64-85.
10. Bordi M, Berg MJ, Mohan PS, Peterhoff CM, Alldred MJ, et al. (2016). Autophagy flux in CA1 neurons of Alzheimer hippocampus: Increased induction overburdens failing lysosomes to propel neuritic dystrophy. Autophagy 12: 2467–2483.

Citation: Swart C, Khoza A, Khan K, Roux SL, du Plessis A, et al. (2017) Investigating Basal Autophagic Activity in Brain Regions Associated with Neurodegeneration using In Vivo and Ex Vivo Models. J Alzheimers Dis Parkinsonism 7: 337. doi: 10.4172/2161-0460.1000337
Page 8 of 8
Volume 7 Issue 4 • 1000337J Alzheimers Dis Parkinsonism, an open access journalISSN: 2161-0460
11. Loos B, du Toit A, Hofmeyr JH (2014) Defining and measuring autophagosome flux—concept and reality. Autophagy 10: 2087-2096.
12. Kabeya Y, Mizushima N, Ueno T, Yamamoto A, Kirisako T, et al. (2000) LC3,a mammalian homologue of yeast Apg8p, is localized in autophagosomemembranes after processing. EMBO J 19: 5720-5728.
13. Klionsky DJ, Abdalla FC, Abeliovich H, Abraham RT, Acevedo-Arozena A, etal. (2012) Guidelines for the use and interpretation of assays for monitoringautophagy. Autophagy 8: 445-544.
14. Klionsky DJ, Abdelmohsen K, Abe A, Abedin MJ, Abeliovich H, et al. (2016)Guidelines for the use and interpretation of assays for monitoring autophagy(3rd edition). Autophagy 12: 1-222.
15. Bjørkøy G, Lamark T, Brech A, Outzen H, Perander M, et al. (2005) p62/SQSTM1 forms protein aggregates degraded by autophagy and has aprotective effect on huntingtin-induced cell death. J Cell Biol 171: 603–614.
16. Mizushima N, Yoshimori T (2007) How to interpret LC3 immunoblotting.Autophagy 3: 542-545.
17. Braak H, Braak E (1991) Neuropathological staging of Alzheimer-relatedchanges. Acta Neuropathol 82: 239-259.
18. Braak H, Del Tredici K, Rüb U, de Vos RA, Jansen Steur EN, et al. (2003) Staging of brain pathology related to sporadic Parkinson’s disease. NeurobiolAging 24: 197–211.
19. Braak H, Alafuzoff I, Arzberger T, Kretzschmar H, Del Tredici K (2006) Stagingof Alzheimer disease-associated neurofibrillary pathology using paraffin sections and immunocytochemistry. Acta Neuropathol 112: 389–404.
20. Haspel J, Shaik RS, Ifedigbo E, Nakahira K, Dolinay T, et al. (2011)Characterization of macroautophagic flux in vivo using a leupeptin-basedassay. Autophagy 7: 629-642.
21. Metscher BD, Müller GB (2011). MicroCT for molecular imaging: Quantitativevisualization of complete three-dimensional distributions of gene products inembryonic limbs. Dev Dyn 240: 2301–2308.
22. du Plessis A, Broeckhoven C, Guelpa A, le Roux SG (2017) Laboratoryx-ray micro-computed tomography: A user guideline for biological samples.Gigascience 6: 1-11.
23. du Plessis A, le Roux SG, Guelpa A (2016) The CT scanner facility atStellenbosch University: An open access X-ray computed tomographylaboratory. Nucl Instrum Methods Phys Res B 384: 42-49.
24. Castejón OJ (2012) Correlative microscopy of Purkinje cells. Biocell 36: 1-29.
25. Kanwisher N (2010) Functional specificity in the human brain: A window into the functional architecture of the mind. Proc Natl Acad Sci U S A 107: 11163-11170.
26. Lipinski MM, Wu J, Faden AI, Sarkar C (2015) Function and mechanisms ofautophagy in brain and spinal cord trauma. Antioxid Redox Signal 23: 565-577.
27. Mizushima N, Yamamoto A, Matsui M, Yoshimori T, Ohsumi Y (2004) In vivo analysis of autophagy in response to nutrient starvation using transgenic miceexpressing a fluorescent autophagosome marker. Mol Biol Cell 15: 1101–1111.
28. Wu T, Hallett M (2013) The cerebellum in Parkinson’s disease. Brain 136: 696-709.
29. Braak H, Del Tredici K (2011) Alzheimer's pathogenesis: is there neuron-to-neuron propagation? Acta Neuropathol 121: 589-595.
30. Bronfman FC, Escudero CA, Weis J, Kruttgen A (2007) Endosomal transportof neurotrophins: Roles in signaling and neurodegenerative diseases. DevNeurobiol 67: 1183–1203.
31. Ginsberg SD, Mufson EJ, Counts SE, Wuu J, Alldred MJ, et al. (2010) Regional selectivity of rab5 and rab7 protein upregulation in mild cognitive impairmentand Alzheimer's disease. J Alzheimers Dis 22: 631-639.
32. Jiang Y, Mullaney KA, Peterhoff CM, Che S, Schmidt SD, et al. (2010)Alzheimer’s-related endosome dysfunction in Down syndrome is Aß-independent but requires APP and is reversed by BACE-1 inhibition. Proc NatlAcad Sci U S A 107: 1630–1635.
33. Boland B, Nixon RA (2006) Neuronal macroautophagy: From development todegeneration. Mol Aspects Med 27: 503-519.
34. Nixon RA, Wegiel J, Kumar A, Yu WH, Peterhoff C, et al. (2005) Extensiveinvolvement of autophagy in Alzheimer disease: An immuno-electronmicroscopy study. J Neuropathol Exp Neurol 64: 113–122.
35. Yu WH, Cuervo AM, Kumar A, Peterhoff CM, Schmidt SD, et al. (2005)Macroautophagy--a novel Beta-amyloid peptide-generating pathway activatedin Alzheimer’s disease. J Cell Biol 171: 87–98.
36. Alirezaei M, Kemball CC, Flynn CT, Wood MR, Whitton JL, et al. (2010) Short-term fasting induces profound neuronal autophagy. Autophagy 6: 702-710.
37. Chen H, McCaffery JM, Chan DC (2007) Mitochondrial fusion protects againstneurodegeneration in the cerebellum. Cell 130: 548–562.
38. Kageyama Y, Zhang Z, Roda R, Fukaya M, Wakabayashi J, et al. (2012)Mitochondrial division ensures the survival of post-mitotic neurons bysuppressing oxidative damage. J Cell Biol 197: 535–551.
39. Diedrich M, Kitada T, Nebrich G, Koppelstaetter A, Shen J, et al. (2011) Brainregion specific mitophagy capacity could contribute to selective neuronal vulnerability in Parkinson’s disease. Proteome Sci 9: 59.
40. Choi JH, Kim JE, Kaang BK (2010) Protein synthesis and degradation arerequired for the incorporation of modified information into the pre-existing object-location memory. Mol Brain 3: 1.
41. Jarome TJ, Helmstetter FJ (2014) Protein degradation and protein synthesis in long-term memory formation. Front Mol Neurosci 7: 61.
42. Haehner A, Hummel T, Reichmann H (2011) Olfactory loss in Parkinson'sdisease. Parkinsons Dis 2011: 1-6.
43. Parent M, Parent A (2010) Substantia nigra and Parkinson's disease: A briefhistory of their long and intimate relationship. Can J Neurol Sci 37: 313-319.
44. Swart C, Du Toit A, Loos B (2016) Autophagy and the invisible line between life and death. Eur J Cell Biol 95: 598-610.
45. Rubinsztein DC, Bento CF, Deretic V (2015) Therapeutic targeting of autophagy in neurodegenerative and infectious diseases. J Exp Med 212: 979-990.
46. Lopes da Fonseca T, Villar-Piqué A, Outeiro TF, et al. (2015) The Interplay between alpha-synuclein clearance and spreading. Biomolecules 5: 435-471.
47. Yoon SS, Jo SA (2012) Mechanisms of Amyloid-ß peptide clearance: Potentialtherapeutic targets for Alzheimer’s disease. Biomol Ther (Seoul) 20: 245–255.
48. Zhao T, Hong Y, Li XJ, Li SH (2016) Subcellular clearance and accumulation of Huntington disease protein: A mini-review. Front Mol Neurosci 9: 27.
49. Maday S, Holzbaur EL (2016) Compartment-Specific regulation of autophagy in primary neurons. J Neurosci 36: 5933-5945.
50. Yang DS, Stavrides P, Mohan PS, Kaushik S, Kumar A, et al. (2011) Reversalof autophagy dysfunction in the TgCRND8 mouse model of Alzheimer’sdisease ameliorates amyloid pathologies and memory deficits. Brain J. Neurol 134: 258-277.