I L Y AND DEMAND, TS AND EXPORTS LECTED AGRICULTURAL …
76
_i r . - Do NoT Remove FDCD., ERS .. Cjas Foreign 24j) I ' L Y AND DEMAND, TS AND EXPORTS LECTED AGRICULTURAL CTS NETHERLANDS: AST FOR 1970 AND 1975'' T OF AGRICUL JURE Economic Research Service
Transcript of I L Y AND DEMAND, TS AND EXPORTS LECTED AGRICULTURAL …

_i r . -Do NoT Remove FDCD., ERS ..
Cjas Foreign 24j)
I
' ~ -~
L Y AND DEMAND, TS AND EXPORTS
LECTED AGRICULTURAL CTS NETHERLANDS:
AST FOR 1970 AND 1975''
T OF AGRICUL JURE Economic Research Service


PREFACE
This report is a summary of a comprehensive study, Supply and. Demand, Imports and Exports of Selected Agricultural Products in the Netherlands: Forecast for 1970 and 1975, conducted under contract for the Economic Research Service and the Foreign Agricultural Service, U.S. Department of Agriculture, and published in English by the Agricultural Economics Research Institute (Landbouw-Economisch Instituut), The Hague, The Netherlands. The contract was administered under the supervision of James J. Naive, a member of the Europe and Soviet Union Branch, ERS. Robert E. Shepherd of the same branch aided in the preparation of this summary. The research on which this report is based was conducted by the staff of AERI (A. Maris, Director). J. R. van Beek, C. Bos, J, Breeveld, J. de Hoogh, W. Maan, W. 0. C. thoe Schwartzenberg, A. J. Vermaat, J, A. Vriens, and w. van Vuuren are responsible for parts of the analysis. Since the study was conducted independently, the results and views expressed are those of the authors and do not necessarily reflect those of the U.S. Department of Agriculture.
This is one of a series of USDA-contracted studies analyzing the long-term prospects for agricultural supply and demand in foreign countries. Other completed studies include those for Jamaica, Trinidad and Tobago; Leeward Islands, Windward Islands, Barbados and British Guiana; Venezuela; Mexico; Brazil; Nigeria; Israel; Ghana; Saudi Arabia; Turkey; Republic of South Africa; India; the Philippines; Japan; Malaysia, Pakistan; Hong Kong; United Kingdom; Austria; Italy, France and West Germany. Copies of these reports are available from the Division of Information, Office of Management Services, U.&. Department of Agriculture, Washington, D.C. 20250.
G. Stanley Europe and oviet Union Branch Foreign Regional Analysis Division
i

CONTENTS
Summary. . . . . . . . . . • . . . . . • . . . . . . . . • . . • . . • . . • • • • . • • • . . iii
Objectives.. . . . . • . . . . . • • • . • •.• • • • • • • . • • • • • • • • • • • • • • • 1
Agricultural Regions............................... 2
Production Patterns.. . • . . • • • . • • • • . . . • • • • . • • • . • • • • • • • 4
Labor and Farm Size Structure...................... 5
Production, Domestic Sales, and Foreign Trade...... 7
Costs, Income, and Productivity.................... 9
Methodology. . . . • . • . . . . . • • . • . • . . • . • • • . • . • • • • • • • • • . • . 11
Assumptions. . . . . . . . . • • . . . . . • • • . • . • • . • • • • . • • . • • . • • • • 12
Forecast of the Prices of Agricultural Products in 1970 and 1975. . . . . . . . . . . . . . . . . . . . . . . . . . . . . . . . . . 13
Analysis of the Development of Domestic Supply of Agricultural Products and a Forecast of Pro-duction in 1970 and 1975 ....................... • . · 17
Forecast of the Consumption of Agricultural Products in 1970 and 1975························· 27
Forecast of the Export Supply and the Import Requirement of Som~ Important Agricultural Raw Materials. . • • . • • • . • • • • • • • • • • . • • • • • • • . • • • • . • • • • . • • • 32
Checking the Production Estimates •••••••••••••••••• 38
Tables............................................. 41
Washington, D.C. 20250 April 1969 ii

SUMMARY
In 1967, the Netherlands was the fifth largest market for U.S. agricultural exports, receiving over $472 million in shipments. The Netherlands competes with U.S. agriculture as a producer and exporter of livestock products, shipping primarily to West European markets. A large share of Dutch livestock feed requirements must be met by imports.
The future of Dutch agriculture is expected to be affected considerably by the country's membership in the European Economic Community with its common agricultural policy. This study was done in an effort to learn what changes might occur by 1970 and 1975 in the production and trade of Dutch agricultural products.
Gross National Product is expected to increase by 16 and 30 percent per capita (1965 prices), for 1970 and 1975, respectively. Private consumption of all goods (in 1965 prices) is projected to increase by 22 and 49 percent over the same periods. Consumption per capita is generally expected to hold steady-or decline for domestically grown arable products and accelerate for livestock products, butter and milk consumed directly. For tobacco and fruit (apples and oranges), consumption is increasing, but it is holding steady for edible fats and declining for cotton.
The production and consumption estimates are balanced by net trade estimates. Wheat imports (net) are shown to continue downward to 1970, mainly because of (1) rising domestic production, and (2) an assumption that wheat will cease to be fed to livestock. Imports are projected as slightly higher in 1975, as production levels off. A continued u~swing in feed grain imports is ascribed to expansion of livestock farming, notably in cattle, hogs, and broilers.
The exportable supply of potatoes is expected to increase considerably to 1970 and further to 1975, a result of rising output and declining consumption. Up to 1970, increased production of sugarbeets is expected to be nearly offset by growth in domestic consumption. From 1970 to 1975, however, the import requirement is projected to rise by about 34 percent. Rapeseed is expected to continue to be used mainly for export, with a relatively sharp increase in production projected.
The projected rise in milk production through 1975 portends a sharp increase in butterfat available for export,
iii

heightened by the projected drop in butter consumption. A larger export availability is projected for skimmed milk, cheese, and butter. Smaller but continuing net imports are projected for dried skimmed milk. But for other dairy products, smaller quantities are projected to be available for export. The implication for the dairy sector is that the growing surplus of butterfat will aggravate the serious surplus disposal problem of the EEC.
Meat supplies available for export are projected to increase-considerably, reaching about one-fou~th of output in 1970 and 1975. Production of pork is projected to rise so strongly that the exportable supply of pork will be much greater. Little change is projected for the beef and veal trade. The export supply of broilers is projected to double by 1970, followed by more modest growth to 1975. Egg exports are projected to disappear by 1975 and to be drastically reduced by 1970.
Imports of oils and fats are projected to continue to grow chiefly due to increasing industrial use. Imports of oilcake and corn gluten are projected to increase sharply as livestock feed consumption expands. Exports of oilcake from domestic crushing also are projected to be up significantly.
The trade in some important products not produced in the Netherlands was included in the study. For rice, little change is projected. Consumption and imports of-or8nges are projected to increase sharply. A gradual increase in tobacco consumption is also projected. The projected increase in the utilization of cotton for textiles to be marketed domestically and to be exported will necessitate increased imports of raw cotton.
iv

SUMMARY OF "SUPPLY AND DEMAND_, D1PORTS AND EXPORTS OF SELECTED AGRICULTURAL PRODUCTS IN THE NETHERLANDS:
FORECAST FOR 1970 AND 1975"
By LANDBOUW-ECONOMISCH INSTITUUT
OBJECTIVES
The Netherlands is a major importer and exporter of agricultural products. Livestock products, which require substantial amounts of imported feedstuffs to produce, are major exports. The country must rely on imports for most or all of its supplies of natural fibers, tropical products, certain temperate-zone fruits and vegetables, and tobacco. The United States has long had an interest in the development of supplies of, and demand for, agricultural products in the Netherlands. In 1967, the Netherlands was the fifth largest market for U.S. agricultural exports, receiving over $472 million in shipments. The Netherlands competes with U.S. agriculture as a producer and exporter of livestock products, shipping primarily to West European markets.
Important changes have occurred in Dutch agriculture in recent times. A vigorous postwar regional industrialization policy provided plentiful nonagricultural employment opportunities. Mechanization has been rapid: the number -of tractors increased from 24,500 in 1950 to 104,000 in 1963. The agricultural labor force declined from 533,000 in 1947 to 310,000 in 1965. As the number of farms fell-by 0.7 percent annually between 1947 and 1955, 1.9 percent from 1955 to 1959, and 2.1 percent from 1959 to 1965--farm sizes increased. The number of farms smaller than 7 acres declined from almost half of all farms in 1947 to onefourth in 1965.
Production patterns have also shifted. From 1953-55 to 1963-65, the following percentage changes occurred in land area devoted to major crops: wheat, up about 70; feed grains, down 22; sugarbeets, up ll; other crops (mostly pulses and flax), down 18. The percentage rises in livestock numbers during the decade are: cattle, 23 (including a 13-percent rise in dairy cattle numbers); hogs, 57; and poultry, 4 7.

Shifting demand patterns, too, hav~ affected output. The rapid rise in incomes in the Netherlands and n~ighboring countries during the 1950's and 1960's increased the consumption of livestock products r€lative to arable products. Dutch farmers, specializing in livestock farming and exporting livestock products, were able to expand agricultural output more rapidly than most neighboring countries. Thus, total agricultural (including horticultural) output increased by 45 percent in the Netherlands, compared with 25 percent for the entire EEC during 1953-62.
These and various other circumstances have increased the need to study the future development of Dutch production and consumption, and imports and exports of important agricultural products. Particularly important is the formation of the European Economic Community lJ and its common agricultural policy (CAP). In this large, integrated West European market, the position of Dutch agriculture will be considerably different from what it is now. The level of, and relationship between, the prices of means of production and end products will undergo changes as a re?ult of economic integration. The competitive position of Dutch agriculture relative to that of agriculture in the partner countries and in outBide countries will be radically changed.
It is still difficult to tell how these changes will affect the production costs and marketing of Dutch agricultural products. This uncertainty results in a hesitant attitude toward investment, both in agriculture and in those processing and supplying industries dependent on imports or on domestic supplies of agricultural raw materials.
AGRICULTURAL REGIONS
The soil of the Netherlands consists almost exclusively of diluvial and alluvial formations. The diluvial soils cover most of the east and south of the country. Elsewhere, mainly alluvial soils occur: sea clay in the costal regions, with here and there a top layer of peat, and river clay along the big rivers in the center of the country and in the southeast.
As the country is small and there are few differences in altitude, climatic variations are slight. Summers are
iJ Other members: Belgium, Luxembourg, France, West Germany, and Italy.
2

cool (average July temperature 700 F) and winters mild (average January temperature approximately 32° F). Rainfall is about 27.6 inches a year.
Mainly on the basis of soil types, the country can be divided into six agricultural regions:
A. The sea clay regions. These include the northeast, the southwest, the IJsselmeer polders, and some parts of the western provinces.
B. The river clay regions along the big rivers and in the southeast.
C. The pastureland regions (old sea-clay land, sometimes with a top layer of peat) along the €ast side of the IJsselmeer and in the greater part of the western provinces.
D. The sandy soil areas in the center, south, and east.
E. The fen colonies (sandy soil mixed with a top layer of excavated moor peat) in the northeast.
F. The horticultural regions in the west, consisting mainly of light soils particularly suitable for horticultural cultivation.
In the sea clay regions and the fen colonies, one encounters mainly arable farms (farms producing crops), which are among the country's largest in area (averaging 21 hectares). The principal crops are cereals--especially wheat-root crops, flax, and pulses. Many agricultural workers were once employed in these regions, but in the postwar years, manual labor has been replaced on a large scale by machine work.
The general type of farm in the pastureland regions is the cattle farm, chiefly a family enterprise with an average area of 14 hectares. Intensive farming is practiced. Much feed, particularly concentrate, is purchased for the herd, since the farm consists largely of grassland. Besides cattle, very much keyed to milk production, hogs provide a considerable source of income in some areas.
In the sandy soil and river clay regions, one finds mixed farms (crop and liv~stock production), with an average farm area of 10 hectares. The products of the arable land are partly fed to livestock on the farm and partly marketed. It has increasingly become customary to sell feed
3

grains and purchase mixed feed. The livestock consist predominantly of dairy cattle; calf-fattening is frequently important. Hogs and poultry usually supply a considerable part of the income of the mixed farm.
PRODUCTION PATTERNS
Major changes have occurred in recent years in agricultural land use and in the size of the livestock population in the Netherlands, as shown in table l.
The wheat area increased by about 70 percent from 1953-55 to 1963-65, the expansion in the sea clay regions being of particular importance. The cause of this should be sought in the favorable guaranteed price for wheat relative to alternative crops and in the good possibilities of mechanization. The expansion of the wheat acreage in the arable regions has been mainly at the expense of feed grains, pulses, and feed beets.
The area under feed grains decreased by 22 percent, the result of an increase in the area of barley and mixtures of cereals and a reduction in the areas of oats and rye. This resulted from the replacement of feed grains by more profitable bread grains and from the conversion of acreage in feed grains into grassland. The latter was particularly significant in the mixed-farming regions. The contraction in the cultivation of potatoes, feed beets, and green forage crops on mixed farms was also significant.
Sugarbeet cultivation increased ll percent. Between 1953-55 and 1963-65, there were great fluctuations in the area cultivated, a direct result of the price policy followed for this product, which alternately encouraged cultivation and led to contraction.
The remaining crops, chiefly pulses and flax, dropped 18 percent.
In the arable regions, the bread grain area expanded at the expense of forage crops and cash crops. The area in root crops, however, remained fairly stable.
In the pastureland regions, there was a considerable decline in the acreages of forage and root crops and an expansion of wheat. The mixed farms, found mainly in the sandy soil and river clay regions, emphasized more strongly the development of grassland. This was accompanied by a large increase in the cattle population, considerably more
4

so than in the pasture areas. There was also a spectacular growth in the hog and poultry populations on the mixed fanns. This development is encouraged by the fact that on these small farms family labor is used almost exclusively, the outflow being less smooth than that of nonfamily agricultural workers. This is particularly true of the farm head and the older members of the family working on the fann. The desire to share in the general prosperity in the l950's and 1960's caused many farmers first of all to attempt to increase incomes from their own farms. This attempt was channeled into an expansion of livestock numbers, which at the prices prevailing for livestock products (made favorable by the authorities) and for concentrated feed, permitted family incomes to rise.
LABOR AND FARM SIZE STRUCTURE
In the first years after the Second World War, the agricultural population was so large that there was considerable concealed unemployment. Labor productivity was consequently low. At the prevailing low standard of living, this was not regarded as a serious bottleneck, especially since agricultural prices were initially favorable as a result of the international shortage of food. Moreover, employment opportunities outside of farming were insufficient to absorb the concealed unemployment.
As the country's economic recovery proceeded, this situation changed. With the population growing rapidly, the Government developed a vigorous industrialization policy. Considerable attention was devoted to the effort to have industrial concerns locate in regions where there had not been heavy industrial concentration before. Nonagricultural enterprises exerted a considerable pull on the labor reservoir in the countryside by offering higher wages and favorable terms of employment. At the same time, the labor requirement in farming decreased because machinery began to be used on a wider scale.
Table 2 shows the decline in the male agricultural working population from 1947 to 1965.
The labor force per 100 hectares of cultivated land fell from 15.2 man-years (300 days of work per man-year) in 1956 to 12.3 in 1962; the corresponding figures per farm are 1.73 and 1.56 labor year units. The number of tractors in agriculture rose from 24,500 in 1950 to 104,000 in 1963, the number of combines from 1,200 to 4,200, and the number of milking machines from 3,800 to 64,000.
5

These changes influenced the number of farms and farm size (table 3).
From 1947 to 1955, the number of farms fell by 0.7 percent a year, from 1955 to 1959 by 1.9 percent a year, and from 1959 to 1965 by 2.1 percent a year. The number of farms smaller than 7 hectares has decreased sharply. In the size class of 7 to 10 hectares, there was at first an increase, and later a drop. The number of farms of 10 to 20 hectares has increased, while the number of larger farms has decreased.
Improvement of the farm size structure is a slow process which lags far behind what would Q~ economically desirable. For instance, it is posited ~ that with a farm organization adapted to present technology it would be enough to have one regular worker per 10 to 30 hectares of arable land and a temporary supplementary labor force of 4 to 5 men per 60 hectares of cereals and of 2 to 3 men per 6 to 10 hectares of potatoes and beets. About 80 percent of the arable farms now have grain areas of less than 5 hectares. For potatoes and sugarbeets, 90 percent and 77 percent, respectively, of the arable farms have an area of less than 2 hectares. On the pastureland farms, the dairy herd is less than 10 cows on 55 percent of the farms and from 10 to 19 cows on 32 percent of the farms.
The failure to improve farm size will, perhaps, lead increasingly--the possibility is greatest in arable farming and in feed production--to the use of contractors and to various forms of collaboration among farmers. The pronounced development of contract work in recent years must be viewed, in the first place, in connection with the decreasing number of hired farm workers (especially in the arable regions where about one-quarter of all work is done by contractors) and the reduced number of members of farmers' families working on farms. As a result of these developments, peaks in the labor requirement have come to weigh heavily on management of the farm. An even mor~ extensive use of contract labor, which would enable farmers to apply the most modern working methods despite small farm area, is hampered by the fact that the volume of work for farm operator +abor would lessen and become more irregular.
~/ See De Nederlandse landbouw in een groeiende economie (Dutch Agriculture in a Growing Economy), Chapter IV, Agricultural Economics Research Institute, The Hague, 1965.
6

A labor surplus is again a possibility, due to the continued existence of a large number of smaller, mostly mixed, farms and the modernization of feed production on these farms. An overabundance of farm labor will probably encourage the expansion of hog and poultry farming and encourage those who run mixed farms to increase their numbers of fat stock and dairy cattle. This will be all the more the case because it is believed that the advantages of modern farming equipment and methods in production not so dependent on land available can be realized--certainly in hog and egg production--with relatively small units (e.g., with 100 hogs or 2,000 laying hens). This situation is, of course, interesting to feed manufacturers and buyers of livestock products. The activity of these two groups is a factor of great importance, since concluding various types of delivery contracts and by granting the farmers financing facilities, they encourage the turnover in feed, and in the case of the buyers, satisfy their own requirements for pigs, poultry, etc. for slaughter. In addition, the technical competence and special marketing interests of the larger buying concerns foster the creation of large, specialized farms for hog and poultry production. However, the extent to which the greater danger of infection of animals, the price risk, and the uncertainties of big business discourage the creation of larger specialized farms is difficult to estimate. The trend toward such farms is not yet pronounced. The trends in cattle fattening are more clear. The relatively favorable prices for heavier cattle have led to a pronounced drop in the number of newborn calves slaughtered and to a greater supply of heavier animals for slaughter.
In summary, the development of technical efficiency on mixed farms and the low rate of improvement in the farm size structure, with the corresponding high man-land ratio, will continue to encourage the expansion and intensification of livestock farming as farmers strive to improve labor productivity. Whether this will prove to be a fortunate development will greatly depend on price developments and the demand for Dutch livestock products on the foreign market. The luxury character of livestock relative to arable products and the rapid development of incomes are encouraging factors.
PRODUCTION, DOMESTIC SALES, AND FOREIGN TRADE
The Dutch agricultural production structure has long differed considerably from patterns of domestic consumption. Since the production of livestock products greatly
7

exceeds homes sales, there is a considerable export surplus. However, since production of crops is insufficient to meet domestic food and feed requirements, large quantities of bread grain and feed grains are imported. This stress on the production of livestock products has become ever greater in recent years. The values of both domestic production and domestic consumption of livestock products have been increasing more rapidly than the values of domestic production and consumption of arable products in recent years (table 4).
The production of crops increased by 10 percent from 1956-58 to 1961-63, while domestic consumption increase by only l percent. As a consequence, the net import of arable products fell by 24 percent. The very slight increase in consumption--despite a population growth of 7 percent--was principally caused by the drop in per capita consumption of bread and potatoes.
The production and consumption of livestock products (in terms of value) displayed about equal increases, 24 percent and 22 percent respectively. The export surplus increased by 28 percent.
The ratio of the value of livestock to crops produced rose to 6 to l. The ratio of these products in consumption is only 3 to l, although this ratio has also increased.
The great rise in income in the Netherlands and other West European countries in the 1950's and 1960•~ combined with a higher income elasticity, caused the demand in these countries for livestock products to increase by a greater percentage than that for crops. Dutch agriculture, specializing in livestock products, was able to expand·more rapidly than the growth in the demand for agricultural products in general. EEC agricultural production, as a whole, corresponds in its composition much more closely to the consumption pattern for agricultural products than Dutch agricultural production.
In the EEC, as a whole, the increase in agricultural (including horticultural) output from 1953 to 1962 was only 25 percent in contrast to 45 percent in the Netherlands.
Exports of livestock, meat, and eggs by the Netherlands go mainly to the member countries of the EEC and dairy products to outside countries. The export value of the first mentioned group has risen much more than that of dairy products, 67 percent and ll percent respectively.
8

Eggs are an exception. Egg exports have declined considerably since 1962, because of increased production in West Germany. The EEC share of total exports of livestock, meat, and eggs increased from 52 percent during 1953-55 to 71 percent during 1962-64, while the EEC share of the exports of dairy products actually decreased, from 38 percent to 32 percent. The member countries of the EEC increased their dairy production considerably between the 1950's and 1962-64, while consumption increased only moderately, due to the low income elasticity. Consumption of meat rose sharply, and the Netherlands has profited by supplying high-quality products.
Cereals are the Netherlands' most important agricultural imports. Imports of wheat, after increasing somewhat in the second half of the 1950's, have fallen in recent years to about 0.7 million tons. Imports of feed grains rose from 1.5 million tons during 1953-55 to 3.1 million tons in 1962-64. These figures reflect the developments already mentioned (the drop in the consumption of bread, the expansion of domestic wheat cultivation, and the increased feed grain requirements).
COSTS, INCOME, AND PRODUCTIVITY
Earlier, attention was drawn to the important changes that have occurred in the postwar years in the volume and pattern of Dutch agricultural production and to the use of inputs. The latter aspect will now be further considered with the aid of table 5.
While value of output of Dutch agriculture and horticulture increased by 61 percent from 1953-55 to 1962-64, the value of nonfarm inputs increased by 92 percent. As a result, the share of nonfarm inputs in the output value rose from 41 percent to 48 percent. Based on 1953 prices, the increase has been still greater--from 41 percent to 52 percent.
This change may be explained by the development of agricultural prices relative to cost elements, and by prices of the cost elements themselves. A comparison of the 1963/64 price level with that of 1953/54 reveals that the wage level doubled, rentals increased by 50 percent, and the prices of implements increased by 20 percent, while prices of artificial fertilizers and of feed increased only slightly. Prices of agricultural products (including subsidies) rose by 20 percent. These changes in price relationships have clearly provided considerable
9

incentive to replace manual labor by machinery and to make more intensive use of labor and land (e.g., by expanding the livestock population and the use of fertilizers).
The increase in feed purchases of more than l billion guilders does not fully reflect the consequences of the expansion of the livestock population on the feed requirement, since domestic feed production has also increased. This is particularly true of the output from grassland which, through greater fertilization increased.
The costs of maintenance and depreciation of buildings, implements, equipment, and machinery increased 50 percent because of rises in building costs, wages, prices of implements, etc., and also through growth in the volume of these assets. The horticultural sector contributed to this rise, since the area under glass expanded. This also had an effect on heating costs and thus on the fuels and electricity item in the table.
From the margin between the value of production and the nonfactor inputs, the production factors labor, capital, and land receive their remuneration after the indirect taxes paid by agriculture and the subsidies received by it have been taken into account. The group of production factors has undergone a basic change in the sense that the area of cultivated land has decreased slightly, the labor force has dropped considerably, and the capital volume has increased.
To appraise the development of agricultural income, a comparison was made between the trend of labor productivity and that of net value added (factor costs) per man-year in agriculture and in the combined nonagricultural sectors. From 1953 to 1963, labor productivity and net value added per man-year both increased in the agricultural sector somewhat more than in the combined nonagricultural sectors. Especially for horticulture, which contributes about onefifth of the gross agricultural production value, it was a period of great economic prosperity.
If horticulture is subtracted, however, the increase in agricultural (arable and livestock farming) income proves to have been about the same as that in the nonagricultural sectors. And the increase was only achieved with the help of Government subsidies, which compensated for the deterioration in the terms of trade of agriculture that began in the middle of the 1950's.
10

METHODOLOGY
A forecast for 1970 is more accurate than one for 1975. As a forecast period lengthens, the uncertainty about external factors and the way in which the supply of, and demand for, agricultural products react to external circumstances greatly increases. This uncertainty could be expressed by alternative assumptions about exogenous and endogenous factors determining supply and demand. In this report, alternatives have been posed for only one factor--the prices and price relationships of agricultural products in 1975 which are central to the forecast.
In a closed economy, interactiQn between the volume of production and consumption via the price mechanism will cause the two quantities to tend toward equality. In these circumstances, a medium-term forecast of production and consumption would consist of an estimate of the future supply function and the future demand function, the intersection of which would give the future production (which equals consumption) . From this confrontation of supply and demand, the equilibrium price could also be derived from the forecast.
However, the Dutch market for agricultural products of other countries is anything but closed. The Netherlands exports--and long has exported--considerable quantities of processed agricultural products. By 1970 and 1975, when the Netherlands will be integrated into the greater EEC market, the Dutch market will be even more open than it is now. The Dutch price level and price relations will then be determined by the market situation and the price policy in the EEC--not the Netherlands.
Consequently, the starting-point for the forecast is a set of estimates of prices which Dutch producers will receive in 1970 and 1975. These estimates will have to reflect many external influences on the marketing possibilities for Dutch agricultural produce. The uncertainty about these external influences (such as growth of production in the EEC and, in particular, the location of this production; the development of consumption; and the influence of the common agricultural policy on both production and consumption) is the reason for posing two alternatives for prices in 1975.
The supply in 1970 and 1975 is then analyzed at the estimated prices and price relationships. The forecast of supply of Dutch agriculture is based on an analysis of the producers' responses to changes in prices in the past
11

and the expected development of more or less autonomous factors determining supply (area of land under cultivation, productivity of crops and cattle, supply of labor, investments).
In addition, domestic consumption of the individual products in 1970 and 1975 is estimated, based on an analysis of the factors which in the past determined consumption (including price and price relationships). In these estimates, allowance has been made for expected population growth and the development of national income.
Finally, by comparing the forecast of production with that of consumption, the expected import or export surplus in 1970 and in 1975 is determined for each product, in unprocessed form. In other words, this surplus does not include the ~uantities of the product which cross the frontier in more or less concealed (processed) form. These "hidden" imports and exports have been counted as consumption and have therefore been separately estimated. The following tabulation illustrates the way the balance sheet has been set up to determine the import re~uirement or of the export supply as a residual item:
domestic production -domestic consumption
balance available for export lf -export surplus J/ in "hidden" form
export supply (surplus) J/ in unprocessed form !J}
AS&JM:PriONS
The estimates are provisional. They are accurate only insofar as the basic assumptions prove correct.
Among the many assumptions that had to be made, a certain gradation is perceptible. There are assumptions regarding the general economic and economic-political eli-
Import re~uirement, if negative. This should also include ~uantities which have under
gone limited processing, but have not been processed into other products.
12

mate during the forecast period; they indicate the general framework inside which the production and consumption of agricultural products is assumed to take place.
The most important of these assumptions are: (l) A continuing favorable economic situation, with a regular rise in the real national per capita income in the Netherlands and the EEC (see table 6); (2) a regular rise in the general level of prices in the Netherlands and the EEC (table 6) and constant rates of exchange between EEC countries; (3) the EEC will be confined to its present six members until 1975; (4) trade in agricultural products within the EEC will be free from discriminatory impediments before 1970; (5) the price level of agricultural products on the world market will stay relatively low, but the EEC in its common market and price policy will continue to aim at achieving a higher level of prices within the Community to guarantee a reasonable livelihood for the agricultural working population.
A second category of assumptions relates to the manner in which prices, production, and consumption of agricultural products will behave inside this general framework. This category also includes the assumption, already mentioned, that the prices of agricultural products in 1970 and 1975 are exogenously determined for the Netherlands. A second important assumption, to be further explained, is that the relatively low income level per head among the agricultural working population in the EEC will not grow more quickly through 1975 than the general wage level in the EEC.
FORECAST OF THE PRICES OF AGRICULTURAL PRODUCTS IN 1970 AND 1975
It has been assumed that producer prices in the Netherlands in 1970 and 1975 will be determined by prices in the larger, fully integrated,EEC market. The forecast of Dutch producer prices is therefore based on an estimate of the future development of price relationships and the average price level of agricultural products in the EEC. Because of uncertainty about these estimates, particularly in the longer term, two alternative assumptions have been made for 1975. The (in part fictitious) common prices in 1967 have been taken as a basis, since 1967 is the year in which trade in a number of important agricultural products inside the EEC became free, with the common market and price policy reaching their final phase.
13
Under EEC policy, in addition to measures aimed at improving productivity (structural policy), efforts will be made, by influencing prices, to arrive at reasonable incomes for the agricultural working population. It has been assumed that price support, with occasional exceptions, will not be given in the form of subsidies, but will continue to be given through measures to guide market prices in the desired direction.
The criteria by which agricultural prices will be determined in the EEC are not yet certain. The common prices for 1967 and 1968 came about through efforts to eliminate the price differentials between the member states. In this phase of price equalization, little attention was devoted to formulating desirable standards for the common price policy after unification of the market. Thus, it was necessary to forecast the factors which will be taken into account in the future.
It has been assumed that market and price policy will influence the price level of agricultural products in the EEC to such an extent that per capita income of the agricultural working population will increase at the same rate as assumed for the wage level (alternative I) or will lag somewhat behind it (alternative II). In other words, the forecast of prices is based on the expectation that the difference in the EEC between the income per ~erson in agriculture and that outside agriculture will not be made up by 1975, and might, in fact, even increase somewhat. 2/ These assumptions are based on the expectation that the market and price policy will encounter various restrictions in realizing its incomes objectives. A producer price increase does not leave other interests undisturbed. 'The increase is reflected in budgetary objections or objections arising out of trade or wage and price policies. The opposition to a producer price increase proves to be particularly active in a period of inflation (also assumed in our forecast), since monetary depreciation alone requires that the nominal price level of agricultural products be regularly raised to prevent a relative decline of incomes in agriculture.
j) The concern here is with the influence of market and price policy on the relative income position of workers in agriculture. An improvement of that position through a more rapid rise in productivity (e.g., as a result of an intensification of structural policy measures in the EEC) than was assumed when the price level was calculated is not excluded.
14

These price level (or income) alternatives are coupled to the two alternative assumptions mentioned above regarding the relationship between the prices of various products in 1975. The possibilities of influencing the prices of agricultural products--and in this way the income of the ~arming population--through market and price policy are subject to various restrictions, notably those in the budgetary field. These restrictions apply more strongly to some products than to others. Products for which a possible price increase will summon up relatively little opposition may be regarded as relatively "strong" products; for relatively "weak" products, this opposition will apply more strongly. Relatively "strong" agricultural products are those for which a long-term import requirement is expected to continue in the EEC. Maintaining, and perhaps increasing, the price differential between the EEC and the world market on behalf of the domestic producers does not in these circumstances--given the EEC system of market and price policy--require any additional expenditure by the European Guidance and Guarantee Fund. §/ Products for which a growing export surplus must be assumed up to 1975 are relatively "weak" since protection of the EEC price will entail increasing expenditure for support buying and export subsidies.
It is expected that the prices of "weak" products will drop relative to prices of "strong" products until 1975.
Our forecast of the relationship between agricultural products for which a common market and price policy is pursued in the EEC is therefore based on expectations concerning the trends in supply for demand and market policy position for the various products in the EEC as a whole. In alternative I, a moderate relative drop in the prices of "the "weak" products has been assumed; in alternative II, a still more unfavorable market situation for "weak" products has been premised.
In table 6, the price relationships assumed for 1970 and 1975 are given. For comparison, the table also includes the price relationships (for the EEC's common prices) in the base year of 1967.
The prices have been expressed in relation to the barley price. Barley is regarded as a "strong" product. It
§/ Incomes from import levies will in fact rise as a result of the greater differential between EEC and world prices.
15

appears that during 1970-75 the prices for wheat, oats, rye, sugarbeets, potatoes, and milk will decline relative to the barley price. Thus, these products are regarded as relatively "weak." On the other hand, maize, beef and veal, as well as barley, are "strong" products. The forecasts of the price relationships and the income position of the agricultural working population have been correlated by the assumption (alternative I) that the income per persons in farming in the EEC during 1967-75 remains constant in relation to income outside agriculture. The unfavorable development in prices of "weak" products assumed in alternative II thus accompanies a relative decline in the income position of agriculture, on the premise that the actual prices of the "strong" products are the same in both alternatives.
Starting from the above assumptions, the prices for the Dutch producer in 1970 and 1975 have been derived within the framework of the estimates of economic development in the EEC (the development of wages and prices). The increase from 1967 in the average EEC price level of these products required to ensure that the average labor income per worker in the agricultural sector rises at the same rate as the general wage level in the EEC has been calculated.
For livestock products not so dependent on available land (pork, eggs, and poultry), EEC prices, unlike those for many agricultural products tied to the soil, are free (except for customs duties and levies at the border). The price development of these livestock products is, therefore, not determined by income objectives of market and price policy but by the long-term development of supply and demand. It has been assumed that for these products (the supply and demand of which are both relatively sensitive to short-term price changes), long-term changes in the price level are under the influence of the development of costs per unit of products.
On the assumption that Dutch producer prices for these livestock products will also be determined exogenously in the case of a completely unified market, it has been supposed that the development of unit costs in the other EEC countries will have a decisive effect on the development of prices in the Netherlands after 1967. Thus, the model for the development in the other EEC countries was West Germany, which is an important producer, consumer, and importer of the livestock products in question. Moreover, sufficient statistical material about West Germany was available to support an approximate estimate of the future development
16
of productivity in hog and poultry production. With the aid of this estimate of the productivity increase and with due regard for the expected changes in the prices of the factors of production (mainly feed and labor), the development of unit costs in West Germany has been approximated separately for pork, eggs, and poultry. The changes which the producer price level will undergo in the Netherlands during 1967-70 and 1967-75 have been derived from this.
Table 7 gives the Dutch producer prices 1970 and 1975, estimated as explained above. It also lists, for comparison, the average producer prices in 1962 and 1965. The assumed fUture prices are expressed in 1970 and 1975 guilders, respectively. The forecast allows for monetary depreciation--estimated at 2.5 percent a year during 1967-70 and at 1.5 percent during 1970-75·
Table 8 gives the assumptions regarding the general wage and price development and the development of relative incomes in farming, which are the basis of the forecast of the nominal prices in table 6.
ANALYSIS OF THE DEVELOPMENT OF DOMESTIC SUPPLY OF AGRICULTURAL PRODUCTS AND A FORECAST OF PRODUCTION IN 1970
AND 1975
Before making a reasonable forecast of the supply of agricultural products it is, of course, necessary to determine the factors, such as prices or productivity, which can cause changes 1/ in the supply and then to investigate the quantitive relationship between these explanatory factors and the production of the relevant agricultural products.
Only data for a limited number of postwar years are available for the analysis of this relationship. The structural conditions of agriculture and the means of production before, during, and immediately following World War II were so different from those in later years that it may not be assumed that the relationship that existed in the earlier period between the factors determining production is still transferable to the period up to 1975. The relevant equations have been derived from data for the period after 1953. The assumption was made that the relationship contained in these equations between the volume
1/ Chance changes, as a result of fluctuating weather, are not considered.
17

of production of the various products and the explanatory factors will generally hold true during 1970-75· ~
The limited amount of data available for the study, the complex nature of the responses of farmers to the factors affecting production, and the need to extrapolate the results over a relatively long period result in inaccuracies and mean that no great exactness can be expected of the forecast. The forecasts may be regarded only as a rough approximation of the agricultural production expected at the prices and incomes assumed for 1970 and 1975.
To explain the supply of the various livestock products, it has been assumed that the following factors are important: (1) The structural development of agriculture as a whole, (2) the development of the relative share-chiefly determined by long-term changes in price relationships--of the relevant line of production, (3) incidental changes in production because of short-term changes in the price of the product in question or of an alternative product, and (4) the changes in yields and in the feed conversion ratios.
Brief attention will be devoted to these factors be-low.
The structural development of agriculture
General developments in agriculture may relate to the intensity of production, farm size, structure, mechanization, the labor supply, cultivation techniques, farm organization, etc. The economic consequences of these developments may be largely summarized in two concepts--the volume of production and labor productivity. These two factors are not independent of one another. The farmer can, at a given moment, clearly direct his entrepreneurial activities, inYestments, etc., to a lesser or greater extent towards increasing production (more cows, more hogs, etc.). As a result, by mechanization, increasing the capacity for livestock, etc., a smaller or larger part of the resources available can be used to step up labor productivity. 2/
§! For egg production, however, this is doubtful, as will be seen later.
2/ In the most extreme case, the development of labor productivity would be confined to the relative saving in time from an increase in production.
18

Increasing production and stepping up labor productivity may therefore be alternatives within certain limits. At relatively high prices for agricultural products in general, the farmer may use his resources for intensifying production; at relatively low prices, it will be desirable to use these resources to cut costs (in particular labor costs) by sensible mechanization. We have not been able to quantify this alternative. In principle, however, it is possible to combine volume of production and labor productivity into a figure indicating the general development of agriculture (or an agricultural region), which does not specify whether this development manifests itself in the form of intensification or in the form of increased labor productivity.
The development of the relative share of an individual line of production in the general long-term development of agriculture
As already pointed out, with any given general development of agriculture, individual lines of production may develop quite differently, depending on changes in price relationships. It is obvious that, to predict the volume of production of a given agricultural product for a future year, not only the prices or the profitability of this product in the years immediately before are of importance. The price trend for a greater number of years will be significant, particularly for a product that re-. quires the buildup of an expensive set of durable means of production.
Obviously, prices themselves are an inadequate means of reflecting the attraction of farmers to a certain line of production. As production costs or the value of the guilder change, farmers evaluate the same price quite differently in light of the new circumstances. For this reason, the prices that were forecast have not been used directly. Instead, proceeds per unit product less corresponding feed costs, frequently used in business economic studies, has been used for hogs and poultry. This balance indicates the attraction of the relevant enterprise to the farmer much better than price alone. By further relativizing this balance, for instance by dividing it by the labor income per hour, not only is the influence of differences in the real value of the guilder in various years eliminated, but the balance (proceeds less feed costs) is also related to the principal factor of production to be set against it, labor. The result is proceeds less feed costs per unit of product expressed in hourly income. It
19

is reasonable to assume that, for the farmer, comparison of this figure with the hours of labor required would be an important criterion in his decision whether to expand or contract production. This does not mean that he really reckons in this manner, but it does mean that, for instance, a contrast which he senses between his income and the efforts required and which may lead him to shift to an alternative product, can be quantitatively reflected by using the method described above. In the case of cattle farming, because a balance of proceeds less feed costs is less simple to calculate and use, we have utilized the quotient of milk price and the unit cost of milk.
Incidental changes in the volume of production because of short-term price changes
Besides changes in supply arlslng from fluctuations in the rate of buildup in durable means of production caused by long-term changes in the prices of products and means of production, incidental changes in production may be expected. These will coincide with a more or less intensive use of the available durable means of production--notably facilities for livestock (sheds, pens, etc.)--or with a change in their use. It is quite feasible for subs~itution between the various lines of production to occur. For instance, if hog prices are good, hog production may become somewhat more intensive and because of limited labor or limited funds for the purchase of feed, etc., poultry production may decline somewhat. To explain incidental change in volume, we have included prices applicable for the relevant point in time of the product concerned and, where applicable, of an alternative product.
Development of physical yields
The increases in yields (of such things as the number of eggs per laying hen, the quantity of milk per cow, and the quantity of grain or potatoes per hectare of arable land) over time are important determinants of supply. A comparable role is played by the quantity of feed required to produce a unit of product (e.g., the quantity of feed per kilogram of eggs, per kilogram of broilers, or per hog for slaughter).
The development of these ratios is not only important for calculating from the number of animals forecast for 1970 and 1975, the corresponding number of eggs, the presumable quantity of milk, and the demand for feed. It also
20

plays a part in determining the prices received. For at a higher physical yield per animal or with improved feed conversion, a lower price will be considered equivalent to a higher price in a preceding year. The latter two possibilities are considered in the balances of proceeds less feed costs. Estimates of the future trends of both physical yields and feed conversions is, in the first place, a technical agricultural matter. These trends depend, above all, on the work of breeders and on extension work. Considering both this work and the rate at which yields and feed conversions improved in the past, estimates were made for the various agricultural products for 1970 and 1975.
Supply response in hog farming
In the analysis of the supply response of farmers to pork prices, a distinction has been made between two ways in which production can change: (a) Through changes in the number of pigs produced for slaughter per sow every 6 months. This can differ, for instance, as a result of relatively slight changes in the length of the period between two stud servicesj and (b) through changes in the size of the sow population.
The two ways in which the supply can change were found to be interconnected, but with the proviso that the change in the number of pigs produced for slaughter per sow, under the influence of adjustments in market prices of pork, took place about 6 months before the corresponding change in the sow population. The following discussion is confined to a brief explanation of the forecast of the sow population. Allowance has been made for the fact that changes in the prices of hogs for slaughter have their effect on the supply only after some delay (table 9). An important factor here is, for instance, the time needed to develop a piglet into a sow ready for serving.
It has been assumed that the carcass weight, in view of the requirements for pork for 1970 and 1975, will be about 80 kilograms and that 1,160 kilograms of carcass weight per sow per year will be produced. This leads to a total production of pork (including lard and suet) of 631 million kilograms for 1970 and 735 million kilograms for alternative I, or 737 million kilograms for alternative II, in 1975·
21

Supply response in cattle farming
In the investigation into the supply of the products of cattle farming (milk and meat), an attempt has been made to find a relationship between the number of calves born annually and the prices of milk and meat. This number of calves largely determines the milk yield and gives the number of animals eventually to be slaughtered as calves or adult cattle. The price of milk, as a percentage of the unit cost of milk, has been chosen as one of the explanatory variables. A balance of proceeds less feed costs has not been used for milk as it was for the other livestock products. Because of the entirely different nature of the feed supply for production of milk, a balance for milk would be highly arbitrary. It appears that the relatively minor changes in the milk price are important to the changes in production. In addition, the favorable meat prices prove important in accelerating the removal of dairy cattle from the dairy herd. This is particularly so because bigger differences occur in the ratio between meat and milk prices than between the price and the unit cost of milk. Some of the most important data for dairy production and the forecast of the number of births in 1970 and 1975 are given in table 10.
By multiplying the forecast number hectare of grassland by the estimate of area, the number of births and thus the have been determined for 1970 and 1975. of this calculation, see table 11.
of births per the grassland total milk yield For the results
As milk is consumed and processed in various forms (butter, cheese, and dried skimmed and dried whole milk), the constituents of the milk occurring in different ratios, it is more suitable to divide milk into its principal constituents. For the forecast, milk is divided into two constituents: skimmable butterfat, on the one hand, and skimmed milk with 0.06 percent of fat left in it, on the other.
Every calf born, if not rejected and destroyed, is ultimately s~aughtered, either as a calf or as an adult animal. As the number of calves born is given in the forecast of dairy production, an extrapolation of the average slaughter weight suffices for an estimate of meat production. Data on this, with the forecast for 1970 and 1975, are summarized in table 12.
Multiplying by the number of births provides the total production of beef and veal in carcass weight; in 1970,
22

this will be 318,000 tons and in 1975 (for price alternatives I and II), 343,000 or 338,000 tons, respectively.
Needless to say, different beef and veal weight ranges could provide a higher average slaughter weight. An increase in the average weight from 130 to 170 kilograms coincides with a drop--from about 45 percent to 30 percent-of the share in output of dairy cows having calved twice and older specimens, while the share of veal from newborn calves declines from about 7 percent to a negligible percentage. Until an average carcass weight of 160 kilograms has been reached, the share of young calves and fat calves will increase--at the expense of veal from newborn calves-from about 8 percent to about 18 percent. At a heavier average weight, this group, as well, loses ground to the remaining category of fat stock (including young cattle and dairy cows having calved once). At an average carcass weight of over 170 kilograms, over 16 percent veal must be expected. For 1970 and 1975, the following composition of the meat output has been estimated:
1960-64 1970 1975
Veal ................•......•........ 1% 16% 13% Fat stock, young cattle and young
dairy cows .•...................... 48% 54% 6~ Culled dairy cows having calved
twice and older specimens (about 20 per 100 births) ••.•••••.••••.•. 33% 3~ 27%
Supply response in broiler production
Broilers require very special facilities. They are processed in slaughterhouses, which have to be certain of a regular supply of birds. This has led broiler production-which largely takes place on the basis of contracts between the farmers and slaughterhouses (in some cases with the feed supplier included)--into being a specialty product of agriculture, more directly influenced by the customer than other lines of production. Consequently, supply is more a function of marketing possibilities and thus of the production policy of slaughterhouses. The quantity produced on farms can be changed by relatively small differences in contract prices. However, the margin between the farm-gate price and the market price of the slaughterhouses (or the closely related export price of the slaughtered birds) is of vital importance to the size of the supply of broilers.
23

The export price per kilogram of ready-to-cook bird relative to feed costs is an explanatory variable. Trend is also important. As broiler production has been built up in a relatively short time, and this rapid development was presumably influenced by the desire to achieve a strong position before establishment of the EEC market, we have assumed that this trend will gradually decrease after 1965 and will have completely disappeared by 1970.
The forecast of the supply in 1970 and 1975 and data on past broiler production are given in table 13.
Supply response in egg production
To explain the size of egg production, the hatching egg input was estimated. Then the laying hen population was calculated from the hatching egg input and a "retention factor" (a factor expressing the average time during which a laying hen is retained in the flock) was determined. It was assumed that the farmers' response would be reflected more directly in the hatching egg input, while, moreover, it would be reflected more exactly over a length of time than in the laying hen population at a given moment.
In table 14, a number of the most important data relating to egg production are summarized, and a forecast of egg production for 1970 and 1975 is given.
The results for 1975 are improbably low, which may be explained by the following factors:
a. The development of productivity was less rapid in the base period than is expected for the years to come and than has been assumed in the forecast of egg prices. The development of larger production units was for a long time checked for policy reasons. Not until 1961--though before that time a liberal exemption policy had been followed--was the maximum of 900 chickens per farm officially abolished. In recent years, large and more economic units have become increasingly important.
b. The assumption that egg prices for the Netherlands would be largely determined on the export market loses much of its force if exports cease.
The above considerations led us to amend the forecast of production in 1975 to the extent that Dutch production will, in any case, cover domestic consumption (see table 25).
24

Egg production releases hens for slaughter as a byproduct. Assuming that after the laying period hens will be supplied to the market as poultry meat, the number may be put at about 30 percent of the hatching egg input. This percentage results from the fact that the hatching result is about 67 percent, half of which are cocks, and the fact that some of the laying hens die prematurely.
Supply response in the arable sector
In the arable sector, production is much more closely tied to the soil than in livestock farming. Moreover, in many cases, changes in the growing plan for arable crops are less far-reaching and easier to realize financially than changes in the ratios between the various livestock products. For this reason, we were concerned more with an alternative distribution of the acreage and less with a more or less independent growth of production (the latter being the case with the various lines of livestock production). It has been assumed that the ratios between the proceeds may be a major incentive for expansion or contraction of the area under certain arable products. High proceeds, in themselves, will not make a certain product attractive. For instance, high production costs may have a predominantly negative influence. Consequently, in assessing the proceeds of arable crops, too, a "balance" (e.g., proceeds per hectare less direct costs) would be a useful explanatory variable. But, in addition to "direct costs," however they are defined, there are other inhibiting or stimulating factors which play a part in the assessment of proceeds per hectare. They include the needs and possibilities of the various types of soil, farm sizes, mechanization, and specialized knowledge. It is difficult to quantify the effect of these factors in usable fashion (e.g., by an addition to or subtraction from the direct costs per hectare for the crops in question). The supply for arable crops has consequently been based on the joint significance of the factors from the past, some of which have been stated and others which have not.
Another important aspect of the supply response for arable crops is the fact that, through crop rotation requirements, the relative share of a given crop in the total arable acreage is limited and that, as the acreage draws nearer to this maximum because of favorable prices, the price incentives required for further expansion are greater.
25

Another consideration is the extent to which the arable farmer responds traditionally. It may be asked whether the fact that the average farmer has had a cer-tain crop in his growing plan for a considerable time plays a big part or whether he draws up his growing plan independently of habits and exclusively by future price expectations. According to our calculations, the truth lies in between. Some data on the development of areas and yields of arable crops and the forecast for 1970 and 1975 are given in table 15.
The price differentials in the two alternatives for 1975 have only a very slight effect on the results. This can be explained by the fact that the differences in the price forecast are small compared with differentials in the past and that, moreover, differences in the two alternatives do not occur until 1970 and, because of delayed supply response, only begin to be felt in 1975.
According to the forecast, wheat production will increase, whereas feed grain production will drop somewhat despite the fact that, in the price hypothesis, a drop in the price of wheat relative to barley has been assumed. This is partly due to the relatively favorable prospects for a further increase in wheat yields. Increased yields can increase supply in two ways: (l) By greater pr.oduction per unit of area, and (2) by a stimulating effect on area, since returns from wheat growing rise more than returns from growing feed grains. The relative drop in the price of wheat assumed because of the export surplus of this product in the EEC is therefore apparently not big enough (even in alternative II) to compensate for the effect of increased yields, at least as far as Dutch agriculture is concerned. A stronger relative drop in price than assumed in alternative II (price of wheat : price of barley = 105 : 100) is hardly conceivable, since the price relationship in this alternative is based on the feed value ratio between these two cereals.
The differences between the present areas for the various other arable products and those forecast for 1970 and 1975 are strikingly small. A large part is played here by the assumption that, as EEC prices were unified, the big changes in price relationships had, by 1970, already occurred in the Netherlands.
Only for potatoes for human consumption is a substantial rise in output expected, this being the result of an assumed increase in yields.
26
An element given insufficient attention in the forecast is the probability that, for a number of crops, certain obstacles·in the path of expansion will be cleared away by technical developments. For instance, better results might be achieved in barley production in sandy soils through the development of new varieties, oats and rye being displaced.
FORECAST OF THE CONSUMPTION OF AGRICULTURAL PRODUCTS IN 1970 AND 1975
To determine the export supply or import requirement of agricultural products in unprocessed form in 1970 and 1975--the ultimate objective of this forecast--the forecast total domestic consumption and export surplus of the product in question in processed form should be subtracted from future domestic production. Thus, consumption estimates have been made for all domestic agricultural products for which a forecast of the domestic supply in 1970 and 1975 has been made. Moreover, estimates have been made of the consumption of products not produced in the Netherlands but which are important substitutes for domestic agricultural products, such as foreign cereals, other feedstuffs, and vegetable fats. In the special interest of the U.S. Department of Agriculture, tobacco, cotton, and oranges have also been included in the forecasts of consumption in 1970 and 1975.
As background information for the estimates of domestic consumption and the export surplus in processed form, balance sheets indicating origin and use over a series of years have been drawn up for each product. In these balance sheets, all forms in which the agricultural product becomes available and is consumed were reduced to a common raw material basis. The relative importance of the separate -consumption categories is apparent from these balance sheets, and the inclusion of all of the sometimes very divergent consumption categories in the forecast of consumption is guaranteed.
The balance sheets make it possible to express the estimates of consumption of final food products directly in quantities of raw material. The assumed relative changes in consumption of these final products are added to the relevant balance sheet items for the base year 1965. This makes a direct comparison between production and consumption in 1970 and 1975 possible.
27

The estimates for each product have been made by following three steps:
a. A forecast of domestic consumption of important foods, on the basis of a demand survey. The quantities of agricultural raw materials required for this purpose are regarded as the main use of the agricultural product in question.
b. A forecast of the domestic uses not covered by (a). In part, this forecast covers foods of minor importance, which can be clearly distinguished from the main use, and dealt with separately. Nonhuman consumption is also included in this category (e.g., feed and industrial consumption).
c. A forecast of the "external" consumption (export surplus) in processed form. As previously stated, the estimate of this use is necessary to determine the export supply or the import requirement of the agricultural product in unprocessed form.
a. the main use
The following have been regarded as main uses: bread, finer bakery products, table potatoes, sugar, milk, and milk products, butter, cheese, meat (including meat products), eggs, fresh apples and oranges, margarine and other edible fats, tobacco products, and cotton. For the estimate of consumption of many of these items, use has been made of an econometric demand investigation performed by the Central Planning Bureau (C.P.B.) for its forecast of the Dutch economy in 1970. With the aid of demand functions, which reasonably explained the development of per capita consumption in the past, 12/ the C.P.B. estimated consumption in 1970. These estimates have been generally used in this report. This was possible because our forecast assumes the same development of the general factors determining demand (e.g., growth in consumer expenditures, population growth) as the C.P.B. Minor differences over the future development of product prices led in some cases to making limited corrections.
The relationship found in the base period (1948-60) between consumption and the explanatory variables led, upon
l§Y The explanatory variables included consumption per person (in constant prices) and the price level of the product in question, and, where applicable, of substitutes.
28
extrapolation in the verification period (1960-65), to systematic differences from actual consumption for many products. Changes in consumption habits thus proved, in general, to be of considerable importance. This causes us to estimate consumption in 1975 (for which the C.P.B. did not make any estimates) by extrapolating the trend lines for 1965-70. No allowance was made for the price alternative posed for 1975; the differences in consumption as a result of the differences in price--very small on a consumer basis--are probably negligible compared with the uncertainty· of the estimates.
The consumption estimates for the principal foodstuffs in 1970 and 1975 are given in this section on the basis of consumption per head in kilograms or pieces per year. For the sake of comparability with the past, the corresponding consumption data for 1956-65 are also stated. 1!/ To determine the total requirement, allowance must also be made for the growth of the population. The effect of this on total consumption may be estimated at 7.3 percent for 1965-70 and at 15.9 for 1965-75· ~ A drop in consumption per head which is less than the percentage just stated (e.g., for bread), is therefore more than compensated for by the larger number of consumers. An increasing consumption per head leads, through the effect of population growth, to an acceleration of the total requirement.
The population forecast is shown in table 16. This table also includes the estimate of the development of private consumption, which is of particular importance to the consumption forecast, although its effect has already been considered in estimating consumption per capita.
The separate consumption estimates of foodstuffs have been summarized into the following groups: arable products (table 17), livestock products (main use), and the estimates for 1970 and 1975.
Consumption per head is generally stationary or even declining. Products with a rising trend, such as potato and finer bakery products, which in part are replacing
liJ Farming years running to July 1, or calendar years. The first eight years have been summarized to averages of 4 years each. ~ In the case of farming years, allowance has been
made for an extra 6 months, (January to June 1965), increasing the population effect by 0.7 percent.
29

bread and fresh potatoes, respectively, can by no means compensate for the entire decline in the consumption of bread and fresh potatoes. In the case of sugar, a decline is perceptible only from 1964 onwards. However, the consumption of sugar for household use has been dropping since 1958, but was temporarily more than compensated for by the consumption of sugar outside households. To judge by the estimates for 1970-75, past trends may be expected to continue.
As table 18 shows, the milk sector has experienced a pronounced drop in li~uid milk consumption per capita, offset by almost as large an increase in condensed milk and products. For 1970-75, the trend is expected to continue. Consumption of butter will fall, under a considerable price increase; consumption of cheese will increase somewhat.
Meat consumption per person has steadily risen. Only in 1964/65 did a drop occur, because of considerably lower beef consumption for a temporary period. A vigorous increase in pork and poultry meat consumption is expected in the future. The consumption of beef and other meat (mainly edible offal, horsemeat, and mutton) will increase to a lesser extent. l]/
For eggs, the consumption of which has been practically constant over the last 5 years (1964, with abnormally low prices, must be regarded as an exception), an increase in per capita consumption is expected as well.
Per capita consumption of apples, oranges, edible fats (excluding butter), tobacco products, and cotton is shown in table 19.
An increase in consumption is assumed for both apples and oranges. In the consumption of apples in 1965 (crop year 1964/65), allowance should be made for the exceptionally good harvest, as a result of which consumption per head must be regarded as exceptionally high.
Among the edible fats, a drop in margarine consumption is expected, which is almost compensated for by greater consumption of edible oil and compound fats.
1jJ A possibly marked increase in meats such as rabbit, turkey, and guinea fowl, which are of little relative importance, has also been considered in the group "other meat."
30

Consumption of tobacco will continue to rise, allowance having been made for the fact that cigarette consumption in particular was artificially stepped up in 1965, through anticipatory stockpiling by retailers and smokers, before an increase in excise duty became effective January 1, 1966.
Cotton consumption will recover somewhat from the low level in 1965.
b. the remaining domestic consumption
The estimate of other uses than the main use under (a) amounts more or less to an extrapolation of the development in the past, above all the recent past. The opinions of practical experts were sought as to the probable prospects. The relative significance of these uses varies considerably. In the case of livestock products, the entire domestic human consumption is covered by the main use. The remaining domestic consumption is highly significant in the case of feed grains, of which 90 percent and more of the domestic consumption is by the livestock sector; about 5 percent goes to the starch industry, breweries, and glucose manufacture.
Other products than grains also play an important part in the feed supply.
The importance of livestock as a consumer of agricultural products emerges as indicated in table 20. The estimated feed requirement in 1970 and 1975 is based on: (l) An assumption about future composition of the feed ration, (2) the forecast of the livestock populations, and (3) the expected improvement in feed conversion. The table shows that the feed requirement will increase considerably up to 1970. From 1970 to 1975, a much smaller increase is expected.
The great requirement of concentrates, which on a produ~t-weight basis is still increasing considerably, ~
1EJ One unit of starch equivalent (approximately l kilogram of starch) corresponds to about 1.35 kilograms of grain, 2.22 kilograms of grain waste, 1.43 kilograms of cattle cake, 1.88 kilograms of animal protein, 1.47 kilograms of dried skimmed milk, etc.; roughage has a much more unfavorable product weight to starch equivalent ratio (e.g., grass about 9).

can only be met in part by domestic production. For feed grains, cattle cake, animal protein, and dried skimmed milk, in particular, imports for livestock feed are of decisive importance. For instance, feed grain imports of nearly 3.6 million tons are estimated for 1970, with a feed requirement of (in product weight) 4.2 million tons of grain and something less than 0.6 million tons of grain waste.
c. the export surplus of processed agricultural products
The forecast of the export surplus of processed products in 1970 and 1975 is likewise based on a reasoned extrapolation, partly based on views of experts consulted. These exports are of particular importance to the dairy sector, meat products, sugar-containing products, and starch. The exports of refined or further-processed fats are also considerable. Exports of cereals in the form of biscuits and other foods do not play a very big role compared with the other items on the grain balance sheet.
FORECAST OF THE EXPORT SUPPLY AND THE IMPORT REQUIREMENT OF SOME IMPORTANT AGRICULTURAL RAW MATERIALS
By comparing the supply and consumption estimates, the export supply expected in 1970 and 1975 can be determined. In this process, the import requirement is regarded as being a negative export supply.
As already stated, the export supply will be given in unprocessed form; imports and exports of processed pr9ducts have therefore been separately determined in advance. The export supply in unprocessed form has been determined as the balance of production and consumption. In practically every case, both imports and exports occur; but only the balance of these two movements has been forecast. As examples, exports of malting barley have been subtracted from imports of feed barley, and imports of high-grade wheat for the meal-and-flour-processing industry are partly offset by exports of Dutch wheat.
In the following compressed balance sheets, sowing seed, losses, etc., have been counted as domestic consumption. Stock changes are assumed not to take place.
Cereals
The import requirement for wheat (table 21) will continue, up to 1970, to follow the declining trend, evidenced
32

since 1960. The main reasons for this are the considerable increase in domestic production and the assumption that wheat will cease to be used as feed. Conversely, the expected further drop in bread consumption per capita is more than offset by population growth and the increasing per capita consumption of finer bakery products. From 1970 to 1975, the import requirement will again rise gradually. With production remaining about the same, the increasing total consumption can have its full effect and is no longer depressed by declining consumption of wheat for other purposes.
The high import surplus of 164,000 tons of processed wheat from 1959/60 to 1962/63 may be ascribed to imports of wheat meal for feed. Now that the EEC market regulation for cereals bas become effective, hardly any imports of wheat or wheat meal for feed occur.
The feed grains display a further considerable increase in the already considerable import requirement. This increase is caused by the forecast growth in numbers of livestock, notably cattle, pigs, and broilers. The import requirement of other feeds than grains is also increasing greatly.
In view of the interchangeability of the various grains, it is not feasible to give a detailed list of the various kinds for 1970 and 1975. In 1964/65, corn beaded the list of imported feed grains with about 67 percen~ followed by millet and sorghums (approximately 27 percent) and rye (4 percent). It seems reasonable to assume that this ratio will be broadly maintained. The forecast tells nothing about the origin of grain imports in 1970 and 1975. Whether and to what extent feed grains from outside countries will be replaced by cereals from the EEC countries (especially France) cannot be forecast.
The low export surplus of products from feed grains in 1963/64 and 1964/65 was the result of unusually large imports (86,000 tons) of processed corn for feed in 1964/65.
Potatoes, sugarbeets, and rapeseed
Table potatoes include seed potatoes, of which about 50 percent lL/ are exported. Use as feed (including losses)
1j/ During crop years 1962-64, exports of seed potatoes were 283,000, 250,000, and 254,000 tons, respectively.
33
averages more than 600,000 tons, ~ mainly potatoes from sandy soils. The export supply of table potatoes (table 22) is forecast to decline in 1970, but in 1975 will about equal the level of 1963/64 and 1964/65.
For industrial potatoes, the forecast of the Central Planning Bureau for 1970 has been extrapolated to 1975. Production is confined almost exclusively to one region, which is why practically no change in area and production is expected. The greater part of the production goes abroad in the form of starch and starch derivatives.
The production of sugarbeets is given in white sugar equivalent. The increase in production up to 1970 is practically compensated for by growth in domestic consumption and greater exports of processed sugar. During 1970-75, on the other hand, the import requirement of sugar will rise by about 34 percent.
Domestic rapeseed or coleseed is rarely used for the extraction of oil. The greater part is exported as sowing seed and bird seed. We assume that this will continue. As domestic production is expected to increase sharply, the export surplus will increase.
Milk and dairy products
Since the use made of the several components of milk varies, it is desirable to provide separate figures for skimmable butterfat and skimmed milk (table 23). l1/ The increase in butterfat production must almost exclusively be added to the quantity available for export (in the form of dairy products), since domestic consumption of butterfat in liquid milk and dairy products will change little.
1§/ Approximately 25 percent of production was assumed in the forecast for 1970 and 1975.
l1f For example, the average fat content of the base milk (butterfat plus skimmed milk) for the various dairy products is butter 84 percent, cream 38.2 percent, condensed milk (including coffee milk) 3.3 percent, dried whole milk 3.1 percent, and cheese 2.9 percent. Through the removal of moisture, the fat content for the following products (product weight) becomes much higher: cheese on the average about 29 percent, condensed milk about 8 percent, and dried whole milk about 26 percent.

Domestic consumption of skimmed milk will increase further, but, less than production, so that the supply of skimmed milk for export in liquid form or in dairy products will increase, at least relative to 1963/64 and 1964/65.
Besides the relatively small exports of milk in natural form, the basic components {skimmable butterfat and skimmed milk) available for export are processed into dairy products. Data on these processed forms of milk are given separately in table 24. In this table, data are in product weights for simplicity. Except for butter, the difference between product weight and the weight of the milk required is very great, as is also evident from the table. The assumed distribution among the individual dairy products should be regarded as one of a very large number of possibilities.
The listed uses of the quantity of processed milk available for export are from separate forecasts of the export surplus for cheese, condensed milk, and dried whole milk. After these estimates have been incorporated in the milk balance, a considerable surplus of butterfat in 1970 and 1975 is revealed. It is assumed that this surplus will become available for export in the form of butter, the export supply rising by 54,000 to 85,000 tons in 1970.
The EEC is already self-sufficient in butterfat. There is, however, no reason to revise the producer prices assumed for milk in 1970 and 1975· The price hypothesis already allows for greater difficulty in valorizing dairy products {notably butter) on the EEC market by assuming a relative drop in the target price for milk. The production accompanying this assumption in the Netherlands will, insofar as it cannot be sold on the EEC market at this target price, find another use {either going with the aid of export subsidies to outside countries or being sold on the internal market by means of price concessions) at the expense of the European Agricultural Guidance and Guarantee Fund.
Skimmed milk, on the other hand, will be inadequately produced in 1970 and 1975 to meet both domestic requirements (in which, above all, the demand for dried skimmed milk for the feed industry plays an important part) and the estimated export requirements of dairy products. The skimmed milk deficiency in 1970 and 1975 has been included in table 25 as an import requirement of dried skimmed milk.
The import surplus of dried skimmed milk in 1970 is expected to be nearly 25 percent less than in 1963/64 and 1964/65, as a result of increasing domestic milk production
35

and a marked increase in butter output. During 1970-75, the import requirement of dried skimmed milk will again increase. The difference between the two alternative estimates for 1975 is striking, the percentage increases over 1970 being: alternative I, 10.8 percent and alternative II, 24.2 percent.
Meat and eggs
According to the estimates of production and consumption, the export supply of meat will increase considerably and will reach about a quarter of production in 1970 and 1975.
For eggs, contrary to the result of the supply function, 1975 production is assumed to meet domestic requirements. Exports will disappear almost entirely.
For the principal kinds of meat--beef (including veal), pork, and broilers--table 25 gives the forecast of the export surplus in 1970 and 1975 separately. 1:'§/
For beef, an international exchange of grades plays a large part. Considerable imports also take place, largely in the form of live animals. The chief item exported is veal; more than 50,000 tons were exported in 1964/65. In 1964/65 and 1963/64, 74,000 and 71,000 tons of beef and veal went abroad, while 64,000 and 52,000 tons were imported. A similar picture is assumed for 1970 and 1975.
The fluctuations, not evidenced by the table, of beef consumption, in particular in 1963/64 and 1964/6~were considerable (255,000 tons in 1963/64 and 209,000 tons in 1964/ 65). High prices of beef in 1964/65 caused the consumer to switch largely to pork, so that the consumption of pork became greater than that of beef. Although beef consumption displayed a vigorous recovery in 1966 from the especially low level in 1964/65, it seems probable--because of the improved quality of pork--that the consumer will eat relatively more pork.
~ The balance of total meat consumption, after deducting the principal kinds of meat stated (average for 1963/64 to 1964/65, 81,000 tons; 1970 and 1975 estimates, 93,000 and 97,000 tons respectively), is likewise rising. Allowance has been made for the consumption of kinds of meat which though of minor importance may display a marked increase in consumption (e.g., rabbits, turkey, and guinea fowl).

Production of pork will probably rise so strongly that the export supply will also become much greater. Imports of pork are minor.
Production of broilers for export is of predominant importance. In the 6 years up to 1970, this is expected to double, followed by more modest growth. The consumption of meat from layers in 1970 and 1975--lower because of a reduced laying flock--is assumed to be entirely confined to the Netherlands except for 10,000 tons of processed poultry meat for export. Domestic consumption of poultry in 1970 and 1975 would be about 14,000 and 11,000 tons higher, respectively, than stated in table 26 for broilers. In the 2 years 1963/64 and 1964/65, domestic consumption averaged 11,000 tons. Total production was 31,000 tons, of which 15,000 tons was exported as poultry as such, and 5,000 tons in processed form.
Oils and fats
The import requirement of oils and fats will continue to grow, chiefly because of strongly increasing industrial consumption. The consumption of margarine, the main product, will rise only slightly.
Products in processed form in export surplus include margarine, compound fats and shortenings, and the fat incorporated in mayonnaise, biscuits, soap, etc. In addition, there are considerable exports of oils and fats in various stages of processing, such as refined oils and fats produced from imported seeds, partially refined edible animal fats, etc. The transition from raw material to final product is gradual. These exports, which in themselves induce a considerable import requirement, are not visible as imports on the basis of fat given in table 27. According to the methods followed so far, balances are stated only on a raw material basis. However, the trade in fats and oils includes products that have undergone a form of processing. In view of the great size of such exports, it seems desirable to include these products. Thus, estimated exports of the slightly processed oils and fats are given in table 27. This item has been added to the import surplus, and accordingly, gross imports of the raw materials become evident.
37

Cattle cake, including all feeds originating from oilseeds and corn gluten, 1:2/ is an important bJ1llroduct of the extraction of oils. It is expected that the feed requirement will increase considerably. Approximately the same development occurs with regard to the exports of cattle cake as with exports of oils and fats; the presumable imports in 1970 and 1975 will be correspondingly higher.
Some foreign products
The import requirement of rice in 1970 and 1975 remains practically unchanged, and traditional exports of factory rice are maintained near the 1964-65 level (table 28).
The consumption of oranges will continue to increase.
In the case of tobacco, the difference between 1964-65 and the forecast for 1970 seems considerable. This is due, however, to the fact that in 1964 the consumption of cigarettes displayed a sudden sharp drop (14 percent from 1963). But by 1965 more cigarettes than ever were smoked, over 25 percent more than in 1964. ~ The forecast allows for a steadily rising trend. The export surplus of tobacco products is in cigars and cut tobacco; on balance, cigarettes are imported.
Exports of cotton waste were not subtracted from the estimated import requirement of raw cotton, since this is a waste product of the textile industry. For 1970 and 1975, exports are estimated at about 20,000 tons. This has been included in the export surplus in processed form. The remaining 2,000 tons are cotton yarns and fabrics.
CHECKING THE PRODUCTION ESTIMATES
Finally, we made a rough check of the supply forecast by an estimate of the development of the total number of
12/ The consumption of feed in 1975 depends on which of the two production estimates are used. The figures in the table relate to alternative I; in the case of alternative II, 10,000 tons less of cattle cake will be required. ~ In 1965, this consumption (sales of the tobacco-pro
cessing industry according to tax stamps) was partly exaggerated by stockpiling among retailers and consumers in anticipation of an increase in the excise duty on January 1, 1966. Average consumption and the average increase in 1960-65 were bases of the forecast.
38

"standard" hours (the standardized labor requirement per unit of output in a base year--1962). ~
Apart from the forecasts by product of the supply in 1970 and 1975, a forecast has been made of total agricultural production (excluding horticulture) in standard hours, based on the forecasts of the development of labor sup-ply ~ (in man-hours) and of labor productivity (in standard hours per man-hour) •
For this forecast, three areas were distinguished: the arable farming area, the pasture farming area, and the mixed farming area. For each of these regions, the future outflow of labor--including both the male agricultural labor force and the total labor supply--was estimated in labor year units (man-years). The f<Y.t'ecast of labor supply expressed in man-hours was obtained from a preceding forecast of the number of man-hours per labor year unit. The rise in labor productivity was also forecast from past developments. The assumed outflow of labor until 1975 was also considered. Labor productivity was obtained by means of an interval estimate.
These two forecasts of labor supply and labor productivity result in a forecast of the development of the total number of standard hours for each of the areas. Adding the figures for the three areas, we arrive at the estimate contained in table 29 for the agricultural sector as a whole (in index figures).
The question is to what extent this forecast of the total production and the supply forecast described earlier are consistent. In more concrete terms: Is the total number of standard hours for each product derived from the supply forecast within the interval derived from the expected development of labor supply and labor productivity?
To make the comparison, the results of the supply forecast have been converted into standard hours • A separate estimate--by means of extrapolation of the past--has been added for those lines of production which were not represented in the supply response study. The ultimate result is in table 29.
~ This estimate has not been included in this summary report • ~ Including contract labor.
39

It appears from the table that the two overall forecasts, made independently, are not contradictory. Nor is this the case for each of the areas of agriculture {the arable, pastureland, and mixed zones) separately. There is thus no reason to conclude that there is any inconsistency between the different lines of production.
40
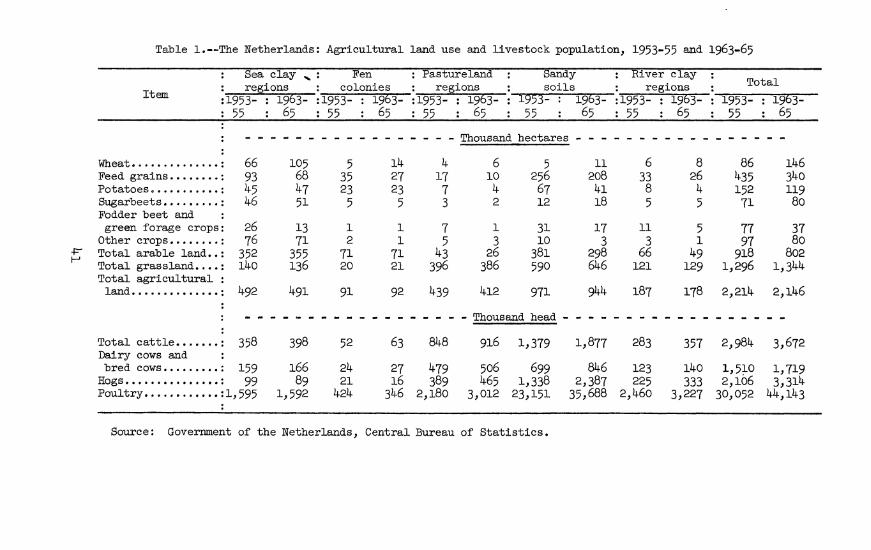
Table 1.--The Netherlands: Agricultural land use and livestock population, 1953-55 and 1963-65
Sea clay , : Fen : Pastureland : Sandy : River clay It . regions : colonies : regions : soils : regions : Total
em :1953- : 1963- :1953- : 1963- :1953- : 1963- : 1953- : 1963- :1953- : 1963- : 1953- : 1963-55 : 65 : 55 : 65 : 55 : 65 : 55 : 65 : 55 : 65 : 55 : 65
- - - - - - - - - - - - - - - Thousand hectares - - - - - - - - - - -
Wheat •............. : 66 105 5 14 4 6 5 11 6 8 86 146 Feed grains .•...... : 93 68 35 27 17 10 256 208 33 26 435 340 Potatoes ........... : 45 47 23 23 7 4 67 41 8 4 152 119 Sugarbeets •...•.... : 46 51 5 5 3 2 12 18 5 5 71 80 Fodder beet and : green forage crops: 26 13 1 1 7 1 31 17 11 5 77 37
Other crops •....... : 76 71 2 1 5 3 10 3 3 1 97 80 ~ Total arable land •. : 352 355 71 71 43 26 381 298 66 49 918 802
Total grassland •... : 140 136 20 21 396 386 590 646 121 129 1,296 1,344 Total agricultural :
land ........•..... : 492 491 91 92 439 412 971 944 187 178 2,214 2,146
- - - - - - - - - - - - - - - Thousand head - - - - - - - - - - - - - - - - - -
Total cattle •.....• : 358 398 52 63 848 916 1,379 1,877 283 357 2,984 3,672 Dairy cows and : bred cows •......•. : 159 166 24 27 479 506 699 846 123 140 1,5~0 1,719
Hogs ......••...•.•. : 99 89 21 16 389 465 1,338 2,387 225 333 2,1o6 3,314 Poultry •....•....•• :l,595 1,592 424 346 2,180 3,012 23,151 35,688 2,460 3,227 30,052 44,143
Source: Government of the Netherlands, Central Bureau of Statistics.

Tab.le 2.--The Netherlands: Male agricultural working population, 1947, 1960, and 1965
Item 1947 1960 1965
- Thousand persons - - - -
Farm heads ...................... : 237 207 185 Sons working on farm ............ : 110 61 55 Hired workers ................... : 186 96 70
Total ........................... : 533 364 310
97 75 72 +="" -1\) Horticulture .................... :
Sources: Government of the Netherlands, Central Bureau of Statistics, and estimates oy Agricultural Economics Research Institute, The Hague.

Table 3.-•The Netherlands: Number of farms classified according to size, 1947, 1955, 1959, and 1965 11
: 1965 as Hectares 1947 1955 1959 1965 :percentage
: of 1947
- Number - - Percent
1-3 . ....... : 35,600 23,600 15,100 9,500 27 3-5 .... .... : 30,000 26,900 21,200 14,400 48 5-7 •.....•. : 26,000 26,100 23,400 17,500 67 7-10 ..•...• : 30,000 35,700 33,700 28,000 93 10-20 .•...• : 47,800 48,800 52,300 53,000 111 20-30 ...... : 16,600 15,300 15,400 16,100 97 30-50 ...... : 9,400 8,400 8,500 8,500 90 Over 50 .••• : 2,200 1,900 1,900 2,000 91
: Total ...... :197,600 186,600 171,500 149,000 75
11 Farms in which farming is the main occupation of the operator.
Source: Government of the Netherlands, Central Bureau of Stat·istics.
43

Table 4. --Tbe Netherlands: Production and consumption of arable and livestock products, 1956-58 and 1961-63 l/ gf
Item :1956- :1961-• 58 : 63
Million guilders
Arable farmi~ : Production ~xcluding forage crops) •••••••• : Domestic consumption (excluding forage :
crops.) •••••••••• • • • • • • • • • • • • • • • • • • • • • • • • • • :
Net imports (excluding forage crops) ••••••• :
Livestock farming
617
851
234
Production ••••••••••••••••••••••••••••••••• : 31 319 Domestic consumption ••••••••••••••••••••••• :2,lo4
Net exports ................................ :1,215
Arable farming plus livestock farming Production ••••••••••••••••••••••••••••••••• :3,936 Domestic consumption ••..••..•.••.•••••..••• :2,955
679
858
179
4,128 2,575
1,553
4,807 3,433
:1961-63 as :percentage :of 1956-58
Percent
110
101
76
124 122
128
122 116
Net exports •.••••••.••••••••••••••.•••••••• : 981 1, 374 140
l/ Both production and consumption have been expressed in 1958 growers' prices; hence, the changes between the two three-year averages can be regarded as changes in volume. The feed grains and other feed crops grown in the Netherlands for domestic use have not been included in gross agricultural production nor consumption, but are regarded as inter-farm sales. The cereals imported for feed have been subtracted from total imports of agricultural products. These corrections were necessary, on the one hand, to restrict gross production of agriculture to those products which do, in fact, find a use outside agriculture and, on the other hand, to limit the consumption of agriculture products to non-agricultural consumption outside agriculture. By means of these corrections, production and consumption can be compared.
g/ Solely agricultural products produced in the Netherlands, but including foreign cereals such as maize, sorghums, milo, etc., beca~se of their great substitutability for domestic feed grains.
Sources: Government of the Netherlands, Central Bureau of Statistics, and estimates by Agricultural Economics Research Institute, The Hague.
44

Table 5.-~The Netherlands: Value of production, nonfactor inputs, and income of Dutch agriculture (including horticulture),
1953-64, in current prices
Item :1953- :1956- :1959- :1962-: 55 : 58 : 61 : 64
- Million guilders -
Gross value of agricultural and : horticultural production •••••• ; ••••• :4,379 5,117 5,966 7,063
Nonfarm_inputs, total •••••• ~·········:l,780 2,248 2,829 3,415 feed •••••••••••••••••••••••••••••••• : 847 1,166 1,570 1,949 fertilizers, pesticides, and insecticides ••••••••••••••••••••••• : 311
maintenance, depreciation ••••••••••• : 362 fuels, electricity •••••••••••••••••• : 72 other nonfarm inputs •••••••••••••••• : 188
Net value added at market prices
319 435
93 235
350 497 107 305
398 576 121 371
(1-2) ••••••••••••••••••••••••••••••• :2,599 2,869 3,137 3,648
Indirect taxes ••••••••••••••••••••••• : 84
Subsidies ••••••••••••••.••••••.•••••• : 27
Net value added at factor costs (equals agricultural income) :
73
281
93
375
loB
388
(3-4 + 5) ........................... :2,542 3,077 3,419 3,928
Agricultural income as percentage of the national income at factor costs •..•••••••••••••••••••••••••••• : 11.7 10.8 9·9
Source: Government of the Netherlands, Central Bureau of Statistics.

Table 6.--The Netherlands: Producer price relationships, forecast for 1970 and 1975 compared with 1967 common prices (barley = 100)
Item Unit 1967 1970 :1975 1 ~1975 II
Wheat ............... : 100 kg 115 113 110
Barley .............. : 100 kg 100 100 100
Rye ........•.....••. : 100 kg 99 97 95
Oats ...•.•....•..... : 100 kg 95 93 90
Maize ..........•..•• : })100 kg 103 105 105
Sugarbeets ...•...•.. : 5}1,000 kg 210 205 200
Table potatoes ]/ . .. ; 100 kg 48 47 46
Rapeseed ...........• : 100 kg 197 195 190
Milk ................ : '!:J}lOO kg 115 113 110
Beef cattle .....•... : 100 kg live wt.: 742 745 745
Calves .............. : 100 kg live wt.:l,o45 1,050 1,100
l/ Threshold price c.i.f. Rotterdam in the month of July. gj 16 percent sugar. 3/ Potatoes grown for human consumption. ~/ 3.7 percent butterfat.
46
105
100
90
85
105
190
44
180
105
745
1,100

Table 7.--Th~ Netherlands: Nominal producer prices, 1962, 1965, common prices for 1967, and forecast for 1970 and 1975
Commodity Unit : Period : 1962 : 1965 : :
1967 : 1970 : 1975 I : 1975 II
-.Quilders - - - - -
Wheat y ... ....................... ; : 100 kg : selling
: season :?}30.98 35.91 35.50 37-90 40.00 38.30 Barley (feed) ?} .................. : do. : selling
season :?}27.06 31.83 31.00 33-70 36.50 36.50 Rye .....•..•••.••••••••••.••••.••• : do. : selling
: : season :?}24.79 29.53 30.75 32.80 34.70 32.80 Oats y ........................... : do. : selling :
: : season : 25.88 30.03 29.50 31.40 32.90 31.00 .p- Sugar beets ex place of loading : : : -..:]
(16% sugar) ••.•••••..••.••.••.•.• :Thousand ton: 52.44 66.26 65.00 69.00 72.80 69.30 crop year :
Table potatoes, ex farm, (sand and: clay areas) .............. o o •••••• : 100 kg : crop year : 12.95 19.90 15.00 15.00 15.00 16.80
Rapeseed ex farm, (average Dutch : quality) ........ - ................ : do. : crop year : 39.00 42.00 61.00 65.60 69.20 65.70
: . . . . Milk, ex farm (3.7% fat) •••••••••• : do. : April-April :d/27.96 33.08 35.50 37.90 40.00 38.30
: Beef cattle, live wt. (second :
: April-April : 166.00 grade) ....•..•••••.•..•......•.•• : do. 232.00 230.00 251.00 271.00 271.00 : :
Calves, live wt. (second grade) : 100 kg : April-April : 231.00 314.00 324.00 354.00 402.00 402.00 : : :
--Continued
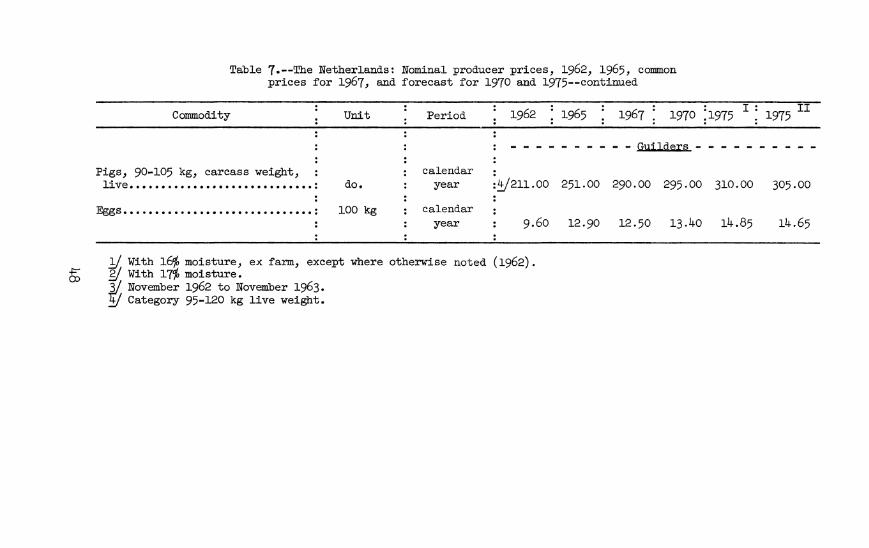
~ CP
Table 7.--The Netherlands: Nominal producer prices, 1962, 1965, common prices for 1967, and forecast for 1970 and 1975--continued
Commodity Unit Period 1962 : 1965 . 1967 : 1970 :1975 I : 1975 II . .
- - - - - - - - - - Guilders - - - - - - - - - -:
live . ............................ : do. calendar
year ::t/211.00 Pigs, 90-105 kg, carcass weight,
: Eggs • ••••••••••••••••••••••••••••• : 100 kg calendar :
year : 9.60
~With 16% moisture, ex farm, except where othe~~se noted (1962). gj With 17% moisture. 3/ November 1962 to November 1963. ~ Category 95-120 kg live weight.
251.00 290.00 295.00 310.00 305.00
12.90 12.50 13.40 14.85 14.65

Table 8.~-European Economic Community: Assumed wage, price, and income levels of the agricultural working population and price levels of agricultural products, forecast
for 1970 and 1975 (1967=100)
Item .
1967 .
1970 : 1975 I : 1975 II . . : . . . . Wages (nominal) ........................•..•......•... o: 100 121 158 158 Wages (real) ..................................•....... : 100 112 136 136 Price of consumer goods •.•.•.•••...•••••••••.••..••..• : 100 108 116 116 . . Labor income per person in agriculture (nominal) •••••• : 100 121 158 148 Labor income per person in agriculture (real) ......... : 100 112 136 127
\f; Labor income per person in agriculture.Y (relative) .• -: 100 100 100 94 . . Price level of agricultural products~ (nominal) ••••• : 100 108 115 111 Price level of agricultural products gj (real) •••••••• : 100 100 99 96
~ The ratio between the labor income per person in agriculture and the wage income per person outside agriculture.
'?) Excluding hogs, poultry, and eggs.

\.Jl 0
Table 9.--The Netherlands: Data for hog production, 1959-64 and forecast for 1970 and 1975
Production period
: 1959 Jan-Jun ••••••••••••• :
Jul-Dec ...•.•..•.... : 1960 Jan-Jun ••••••••••••• :
Jul-Dec ....•..••.... : 1961 Jan-Jun ••••••••••••• :
Jul-Dec ••.•.•...•... : 1962 Jan-Jun ••••••••••••• :
Jul-Dec ••••••.•••.•• : 1963 Jan-Jun ••••••••••••• :
Jul-Dec •...•••..••.• : 1964 Jan-Jun ••••••••••••• : 1970 .. .....•..•.......... : 1975 Io••••••• .. ••••••••••: 1975 n ............. - ............ :
Relevant sow population census l/
- - Thousand sows - - ·
'58 Jan-Jun 290 Jul-Dec 282
'59 Jan-Jun 331 Jul-Dec 356
•6o Jan-Jun 365 Jul-Dec 324
'61 Jan-Jun 354 Jul-Dec 368
'62 Jan-Jun 395 Jul-Dec 373
'63 Jan-Jun 337 544 634 635
Pigs : Prices of butchers' : Carcass slaughtered : hogs per 100 kg, : weight per
pe;: sow : slaughter weigh.t : hog gj
- - - - Guilders - - - - - Kilograms
6.21 '57 Jul-Dec 217 89 7·45 '58 Jan-Jun 209 89 7.18 Jul-Dec 226 83 8.08 '59 J'SJ;l-'Jun 234 83 6.60 Jul-Dec 225 85 7.18 '60 Jan-Jun 199 85 7.42 Jul-Dec 215 85 6.28 '61 Jan-Jun 235 84 6.57 Jul-Dec 211 84 6.74 '62 Jan-Jun 207 83 7-50 Jul-Dec 219 82
295 305 31.0
1/ The number of sows from which the pigs for slaughter supplied in the period stated in the first column are farrowed.
g/ Including lard and suet.

Table 10.--The Netherlands: Data for dairy production, 1955-65 and forecast for 1970 and 1975
Calves : Milk : : Ratio of : : Milk price Calves : born per : production : Fat meat price : : (percentage Year born : hectare of : : content J} : to milk : Year :
grassland : per birth ]}_ : : price : : of unit cost 5./)
Thousand head - Kilograms - - Percent - : : - - - Percent
1,496 11.4 :
1952 ••• : 1955 ••••..• : 1.15 3,900 3.75 : 115 1956 ..••••• : 1,492 1.15 3,950 3·75 12.7 : 1953 .•• : 112 1957 •..••.. : 1,480 1.13 4,050 3.78 10.2 : 1954 ... : 106 1958 ••.••.• : 1,545 1.17 4,020 3·73 10.1 : 1955· .• : 106 1959· ••.... : 1,584 1.19 4,130 3.80 10.9 : 1956 ••• : 99 1960 ••••.•• : 1,672 1.26 4,120 3.80 10.7 : 1957· .• : 113
V1 1961. .••... : 1,702 1.27 4,130 3.82 11.2 1958· .. ; 110 1-' : 1962 •••.••. : 1,828 1.35 3,830 3.83 10.9 : 1959· ••. 107 1963 •••.••• : 1,839 1.36 3,950 11. 10.4 : 1960 ... : lo4 1964 ....... : 1,693 1.26 4,120 "JI 11.8 : 1961 ... : 102 1965 ••••... : 1,774 1.33 11 ]/ 11 : 1962 ... : 99
: : 1963 ... ; 105 1970 ....... : 1,929 1.46 4,200 3.90 11.3 : 1970·. ·: 105
1975 I .. ···: : I :
1,960 1.50 4,250 3·95 11.5 : 1975 •. 101 1975 II .... : 1,933 1.48 4,250 3·95 12.0 1975 rr: 101
:
1} Split-year data (except forecast years); e.g., 1955=1955/56. gj Agricultural Economics Research Institute farms in pasture areas. ]/ Comparable data unavailable.

Table 11.--The Netherlands: Forecast of milk production, 1970 and 1975
Item Unit :L970 ;1975 I II
1975
Hectares of grassland .•.. : Thousand :1,321 1,306 1,306 Births per hectare •...... : Number : 1.46 1.50 1.48 Total births ••••...•••..• : Thousand :1,929 1,960 1,933 Milk yield •••••.••••••••• : kg per birth :4,200 4,250 4,250 Total whole milk ••.•••••• : Thousand ton :8,102 8,330 8,215 Fat content ..........•••• : Percent : 3.90 3·95 3·95 Skimmable butterfat .••... : Thousand ton 311 324 320 Skimmed milk ••••••••••••• :Thousand ton ~:7,791 8,oo6 7,8~5
~ With 0.06 percent residual fat.
Table 12.--The Netherlands: Cattle, carcass weight per animal, 1955-64 and forecast for 1970 and 1975
Year Adult cattle: All cat~le for slaughter :Excl. destruct~ons :lncl. destructions
- - - - - - - - - - Kilograms - - - -
1955•••••o•••= 285 145 131 1956 ......... : 281 145 131 1957 •••••••.• : 293 156 141 1958 •••.••••• : 287 157 143 1959· •••••••. : 283 161 147 1960 ••••••••• : 285 166 149 1961 •.•...... : 284 170 152 1962 •......•. : 279 181 161 1963 ......... : 264 168 153 1964 ••.•...•. : 263 165 149 1970 ......... : 260 185 165 1975· .•.••.•. : 260 195 175
52

Table 13.--T.he Netherlands: Production of broilers (ready-tocook weight), 1955-65 and forecast for 1970 and 1975 1/
Year Production Export price Feed cost
Million kilo£am.S - - - - - Guilders - -
1955· ......... : 8.1 4.36 1.6o 1956 •••••••••• : 11.6 4.19 1.63 1957· ••••••••• : 10.9 4.05 1.50 1958 •••••••••• : 15.6 3.71 1.51 1959· ......... : 20.4 3.50 1.47 1.960 ••.••••••• : 29.8 3.24 1.33 1961 •••••••••• : 37·5 2.81 1.31 1962 .......... : 47.4 2.83 1.37 1963 •••••••••• : 59·5 2.76 1.34 1964 .......... : 89.2 2.77 1.33 1965 •••••••••• : 113.4 y y 1970 •••••••••• : 177·9 3.04 1.43
1975 I ........ ; 213.2 3.25 1.47 1975 II ....... : 211.7 3.23 1.47
y For the sake of comparability 1 ready-to-cook weight has 1 in all cases 1 been put at 70 percent of the live weight 1 though in the first years the broilers were not supplied ready-to-cook, and in recent years the actual percentage has risen to 74 percent.
gj Comparable data unavailable.
53

Table 14.--The Netherlands: Layer and egg production, 1955-64 and forecast for 1970 and 1975
Year
l955oooooo: l956o ••••• : 1957 ••• 0 •• :
1958oooooo: 1959 0 • 0 0 •• :
1960 •••••. : 1961. .••.. :
V1 1962 ...... : +=""" 1963 ...... :
1964 ••.••• :
1970 ...... :
1975 I .... ; 1975 II .. ·:
Gross egg :-- ~ggs -per hen 1T : Reten- - --:- . Egg prl.ce production : On : Other : tion : (hatching on farms l/ : farms : than farms : factor 11 : season) 11 - Millions -
3,836 4,534 4,378 5,084 5,418 5,103 5,6ll 4,858
5I ?J
l/3,390
4/3,180 :£13,180
193 206 208 207 204 196 191 186 5I ?J
203
207 207
24 23 25 23 22 25 22 23 5I ?J 12
8 8
1.080 1.010 1.015 1.032 1.046 1.127 1.141 1.139
5I ?J
1.2
1.2 1.2
Guilders/kg
2.59 2.00 2-38 2.02 1.84 2.13 1.68 2.22 1.70
y 2.28
2.52 2.49
l/ $plit-year data (except forecast years); e.g., 1955=1955/56. gj Comparable 'data unavailable. .
Hen slaughter-
ings
Hatching egg input J}
- - - - - Millions - - -
13.0 15.2 19.4 18.8 21.7 23.3 19.9 25.1 22.0 20.3
14.2
8.4 7·3
81.8 67.1 79·9 90o6 73.6 91.2 78.7 70·9 55·7 43.9
47.2
28.1 24.3
3/ Including nonagricultural production brings total to 3,590 million eggs. ~ Domestic production only; including nonagricultural production brings total to 3,300 million eggs.

~~ble 15.--Arable crops in the Netherlands: Area, 1955-56; yield, 1955-63; and forecast of area, yield, and production,
1970 and 1975
:Barley : . . :Sugar-: Table : Rape-Year Oats :Wheat : Rye :beets :~otatoes : seed
- - - - - Area (thousand hectaresi - - -1955· ....... : 70.0 170.7 89.3 153·9 66.8 106.3 7·4 1956 •.. 0 •• 0.: 73.8 153.6 85.8 171.2 69.1 103.9 10.2 1957 ••.••••• : 72.1 159.4 99.0 157.4 64.6 99·1 6.4 l958 •••••••• : 81.9 l37·5 ll1.2 l44.7 81.0 92.8 4.5 1959o •••••• 0 : 72.3 125.5 120.4 l43.8 93.0 98.3 2.6 1960o •••••• 0: 69.4 ll5.3 127.8 l53-3 92.7 97.4 2.9 19610 0 0 0 0 •• 0 : 102.6 l23-5 122.8 ll9o7 84.8 80.9 3·9 1962 •••••••• : 100.3 ll9.1 132.6 l70.0 77.4 79.0 4.l 1963 •••••••• : 101.1 ll3.0 126.6 106.2 69·5 8J..7 4.0 1964 •..•.•• 0: 87.1 102.7 15l.3 105.7 79-1 72-5 3.6 1965 ••• 0 •• 0.: 98.7 100.6 158.5 98.2 91.9 73.1 4.2 1966. 0 •••••• : 120o0 99-l 147-9 74.4 9l.9 79·3 4.8
1970 0 ••• 0 ••• : 107.6 95·6 l57-3 82.6 9l.5 84.2 4.6
1975 I ••••.• : l04.3 9l.9 l54.3 78.7 88.6 86.8 5·9 1975 II,,, •• : 105.6 91.7 l54.3 78.3 88.5 86.8 5-9
- - - Yield ~er hectare {hundred kilo~ams}
l955oeeooeeo: 38 34 39 30 447 269 25 1956 . . 0 • 0 • 0 • : 37 32 36 29 367 245 25 l957 0 •••• 0 •• : 40 32 40 29 4l7 282 25 l958 •••••••• : 38 32 36 30 479 289 20 1959 •••••••• : 37 26 4l 27 333 2].8 29 l960 •••••••• : 42 34 47 30 505 284 27 1961 .••. 0 ••• : 38 35 39 25 455 283 25 l962 •••••• o.: 43 39 45 32 379 307 25 1963 •••••••• : 38 38 42 30 389 287 25
1970 . . 0 •••• 0: 44 42 48 3l y427 320 27
1975· .....•. : 45 44 50 32 y431 331 27 :
- - - - Total production {thousand tons) - -1970 ........ : 473 402 755 256 3,907 2,695 12
1975 I ..... ·; 470 404 792 252 3,820 2,875 16 1975 II .... ·: 475 403 792 250 3,813 2,875 16
y 17 percent sugar content.
55

\Jl (}\
Table 16.--Population and private consumption in the Netherlands, 1965 and forecast for 1970 and 1975
Item Unit 1965 1970 : 1975 :
Thousand :yl2,292 13,192 14,243 Index : 100 107 116
Population ..................................... :
Total private consumption in 1965 prices ....... : Billion guilder : 39 48 58 Index : 100 122 149
y As of July 1.
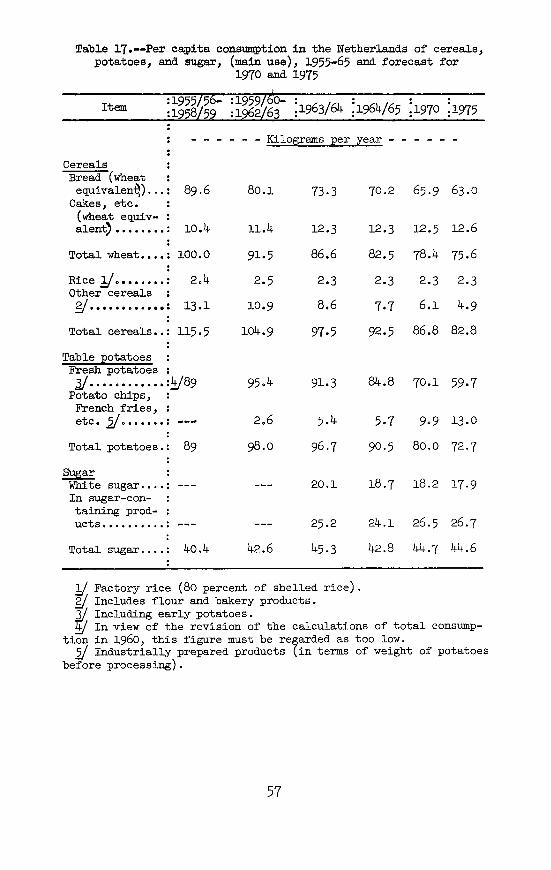
Tab~e ~7.--Per capita consumption in the Nether~ds of cereals, potatoes, and sugar, (main use), ~955-65 and forecast for
~910 and ~975
Item =~955/56-=~958L52
=~959/tSo-:1962z63 :~963/64 :~964/65 ;~910 ;~975
- - - - - - Kilograms per year - - - - - -
Cereals Bread (wheat : equivalen~) •.• : 89.6 80.1 73·3
Cakes, etc. (wheat equiv- : alent) ........ : 10.4 11.4 12.3
Total wheat ••• , : 100.0 91.5 86.6
Rice !/o•••••••; 2o4 2.5 2.3 Other cereals Y••••••o••••o: 13.1 10.9 8.6
Total cereals •• : 115.5 104.9 97·5
Table ;12otatoes Fresh potatoes : lf. 0 •• 0 ....... :!J}89 95o4 91.3
Potato chips, French fries, : etc. 2 o •••••• : 2o6 5.4
Total potatoes. : 89 98.0 96.7
Sugar White sugar .•.. : 20.1 In sugar-con-taining prod- : ucts ••.••.••.• : 25.2
Total sugar ..•. : 40.4 42.6 45.3
~Factory rice (80 percent of shelled rice). g; Includes flour and bakery products.
70.2 65·9 63.0
12.3 12.5 12.6
82.5 78.4 75.6
2.3 2.3 2.3
7·7 6.1 4.9
92.5 86.8 82.8
84.8 70.1 59·7
5·7 9·9 13.0
90.5 80.0 72.7
18.7 18.2 17.9
24.1 26.5 26.7
42.8 44.7 44.6
3/ Including early potatoes. ;; In view of the revision of the calculations of total consump
tion in 1960, this figure must be re~arded as too low. 2 Industrially prepared products tin terms of weight of potatoes before processing).
57

Table 18.--Per capita consumption in the Netherlands of livestock products (main use), 1955-65 and forecast for 1970 and 1975
ltem :1955/56-:1958L59
:1959/60-:1962/63 :1963/64 ~1964/65 :1970 :1975
- - - - - - Kilograms ~er year - - - - - -Milk and milk ;eroducts Liquid milk .••• : 156.7 137·5 126.2 121.5 109.1 102.2 Condensed (cof-:
fee) milk : (milk equi v- : alent) ........ : 10,0 17.5 21.7 22.3 26.5 27.9
Milk products (milk equi v:.. alent)' y ..... ;. 40.8 43.7 49.6 54.5 59.6 61.0
Total milk and : t
milk products. : 207.5 198.7 197·5 198.3 195.2 191.1
Other dair;z products : But~er fproduct:
we1ghi;- •••.••. : 4.0 5.0 5·5 4.9 3.4 3.2 Cheese (product: weight) ....... : 6.8 7.6 8.2 8.3 8.6 8.8
Meat carcass wei ht
Beef .•••.•.•.•• : 16.6 19.3 21.2 11"·3 20.0 21.0 Pork ••••.•••••• : 17.1 18.6 16.1 18.6 20.8 22.8 Poultry meat ••• : 0.8 2.1 3.2 3.8 5·7 6.7 Other meat ••••• : 5·3 5.2 5.6 5·9 6.0 6.0
Total meat ••••• : 39·9 45.2 46.1 45.6 52.5 56.5
~y In numbers of :
eggs . ......... : 190 2o6 225 206 225 225
2/ Including porridge, custard, buttermilk, gj Calendar years, 1955/56=1956, etc.
and special products.

Table 19.--Per capita consumption in the Netherlands of miscellaneous products, 1956-65 and forecast for 1970 and 1975
Item Un:i,t : 1956- : 1960- : 1964 ;
1965 1970 1975 : : 591/ : 63 . . : :
Fruit Apples ••••.••••.••..•.•••.•••••• : kg : 17.1 16.7 g/18.6 g/24.0 23.5 25.0 Oranges •••.••.••••••••••.••••.•. : kg : 12.8 16.3 15.9 17.9 21.0 23.0
: : Total ••••••••••••••.•••.••••.••• : kg : 29·9 33.0 34.5 41.9 44.5 48.0
: : ....... kg : 19.8 19.8 20.1 19.6 19.0 18.7
kg : 4.9 5.6 6.3 6.8 7·1 7-4 : :
\J1 Total .••.••••.••••••••.••••••••• : kg : 24.7 25.4 26.4 26.4 26.1 26.1 \0
Tobacco Cigarettes ••.•••••••.••••••••••• : Pieces : 1,196 1,276 1,161 1,460 1,450 1,500 Cigars •••.••.•.••..••••.••..•.•• : Pieces : 106 125 134 125 130 135 Cut tobacco ••••.•••••••••.•.••.• : kg : 0.78 0.80 0.82 0.91 0.95 1.00
: Cotton •••.••••••••.••••••••.••••• : kg : 6.0 6.2 6.4 5·7 5·9 5.8
:
l/ Fruit and edible fats=l957-59· gj 1964 and 1965 refer to the crop years 1963/64 and 1964/65.

0\ 0
Table 20.--The Netherlands: Size and composition of the feed requirement, 1954-65 and forecast for 1970 and 1975
. . Item . 1954/55.:: -: T958759- : l9b2/53- :
1957/58 : 1961/62 : 1964/65 : 1970 I
. 1975 : 1975
Million units o~ starch equivalent - -.
Cereals y .................. : 2,242 2,851 2,998 3,387 3,585 3,578 Oilcake . .................... : 404 504 652 1,049 1,260 1,253 Other concentrates~ ••••••• : 230 407 585 961 1,169 1,159 Grass ....................... : 3,825 4,157 4,310 4,500 4,660 4,660 Other roughage ••••.•••••.••• : 1,108 1,030 837 975 717 650 . . Total . ...................... : 7,809 8,949 9,382 10,873 11,392 11,300
1/ Including grain waste. gj Animal protein, dried skimmed milk and whey powder, pulses, dried pulp and potato
fibers, grass meal, and lucerne meal.
II

0'\ I-'
Table 21.--The Netherlands: Wheat and feed grains; production, consumption, and export surpluses; 1959-65 and forecast for 1970 and 1975
Item l959Jbb-=---:-i9b3[64- : 1962/63 : 1964/65 1970 1975
I II 1975
- Thousand tons grain equivalent - - - -
Wheat Production . ...................•......... : 552 634 755 772 772 Domestic consumption lf ................. : 1,465 1,176 1,073 1,113 1,113 Export surplus in processed form gj . .. o o : -164 l 27 40 40 . Export surplus, unprocessed Y••••o•••••= -749 -543 -345 -381 -381
Feed grains Production . ............................. : 1,256 1,274 1,185 1,181 1,184 Feed. o •• o ••••••••••••••••••••••••••••••• : 3,440 3,644 4,217 4,467 4,460 Other domestic consumption 1/•••••••o•••= 347 378 437 471 471 Export surplus in processed form gj ..... : 109 35 119 119 119 . Export surplus, unprocessed gj .......... : -2,640 -2,782 -3,588 -3,876 -3,866
lJ Including sowing seed and losses. gj Negative indicates import balance.
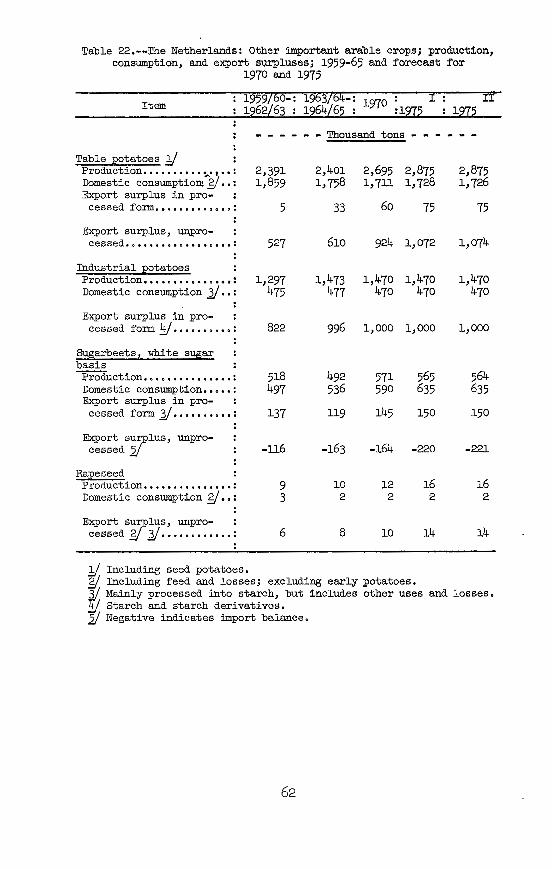
Table 22.--The Netherlands: Other important arable crops; production, consumption, and export surpluses; 1959-65 and forecast for
1970 and 1975
Item 1959/60-: 1963/64-:
1970 ~1975 I : II
1962L63 : 1964L65 : : 1272
-- - - -- Thousand tons - - -
Table ;12otatoes J) Production . ......... ~· 1 •• : 2,391 2,401 2,695 2,875 2,875 Domestic consumption: 5:.7 •• : 1,859 1,758 1,711 1,728 1,726 Export surplus in pro-
cessed form ••••••••••••• : 5 33 60 75 75
Export surplus, unpro-cessed.o•••••o•o••o•o•eo! 527 610 924 1,072 1,074
Industrial ~otatoes Production •.•• o•••o••o•oo: 1,297 1,473 1,470 1,470 1,470 Domestic consumption]/ •• : 475 477 470 470 470
Export surplus in pro-cessed form~ •••••••••• : 822 996 1,000 1,000 1,000
Sugarbeets 1 white s~ar basis -prQduction ••••••••••••••• : 518 492 571 565 564
Domestic consumption ••••• : 497 536 590 635 635 Export surplus in pro-
cessed form]/ •••••••••• : 137 119 145 150 150
Export surplus, unpro-cessed :2) -116 -163 -164 -220 -221
Rapeseed Production ••••••••••••••• : 9 10 12 16 16 Domestic consumption gf •• : 3 2 2 2 2
Export surplus, unpro- : cessed gf ]/ ••.•.••••••• : 6 8 10 14 14
1/ Including seed potatoes. ~ Including feed and losses; excluding early potatoes. 3/ Mainly processed into starch, but includes other uses ;j Starch and starch derivatives.
and losses.
'"iJ Negative indicates import balance.
62

0\ w
Table 23.--The Netherlands: Milk and dairy products; production, consumption, and export surpluses; 1959-65 and forecast for 1970 and 1975
---- --;----.- -- -: T959/6o.::: -1963,[64-: : I: II Item : U~~t : 1962/63 : 1964/65 : l970 : l975 : 1975
Milk Production ......................... : 1,000 ton: Fat content ........................ : Percent Fat remaining in skimmed milk ...... : do.
Skimmable butterfat A . :Production ......................... : 1, 000 ton: Feed ............................... : do. Other domestic consumption ......... : do.
. Available for export (surplus) ..... :
Skimmed milk Production •........................ : Feed . ......... , .............. _ ..... : Other domestic consumption ......... : . . Available for export (surplus) ..... :
do.
do. do. do .
do.
6,959 3.80 0.07
260 13
143
104
6,699 1,506 3,257
1,936
7,017 3.80 0.07
265 ll
159
95
6,752 2,o88 3,511
1,153
8,102 8,330 3-90 3·95 0.06 0.06
311 9
156
146
324 8
166
150
7,791 8,006 2,231 2,281 3,833 4,092
1,727 1,633
8,215 3-·95 0.06
320 8
166
146
7,895 2,281 4,092
1,522

Table 24.--The Netherlands: Export surpluses of the principal dairy products, 1959-65 and forecasts for 1970 and 1975
Item :1959/60- :1963/64- : : I II :1962/63 :1964/65 :1970 :1975 :1975
- Thousand tons
Cheese o ............. o ••••••• : 107 106 130 135 135 Condensed milk ••• , ••••••••• : 3o8 335 325 325 325 Dried milk, whole ••••••••• ,: 39 35 35 35 35 Dried skimmed milk in dried: synthetic milk ••••••••••• ,: 15 30 15 10 10
Butter •••••••••••••••••••• ,: 44 31 85 88 83 Dried milk, skimmed 21·····: -25 -97 -75 -83 -93
21 Negative indicates import balance.
Table 25.--The Netherlands: Meat and eggs; production, consumption, and export surpluses; 1959-65 and forecast for 1970 and 1975
Item :1959/60- :1963/64- : 970 : I : II :1962/63 :1964/65 : l : 1975 : 1975
- - - - - --- Thousand tons - - - - - - -
All meat : Production (bone in) •••• : 807 902 1,224 1,390 1,386 Deduction for fat ••••••• : 83 98 136 156 155
Production (carcass : weight) •....•.•••.••.•• : 724 804 1,088 1,234 1,231
Domestic consumption •.•. : 527 554 693 806 806 Export surplus in pro-
cessed form ••..•.•..••. : 79 79 100 100 100
Export surplus, unpro-cessed ••.•..••.••..••.• : 117 171 295 328 325
- - - Millions
~21 5,806 4,653 (3,300) (3,300) Production ••....•.....•. ; 3,590
Domestic consumption~.: 2,654 2,917 3,015 3,300 3,300 Export surplus in pro-
cessed form •••••••••••• : 220 220 Export surplus, unpro-
cessed ••••.•••••••••• o.: 2,932 1,517 575
lJ Hen's eggs, including non-agricultural production gj Including hatching eggs and losses.
(estimated).
64

Table 26.--The Netherlands: Specified kinds of meat; production, consumption, and export surpluses; 1959-65 and forecast for
1970 and 1975
Item :1959/60- :1963/64-:1962/63 :1964/65 1970 I: II
1975 1975
- Thousand tons (carcass weight)
Beef and veal , Production (bone in) •••• : 250 Deduction for fat •• , •••• : 8 Domestic consumption •••• : 225 Export surplus in pro-cessed form •••••••••••• : 9
Export surplus,, unpro-cessed ••••••••••••••••• : 8
Pork : -production (bone in) •••• : 417
Deduction for fat ••••••• : 74 Domestic consumption •••• : 217 Export surplus in pro-
cessed form •••••••••••• : 67
Export surplus, unpro-cessed,,.,,, ••••••••••• : 59
Broilers y E) Production •••••••••••••• : 38 Domestic consumption •••• : 17
Export surplus, unpro-cessed ••..••..•. o••oo••: 21
263 13
232
2
15
457 81
210
72
94
88 31
57
lf Ready to cook, excluding culled layers. ~ Exports of products from chicken meat are
the forecast at 10,000 tons in 1970 and 1975. culled layers will be processed,
318 24
265
5
24
631 107 274
85
178 61
ll7
343 26
300
5
12
735 125 325
85
200
213 84
129
338 25
300
5
8
737 125 325
85
202
212 84
128
estimated according to It is assumed that only

Table 27.--The Netherlands: Oils and fats and cattle cakeJ production, consumption, and export surpluses; 1960-65 and forecast for
1970 and 1975
Item 1975
- - - - - Thousand tons - -
Oils and fats (fat content) Production
Animal fats •••••••••••••••••• : 77 77 95 110 Vegetable fats ••••••••••••••• : 6 8 10 10
Total •••••••••••••••••••••• : 83 85 105 120
Domestic consumption ••••••••••• : 395 453 494 539 Export surplus in processed
form ••••••••••••••••••••••••• : 63 72 81 88
Export surplus, unprocessed y.: -375 -440 -470 -505 (Export of oils and fats) •••••• : (202) (173) (170) (160)
(Gross export surplus, unpro- : ceased];/) ••••••••••••••••••• : (-577) (-613) (-640) (-665)
Cattle cake ~ ~ : Production !SJ •••••••••••••••••• : 482 526 575 615 Domestic consumption ••••••••••• : 8o6 999 1,500 1,800 Export surplus in processed
fom .... ..................... : 4 6 8 8
Export surplus, unprocessed : y 2J •..... ...•......•...•..• : -328 -479 -933 -1,193
(Export of cattle cake) •••••••• : (224) (286) (350) (380)
(Gross export surplus, unpro- : ceased 1/) ................... : (-552) (-765) (-1,283)(-1,573)
lJ Negative indicates import balance. FJ. Including extracted meal, expellers, gluten, etc. ~Farming years (1960/61=1960, etc.). ~Mostly from processing of imported oilseeds. 1/ Includes exports in mixed feeds.
66

Table 2~--The Netherlands: Rice, oranges, tobacco, and raw cotton; consumption and export and import surpluses; 1960-65 and forecast
for 1970 and 1975
Item 1970 1975
- - Thousand tons
Rice ]J 48 48 Domestic consumption ••.••.•.•.. : 52 50
Export surplus in processed : form gj ............... · · .... · ·: 35 25 25 25
Import surplus ..•..•.. , ••.•• , •. : 87 73 73 75
Oranges Domestic consumption (=net im- : ports) •.••..•.•...•.•••••..•. ,: 182 211 277 328
Tobacco Domestic consumption ••.•..••... : 35 38 45 50 Export surplus in processed
fopn •..•..•..•..•...•...••.••. : 2 4 4 5
Import surplus •.••.••.•...•.••. : 37 42 49 55
Raw cotton Domestic consumption •.•.••.•••. : 72 73 78 83 Export ~urp1us in processed : form]/ .•••••••••••••.•••••••• : 17 18 22 22
Import surplus ••••••••••••••••• : 89 91 100 105
~Milled basis farming years (1959/60=1960). g( Factory rice. ]/ Cotton waste, yarns, cotton fabrics, etc.
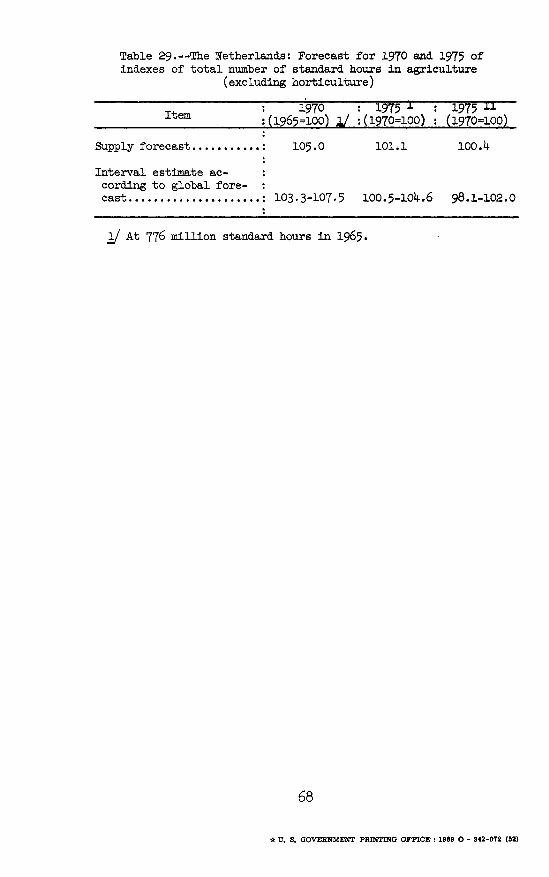
Table 29.--The Netherlands: Forecast for 1970 and 1975 of indexes of total number of standard hours in agriculture
(excluding horticulture)
Item : 1970 : 1975 I :(1965=100) ll :(1970=100)
Supply forecast ••••••••••• : 101.1
Interval estimate according to global fore-
1975 II (1970=100)
100.4
cast •••••.••..••••••••••• : 103.3-107.5 100.5-104.6 98.1-102.0
l/ At 776 million standard hours in 1965.
68
"1r U, S, GOVERNMENT PRINTING OFFICE : 1989 0 • 342·072 (52)


UNITED STATES DEPARTMENT OF AGRICULTURE
WASHINGTON, D.C. 202!50
OFFICIAL BUSINESS