I HART CGM Study Dexcom CGM Outperforms Abbott FreeStyle ...
10
Dexcom CGM Outperforms Abbott FreeStyle Libre FGM 1 For those with impaired awareness of hypoglycaemia, Dexcom CGM is the superior choice. In this head-to-head study in the United Kingdom (UK) comparing the impact on hypoglycaemia between the Dexcom G5 ® Mobile Continuous Glucose Monitoring (CGM) System and the Abbott FreeStyle Libre Flash Glucose Monitoring (FGM) System, the Dexcom G5 Mobile outperformed Libre FGM in reducing exposure to dangerously low hypoglycaemia levels. In a 24-hour period and at night, Libre FGM users increased time spent in hypoglycaemia, while Dexcom CGM users significantly reduced their time spent in hypoglycaemia, benefitting from the alerts and hypo alarm of the Dexcom G5 Mobile. Study Objective & Methods Objective: Evaluate the impact on time spent in hypoglycaemia in CGM and FGM users with impaired awareness of hypoglycaemia (IAH). Research Design/Methods: • Randomized, controlled trial; 8-week treatment period • Adults with type 1 diabetes on multiple daily injections of insulin (n=39); split into CGM use (n=19) or FGM use (n=20) • Gold score * ≥4 (impaired hypo awareness or recent severe hypoglycaemic event) Results Overall Impact on Hypoglycaemia Primary Outcome: Comparison of change in time spent in hypoglycaemia (<60 mg/dL or 3.3 mmol/L) of CGM users to FGM users: • Dexcom G5 Mobile users reduced median time spent in hypoglycaemia from baseline by 43 minutes. † • Libre FGM users increased median time spent in hypoglycaemia from baseline by 19 minutes. † † Between-group p-value: .006; outcome calculated by converting median percentage point difference into minutes, based on 24-hour period. *The Gold score measures hypoglycaemia awareness, based on a response to, “Do you know when your hypos are beginning”;7-point scale, with 1 representing “always aware” and 7 “never aware”. Scores ≥4 indicate IAH. + – Reduction of Overall Hypoglycaemia + – + – Dexcom CGM users reduced time spent in hypoglycaemia, while Libre FGM users increased their exposure to hypoglycaemia. REDUCED OVERALL HYPOGLYCAEMIA Dexcom CGM users decreased time in hypoglycaemia at night, while Libre FGM users experienced worsening hypoglycaemia. REDUCED NIGHTTIME HYPOGLYCAEMIA Dexcom CGM users saw a significant reduction in hypoglycaemia fear compared to Libre FGM users. REDUCED FEAR OF HYPOGLYCAEMIA RESULTS Reduction of Nighttime Hypoglycaemia + – + – Reduced Fear of Hypoglycaemia I HART CGM Study 1 CGM First ™ Across Multiple Thresholds, Dexcom CGM Use Decreased Time in Hypo While Libre FGM Use Increased Time (8 weeks - baseline) <50 mg/dL or <2.8 mmol/L <60 mg/dL or <3.3 mmol/L <70 mg/dL or <3.9 mmol/L Dexcom G5 Mobile CGM 20 0 -20 -40 40 -60 60 Abbott Freestyle Libre FGM Median ∆ Mins
Transcript of I HART CGM Study Dexcom CGM Outperforms Abbott FreeStyle ...

Dexcom CGM Outperforms Abbott FreeStyle Libre FGM1
For those with impaired awareness of hypoglycaemia, Dexcom CGM is the superior choice.
In this head-to-head study in the United Kingdom (UK) comparing the impact on hypoglycaemia between the Dexcom G5® Mobile Continuous Glucose Monitoring (CGM) System and the Abbott FreeStyle Libre Flash Glucose Monitoring (FGM) System, the Dexcom G5 Mobile outperformed Libre FGM in reducing exposure to dangerously low hypoglycaemia levels. In a 24-hour period and at night, Libre FGM users increased time spent in hypoglycaemia, while Dexcom CGM users significantly reduced their time spent in hypoglycaemia, benefitting from the alerts and hypo alarm of the Dexcom G5 Mobile.
Study Objective & Methods
Objective: Evaluate the impact on time spent in hypoglycaemia in CGM and FGM users with impaired awareness of hypoglycaemia (IAH).
Research Design/Methods: • Randomized, controlled trial; 8-week treatment period • Adults with type 1 diabetes on multiple daily injections of insulin (n=39); split into CGM use (n=19) or FGM use (n=20) • Gold score* ≥4 (impaired hypo awareness or recent severe hypoglycaemic event)
Results
Overall Impact on HypoglycaemiaPrimary Outcome:Comparison of change in time spent in hypoglycaemia (<60 mg/dL or 3.3 mmol/L) of CGM users to FGM users:
• Dexcom G5 Mobile users reduced median time spent in hypoglycaemia from baseline by 43 minutes.†
• Libre FGM users increased median time spent in hypoglycaemia from baseline by 19 minutes.†
† Between-group p-value: .006; outcome calculated by converting median percentage point difference into minutes, based on 24-hour period.
*The Gold score measures hypoglycaemia awareness, based on a response to, “Do you know when your hypos are beginning”;7-point scale, with 1 representing “always aware” and 7 “never aware”. Scores ≥4 indicate IAH.
+–
Reduction of Overall Hypoglycaemia
+–
+–
Dexcom CGM users reduced time spent in hypoglycaemia, while Libre FGM users increased their exposure to hypoglycaemia.
REDUCEDOVERALL HYPOGLYCAEMIA
Dexcom CGM users decreased time in hypoglycaemia at night, while Libre FGM users experienced worsening hypoglycaemia.
REDUCEDNIGHTTIMEHYPOGLYCAEMIA
Dexcom CGM users saw a significant reduction in hypoglycaemia fear compared to Libre FGM users.
REDUCEDFEAR OF HYPOGLYCAEMIA
RESULTS
Reduction of Nighttime Hypoglycaemia
+–
+–
Reduced Fear of Hypoglycaemia
I HART CGM Study1
CGM First™
Across Multiple Thresholds, Dexcom CGM Use Decreased Time in Hypo While Libre FGM Use Increased Time
(8 w
ee
ks -
bas
elin
e)
<50 mg/dLor <2.8 mmol/L
<60 mg/dLor <3.3 mmol/L
<70 mg/dLor <3.9 mmol/L
Dexcom G5 Mobile CGM
20
0
-20
-40
40
-60
60
Abbott Freestyle Libre FGM
Med
ian
∆ M
ins
1

Research: Treatment
A randomized controlled pilot study of continuous
glucose monitoring and flash glucose monitoring in
people with Type 1 diabetes and impaired awareness of
hypoglycaemia
M. Reddy, N. Jugnee, A. El Laboudi, E. Spanudakis, S. Anantharaja and N. Oliver
Division of Diabetes, Endocrinology and Metabolism, Faculty of Medicine, Imperial College, London, UK
Accepted 5 December 2017
Abstract
Aim Hypoglycaemia in Type 1 diabetes is associated with mortality and morbidity, especially where awareness of
hypoglycaemia is impaired. Clinical pathways for access to continuous glucose monitoring (CGM) and flash glucose
monitoring technologies are unclear. We assessed the impact of CGM and flash glucose monitoring in a high-risk group
of people with Type 1 diabetes.
Methods A randomized, non-masked parallel group study was undertaken. Adults with Type 1 diabetes using a
multiple-dose insulin-injection regimen with a Gold score of ≥ 4 or recent severe hypoglycaemia were recruited.
Following 2 weeks of blinded CGM, they were randomly assigned to CGM (Dexcom G5) or flash glucose monitoring
(Abbott Freestyle Libre) for 8 weeks. The primary outcome was the difference in time spent in hypoglycaemia (below
3.3 mmol/l) from baseline to endpoint with CGM versus flash glucose monitoring.
Results Some 40 participants were randomized to CGM (n = 20) or flash glucose monitoring (n = 20). The
participants (24 men, 16 women) had a median (IQR) age of 49.6 (37.5–63.5) years, duration of diabetes of 30.0 (21.0–36.5) years and HbA1c of 56 (48–63) mmol/mol [7.3 (6.5–7.8)%]. The baseline median percentage time < 3.3 mmol/l
was 4.5% in the CGM group and 6.7% in the flash glucose monitoring. At the end-point the percentage time
< 3.3 mmol/l was 2.4%, and 6.8% respectively (median between group difference �4.3%, P = 0.006). Time spent in
hypoglycaemia at all thresholds, and hypoglycaemia fear, were different between groups, favouring CGM.
Conclusion CGM more effectively reduces time spent in hypoglycaemia in people with Type 1 diabetes and impaired
awareness of hypoglycaemia compared with flash glucose monitoring. (Clinical Trial Registry No: NCT03028220)
Diabet. Med. 00, 00–00 (2017)
Introduction
Type 1 diabetes accounts for 10–15% of the worldwide
diabetes prevalence and its incidence is increasing worldwide
by 3–5% percent annually [1]. Achieving optimal glucose
control, as measured by HbA1c, reduces the risk of micro-
and macrovascular complications, but can be challenging for
people living with Type 1 diabetes due to hypoglycaemia
[2–4].
Hypoglycaemia is a metabolic complication of Type 1
diabetes and is one of the major barriers to optimizing
glucose self-management. People with Type 1 diabetes on
average have 1.8 self-treated incidences of hypoglycaemia
per week, and 0.2–3.2 episodes of severe hypoglycaemia,
defined as hypoglycaemia requiring the assistance of a third
party, annually [5,6]. Recurrent hypoglycaemia erodes
hypoglycaemia awareness and impaired awareness is seen
in around a quarter of people with Type 1 diabetes [7].
However, this may be an underestimate, with self-reported
severe hypoglycaemia rates affected by driving regulations
and other considerations [8].
Impaired awareness of hypoglycaemia increases risk of
severe hypoglycaemia six-fold. Hypoglycaemia is one of the
postulated causes of the ‘dead in bed’ syndrome, which is the
Correspondence to: Nick Oliver. E-mail: [email protected]
This is an open access article under the terms of the Creative Commons
Attribution-NonCommercial License, which permits use, distribution and
reproduction in any medium, provided the original work is properly cited and
is not used for commercial purposes.
ª 2017 The Authors.Diabetic Medicine published by John Wiley & Sons Ltd on behalf of Diabetes UK. 1
DIABETICMedicine
DOI: 10.1111/dme.13561

leading cause of death in people under 40 years of age with
Type 1 diabetes [9,10]. There is a three- to four-fold higher
mortality in people with diabetes who self-reported severe
hypoglycaemia in the preceding 5 years [11]. Hypoglycaemia
is, and remains, a significant burden for people with Type 1
diabetes and carries with it mortality and morbidity.
Continuous glucose monitoring (CGM) devices display an
estimate of blood glucose, along with the trends in glucose
changes, in real time. In addition, they provide alert and
alarm features for hypo- and hyperglycaemia, and for times
of rapid glucose change. Use of CGM is associated with a
reduction in HbA1c [12], and reduced exposure to, and risk
of hypoglycaemia [13] in people using insulin pump and
multiple-dose injection regimens [14]. The impact on glucose
and hypoglycaemia outcomes has additionally been con-
firmed in people with Type 1 diabetes and impaired
hypoglycaemia awareness [15]. Flash glucose monitoring
does not provide real-time data with alerts and alarms, but
allows users to retrospectively review the preceding 8 h of
continuous glucose data, along with a contemporary esti-
mated blood glucose value and trend line. The glucose data
are made available when the user chooses to swipe the reader
over the sensor. In one study of people with Type 1 diabetes,
flash glucose monitoring was associated with a reduction in
time spent in hypoglycaemia in people with Type 1 diabetes
and an HbA1c close to target [16].
International guidance supports the use of CGM for
people with Type 1 diabetes [17], especially those at high
risk of hypoglycaemia [18]. However, the role of flash
glucose monitoring in the self-management of Type 1
diabetes is less clear, especially for people with impaired
awareness of hypoglycaemia, or at high risk of severe
hypoglycaemia, and despite uptake of flash glucose moni-
toring led by people with diabetes, evidence-based clinical
pathways to optimize access to the appropriate monitoring
technologies are not available.
This study aims to assess the impact of CGM and flash
glucose monitoring on hypoglycaemia in people with Type 1
diabetes and impaired awareness of hypoglycaemia using a
multiple-dose insulin injection regimen.
Methods
Study design and participants
This randomized, non-masked parallel group study was
conducted at a single specialist site in the United Kingdom
(UK). Ethical approval was obtained from the National
Health Service (NHS) Research Ethics Committee. Partici-
pants aged ≥ 18 years with Type 1 diabetes for > 3 years
were recruited. In addition, participants had experienced a
severe hypoglycaemic event in the last 12 months requiring
third-party assistance or had a Gold score of ≥ 4. Those with
severe hypoglycaemia and a Gold score of < 4 may not have
impaired hypoglycaemia awareness; however, severe hypo-
glycaemia is associated with impaired awareness of hypogly-
caemia and they have therefore been included in this high-risk
study population. They had been using an intensified multi-
ple-dose insulin injection regimen for over 6 months and a
diagnosis of Type 1 diabetes was confirmed based on clinical
features and a fasting c-peptide < 200 pmol/l. All participants
had received Type 1 diabetes education, including the
principles of flexible insulin therapy, either as a group or in
a one-to-one environment from a specialist educator. Partic-
ipants were excluded if they had used CGM or flash glucose
monitoring within the last 6 months (except short periods of
diagnostic blinded use under clinic supervision), used regular
paracetamol, were pregnant or planning pregnancy, breast-
feeding, enrolled in other clinical trials, had active malig-
nancy or were under investigation for malignancy, had severe
visual impairment, or reduced manual dexterity. All partic-
ipants gave written informed consent.
Procedures
At study enrolment, participants gave a full medical and
medication history, and underwent a physical examination
and electrocardiogram. Fasting venous blood tests were
taken to assess HbA1c, plasma glucose, urea and electrolytes,
cortisol, and serum c-peptide. Women of childbearing age
had a urine pregnancy test. The Gold Score, Hypoglycaemia
Fear Score II (HFS-II), and Problem Areas in Diabetes (PAID)
questionnaires were completed. The Gold score is given by
subjective rating on a scale from 1 (always) to 7 (never) in
response to the question ‘Do you know when your hypos are
commencing?’. Participants meeting the inclusion criteria
had a brief Type 1 diabetes education refresher. Participants
then commenced a two-week run-in phase using the Dexcom
What’s new?
• This is the first head-to-head glucose monitoring study
comparing continuous glucose monitoring (CGM) and
flash glucose monitoring. This study addresses the
highest risk group with problematic and severe hypo-
glycaemia.
• CGM has a greater beneficial impact on hypoglycaemia
outcomes than flash glucose monitoring for people at
high risk of hypoglycaemia.
• The data contribute to the existing CGM literature and
are the first for flash glucose monitoring in a high-risk
group, expanding the evidence base.
• The results are clinically relevant and support a role for
CGM in the clinical pathway in people with severe
hypoglycaemia or impaired awareness of hypogly-
caemia.
2ª 2017 The Authors.
Diabetic Medicine published by John Wiley & Sons Ltd on behalf of Diabetes UK.
DIABETICMedicine Comparison of continuous and flash glucose monitoring in Type 1 diabetes � M. Reddy et al.

(San Diego, CA, USA) G4 sensor with a blinded receiver
running the advanced ‘505’ algorithm which stores glucose
data, but does not make it available to the participant. The
sensor was calibrated to capillary blood glucose values a
minimum of twice daily. From these blinded CGM data
baseline glucose metrics were calculated.
Participants were randomly assigned to CGM (Dexcom
G5) or flash glucose monitoring (Abbott Freestyle Libre) in a
1 :1 ratio using an online randomization tool (www.sealede
nvelope.com). Randomization was stratified by HbA1c
(< 58 mmol/mol and ≥ 58 mmol/mol). The treatment period
was 8 weeks.
Participants then received standardized CGM education for
the CGM (Dexcom G5) or flash glucose monitoring (Abbott
Freestyle Libre) devices, including the use of the absolute
value, rate of change arrow and glucose trend line. Both the
CGM and flash glucose monitoring systems were used non-
adjunctively (without capillary blood glucose verification
before making a treatment decision), in accordance with
product licences but participants were instructed to test their
capillary blood glucose if symptoms of hypo- or hypergly-
caemia occur, in case of sensor failure or if the sensor glucose
is out of the device’s range. Participants used the sensors with
the accompanying receivers and changed the sensor according
to the license (every 7 days for Dexcom G5, every 14 days for
Freestyle Libre) or sooner in the event of sensor failure. There
was a telephone visit 2 weeks after randomization focusing
on the function of the technology and any difficulties with
use. Participants attended the clinical research facility
4 weeks after randomization and data were downloaded
from their CGM and flash glucose monitoring devices using
the Diasend software. Eight weeks after randomization
participants attended the clinical research facility for a
venous blood test for HbA1c. They additionally completed
the Gold Score, HFS-II and PAID questionnaires, and data
were downloaded from their CGM and flash glucose mon-
itoring devices. Participants were provided with a contact
number for technical support, but insulin titration decisions
were made by the participant throughout the study. In the
CGM arm of the study, low glucose alert settings were
standardized at 4.4 mmol/l for all participants at randomiza-
tion and could be reduced to 4 mmol/l at week 2 during the
telephone visit depending on participant preference. High
glucose alerts were not protocolized.
Outcomes
The primary outcome was change in time spent in hypogly-
caemia (< 3.3 mmol/l) from baseline to endpoint with CGM
vs. flash glucose monitoring. Secondary outcomes were
percentage time spent in hypoglycaemia < 2.8, 3.5 and
3.9 mmol/l, percentage time in euglycaemia (3.9–7.8 mmol/l),
percentage time spent in target (3.9–10 mmol/l), percentage
time spent inhyperglycaemia> 7.8,> 10and> 15 mmol/l, low
blood glucose index (LBGI, a measure of hypoglycaemia risk
derived from continuous glucose data), severe hypoglycaemia
(requiring third-party assistance to treat), hypoglycaemia risk,
HbA1c,Gold Score, hypoglycaemia fear (HFS-II) and diabetes-
related emotional distress (PAID questionnaire). Baseline
continuous glucose data were taken from the first 14 days of
monitoring (the run-in phase) and endpoint outcomes calcu-
lated from the last 28 days in each treatment period.
Statistical analysis
In this pilot study we recruited n = 20 in each group (40
participants in total) which would demonstrate as significant
(P < 0.05) at 80% power a 0.92 standard deviation differ-
ence in mean change from baseline, in percentage time in
hypoglycaemia (< 3.3 mmol/l), between CGM and flash
glucose monitoring. Data were analysed using Stata v14
(StataCorp, College Station, TX, USA). Many variables were
not normally distributed and summary statistics are therefore
presented as median (IQR) and median change (95%
confidence interval). Outcomes at baseline and at 8 weeks
were analysed for CGM and for flash glucose monitoring
separately, and change from baseline to 8 weeks was
compared between the two interventions. The primary
outcome comparison was between CGM and flash glucose
monitoring in change in percentage time in hypoglycaemia
(< 3.3 mmol/l). Secondary outcome comparisons were con-
sidered as hypothesis-generating and informative. The Wil-
coxon rank sum test was used for comparing median changes
between groups. Analysis was by intention to treat. No data
monitoring committee was convened. The study is registered
at ClincialTrials.gov, number NCT03028220.
Results
We recruited 47 participants between 22 January 2016 and 7
December 2016. Seven participants were excluded and 40
were subsequently randomized to CGM (n = 20) or flash
glucose monitoring (n = 20) following the baseline run-in
period (Fig. 1, Table 1). Participants (24 men, 16 women)
had a median (IQR) age of 49.5 (37.5–63.5) years, duration
of diabetes of 30.0 (21.0–36.5) years, HbA1c of 56 (48–
63) mmol/mol (7.3 (6.5–7.8)%), Gold Score of 5 (4–5), and
episodes of self-reported hypoglycaemia per week of 3.0
(2.0–4.5). There were no significant differences in baseline
characteristics between the groups. Some 39 of the 40
participants included had a history of at least one episode of
severe hypoglycaemia in the past (6 months to 7 years ago).
Five participants were randomized with a history of severe
hypoglycaemia in the preceding year (and a Gold score of
< 4), all other participants had a Gold score of ≥ 4. Those
with a Gold score of < 4 all had a Gold score of 3 at baseline.
Two of these participants were randomized to the CGM
group and the remaining three to the flash glucose monitor-
ing group. All 40 randomized participants completed the
intervention period. For outcomes derived from CGM data
ª 2017 The Authors.Diabetic Medicine published by John Wiley & Sons Ltd on behalf of Diabetes UK. 3
Research article DIABETICMedicine
n = 19 were analysed in the CGM group due to loss of the 8-
week CGM data for one participant resulting from uploading
error. A comparison of the glucose outcomes, derived from
the run-in blinded CGM data, between the CGM and flash
glucose monitoring groups was performed (using a non-
parametric test) and showed no statistical difference between
groups at baseline. None of the participants or their family/
friends downloaded the Dexcom Share app which allows
family members and friends to follow glucose trends and
alarms of the individual.
Median percentage time < 3.3 mmol/l fell from 4.5% to
2.4% in the CGM group and changed from to 6.7% to 6.8%
in the flash glucose monitoring group (Table 2). For the
primary outcome comparison, the median changes from
baseline to end-point for participants using CGM and flash
glucose monitoring were �3.0% and +1.3%< respectively
(P = 0.006). Accordingly, the median net effect of CGM
relative to flash glucose monitoring was a reduction of 4.3%
in percentage time < 3.3 mmol/l.
Within-group changes and significance levels for between
group differences for all CGM outcomes are reported in
Table 2. The same directionality of change and between-
group differences were found for hypoglycaemia outcomes
when overnight CGM data only (22:00 h to 07:00 h) were
analysed (Table 3). No significant between group differences
in change in time in target or in time spent above hypergly-
caemic thresholds were observed.
No episodes of severe hypoglycaemia were reported during
the 8-week intervention phase in either group.
At baseline 90% (18/20) of participants in the CGM group
and 85% (17/20) had a Gold score ≥ 4; at the 8-week end-
point this was reduced to 60% (12/20) in both groups,
indicating restored self-reported hypoglycaemia awareness in
a proportion of individuals. However, no significant differ-
ence was observed in overall Gold score from baseline to
end-point between the two groups (Table 4). No between-
group differences in HbA1c change were noted at 8 weeks.
The change in hypoglycaemia between group difference
was significant (P = 0.02; Table 4). This difference was
accounted for by changes in the worry sub-score of the HFS-
II (P = 0.02 for the between group difference). No within or
between group differences were noted in HFS-II behaviour
sub-score, and PAID scores.
Discussion
The results from this randomized parallel group pilot study
suggest that an 8-week intervention with CGM has a greater
benefit in reducing time in hypoglycaemia comparedwith flash
glucose monitoring in people with Type 1 diabetes and
impaired awareness of hypoglycaemia. Both CGM and flash
glucosemonitoring improvedHbA1c andpercentage time spent
in glucose target (3.9–7.8 and 3.9–10 mmol/l) over 8 weeks.
Finally, within- and between-group improvements in overall
Assessed for eligibility n = 47
Randomized n = 40
Allocated to CGMn = 20
Allocated to flash glucosemonitoring n = 20
Analysed n = 20* Analysed n = 20
7 participants excluded†
FIGURE 1 Participant recruitment. Results are expressed as median (IQR). *For outcomes derived from continuous glucose monitoring (CGM) data,
n = 19 were analysed in the G5 group due to loss of the 8-week CGM data for one participant (uploading error). †Reasons for participant exclusionwere: severe hypoglycaemia in run-in (1), failed to comply with visit schedule (3), dropped out due interference of study with exercise programme
(1), dropped out as they did not feel they could commit to the study (2).
Table 1 Baseline characteristics of study participants. Results are expressed as median (IQR)
CGM (n = 20) Flash glucose monitoring (n = 20) All participants (n = 40)
Gender (male : female) 12 : 8 12 : 8 24 : 16Age (years) 50.5 (45.0–64.5) 48.5 (34.0–63.0) 49.5 (37.5–63.5)Duration of diabetes (years) 30.0 (25.0–36.0) 28.0 (16.5–36.5) 30.0 (21.0–36.5)Gold score 5 (5–6) 5 (4–5) 5 (4–5)HbA1c (mmol/mol) 57 (49–62) 55 (48–65) 56 (48–63)HbA1c (%) 7.4 (6.6–7.8) 7.2 (6.5–8.1) 7.3 (6.5–7.8)Self-reported hypoglycaemia/week 3.0 (2.0–4.0) 2.5 (1.7–4.7) 3.0 (2.0–4.5)
CGM, continuous glucose monitoring.
4ª 2017 The Authors.
Diabetic Medicine published by John Wiley & Sons Ltd on behalf of Diabetes UK.
DIABETICMedicine Comparison of continuous and flash glucose monitoring in Type 1 diabetes � M. Reddy et al.

Table
2Medianpercentagetime(andIQ
R)spentwithin
variousglucose
ranges,atbaseline(w
eeks�2
to0)andendpoint(4–8
weeks),andmedianchange(and95%
confidence
interval)in
percentage
timeforcontinuousandflash
glucose
monitoring
Percentagetimewithin
defined
glucose
range
Continuousglucose
monitoring
(n=19)
Median(IQR)
Flash
glucose
monitoring(n
=20)
Median(IQR)
Medianchangefrom
baseline(95%
CI)
Baseline
(�2to
0weeks)
Endpoint
(4to
8weeks)
Baseline
(�2to
0weeks)
Endpoint
(4to
8weeks)
Continuousglucose
monitoring
Flash
glucose
monitoring
P-value
<2.8
mmol/l
2.3
(0.6–1
0.7)
0.9
(0.2–1
.8)
4.1
(2.5–5
.9)
3.8
(3.0–6
.4)
�1.2
(�4.3
to�0
.5)
1.3
(�1.0
to2.4)
0.003
<3.3
mmol/l
4.5
(1.9–1
4.1)
2.4
(1.0–5
.1)
6.7
(4.8–9
.5)
6.8
(4.8–1
1.7)
�3.0
(�5.0
to�0
.3)
1.3
(�1.4
to3.6)
0.006
<3.5
mmol/l
5.5
(3.1–1
5.7)
3.5
(1.8–6
.3)
8.0
(5.7–1
0.7)
8.2
(6.0–1
3.2)
�2.8
(�4.7
to�0
.3)
2.0
(�1.0
to4.7)
0.004
<3.9
mmol/l
8.8
(5.7–1
9.5)
6.2
(3.1–1
0.2)
11.9
(8.8–1
3.7)
11.0
(8.2–1
7.0)
�2.7
(�6.1
to�0
.1)
0.6
(�2.1
to5.4)
0.01
>7.8
mmol/l
48.8
(40.8–7
0.0)
49.0
(36.6–5
8.1)
50.3
(43.9–5
8.6)
47.1
(37.4–5
3.5)
�3.4
(�10.5
to1.4)
�5.9
(�15.0
to5.6)
0.57
>10mmol/l
33.3
(25.2–4
9.9)
26.7
(16.9–3
7.4)
35.0
(21.9–3
8.7)
28.0
(18.0–3
2.1)
�8.6
(�13.0
to�1
.1)
�7.0
(�16.9
to1.7)
0.71
>15mmol/l
10.0
(1.6–2
0.4)
4.2
(1.2–9
.7)
5.9
(2.7–9
.2)
2.6
(1.2–5
.1)
�4.9
(�8.6
to�0
.7)
�3.1
(�5.3
to�0
.4)
0.48
3.9–7
.8mmol/l
31.7
(24.1–4
3.8)
43.7
(34.7–5
2.3)
34.8
(30.2–4
4.1)
40.4
(34.7–4
5.3)
10.6
(3.3
to14.4)
5.9
(�2.4
to9.0)
0.15
3.9–1
0mmol/l
50.2
(40.8–6
6.5)
65.9
(53.5–7
4.8)
54.1
(47.5–6
4.5)
60.0
(54.5–6
7.8)
12.7
(7.2
to15.8)
5.3
(1.1
to11.7)
0.05
Table
3Medianpercentagetime(andIQ
R)spentwithin
variousglucose
ranges
overnight(22.00–0
7.00),atbaseline(w
eeks�2
to0)andendpoint(4–8
weeks),andthemedianchange(and95%
confidence
interval)in
percentagetimeforcontinuousandflash
glucose
monitoring
Percentagetimewithin
defined
glucose
range
Continuousglucose
monitoring
(n=19)
Median(IQR)
Flash
glucose
monitoring(n
=20)
Median(IQR)
Medianchangefrom
baseline(95%
CI)
Baseline
(�2to
0weeks)
Endpoint
(4–8
weeks)
Baseline
(�2to
0weeks)
Endpoint
(4–8
weeks)
Continuousglucose
monitoring
Flash
glucose
monitoring
P-value
<2.8
mmol/l
4.1
(0.5–1
3.1)
0.5
(0.0–2
.3)
5.1
(1.7–8
.2)
6.1
(3.6–1
0.8)
�2.7
(�6.1
to�0
.5)
1.2
(�1.5
to4.8)
0.001
<3.3
mmol/l
6.1
(2.9–1
7.3)
1.4
(0.4–5
.7)
8.3
(2.7–1
2.2)
8.8
(6.0–1
6.7)
�4.4
(�6.9
to0.0)
1.6
(�1.6
to6.0)
<0.001
<3.5
mmol/l
7.0
(3.9–1
8.7)
2.7
(0.6–7
.1)
9.5
(4.0–1
3.6)
10.2
(7.7–1
8.9)
�5.2
(�6.4
to0.0)
2.2
(�0.9
to6.6)
0.001
<3.9
mmol/l
9.6
(5.2–2
0.7)
5.5
(1.5–1
0.5)
13.0
(6.7–1
7.1)
12.6
(10.1– 2
2.0)
�4.8
(�9.5
to�0
.7)
3.1
(�2.7
to6.8)
0.004
>7.8
mmol/l
51.9
(36.9–6
8.9)
52.4
(35.5–6
3.3)
49.4
(34.4–6
4.6)
43.4
(30.5–6
0.7)
�1.9
(�11.1
to9.4)
�7.0
(�12.7
to3.4)
0.41
>10mmol/l
33.8
(13.5–5
3.1)
26.7
(11.2–4
4.6)
30.0
(16.6–4
4.9)
24.0
(13.5–3
2.5)
�4.4
(�15.4
to9.5)
�9.9
(�15.7
to�4
.3)
0.36
>15mmol/l
8.5
(1.0–1
3.8)
5.1
(0.5–8
.3)
5.4
(2.1–9
.8)
1.1
(0.7–4
.6)
�4.1
(�6.1
to0.0)
�2.9
(�6.1
to�1
.4)
0.70
3.9–7
.8mmol/l
31.8
(21.8–4
6.6)
42.8
(29.2–4
9.5)
37.6
(25.2–4
6.7)
41.4
(30.5–4
6.6)
13.0
(�4.1
to19.6)
4.1
(�1.0
to11.0)
0.16
3.9–1
0mmol/l
47.8
(39.2–6
5.9)
62.6
(51.7–7
2.7)
53.9
(42.3–6
7.5)
59.5
(52.1–6
4.2)
14.1
(�1.5
to23.7)
5.2
(0.7
to11.6)
0.20
ª 2017 The Authors.Diabetic Medicine published by John Wiley & Sons Ltd on behalf of Diabetes UK. 5
Research article DIABETICMedicine

hypoglycaemia fear and the worry sub-scale of the hypogly-
caemia fear survey were seen with CGM. Awareness of
hypoglycaemia remained unchanged with both glucose mon-
itoring devices.
This is the first direct comparator study of continuous
glucose recording technologies assessing glucose outcomes
and aimed to provide supporting evidence for clinical
pathways implementing CGM and flash glucose monitoring
technologies. Around 25% of people with Type 1 diabetes
have impaired awareness of hypoglycaemia, and the associ-
ations with severe hypoglycaemia confer a burden of
mortality and morbidity. The data from this study suggest
that alerts and alarms are important for this high-risk group,
and that evidence-based clinical pathways must include a
measure of hypoglycaemia awareness prior to implementing
monitoring technologies where flash glucose monitoring may
not be first choice. A measure of hypoglycaemia awareness is
already included in the National Institute for Health and
Care Excellence (NICE) guideline for Type 1 diabetes in
adults [18]. In the IMPACT study [16] flash glucose
monitoring reduced time in hypoglycaemia, a finding we
have not replicated, but IMPACT excluded people with
impaired awareness of hypoglycaemia and recruited partic-
ipants with a lower mean HbA1c. These differences in the
population recruited may further indicate the importance of
selecting the appropriate technology for individuals with
Type 1 diabetes.
We did not see an improvement in self-reported awareness
of hypoglycaemia measured by Gold score with either CGM
or flash glucose monitoring. The lack of improvement in
Gold score with CGM is consistent with findings seen in the
IN CONTROL study [15] and in a retrospective audit [19].
The HypoCOMPaSS study showed that restoration of
hypoglycaemia awareness can be achieved, but that self-
monitoring capillary blood glucose and CGM have an
equivalent effect on impaired awareness of hypoglycaemia
[20]. However, the study designs and technologies imple-
mented differ, and further research is warranted to explore
the impacts of technology as an adjunct to education in
people with Type 1 diabetes and impaired awareness of
hypoglycaemia. A limitation to evaluating the Gold score
after the use of CGM or flash glucose monitoring is that it is
a subjective score and therefore does not distinguish whether
those who restored their hypoglycaemia awareness had true
recurrence of hypoglycaemia awareness from symptoms or
whether the glucose monitoring was providing ‘electronic
awareness’ by seeing the glucose trace falling or hearing the
alarms with CGM.
Our study is limited by small numbers and a short follow-
up period, but the population and study design are compa-
rable with previous reports in highly selected high-risk
groups. The baseline estimate of glucose data was derived
from blinded CGM in both groups, but the final glucose data
was derived from either CGM or flash glucose monitoring.
Therefore, a further limitation is the comparison betweenTable
4Median(andIQ
R)LBGI,Gold
score,HbA1c,HFS-totalscores,HFS-Behavioursubscores,HFS-W
orrysubscoresandPAID
scoresatbaselineandendpoint(at8weeks),andthemedianchange
(and95%
confidence
interval)forcontinuousandflash
glucose
monitoring.
Continuousglucose
monitoring
(n=19)
Median(IQR)
Flash
glucose
monitoring(n
=20)
Median(IQR)
Medianchangefrom
baseline
(95%
CI)
Baseline
Endpoint
(at8weeks)
Baseline
Endpoint
(at8weeks)
Continuousglucose
monitoring
Flash
glucose
monitoring
P-value
LBGI
7.0
(5.4–1
2.3)
5.3
(3.2–6
.3)
8.5
(5.9–9
.8)
9.1
(7.2–1
0.7)
�3.5
(�4.9
to�0
.9)
0.9
(�0.2
to3.0)
<0.001
Gold
score
5(5–6
)4.5
(3.0
-5.0)
5(4–5
)5.0
(3.5–6
.0)
0.0
(�1.0
to0.0)
0.0
(�0.8
to0.0)
0.23
HbA1c(m
mol/mol)
57(49–6
2)
54(45–6
1)
55(48–6
5)
51(48–5
9)
�1.5
(�8.6
to�1
.0)
�4.5
(�5.8
to0.0)
0.91
HbA1c(%
)7.4
(6.6–7
.8)
7.1
(6.3–7
.7)
7.2
(6.5–8
.1)
6.8
(6.5–7
.5)
�0.15(�
0.8
to�0
.05)
�0.35(�
0.6
to0.0)
HFS-totalscore
59.5
(37.0–7
8.0)
49.5
(28.0–7
4.0)
42.5
(32.0–5
6.5)
42.0
(28.5–6
5.5)
�6.5
(�10.8
to�2
.2)
�2.0
(�3.8
to2.8)
0.02
HFS-Behavioursubscore
21.0
(13.5–3
1.0)
20.0
(10.5–2
6.0)
17.5
(12.5–2
4.5)
15.0
(11.5–2
5.5)
�2.0
(�3.8
to�0
.1)
�0.5
(�3.0
to1.8)
0.36
HFS-W
orrysubscore
40.5
(24.0–5
2.5)
30.0
(17.5–4
4.0)
27.5
(18.0–3
4.5)
31.0
(15.5–4
6.0)
�4.5
(�7.8
to�0
.1)
0.5
(�3.0
to2.8)
0.02
PAID
score
31.0
(13.5–4
5.5)
28.5
(17.5–4
3.0)
19.0
(14.0–4
6.0)
22.0
(11.5–4
0.0)
�1.0
(�5.7
to4.8)
�1(�
5.0
to2.0)
0.82
6ª 2017 The Authors.
Diabetic Medicine published by John Wiley & Sons Ltd on behalf of Diabetes UK.
DIABETICMedicine Comparison of continuous and flash glucose monitoring in Type 1 diabetes � M. Reddy et al.

CGM and FGM data, where accuracy may not be equiva-
lent, so glucose outcomes may not be directly comparable.
This applies when evaluating the difference from baseline to
endpoint within the flash glucose monitoring group and
when comparing the two groups. However, the devices were
used in line with license and the relative published accura-
cies, expressed as a mean absolute difference, are between
11% and 13% for real-world use [21–24]. Another limita-
tion of our study is that stratification at randomization was
based on HbA1c alone and does not consider other factors
such as age, gender and diabetes duration. It is also
important to note that the reported times within range
reported are not independent (for example the percentage
time spent < 3.3mmol outcome includes percentage time
spent < 2.8 mmol/l). We recognize that the inclusion of
participants with severe hypoglycaemia and a Gold score of
< 4 makes the study population heterogeneous as those five
participants with a Gold score of < 4 may not have impaired
awareness of hypoglycaemia. This is a limitation, but these
participants belong to a high-risk population and were
randomized in an equal distribution (two in the CGM group
and five in the flash glucose monitoring group). The strength
of the study lies in its novelty and the clearly defined
homogeneous group of those at highest risk of challenging
hypoglycaemia.
A new consensus for reporting hypoglycaemia in studies as
< 3.0 mmol/l was recently recommended by The Interna-
tional Hypoglycaemia Study Group [25], but this was not the
case at the time of study design. The percentage time spent at
glucose < 3.0 mmol/l was therefore not a predetermined
study outcome in this study, but when analysed post hoc the
baseline vs. endpoint values were (3.1 vs. 1.5) and (4.7 vs.
5.0) in the CGM group and flash glucose monitoring group
respectively and there was a significant difference in median
change from baseline between groups (P = 0.004), suggest-
ing benefit with CGM.
The uptake of flash glucose monitoring has been striking
but, as yet, the technology has not been widely incorporated
into clinical guidelines where its role has been unclear. The
IMPACT study selected a specific group of people with
HbA1c values close to target and showed no change in HbA1c
but a reduction in time spent in hypoglycaemia compared
with self-monitoring of capillary blood glucose [16]. This
study adds to the IMPACT and DIAMOND studies and
suggests that CGM is preferable to flash glucose monitoring
for people with Type 1 diabetes using a multiple-dose
injection regimen with HbA1c values above target, and for
those with challenging hypoglycaemia.
One possible mechanism for the findings in our study is the
impact of alerts and alarms on behaviour and it is striking to
note that, alongside a reduction in exposure to hypogly-
caemia, we have demonstrated a reduction in hypoglycaemia
fear and worry. The changes to hypoglycaemia fear should
be confirmed in a larger study with a more heterogeneous
population.
Conclusion
In summary, our pilot data suggest that CGM has a
greater beneficial impact on hypoglycaemia outcomes
than flash glucose monitoring for people with impaired
hypoglycaemia awareness. Additionally, CGM has a
beneficial impact on hypoglycaemia fear, one of the
major barriers to optimal glucose control. The data
suggest that careful assessment of hypoglycaemia aware-
ness is critical to selecting the appropriate glucose
monitoring technology and that evidence-based clinical
pathways for monitoring should be different for people
with impaired awareness.
Funding sources
Dexcom funded the investigator-initiated study and provided
materials. The study was sponsored by Imperial College London.
Competing interests
NO has received honoraria for speaking and advisory board
participation from Abbott Diabetes, Dexcom, Medtronic
Diabetes and Roche Diabetes.
Acknowledgements
This paper presents independent research funded by Dexcom
and supported by the NIHR CRF and BRC at Imperial
College Healthcare NHS Trust. The views expressed are
those of the authors and not necessarily those of Dexcom, the
NHS, the NIHR or the Department of Health. The authors
would like to thank all of the study participants for their
valuable time.
Author contributions
MR, ES, NJ and SA ran the clinical study. MR performed the
statistical analysis. NO and MR wrote the first draft of the
report. NO designed the study, and AEL, MR and NO wrote
the protocol. NO is the guarantor of the study.
References
1 International Diabetes Federation (IDF). IDF Diabetes Atlas -
Seventh Edition. Brussels: International Diabetes Federation, 2015.
https://doi.org/10.1289/image.ehp.v119.i03
2 The Diabetes Control and Complications Trial Study Research.
Group. Epidemiology of severe hypoglycemia in the diabetes
control and complications trial. The DCCT Research Group. Am
J Med 1991; 90: 450–459.3 DCCT Study Group. The effect of intensive treatment of diabetes
on the development and progression of long-term complications in
insulin-dependent diabetes mellitus. N Engl J Med 1993; 329: 977–986.
4 The Diabetes Control and Complications Trial/ Epidemiology of
Diabetes Interventions and Complications (DCCT/EDIC) Study
ª 2017 The Authors.Diabetic Medicine published by John Wiley & Sons Ltd on behalf of Diabetes UK. 7
Research article DIABETICMedicine

Research Group. Intensive diabetes treatment and cardiovascular
disease in patients with Type 1 diabetes. N Engl J Med 2005; 353:
2643–2653.5 €Ostenson CG, Geelhoed-Duijvestijn P, Lahtela J, Weitgasser R,
Markert Jensen M, Pedersen-Bjergaard U. Self-reported non-severe
hypoglycaemic events in Europe. Diabet Med 2014; 31: 92–101.6 Frier BM. Hypoglycaemia in diabetes mellitus: epidemiology and
clinical implications. Nat Rev Endocrinol 2014; 10: 711–722.7 Geddes J, Schopman JE, Zammitt NN, Frier BM. Prevalence of
impaired awareness of hypoglycaemia in adults with Type 1
diabetes. Diabet Med 2008; 25: 501–504.8 Pedersen-Bjergaard U, Færch L, Allingbjerg ML, Agesen R,
Thorsteinsson B. The influence of new European Union driver’s
license legislation on reporting of severe hypoglycemia by patients
with Type 1 diabetes. Diabetes Care 2015; 38: 29–33.9 Dahlquist G, K€all�en B. Mortality in childhood-onset Type 1
diabetes: a population-based study. Diabetes Care 2005; 28:
2384–2387.10 Skrivarhaug T, Bangstad HJ, Stene LC, Sandvik L, Hanssen KF,
Joner G. Long-term mortality in a nationwide cohort of childhood-
onset Type 1 diabetic patients in Norway. Diabetologia 2006; 49:
298–305.11 McCoy RG, Van Houten HK, Ziegenfuss JY, Shah ND, Wermers
RA, Smith SA. Increased mortality of patients with diabetes
reporting severe hypoglycemia. Diabetes Care 2012; 35: 1897–1901.
12 Pickup JC, Freeman SC, Sutton AJ. Glycaemic control in Type 1
diabetes during real time continuous glucose monitoring compared
with self monitoring of blood glucose: meta-analysis of randomised
controlled trials using individual patient data. BMJ 2011; 343:
d3805.
13 El-Laboudi AH, Godsland IF, Johnston DG, Oliver NS. Measures
of glycemic variability in Type 1 diabetes and the effect of real-time
continuous glucose monitoring. Diabetes Technol Ther 2016; 18:
806–812.14 Beck RW, Riddlesworth T, Ruedy K, Ahmann A, Bergenstal R,
Haller S et al. Effect of continuous glucose monitoring on glycemic
control in adults with Type 1 diabetes using insulin injections.
JAMA 2017; 317: 371–378.15 van Beers CA, DeVries JH, Kleijer SJ, Smits MM, Geelhoed-
Duijvestijn PH, Kramer MH et al. Continuous glucose monitoring
for patients with Type 1 diabetes and impaired awareness of
hypoglycaemia (IN CONTROL): a randomised, open-label, cross-
over trial. Lancet Diabetes Endocrinol 2016; 4: 893–902.
16 Bolinder J, Antuna R, Geelhoed-duijvestijn P, Kr€oger J, Weitgasser
R. Novel glucose-sensing technology and hypoglycaemia in Type 1
diabetes: a multicentre, non-masked, randomised controlled trial.
Lancet 2016; 388: 2254–2263.17 American Diabetes Association. Standards of medical care in
diabetes. Diabetes Care 2017; 40 (Suppl 1).
18 National Institute for Health and Care Excellence (NICE). Type 1
Diabetes in Adults: Diagnosis and Management. NICE guideline
17. Available at https://www.nice.org.uk/guidance/ng17 Last
accessed 1 November 2017.
19 Choudhary P, Ramasamy S, Green L, Gallen G, Pender S,
Brackenridge A et al. Real-time continuous glucose monitoring
significantly reduces severe hypoglycemia in hypoglycemia-una-
ware patients with Type 1 diabetes. Diabetes Care 2013; 36: 4160–4162.
20 Little SA, Leelarathna L, Walkinshaw E, Tan HK, Chapple O,
Lubina-Solomon A et al. Recovery of hypoglycemia awareness in
long-standing Type 1 diabetes: a multicenter 2 9 2 factorial
randomized controlled trial comparing insulin pump with multiple
daily injections and continuous with conventional glucose self-
monitoring (HypoCOMPaSS). Diabetes Care 2014; 37: 2114–2122.
21 Andelin M, Kropff J, Matuleviciene V, Joseph JI, Attvall S,
Theodorsson E et al. Assessing the accuracy of continuous glucose
monitoring (CGM) calibrated with capillary values using capillary
or venous glucose levels as a reference. J Diabetes Sci Technol
2016; 10: 876–884.22 Taleb N, Emami A, Suppere C, Messier V, Legault L, Chiasson JL
et al. Comparison of two continuous glucose monitoring systems,
Dexcom G4 Platinum and Medtronic Paradigm Veo Enlite System,
at rest and during exercise. Diabetes Technol Ther 2016; 18: 561–567. https://doi.org/10.1089/dia.2015.0394.
23 Ji L, Guo X, Guo L, Ren Q, Yu N, Zhang J. A multicenter
evaluation of the performance and usability of a novel glucose
monitoring system in chinese adults with diabetes. J Diabetes Sci
Technol 2017; 11: 290–295.24 Bailey TS, Chang A, Christiansen M. Clinical accuracy of a
continuous glucose monitoring system with an advanced algorithm.
J Diabetes Sci Technol 2015; 9: 209–14.25 International Hypoglycaemia Study Group. Glucose concentrations
of less than 3.0 mmol/L (54 mg/dL) should be reported in clinical
trials: a joint position statement of the American Diabetes
Association and the European Association for the Study of
Diabetes. Diabetes Care 2017; 40: 155–157.
8ª 2017 The Authors.
Diabetic Medicine published by John Wiley & Sons Ltd on behalf of Diabetes UK.
DIABETICMedicine Comparison of continuous and flash glucose monitoring in Type 1 diabetes � M. Reddy et al.

(8 w
ee
ks -
bas
elin
e)
References1 Reddy M, Jugnee N, El Labuoudi A, Spanudakis E, Anantharaja S, Oliver N. A Randomized Controlled Pilot Study of Continuous Glucose Monitoring in People with Type 1 Diabetes and Impaired Awareness of Hypoglycaemia. Diabet Med. In press (Originally registered as Impact on Hypoglycaemia Awareness of Real Time CGM and Intermittent Continuous Glucose Data (I HART CGM); ClinicalTrials.gov NCT03028220). 2 American Diabetes Association. Glycemic targets. Sec. 6. In Standards of Medical Care in Diabetes—2017. Diabetes Care. 2017;40(Suppl 1):S48-S56. 3 Bailey TS, Grunberger G, Bode BW, et al. American Association of Clinical Endocrinologists and American College of Endocrinology 2016 Outpatient Glucose Monitoring Consensus Statement. Endocr Pract. 2016;22(2):231-261. 4 Peters A, Ahmann A, Battelino T et al. Diabetes Technology—Continuous Subcutaneous Insulin Infusion Therapy and Continuous Glucose Monitoring in Adults: An Endocrine Society Clinical Practice Guideline. The Journal of Clinical Endocrinology & Metabolism. 2016:jc.2016-2534. 5 Šoupal J, Petruželková L, Flekač M et al. Comparison of Different Treatment Modalities for Type 1 Diabetes, Including Sensor-Augmented Insulin Regimens, in 52 Weeks of Follow-Up: A COMISAIR Study. Diabetes Technology & Therapeutics. 2016;18(9):532-538.
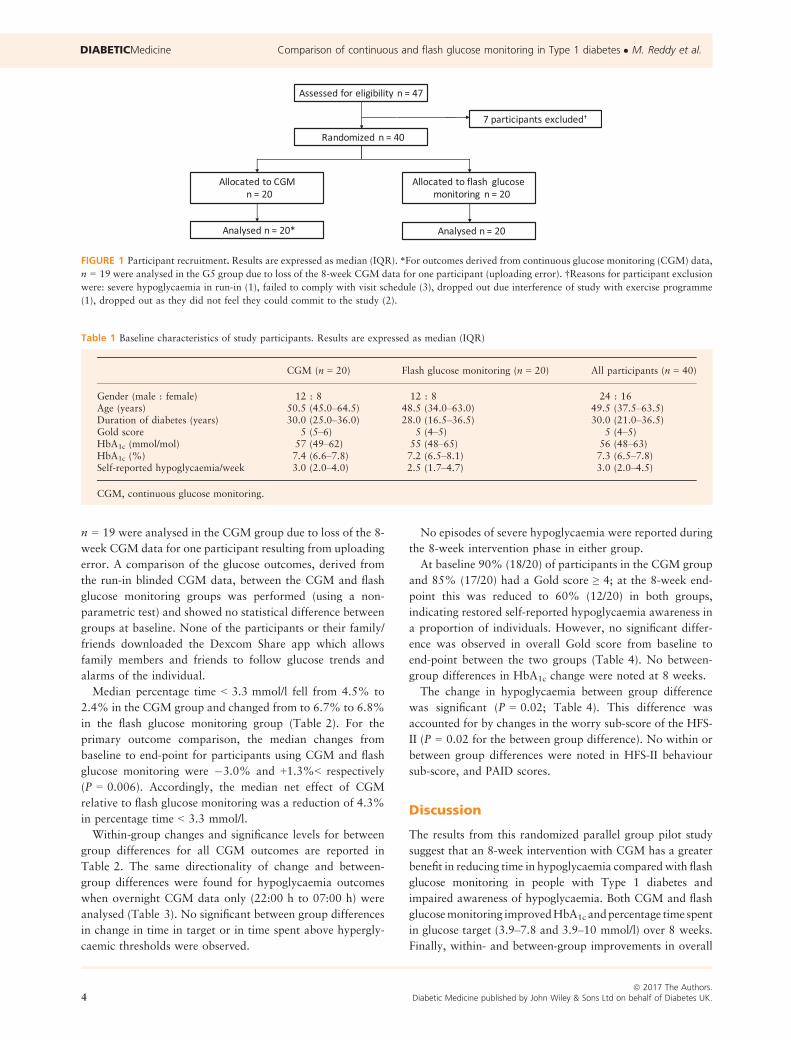
Dexcom CGM Use Reduced Time in Hypoglycaemia at Night; Increased Time Spent with Libre FGM UseDexcom CGM use reduced median time spent in hypoglycaemia (<60 mg/dL or 3.3 mmol/L) by 24 minutes from baseline while subjects using the Libre FGM increased exposure by 9 minutes.
• The audible alerts and alarm of the Dexcom G5 Mobile—which Libre FGM does not have—are especially helpful to patients with IAH at night, when they are most vulnerable to potentially dangerous hypoglycaemic incidents.1
Reduced Fear of Hypoglycaemia
• Participants in the Dexcom CGM group reported less fear of hypoglycaemia, a major barrier to good glucose control.
• No change in hypoglycaemia fear was reported in the Libre FGM group. (Between-group p-value: .02)
Dexcom CGM First™
Professional societies, including the ADA, AACE and the Endocrine Society now recognize CGM as a standard of care.2-4 Dexcom CGM use has been proven to both reduce A1C and decrease risk of hypoglycaemia regardless of insulin delivery method.5 When initiating or adjusting insulin regimens for your patients, Dexcom CGM provides real-time insights for better glycemic outcomes. Optimize your patients' diabetes treatment plans and recommend a Dexcom CGM System today.
For more information about adding Dexcom CGM to your patient’s diabetes treatment plan, visit dexcom.com/global
LBL015731 Rev001
I HART CGM Study1 Dexcom CGM Outperforms Abbott Freestyle Libre FGM (cont.)
+–
<50 mg/dLor <2.8 mmol/L
<60 mg/dLor <3.3 mmol/L
<70 mg/dLor <3.9 mmol/L
Dexcom CGM O�ers Added Protection at Night‡
Dexcom G5 Mobile CGM Abbott FreeStyle Libre FGM
Med
ian
∆ M
ins
‡ Nighttime hypoglycaemia measured from 22:00 - 07:00.
10
0
-10
-20
20
-30
30
©2017 Dexcom Inc. All rights reserved.
2