I Duke Energy. 12700 Hagers Ferry Road
27
I Duke Energy. Duke Energy Corporation McGuire Nuclear Station 12700 Hagers Ferry Road Huntersville, NC 28078-9340 (704) 875-4800 OFFICE (704) 875-4809 FAX H. B. Barron Vice President January 15, 2001 U. S. Nuclear Regulatory Commission Document Control Desk Washington, D.C. 20555 Subject: McGuire Nuclear Station Docket No. 50-370 Unit 2, Cycle 14 Startup Report Attached is the McGuire Nuclear Station Unit 2 Cycle 14 Startup Report for Criticality, Zero Power Physics Testing, and Power Escalation Testing as required by Selected Licensee Commitment (SLC) 16.14.1, "Startup Reports." This SLC requires a summary report within 90 days following resumption of commercial power operation if fuel of a different design or manufactured by a different fuel supplier has been installed. This report is submitted due to the use of Westinghouse Robust Fuel Assemblies (RFA). All testing acceptance criteria were satisfied indicating the newly loaded core was behaving as designed. Questions concerning this report should be directed to Kay Crane, McGuire Regulatory Compliance at (704) 875-4306. H. B. Barron, Vice President McGuire Nuclear Station \)YI9
Transcript of I Duke Energy. 12700 Hagers Ferry Road
I Duke Energy.
Duke Energy Corporation McGuire Nuclear Station 12700 Hagers Ferry Road Huntersville, NC 28078-9340
(704) 875-4800 OFFICE (704) 875-4809 FAXH. B. Barron
Vice President
January 15, 2001
U. S. Nuclear Regulatory Commission Document Control Desk Washington, D.C. 20555
Subject: McGuire Nuclear Station Docket No. 50-370 Unit 2, Cycle 14 Startup Report
Attached is the McGuire Nuclear Station Unit 2 Cycle 14
Startup Report for Criticality, Zero Power Physics Testing,
and Power Escalation Testing as required by Selected Licensee Commitment (SLC) 16.14.1, "Startup Reports." This
SLC requires a summary report within 90 days following resumption of commercial power operation if fuel of a
different design or manufactured by a different fuel
supplier has been installed. This report is submitted due
to the use of Westinghouse Robust Fuel Assemblies (RFA).
All testing acceptance criteria were satisfied indicating
the newly loaded core was behaving as designed.
Questions concerning this report should be directed to Kay
Crane, McGuire Regulatory Compliance at (704) 875-4306.
H. B. Barron, Vice President McGuire Nuclear Station
\�)YI9
U. S. Nuclear Regulatory Commission Document Control Desk January 15, 2001 Page 2
cc: Mr. Luis A. Reyes U. S. Nuclear Regulatory Commission, Region II Atlanta Federal Center 61 Forsyth St., SW, Suite 23T85 Atlanta, GA 30303
Mr. Frank Rinaldi, Project Manager Office of Nuclear Reactor Regulation U. S. Nuclear Regulatory Commission Mail Stop, 14H25, OWFN Washington, D.C. 20555
Mr. Scott Shaeffer Senior Resident Inspector McGuire Nuclear Station

U. S. Nuclear Regulatory Commission Document Control Desk January 15, 2001 Page 3
cc: RGC File ECO50-ELL
Duke Power Company McGuire Nuclear Station
Unit 2 Cycle 14
STARTUP REPORT
October 2000
TABLE OF CONTENTS
Page
List of Figures ................................................................................................................................................. .iii
List of Figureso ............................................................................................................................................. 1
1.0 Introduction ...Test ................................................................................................................................... 1
2.0 Precritical Testing ................................................................................................................. 2
2.1 Total Core Reloading ................................................................................ 2
2.2 Prelim inary NIS Calibration .................................................................................................. 2
2.3 Reactor Coolant System Dilution ........................................................................................ 2
2.4 Control Rod Drop Tim ing Test ............................................................................................. 3
3.0 Zero Power Physics Testing ......................................................................................................... 7
3.1 1/M Approach to Criticality .................................................................................................. 7
3.2 Reactivity Com puter Checkout ........................................................................................... 10
3.3 Point of Nuclear Heat Addition ........................................................................................... 10
3.4 Dynam ic Rod W orth M easurem ent .................................................................................... 11
3.5 ARO Boron Endpoint M easurem ent .................................................................................. 11
3.6 ARO Isothermal Temperature Coefficient Measurement ................................................. 11
4.0 Power Escalation Testing ..................................................................................................................... 13
4.1 Core Power Distribution .................................................................................................... 13
4.2 O ne-Point Incore/Excore Calibration ................................................................................. 17
4.3 Reactor Coolant Delta Tem perature M easurem ent .......................................................... 18
4.4 Hot Full Power Critical Boron Concentration Measurement .............................................. 18
4.5 Incore/Excore Calibration .................................................................................................. 18
4.6 Interm ediate Range NIS Setpoint Evaluation ................................................................... 20
LIST OF TABLES
Page
1. Core Design Data.............................................................................................. 1
2. Prelim inary NIS Calibration Data ....................................................................................................... 4
3. Cycle 13 and Cycle 14 Rod Drop Tim ing Results ............................................................................. 5
4. Sum m ary of Zero Power Physics Testing Results ........................................................................... 8
5. Reactivity Com puter Checkout ....................................................................................................... 10
6. Nuclear Heat Determ ination ........................................................................................................... 10
7. ITC M easurem ent Results .................................................................................................................... 12
8. Core Power Distribution Results, 18% Power .................................................................................. 14
9. Core Power Distribution Results, 76% Power .................................................................................. 15
10. Core Power Distribution Results, 100% Power ................................................................................ 16
11. O ne-Point Incore/Excore Calibration Results .................................................................................. 17
12. Incore/Excore Calibration Results .................................................................................................. 19
ii
LIST OF FIGURES
Page
1. ICRR vs. Demin Water Added During Reactor Coolant System Dilution ........................................ 6
2. Inverse Count Rate Ratio vs. Control Rod Worth During Approach to Criticality ............................. 9
iii
Page 1 of 20
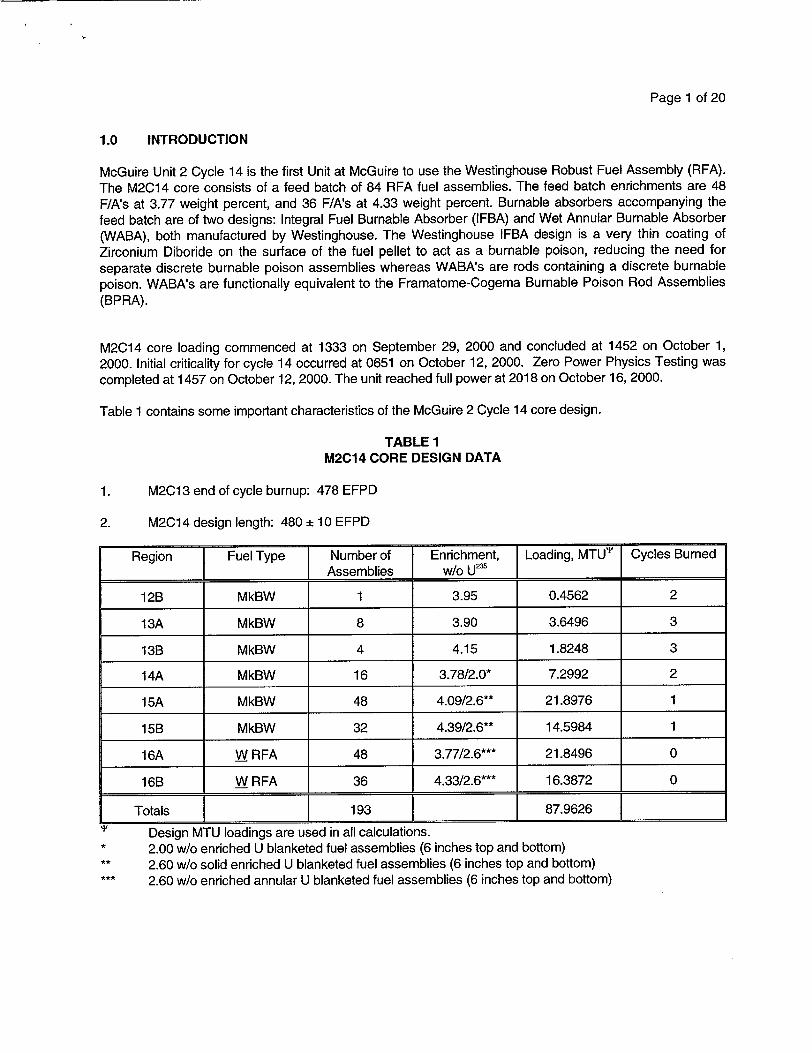
1.0 INTRODUCTION
McGuire Unit 2 Cycle 14 is the first Unit at McGuire to use the Westinghouse Robust Fuel Assembly (RFA). The M2C14 core consists of a feed batch of 84 RFA fuel assemblies. The feed batch enrichments are 48
F/A's at 3.77 weight percent, and 36 F/A's at 4.33 weight percent. Burnable absorbers accompanying the feed batch are of two designs: Integral Fuel Burnable Absorber (IFBA) and Wet Annular Burnable Absorber (WABA), both manufactured by Westinghouse. The Westinghouse IFBA design is a very thin coating of
Zirconium Diboride on the surface of the fuel pellet to act as a burnable poison, reducing the need for
separate discrete burnable poison assemblies whereas WABA's are rods containing a discrete burnable poison. WABA's are functionally equivalent to the Framatome-Cogema Burnable Poison Rod Assemblies (BPRA).
M2C14 core loading commenced at 1333 on September 29, 2000 and concluded at 1452 on October 1, 2000. Initial criticality for cycle 14 occurred at 0651 on October 12, 2000. Zero Power Physics Testing was completed at 1457 on October 12, 2000. The unit reached full power at 2018 on October 16, 2000.
Table 1 contains some important characteristics of the McGuire 2 Cycle 14 core design.
TABLE 1 M2C14 CORE DESIGN DATA
1. M2C13 end of cycle burnup: 478 EFPD
2. M2C14 design length: 480 -± 10 EFPD
Region FuelType Number of Enrichment, Loading, MTU'" Cycles Burned Assemblies W/o U23
12B MkBW 1 3.95 0.4562 2
13A MkBW 8 3.90 3.6496 3
13B MkBW 4 4.15 1.8248 3
14A MkBW 16 3.78/2.0* 7.2992 2
15A MkBW 48 4.09/2.6** 21.8976 1
15B MkBW 32 4.39/2.6** 14.5984 1
16A W RFA 48 3.77/2.6*** 21.8496 0
16B W RFA 36 4.33/2.6*** 16.3872 0
Totals 193 87.96269, Design MTU loadings are used in all calculations.
2.00 w/o enriched U blanketed fuel assemblies (6 inches top and bottom) 2.60 w/o solid enriched U blanketed fuel assemblies (6 inches top and bottom) 2.60 w/o enriched annular U blanketed fuel assemblies (6 inches top and bottom)
Page 2 of 20
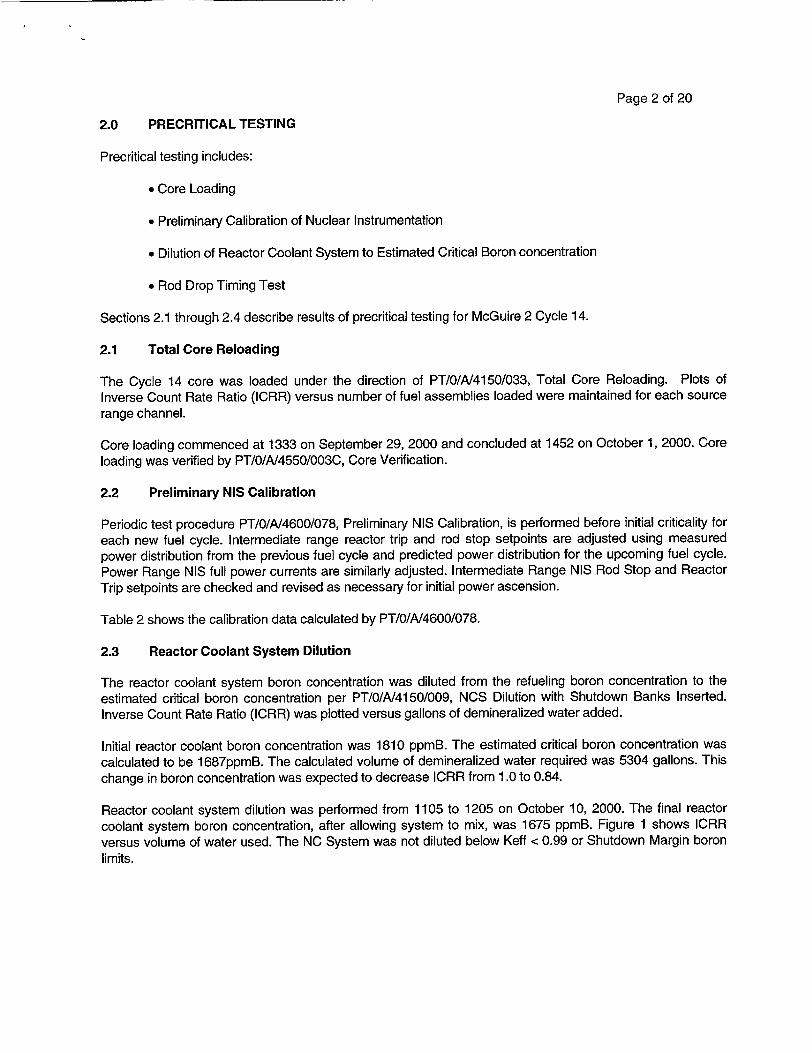
2.0 PRECRITICAL TESTING
Precritical testing includes:
"* Core Loading
"* Preliminary Calibration of Nuclear Instrumentation
"* Dilution of Reactor Coolant System to Estimated Critical Boron concentration
"* Rod Drop Timing Test
Sections 2.1 through 2.4 describe results of precritical testing for McGuire 2 Cycle 14.
2.1 Total Core Reloading
The Cycle 14 core was loaded under the direction of PT/O/A/4150/033, Total Core Reloading. Plots of Inverse Count Rate Ratio (ICRR) versus number of fuel assemblies loaded were maintained for each source range channel.
Core loading commenced at 1333 on September 29, 2000 and concluded at 1452 on October 1, 2000. Core loading was verified by PT/0/A/4550/003C, Core Verification.
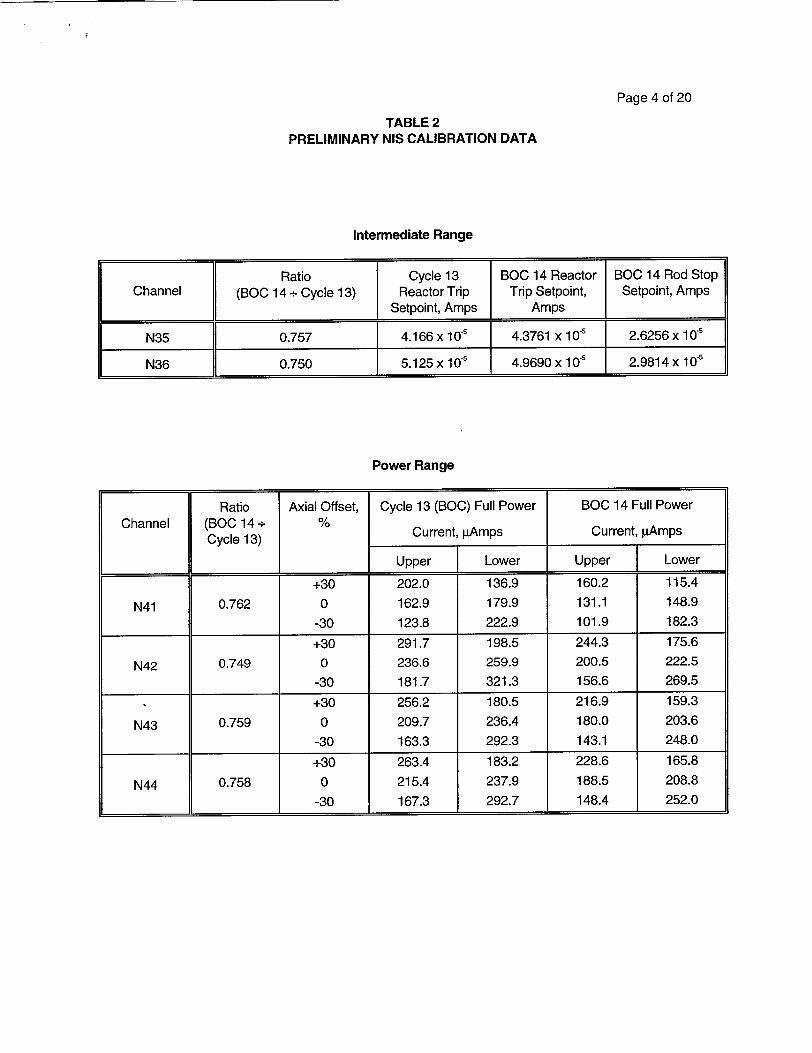
2.2 Preliminary NIS Calibration
Periodic test procedure PT/O/A/4600/078, Preliminary NIS Calibration, is performed before initial criticality for each new fuel cycle. Intermediate range reactor trip and rod stop setpoints are adjusted using measured power distribution from the previous fuel cycle and predicted power distribution for the upcoming fuel cycle.
Power Range NIS full power currents are similarly adjusted. Intermediate Range NIS Rod Stop and Reactor Trip setpoints are checked and revised as necessary for initial power ascension.
Table 2 shows the calibration data calculated by PT/0/A/4600/078.
2.3 Reactor Coolant System Dilution
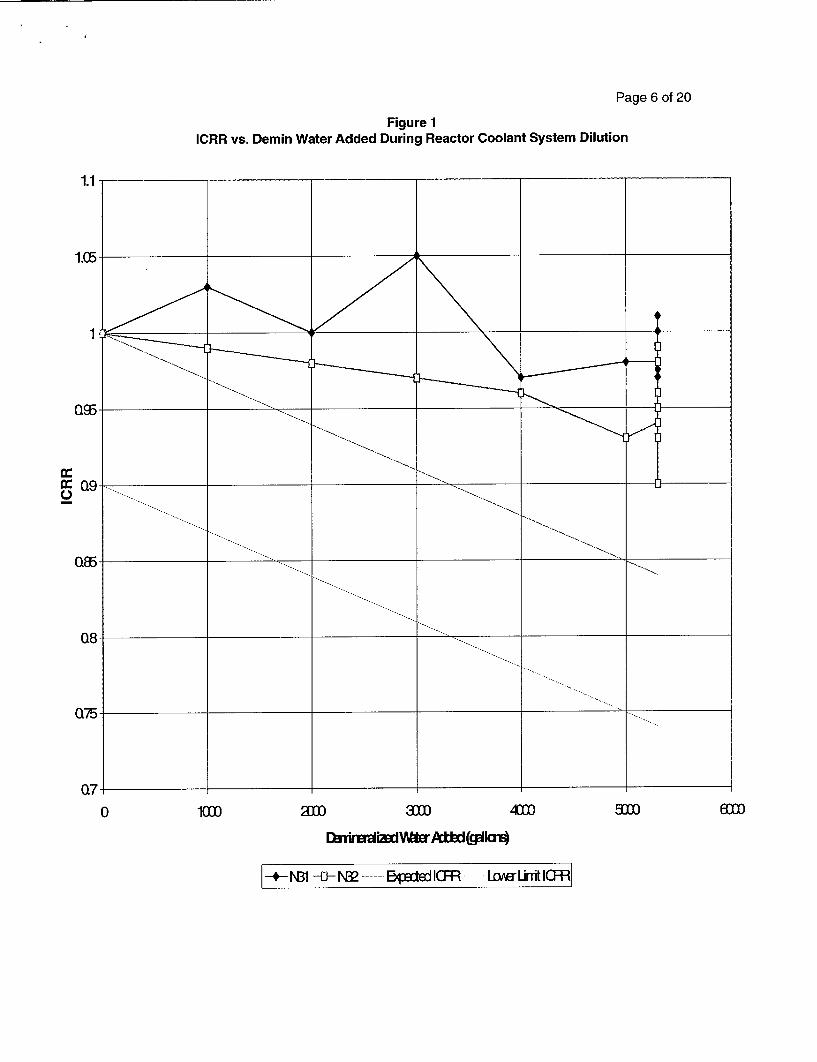
The reactor coolant system boron concentration was diluted from the refueling boron concentration to the estimated critical boron concentration per PT/O/A/4150/009, NCS Dilution with Shutdown Banks Inserted. Inverse Count Rate Ratio (ICRR) was plotted versus gallons of demineralized water added.
Initial reactor coolant boron concentration was 1810 ppmB. The estimated critical boron concentration was calculated to be 1687ppmB. The calculated volume of demineralized water required was 5304 gallons. This change in boron concentration was expected to decrease ICRR from 1.0 to 0.84.
Reactor coolant system dilution was performed from 1105 to 1205 on October 10, 2000. The final reactor
coolant system boron concentration, after allowing system to mix, was 1675 ppmB. Figure 1 shows ICRR versus volume of water used. The NC System was not diluted below Keff < 0.99 or Shutdown Margin boron limits.
Page 3 of 20
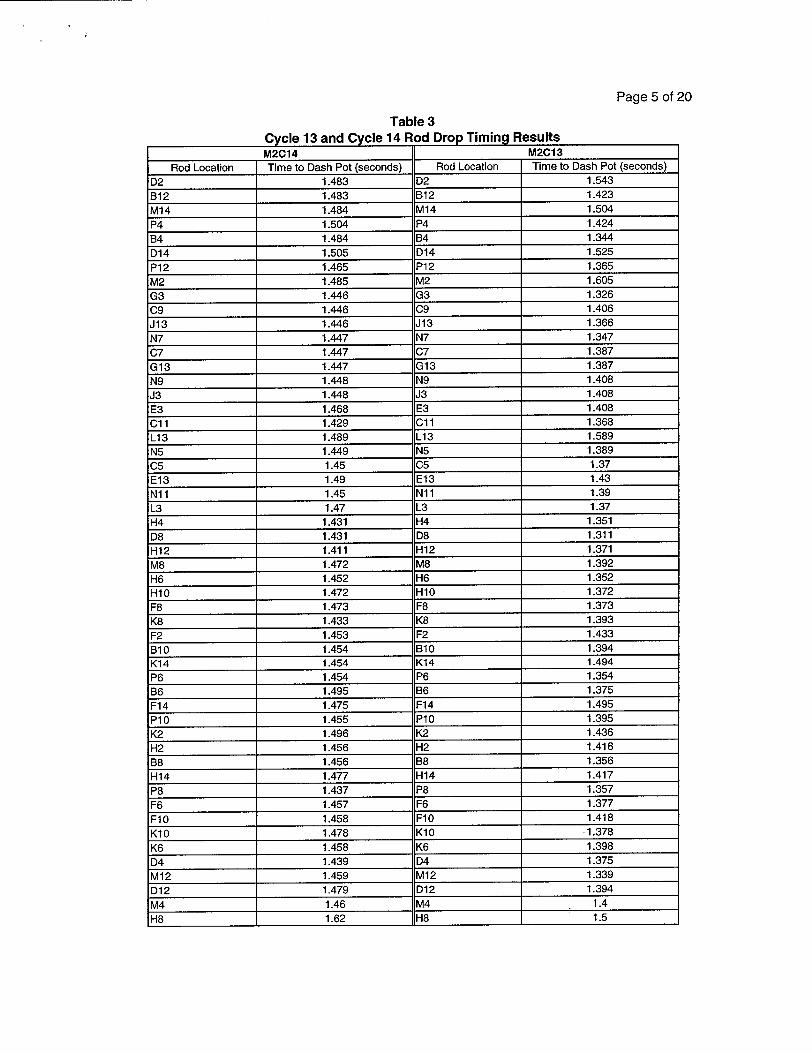
2.4 Control Rod Drop Timing Test
This test is performed prior to each post-refueling startup to verify that, when dropped from the fully withdrawn position at hot, no-load conditions, each RCCA completely inserts and the drop time is _< 2.2 seconds (pursuant to Tech. Spec. Surveillance Requirement 3.1.4.3). The 2.2 second criterion applies to the time measured from the beginning of decay of Stationary Gripper coil voltage to Dashpot entry.
All BOC14 RCCA drop times satisfied the acceptance criterion. Table 3 summarizes not only the BOC14 data, but for comparison purposes, the BOC13 drop times as well. It should be noted that "Time to Dash Pot" is the data to be compared to the 2.2 second criterion. "Time to Dash Pot" is a parameter that is measured for the purposes of assessing resistance to the RCCA in the Dash Pot region.
TABLE
2
TABLE 2 PRELIMINARY NIS CALIBRATION DATA
Intermediate Range
Page 4 of 20
Ratio Cycle 13 BOC 14 Reactor BOC 14 Rod Stop Channel (BOC 14 + Cycle 13) Reactor Trip Trip Setpoint, Setpoint, Amps
Setpoint, Amps Amps
N35 0.757 4.166 x 10U5 4.3761 x 10"' 2.6256 x 10.'
N36 0.750 5.125 x 10.5 4.9690 x 10.5 2.9814 x 10⁻⁵
Power Range
Ratio Axial Offset, Cycle 13 (BOO) Full Power BOC 14 Full Power
Channel (BOC 14 - Current, pAmps Current, pAmps Cycle 13) Current, ____mps Current, __mps
Upper [ Lower Upper Lower
+30 202.0 136.9 160.2 115.4
N41 0.762 0 162.9 179.9 131.1 148.9
-30 123.8 222.9 101.9 182.3
+30 291.7 198.5 244.3 175.6
N42 0.749 0 236.6 259.9 200.5 222.5
-30 181.7 321.3 156.6 269.5
+30 256.2 180.5 216.9 159.3
N43 0.759 0 209.7 236.4 180.0 203.6
-30 163.3 292.3 143.1 248.0
+30 263.4 183.2 228.6 165.8
N44 0.758 0 215.4 237.9 188.5 208.8
-30 167.3 292.7 148.4 252.0
Page 5 of 20
Table 3 Cycle 13 and Cycle 14 Rod Drop Timing Results M2C14 M2C13
Rod Location Time to Dash Pot (seconds) Rod Location Time to Dash Pot (seconds)
D2 1.483 D2 1.543
B12 1.483 B12 1.423
M14 1.484 M14 1.504
P4 1.504 P4 1.424
B4 1.484 B4 1.344
D14 1.505 D14 1.525
P12 1.465 P12 1.365
M2 1.485 M2 1.605
G3 1.446 G3 1.326
C9 1.446 C9 1.406
J13 1.446 J13 1.366
N7 1.447 N7 1.347
C7 1.447 C7 1.387
G13 1.447 G13 1.387
N9 1.448 N9 1.408
J3 1.448 J3 1.408
E3 1.468 E3 1.408
C11 1.429 C11 1.368
L13 1.489 L13 1.589
N5 1.449 N5 1.389
C5 1.45 C5 1.37
E13 1.49 E13 1.43
N11 1.45 N11 1.39
L3 1.47 L3 1.37
H4 1.431 H4 1.351
D8 1.431 D8 1.311
H12 1.411 H12 1.371
M8 1.472 M8 1.392
H6 1.452 H6 1.352
H1O 1.472 H10 1.372
F8 1.473 F8 1.373
K8 1.433 K8 1.393
F2 1.453 F2 1.433
B10 1.454 B10 1.394
K14 1.454 K14 1.494
P6 1.454 P6 1.354
B6 1.495 B6 1.375
F14 1.475 F14 1.495
P10 1.455 P10 1.395
K2 1.496 K2 1.436
H2 1.456 H2 1.416
B8 1.456 B8 1.356
H14 1.477 H14 1.417
P8 1.437 P8 1.357
F6 1.457 F6 1.377
FIO 1.458 F1O 1.418
K1O 1.478 K10 1.378
K6 1.458 K6 1.398
D4 1.439 D4 1.375
M12 1.459 M12 1.339
D12 1.479 012 1.394
M4 1.46 M4 1.4
H8 1.62 H8 1.5
Page 6 of 20
Figure 1 ICRR vs. Detain Water Added During Reactor Coolant System Dilution
C.
0 1000
I
I
2a00 31D 400D
--- N31 -0-IN32 .......... ed ICFR - Iom Urnit ICR
EIMOMw0
Page 7 of 20
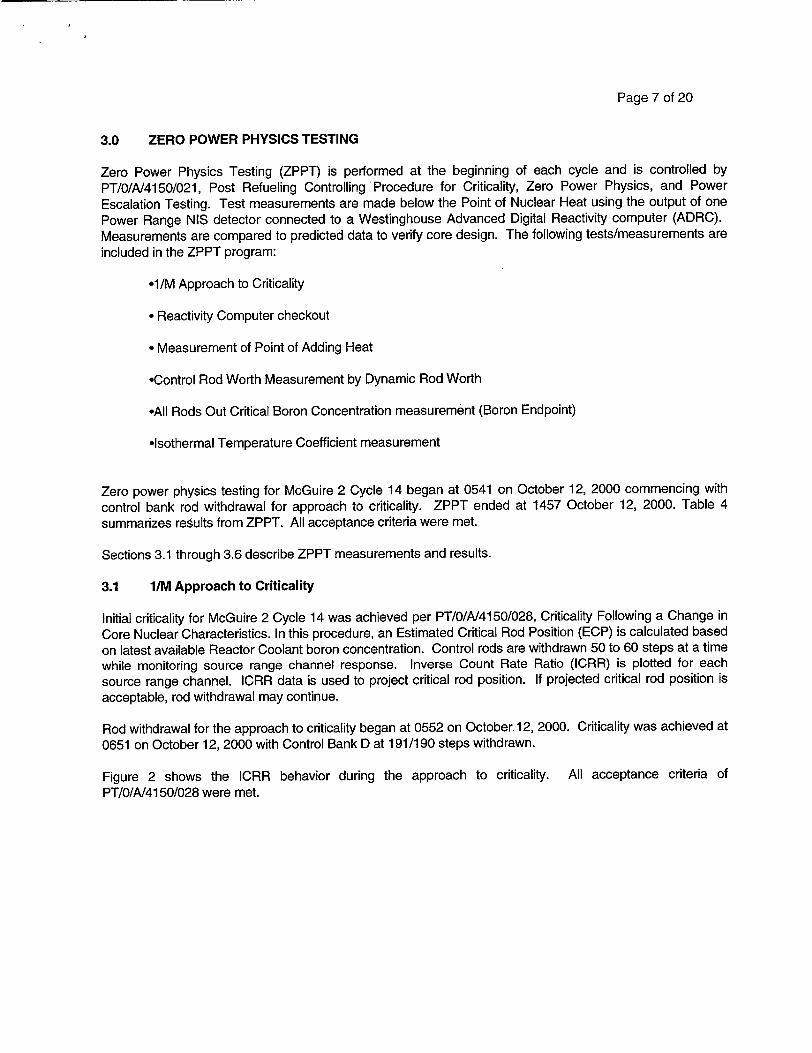
3.0 ZERO POWER PHYSICS TESTING
Zero Power Physics Testing (ZPPT) is performed at the beginning of each cycle and is controlled by
PT/0/A/4150/021, Post Refueling Controlling Procedure for Criticality, Zero Power Physics, and Power
Escalation Testing. Test measurements are made below the Point of Nuclear Heat using the output of one
Power Range NIS detector connected to a Westinghouse Advanced Digital Reactivity computer (ADRC).
Measurements are compared to predicted data to verify core design. The following tests/measurements are
included in the ZPPT program:
• /M Approach to Criticality
"• Reactivity Computer checkout
"* Measurement of Point of Adding Heat
-Control Rod Worth Measurement by Dynamic Rod Worth
-All Rods Out Critical Boron Concentration measurement (Boron Endpoint)
-Isothermal Temperature Coefficient measurement
Zero power physics testing for McGuire 2 Cycle 14 began at 0541 on October 12, 2000 commencing with
control bank rod withdrawal for approach to criticality. ZPPT ended at 1457 October 12, 2000. Table 4
summarizes results from ZPPT. All acceptance criteria were met.
Sections 3.1 through 3.6 describe ZPPT measurements and results.
3.1 1/M Approach to Criticality
Initial criticality for McGuire 2 Cycle 14 was achieved per PT/0/A/4150/028, Criticality Following a Change in
Core Nuclear Characteristics. In this procedure, an Estimated Critical Rod Position (ECP) is calculated based
on latest available Reactor Coolant boron concentration. Control rods are withdrawn 50 to 60 steps at a time while monitoring source range channel response. Inverse Count Rate Ratio (ICRR) is plotted for each
source range channel. ICRR data is used to project critical rod position. If projected critical rod position is acceptable, rod withdrawal may continue.
Rod withdrawal for the approach to criticality began at 0552 on October 12, 2000. Criticality was achieved at
0651 on October 12, 2000 with Control Bank D at 191/190 steps withdrawn.
Figure 2 shows the ICRR behavior during the approach to criticality. All acceptance criteria of PT/O/A/4150/028 were met.
Page 8 of 20
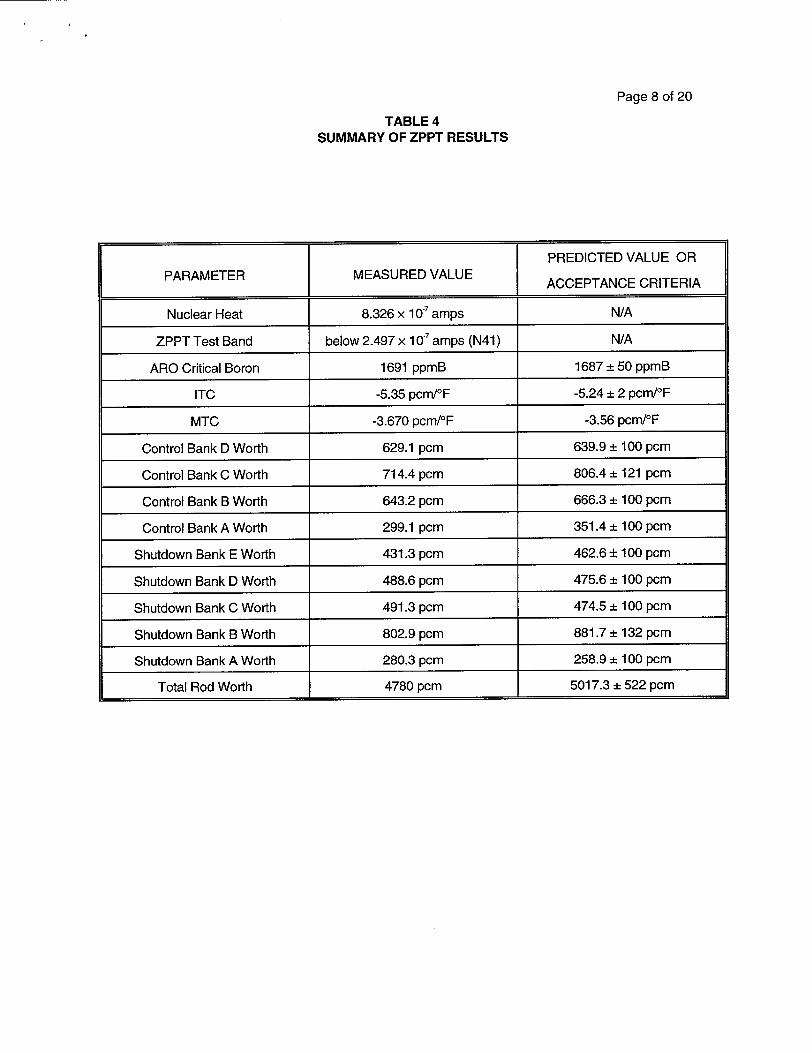
TABLE 4 SUMMARY OF ZPPT RESULTS
PREDICTED VALUE OR PARAMETER MEASURED VALUE ACCEPTANCE CRITERIA
Nuclear Heat 8.326 x 1 0 amps N/A
ZPPT Test Band below 2.497 x 10.7 amps (N41) N/A
ARO Critical Boron 1691 ppmB 1687 ± 50 ppmB
ITC -5.35 pcm/°F -5.24 ± 2 pcm/0F
MTC -3.670 pcm/°F -3.56 pcm/°F
Control Bank D Worth 629.1 pcm 639.9 ± 100 pcm
Control Bank C Worth 714.4 pcm 806.4 ± 121 pcm
Control Bank B Worth 643.2 pcm 666.3 ± 100 pcm
Control Bank A Worth 299.1 pcm 351.4 ± 100 pcm
Shutdown Bank E Worth 431.3 pcm 462.6 + 100 pcm
Shutdown Bank D Worth 488.6 pcm 475.6 ± 100 pcm
Shutdown Bank C Worth 491.3 pcm 474.5 ± 100 pcm
Shutdown Bank B Worth 802.9 pcm 881.7 132 pcm
Shutdown Bank A Worth 280.3 pcm 258.9 ± 100 pcm
Total Rod Worth 4780 pcm 5017.3 ± 522 pcm
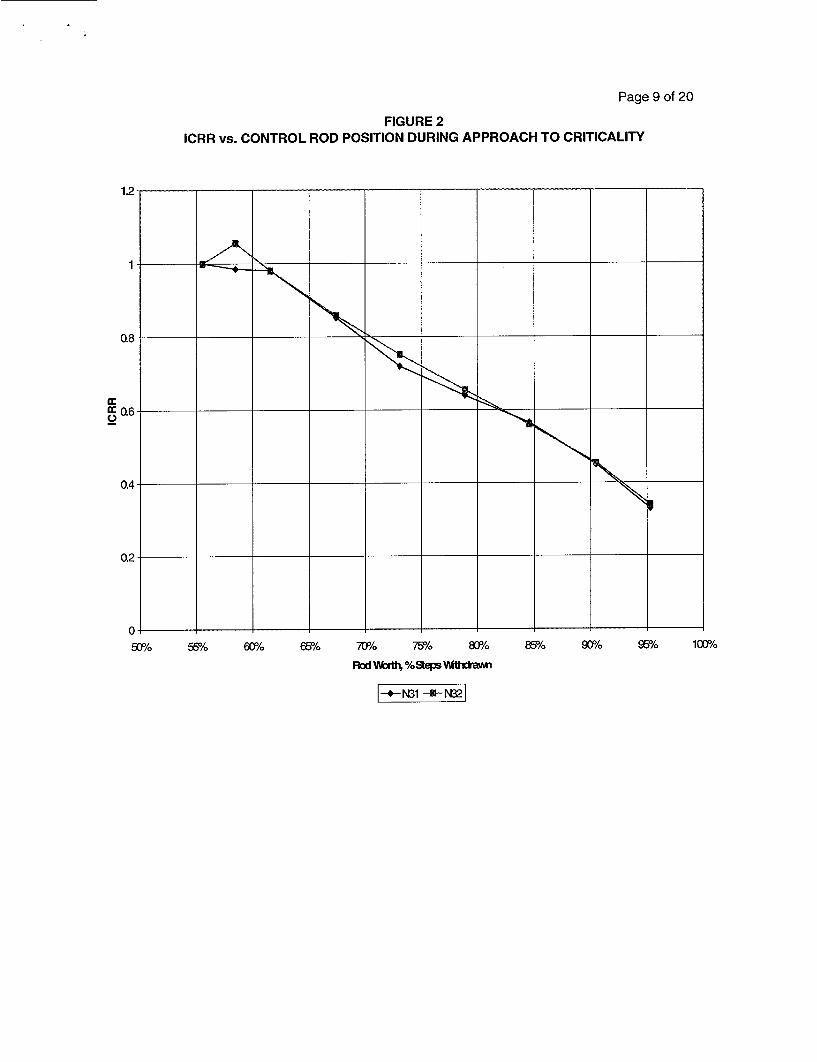
Page 9 of 20
FIGURE 2 ICRR vs. CONTROL ROD POSITION DURING APPROACH TO CRITICALITY
M
50% 55o10 60P/6 65&/ 707/ 7510 8(p/ 0
Rod Wob•i %epsW•thdran
I-4- N31 -- N321
W5/o 9%0 W5/o 10W%
,I
.9
Page 10 of 20
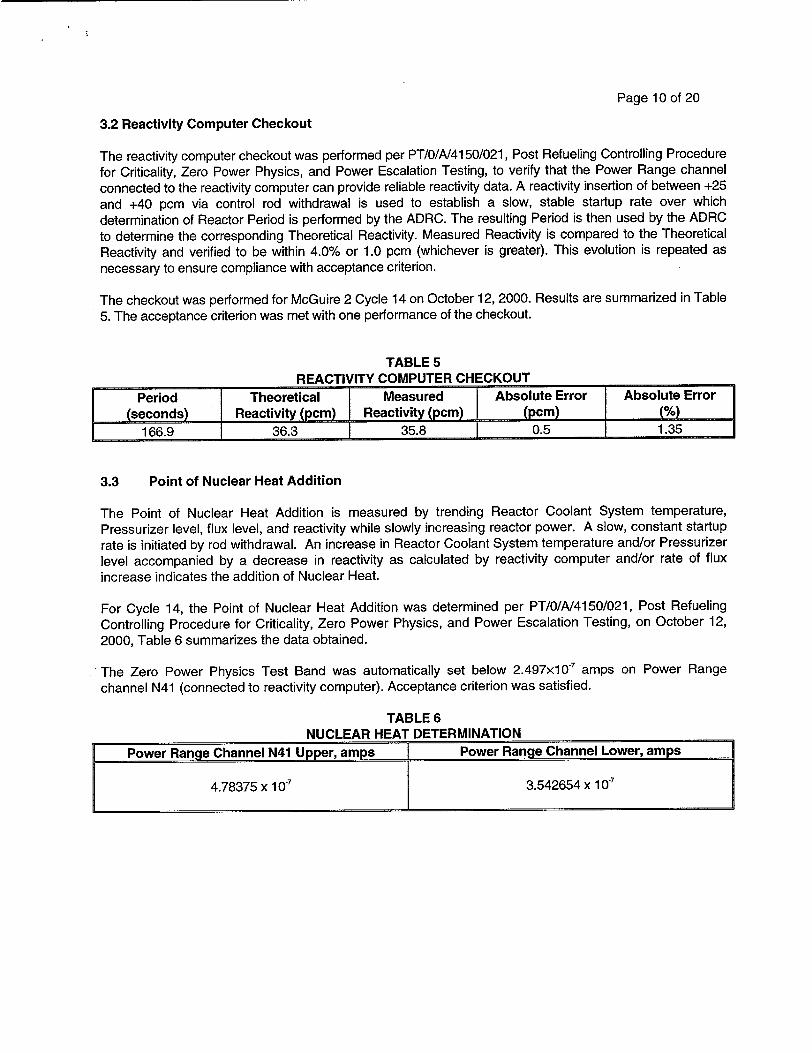
3.2 Reactivity Computer Checkout
The reactivity computer checkout was performed per PT/O/A/4150/021, Post Refueling Controlling Procedure
for Criticality, Zero Power Physics, and Power Escalation Testing, to verify that the Power Range channel
connected to the reactivity computer can provide reliable reactivity data. A reactivity insertion of between +25
and +40 pcm via control rod withdrawal is used to establish a slow, stable startup rate over which
determination of Reactor Period is performed by the ADRC. The resulting Period is then used by the ADRC
to determine the corresponding Theoretical Reactivity. Measured Reactivity is compared to the Theoretical Reactivity and verified to be within 4.0% or 1.0 pcm (whichever is greater). This evolution is repeated as necessary to ensure compliance with acceptance criterion.
The checkout was performed for McGuire 2 Cycle 14 on October 12, 2000. Results are summarized in Table
5. The acceptance criterion was met with one performance of the checkout.
TABLE 5 REACTIVITY COMPUTER CHECKOUT
Period Theoretical Measured Absolute Error Absolute Error
(seconds) Reactivity (pcm) Reactivity (pcm) (pcm) (%) 166.9 36.3 35.8 0.5 1.35
3.3 Point of Nuclear Heat Addition
The Point of Nuclear Heat Addition is measured by trending Reactor Coolant System temperature, Pressurizer level, flux level, and reactivity while slowly increasing reactor power. A slow, constant startup
rate is initiated by rod withdrawal. An increase in Reactor Coolant System temperature and/or Pressurizer
level accompanied by a decrease in reactivity as calculated by reactivity computer and/or rate of flux increase indicates the addition of Nuclear Heat.
For Cycle 14, the Point of Nuclear Heat Addition was determined per PT/O/A/4150/021, Post Refueling
Controlling Procedure for Criticality, Zero Power Physics, and Power Escalation Testing, on October 12, 2000, Table 6 summarizes the data obtained.
The Zero Power Physics Test Band was automatically set below 2.497x10⁷ amps on Power Range
channel N41 (connected to reactivity computer). Acceptance criterion was satisfied.
TABLE 6 NUCLEAR HEAT DETERMINATION
Power Range Channel N41 Upper, amps Power Range Channel Lower, amps
4.78375 x 10⁻⁷ 3.542654 x 10.7
Page 11 of 20
3.4 Dynamic Rod Worth Measurement
Using the Westinghouse Advanced Digital Reactivity Computer (ADRC), the reactivity worth of each
RCCA Bank is measured using DRWM technique as follows:
"* Control Bank D is withdrawn (in MANUAL) to fully withdrawn position. "* Flux level is allowed to increase to just below ZPPT Test Limit. "* First RCCA Bank to be measured is inserted in Bank Select Mode in one continuous motion to a Step
Demand Counter Indication - 2 steps withdrawn. "* Once the ADRC has signaled that it has acquired sufficient data for measurement, the RCCA Bank is
returned to fully withdrawn position. "* The next bank to be tested is then selected and, once flux level has recovered to just below ZPPT
Test Limit, the measurement process is repeated. "* This test sequence is repeated until all Control and Shutdown Banks have been measured
The measured worth of each RCCA Bank is verified to be within 15% or 100 pcm (whichever criteria is
greater) of predicted worth. The sum of the worths of all banks is verified to be within 8% of the sum of
predicted worths. This sum is also verified to be > 90% of predicted total.
The beginning of Cycle 14 rod worth measurements via DRWM were performed on October 12, 2000 per
PT/0/A/4150/021, Post Refueling Controlling Procedure for Criticality, Zero Power Physics, and Power
Escalation Testing. Results are summarized in Table 4. All acceptance criteria were met.
3.5 ARO Boron Endpoint Measurement
This test is performed at the beginning of each cycle to verify that measured and predicted total core
reactivity are consistent. The test is performed in conjunction with Dynamic Rod Worth Measurement.
Reactor Coolant System boron samples are obtained at 30 minute intervals during DRWM. The reactivity
difference from criticality to the ARO configuration is measured with each bank withdrawal over the course
of DRWM. These reactivities are averaged to determine the amount of control rod insertion at critical core
conditions. This reactivity is converted to equivalent boron (using the predicted differential boron worth)
and added to the average of the boron samples obtained during DRWM to obtain the ARO critical boron
concentration.
The Cycle 14 beginning of cycle, hot zero power, all rods out, critical boron concentration was measured
on October 12, 2000 per PT/0/A/4150/021, Post Refueling Controlling Procedure for Criticality, Zero
Power Physics, and Power Escalation Testing. The ARO, HZP boron concentration was measured to be
1684 ppmB. Predicted ARO critical boron concentration was 1687 ppmB. The acceptance criterion
(measured boron within 50 ppmB of predicted) was therefore met.
3.6 ARO Isothermal Temperature Coefficient Measurement
The all rods out (ARO) Isothermal Temperature Coefficient (ITC) is measured at the beginning of each
cycle to verify consistency with predicted value. In addition, the Moderator Temperature Coefficient (MTC)
is obtained by subtracting the Doppler Coefficient from the ITC. The MTC is used to ensure compliance with Technical Specification limits.
Page 12 of 20
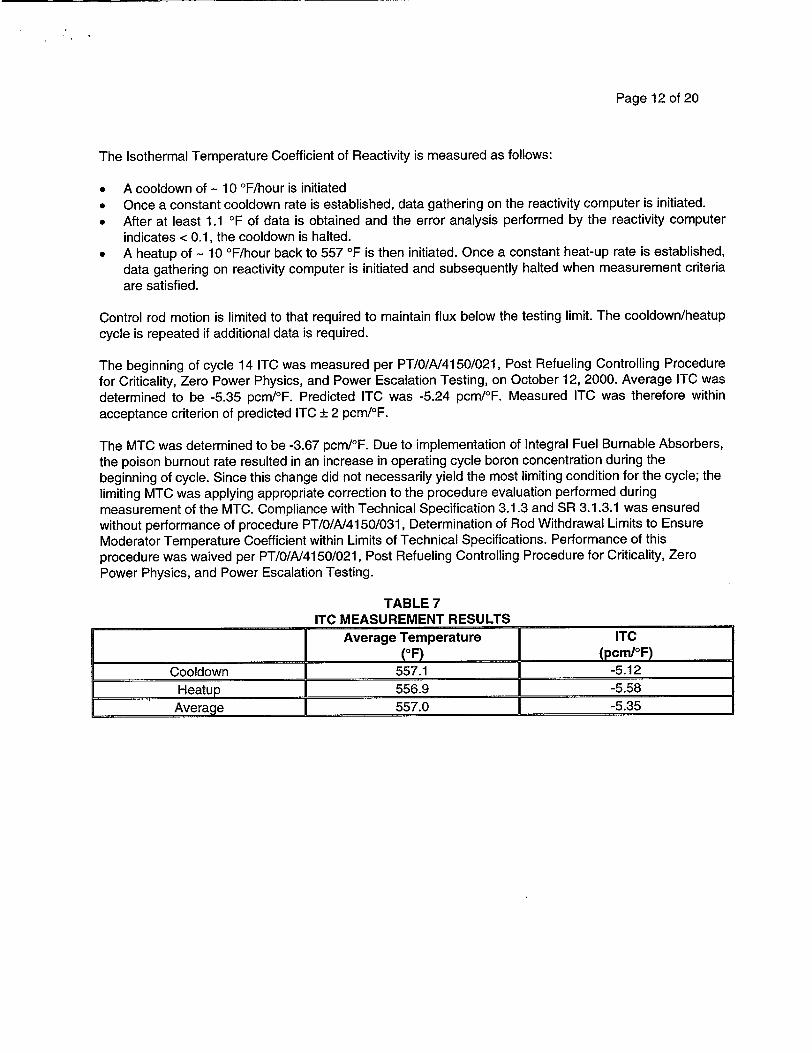
The Isothermal Temperature Coefficient of Reactivity is measured as follows:
"* A cooldown of - 10 OF/hour is initiated "* Once a constant cooldown rate is established, data gathering on the reactivity computer is initiated. "* After at least 1.1 OF of data is obtained and the error analysis performed by the reactivity computer
indicates < 0.1, the cooldown is halted. "* A heatup of - 10 OF/hour back to 557 OF is then initiated. Once a constant heat-up rate is established,
data gathering on reactivity computer is initiated and subsequently halted when measurement criteria are satisfied.
Control rod motion is limited to that required to maintain flux below the testing limit. The cooldown/heatup cycle is repeated if additional data is required.
The beginning of cycle 14 ITC was measured per PT/0/A/4150/021, Post Refueling Controlling Procedure for Criticality, Zero Power Physics, and Power Escalation Testing, on October 12, 2000. Average ITC was determined to be -5.35 pcm/OF. Predicted ITC was -5.24 pcm/°F. Measured ITC was therefore within acceptance criterion of predicted ITC ± 2 pcm/°F.
The MTC was determined to be -3.67 pcm/°F. Due to implementation of Integral Fuel Burnable Absorbers, the poison burnout rate resulted in an increase in operating cycle boron concentration during the beginning of cycle. Since this change did not necessarily yield the most limiting condition for the cycle; the limiting MTC was applying appropriate correction to the procedure evaluation performed during measurement of the MTC. Compliance with Technical Specification 3.1.3 and SR 3.1.3.1 was ensured without performance of procedure PT/0/A/4150/031, Determination of Rod Withdrawal Limits to Ensure Moderator Temperature Coefficient within Limits of Technical Specifications. Performance of this procedure was waived per PT/O/A/4150/021, Post Refueling Controlling Procedure for Criticality, Zero Power Physics, and Power Escalation Testing.
TABLE 7 ITC MEASUREMENT RESULTS
Average Temperature ITC (°F) (pcm/OF)
Cooldown 557.1 -5.12
Heatup 556.9 -5.58
Average 557.0 -5.35
Page 13 of 20
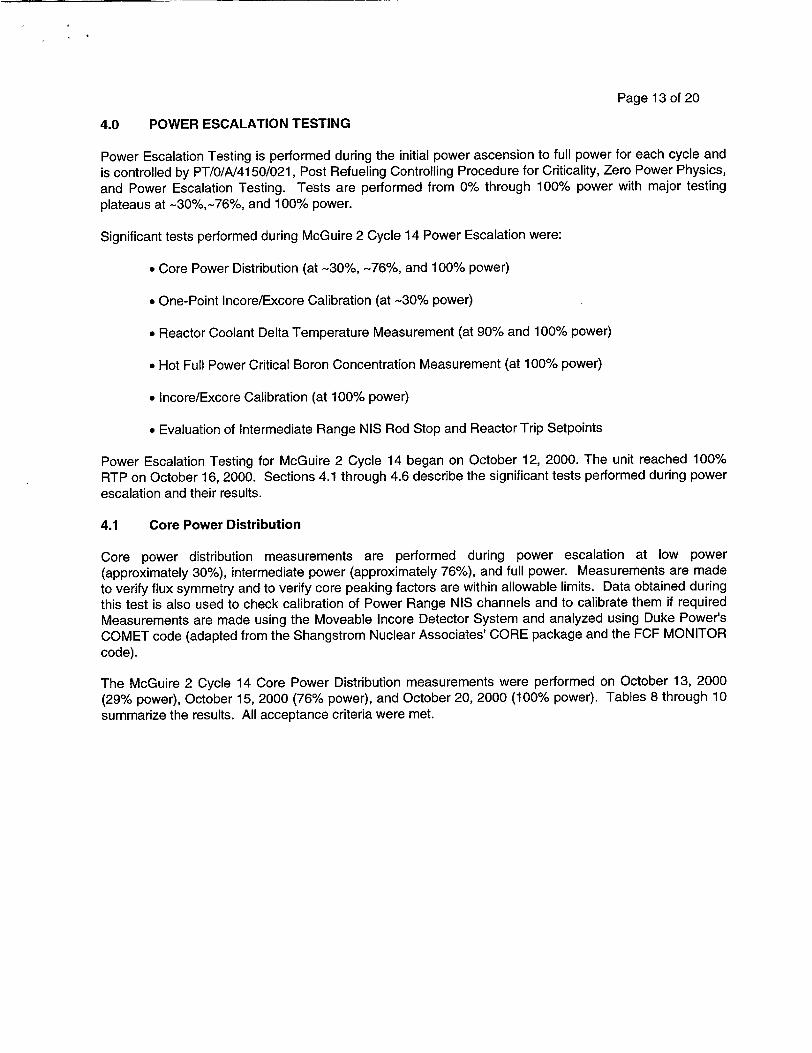
4.0 POWER ESCALATION TESTING
Power Escalation Testing is performed during the initial power ascension to full power for each cycle and
is controlled by PT/0/A/4150/021, Post Refueling Controlling Procedure for Criticality, Zero Power Physics,
and Power Escalation Testing. Tests are performed from 0% through 100% power with major testing
plateaus at -30%,-76%, and 100% power.
Significant tests performed during McGuire 2 Cycle 14 Power Escalation were:
"* Core Power Distribution (at -30%, -76%, and 100% power)
"* One-Point Incore/Excore Calibration (at -30% power)
"* Reactor Coolant Delta Temperature Measurement (at 90% and 100% power)
"* Hot Full Power Critical Boron Concentration Measurement (at 100% power)
"* Incore/Excore Calibration (at 100% power)
"* Evaluation of Intermediate Range NIS Rod Stop and Reactor Trip Setpoints
Power Escalation Testing for McGuire 2 Cycle 14 began on October 12, 2000. The unit reached 100%
RTP on October 16, 2000. Sections 4.1 through 4.6 describe the significant tests performed during power escalation and their results.
4.1 Core Power Distribution
Core power distribution measurements are performed during power escalation at low power
(approximately 30%), intermediate power (approximately 76%), and full power. Measurements are made
to verify flux symmetry and to verify core peaking factors are within allowable limits. Data obtained during this test is also used to check calibration of Power Range NIS channels and to calibrate them if required Measurements are made using the Moveable Incore Detector System and analyzed using Duke Power's COMET code (adapted from the Shangstrom Nuclear Associates' CORE package and the FCF MONITOR code).
The McGuire 2 Cycle 14 Core Power Distribution measurements were performed on October 13, 2000
(29% power), October 15, 2000 (76% power), and October 20, 2000 (100% power). Tables 8 through 10
summarize the results. All acceptance criteria were met.
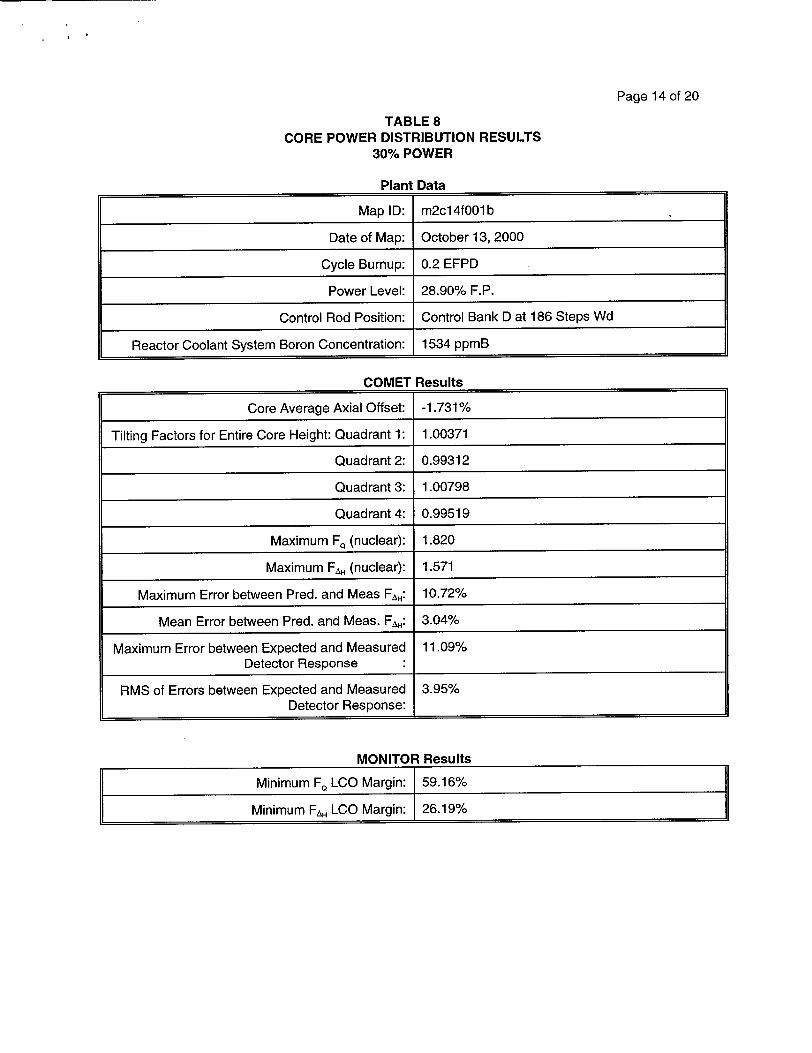
Page 14 of 20
TABLE 8 CORE POWER DISTRIBUTION RESULTS
30% POWER
Plant Data
Map ID: m2cl4f001b
Date of Map: October 13, 2000
Cycle Burnup: 0.2 EFPD
Power Level: 28.90% F.P.
Control Rod Position: Control Bank D at 186 Steps Wd
Reactor Coolant System Boron Concentration: 1534 ppmB
COMET Results
Core Average Axial Offset: -1.731%
Tilting Factors for Entire Core Height: Quadrant 1: 1.00371
Quadrant 2: 0.99312
Quadrant 3: 1.00798
Quadrant 4: 0.99519
Maximum F, (nuclear): 1.820
Maximum FA. (nuclear): 1.571
Maximum Error between Pred. and Meas F5: 10.72%
Mean Error between Pred. and Meas. FA: 3.04%
Maximum Error between Expected and Measured 11.09% Detector Response
RMS of Errors between Expected and Measured 3.95% Detector Response:
MONITOR Results
Minimum F. LCO Margin: 59.16%
Minimum F• LCO Margin: 26.19%
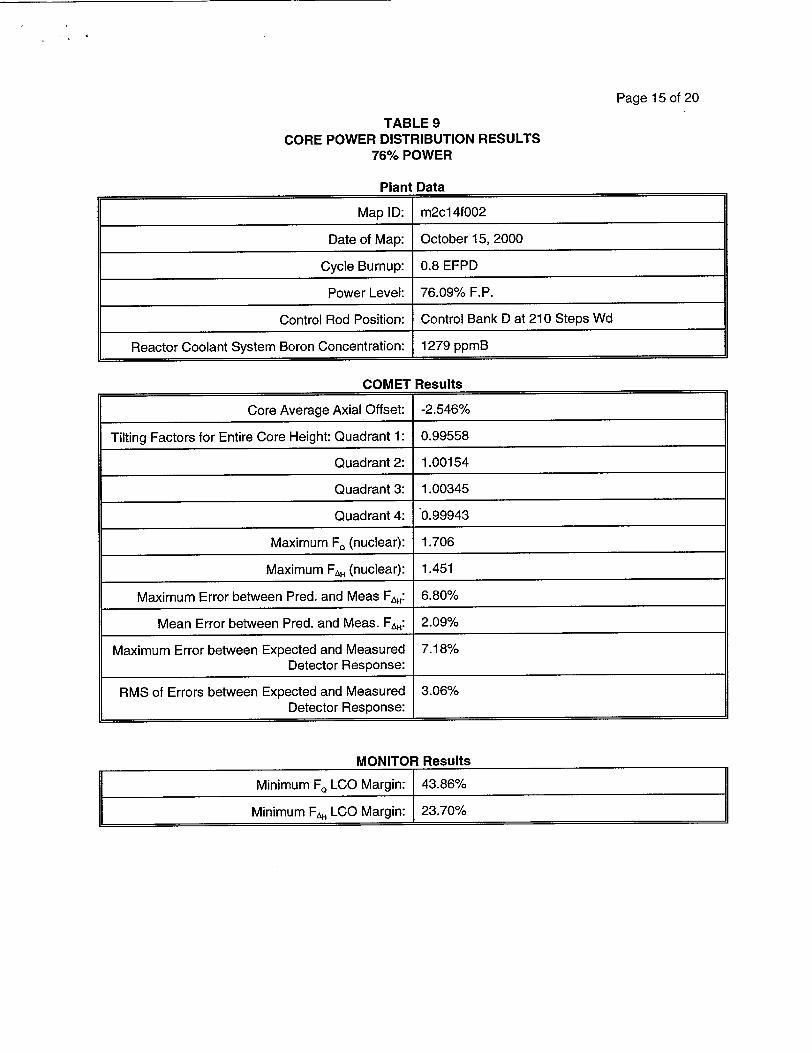
Page 15 of 20
TABLE 9 CORE POWER DISTRIBUTION RESULTS
76% POWER
Plant Data
Map ID: m2cl 4f002
Date of Map: October 15, 2000
Cycle Burnup: 0.8 EFPD
Power Level: 76.09% F.P.
Control Rod Position: Control Bank D at 210 Steps Wd
Reactor Coolant System Boron Concentration: 1279 ppmB
COMET Results
Core Average Axial Offset: -2.546%
Tilting Factors for Entire Core Height: Quadrant 1: 0.99558
Quadrant 2: 1.00154
Quadrant 3: 1.00345
Quadrant 4: 0.99943
Maximum F, (nuclear): 1.706
Maximum F,& (nuclear): 1.451
Maximum Error between Pred. and Meas F,&: 6.80%
Mean Error between Pred. and Meas. F,&: 2.09%
Maximum Error between Expected and Measured 7.18% Detector Response:
RMS of Errors between Expected and Measured 3.06% Detector Response:
MONITOR Results
Minimum F0 LCO Margin: 43.86%
Minimum F& LCO Margin: 23.70%
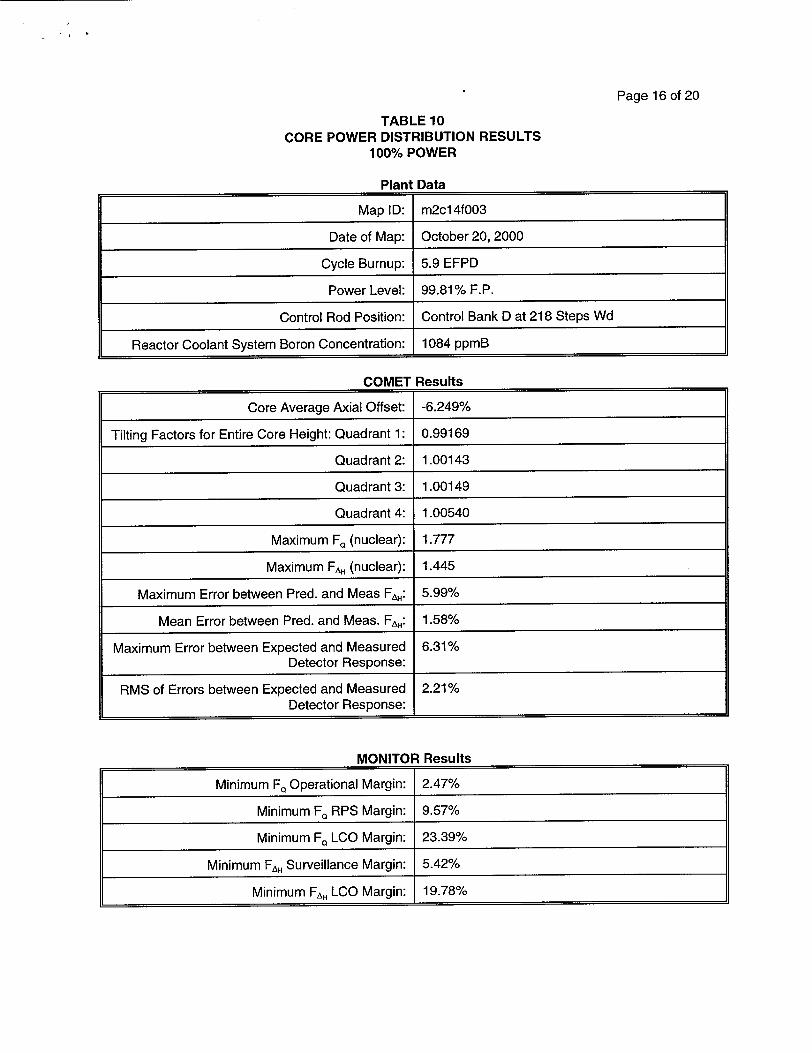
Page 16 of 20
TABLE 10 CORE POWER DISTRIBUTION RESULTS
100% POWER
Plant Data
Map ID: m2c14f003
Date of Map: October 20, 2000
Cycle Burnup: 5.9 EFPD
Power Level: 99.81% F.P.
Control Rod Position: Control Bank D at 218 Steps Wd
Reactor Coolant System Boron Concentration: 1084 ppmB
COMET Results
Core Average Axial Offset: -6.249%
Tilting Factors for Entire Core Height: Quadrant 1: 0.99169
Quadrant 2: 1.00143
Quadrant 3: 1.00149
Quadrant 4: 1.00540
Maximum F0 (nuclear): 1.777
Maximum FA, (nuclear): 1.445
Maximum Error between Pred. and Meas FA.: 5.99%
Mean Error between Pred. and Meas. FA,: 1.58%
Maximum Error between Expected and Measured 6.31% Detector Response:
RMS of Errors between Expected and Measured 2.21% Detector Response:
MONITOR Results
Minimum F. Operational Margin: 2.47%
Minimum F. RPS Margin: 9.57%
Minimum F. LCO Margin: 23.39%
Minimum FAH Surveillance Margin: 5.42%
Minimum FA, LCO Margin: 19.78%
Page 17 of 20
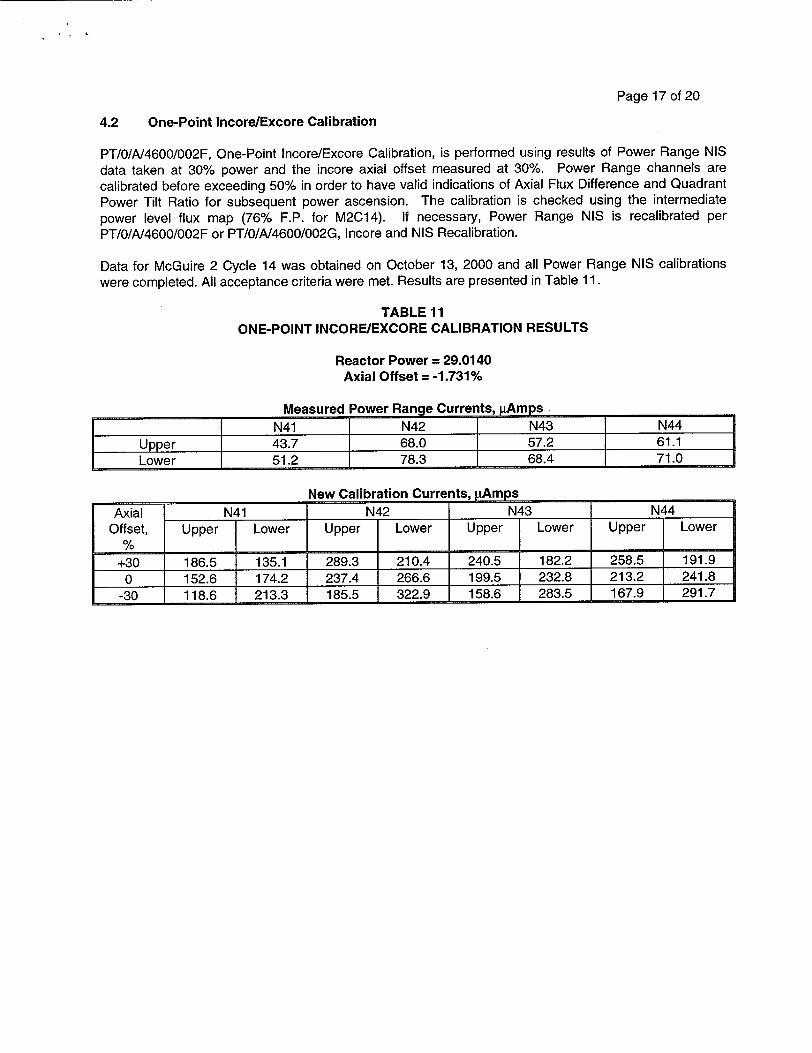
4.2 One-Point Incore/Excore Calibration
PT/O/A/4600/002F, One-Point Incore/Excore Calibration, is performed using results of Power Range NIS
data taken at 30% power and the incore axial offset measured at 30%. Power Range channels are
calibrated before exceeding 50% in order to have valid indications of Axial Flux Difference and Quadrant Power Tilt Ratio for subsequent power ascension. The calibration is checked using the intermediate
power level flux map (76% F.P. for M2C14). If necessary, Power Range NIS is recalibrated per
PT/0/A/4600/002F or PT/0/A/4600/002G, Incore and NIS Recalibration.
Data for McGuire 2 Cycle 14 was obtained on October 13, 2000 and all Power Range NIS calibrations were completed. All acceptance criteria were met. Results are presented in Table 11.
TABLE 11 ONE-POINT INCORE/EXCORE CALIBRATION RESULTS
Reactor Power = 29.0140 Axial Offset = -1.731%
Measured Power Range Currents, PAmps N41 N42 N43 N44
Upper 43.7 68.0 57.2 61.1
Lower 51.2 78.3 68.4 71.0
New Calibration Currents, pAmps Axial N41 N42 N43 N44
Offset, Upper Lower Upper Lower Upper Lower Upper Lower
+30 186.5 135.1 289.3 210.4 240.5 182.2 258.5 191.9
0 152.6 174.2 237.4 266.6 199.5 232.8 213.2 241.8
-30 118.6 213.3 185.5 322.9 158.6 283.5 167.9 291.7
Page 18 of 20
4.3 Reactor Coolant Loop Delta Temperature Measurement
Reactor Coolant System (NC) Hot Leg and Cold Leg temperature data is normally obtained at
approximately 87% and 100% power per PT/O/A/4150/040, NC Loop Delta-T, RTAS, and OPDT &OTDT
Channel Check Criteria Evaluation, to ensure that full power delta temperature constants (AT.) are valid.
AT 0 is used in the Over-power and Over-temperature Delta Temperature reactor protection functions.
In the case of M2C14, loop AT0's were evaluated at 90% F.P. on October 15, 2000 three loops required
gain adjustments. Power ascension proceeded to 100% F.P. where the AT 0's were re-evaluated. All
acceptance criteria were met.
4.4 Hot Full Power Critical Boron Concentration Measurement
The Hot Full Power critical boron concentration is measured using PT/O/A/4150/004, Reactivity Anomalies
Calculation. Reactor Coolant boron concentration is measured (average of three samples) with reactor at
essentially all rods out, Hot Full Power, equilibrium xenon conditions. The measured boron is corrected
for any off-reference condition (e.g. inserted rod worth, temperature error, difference from equilibrium ,xenon) and compared to predicted value.
For McGuire 2 Cycle 14, the Hot Full Power critical boron concentration was measured on October 20,
2000. The measured critical boron concentration was 1082 ppmB. Predicted HFP critical boron
concentration was 1085 ppmB. The ARO Boron Endpoint Measurement during ZPPT yielded a measured
HZP Boron Concentration of 1691 ppmB (prediction being 1687 ppmB). The predicted ABoron was
therefore 602 ppmB, while the measured ABoron was 609 ppmB. The difference of 7 ppmB between these
two parameters easily satisfied the acceptance criterion.
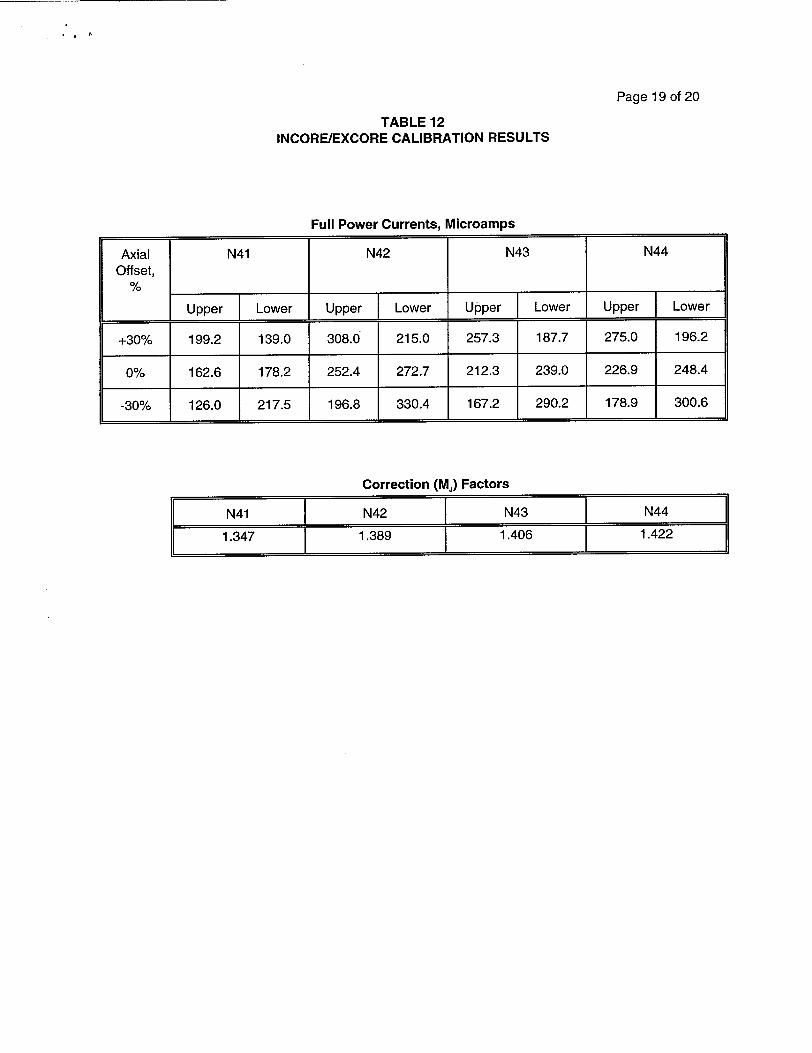
4.5 Incore/Excore Calibration
Excore NIS Power Range channels are calibrated at full power per PT/O/A/4600/002G, Incore and NIS
Recalibration. Incore data (flux maps) and Power Range NIS currents are obtained at various axial power distributions. A least squares fit of the output of each detector (upper and lower chambers) as a function
of measured incore axial offset is determined. The slopes and intercepts of the fit for the upper and lower
chamber for each channel are used to determine calibration data for that channel.
This test was performed for McGuire 2 Cycle 14 on October 20 - 21, 2000. Nine flux maps, with axial
offset ranging from -12.466% to 3.665% were used. Table 12 summarizes the results. All acceptance criteria were met.
Page 19 of 20
TABLE 12 INCORE/EXCORE CALIBRATION RESULTS
Full Power Currents, Microamps
Axial N41 N42 N43 N44
Offset,
Upper Lower Upper ]-Lower Upper] Lower Upper Lower
+30% 199.2 139.0 308.0 215.0 257.3 187.7 275.0 196.2
0% 162.6 178.2 252.4 272.7 212.3 239.0 226.9 248.4
-30% 126.0 217.5 196.8 330.4 167.2 290.2 178.9 300.6
Correction (Ma) Factors
Page 20 of 20
4.6 Intermediate Range NIS Setpoint Evaluation
PT/0/A/4150/021, Post Refueling Controlling Procedure for Criticality, Zero Power Physics, and Power Escalation Testing, performs an evaluation of Intermediate Range NIS response in comparison to 20% (Rod Stop) and 25% F.P. (Reactor Trip). This evaluation acquires N35 and N36 indication data as close to 25% Thermal Power as possible. The extrapolated channel responses are then compared to the installed 25% F.P. I/R NIS Reactor Trip setpoints to ensure existing setpoints do not exceed the channels' indication at 30% F.P. This verifies that the Reactor Trip setpoints have been established conservatively enough to ensure compliance with allowable Technical Specifications, tolerance on this Reactor Protection function.