I CCR S IMPOUNDMENT - aep.com€¦ · INACTIVE CCR SURFACE IMPOUNDMENT. Design and Operating...
50
INACTIVE CCR SURFACE IMPOUNDMENT Design and Operating Criteria CFR 257.71; 257.73; 257.74;257.82 Fly Ash Pond John E. Amos Plant April, 2018 Prepared for: Appalachian Power Company – John E. Amos Plant 1530 Winfield Rd, Winfield, West Virginia 25213 Prepared by: American Electric Power Service Corporation 1 Riverside Plaza Columbus, OH 43215 Document ID: GERS-18-012
Transcript of I CCR S IMPOUNDMENT - aep.com€¦ · INACTIVE CCR SURFACE IMPOUNDMENT. Design and Operating...

INACTIVE CCR SURFACE IMPOUNDMENT Design and Operating Criteria
CFR 257.71; 257.73; 257.74;257.82
Fly Ash Pond
John E. Amos Plant
April, 2018
Prepared for: Appalachian Power Company – John E. Amos Plant
1530 Winfield Rd,
Winfield, West Virginia 25213
Prepared by: American Electric Power Service Corporation
1 Riverside Plaza
Columbus, OH 43215
Document ID: GERS-18-012

Page 3 of 4
Table of CONTENTS 1.0 OBJECTIVE ................................................................................................................................................................ ......... 4
2.0 NAME AND DESCRIPTION OF INACTIVE CCR SURFACE IMPOUNDMENT ........................................ 4
Attachment: Closure Design Report (report text only)

Page 4 of 4
1.0 OBJECTIVE This report was prepared by AEP- Geotechnical Engineering Services (GES) section to fulfill requirements of CFR 257 Subpart D for Inactive CCR Surface Impoundments.
2.0 NAME AND DESCRIPTION OF INACTIVE CCR SURFACE IMPOUNDMENT The John E. Amos Power Plant is located near Winfield, Putnam County, West Virginia. It is owned and operated by Appalachian Power Company (APCO). The facility owns an inactive CCR surface impoundment that was used for permanent disposal of fly ash, referenced as the John Amos Fly Ash Pond (FAP). The Fly Ash Pond dam is a cross valley dam on Scary Creek, a tributary to the Kanawha River. The dam is 220 feet high and has side slopes of 2.5 to 3H:1V on the upstream slope, and 2.0 to 2.5H:1V on the downstream slope.
The dam is classified as a High Hazard Dam and is an unlined surface impoundment.
An operation of the CCR unit ceased in 2010 in accordance with the State requirements, and therefore was not operating as of October 14, 2015. The closure of the CCR unit started in 2011 with a site investigation and engineering report. The closure report was filed with applications to the State of West Virginia Department of Environmental Protection to close the fly ash pond.
Approval was obtained and construction activities started in September 2013. The construction was completed in the Fall of 2017. The closure of the CCR Unit was closure in place with a CCR compliant cap system, consisting of a geomembrane and two-feet thick cover soil and vegetation.
The closure report referenced above addressed all items related to Structural Integrity as per CFR 257.73, CFR 257.74 and CFR 257.82. As part of the closure design, a new discharge channel was constructed such that the dam no longer impounds any stormwater runoff from the watershed. The channel was designed to pass the peak discharge of the PMF design storm.
The text portion of the design report for the closure is in the attachment.
The facility is now in Post Closure Care period of 30 years.

ATTACHMENT
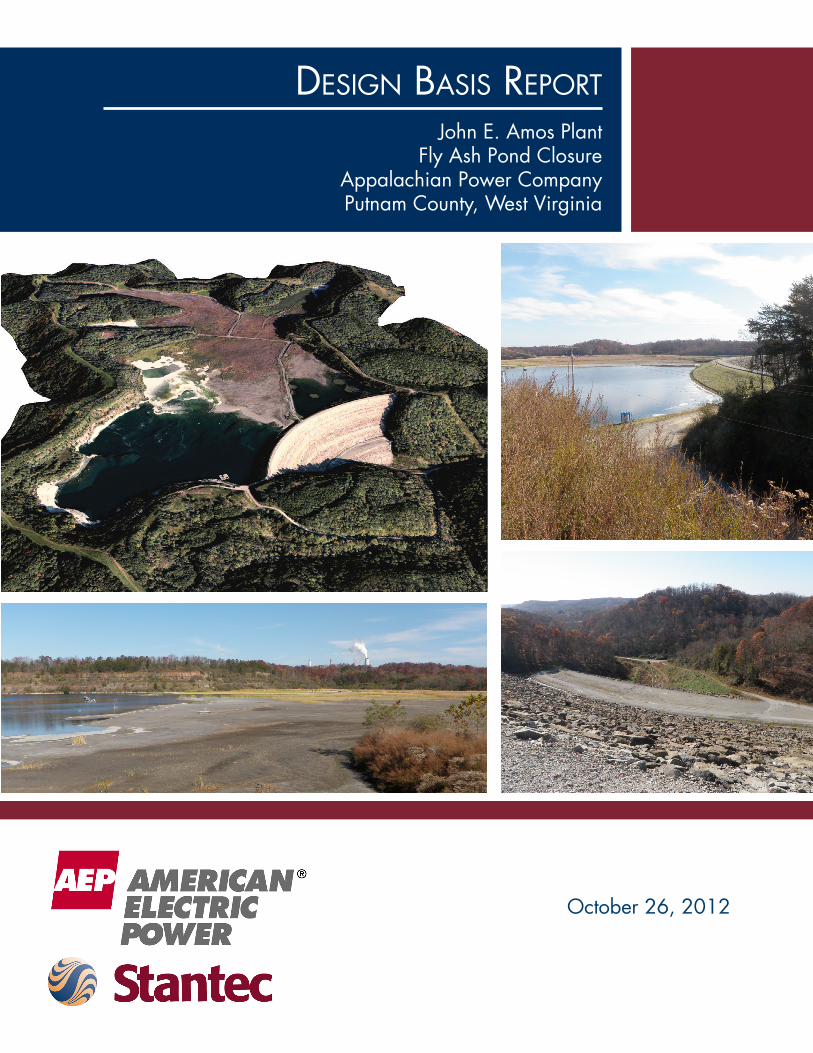
October 26, 2012
Design Basis RepoRt
John E. Amos PlantFly Ash Pond Closure
Appalachian Power CompanyPutnam County, West Virginia


DESIGN BASIS REPORT
lb w:\1756\active\175661014\clerical\report\permit design report\permit_design_report.docx i
Table of Contents
1.0 INTRODUCTION .............................................................................................................. 1.1 1.1 BACKGROUND ................................................................................................................ 1.1 1.2 PROJECT DESCRIPTION ................................................................................................ 1.3 1.3 DAM SAFETY CLASSIFICATION ..................................................................................... 1.3 1.4 PURPOSE AND SCOPE OF REPORT ............................................................................. 1.3
2.0 SITE DEVELOPMENT AND CONSTRUCTION ................................................................ 2.4 2.1 PRIMARY DESIGN ELEMENTS ....................................................................................... 2.4
2.1.1 Mass Grading ..................................................................................................... 2.4 2.1.2 Borrow Sites ....................................................................................................... 2.5 2.1.3 Soil Cover........................................................................................................... 2.5 2.1.4 Interim Stormwater Management ....................................................................... 2.5 2.1.5 Drainage Channel Network ................................................................................ 2.5
2.2 CONSTRUCTION SEQUENCING .................................................................................... 2.6 2.3 OPINION OF PROBABLE CONSTRUCTION COSTS ...................................................... 2.7 2.4 CONSTRUCTION SPECIFICATIONS ............................................................................... 2.7
3.0 STORMWATER MANAGEMENT ..................................................................................... 3.8 3.1 HYDROLOGY ................................................................................................................... 3.8 3.2 RESERVOIR POOL ROUTING ......................................................................................... 3.9
3.2.1 Stage – Storage – Discharge Relationships ....................................................... 3.9 3.2.2 Design Storm Routing Results .......................................................................... 3.10
3.3 CONTACT WATER CONTAINMENT .............................................................................. 3.10 3.4 CHANNEL DESIGN ........................................................................................................ 3.11
4.0 GEOTECHNICAL DESIGN ............................................................................................. 4.13 4.1 BORROW AREA ANALYSIS .......................................................................................... 4.13
4.1.1 Material Needs ................................................................................................. 4.14 4.1.2 Available Materials ........................................................................................... 4.14
4.2 SETTLEMENT ANALYSIS .............................................................................................. 4.15 4.2.1 Methodology and Assumptions ......................................................................... 4.15 4.2.2 Time Rate of Consolidation .............................................................................. 4.16 4.2.3 Settlement Magnitude and Differential Settlement ............................................ 4.17 4.2.4 Overbuild Design .............................................................................................. 4.18
4.3 POST-CLOSURE STABILITY ......................................................................................... 4.19 4.3.1 Design Criteria and Methodology ..................................................................... 4.19 4.3.2 Dam Stability .................................................................................................... 4.20 4.3.3 Closed Impoundment ....................................................................................... 4.21 4.3.4 Spillway Cut and Borrow Sites .......................................................................... 4.22 4.3.5 Stability During Construction ............................................................................ 4.25
4.4 LIQUEFACTION POTENTIAL ......................................................................................... 4.28 4.4.1 Seismic Liquefaction ........................................................................................ 4.28

DESIGN BASIS REPORT
lb w:\1756\active\175661014\clerical\report\permit design report\permit_design_report.docx ii
4.4.2 Site-Specific Seismic Study .............................................................................. 4.29 4.4.3 Cyclic Triaxial Testing....................................................................................... 4.30
4.5 INSTRUMENTATION ...................................................................................................... 4.34 4.5.1 Piezometers ..................................................................................................... 4.34 4.5.2 Vertical Slope Inclinometers ............................................................................. 4.36 4.5.3 Existing Instrumentation ................................................................................... 4.37 4.5.4 Post Closure ..................................................................................................... 4.37
5.0 REFERENCES ............................................................................................................... 5.38 Appendices Appendix A Dam Safety Documentation A-1 AEPSC (2008b) - Monitoring and Emergency Action Plan and Maintenance Plan A-2 AEPSC (1993) - Dam Break Analysis Appendix B Construction Documentation B-1 Work Plan B-2 Construction Estimate B-3 Construction Specifications Appendix C Stormwater Management C-1 Hydrologic Parameters C-2 Stage-Storage Curves C-3 Rating Curves C-4 Hydrologic Model Results C-5 Channel Design Appendix D Supporting Geotechnical Reports D-1 Stantec (2012d) – Geotechnical Data Report (Revision 2) D-2 Stantec (2012e) – Revised Supplemental Geotechnical Data Report Appendix E Geotechnical Analyses E-1 Settlement E-2 Global Stability E-3 Veneer Stability E-4 Dredge Dike Stability E-5 Liquefaction Potential
DESIGN BASIS REPORT FLY ASH POND CLOSURE
lb w:\1756\active\175661014\clerical\report\permit design report\permit_design_report.docx 1.1
1.0 Introduction
1.1 BACKGROUND
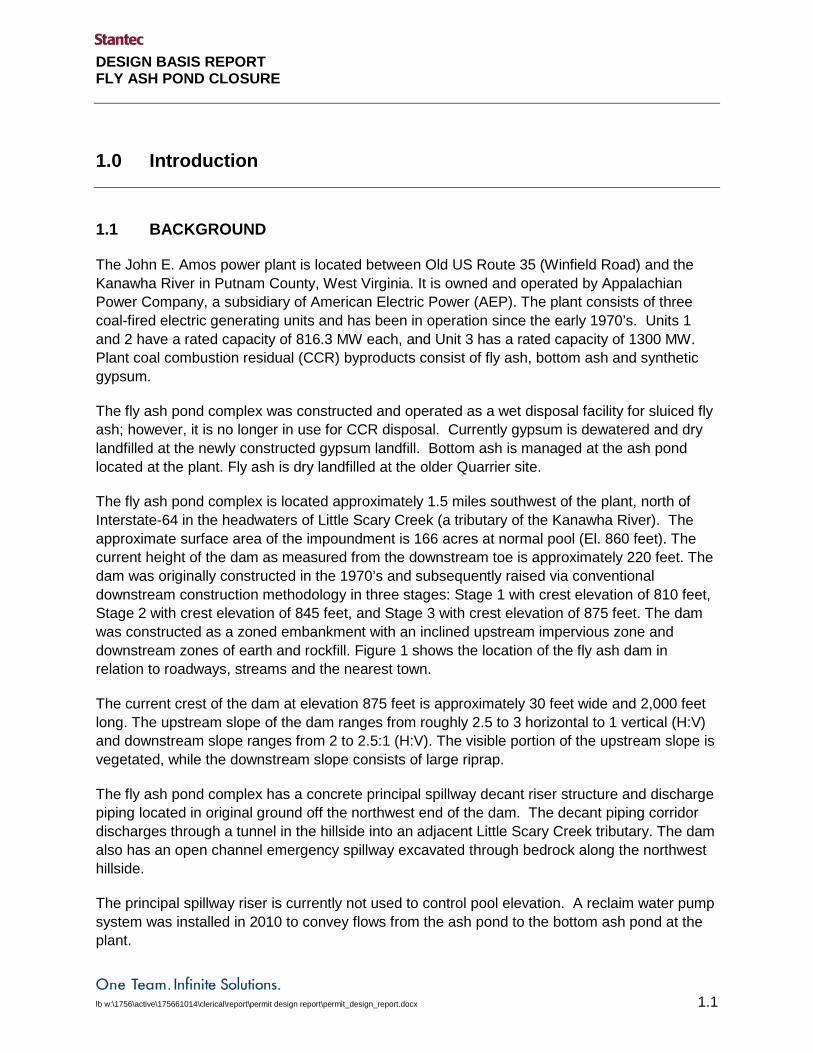
The John E. Amos power plant is located between Old US Route 35 (Winfield Road) and the Kanawha River in Putnam County, West Virginia. It is owned and operated by Appalachian Power Company, a subsidiary of American Electric Power (AEP). The plant consists of three coal-fired electric generating units and has been in operation since the early 1970’s. Units 1 and 2 have a rated capacity of 816.3 MW each, and Unit 3 has a rated capacity of 1300 MW. Plant coal combustion residual (CCR) byproducts consist of fly ash, bottom ash and synthetic gypsum.
The fly ash pond complex was constructed and operated as a wet disposal facility for sluiced fly ash; however, it is no longer in use for CCR disposal. Currently gypsum is dewatered and dry landfilled at the newly constructed gypsum landfill. Bottom ash is managed at the ash pond located at the plant. Fly ash is dry landfilled at the older Quarrier site.
The fly ash pond complex is located approximately 1.5 miles southwest of the plant, north of Interstate-64 in the headwaters of Little Scary Creek (a tributary of the Kanawha River). The approximate surface area of the impoundment is 166 acres at normal pool (El. 860 feet). The current height of the dam as measured from the downstream toe is approximately 220 feet. The dam was originally constructed in the 1970’s and subsequently raised via conventional downstream construction methodology in three stages: Stage 1 with crest elevation of 810 feet, Stage 2 with crest elevation of 845 feet, and Stage 3 with crest elevation of 875 feet. The dam was constructed as a zoned embankment with an inclined upstream impervious zone and downstream zones of earth and rockfill. Figure 1 shows the location of the fly ash dam in relation to roadways, streams and the nearest town.
The current crest of the dam at elevation 875 feet is approximately 30 feet wide and 2,000 feet long. The upstream slope of the dam ranges from roughly 2.5 to 3 horizontal to 1 vertical (H:V) and downstream slope ranges from 2 to 2.5:1 (H:V). The visible portion of the upstream slope is vegetated, while the downstream slope consists of large riprap.
The fly ash pond complex has a concrete principal spillway decant riser structure and discharge piping located in original ground off the northwest end of the dam. The decant piping corridor discharges through a tunnel in the hillside into an adjacent Little Scary Creek tributary. The dam also has an open channel emergency spillway excavated through bedrock along the northwest hillside.
The principal spillway riser is currently not used to control pool elevation. A reclaim water pump system was installed in 2010 to convey flows from the ash pond to the bottom ash pond at the plant.

DESIGN BASIS REPORT
lb w:\1756\active\175661014\clerical\report\permit design report\permit_design_report.docx 1.2
Figure 1. Location Map

DESIGN BASIS REPORT
lb w:\1756\active\175661014\clerical\report\permit design report\permit_design_report.docx 1.3
1.2 PROJECT DESCRIPTION
The Amos Fly Ash Pond Closure project will eliminate the permanent pool through the re-grading of the in-situ fly ash within the impoundment and excavation of a new outlet channel to the west of the facility. The re-graded ash will be overlain by a soil cover to prevent direct contact between stormwater runoff and CCRs.
1.3 DAM SAFETY CLASSIFICATION
The Amos Fly Ash Pond Dam is classified as a Class I structure per West Virginia Dam Safety Regulations. The previously developed Monitoring and Emergency Action Plan and Maintenance Plan revised January 24, 2008 by AEP are included in Appendix A-1. The Emergency Action Plan utilized results of a dam break analysis prepared by AEP in 1993. A copy of the dam break analysis is also provided in Appendix A-2. No updates to the plans or dam break analysis are proposed at this time. During closure operations, the normal pool and volume of sluiced ash / water impounded will not exceed the previous modeled conditions and will reduce potential breach consequences.
1.4 PURPOSE AND SCOPE OF REPORT
This engineering report is provided in support of the West Virginia Dam Safety permit modification application for the Amos Fly Ash Pond Closure project. The report presents the proposed design and supporting engineering analyses. Section 2.0 outlines the proposed construction elements, sequencing, costs and specifications. Section 3.0 discusses the analysis and design of stormwater management features including reservoir pool routings and channel design. Finally, Section 4.0 includes the review of the geotechnical design analyses performed including settlement, slope stability and liquefaction potential.

DESIGN BASIS REPORT
lb w:\1756\active\175661014\clerical\report\permit design report\permit_design_report.docx 2.4
2.0 Site Development and Construction
2.1 PRIMARY DESIGN ELEMENTS
The Amos Fly Ash Pond Closure Permit Drawings provided with the application present the proposed closure design. The design is comprised of multiple key elements outlined below and detailed further in the project work plan and construction specifications.
2.1.1 Mass Grading
The proposed closure design includes the re-grading of in-situ fly ash within the fly ash pond impoundment to facilitate drainage across the site and eliminate a permanent pool. Initial grading will be performed through excavation of fly ash in the central and western portions of the pond and placement in the eastern areas of the pond. The grading is anticipated to occur via one or a combination of the following methods: 1) hydraulic dredging of fly ash and placement in upstream dredge containment areas and/or 2) conventional excavation and fill placement utilizing low ground pressure construction equipment. Proposed grading plans for the final grade and interim phasing are presented in Drawings 13-30705 to 30714.
A typical dredge containment dike detail is presented in Drawing 13-30727. The typical dike design includes a homogenous soil embankment with a compatible chimney filter and drainage blanket. The upstream and downstream slopes are protected from erosion with a soil/rock cover. The pool elevation will be controlled by a fixed trapezoidal spillway with an invert two feet below the dam crest.
Dredge containment dike heights will vary based on their location and the proposed final grades. The dikes will be restricted to a maximum height of 24 feet and the open impounded volume less than 50-acre feet. Dredge containment areas may not be operated in series. Once a cell is filled to capacity, the free water shall be drained and final grade established prior to construction of the next downstream cell.
As an alternative to dredging, the contractor may elect to utilize conventional grading methods based on either ease of construction or economic factors. Areas not filled via hydraulic dredging shall be constructed with fly ash or soil / rock borrow from designated borrow sites within the impoundment watershed.
For purposes of the construction work plan and cost opinion, it is currently assumed that the majority of grading in the eastern and central portions of the pond identified in the Phase 1 drawings will be constructed with hydraulic dredging. The remaining grading operations in the western areas will completed via conventional methods.

DESIGN BASIS REPORT
lb w:\1756\active\175661014\clerical\report\permit design report\permit_design_report.docx 2.5
2.1.2 Borrow Sites
Soil and rock borrow for use in the pond closure will be sourced from one of four borrow sites located adjacent to the pond. The borrow sites are identified on Drawings 13-30714 to 30720. Maximum extents for the borrow sites are identified on the drawings. Borrow materials are anticipated to include clay overburden soils and bedrock including claystone, shales, siltstone and sandstone. Additional information regarding the composition and uses of borrow material is provided in Section 4.1, Borrow Area Analysis.
2.1.3 Soil Cover
Soil cover will be placed atop the ash subgrade surface to protect the placed fill from erosion. The soil will be sourced from the adjacent borrow areas. Cover soils will be sloped from 2-10 percent. The top six inches will be suitable to sustain vegetation.
2.1.4 Interim Stormwater Management
The existing water reclaim system consists of the pump station located adjacent to the emergency spillway and twin eight-inch HDPE reclaim water lines that run along the crest of the dam and along a floating roadway east toward the plant. Stormwater that falls within the pond watershed is stored in the pond and pumped via the reclaim system to the plant. During construction, the reclaim system will be utilized to manage construction runoff and ash contact water.
Modifications to the system will be required as the proposed grading will impact the existing discharge pipes and require water levels in the pond lower than the allowable operating range of the existing pump system estimated as elevation 850 feet. The new reclaim water lines will be constructed outside of the proposed excavation limits. Details for the water lines are provided on Drawing 13-30707.
Additionally, the contractor will modify the existing pump intake lines to accommodate attachment of a secondary pumping system. The secondary system will pump water through two temporary units at the current pump station capacity (675 gpm) each from elevations below 850 feet to the existing pump station. The existing station will then pump flows back to the plant.
2.1.5 Drainage Channel Network
Following establishment of final grades, stormwater runoff from the soil cover and surrounding hillsides will be conveyed across the final surface, via a network of drainage channels, through a newly excavated spillway adjacent to the existing emergency spillway and into a tributary of Little Scary Creek. Channel details are shown on Drawing 13-30728. Details on the design of each channel are provided in Section 3.4.

DESIGN BASIS REPORT
lb w:\1756\active\175661014\clerical\report\permit design report\permit_design_report.docx 2.6
2.2 CONSTRUCTION SEQUENCING
The proposed construction sequencing was developed to review constructability concerns and allow for review of potential interim conditions. The actual construction sequencing of the proposed closure may differ from that displayed on Drawings 13-30708 to 30713 and will be determined by the selected contractor.
The construction phases presented are described below. A more detailed outline of the construction sequencing is provided in Appendix B-1.
• Phase 1 – Initial Mass Grading: In-situ ash will be hydraulically dredged and placed in upstream dredge containment areas. The operating pool of the ash pond will be maintained at an approximate elevation of 860 feet to allow for dredge equipment access to the excavation areas. The dredge containment dikes would maintain a permanent pool to allow for solids to settle and decanted water to flow back to the larger impoundment. The containment areas would be constructed from upstream to downstream and dewatered as necessary. Constructed dredge containment dikes will maintain storage capacity and dike height metrics below dam classification thresholds.
• Phase 2 – Close Dredge Containment Areas and Grade Dredged Areas: At the conclusion of dredging operations, the pool level will be drawn down and the dredge containment areas will be constructed to final grade, covered, mulched and seeded. Areas within the pond that were dredged will be graded to prepare for final cap and the pond water level will be lowered by the contractor using the existing reclaim water pump system and the secondary pumping system.
• Phase 3 – Continue Closure: During Phase 3, the prepared subgrade in Phase 2 will be covered, mulched and seeded. Additional subgrade development will occur with stormwater being directed to a smaller pool in the northwest corner of the pond.
• Phase 4 - Completion of Diversion Network: Phase 4 will include the cover, mulch and seeding of the Phase 3 area and completion of the diversion network. This will include construction of the proposed spillway rock cut and connection to the receiving tributary. Stormwater will continue to be maintained in the northwest pool.
• Phase 5 – Final Closure Operations: During Phase 5, the majority of stormwater runoff within the pond watershed will be diverted through the proposed spillway following establishment of vegetation of the Phase 4 final cover. A small water quality basin will remain to provide for erosion control and contact water containment of the area not yet completed. The remaining pond will be filled in and closed from the perimeter working towards the pond. Finally, once vegetation has been established, the small remaining pond will be closed and all runoff directed to the diversion channel. At this time, the existing principal spillway will be abandoned.

DESIGN BASIS REPORT
lb w:\1756\active\175661014\clerical\report\permit design report\permit_design_report.docx 2.7
2.3 OPINION OF PROBABLE CONSTRUCTION COSTS
A construction cost opinion has been developed as part of the permit design package. The total construction costs are estimated at $26,819,000. A detailed breakdown of the construction cost opinion is provided in Appendix B-2.
2.4 CONSTRUCTION SPECIFICATIONS
Specifications have been developed for the construction of the proposed improvements. The specifications include the following:
• CE-002 - Specification for Clearing and Grubbing • CE-003 - Specification for Stripping • CE-004 - Specification for Excavation • CE-004A - Specification for Rock Blasting • CE-005 - Specification for Foundation Preparation • CE-006 - Specification for Fill • CE-006A - Earthwork (Backfill) Testing • CE-007 - Specification for Erosion and Sediment Control • CE-008 - Specification for Surface Drainage Systems • CE-009 - Specification for Roads and Parking Areas • CE-009A - Specification for Road Mix Fly Ash-Aggregate Base Course • CE-013 - Specification for Geotextile • CE-013A - Nonwoven Geotextile • CE-017 - Specification for Hydraulic Dredging • CE-022 - Specification for Surface Settlement Monuments and Settlement Gages • CE-025 - Specification for Pressure Relief, Horizontal, and French Drains • CE-033 - Specification for Loading, Excavating, Hauling, Placing, and Compacting of
Coal Combustion By-Products • CE-036 - Demolition Removals and Alterations • CE-037 - Excavation and Backfill for Underground Utilities • CE-040 - Materials for Underground Piping and Sewers
These are included in Appendix B-3.
DESIGN BASIS REPORT
lb w:\1756\active\175661014\clerical\report\permit design report\permit_design_report.docx 3.8
3.0 Stormwater Management
Stantec performed stormwater calculations to evaluate the hydrologic and hydraulic performance of the drainage facilities for the proposed closure design. This analysis included routing of storm runoff through the impoundment for existing, interim and closed conditions. In addition, peak flow rates were estimated for the closed condition to develop the stormwater conveyance and diversion structure designs.
Current pond operations maintain a normal pool elevation of approximately 860 feet utilizing the reclaim water pump system with a total rated capacity of 1350 gallons per minute (3 cubic feet per second). The pump system was designed to prevent the discharge of water through the primary decant structure (current discharge elevation 867 feet) for storm events equal to or less than back-to-back 25-year, 24-hour storms. These storm inflows are stored in the pond and pumped back to the bottom ash pond at the plant.
As outlined in Section 2.0, the ash pond will be closed through the progressive phasing of excavation and fill within the impoundment. Throughout construction, the existing operation guidelines will be maintained. Contact water (i.e. rainfall that falls on or passes over exposed ash) will be stored within the pond footprint and pumped back to the bottom ash pond for storm events equal to or less than back-to-back 25-year, 24-hour events. In addition, the proposed interim grading and pond elevations will provide sufficient storage and spillway capacity to pass the Probable Maximum Precipitation (PMP) event without overtopping the dam crest.
Final closure conditions will result in elimination of the permanent pool and a direct connection to a downstream tributary of Little Scary Creek through a deepening of the existing emergency spillway cut. The primary decant structure will be abandoned and new drainage channels constructed atop the closed pond surface. The proposed drainage channels are designed to convey the 100-year, 6-hour storm event.
3.1 HYDROLOGY
Stantec computed runoff hydrographs for the drainage area of the impoundment using the U.S. Army Corps of Engineers (USACE) Hydrologic Modeling System (HEC-HMS) Version 3.4 (USACE, 2010). Twelve design subbasins were delineated based on topographic information provided by AEP and the proposed closure geometry. The base mapping was derived from AEP aerial and hydrographic surveys dated early 1996, March 29, 2002, April 5, 2005 and September 8, 2010. Topographic data was formatted into 2-foot contours referenced to the North American Vertical Datum of 1988. Figure C-1 in Appendix C.1 displays the subbasin delineations and key drainage features.
Hydrologic calculations were performed using the methodology outlined in the U.S. Department of Agriculture (USDA) Technical Release 55: Urban Hydrology for Small Watersheds (TR-55) (USDA, 1986). Design storm rainfall depths were determined using the National Oceanic and

DESIGN BASIS REPORT
lb w:\1756\active\175661014\clerical\report\permit design report\permit_design_report.docx 3.9
Atmospheric Administration (NOAA) Atlas 14: Point Precipitation Frequency Estimates (NOAA, 2011) and Hydrometeorological Report No. 51 (NOAA, 1978). Design storm information is summarized in Table 1. The SCS Type B six hour rainfall hyetograph was utilized for each 6-hour event (Chow, 1988), and a modified SCS Type II hyetograph was utilized for the back-to-back 24-hour events.
Table 1. Design Storms
Recurrence Interval (year)
Duration (hour)
Rainfall Depth (inches) Design Basis
2 6 1.81 Low Flow (Bankfull) Channel Design
Back-to-Back 25 48 8.31 Contact Water Containment Pool Routing
100 6 3.84 Channel Design
PMP 6
27.80
Dam Safety Pool Routing
Stantec analyzed the performance of the pond and drainage network for the existing, interim and closed conditions. Subbasin runoff properties, including curve numbers and lag times, were calculated for each of the modeled scenarios using TR-55 methodology. Appendix C.1 includes a summary of the hydrologic parameters for each model scenario.
3.2 RESERVOIR POOL ROUTING
The existing fly ash pond complex must continue to meet dam safety regulations outlined in the State of West Virginia’s “Title 47, Legislative Rule, Department of Environmental Protection, Water Resources Series 34, Dam Safety Rule” (State of West Virginia, 2009) throughout pond closure construction. As a high hazard facility, the pond must maintain the capacity to store and pass the 6-hour PMP event without overtopping the dam crest. To assess the impacts of the proposed closure design on the reservoir performance during a PMP event, Stantec analyzed each interim phase of construction and the final proposed closure geometry.
3.2.1 Stage – Storage – Discharge Relationships
A unique stage storage curve was developed for each modeled scenario using existing aerial and hydrographic survey data and proposed grading plans. Figures C.2 and C.3 in Appendix C.2 show the estimated stage storage curves for each of these scenarios.
Additionally, two separate rating curves were developed for the analysis. Rating Curve # 1 represents the existing pond operations including the principal spillway set at El. 867 feet and the emergency spillway at El. 868 feet. Rating Curve #2 represents the final spillway configuration with the proposed channel cut through the ridge on the west side of the pond. Due

DESIGN BASIS REPORT
lb w:\1756\active\175661014\clerical\report\permit design report\permit_design_report.docx 3.10
to the varied geometry and slope of the spillway cut, a HEC-RAS model was developed to calculate water surface elevations at multiple locations for a range of flow rates. Figures C.4 and C.5 in Appendix C.3 provide a graphical representation of Rating Curves 1 and 2, respectively.
3.2.2 Design Storm Routing Results
The results of the analysis are presented in Table 2. Additional model results output is provided in Appendix C.4.
Table 2. PMP Reservoir Routing Results
Based on the results of the analyses, none of the existing or proposed conditions will result in pool elevations greater than the top of the existing primary spillway (El. 867’), emergency spillway (El. 868’) or within 9 feet of the dam crest (El. 875’). The highest pool elevation would occur during the initial stages of Phase 2 when fill has been placed in the eastern sections of the pond and the pool is still raised for dredging operations. Subsequent phases lower the normal pool elevation and result in additional storage capacity and freeboard.
Following completion of construction, the permanent pool will be eliminated; however, during extreme events, such as the PMP, water may pond on the graded surface for less than 24-hours.
3.3 CONTACT WATER CONTAINMENT
In addition to the PMP reservoir pool routings, Stantec also reviewed the performance of the proposed contact water containment ponds during Phases 3, 4 and 5 of construction. During these phases, excavation of some or all of the Borrow Site 3 / Spillway Cut will occur. With excavation of this area, a potential release of contact water could occur without proper containment procedures.
Using the results of the HEC-HMS rainfall-runoff analysis, Stantec performed pool routings for each phase to determine the required containment elevation for back-to-back 25-year, 24-hour storm events. The results of the routings, as well as the containment elevations specified on the drawings, are provided in Table 3 below.
Phase Spillway Elevation
(feet)
Max Normal Pool Elevation
(feet)
Peak Pool Elevation
(feet) Existing 867.0 860.0 864.4
1 / 2 867.0 860.0 865.5 3 867.0 832.0 851.9 4 867.0 824.0 852.6
Final 825.2 825.2 836.7

DESIGN BASIS REPORT
lb w:\1756\active\175661014\clerical\report\permit design report\permit_design_report.docx 3.11
Table 3. Containment Pond Routing Results (Back-to-Back 25-Year, 24-Hour Storms)
During back-to-back 25-year events, containment elevations provide at least 0.8 feet of freeboard above the calculated maximum pool elevations.
3.4 CHANNEL DESIGN
Each of the proposed permanent drainage channels was designed to convey the 100-year 6-hour storm event, which meets the West Virginia Dam Safety Regulations for diversion channels and exceeds the requirements for supplemental drainage features. The permit modification drawings include details for three channel configurations. Each of the configurations is a two-staged channel with a small “bankfull” channel and a broader shallow floodplain.
The channel geometries were designed to contain a 2-year storm event within the “bankfull” channel and a 100-year storm event within the floodplain area. Table 4 below, provides a list of peak flow rates at key locations developed from the HEC-HMS rainfall-runoff analysis. The location of each studied discharge point is shown on Figure C.1 in Appendix C.1.
Table 4. Drainage Channel Peak Flow Rates
Peak Flows (cfs) Discharge Point 2-Year 100-Year
A 93 478 B 91 456 C 86 432 D 8 43 E 10 40 F 9 41 G 8 71 H 8 41 I 15 82
The required channel depth and erosion protection were determined based on methods outlined in the West Virginia Division of Highways Drainage Manual (WVDOT, 2007). Normal depth for each channel was calculated based on Manning’s equation. The maximum anticipated shear
Phase
Normal Pool Elevation
(feet) Peak Pool Elevation
Containment Elevation
(feet)
3 832.0 839.2 840.0
4 824.0 838.7 840.0
5 830.0 838.4 840.0

DESIGN BASIS REPORT
lb w:\1756\active\175661014\clerical\report\permit design report\permit_design_report.docx 3.12
stress was calculated using Tractive Force Theory. Example calculations and channel design results are provided in Appendix C.5.

DESIGN BASIS REPORT
lb w:\1756\active\175661014\clerical\report\permit design report\permit_design_report.docx 4.13
4.0 Geotechnical Design
4.1 BORROW AREA ANALYSIS
Construction of the final closure system will require significant quantities of soil that is suitable for supporting vegetation. In addition, significant borrow material will be needed to adjust grades within the pond footprint prior to placing the final cover. Stantec’s geotechnical exploration, performed in February and March of 2012, focused on potential borrow areas within the ash pond watershed, as well as within the vicinity of the proposed spillway cut.
Four areas were identified as potential borrow sites during the exploration and are shown in planview and profile on the permit modification drawings. Borrow Sites 1, 2 and 4 are located around the eastern perimeter of the ash pond, and Borrow Site 3 is located on north side of the existing emergency spillway cut. Both soil and rock excavation is expected within these areas, with rock excavation being performed using mechanical excavation and/or blasting. Certain weaker rock strata can be broken down into clay-like materials as needed.
These borrow sites will provide material for three primary needs:
• Soil Cover – final cover
• Durable Rock Fill – channel lining, slope protection stone, etc.
• Bulk Fill – subgrade fill (in areas where dredged fly ash is not used), other areas where random fill is suitable.
Although dredged fly ash will be used extensively as subgrade fill, it is not discussed further herein because it is not being imported from outside the pond footprint.
In conjunction with the geotechnical exploration performed by Stantec, several historical references were used to define the subsurface stratigraphy for each site. These sources were also used to determine the available materials and quantities. The references included Acres American Incorporated (1974, 1975a, 1975b) reports for the main dam construction and expansion (including quarries that were to provide soil and rock borrow), along with the H. C. Nutting (2008) geotechnical report and AEP (1995) boring and monitoring well logs. Geotechnical reports provided by Stantec to support this design project are included in Appendix D. This includes Stantec (2012d) and Stantec (2012e).
Conceptual cut slope designs were developed for each borrow site, and can be found in the permit drawings. With the exception of Borrow Site 3, the slopes shown represent the steepest allowable slopes and the greatest lateral extent of development. The contractor may choose the degree of development for each borrow site based on their preferred approach. The lateral extent of the excavation is constrained by a minimum setback distance from gas lines located

DESIGN BASIS REPORT
lb w:\1756\active\175661014\clerical\report\permit design report\permit_design_report.docx 4.14
around the facility perimeter. Currently, the setback distance (100 feet) shown herein has been assumed. The actual minimum distance will be determined during preparation of final construction drawings, in coordination with AEP and the gas utilities.
The development of Borrow Site 3 is also needed for the new spillway cut. On the south side of the new drainage channel, the geometry shown on the design drawings represents the required cut. On the north side, the minimum cut is shown but the contractor may propose to expand this cut farther to the north to generate additional borrow.
4.1.1 Material Needs
Based on the proposed grading, the required borrow quantities are estimated as follows:
• Soil Cover = 541,000 cubic yards
• Durable Rock Fill = small quantity in comparison to available (Section 4.1.2)
• Bulk Fill = 432,000 cubic yards
Quantities are presented in terms of “in-place, after-compaction” volumes. No adjustment or assumptions have been made regarding the volume of borrow material that would be required to produce these in-place, after-compaction volumes.
4.1.2 Available Materials
Based upon Stantec’s exploration and the historical data, the materials available onsite consist of clayey overburden soil, durable and nondurable sandstone, siltstone, shale, and claystone. Using the designed cut slopes shown on the drawings, volume calculations were performed using AutoCAD Civil3D 2009, and the available in-situ quantities of each material are presented in Table 5. The quantities provided are estimates based upon the limited subsurface data from Stantec’s test pits and the available historical exploration data. Subsurface conditions between borings and test pits are unknown.
Table 5. Estimated Borrow Site Materials
Borrow Site ESTIMATED AVAILABLE MATERIAL VOLUMES
Sandstone/Siltstone (cy)
Shale/Claystone (cy)
Clayey Soil (cy
Site 1 182,000 171,000 129,000 Site 2 173,000 8,500 55,000 Site 3 391,000 20,000 72,000 Site 4 248,000 89,000 71,000 Total 994,000 288,500 327,000

DESIGN BASIS REPORT
lb w:\1756\active\175661014\clerical\report\permit design report\permit_design_report.docx 4.15
The durable rock fill could consist of the relatively hard sandstone and siltstone encountered in the area. Bulk fill could consist of nondurable sandstone, siltstone, and shale, along with overburden soil unsuitable for the final cover and liner. Coal, if encountered during excavation, should be separated from the borrow material and not be used as fill for this site. The soil cover should consist of clayey overburden material, similar to that encountered during the test pit exploration conducted by Stantec.
Weaker claystone and clay shale strata could be processed until suitable for use as clay for the final cover and liner. Processing may include mechanically breaking down the rock and wetting the rock to accelerate the slaking process, until the material becomes soil-like and suitable for placement and compaction. This process has been successfully utilized at the Amos Plant in the past to construct the impervious zone of the fly ash dam, and is currently ongoing to generate clay material for construction of the Amos Flue Gas Desulfurization (FGD) landfill.
The level of effort necessary to excavate the borrow sites (e.g., mechanical excavation versus blasting) has not been quantified and is beyond the current scope of study. Similarly, the level of effort necessary to process certain rock strata into soil-like materials is beyond the current scope of study. Prospective contractors should evaluate these issues during the bidding process for this project. The rock excavation is discussed in more detail in Section 4.3.4.2, Rock Excavation, and in the specifications (Appendix B-3).
4.2 SETTLEMENT ANALYSIS
Consolidation analyses were performed to evaluate the total anticipated vertical settlement of the final cap. Total settlement is a function of the thickness and stress history of underlying ash and soil, additional load imposed by closure construction (new sluiced ash and final cap), and the assumed time period over which the new load is imposed. Multiple points along several profiles were evaluated and then compared in order to consider planned overbuild and potential areas of differential settlement. A plan view showing the selected alignments can be found in Appendix E-1.
The closure geometry and sequence is such that the most significant settlement will occur within the existing sluiced ash, due to the placement of new sluiced ash in the upstream portions of the pond footprint. Another area of larger settlements is near the existing principal spillway riser, where the pond is still deep and will require a large amount of fill during closure. The rate of consolidation has been considered herein to evaluate whether a waiting period can be incorporated to allow some percentage of this settlement to occur prior to construction of the final cap. After establishing a reasonable waiting period, the total anticipated settlement is then calculated. The grading design was then modified (i.e., overbuilt) to compensate for settlements, such that post-closure grades were within acceptable bounds.
4.2.1 Methodology and Assumptions
The settlement magnitude was calculated along the main project baseline at approximate 100-foot spacing and at 200- to 300-foot spacing along selected secondary alignments. A plan view

DESIGN BASIS REPORT
lb w:\1756\active\175661014\clerical\report\permit design report\permit_design_report.docx 4.16
showing the alignments is included in Appendix E-1. At each selected station, two components of settlement were estimated:
• Settlement due to Grading: caused by placement of fill (dredged ash or bulk fill) to achieve the subgrade elevation.
• Settlement due to Cap: caused by placement of the final soil cover to achieve final grade.
Settlement due to grading (dredge and fill) and due to cap (final soil cover) were calculated separately. The soil profile at each station was divided into separate horizons, consisting of residual soil, sluiced fly ash, dredged fly ash, and the final soil cover. Each soil horizon was assumed to be homogeneous, using the soil properties in Appendix E-1 estimated from the lab and field testing performed during the geotechnical exploration.
Several assumptions were made to simplify the analysis:
• All settlement is due to primary consolidation, which can be modeled assuming a one-dimensional soil profile.
• Existing sluiced ash is normally consolidated.
• Based upon the exploration findings, the sluiced fly ash and residual soil were assumed to be saturated. Further, the additional dredged fly ash is assumed to be saturated at the time of final cover placement.
• After dredging portions of the pond footprint, sufficient time passes to allow complete rebound of the existing sluiced ash prior to placing the cap. Therefore, the ash in the dredge area will be over consolidated at the beginning of cap placement.
• Post-construction settlement within the final cover is assumed to be negligible.
4.2.2 Time Rate of Consolidation In order to determine the total settlement magnitude at each station, it was assumed that the final soil cover would not be placed until 30 days after completion of ash grading. This is judged to be a reasonable assumption, given that the ash grading will take place over an extended period of time and that the conversion from dredging to final cover construction cannot occur instantaneously. In reality, consolidation due to placement of dredged fly ash will occur continuously as material is placed, not instantaneously as is assumed. Using the pore pressure dissipation tests performed as part of the CPT exploration on the site, estimated time to 50% consolidation (t50) values were calculated. As shown in the calculations in Appendix E-1, using lab data and published correlations, a coefficient of consolidation (cv)

DESIGN BASIS REPORT
lb w:\1756\active\175661014\clerical\report\permit design report\permit_design_report.docx 4.17
value was calculated for the fly ash. A cv value was also estimated for the residual soil based upon lab test results and published correlations for clayey soil. These values were used to estimate the percent of consolidation that will occur in the first 30 days. Any settlement occurring after those 30 days was added to the settlement caused by the final soil cover to determine the total settlement magnitude at each station. This 30-day waiting period reduced the settlement magnitude due to fly ash grading by 40 to 90 percent, thus reducing the total settlement by as much as 0.3 feet within the pond footprint.
4.2.3 Settlement Magnitude and Differential Settlement
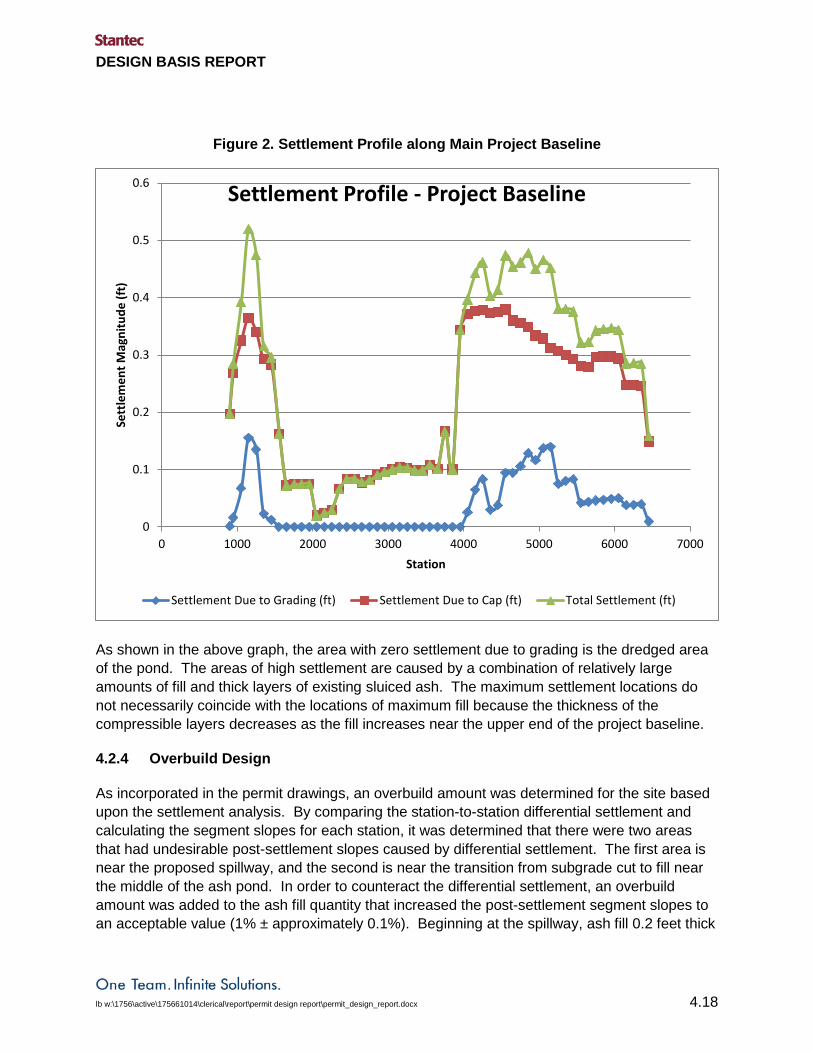
The general settlement profile for the baseline consists of a relatively large amount of settlement near the spillway, peaking at Station 111+50 with a magnitude of 0.52 feet, and decreasing to as low as 0.02 feet near Station 120+54. The region of higher settlement is where the pond is currently deep and requires significant filling, while the region of lower settlement corresponds to an area of dredging where the only settlement is due to placement of the 2-foot thick cover.
Towards the eastern (upper) end of the baseline, the calculated settlement increases again due to the amount of dredged ash fill. The maximum settlement calculated in this area is approximately 0.48 feet near Station 148+54. It was anticipated that the buried quarry bench (Stations 120+00 to 122+00 along the baseline) within the footprint of the pond would create substantial differential settlement. However, because of favorable grading in this region, the quarry bench is now almost completely in the dredging area and is not a major concern for differential settlement.
The settlement values calculated for the secondary alignments were found to be less than the maximum values along the main project baseline alignment. Shown below, and in Appendix E-1, is a plot of the settlement profile along the project baseline, assuming a 30-day wait period before placing the final soil cover.
DESIGN BASIS REPORT
lb w:\1756\active\175661014\clerical\report\permit design report\permit_design_report.docx 4.18
Figure 2. Settlement Profile along Main Project Baseline
As shown in the above graph, the area with zero settlement due to grading is the dredged area of the pond. The areas of high settlement are caused by a combination of relatively large amounts of fill and thick layers of existing sluiced ash. The maximum settlement locations do not necessarily coincide with the locations of maximum fill because the thickness of the compressible layers decreases as the fill increases near the upper end of the project baseline.
4.2.4 Overbuild Design
As incorporated in the permit drawings, an overbuild amount was determined for the site based upon the settlement analysis. By comparing the station-to-station differential settlement and calculating the segment slopes for each station, it was determined that there were two areas that had undesirable post-settlement slopes caused by differential settlement. The first area is near the proposed spillway, and the second is near the transition from subgrade cut to fill near the middle of the ash pond. In order to counteract the differential settlement, an overbuild amount was added to the ash fill quantity that increased the post-settlement segment slopes to an acceptable value (1% ± approximately 0.1%). Beginning at the spillway, ash fill 0.2 feet thick
0
0.1
0.2
0.3
0.4
0.5
0.6
0 1000 2000 3000 4000 5000 6000 7000
Sett
lem
ent M
agni
tude
(ft)
Station
Settlement Profile - Project Baseline
Settlement Due to Grading (ft) Settlement Due to Cap (ft) Total Settlement (ft)

DESIGN BASIS REPORT
lb w:\1756\active\175661014\clerical\report\permit design report\permit_design_report.docx 4.19
was added and carried along the alignment until Station 139+54, after which an additional 0.4 feet of ash fill was added.
The secondary alignments did not show significant differential settlement, thus they did not require additional overbuild beyond that necessary to match up at the confluence with the overbuilt primary alignment.
4.3 POST-CLOSURE STABILITY
Stability analyses were performed at several locations of the impoundment to determine the stability of the closure design. Several scenarios were analyzed for the various cross-sections, including short-term, long-term, and seismic stability.
4.3.1 Design Criteria and Methodology
Consistent with engineering practice and governing dam safety regulations (State of West Virginia, 2009), the target factors of safety for short-term (i.e., during construction and end of construction) slope stability are as follows:
• Drained Stability (FSd) FSd ≥ 1.5
• Undrained Stability (FSu) FSu ≥ 1.3 (per §47-34-7.4.b.1.D.1(b))
The following factors of safety against static slope stability will be maintained in the long term, following project completion:
• Drained Stability (FSd) FSd ≥ 1.5 (per §47-34-7.4.b.1.D.1(a))
• Veneer Sliding (FSv) FSv ≥ 1.1
• Dynamic Stability (FSEQ) FSEQ ≥ 1.2 (per §47-34-7.4.b.1.D.1(d))
• Post-Earthquake Static Stability (FSPOST-EQ) FSPOST-EQ ≥ 1.0
The material properties used in the analyses were derived from lab and field testing performed during the geotechnical exploration, historical data from the site, and correlated values with published data when necessary. Refer to summary tables in Appendix E-2 for material properties.
The strength values for the residual soil were based upon strength values given in Acres American Incorporated (1974) dam raising report and other historical information for the clay in the area. For the final soil cover, a similar value was used based upon the type of soil recovered during the excavation of the test pits. The material consisted of stiff to very stiff sandy clay and clayey sand.

DESIGN BASIS REPORT
lb w:\1756\active\175661014\clerical\report\permit design report\permit_design_report.docx 4.20
As described in Stantec (2012d), several triaxial tests were performed on the sluiced fly ash. From the consolidated-undrained (CU) tests, it was shown that, under the range of pressures that the samples were tested, the material has higher undrained strength than drained strength, which can only occur if negative pore pressures are generated and lead to additional strength via suction pressures. Typically, sluiced ash is assumed to be deposited in such a loose state that it will contract upon shearing, even at low confining pressures. However, most of the CU triaxial test results show that the sluiced ash demonstrates classic dilative behavior, illustrated by the shape of the stress path and the pore pressure response. The pore pressure response is particularly indicative of dilation during shear, in which negative pore pressures are generated as the sample attempts to expand.
Stress-strain behavior is also generally dilative, indicated by a lack of significant post-peak drop in strength. However, as confining pressures increase, the behavior of this same material should change to contractive. In a small number of tests at the highest confining pressures (representative of the ash near the bottom of the deepest portions of the pond), this transition can be seen in terms of slightly positive pore pressures during shearing.
During design, the increase in undrained shear strength due to negative pore pressures is often neglected, because such suction pressures cannot be sustained. This may be particularly true for the relatively pervious sluiced ash, which will dissipate excess pore pressures rather quickly during and after shearing. In such cases, it is common to assume that the lower drained strength will control design during otherwise undrained loading scenarios. Because of this, the material exhibits higher undrained strengths than drained strengths. Therefore, the drained friction angle was used in the analyses for both short and long-term stability.
A copy of Stantec (2012d) is included in Appendix D-1.
4.3.2 Dam Stability
The existing fly ash deposits along the upstream face of the dam will be regraded and capped for closure. In general, a modest amount of additional fill (sluiced ash and cover materials) will be placed against the dam near the left (south) abutment, while existing fill (sluiced ash) will be removed moving towards the right (north) abutment. The removed thickness will increase moving towards the right abutment in the direction of the new spillway cut. The most significant change to the loading on the dam might be the removal of the permanent pool from the upstream side and the resulting decrease in pore water pressures in the embankment.
Based on previous reports and the known regulatory requirements, the existing dam is assumed to meet all necessary stability criteria for short-term and long-term load scenarios for the range of conditions that existed during construction and operation of the fly ash pond. To demonstrate (graphically) how the closure geometry interacts with that of the dam and to show that stability criteria are met for long-term conditions, two cross sections were evaluated using drained strength parameters and steady-state (post-closure) conditions. Two ash elevations were used, the highest (Elevation 861.8 feet) and lowest (Elevation 838.7 feet) proposed ash fill heights behind the dam. Material properties for the dam were derived from historical data (Acres

DESIGN BASIS REPORT
lb w:\1756\active\175661014\clerical\report\permit design report\permit_design_report.docx 4.21
American Incorporated, 1974, 1975a; H.C. Nutting 2008) and published correlations. The piezometric line was estimated to be at the fly ash-soil cover interface and then travel through the dam to the drainage layer to the toe of the dam. The results of the long-term, drained analyses are shown in Table 6.
Table 6. Global Slope Stability Results, Existing Dam after Closure
Scenario Calculated Factor of
Safety Minimum Target Factor of Safety
High Ash Elevation, Downstream Face 1.65 1.5 High Ash Elevation, Upstream Face 1.60 1.5
Low Ash Elevation, Downstream Face 2.03 1.5 Low Ash Elevation, Upstream Face 1.51 1.5
4.3.3 Closed Impoundment
Three cross sections, shown in planview in Appendix E-2, were chosen within the closed pond footprint to evaluate for global slope stability. The sections were chosen because they were either long continuous slopes or steeper slopes. Each section was evaluated under three scenarios: short term, long term, and dynamic.
The dynamic scenario applied a 0.022g horizontal seismic coefficient (kh) to the section and was evaluated under undrained conditions. For the dynamic case, the static, undrained shear strengths of each material were reduced by 20 percent to account for a modest loss of strength due to generation of excess pore water pressure. The horizontal seismic coefficient was selected as 50 percent of the peak ground acceleration on rock (PGArock) for the design earthquake. The use of 50 percent of PGArock is based on research from the U.S. Army Corps of Engineers (USACE) regarding seismic stability of embankments (Hynes-Griffin and Franklin 1984). They conclude that permanent deformations will be tolerable if a slope stability analysis shows at least marginal stability (factor of safety greater than or equal to 1) using kh and reduced strengths as outlined above.
The depth of the failure surface was not restricted; therefore, the failure surface generally extended to the residual soil or to the estimated top of bedrock. A summary of the results are presented in Table 7, and a graphical representation of the analyses and summary of material parameters can be found in Appendix E-2. Because no liquefaction is anticipated (Section 4.4), the post-earthquake case would utilize the same strengths as the dynamic case, but with no horizontal seismic coefficient (kh=0). Thus, no additional analysis is needed to show that this case exceeds the minimum target factor of safety.

DESIGN BASIS REPORT
lb w:\1756\active\175661014\clerical\report\permit design report\permit_design_report.docx 4.22
Table 7. Global Slope Stability Results, Closed Impoundment
Cross-Section
Factor of Safety
Long-Term, Drained Conditions
Short-Term, Undrained Conditions
Long-Term, Undrained Conditions, Dynamic Loading (kh=0.022g)
Minimum Target FS 1.5 1.3 1.2 Cross-Section 1 7.92 12.07 5.54 Cross-Section 2 11.13 7.52 2.86 Cross-Section 3 10.70 7.78 2.99
Veneer stability is often highly dependent on the interface shear strength between specific components of the cover layer. An additional analysis was performed to determine if sufficient shear strength was provided within the soil cover and between its interface with the fly ash fill. As shown in Appendix E-3, the veneer stability spreadsheet was used to analyze two sections: one with the longest straight-line continuous slope and another with the steepest final grade slope. Each section was analyzed under drained, saturated, seismic, and static residual stability conditions. The relevant material properties used in the analyses were the same as those used in the global stability calculations.
For the seismic veneer stabilizing case, the results of ground response analyses (Section 4.4.2.2) were used to estimate the ground surface accelerations at the top of the soil cover. The range of ground surface accelerations was found to be between 0.05g and 0.1g. Therefore, a value of 0.1g was used in the veneer stability analyses. The spreadsheet calculates the factor of safety against sliding for a range of interface friction angles for each scenario. Results and plots of the minimal necessary strength “envelopes” (combinations of friction angle and adhesion) and are included in Appendix E-3, as are derivations of the veneer stability equations. From this spreadsheet, due in large part to the gentle slopes of the final surface, it is determined that stability of the closed facility under the conditions analyzed is acceptable.
4.3.4 Spillway Cut and Borrow Sites
Because construction of the spillway cut and borrow sites will require rock excavations that are to become permanent site features, the slopes must be designed to meet appropriate criteria. Also, because blasting is likely near site features that need to be protected, a discussion is included on how such work can be governed and monitored during construction.
4.3.4.1 Rock Slope Design
Rock slopes have been designed for the four potential borrow sites at the project. Borrow Sites 1, 2, and 4 (refer to the permit drawings for a plan view and profiles of all borrow sites) may be developed to varying degrees, at the contractor’s discretion. Slopes shown for these borrow sites represent the greatest extent that the contractor could elect to develop; that is, they represent the steepest slopes that could remain and the greatest lateral extent of development

DESIGN BASIS REPORT
lb w:\1756\active\175661014\clerical\report\permit design report\permit_design_report.docx 4.23
(often constrained by a buffer zone away from gas lines around the facility perimeter). As part of developing efficient means and methods to construct the project, the contractor may choose not to develop certain borrow sites or to only partially develop certain sites.
The development of Borrow Site 3, near the existing emergency spillway cut, is required to allow the main drainage channel to exit the pond footprint. The cut slope geometry also incorporates a road that was requested by AEP to allow access to monitoring wells and gas lines. The southern side of this “new spillway cut” must be built as shown on the drawings, while the northern side represents a minimum required cut. The contractor could propose expanding this cut to the north (within limits dictated by gas lines farther to the north) to generate more borrow material from this site. Such a modification could be considered by AEP and the design engineer during construction through a submittal by the contractor for an alternate geometry.
The design of proposed rock cut slopes was performed in accordance with guidance from the West Virginia Department of Transportation (WVDOT), Division of Highways. The design directive is entitled “DD-403, Guide for Design in Cut Sections through Bedrock” (WVDOT 2006). Although this guidance is not mandatory for this type of project, it was judged to be an appropriate resource to serve as a design basis for rock slopes at the project. The guidance attempts to balance construction costs (i.e., minimizing the amount of excavation) with long-term maintenance (i.e., minimizing cleanup costs related to rockfalls). It is also written to allow a certain degree of flexibility to account for unique site geology, geometric, and/or construction issues.
WVDOT provides design guidance based on four bedrock types. The four types are not based purely on geology, instead they are based on slope angles that are considered appropriate based on experience and historical performance. The types are described in general terms (see Table 8) by geology, unconfined compressive strength (UCS), and slake durability index (SDI). Based on the rock type, guidance is then provided regarding maximum slope, bench width, and backslope height. Guidance is also provided regarding slopes in the overburden zone.

DESIGN BASIS REPORT
lb w:\1756\active\175661014\clerical\report\permit design report\permit_design_report.docx 4.24
Table 8. WVDOT Rock Types for Cut Slope Design (WVDOT, 2006)
Rock Category
Typical Maximum
Slope Typical Geology UCS
(psi) SDI (for
shales) Other Remarks
Type 1 1/6H:1V Hard and medium-hard
limestone and sandstone, hard shale
8,000+ 95+ N/A
Type 2 1/2H:1V
Soft limestones and sandstones, medium-hard
shale and siltstone or interbedded combinations
4,000-8,000 51-94 N/A
Type 3 3/4H:1V Soft shale interbedded with
siltstone, sandstone, or limestone
1,000-4,000 0-50
Without the interbedded
materials, these shales would be
Type 4. Type 4 1H:1V Soft and very soft shale 1,000 0-50 N/A
At Borrow Sites 1, 2, and 4, rock coring was not within the scope of Stantec’s geotechnical exploration. However, historical borings and/or geologic profiles provided by AEP were available for Sites 1 and 4, and monitoring well logs were available for the lower portion of rock within Site 2. No UCS or SDI data were available for Sites 1, 2, or 4, and limited information was recorded on the boring logs regarding rock quality (e.g., percent core recovery, rock quality designation (RQD)). Generally, the rock at these sites consisted of layers of clay shale upwards of 20 feet thick and layers of interbedded siltstone, sandstone, and clay shale approaching 30 feet thick. Due to the presence of the clay shale and the limited degree of available data, these materials were classified as Type 4. Based on the range of allowable parameters for Type 4 rock, the design includes 3H:1V slopes in soft, erodible soils and 1H:1V slopes in competent rock with a 10-foot bench width.
At Borrow Site 3, Stantec performed 4 borings that included soil sampling and rock coring. The field engineer photographed the rock core and recorded the percent recovery and RQD. Stantec performed UCS and SDI testing on the predominant strata encountered in the borings. In addition, AEP provided several historical borings and a geologic profile in the vicinity of Site 3. The rock at these sites consisted of layers of interbedded shale and sandstone upwards of 30 feet thick, claystone up to 5 feet thick, shale up to 9 feet thick, and sandstone up to 30 feet thick. The sandstone was classified as Type 2, while all other materials were classified as Type 4. Based on the range of allowable parameters for Type 2 rock, the design included 1H:1V slopes (the allowable 1/2H:1V slopes were not necessary). No benches were required within the sandstone, due to the limited height exposed. For the Type 4 rock, the design includes 1H:1V slopes and 10-foot bench widths for the competent rock with 2H:1V slopes in the soft, erodible soils.

DESIGN BASIS REPORT
lb w:\1756\active\175661014\clerical\report\permit design report\permit_design_report.docx 4.25
For comparison, historical drawings show that the existing rock slopes in the emergency spillway are 1H:1V in strata similar to that expected at the four borrow sites. Recent observations of these cut slopes show that the slopes are in good condition, and plant personnel reported little need for maintenance with regard to rockfall.
It should be noted that the designs described herein and depicted on the drawings are approximate and are based on geologic information from limited subsurface information, laboratory testing, and historical records. Boring logs and related information depict approximate subsurface conditions at discrete locations and at the time of drilling. Conditions at other locations may differ from those at the boring locations. Also, the passage of time may result in a change in the subsurface conditions at any boring location. Actual conditions between borings are unknown and may differ from those shown. Benches that are positioned at specific elevations on the drawings are often based upon encountering certain weaker strata. During construction, if weaker strata are found at different locations (vertically and/or laterally), the slope design may need to be adjusted to suit actual field conditions. If AEP or the contractor proposes alternate rock slope geometry during construction based on actual field conditions, the design engineer should be engaged to evaluate the proposed changes.
4.3.4.2 Rock Excavation
Rock excavation will be required to construct the cut near the existing emergency spillway, where the new drainage channel will exit the pond footprint. In addition, the contractor may elect to develop one or more of the other designated borrow sites to generate additional material for use as fill. It is likely that rock excavation will be performed using blasting; therefore, to protect structures of interest both on- and off-site, it will be important for AEP to control this work through appropriate construction specifications.
Protection of nearby dwellings, buildings, utilities, or other sensitive structures is typically regulated by establishing certain controls on the blasting, coupled with monitoring to verify compliance. Three phenomena that can damage nearby structures are ground vibration, air-overpressure (airblast), and flyrock. Specification CE-04A Rock Blasting provided in Appendix B-3 defines project requirements for blasting including procedures to minimize impacts from these hazards.
4.3.5 Stability During Construction
4.3.5.1 Concept
During construction, temporary slopes will be generated during the excavation (dredging) and filling processes. Due to the nature of the dredging process, it is assumed that slopes of significant grade will be temporary and below water level. Similarly, due to the nature of the sluicing and sedimentation process, it is assumed that no fill slopes of significant grade will be created. The existing dam is assumed to remain stable during construction, as it is not being modified by the closure, other than removing some sluiced ash along a portion of the upstream face.

DESIGN BASIS REPORT
lb w:\1756\active\175661014\clerical\report\permit design report\permit_design_report.docx 4.26
However, the rate of decrease in the pond elevation must be properly regulated to avoid a slope failure (due to rapid drawdown) along the upstream face of the dam. The primary items of concern for interim stability during construction are the dredge containment dikes that will be constructed in upstream areas to impound the sluiced material as it is deposited. These containment dikes have flexibility in the design based on the materials available and the construction elevation height needs. The dikes have been designed using a 30-foot minimum crest width, 4 horizontal to 1 vertical (4:1) sideslopes, and a maximum height of 24 feet. They have slope protection along the sideslopes and a graded stone surface for an access road along the crest. To address seepage and piping concerns during initial analyses, a chimney drain, blanket drain, and a seepage blanket have been designed. It will be the contractor’s responsibility to establish a stable subgrade for construction of the dike. Target factors of safety for short-term (i.e., during construction and end of construction) slope stability are as shown in Section 4.3.1. The potential for piping was evaluated because upward seepage toward the ground surface is anticipated during dredging activities. The toe of the dredge containment dike was evaluated in areas of high upward gradient and within a few feet of the phreatic surface near the embankment toe. For this design, we used the factor of safety against piping (FSpiping) as defined by the U. S. Army Corps of Engineers (USACE) for the design and assessment of dams (USACE, 1993). The current USACE design criteria (EM 1110-2-1901) generally requires:
• Downstream toe of dam FSpiping ≥3.0
• Toe of a downstream seepage berm FSpiping ≥1.5 The material properties used in the seepage and stability analyses were derived from the lab and field testing performed during the geotechnical exploration, historical data from the site, and correlated values with published data when necessary. Material properties used for these analyses are summarized in Appendix E-4.
4.3.5.2 Dike Design
The dimensions and construction of the design dredge dike are shown on the details of the design drawings. The models use a 30-foot crest width, 4H:1V sideslopes, and a 25-foot dike height. The 25-foot height exceeds the maximum allowable height and provides for another factor of safety in the analysis. Slope protection is modeled along the dike crest and slopes to protect against erosion. Material parameters were based upon laboratory testing data (Stantec, 2012d) and historical design shear strengths (H. C. Nutting, 2008; Acres American Incorporated, 1974). The embankment model assumes compacted fly ash composes the embankment. The slope protection and seepage blanket were modeled using the random rock fill properties from Acres American Incorporated (1974). This should be representative of the durable rock available from the proposed borrow sites for this project. For the chimney and blanket drains, a filter design was performed to determine an appropriate drainage material within the fly ash dike. AASHTO

DESIGN BASIS REPORT
lb w:\1756\active\175661014\clerical\report\permit design report\permit_design_report.docx 4.27
Type A sand was selected for the design. Alternative filter materials might be available for construction activities and should be checked against the design requirements. Sluiced and compacted fly ash material parameters were based upon laboratory testing of Shelby tubes taken during Stantec’s 2012 field exploration. Dredged fly ash properties were assumed to be similar to the sluiced ash results with the exception of the selected anisotropy ratio. For purposes of stability analysis, it was assumed that the compacted fly ash dikes will be constructed directly on the existing sluiced fly ash surface of the pond. No foundation improvements, bridging layers, or geosynthetic reinforcement were modeled, although the contractor should consider constructability issues related to localized soft zones on the ash surface. The phreatic surface was defined using a seepage model (analyzed using GeoStudio 2007 SEEP/W). Boundary conditions for the seepage model were based on the spillway designs of the dredge dikes. The design storm event allows a short-term, one-foot freeboard upstream of the dredge dike. The model was run assuming dredged ash at the principal spillway elevation with the design storm event raising the pool level to a one-foot freeboard upstream of the dike. A second model was run assuming no dredged ash is present and water has risen upstream to a one-foot freeboard. The chimney drain was designed at approximately half of the dredge dike height, in line with the downstream edge of the dike crest. It is modeled at a thickness of three feet. The seepage blanket extends 18 feet beyond the downstream toe of the dredge dike. It is three feet thick with a 3H:1V downstream toe.
4.3.5.3 Results
The laboratory test results for the consolidated undrained (CU) triaxial testing suggests that drained strength within the sluiced ash controls over the undrained strength properties due to the fly ash’s dilative nature at low confining pressures. The stability analyses were run using the selected drained strengths as a more conservative estimate of slope stability. In reality, excess pore water pressures are created during sluiced ash placement and dike construction; however, it will begin to dissipate immediately. It is unclear how quickly the fly ash transitions from undrained to drained behavior. Stability cross sections, material parameters, and results are shown in Appendix E-4. Results are also summarized in the following table (Table 9). The runs all assume a 25-foot tall dike constructed of compacted fly ash with a chimney drain, seepage blanket, and stone slope protection.

DESIGN BASIS REPORT
lb w:\1756\active\175661014\clerical\report\permit design report\permit_design_report.docx 4.28
Table 9. Design Slope Stability Results – Dredge Containment Dike
Stability Case (Short-Term Conditions)
Calculated Factor of Safety
(1.3 target)
FSpiping Dike Toe
(3.0 target) Blanket Toe (1.5 target)
Downstream (ash impounded, with storm event) 2.1 3.8 1.5 Downstream (water only impounded) 3.2 3.5 1.5 Upstream (water only impounded) 2.0
The results show that the assumed dimensions and materials for the dredge containment dikes are capable of meeting target factors of safety for stability and seepage. It is possible that a greater number of shorter dikes, or dikes raised in multiple stages, may be preferred by the contractor due to constructability concerns and/or operational and sequencing issues. The above analyses for the more conservative cases demonstrate that properly designed shorter dikes should also be capable of meeting stability criteria. It is recommended that appropriate construction observation methods be employed to monitor actual performance of the dike and foundation materials during loading. The rate of fill placement, development of excess pore water pressures (using piezometers), and potential slope deformations (using survey markers or inclinometers) should be monitored and analyzed throughout construction. Refer to Section 4.5 regarding recommended instrumentation during construction.
4.4 LIQUEFACTION POTENTIAL
4.4.1 Seismic Liquefaction
Because sluiced fly ash is typically a saturated, loose, cohesionless material, it is susceptible to liquefaction if subjected to a sufficiently large earthquake. Strength loss due to liquefaction can lead to settlement and/or slope deformations, depending on material parameters and site geometry. The NCEER method compares the liquefaction resistance of a soil, expressed in terms of a cyclic resistance ratio (CRR), to the cyclic stress ratio (CSR) induced by the design earthquake. Both the CRR and CSR represent a shear stress normalized with respect to the vertical effective stress in the soil. The factor of safety against liquefaction (FSliq) is computed by taking the ratio of CRR and CSR:
CSRCRRFSliq =
Seismic loads were estimated using the site-specific design earthquake ground motions and a site-specific ground response analysis (using ProShake software). Liquefaction resistance was estimated based on laboratory data (cyclic triaxial testing) for fly ash from the Amos Plant.

DESIGN BASIS REPORT
lb w:\1756\active\175661014\clerical\report\permit design report\permit_design_report.docx 4.29
4.4.2 Site-Specific Seismic Study
4.4.2.1 Definition of Design Seismic Event
The design earthquake event has been defined probabilistically on the basis of a site-specific seismic hazards study. The legislative rule (refer to Department of Environmental Protection, Water Resources, Dam Safety Rule, §47-34-7.4.b.1.D.1(d)) does not specify an appropriate design earthquake recurrence interval (i.e., return period). Consistent with engineering practice and AEP direction, the design earthquake event corresponds to a 2% probability of exceedance in 50 years (recurrence interval = 2,475 years).
4.4.2.2 Site-Specific Design Seismic Events and Ground Motions
Stantec coordinated with its seismology subconsultant, Pacific Engineering and Analysis (Pacific), to perform site-specific seismic study and develop the design seismic events and associated ground motions (i.e., time histories). Pacific’s report (Pacific Engineering and Analysis, 2011), which describes their methodology and results, is provided as an appendix in our Geotechnical Data Report (2012d). Stantec (2012d) is included in Appendix D.
Uniform hazard spectra (UHS) were developed using probabilistic methods. Dominant individual design events were then selected by deaggregating the hazard and identifying primary contributors in terms of magnitude and epicentral distance. Two design earthquake scenarios were identified for development of ground motion time histories. The first scenario is a M5.5 event relatively close to the project site (epicentral distance in the range of 10-50 km). The second scenario is a M7.5 event at a greater distance from the project site (epicentral distance in the range of 75-200 km). Pacific used deterministic methods to derive design spectra and ground motion parameters that are consistent with both the UHS and the two design event scenarios. Key ground motion parameters for the design events used in this study are summarized in Table 10.
The design event acceleration time histories represent the expected subsurface ground motions at the top of bedrock and not a free-surface or outcrop motion. Stantec supplied Pacific with basic geologic parameters for the site, such as soil type, rock type, approximate depth to bedrock (“soft rock”), and depth to “hard rock” (the fundamental seismic hazard model for central and eastern United States assumes “hard rock” geology). Pacific estimated a range of reasonable shear wave velocities for overburden (i.e., alluvium) and soft rock and estimated average unit weights for the overburden and soft rock. These parameters were based on existing site information and regional geologic information, some of which was supplied by AEP. The design ground motions, which were derived from historic acceleration records, were spectrally matched to the deterministic design spectra, in accordance with the standard of practice. The peak acceleration and duration of shaking at the top of bedrock for each earthquake scenario is listed in Table 10. Note that, while the peak horizontal accelerations for the two scenarios are rather similar, the duration of the larger magnitude event is significantly greater than that of the smaller magnitude event.

DESIGN BASIS REPORT
lb w:\1756\active\175661014\clerical\report\permit design report\permit_design_report.docx 4.30
Table 10. Bedrock Ground Motion Parameters for Seismic Evaluation of AEP Amos Fly Ash Pond Closure1
Parameter Scenario 1 Scenario 2 Moment Magnitude (Mw) 5.5 7.5
Peak Horizontal Acceleration 0.043 g 0.034 g Time History Duration (5 to 75%) – Horizontal
Component of Motion Approx. 3-4 sec Approx. 21 sec
Time History Duration (5 to 95%) – Horizontal Component of Motion
Approx. 7-8 sec Approx. 26-27 sec
1Parameters shown are at top of soft rock/base of soil.
4.4.3 Cyclic Triaxial Testing
AEP provided results from cyclic triaxial testing that was performed on fly ash from Amos at The Ohio State University (OSU) (OSU, 2012). As part of our Supplemental Scope of Work, Stantec collaborated with the University of Kentucky to perform additional cyclic triaxial tests on Amos fly ash (Stantec, 2012e).
4.4.3.1 The Ohio State University Data
AEP provided Stantec the report prepared by OSU for the fly ash liquefaction potential at Amos Fossil Plant (OSU, 2012). OSU prepared 10 specimens from the Amos fly ash by pluviating the material in water to a range of initial densities. The specimens were then tested at confining stresses ranging from 10 to 40 pounds per square inch (psi) and cyclic stress ratios (CSR) ranging from 0.1 to 0.4 as shown in Table 11. After testing, OSU reviewed the data and number of cycles to liquefaction (Nliq) was determined as the first occurrence of either:
• Axial stress reported was less than 95% of the programmed loading, or • Effective confining stress reached a minimum value of zero (i.e., ru=1) (OSU, 2012).
Table 11. Ohio State University – Cyclic Triaxial Laboratory Data for Amos Fly Ash
Test No. CSR Confining Stress
(psi) Dry Density (pcf) Cycles to
Liquefaction (Nliq) 1 0.1 20 101.1 5001 2 0.2 20 97.6 9 3 0.3 20 94.9 3 4 0.4 20 94.1 2 5 0.1 20 96.9 5001 6 0.2 20 100.4 8 7 0.3 20 97.0 3 8 0.3 10 101.0 7 9 0.2 10 111.0 76
10 0.3 40 102.1 6 1 Samples that did not liquefy were tested for 500 cycles before ending the test.

DESIGN BASIS REPORT
lb w:\1756\active\175661014\clerical\report\permit design report\permit_design_report.docx 4.31
Figure presents the number of cycles required for each sample to liquefy using the above liquefaction criteria. Typically, it is expected that the number of cycles of liquefaction increases as the confining pressure increases (all else equal). However, data would indicate that the samples tested at 10 psi are more resistant to liquefaction than those tested at 20 psi and 40 psi. This could be correct if samples at 10 psi are dilative while samples at 20 psi and 40 psi are more contractive. The results for the 20 psi generally provide a lower bound for the available data. Figure 3. Results from the OSU Cyclic Triaxial Testing for the Amos Fly Ash Specimens
4.4.3.2 University of Kentucky Data
To supplement the OSU data, Stantec and the University of Kentucky (UK) performed two additional cyclic triaxial tests on the Amos fly ash, as documented in our Supplemental Geotechnical Data Report (Stantec, 2012e). UK prepared two specimens from the Amos fly ash by pluviating the material in water to a range of initial densities. UK tested the samples with CSR values of 0.135 and 0.269, and both samples had a 20-psi confining pressure applied. Using the same definition of liquefaction as OSU, Stantec estimated the number of cycles to liquefaction for the UK data as shown in Table . The number of cycles to liquefaction of Test No. 1 was governed by the axial stress criteria, while Test No. 2 was governed by the excess pore pressure ratio criteria.
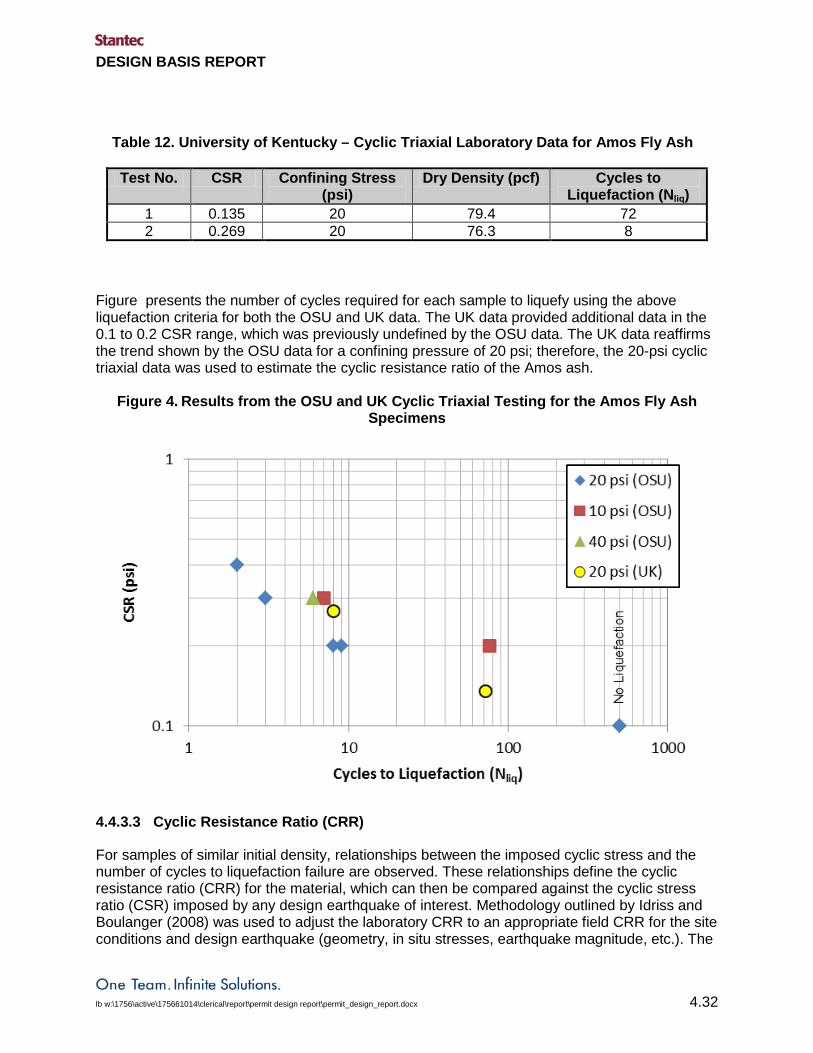
DESIGN BASIS REPORT
lb w:\1756\active\175661014\clerical\report\permit design report\permit_design_report.docx 4.32
Table 12. University of Kentucky – Cyclic Triaxial Laboratory Data for Amos Fly Ash
Test No. CSR Confining Stress (psi)
Dry Density (pcf) Cycles to Liquefaction (Nliq)
1 0.135 20 79.4 72 2 0.269 20 76.3 8
Figure presents the number of cycles required for each sample to liquefy using the above liquefaction criteria for both the OSU and UK data. The UK data provided additional data in the 0.1 to 0.2 CSR range, which was previously undefined by the OSU data. The UK data reaffirms the trend shown by the OSU data for a confining pressure of 20 psi; therefore, the 20-psi cyclic triaxial data was used to estimate the cyclic resistance ratio of the Amos ash.
Figure 4. Results from the OSU and UK Cyclic Triaxial Testing for the Amos Fly Ash Specimens
4.4.3.3 Cyclic Resistance Ratio (CRR)
For samples of similar initial density, relationships between the imposed cyclic stress and the number of cycles to liquefaction failure are observed. These relationships define the cyclic resistance ratio (CRR) for the material, which can then be compared against the cyclic stress ratio (CSR) imposed by any design earthquake of interest. Methodology outlined by Idriss and Boulanger (2008) was used to adjust the laboratory CRR to an appropriate field CRR for the site conditions and design earthquake (geometry, in situ stresses, earthquake magnitude, etc.). The

DESIGN BASIS REPORT
lb w:\1756\active\175661014\clerical\report\permit design report\permit_design_report.docx 4.33
primary benefit of this approach is the use of site-specific materials and development of a CRR relationship for the specific material. This is particularly relevant for fly ash, as many of the published relationships and correlations are based on testing of sands and may not be as appropriate for fly ash. The primary drawback of such a method is that fly ash samples must be reconstituted in the lab and may not be representative of the undisturbed, in-situ materials. The approach used site-specific ground response analysis to estimate the load (CSR) imposed by the design earthquake. Because the cyclic triaxial results are not specific to a particular location within the fly ash pond, three generic soil columns were derived for the site and were used in a ground response analysis and to estimate the CSR. Shear wave velocities for the sluiced ash were based on CPT testing performed during the geotechnical exploration, while shear wave velocities for other soils were estimated based on published correlations that are typically related to effective stress and soil type. The methodologies outlined above, along with the results, are summarized in a series of example calculations in Appendix E. Both the M7.5 and M5.5 earthquakes were evaluated. Considering the CRR derived from laboratory testing of Amos fly ash, the M7.5 event controlled for all three generic profiles. The larger magnitude event controlled because its longer duration (more cycles of shaking) results in a lower CRR compared to the shorter duration, smaller magnitude event. The CSR for the M7.5 event was higher than that of the M5.5 event for two of the three profiles, but the greater difference in CRR was such that the resulting factor of safety (FSliq) was lower for the M7.5 event for all three profiles. For both events and all three profiles, FSliq was shown to be above the typical threshold value of 1.4 (values less than 1.1 indicate fully liquefied conditions, while values of 1.1 to 1.4 are partially liquefied), meaning that no liquefaction would be anticipated. 4.4.3.4 Static Liquefaction Static liquefaction is a phenomenon that can occur when a soil experiences significant strain softening (i.e., strength loss beyond the peak strength) due to static loading or creep, often resulting in a flow failure. Contractive soils, which can include hydraulic fill (including some types of sluiced fly ash), can be particularly susceptible to static liquefaction during undrained shearing. The potential for static liquefaction is related to two key material parameters: (1) the strain level at peak strength and (2) the decrease in strength from peak to residual (often expressed as a sensitivity ratio) as strain increases. If peak strength is realized at very small strains, there exists a greater probability that static loads and/or creep could surpass the peak. If the material is highly sensitive, yet a slope or facility was designed based on peak strength, there exists a greater probability that any exceedance of the peak strain will lead to a flow failure. Laboratory results (15 consolidated-undrained triaxial tests) of Amos fly ash indicate that in general, the material behavior is dilative or near a transition from dilative to slightly contractive (see Appendix E). Dilative behavior is typically observed at lower confining pressures and a transition towards slightly contractive behavior is observed at higher confining pressures, as would be expected. Dilative materials do not exhibit distinct peak strength in undrained shear, as the strength continues to climb as the specimen attempts to dilate. It should be noted that several of the laboratory specimens showed signs of air bubbles in the testing apparatus used to measure pore water pressure. This is indicated by non-responsive pore water pressure

DESIGN BASIS REPORT
lb w:\1756\active\175661014\clerical\report\permit design report\permit_design_report.docx 4.34
readings as the values become more negative during shear. The impact on the data is that the deviator stress does not continue to go upward as it should if the negative pore water pressures could be correctly measured. This could lead to underestimating the undrained shear strength of such dilative materials. To account for static liquefaction potential during design, two approaches could be used: (1) avoid undrained loading scenarios that could mobilize the peak strength/strain or (2) design based on residual strengths. For weak, contractive materials, it is typically not feasible to design based on residual strengths. Therefore, the preferred approach is to design with adequate safety margins for undrained conditions, to avoid approaching the peak strength/strain. Meeting the regulatory defined minimum factors of safety for short-term, undrained conditions is only a first step in this process. The current design considers the stress-strain behavior and sensitivity of the sluiced fly ash. Because the Amos fly ash is judged to be dilative, and thus stronger when sheared in undrained conditions, the design is actually based on the lower, drained strengths. Further, the dilative behavior makes it unlikely that a flow failure due to static liquefaction would occur (i.e., no significant strain softening). The gentle slopes of the proposed closure provide ample safety margins, given the drained and undrained strength of the fly ash. The more critical case is the undrained loading of the ash due to the temporary dredge containment dikes, which have somewhat steeper side slopes and thus lower safety factors. Because the dikes will be relatively short, the areas of concern within the foundation would be relatively shallow. Shallow areas correspond to low confining pressures; thus, dilative behavior would be more likely. Regardless, construction observation and instrumentation should be used during construction (Section 4.5) to check for signs of elevated pore pressures and/or slope movement that could lead to an undrained failure.
4.5 INSTRUMENTATION
During construction, the use of field instrumentation is recommended to monitor actual conditions and compare with those assumed during design. Post-closure monitoring using instrumentation is also recommended to monitor long-term performance of the facility and to meet any regulatory permitting requirements. A detailed discussion of the instruments and proposed locations can be found in the following sections.
The construction instrumentation and monitoring program recommended below is a baseline for the initial dredge containment dike(s) constructed during the project. However, it is likely that the Contractor’s approach, including construction methods and their operation of the dredge containment cells will influence how the monitoring program can be best utilized. The instrumentation and monitoring program for subsequent dikes should be reviewed and potentially adapted based on analysis of data and observed performance of the initial dikes.
4.5.1 Piezometers
The primary geotechnical issue during construction is the stability of temporary/interim dredge containment dikes. With respect to both slope stability and piping failure modes, there is a need
DESIGN BASIS REPORT
lb w:\1756\active\175661014\clerical\report\permit design report\permit_design_report.docx 4.35
to monitor pore pressures in the sluiced fly ash foundation in the vicinity of the dikes. We recommend installation of standpipe piezometers that can be read manually or vibrating wire piezometers that can be read using an automated data acquisition system (ADAS), along with routine monitoring and timely analysis of the resulting data throughout construction. General recommendations for the piezometers are given below. More specific requirements will be developed as part of the construction documents.
• Within each dike there should be a minimum of six piezometers installed. These piezometers will be arranged along three separate cross sections of the dike. The cross-sections (upstream to downstream) will have a piezometer at each critical area of interest (i.e., crest and downstream toe). One cross-section should be located through the center (lengthwise) of the dike, and the maximum allowable distance between cross-sections (in plan) is 100 feet.
• Instruments should be installed prior to construction of each dredge containment dike. Special considerations will have to be made to protect installed instruments during construction. The elevation of the standpipe including additional riser lengths will have to be closely monitored and documented during construction so that water level elevations can be accurately referenced.
• Monitoring thresholds will be established to link observed readings with field actions such as slowing or accelerating the rate of fill placement, decreasing pool levels, or other risk reduction measures.
• If desired, piezometers could utilize electronic pressure transducers with ADAS to allow frequent monitoring and observations of fluctuations and trends in pore pressure. Automation may not be needed during construction if staff will be on site to take daily measurements. The ADAS option could also be implemented post-construction by installing pressure transducers within the open standpipe piezometers to monitor the site for an extended period afterward.
• Instruments must be designed and protected against construction activities (excavations, traffic) and the elements (standing water, lightning).
• Piezometers can be installed in open boreholes using the fully grouted method, in which the transducer and data cable are surrounded by a grout mixture instead of a filter sand zone. Fully grouted piezometers are becoming more common, particularly for short-term projects, due to the simplified backfilling method, quicker response time (i.e., more compliant in lower permeability soils), and ability to easily install multiple instruments in a single borehole if desired. However, the data could not be manually verified by a water level indicator as could be done for a transducer in an open standpipe.
• Data from unvented transducers must be corrected for site-specific fluctuations in barometric pressure. This is simply addressed by installing a barometer onsite that can be used to correct all of the piezometer data during post processing. Although vented
DESIGN BASIS REPORT
lb w:\1756\active\175661014\clerical\report\permit design report\permit_design_report.docx 4.36
piezometers, which do not require barometric correction, could be used, they can be prone to problems with the vent clogging (air bubbles or other problems). Vented piezometers are also not as suitable for the fully grouted installation method.
• In order to correlate piezometer readings with potential influencing factors, we recommend periodic monitoring of the pond elevation, dredge area pool elevations, and daily precipitation. Such readings could be performed manually (staff gauge, rain gauge, etc.) or they could also be automated.
• If the system is automated, the use of transducers, as opposed to open standpipes, would allow data cables from multiple instruments to be routed to one or more centralized locations for data collection. Such location(s) could be selected to avoid high-traffic areas during construction. If warranted, telemetry systems (wired or wireless) could be added to allow remote data transfer and monitoring, although this increases the costs and complexity of the system.
• Data should be collected weekly at a minimum when no sluicing or stacking is occurring and daily during the ash sluicing or stacking process. If excessive pore pressures are generated, additional measurements may be warranted to assess stability.
4.5.2 Vertical Slope Inclinometers
Vertical slope inclinometers (SI) can be installed within or near slopes to detect small initial movements that may alert the user to the potential for larger slope failures and allow time for risk reduction measures to be implemented. Inclinometers will be considered for use near the downstream toe of dredge containment dikes during construction, but are probably not warranted for use after closure due to the gentle final slopes. General recommendations are provided below. More specific requirements will be developed as part of the construction documents.
• Slope inclinometers (SIs) should be located at the critical area of interest (i.e., downstream toe of dike). A minimum of one inclinometer should be placed within a given temporary/interim dredge containment dike. The inclinometer should be located next to the piezometer at the downstream toe of the center (lengthwise) cross-section (see Section 4.5.1). If additional inclinometers are warranted they should be placed at the downstream toe at the same cross section(s) as other piezometers.
• Instruments should be installed prior to construction of each dredge containment dike. Special considerations will have to be made to protect installed instruments during construction. The initial elevation of the casing will have to be well documented, and additions to the casing will have to be well documented to accurately reference slope inclinometer readings.
• Monitoring thresholds could be established to link observed readings with field actions such as slowing the rate of fill placement or other risk reduction measures.
DESIGN BASIS REPORT
lb w:\1756\active\175661014\clerical\report\permit design report\permit_design_report.docx 4.37
• The bottom of the SI casing must be a fixed reference point. Thus, it must be installed in stable rock (preferred, if depth to rock is reasonable) or soil that is known to be well below any reasonable failure surface.
• In an overall program that involves both SIs and fully grouted piezometers, some cost efficiency can be realized by installing the piezometers on the outside of the SI casing, thus eliminating an extra borehole.
• Data should be collected weekly at a minimum when no sluicing or stacking is occurring and daily during the sluicing or stacking process. If excessive movements are observed, additional measurements may be warranted to assess stability.
4.5.3 Existing Instrumentation
AEP maintains a network of piezometers and surface deformation monuments across the crest and downstream face of the existing dam. They currently have one pneumatic piezometer in the sluiced fly ash (installed in 2008 - B-17). As part of Stantec’s geotechnical exploration, two open standpipe piezometers (with pressure transducers and ADAS) and one multilevel groundwater sampling system were installed within the sluiced fly ash. We recommend that all of these instruments be protected and periodically monitored during construction. The value of data from specific instruments may depend on their proximity to active areas of construction (excavation, fill, fluctuating pools, etc.).
4.5.4 Post Closure
The Dam Safety Rule (W. Va. Code §22-14-4 and §22-14-19) establishes the guidelines required to operate and abandon a dam in the state of West Virginia. Within the Dam Safety Rule, guidelines are presented regarding instrumentation and monitoring of said instruments. Given that the pond closure will be addressed through a modification of the existing permit (as opposed to the dam abandonment process), existing monitoring wells and any other instrumentation should continue to be monitored as required under existing permits and regulations. If abandonment of the dam becomes an option in the future, the proposed construction instrumentation could be used to support compliance with the abandonment guidelines.
Instrumentation installed during closure activities could be monitored (at AEP’s discretion) to measure the phreatic surface and saturation levels of the ash over time. The cap will reduce the infiltration into the impoundment, but seasonal changes will likely have an impact on the ash saturation levels, therefore, data could be collected at a minimum monthly. If personnel will not be on-site frequently, the automation of data collection may be the most efficient method to take routine, periodic measurements. Pressure transducers can be installed within open standpipe piezometers to record hourly, daily, or weekly measurements. The data from the transducers would be retained on the instrument until personnel downloads the data during a site visit.

DESIGN BASIS REPORT
lb w:\1756\active\175661014\clerical\report\permit design report\permit_design_report.docx 5.38
5.0 References
• Acres American Incorporated (1974). “Draft, Preliminary Design Report, John E. Amos Plant, Fly Ash Retention Dam, Stage 2.” Prepared for Appalachian Power Company, November.
• Acres American Incorporated (1975a). “Geotechnical Data for Bidders, Volume 2 (Phases 1 and 2 Investigations), John E. Amos Plant, Fly Ash Retention Dam, Stage 2.” Prepared for Appalachian Power Company.
• Acres American Incorporated (1975b). Various Stage 2 construction drawings, John E. Amos Plant, Fly Ash Retention Dam, Stage 2. Prepared for Appalachian Power Company.
• American Electric Power (1995). “EPRI Ground Water Study – Amos” (partial), Boring Logs and Monitoring Well Construction Logs. Unit 3 – Fly Ash Pond Monitoring Program. August.
• American Electric Power Service Corporation (AEPSC) (1993). “Dam Break Analysis”. Appalachian Power Company. John Amos Fly Ash Dam, West Virginia ID #03911. Civil Engineering Division. November.
• American Electric Power Service Corporation (AEPSC) (2008b). “Monitoring and Emergency Action Plan and Maintenance Plan”. For the John E. Amos Plant Fly Ash Dam, WV ID #07911. Winfield, Putnam County, West Virginia. Prepared for Appalachian Power Company. January 28.
• Chow V., D. R. Maidment, and L. W. Mays. (1988). Applied Hydrology. McGraw Hill, Singapore, 461.
• H. C. Nutting (2008). “Geotechnical Data Collection Report, Amos U3 Fly Ash Dam Raising Study” Prepared for American Electric Power. February.
• Hynes-Griffin, M. E., and Franklin, A. G. (1984). “Rationalizing the seismic coefficient method.” Miscellaneous Paper GL-84-13, U.S. Army Engineer Waterways Experiment Station, July, 37 pages.
• Idriss, I.M. and Boulanger, R.W. (2008). “Soil Liquefaction During Earthquakes.” Monograph, Earthquake Engineering Research Institute, Oakland, California.
• Konya, C. J., and Walter, E. J. (1990). Surface Blast Design. Second Edition, Prentice Hall Publishing, Englewood, New Jersey.

DESIGN BASIS REPORT
lb w:\1756\active\175661014\clerical\report\permit design report\permit_design_report.docx 5.39
• National Oceanic and Atmospheric Administration (NOAA) (2011). NOAA Atlas 14: Precipitation-Frequency Atlas of the United States. National Weather Service, Silver Spring, Maryland.
• National Oceanic and Atmospheric Administration (NOAA) (1978). Hydrometeorological Report No. 51. Probable Maximum Precipitation Estimates, United States, East of 105th Meridian. Washington, D.C. June.
• Pacific Engineering and Analysis (2011). “Development of Design Ground Motions for the John E. Amos Plant Fly Ash Pond Closure, Draft Report.” Prepared for Stantec Consulting Services Inc., December.
• Stantec Consulting Services Inc. (2011a). “Work Plan, Fly Ash Dam Complex Closure, John E. Amos Plant” Prepared for American Electric Power, August.
• Stantec Consulting Services Inc. (2012a). “Data Gaps Memorandum, Fly Ash Dam Complex Closure, AEP John E. Amos Plant; Data Gap Analysis and Phase 2 Exploration Recommendations – Rev. 1” Prepared for American Electric Power, January.
• Stantec Consulting Services Inc. (2012b). Amos Ash Pond Complex Closure, Conceptual Design Report. John E. Amos Power Plants. Putnam County, West Virginia. February.
• Stantec Consulting Services Inc. (2012c). 30-Percent Design Drawings, Fly Ash Dam Closure. John E. Amos Power Plant. Scary, West Virginia. Prepared for American Electric Power. April.
• Stantec Consulting Services Inc. (2012d). “Geotechnical Data Report (Revision 2), Fly Ash Dam Complex” Prepared for American Electric Power, October.
• Stantec Consulting Services Inc. (2012e). “Revised Supplemental Geotechnical Data Report, Fly Ash Dam Complex” Prepared for American Electric Power, October.
• State of West Virginia (2009). “Title 47, Legislative Rule, Department of Environmental Protection, Water Resources; Series 34, Dam Safety Rule.” West Virginia Code of State Rules.
• State of West Virginia (2010). “Title 33, Legislative Rule, Department of Environmental Protection, Waste Management; Series 1, Solid Waste Management Rule.” West Virginia Code of State Rules.
• State of West Virginia (2011). “Chapter 22. Environmental Resources, Article 14. Dam Control Act.” West Virginia Code.

DESIGN BASIS REPORT
lb w:\1756\active\175661014\clerical\report\permit design report\permit_design_report.docx 5.40
• The Ohio State University (OSU) (2012). “Evaluation of Liquefaction Potential of Impounded Fly Ash: John E. Amos Power Plant, Final Report.” Prepared for American Electric Power, June.
• U. S. Army Corps of Engineers (USACE) (1993). Engineering and Design, Seepage Analysis and Control of Dams. EM 1110-2-1901. April 30th.
• US Army Corps of Engineers (USACE). (2010). Hydrologic Modeling System, HEC-HMS Version 3.4. Hydrologic Engineering Center, Davis, California.
• US Department of Agriculture (USDA). (1986). Technical Release 55: Urban Hydrology for Small Watersheds. Natural Resources Conservation Service, Urbandale, Iowa.
• West Virginia Department of Transportation (WVDOT) (2006). “DD-403, Guide for Design in Cut Sections through Bedrock.” Division of Highways, July.
• West Virginia Department of Transportation (WVDOT) (2007). Drainage Manual – 3rd Edition. Division of Highways. December.