I-5 Ship Canal Bridge Noise Study Ship Canal Bridge: Noise Pilot Project. ... designing noise ......
40
I-5 Ship Canal Bridge: Noise Pilot Project Measurement Results 15700 Dayton Avenue North, P.O. Box 330310 Seattle, WA 98133-9710 September 2012
-
Upload
duongkhuong -
Category
Documents
-
view
221 -
download
1
Transcript of I-5 Ship Canal Bridge Noise Study Ship Canal Bridge: Noise Pilot Project. ... designing noise ......

I-5 Ship Canal Bridge: Noise Pilot Project Measurement Results
15700 Dayton Avenue North, P.O. Box 330310 Seattle, WA 98133-9710 September 2012

Table of Contents
List of Tables ........................................................................................................................................... ii
List of Figures .......................................................................................................................................... ii
Results at a Glance ....................................................................................................................................... 1
What did the I-5 Ship Canal Bridge pilot noise abatement study find? ............................................ 1
What constraints were there on the project? ....................................................................................... 1
Why did the test panels not perform as predicted? ............................................................................. 2
What happens next? ............................................................................................................................... 2
Introduction .................................................................................................................................................. 3
Background ............................................................................................................................................. 3
What noise regulations are relevant? .................................................................................................... 3
What is the study area? .......................................................................................................................... 4 Bridge Traffic Noise............................................................................................................................. 5
What makes this a Noise “Pilot” Project? ............................................................................................ 5
What material was used for the pilot study? ........................................................................................ 6
Measurement Results .............................................................................................................................. 7
Why did the noise panels not work as predicted? ................................................................................ 9
What are the recommendations? ........................................................................................................... 9
Noise Basics................................................................................................................................................ 10
What causes traffic noise? .................................................................................................................... 10
How do people hear sound? ................................................................................................................. 10
How are humans affected by noise? .................................................................................................... 10
How do Noise Walls work? .................................................................................................................. 10
Ship Canal Bridge Studies ......................................................................................................................... 12
What studies have been done before? ................................................................................................. 12
References .................................................................................................................................................. 13
Contacts ...................................................................................................................................................... 14
Characteristics of Noise ...................................................................................................................... A-1 Sound ................................................................................................................................................ A-1 Sound Characteristics and Human Response ................................................................................... A-1 How Humans Perceive Noise ........................................................................................................... A-1 Factors Affecting Traffic Noise ....................................................................................................... A-1 Environmental Effects on Noise ...................................................................................................... A-2 Atmospheric Conditions ................................................................................................................... A-2
Sound Level Descriptors ..................................................................................................................... A-3 Effects of Noise ................................................................................................................................ A-3 Noise Regulations and Impact Criteria ............................................................................................ A-4
Construction Noise .............................................................................................................................. A-6
Characteristics of Noise ...................................................................................................................... B-1

I-5: Ship Canal Bridge: Noise Pilot Project ii
List of Tables
Table 1: Average Noise Levels and Noise Reductions (difference) at Ship Canal Bridge Monitoring Locations ........ 8 Table 2: FHWA Noise Abatement Criteria ............................................................................................................... A-4 Table 3: Maximum Permissible Environmental Noise Levels .................................................................................. A-5 Table 4: Pre- and post-construction noise measurements for the Ship Canal Bridge pilot noise study. .................. B-1 Table 5: Single factor ANOVA statistical tests comparing quarterly measurements for pre- and post-construction at grade measurements for the Ship Canal Bridge pilot noise study. ............................................................................ B-4 Table 6: Single factor ANOVA statistical tests comparing averages for pre- and post-construction at grade measurements for the Ship Canal Bridge pilot noise study. ...................................................................................... B-5 Table 7: Plots of noise measurements collected on the bridge by quarter for pre- and post-construction for the Ship Canal Bridge pilot noise study. ................................................................................................................................. B-6 Table 8: Single factor ANOVA statistical tests comparing quarterly measurements for Site A on the bridge for the Ship Canal Bridge pilot noise study. ......................................................................................................................... B-9 Table 9: Single factor ANOVA statistical tests comparing pre-construction versus average quarterly post-construction measurements for Site A on the bridge for the Ship Canal Bridge pilot noise study. ........................... B-9 Table 10: Single factor ANOVA statistical tests comparing quarterly measurements for Site B on the bridge for the Ship Canal Bridge pilot noise study. ....................................................................................................................... B-10 Table 11: Single factor ANOVA statistical tests comparing post-construction quarterly measurements for Site B on the bridge for the Ship Canal Bridge pilot noise study. ........................................................................................... B-11 Table 12: Single factor ANOVA statistical tests comparing post-construction average quarter measurements for Site B on the bridge for the Ship Canal Bridge pilot noise study. ........................................................................... B-12 Table 13: Single factor ANOVA statistical tests comparing pre-construction versus average quarterly post-construction measurements for Site B on the bridge for the Ship Canal Bridge pilot noise study. ......................... B-12 Table 14: Single factor ANOVA statistical tests comparing quarterly measurements for Site C on the bridge for the Ship Canal Bridge pilot noise study. ....................................................................................................................... B-13 Table 15: Single factor ANOVA statistical tests comparing three quarterly measurements for Site C on the bridge for the Ship Canal Bridge pilot noise study. ............................................................................................................ B-14 Table 16: Single factor ANOVA statistical tests comparing pre-construction versus average quarterly post-construction measurements for Site A on the bridge for the Ship Canal Bridge pilot noise study. ......................... B-14 Table 17: Single factor ANOVA statistical tests comparing quarterly measurements for Site D on the bridge for the Ship Canal Bridge pilot noise study. ....................................................................................................................... B-15 Table 18: Single factor ANOVA statistical tests comparing pre-construction versus average quarterly post-construction measurements for Site D on the bridge for the Ship Canal Bridge pilot noise study. ......................... B-15 Table 19: Single factor ANOVA statistical tests comparing quarterly measurements for Site D on the bridge for the Ship Canal Bridge pilot noise study. ....................................................................................................................... B-15
List of Figures
Figure 1: Ship Canal Bridge pilot study area ............................................................................................................... 5 Figure 2: Direct Path and Reflected Path Sound .......................................................................................................... 6 Figure 3: Ship Canal Bridge Noise Pilot Study Area ................................................................................................... 8 Figure 4: Elevated noise source ............................................................................................................................... A-2 Figure 5: Site B quarterly measurements on the bridge for each quarter .............................................................. B-10 Figure 6: Site C quarterly measurements on the bridge for each quarter .............................................................. B-13 Figure 7: Comparison of noise levels at the 500 Hertz (Hz) frequency for pre- and post-construction measurements at all sites. ................................................................................................................................................................ B-16 Figure 8: Comparison of noise levels at the 800 Hertz (Hz) frequency for pre- and post-construction measurements at all sites. ................................................................................................................................................................ B-17

I-5: Ship Canal Bridge: Noise Pilot Project 1
RESULTS AT A GLANCE
What did the I-5 Ship Canal Bridge pilot
noise abatement study find?
From 2010 - 2011, the Washington State Department of Transportation measured noise level reductions from the vertically hung noise-absorptive panels at the south concrete approach above the express lanes on the I-5 Ship Canal Bridge in Seattle. This project is the first time that this type of material has been used in this type of application. The report summarizes the results I-5 Ship Canal Bridge Pilot Noise Study (noise pilot project) after one year of monitoring. Modeling of the vertically hung absorptive panels predicted 4 to 5 decibels (dB) of noise reduction were possible (HDR, 2009). The average human ear notices noise reductions as small as 3 dB; 10 dB reductions sound half as loud. The first year results are as follows:
The panels provided 0-4 dB of noise reduction to nearby residents along the south concrete approach of the bridge.
Despite measured noise reductions with the panels, an Analysis of Variance (ANOVA) statistical test indicates that post-construction measurements are not significantly quieter than pre-construction noise measurements.
An ANOVA statistical test of the four quarters of post-construction noise measurements indicates that there are no significant seasonal differences in the noise levels or traffic counts.
What constraints were there on the project?
The unique nature of the bridge created numerous challenges for designing noise reduction. Constraints included the following:
Aesthetics; views of and from the bridge
Maintaining structural integrity; wind and dead loading
Access; bridge inspections, bird and rodent habitat
Maintenance; graffiti cleanup, durability of materials

I-5: Ship Canal Bridge: Noise Pilot Project 2
Why did the test panels not perform as
predicted?
The noise models underestimated the total noise in the project area because they couldn’t account for diffracted or direct path noise and only analyzed reflected noise and the absorptive panels.
Noise is diffracting around or reflecting off of the hard edges of the test panels which could reduce their effectiveness. The panels also have steel corners for reinforcement which could be reflecting or diffracting noise.
Noise is reflected out from the exposed ceiling between the panels and directly over express lane traffic. The locations closest to the bridge (e.g. Sites 10 and 18) which received the lowest reductions have a direct line-of-sight to the ceiling. Receivers farther away (e.g. Site 15) have higher reductions because the panels block more of the view to the ceiling.
What happens next?
WSDOT committed to monitoring the project for three years total. Monitoring commitments in year two and year three included the following:
Collect annual noise measurements at locations around the project area and evaluate panel durability and maintenance issues.
Consider input from affected residents and businesses.
Evaluate whether additional analysis techniques can help WSDOT better understand how the noise panels are performing.
Brief elected officials and representatives, the Washington State Transportation Commission and others at WSDOT.
The results from the first year of testing do not suggest that any changes in performance should be expected in year two or year three. The acoustic performance has been consistent throughout the first year during quarterly measurements and there is no evidence of physical deterioration of the materials. Therefore, WSDOT proposes to end regular evaluations of the Noise Pilot Project after one year and for this report to be considered the final summary report.

I-5: Ship Canal Bridge: Noise Pilot Project 3
INTRODUCTION
Background
WSDOT has worked with the Eastlake community for almost 20 years to identify and implement methods for reducing traffic noise levels coming from I-5, as funding has allowed. This document summarizes the noise-reduction methods and studies WSDOT has pursued, and provides references to more detailed materials. The dominant source of noise for residents north of E. Hamlin Street is from traffic on the I-5 express lanes. Communities around the Ship Canal Bridge asked WSDOT to reduce the traffic noise by closing the express lanes at night. In 1997, WSDOT was able to secure funding for operations of ongoing nightly closures of the I-5 express lanes.
Between 2003 and 2008, through the 2003 and 2005 gas tax, WSDOT secured funding to build noise walls on either side of I-5 near the south end of the Ship Canal Bridge.
Since 2004, WSDOT has explored additional options for reducing noise in the area. After extensive internal discussions, an Expert Review Panel (ERP) of four national acoustic experts was convened. Given the constraints on the project, the One of the ERP recommendations was to hang acoustically absorptive panels from the underside of the I-5 mainline, above the I-5 Express Lanes. This recommendation became the Noise Pilot Project described here.
In 2010, WSDOT installed approximately 700 noise-absorptive ceiling panels above the I-5 express lanes on the south end of the Ship Canal Bridge between E. Gwinn Place and E. Allison Street. The panels were hung vertically on the outer edges of the ceiling. They were designed to absorb and block the traffic noise that bounces off the ceiling of the express lanes and into the surrounding neighborhoods.
This is the first time this type of material has been used in this type of application. WSDOT agreed to monitor the test section to evaluate its effectiveness at reducing noise and its durability in this environment. This report outlines the noise measurements collected over the first year following construction and highlights other lessons learned.
What noise regulations are relevant?
In the 1970’s the federal government established the following noise regulations and procedures to address transportation related noise:
Noise Control Act of 1972. Traffic noise regulation requiring federal agencies to implement noise programs.

I-5: Ship Canal Bridge: Noise Pilot Project 4
Procedures for Abatement of Highway Traffic Noise and Construction Noise (23 CFR 772). Requires that the Federal Highway Administration (FHWA) do the following:
o Issue specific highway traffic noise rules in 1976 o Set up the federal aid program to include financial
support for highway noise mitigation o Identify two types of noise mitigation projects: Type I:
mandatory for new construction after 1976, and Type II: voluntary to address pre-existing conditions before 1976 (i.e., “retrofits”).
WSDOT established a Type II voluntary retrofit program that included a prioritization of eligible locations for noise abatement. WSDOT developed an agency directive (D22-22) in the late 1970’s (updated in 1987) that established criteria for equitably ranking the retrofit sites. We use a cost benefit calculation that includes:
Noise level before project
Noise level after project
Number of sensitive “receivers” (noise sensitive properties like homes, churches, schools, etc.)
Cost of noise reduction WSDOT initially considered the Ship Canal Bridge for retrofit ranking in 1977. The bridge was removed from consideration at that time because acceptable lightweight materials were not available, analysis methods had not been developed, and the cost was thought to be too high.
In the 1990’s, residents requested that WSDOT close the I-5 express lanes to reduce noise at night. In 1997, WSDOT was able to secure funding for operations of ongoing nightly closures of the I-5 express lanes. WSDOT initially closed the express lanes from midnight to 4 a.m. In July of 2012, WSDOT completed the I-5 Express Lane Automation project that allows for extended express lanes closures on weeknights from 11 p.m. to 5 a.m. On weekends the express lanes do not open until 7 a.m.
Currently, 56 sites have been identified, including the Ship Canal Bridge. The Bridge was ranked number four when the Noise Pilot Project was originally funded.
What is the study area?
The study area is a 500 foot long section of the south concrete approach of the Ship Canal Bridge. It includes communities on both the east and west side of the concrete approach (Figure 1).

I-5: Ship Canal Bridge: Noise Pilot Project 5
Bridge Traffic Noise
Due to the two level structure of the bridge, nearby residents hear high noise levels from two sources:
“Direct path” noise comes from cars and trucks on the roadway directly to the listener.
“Reflected path” noise that is reflected off the bottom of the mainline.
What makes this a Noise “Pilot” Project?
The Ship Canal Bridge is unique. It is a double-decker bridge carrying more than 200,000 vehicles per day that goes through a dense urban neighborhood with residences constructed very near the structure. Opened in 1962, the Ship Canal Bridge has been nominated for the National Historic Registry, and is locally and regionally iconic. Acoustically, the bridge creates a complex noise environment with both direct path and reflected path noise and other traffic sources (Figure 2).
Figure 1: Ship Canal Bridge pilot study area

I-5: Ship Canal Bridge: Noise Pilot Project 6
Figure 2: Direct Path and Reflected Path Sound
The unique nature of the bridge created numerous challenges for designing noise reduction. Constraints included the following:
Aesthetics; views of and from the bridge
Maintaining structural integrity; wind and dead loading
Access; bridge inspections, bird and rodent habitat
Maintenance; graffiti cleanup
Durability; more than 25 years of expected life remaining
Cost
Given the significant design challenges with the bridge, there was not an obvious cost-effective solution for reducing noise. Even after bringing in national acoustic experts, there remained uncertainty about the effectiveness of noise reduction options. The project was determined to be a research project, or Noise Pilot Project, to allow WSDOT to do the following:
Evaluate the ceiling panels for durability, wind loads, installation, appearance and the effect on the bridge structure
Determine if the selected ceiling panel materials would provide the predicted noise reductions
Respond to neighborhood desires for reasonable options to reduce high noise levels
Verify the noise modeling results with field measurements
Apply what we learn on future similar projects.
What material was used for the pilot study?
WSDOT considered a variety of products with different levels of effectiveness and eventually selected a quilted absorptive panel with the trade name of Sound Seal, model BBC-EXT-2QT-UH Sound Baffles. The product was selected for its combination of acoustic features, durability, and ability for use in this application. The material selected is not currently approved by WSDOT. The product had the following characteristics:
Exterior grade vinyl coated polyester facing
1/2 –inch thick internal Ultra High Molecular Weight Polyethylene stiffener
2-inches of fiberglass batting
One pound per square foot reinforced loaded vinyl noise barrier backing.

I-5: Ship Canal Bridge: Noise Pilot Project 7
Sound Absorption Coefficients (SAC) values of 0.74 at 500 Hz and 0.72 at 1000 Hz. So 74% and 72% of the energy are absorbed at these frequencies, respectively.
This study analyzed the following related to the absorptive product:
Measured frequencies indicate that approximately 22% of the energy is being absorbed at 500 Hz and 27% at 800 Hz.
Measurement Results
Noise levels were monitored for two quarters prior to the installation of the absorptive noise panels and then quarterly for the first year at 18 locations on the ground and four stations on the bridge near the source. Note: the average human ear notices noise reductions as small as 3 decibels; 10 decibel reductions sound half as loud to the human ear.
Within the study area, noise levels were 0-4 dB lower after the panels were installed. Most of the reductions were not audible.
Outside the study area, two locations measured 1- 2 dB higher after the panels were installed.
There were no significant differences in pre-construction versus post-construction traffic volumes, based on traffic counts.
Heavy truck counts were significantly lower in fall 2010 and summer 2011 than in the other measurement periods. However, results do not suggest a measurable effect.

I-5: Ship Canal Bridge: Noise Pilot Project 9
Why did the noise panels not work as
predicted?
Results from two noise models were combined to predict noise reductions from the noise pilot project because no single proven model was capable of modeling direct path traffic noise, sound diffraction, and reflected noise. The original noise modeling used the Federal Highway Administration’s (FHWA) Traffic Noise Model (TNM) to predict traffic noise levels and sound bending (diffracting) around objects. The Enhanced Acoustic Simulator for Engineers (EASE) model was used to predict reflected noise.
The noise models underestimated the total noise in the project area because they couldn’t account for diffracted or direct path noise and only analyzed reflected noise and the absorptive panels.
Noise is diffracting around or reflecting off of the hard edges of the test panels which could reduce their effectiveness. The panels also have steel corners for reinforcement which could be reflecting or diffracting noise.
Noise is reflected out from the exposed ceiling between the panels and directly over express lane traffic. The locations closest to the bridge (e.g. Sites 10 and 18) received the lowest reductions have a direct line-of-sight to the ceiling. Receivers further away (e.g. Site 15) have higher reductions because the panels block more of their view to the ceiling.
What are the recommendations?
At this time, WSDOT is uncertain about a path forward and no specific recommendations are proposed. WSDOT has worked with local and national experts to research solutions to build a pilot project that uses an innovative solution to fit within the many constraints of this historic bridge.
The agency has spent nearly 20 years and more than $7 million dollars, including direct funding and staff time, investigating the situation. Nearby noise reduction efforts, e.g., noise walls, along Harvard Avenue E and Boylston Ave E have exceeded $15 million dollars. At this point, it is difficult to say what else can be done with any amount of money.


I-5: Ship Canal Bridge: Noise Pilot Project 11
Other materials absorb sound. Sound pressure enters the absorptive material, containing open spaces in which the sound pressure loses energy. This is called sound absorption.

I-5: Ship Canal Bridge: Noise Pilot Project 12
SHIP CANAL BRIDGE STUDIES
What studies have been done before?
In 2003 WSDOT’s SR 520 “Trans-Lake” project analyzed noise and structural issues.
The WSDOT Bridge and Structures Office completed the SR 5/520 Ship Canal Noise Mitigation Structural Feasibility and Cost Analysis. The report identified limitations of several noise reduction methods, but also provided an opportunity to consider other methods of noise reduction needing additional research.
Michael Minor and Associates completed the Ship Canal Bridge Noise Abatement Feasibility Study Mitigation in early 2004. Minor’s report looked at several products and identified a variety of next steps to evaluate additional products and rank the bridge on the retrofit list.
WSDOT completed supplemental noise report in late 2004 exploring innovative product solutions and additional complementary noise reduction systems.
WSDOT received $5 million for further study from State Legislature.
WSDOT convened an Expert Review Panel in 2008 who recommended a phased approach to abatement including vertical ceiling panels.
WSDOT contracts with consultant to conduct reflective modeling of noise on bridge using EASE model.
WSDOT constructed vertical noise panels in a test section on the concrete south approach of the bridge in 2010.
I-5: Ship Canal Bridge: Noise Pilot Project 13
REFERENCES
HDR Engineering, Inc. 2009. I-5 Ship Canal Bridge Noise Study Acoustics Recommendations Report – Final.
U.S. Department of Transportation, Federal Highway Administration, 1973. Fundamentals and Abatement of Highway Traffic Noise. Washington D.C.
U.S. Department of Transportation, Federal Highway Administration, 1982. “Procedures for Abatement of Highway Traffic Noise and Construction Noise.” Federal-Aid Highway Program Manual. Volume 7, Chapter 7, Section 3. Washington, D.C.
U.S. Department of Transportation, Federal Highway Administration, 1996. Measurement of Highway-Related Noise. Washington D.C.
U.S. Department of Transportation, Federal Highway Administration, 1998. FHWA Traffic Noise Model User’s Guide. Washington D.C.
U.S. Department of Transportation, Federal Transit Administration, 1995. Transit Noise and Vibration Impact Assessment. Washington D.C.
U.S. Environmental Protection Agency, 1971. Noise from Construction Equipment and Operations, Building Equipment, and Home Appliances. Washington, D.C.
U.S. Environmental Protection Agency, 1974. Information on Levels of Environmental Noise Requisite to Protect Public Health and Welfare with an Adequate Margin of Safety. Report Number 550/9-74-004.
Washington Administrative Code, 1989. Chapter 173-60. Maximum Environmental Noise Levels. Olympia, Washington.
Washington State Department of Transportation, March 1999. Traffic Noise Analysis and Abatement Policy and Procedures. Olympia, Washington.
Washington State Department of Transportation, July 2004. State Route 520 Alternative Noise Barrier Materials Research Report.

I-5: Ship Canal Bridge: Noise Pilot Project 14
CONTACTS
Project Noise Jim Laughlin Washington State Dept. of Transportation 15700 Dayton Avenue North, P.O. Box 330310 Seattle, WA 98133-9710 (206) 440-4643 [email protected]
Project Design and Construction Ann Marie Lamsek SR 520 Office Department of Transportation 600 Stewart Street, Suite 520 North, P.O. Box 330310 Seattle, WA 98101 (206) 770-3503 [email protected]
Noise Policy Tim Sexton Washington State Department of Transportation 15700 Dayton Avenue North, P.O. Box 330310 Seattle, WA 98133-9710 (206) 440-4549 [email protected]

I-5: Ship Canal Bridge: Noise Pilot Project A-1
APPENDIX A: NOISE BASICS
Characteristics of Noise
Sound
Sound is created when objects vibrate, resulting in a minute variation in surrounding atmospheric pressure. This is called sound pressure. The human response to sound depends on the magnitude of a sound as a function of its frequency and time pattern (EPA, 1974). Magnitude measures the physical sound energy in the air. The range of magnitude, from the faintest to the loudest sound that the ear can hear, is so large that sound pressure is expressed on a logarithmic scale in units called decibels (dB). Loudness, compared to physical sound measurement, refers to how people subjectively judge a sound and this varies from person to person. Noise is unwanted sound.
Sound Characteristics and Human Response
Humans respond to a sound's frequency or pitch. The human ear is very effective at perceiving sounds that have a frequency between approximately 1,000 and 5,000 Hz, and human hearing decreases outside this range. Environmental noise is composed of many frequencies, each occurring simultaneously at its own sound-pressure level. Frequency weighting, which is applied electronically by a sound level meter, combines the overall sound frequency into one sound level that simulates how an average person hears sounds. The commonly used frequency weighting for environmental noise is A-weighting (dBA), which is most similar to how humans perceive sounds of low to moderate magnitude.
How Humans Perceive Noise
Because of the logarithmic decibel scale, a doubling of the noise sources (e.g., the number of cars operating on a roadway) increases noise levels by three dBA. A ten-fold increase in the number of noise sources will add 10 dBA. As a result, a source that emits a sound level of 60 dBA, combined with another source of 60 dBA, yields a combined sound level of 63 dBA (not 120 dBA). The human ear can barely perceive a three dBA increase, but a five or six dBA increase is readily noticeable and sounds as if the noise is about one and one-half times as loud. To most listeners, a ten dBA increase appears to be a doubling in noise level.
Factors Affecting Traffic Noise
Noise levels from traffic sources depend on volume, speed, and the type of vehicle. Generally, an increase in volume, speed, or vehicle size increases traffic noise levels. Vehicular noise is a combination of sounds from the engine, exhaust, and tires. Other conditions affecting traffic noise include defective mufflers, steep grades, terrain,

I-5: Ship Canal Bridge: Noise Pilot Project A-2
vegetation, distance from the roadway, and shielding by barriers and buildings.
Environmental Effects on Noise
Noise levels decrease with distance from the source. For a line source such as a roadway, noise levels decrease 3 dBA over hard ground (concrete, pavement) or 4.5 dBA over soft ground (grass) for every doubling of distance between the source and the receptor. For a point source such as construction, noise levels decrease between 6 dBA and 7.5 dBA for every doubling of distance from the source.
The type of terrain and the elevation of the receiver relative to the noise source can greatly affect the propagation of noise. Level ground is the simplest scenario: sound travels in a straight line-of-sight path between the source and receiver (Figure 4).
Figure 4: Elevated noise source
If the source is depressed or the receiver is elevated, noise generally travels directly to the receiver. Noise levels may be reduced in cases where the terrain crests between the source and receiver, resulting in a partial noise barrier near the receiver. If the source is elevated or the receiver is depressed, sound often is reduced at the receiver. The edge of the roadway can act as a partial noise barrier, blocking some sound transmission between the source and receiver (Figure 4). Even a short barrier (e.g., a solid concrete Jersey-type safety barrier) can reduce noise levels. Breaking the line of sight between the receiver and the noise source often results in a noise reduction of approximately five dBA.
Atmospheric Conditions
Atmospheric conditions such as wind, temperature, humidity, and precipitation, are not normally a major factor in most traffic noise

I-5: Ship Canal Bridge: Noise Pilot Project A-3
analysis projects. However, in the present study the bridge structure is elevated above the community. Therefore, prevailing winds from the northwest during the winter months and the southwest during the summer months tend to carry more of the traffic noise farther east of the bridge and bend the sound waves towards the ground on the east side
Sound Level Descriptors
A widely used descriptor for environmental noise is the equivalent sound level (Leq). The Leq can be considered a measure of the average sound level during a specified period of time. It is a measure of total noise, or a summation of all sounds during a time period. It places more emphasis on occasional high noise levels that accompany general background sound levels. Leq is defined as the constant level that, over a given period of time, transmits to the receiver the same amount of acoustical energy as the actual time-varying sound. For example, two sounds, one containing twice as much energy but lasting only half as long, have the same Leq noise levels. Leq measured over a one-hour period is the hourly Leq [Leq(h)] this is used for highway noise impact and abatement analyses.
Short-term noise levels (e.g., a single truck passing by) are described by either the total noise energy or the highest instantaneous noise level occurring during the event. The sound exposure level (SEL) is a measure of total sound energy from an event, and is useful in determining what the Leq will be over a period in time when several noise events occur. The maximum sound level (Lmax) is the greatest short-duration sound level that occurs during a single event. Lmax is related to impacts on speech interference and sleep disruption. In comparison, Lmin is the minimum sound level during a period of time.
People will generally find a moderately high, constant sound level more tolerable than a quiet background level interrupted by frequent high-level noise intrusions. An individual’s response to sound depends greatly upon the range that the sound varies in a given environment. For example, steady traffic noise from a highway is normally less bothersome than occasional aircraft flyovers in a relatively quiet area. In light of this subjective response, it is often useful to look at a statistical distribution of sound levels over a given time period in addition to the average sound level. Such distributions identify the sound level exceeded and the percentage of time it is exceeded. Therefore, it allows for a more thorough description of the range of sound levels during a given measurement period. These distributions are identified with an Ln, where n is the percentage of time that the levels are exceeded. For example, the L10 level is the sound level that is exceeded 10 percent of the time.
Effects of Noise
Environmental noise at high intensities directly affects human health by causing hearing loss. Prolonged exposure to very high levels of

I-5: Ship Canal Bridge: Noise Pilot Project A-4
environmental noise can cause hearing loss. The EPA has established a protective level of 70 dBA Leq, below which hearing is conserved for exposure over a 40-year period (U.S. EPA, 1974). Although scientific evidence is not currently conclusive, noise is suspected of causing or aggravating other diseases. Environmental noise indirectly affects human welfare by interfering with sleep, thought, and conversation. The FHWA noise abatement criteria are based on speech interference, which is a well documented impact that is relatively reproducible in human response studies.
Noise Regulations and Impact Criteria
Applicable noise regulations and guidelines provide a basis for evaluating potential noise impacts. For Type I state and federally funded highway projects, traffic noise impacts occur when predicted LAeq (h) sound levels approach or exceed the noise abatement criteria (NAC) established by the FHWA, or substantially exceed existing sound levels (U.S. Department of Transportation, 1973, Noise Abatement Council). The term "substantially exceed" is defined by WSDOT as an increase of 10 dBA or more to be a substantial increase.
Table 2: FHWA Noise Abatement Criteria
Activity Category Leq (h) (dBA) Description of Activity Category
A 57 (exterior)
Lands on which serenity and quiet are of extraordinary significance and serve an important public need, and where preserving these qualities is essential if the area is to continue to serve its intended purpose.
B 67 (exterior)
Picnic areas, recreation areas, playgrounds, active sports areas, parks, residences, motels, hotels, schools, churches, libraries, and hospitals.
C 72 (exterior) Developed lands, properties, or activities not included in Categories A or B above.
D - Undeveloped lands.
E 52 (interior) Residences, motels, hotels, public meeting rooms, schools, churches, libraries, hospitals, and auditoriums.
Source: U.S. Department of Transportation, 1982. The FHWA noise abatement criteria specify exterior LAeq(h) noise levels for various land activity categories (Table 2). For receptors where serenity and quiet are of extraordinary significance, the noise criterion is 57 dBA. For residences, parks, schools, churches, and similar areas, the noise criterion is 67 dBA. For developed lands, the noise criterion is 72 dBA. WSDOT considers a noise impact to occur if

I-5: Ship Canal Bridge: Noise Pilot Project A-5
predicted LAeq(h) noise levels approach within one dBA of the noise abatement criteria in Table 2. Thus, if a noise level were 66 dBA or higher, it will approach or exceed the FHWA noise abatement criterion of 67 dBA for residences. Land use in the study area includes residential, parks, commercial, industrial, schools and some undeveloped uses (see Figure 1 for map showing quadrants). In the southwest quadrant of the study area land use is primarily residential in the south, changing to a mix of residential, commercial, and industrial uses farther north. There are several apartments under the bridge at Eastlake Avenue E. and E. Allison and several houseboats located along the waterfront. The Southeast quadrant of the study area is almost exclusively residential. There are some residences that have been converted to commercial use near Franklin Avenue East. North of Franklin to Eastlake Avenue East land use is mixed with residential and commercial uses. North of Eastlake Avenue E. land use is commercial with several residential uses including houseboats under the bridge. In the northwest quadrant land use is primarily residential near I-5. John Stanford International School is located near the bridge along 5th Avenue NE. Farther south, land use changes to primarily commercial and industrial, and parklands and trails along most of the waterfront. In the northeast quadrant land use is primarily residential near I-5 and changes to commercial and industrial down to the waterfront.
The City of Seattle property line noise regulations are outlined in SMC 25.08.410 of the municipal code. The maximum permissible noise levels depend on the land uses of both the source noise and receiving property (Table 3). The environmental designation for noise abatement (EDNA) is defined by the land use of a property. In general, residential uses are class A, commercial are class B, and industrial are class C.
Table 3: Maximum Permissible Environmental Noise Levels
EDNA OF NOISE
SOURCE
EDNA OF RECEIVING PROPERTY
Residential (dBA)
Commercial (dBA)
Industrial (dBA)
Rural 52 55 57 Residential 55 57 60 Commercial 57 60 65 Industrial 60 65 70 Source: Seattle Municipal Code SMC 25.08.410
Noise from traffic operating on public roadways is exempt from SMC 25.08.410. Construction noise is exempt from property line standards during daytime hours. Nighttime construction noise from the project, however, must meet 10 dB below City of Seattle property line regulations (Table3) between 10 p.m. and 7 a.m.

I-5: Ship Canal Bridge: Noise Pilot Project A-6
Construction Noise
Construction of any of the noise walls requires nighttime construction activities. Therefore, a nighttime noise variance is required from the City of Seattle. Construction noise mitigation requirements will be developed in coordination with the City and specified in the noise variance. To reduce construction noise at nearby receptors, mitigation measures such as the following could be incorporated into construction plans, contractor specifications, and variance requirements:
Develop a construction monitoring and management plan that establishes specified noise levels that may not be exceeded by the contractor during specific time periods.
Construct temporary noise barriers or curtains around stationary equipment and long-term work areas located close to residences.
Limit the noisiest construction activities to before 10:00 PM on weekdays and weekends reducing construction noise levels during sensitive nighttime hours.
Equip construction equipment engines with adequate mufflers, intake silencers and engine enclosures.
Use the quietest equipment available. Require the use of OSHA approved ambient sound level
backup alarms. Turn off construction equipment during prolonged periods of
non-use. Maintain all equipment and train operators in their proper use. Where possible, locate stationary equipment away from
sensitive receiving properties Provide a 24-hour noise complaint line. Notify nearby residents prior to periods of intense nighttime
construction

I-5: Ship Canal Bridge: Noise Pilot Project B-1
APPENDIX B: RESULTS
Characteristics of Noise
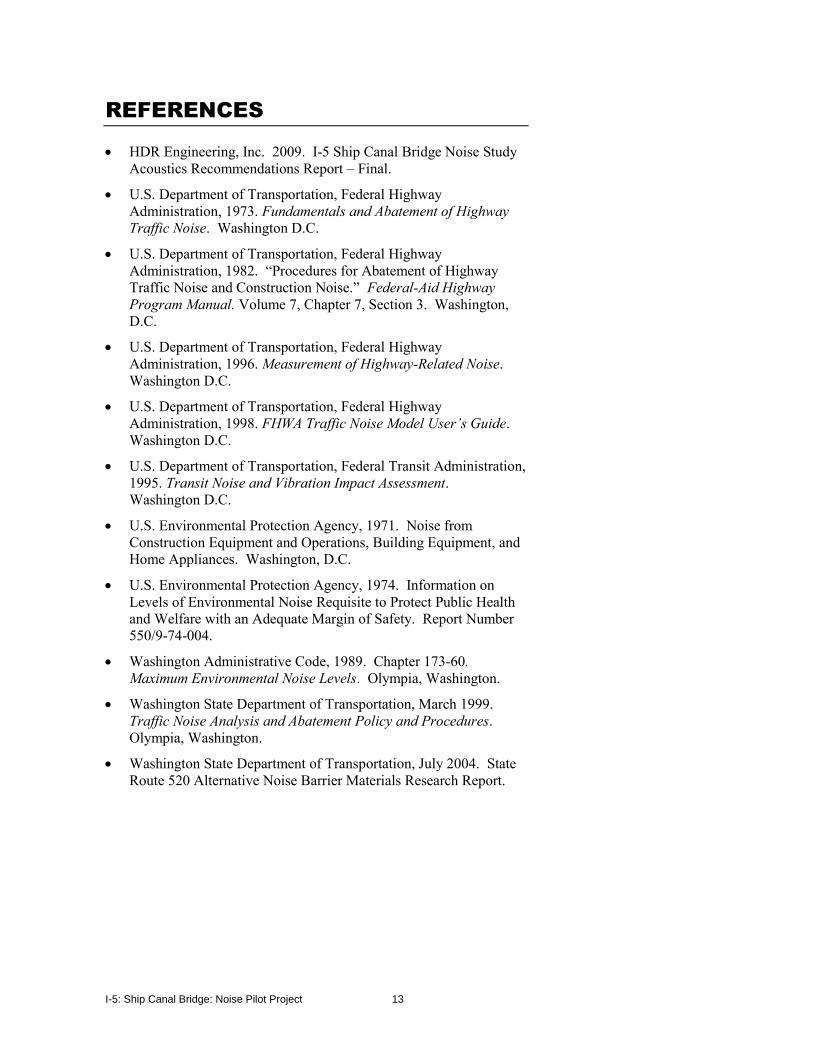
Table 4: Pre- and post-construction noise measurements for the Ship Canal Bridge pilot noise study.
Pre-Construction Post-Construction
Location Location Description
December 2009 (dBA)
February 2010 (dBA)
Average Pre-Con (dBA)
October 2010 (dBA)
February 2011 (dBA)
July 2011 (dBA)
September 2011 (dBA)
Average Post-Con (dBA)
A Express Lane, west side, inside lane near E. Gwinn Place
92 92 92.3 92 92 92 92 91.8
B
Express Lane, east side, inside lane between E. Gwinn Place and E. Shelby Street
- - - 93 92 90 92 91.2
C
Express Lane, east side, inside lane between E. Gwinn Place and E. Allison Street
91 - 91.0 92 - 91 91 91.8
D Express Lane, west side, south of Eastlake Avenue E.
- - - - - 92 92 91.7
1 Alley, 65’ off Allison St. 83 84 83.5 81 80 81 80 80.5
2 Brentwood Apts. 2923 Franklin, Right side of yard
82 82 82.4 79 79 78 79 78.8
3 Brentwood Apts. Drive way bet. 2923 and 2919 Franklin
82 82 82.4 80 80 80 81 80.3
4 Brentwood Apts. NW 74 73 74.3 71 72 71 72 71.5
I-5: Ship Canal Bridge: Noise Pilot Project B-2
Pre-Construction Post-Construction
Location Location Description
December 2009 (dBA)
February 2010 (dBA)
Average Pre-Con (dBA)
October 2010 (dBA)
February 2011 (dBA)
July 2011 (dBA)
September 2011 (dBA)
Average Post-Con (dBA)
corner of House #2923 Franklin St
5 NE Corner of Allison & East Lake 79 79 79.4 77 77 77 78 77.3
6
West of East Lake on North side Allison St. on the S. side of a building
70 69 70.3 69 69 69 70 69.3
7 On the park W side of I-5, (west of) next to a pine tree.
81 83 81.6 80 80 80 80 80.0
8 On the side walk West side of the walkway of Psychic Palm.
78 80 78.6 78 77 78 77 77.5
9
On the E side of East Lake Ave On a side walk, N edge of Lake Union Café
79 82 79.8 81 80 82 80 80.8
10 NW Harvard and Allison St. 75’ from Br.
82 84 82.6 82 82 82 82 82.0
11
W side of Harvard across the Pillar and across NW. corner of house # 3109
79 82 79.8 82 82 82 82 82.0
12 N side of Franklin, where walk way starts for house #3109
77 80 77.8 79 79 77 77 78.0
13 NW Corner of Allison & Harvard, by the stop sign 150’ E of I-5
79 79 79.4 78 78 79 78 78.3
14 NE side of Allison bet. Windows of House # 69 72 69.8 70 70 70 70 70.0

I-5: Ship Canal Bridge: Noise Pilot Project B-3
Pre-Construction Post-Construction
Location Location Description
December 2009 (dBA)
February 2010 (dBA)
Average Pre-Con (dBA)
October 2010 (dBA)
February 2011 (dBA)
July 2011 (dBA)
September 2011 (dBA)
Average Post-Con (dBA)
810. 300’ E of I-5
15 On the Alley, edge of Parking #103 79 77 79.3 77 76 77 75 76.3
16 S. Side of Gwinn, 30 ‘ E of Stop Sign 75 72 75.2 75 72 74 74 73.8
17
W side of Harvard St. Direct Traffic, between Shelby and Gwinn
83 80 83.2 82 83 82 82 82.3
18 W Side of Harvard St, on edge curve on Planting Strip.
83 82 83.3 82 83 82 83 82.5
Note: Missing values in table due to malfunctioning equipment, unable to collect data.

I-5: Ship Canal Bridge: Noise Pilot Project B-4
Table 5: Single factor ANOVA statistical tests comparing quarterly measurements for pre- and post-construction at grade measurements for the Ship Canal Bridge pilot noise study.
ANOVA: Single Factor Pre-Construction SUMMARY Groups Count Sum Average Variance December 2009 18 1414 78.55555556 17.79084967 February 2010 18 1422 79 20.70588235 ANOVA Source of Variation SS df MS F P-value F critical Between Groups 1.777777778 1 1.777777778 0.092359932 0.763050329* 4.130017699 Within Groups 654.4444444 34 19.24836601 Total 656.2222222 35 * - Not Statistically Significant ANOVA: Single Factor Post-Construction SUMMARY Groups Count Sum Average Variance October 2010 18 1403 77.94444444 17.46732026 February 2011 18 1399 77.72222222 18.91830065 July 2011 18 1400 77.77777778 18.30065359 September 2011 18 1401 77.83333333 16.14705882 ANOVA Source of Variation SS df MS F P-value F critical Between Groups 0.486111111 3 0.162037037 0.009150327 0.998787537* 2.739502326 Within Groups 1204.166667 68 17.70833333 Total 1204.652778 71
* - Not Statistically Significant
Table 5 shows the results of a statistical comparison of the two quarters of pre-construction measurements in the upper part of the table and a comparison of the four quarters of the first year of post-construction measurements. The results indicate that the preconstruction measurements are not significantly different from one another and thus there is no difference between the two quarters of data collected and the data they can be combined as an average. The lower half of the table indicates that the four quarters of data collected post-construction are not significantly different from one another and so there is no difference between the four quarters of data and there are no apparent seasonal differences thus the data can be combined as an average. Table 6 below shows the results of a single factor ANOVA statistical test which compares the average pre-construction versus the average post-construction at-grade measurements. The results indicate that the post-construction measurements are not statistically significantly different (p>0.05) from the pre-construction noise measurements. Most of the variation in the measurements can be explained by the differences between the different measurement locations.

I-5: Ship Canal Bridge: Noise Pilot Project B-5
Table 6: Single factor ANOVA statistical tests comparing averages for pre- and post-construction at grade measurements for the Ship Canal Bridge pilot noise study.
ANOVA: Single Factor Pre-Construction vs. Post-Construction SUMMARY Groups Count Sum Average Variance Pre-con (avg) 18 1420.096 78.89420401 18.06680845 Post-con (avg) 18 1401.444 77.85802258 17.27788507 ANOVA Source of Variation SS df MS F P-value F critical Between Groups 9.663048 1 9.663047616 0.546789158 0.464708* 4.130018
Within Groups 600.8598 34 17.67234676 Total 610.5228 35
* - Not Statistically Significant


I-5: Ship Canal Bridge: Noise Pilot Project B-9
Site A Table 7 shows the 15-minute Leq noise measurements collected each hour at the four locations on the bridge express lanes within the pilot study area. Some of the plots, for example post construction quarter 2, shows considerable variability in the plots when compared with the other sites on the bridge. Statistical analysis using Dixon’s Q-test for outliers shows that some of the data are considered statistical outliers. At site C for quarter 2 post construction it appears that the meter may have lost internal power or some other internal malfunction that caused erroneous results after that point. The data for this meter at Site C was determined to be statistically significantly different than the other three quarters and the pre-construction measurements (Single Factor ANOVA, p < 0.05) and so this data was eliminated from subsequent analysis. Data identified as statistical outliers were also not included in subsequent analysis. Table 8 provides the results of a single factor ANOVA comparing quarterly measurements at Site A on the bridge. The results of this comparison indicate that the quarterly measurements at Site A are not significantly different from one another (p>0.05). Table 9 compares the average pre-construction measurements at Site A versus the average post-construction measurements. The results show that they are not significantly different (p>0.05). Table 8: Single factor ANOVA statistical tests comparing quarterly measurements for Site A on the bridge for the Ship Canal Bridge pilot noise study.
ANOVA: Single Factor Pre-Construction versus Post-Construction All Site A SUMMARY Groups Count Sum Average Variance A-Q1 7 640.9 91.55714 0.832857 A-Q2 7 648.2 92.6 1.726667 A-Q3 7 641 91.57143 0.782381 A-Q4 8 736.8 92.1 1.285714 ANOVA Source of Variation SS df MS F P-value F crit Between Groups 5.216847 3 1.738949 1.49644 0.239772* 2.991241 Within Groups 29.05143 25 1.162057 Total 34.26828 28 * - Not Statistically Significant
Table 9: Single factor ANOVA statistical tests comparing pre-construction versus average quarterly post-construction measurements for Site A on the bridge for the Ship Canal Bridge pilot noise study.
ANOVA: Single Factor Pre-Construction versus Post-Construction All Site D SUMMARY Groups Count Sum Average Variance Pre-con A 8 730.676730 91.3345913 1.25227101 Post-con A 8 732.251533 91.5314417 2.24958158 ANOVA Source of Variation SS df MS F P-value F crit Between Groups 0.155000 1 0.155000 0.088524 0.770430* 4.600109 Within Groups 24.51296 14 1.750926 Total 24.66796 15 * - Not Statistically Significant

I-5: Ship Canal Bridge: Noise Pilot Project B-11
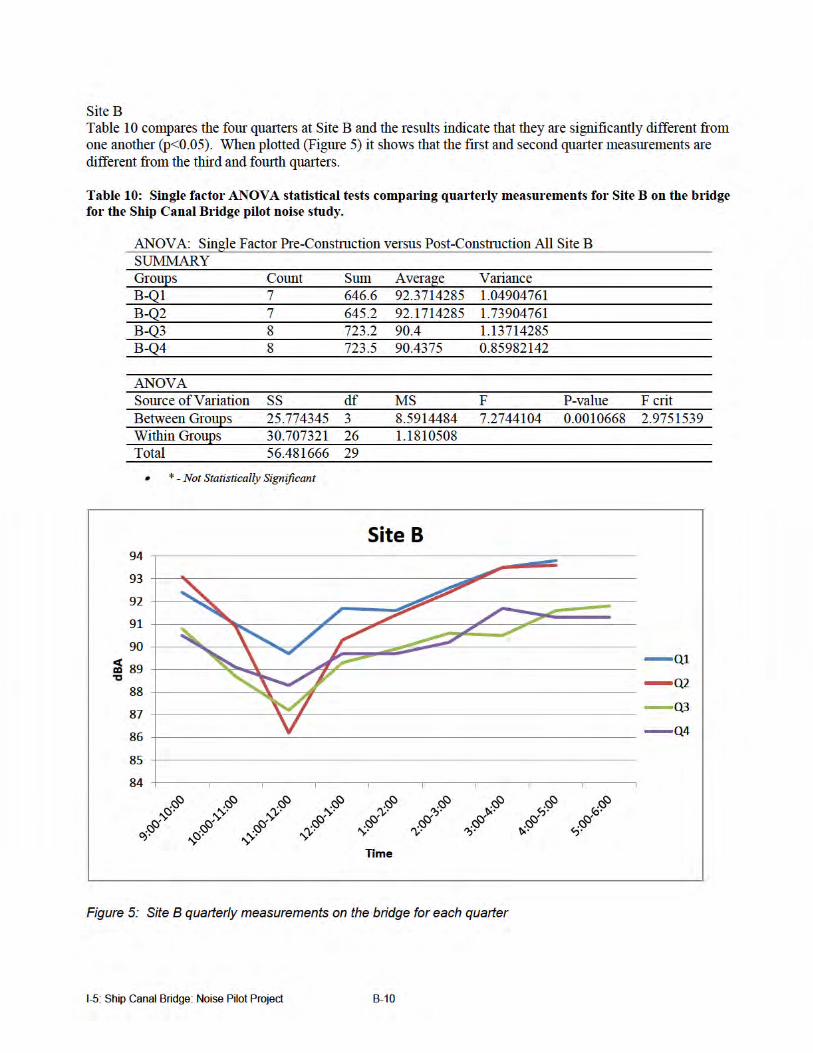
Table 11 shows the results of a three separate single factor ANOVA tests comparing the four quarters in a pair wise manner to determine which are significantly different from one another. The results indicate that the first and second quarters are significantly different from the third and fourth quarters. Therefore, since the first and second quarters are not significantly different from one another they can be averaged. The same is true for the third and fourth quarter results. Table 11: Single factor ANOVA statistical tests comparing post-construction quarterly measurements for Site B on the bridge for the Ship Canal Bridge pilot noise study.
ANOVA: Single Factor Post-Construction Site B SUMMARY Groups Count Sum Average Variance B-Q2 7 645.2 92.17143 1.739048 B-Q3 8 723.2 90.4 1.137143 ANOVA Source of Variation SS df MS F P-value F crit Between Groups 11.71505 1 11.71505 8.279507 0.012958 4.667193 Within Groups 18.39429 13 1.414945 Total 30.10933 14
ANOVA: Single Factor Pre-Construction versus Post-Construction All Site D SUMMARY Groups Count Sum Average Variance B-Q1 8 736.3 92.0375 1.79125 B-Q3 9 810.4 90.04444 2.132778 ANOVA Source of Variation SS df MS F P-value F crit Between Groups 16.82373 1 16.82373 8.525261 0.010562 4.543077 Within Groups 29.60097 15 1.973398 Total 46.42471 16
ANOVA: Single Factor Post-Construction Site B SUMMARY Groups Count Sum Average Variance B-Q1 8 736.3 92.0375 1.79125 B-Q4 9 811.8 90.2 1.26 ANOVA Source of Variation SS df MS F P-value F crit Between Groups 14.30007 1 14.30007 9.483331 0.00763 4.543077 Within Groups 22.61875 15 1.507917 Total 36.91882 16 * - Not Statistically Significant
Table 12 shows the first and second quarter averaged data compared against the averaged third and fourth quarter data using a single factor ANOVA. The results indicate that they are not significantly different

I-5: Ship Canal Bridge: Noise Pilot Project B-12
(p>0.05) and so the two averages can be averaged together for further comparisons. Table 13 shows the results of a single factor ANOVA comparing the average pre-construction measurements against the averaged first and second and averaged third and fourth quarters at Site B. Results indicate that they are not significantly different from one another (p>0.05). Table 12: Single factor ANOVA statistical tests comparing post-construction average quarter measurements for Site B on the bridge for the Ship Canal Bridge pilot noise study.
ANOVA: Single Factor Pre-Construction versus Post-Construction All Site B SUMMARY Groups Count Sum Average Variance Post-con B 1+2 8 734.2674 91.78343 3.083408 Post-con B 3+4 9 811.2034 90.13371 1.582299 ANOVA Source of Variation SS df MS F P-value F crit Between Groups 11.6943 2 5.847149 2.818299 0.080403* 3.422132 Within Groups 47.71829 23 2.074708 Total 59.41259 25 * - Not Statistically Significant
Table 13: Single factor ANOVA statistical tests comparing pre-construction versus average quarterly post-construction measurements for Site B on the bridge for the Ship Canal Bridge pilot noise study.
ANOVA: Single Factor Pre-Construction versus Post-Construction All Site B SUMMARY Groups Count Sum Average Variance Pre-con B 9 819.7094 91.07882 1.684505 Post-con B 1+2 8 734.2674 91.78343 3.083408 Post-con B 3+4 9 811.2034 90.13371 1.582299 ANOVA Source of Variation SS df MS F P-value F crit Between Groups 11.6943 2 5.847149 2.818299 0.080403* 3.422132 Within Groups 47.71829 23 2.074708 Total 59.41259 25 * - Not Statistically Significant
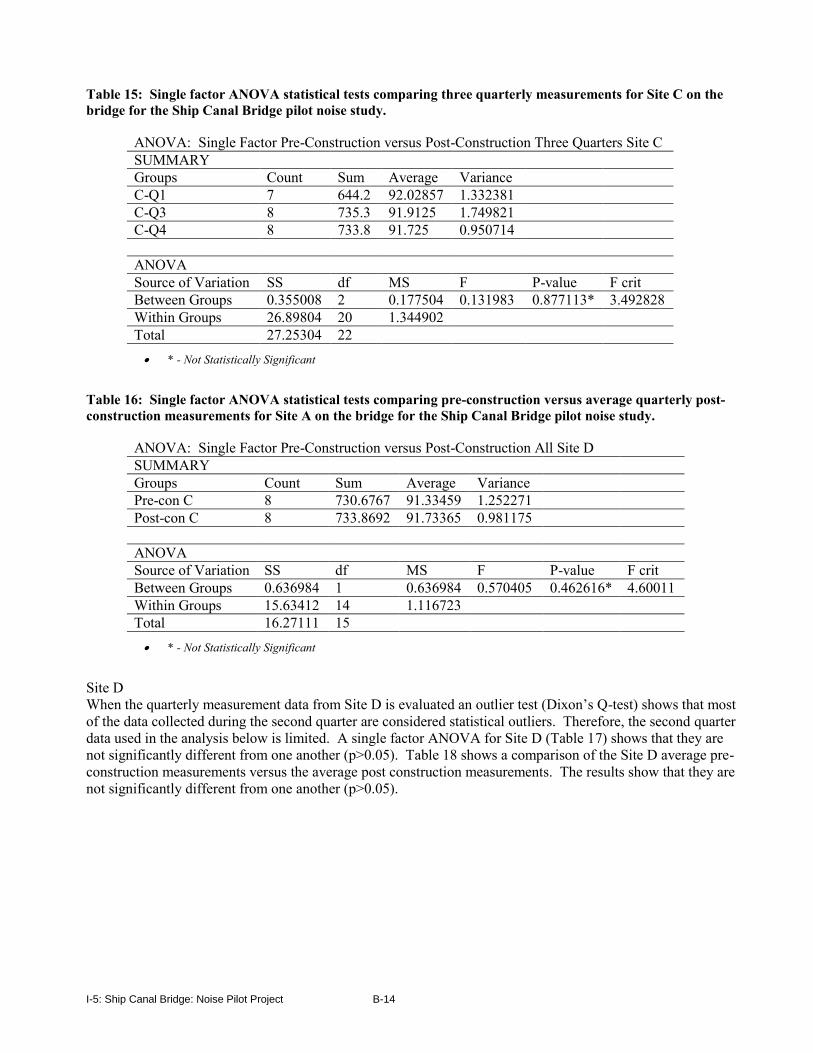
Site C Table 14 shows the results of a single factor ANOVA comparing quarterly measurements at Site C on the bridge. The results of this comparison indicate that the quarterly measurements at Site C are significantly different from one another (p<0.05). When plotted (Figure 6) it shows that the second quarter measurements are quite different from the other three quarters. In fact it appears that the noise meter used during the second quarter measurements at this site may have had a loss of power or other internal malfunction causing the measurements to more or less level out after the noon measurement rather than gradually increasing as with the other quarters. Additionally two of the measurements collected at 2:00 pm and 4:00 pm were tested and found to be statistical outliers (Dixon’s Q-test). Therefore, the second quarter results were eliminated from further analysis.

I-5: Ship Canal Bridge: Noise Pilot Project B-14
Table 15: Single factor ANOVA statistical tests comparing three quarterly measurements for Site C on the bridge for the Ship Canal Bridge pilot noise study.
ANOVA: Single Factor Pre-Construction versus Post-Construction Three Quarters Site C SUMMARY Groups Count Sum Average Variance C-Q1 7 644.2 92.02857 1.332381 C-Q3 8 735.3 91.9125 1.749821 C-Q4 8 733.8 91.725 0.950714 ANOVA Source of Variation SS df MS F P-value F crit Between Groups 0.355008 2 0.177504 0.131983 0.877113* 3.492828 Within Groups 26.89804 20 1.344902 Total 27.25304 22 * - Not Statistically Significant
Table 16: Single factor ANOVA statistical tests comparing pre-construction versus average quarterly post-construction measurements for Site A on the bridge for the Ship Canal Bridge pilot noise study.
ANOVA: Single Factor Pre-Construction versus Post-Construction All Site D SUMMARY Groups Count Sum Average Variance Pre-con C 8 730.6767 91.33459 1.252271 Post-con C 8 733.8692 91.73365 0.981175 ANOVA Source of Variation SS df MS F P-value F crit Between Groups 0.636984 1 0.636984 0.570405 0.462616* 4.60011 Within Groups 15.63412 14 1.116723 Total 16.27111 15 * - Not Statistically Significant
Site D When the quarterly measurement data from Site D is evaluated an outlier test (Dixon’s Q-test) shows that most of the data collected during the second quarter are considered statistical outliers. Therefore, the second quarter data used in the analysis below is limited. A single factor ANOVA for Site D (Table 17) shows that they are not significantly different from one another (p>0.05). Table 18 shows a comparison of the Site D average pre-construction measurements versus the average post construction measurements. The results show that they are not significantly different from one another (p>0.05).

I-5: Ship Canal Bridge: Noise Pilot Project B-15
Table 17: Single factor ANOVA statistical tests comparing quarterly measurements for Site D on the bridge for the Ship Canal Bridge pilot noise study.
ANOVA: Single Factor Pre-Construction versus Post-Construction All Site D SUMMARY Groups Count Sum Average Variance D-Q2 3 280.6 93.533333 11.743333 D-Q3 7 641.2 91.6 0.5033333 D-Q4 7 641.2 91.6 1.06 ANOVA Source of Variation SS df MS F P-value F crit Between Groups 9.234509 2 4.6172549 1.9667820 0.1766973* 3.7388918 Within Groups 32.86666 14 2.3476190 Total 42.101176 16 * - Not Statistically Significant
Table 18: Single factor ANOVA statistical tests comparing pre-construction versus average quarterly post-construction measurements for Site D on the bridge for the Ship Canal Bridge pilot noise study.
ANOVA: Single Factor Pre-Construction versus Post-Construction All Site D SUMMARY Groups Count Sum Average Variance Pre-con D 8 730.6767 91.33459 1.252271 Post-con D 7 636.6882 90.95546 3.976341 ANOVA Source of Variation SS df MS F P-value F crit Between Groups 0.536637 1 0.536637 0.213839 0.651419* 4.667193 Within Groups 32.62394 13 2.509534 Total 33.16058 14 * - Not Statistically Significant
Table 19 compares the average pre-construction noise measurements against the average post construction measurements at each site. The results indicate that they are not significantly different from one another (p>0.05). Table 19: Single factor ANOVA statistical tests comparing quarterly measurements for Site D on the bridge for the Ship Canal Bridge pilot noise study.
ANOVA: Single Factor Pre-Construction versus Post-Construction All Site D SUMMARY Groups Count Sum Average Variance Pre-Con 8 730.67673 91.334591 1.2522710 Post-Con A 8 732.25153 91.531441 2.2495815 Post-Con B 8 728.29005 91.036257 1.9414925 Post-Con C 8 733.86918 91.733647 0.9811752
I-5: Ship Canal Bridge: Noise Pilot Project B-16
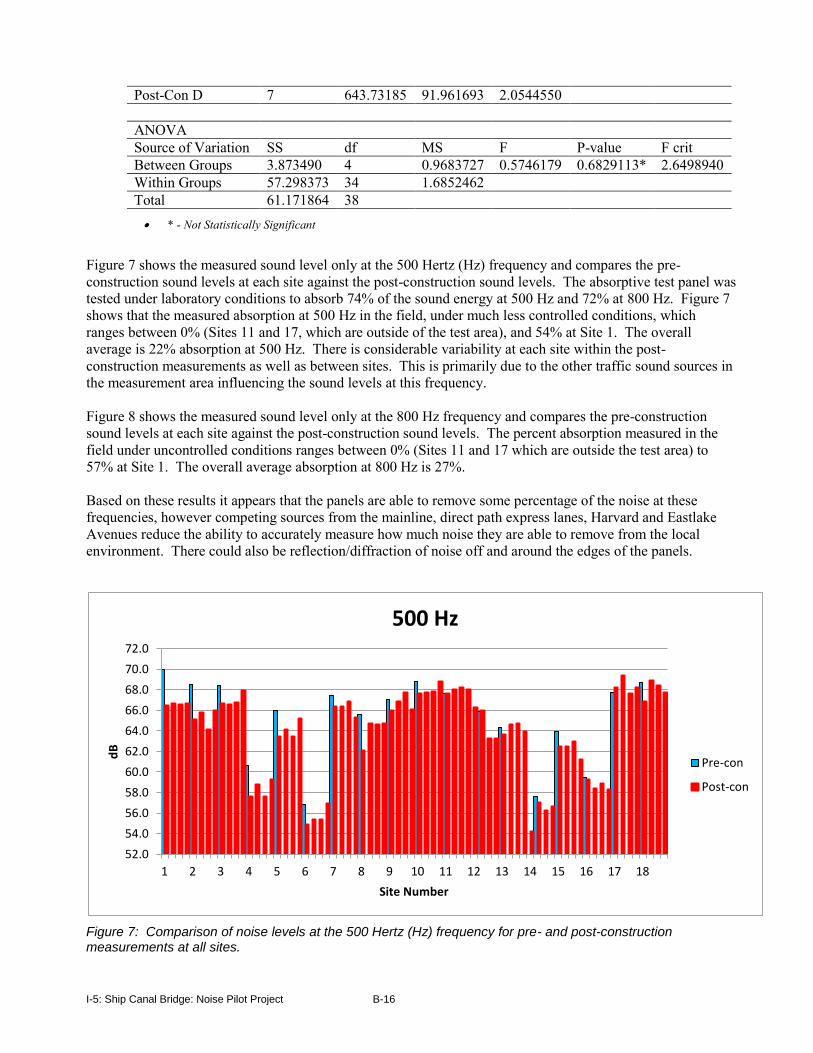
Post-Con D 7 643.73185 91.961693 2.0544550 ANOVA Source of Variation SS df MS F P-value F crit Between Groups 3.873490 4 0.9683727 0.5746179 0.6829113* 2.6498940 Within Groups 57.298373 34 1.6852462 Total 61.171864 38 * - Not Statistically Significant
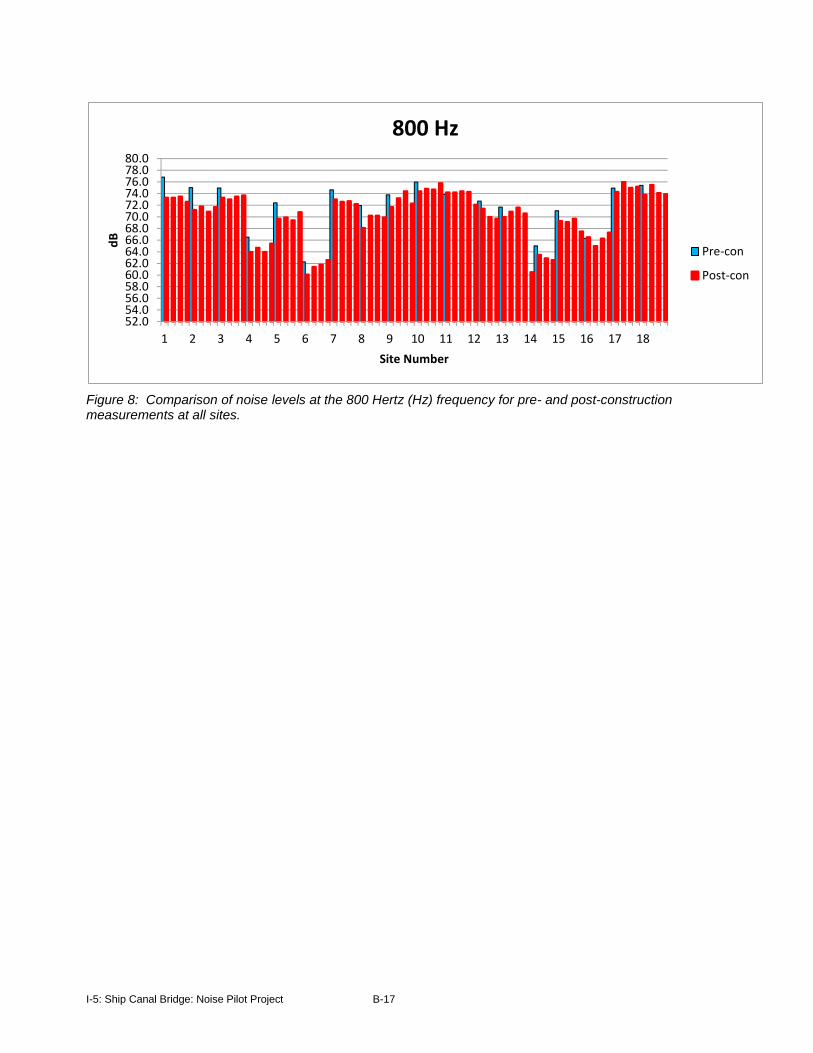
Figure 7 shows the measured sound level only at the 500 Hertz (Hz) frequency and compares the pre-construction sound levels at each site against the post-construction sound levels. The absorptive test panel was tested under laboratory conditions to absorb 74% of the sound energy at 500 Hz and 72% at 800 Hz. Figure 7 shows that the measured absorption at 500 Hz in the field, under much less controlled conditions, which ranges between 0% (Sites 11 and 17, which are outside of the test area), and 54% at Site 1. The overall average is 22% absorption at 500 Hz. There is considerable variability at each site within the post-construction measurements as well as between sites. This is primarily due to the other traffic sound sources in the measurement area influencing the sound levels at this frequency. Figure 8 shows the measured sound level only at the 800 Hz frequency and compares the pre-construction sound levels at each site against the post-construction sound levels. The percent absorption measured in the field under uncontrolled conditions ranges between 0% (Sites 11 and 17 which are outside the test area) to 57% at Site 1. The overall average absorption at 800 Hz is 27%. Based on these results it appears that the panels are able to remove some percentage of the noise at these frequencies, however competing sources from the mainline, direct path express lanes, Harvard and Eastlake Avenues reduce the ability to accurately measure how much noise they are able to remove from the local environment. There could also be reflection/diffraction of noise off and around the edges of the panels.
Figure 7: Comparison of noise levels at the 500 Hertz (Hz) frequency for pre- and post-construction measurements at all sites.
52.0
54.0
56.0
58.0
60.0
62.0
64.0
66.0
68.0
70.0
72.0
1 2 3 4 5 6 7 8 9 10 11 12 13 14 15 16 17 18
dB
Site Number
500 Hz
Pre-con
Post-con
I-5: Ship Canal Bridge: Noise Pilot Project B-17
Figure 8: Comparison of noise levels at the 800 Hertz (Hz) frequency for pre- and post-construction measurements at all sites.
52.054.056.058.060.062.064.066.068.070.072.074.076.078.080.0
1 2 3 4 5 6 7 8 9 10 11 12 13 14 15 16 17 18
dB
Site Number
800 Hz
Pre-con
Post-con