i 45 K - apps.dtic.mil · D D ORM147 PAEI UCtASSIFIED. I'UNCLASSIFIED Security Classification 14....
65
UNCLASSIFIED ~ i 45 K DOCUMENT CONTROL DATA.- R & D 'S. "Irtt ,V ta.d jin affoi, )I iti tt . ?,o-Jy ti tt m o art ati A iIndeiA nj gnnutJt,e~n twi,'t to untored whon sh; Ia'VOWs Ffep),t IN~ Cldl)141110d 0;41IýINA Vi%C; AC rIV17T ,('orptra' acghoir) li. RILPORT SliCURITY CLASSIF'ICATION IUNCLASSIFIED Naval Ordnance Laboratory .GRU White Oak, S3ilver Spring, 14aryland NM I HUPOFT TITL.E Cam:Or FIBER SURFACE TREAVE~NTS 4. r)r5c04IPTIVF NOTFS(T'Ype otr..potadi~ncflCusivedetwa .1. Atu 1 uOHI( (b'ars nhnie, middle t1111101, all1 tlame, J. V. LArsen T. V1. 3mith P. w. Erickson ,3. FALPOFAT OATil ?a. TOTAL P40. OF PAGIES 7.NO. OP "Cps 29 October 1971586 do' CONTRACT OR GRANT NO. Ma. ORIGINATOMTS R9PORT NUMOKIRS) Al? 520/292/70 F 51-544-201 NOLTR 71-165 h. FPQOJEC I NO). ob. OT.4KR REPORT NotSl (Any olP.r numboer that may be asaidned C. this report) d. None 10,DIfSrRIBUTION STAT(MMr. Approved for public release; dist~ribution unlimited I I SUPPLrmi:NTARY NJOTES 11. SPONSORING MILITARY ACTIVITY I ~Naval Uir Oyntems Cowtviad 'None liavy Department ________ ___________ Washirigtrn, D. C.: k'P AUSI'MACT n Three surface treatments'kwere investigated. oxidation treatments were foun to be generally slow blit in some cases quite effective. Li~uid oxidations were Pre- ferred. Gaseou3 methods w~ere usually detrimental to the fiber tensile strengths. The oxidation treatmnents appear to produce a carbon-like surfac4 on t"re fibers. The solution-reduction treatments were~ the most effective, producing composite shear strengths up to 12,000 psiN the highest values reported to date for high-modulus (over 50 million psi) fibers. - The method is extremely fast, requiring less than one minute of residence time.,, This approach has commercial significance when compared with currently used oxidation treatment3 requiring several hours. Ti~e characteristics of the. fiber surfaces were found to be related to the type of fiber with high-modulus fibers having a graphite-like surface and lowe-r-modulus fibers exhibitinlg a carbon-like surface.,,,The nature of the surface carbon determines to a large extent the reactivity of the surface to matrix resins and the resulting composite shear str!'mgth. Carbon-like surfaces'are Iinporkant for the develoynent Of high composite shear strengths .- Several other factors,. such as surface area, functionality, and wettability, were found to play less important roles In composite shear strengths.! D D ORM147 PAEI UCtASSIFIED
-
Upload
vuongnguyet -
Category
Documents
-
view
214 -
download
0
Transcript of i 45 K - apps.dtic.mil · D D ORM147 PAEI UCtASSIFIED. I'UNCLASSIFIED Security Classification 14....

UNCLASSIFIED ~ i 45 KDOCUMENT CONTROL DATA.- R & D
'S. "Irtt ,V ta.d jin affoi, )I iti tt . ?,o-Jy ti tt m o art ati A iIndeiA nj gnnutJt,e~n twi,'t to untored whon sh; Ia'VOWs Ffep),t IN~ Cldl)141110d0;41IýINA Vi%C; AC rIV17T ,('orptra' acghoir) li. RILPORT SliCURITY CLASSIF'ICATION
IUNCLASSIFIEDNaval Ordnance Laboratory .GRU
White Oak, S3ilver Spring, 14aryland NMI HUPOFT TITL.E
Cam:Or FIBER SURFACE TREAVE~NTS
4. r)r5c04IPTIVF NOTFS(T'Ype otr..potadi~ncflCusivedetwa
.1. Atu 1 uOHI( (b'ars nhnie, middle t1111101, all1 tlame,
J. V. LArsenT. V1. 3mithP. w. Erickson
,3. FALPOFAT OATil ?a. TOTAL P40. OF PAGIES 7.NO. OP "Cps
29 October 1971586do' CONTRACT OR GRANT NO. Ma. ORIGINATOMTS R9PORT NUMOKIRS)
Al? 520/292/70 F 51-544-201 NOLTR 71-165h. FPQOJEC I NO).
ob. OT.4KR REPORT NotSl (Any olP.r numboer that may be asaidnedC. this report)
d. None10,DIfSrRIBUTION STAT(MMr.
Approved for public release; dist~ribution unlimited
I I SUPPLrmi:NTARY NJOTES 11. SPONSORING MILITARY ACTIVITY
I ~Naval Uir Oyntems Cowtviad'None liavy Department
________ ___________ Washirigtrn, D. C.:k'P AUSI'MACT
nThree surface treatments'kwere investigated. oxidation treatments were founto be generally slow blit in some cases quite effective. Li~uid oxidations were Pre-ferred. Gaseou3 methods w~ere usually detrimental to the fiber tensile strengths. Theoxidation treatmnents appear to produce a carbon-like surfac4 on t"re fibers. Thesolution-reduction treatments were~ the most effective, producing composite shearstrengths up to 12,000 psiN the highest values reported to date for high-modulus (over50 million psi) fibers. - The method is extremely fast, requiring less than one minuteof residence time.,, This approach has commercial significance when compared withcurrently used oxidation treatment3 requiring several hours.
Ti~e characteristics of the. fiber surfaces were found to be related to the typeof fiber with high-modulus fibers having a graphite-like surface and lowe-r-modulusfibers exhibitinlg a carbon-like surface.,,,The nature of the surface carbon determinesto a large extent the reactivity of the surface to matrix resins and the resultingcomposite shear str!'mgth. Carbon-like surfaces'are Iinporkant for the develoynent Ofhigh composite shear strengths .- Several other factors,. such as surface area,functionality, and wettability, were found to play less important roles In compositeshear strengths.!
D D ORM147 PAEI UCtASSIFIED

I'UNCLASSIFIEDSecurity Classification
14. LINK A LINK- 0 LINK CKEY WORDSMOLC WT MOL[ WY MOLZ WT
Cc Wsite XaterialsCarbon FibersD-rface TreatmentRmsn Spectroscopy
It
DDAE I2O • 1473 (BACK) U-C- .i -(PAGE 2) Stcwlt, Clasification

NOLTR 71-165
I
CARBON FIBER SURFACE TREATMENTS
Prepared by:
J. V. LarsenT. G. Smith*
P..W. Erickson
ABSTRACT: Three surface treatments were investigated. Oxidation treatmentswere found to be generally slow but in some cases quite effective. Liquidoxidations were preferred. Gaseous methods were usually detrimental to thefiber tensile strengths. The oxidation treatments appear to produce a carbon-like surface on the fibers. The solution-reduction treatments were the mosteffective, producing composite shear strengths up to 12,000 psi, the highestvalues reported to date for high-modulus (over 50 million psi) fibers. Themethod is extremely fast, requiring less that one minute of residence time.This approach has commercial significance when compared with currently usedoxidation treatments requiring several hours.
The characteristice )f the fiber surfaces were found to be related to the typeof fiber with high-modulus fibers having a graphite-like surface and lower-modulus fibers exhibiting a carbon-like surface. The nature of the surfacecarbon determines to a large extent the reactivity of the surface to matrixresins and the resulting composite shear strength. Carbon-like surfaces reimportant for the development of high composite shear strengths. Several otherfactors, such as surface area, functionality, and wettability, were found toplay less important roles in composite shear strengths.
*Professor, Chemical Engineering Department, University of Maryland
Details of illustrations inthis document may be beti.r
studied on microfiche
APPROVED BY: F. Robert Barnet ChiefNion-Metallic Materials Division
CHE1ISTRY RESEARCH DEPARTMENTNAVAL ORDNANCE LABORATORY
SILVER SPRING, MARYLAND
i
NoIR 71-165
k
NOLTR 71-165 29 October 1971
Carbon Fiber Surface Treatments
This report describes the treatment of carbon fiber surfaces byoxidation, vapor deposition, and solution-reduction. The surfaces oftreated and untreated fibers are also characterized by various tech-niques. The method of resin coating the fibers and then pyrolyzingthe resin is the first method known to give high shear strengths onhigh-moduli fibers. Thus it represents a scientific break-throughin this field. Further development is now needed to optimize themethod and make it commercially feasible. Its further use in R & Don advanced composites for aircraft and other military hardwareshould be started at once.
This project was funded by the Naval Air Systems Command underTask A32 520/292/70 F 51-544-201. The work reported herein was con-ducted between September 1969 and July 1971. Portions of this reportare taken from the Doctoral Thesis of the principal author submittedto the Chemical Engineering Depart .ent at the University of Maryland.The thesis work was directed by Professor Theodore G. Smith in con-junction with the staff of the Non-Metallic Materials Division at NOL.
RERT WILMLASON 1Captain, USNCommander
By direction/ \/
II.-
N0I1R 71-165
CONTENTS
Page
INTRODUCTION . . . . . . . . . . . . . . . . . . . . . . . . 1
BACKGROUND ............ - . . . 4A) Fiber Surface and Surface Chemistry .......... 4B) Surface Treatments .................. 5
EXPERIMENTAL APPROACH ......... .......... 8A) Introduction . . . . . . . . . . . . . . . . . . . . . 8B) Surface Treatments .................. 8
1. Introduction . .......... ...... 82. Oxidation Methodh;............. 83. Vapor Deposition Methods . . . . . . . . . . . . . 104. Solution-Reduction Methods . . . .... 10
C) Characterization of Treated and Untreated Fibers. ... 141. Introduction . . . . . . . . . . . . . . . . . . 142. Surface Area . . . . . . . . . . . . . . . . .. 143. Surface Wettability . . . . . . . . . . . . . .. 144. Surface Morphology .. . . . . . . ....5. Gas Chromatograph Reactivity ......... . 156. Energy Dispersive X-Ray ............. 177. Raman Spectroscopy ................ 17
D) Testing . . . . . . . . . . 191. Tensile;Strenghs ................. 192. Shear Strengths . . . . . . . . . . . . 193. Fractography .............. ..... 19
RESULTS AND DISCUSSION . .................. 20A) Surface Treatments .o................ 20
1. Oxidation Methods . . o . . . . . . . . . o . . . . 202. Vapor Deposition Methods ............. 243. Solution-Reduction Methods . . . . . . . . . . . . 25
B) Fiber Surface Characterization . .. ......... 30lo Surface Structure .. ... . . . ... 30
a. Raman Spectroscopy . . . . . . . . . . . . . 30b. Surface Area . . . . . .. .... . .. . 37
2. Surface Reactivity .... ........... 39a. Gas Chromatograph Reactivity o . .. . . 39b. Wettability and Surface Energy . . . . . . . . 41
CONCLUSIONS AND RECOMMENDATIONS . . . . . . . o . o . . . . 42
REFERENCES .... . . . . . . . . . . . . . 44
I. iii

NOLTR 71-165
Page
APPENDIX B . . . . . . . . . . . . . . . . . . . . . . . A-I
APPENDIX B . . . . B-1
APPENDIX C .. .. .. .. .. .. .. .. .. .. ..... C-1
APPENDIX D .* . . . . . . . . .. *. .. . . . . . . ... . . D-i
APPENDIX E . . . . . . . . .. . . . . . . . . . . . . E-1
APPENDIX F . . . . . . . . . . . . . . . . . . .F-
ILLUSTRATIONS
Figure Title Page
1 Comparison of Carbon Fiber Composite. . . . . ... 2Properties with Other EngineeringMaterials
2 Shear Strength versus Treatment Time. . . . . . .. 7for the Sodium Hypochlorite OxidationTreatment
3 Schematic of Apparatus for Electrolytic ..... . 11Oxidation of Carbon Fiber Surfaces4 Schematic of Resistance Fiber Treater . . .. 12
5 Schematic of Solution Treatment Apparatus . 136 a. Schematic of Torsion Balance with Fiber Ring. .f. . 16
b. Detail of Wire Fixture Holding Fiber . . .... 167 a. Schematic of Laser Raman Instrument ........ 18
Showing Sample Positioningb. Detail of Fiber Specimen Holder . . . . .... . 18
8 Oxidation of Fiber Surfaces . .. .... .. . 22(Proposed Mechanism)
9 Micrographs of Fiber Surfaces Showing .f.. .. . . 23Oxidation
10 The Layer Pinning Theory . f.t. .f . .f. .f .. . 2611 Comparison of Raman Spectra of Various ...... 31
Graphites and Carbons
12 X-Ray Crystallite Size versus Raman ... . 32Intensity Ratio
13 Raman Peak Intensity Ratio (R) versus .. ..... 35Composite Shear Strength
14 Shear Strength versus Finer Modulus .f. .f . .f . . . 3615 Gas Chromatographic Reactivity of ... ... .. . 40
Treated and Untreated Carbon FibersA-i Surface Area Measurement . . ' .. f A-2B-1 Critical Surface Tensions of Fibers;. .. ... B-3
Determined by the Fiber Ring Method
NOLTR 71-165
TABLES
Table Title Page
1 Carbon Fibers and Their Mechanical Properties . . . . 92 Oxidation Treatment Results .... . ...... 213 Vapor Deposition and Solution-Reduction ....... 27
Treatment Results4 Chemical Composition Changes with . . . . . . . . . . 29
Solution-Reduction Treatments5 Raman Intensity Ratio (I1155/I1575) for . . . . . . . 33
Various Carbon Fibers an Graphites6 Surface Areas of Carbon Fibers - . . . . . . . . . . 38
Treated and Untreated
I
NOLTR 71-165
INTRODUCTION
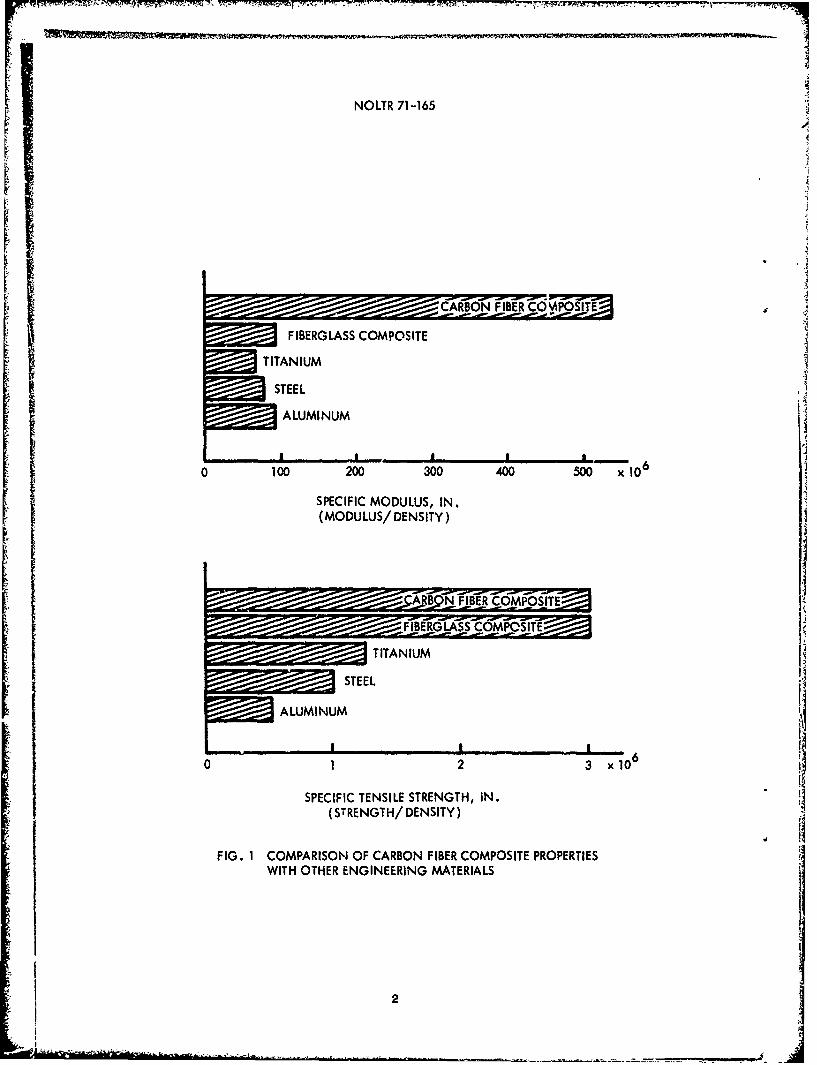
Carbon fibers are one of the most promising new materials of recentyears. Currently there is considerable interest in these high-modulus,high-strength filaments in developing technology for their use inreinforced plastics composites. The attractiveness of carbon fibercomposites can be seen when their specific properties (modulus andtensile strength) are compared with those of conventional engineeringmaterials (Figure 1). At the present time, the relatively high priceof the fibers (one to several hundred dollars per pound) has limitedtheir use to applications where weight saving is at a premium. Priceprojections, however, for large-scale production of the fibers havebeen as low as five dollars per pound (21). At lower prices, thefibers could profitably be used in many conventional applicationssuch as sports equipment, cables, commercial buildings, bridges, andeven automobiles.
Other properties of carbon fibers which are of particular interestare their thermal and chemical stability, electrical conductivity,low coefficients of friction and thermal expansion, high strengthretention in tensile cyclic fatigue, and resistance to moisture.Carbon fibers offer one other distinct advantage. They are availablewith a range of mechanical strengths so that fibers with specificdesirable properties can be chosen to advantage for a particularapplication. The fiber tensile strengths range from 200,000 psi toover 450,000 spi while the moduli range from 25 million psi to over80 million psi. Experimental fibers of 550,000 psi tensile strengthand 110 million psi modulus bave been fabricated (21). A reasonablegoal which is theoretically obtainable based on early work withgraphite whiskers (5) would be a fiber having 1 million psi tensilestrength and 100 million psi modulus (39).
High-modulus, high-strength fibers are produced by the pyrolysis ofrelatively inexpensive, commercially available polymeric textilefibers. Two precursor fibers which are most frequently used areRayon (cellulose) and polyacrylonitrile (PAN). The Rayon-based carbonfibers are commercially sold in continuous yarn form consisting cf1440 filaments each of which is approximately seven microns indiameter. PAN-based carbon fibers generally come in tow form (a towis a large bundle of filaments without twist) consisting of 10,000filaments. Recently PAN-based fibers have been introduced in the formof a hank (a large tow) containing 40,000 filaments and a small tow of5,000 filaments. Fibers made from other precursor materials such as
NOLTR 71-165
CARBONAS FIBEMPOSITETE
STITANIUM
STEEL
ALUMINUM
0 100 200 300 400 500 x10 6
SPECIFIC MODULUS, IN.(MODULUS/DENSITY)
• TITANIUM
STEEL
ALUMINUM
6Ix,
0 1 2 3 x10⁶
SPECIFIC TENSILE STRENGTH, IN.(STRENGTH/ DENSITY)
FIG. 1 COMPARISON OF CARBON FIBER COMPOSITE PROPERTIESWITH OTHER ENGINEERING MATERIALS
2 j

NOLTR 71-165
pitch (2), polybenzimidazole (21), polyvinyl alcohol (50), andphenolic fibers (KYNOL) (37) offer some promise but are not yetcommercially available.
In spite of the interest in carbon fibers, the promise they hold,and the technology developed so far towards their use in compositematerials, several problem areas still remain. The most significant
of these has been associated with the interface area and the develop-ment of strong fiber-resin bonds. The weak bond achieved between thematrix resin and the carbon fibers has been the subject of manyinvestigations but still the role of the many interacting factors isnot fully understood and is the subject of much debate. Typicallyinterlaminar shear strengths, which are a measure of the fiber-resinbond, in untreated carbon fiber-epoxy resin composites are around3500 psi. This compares with values of over 15,000 psi for otherreinforcing fibers (glass and boron) (25). The general approach tothe shear strength problem with carbon fibers has been through fibersurface treatments.
To date the surface treatment approach most widely used has beenoxidation of the fiber surface by a variety of processes. Suchtreatments have produced various desirable and undesirable results.Most of the oxidation treatments require long exposures to theoxidative environment which, on occasion, cause reductions in thefiber tensile strengths along with the increased composite shearstrengths.
The objective of this study was to develop further understandingconcerning the structure and surface of high-modulus, high-strengthcarbon fibers and with this understanding investigate new approachesto fiber surface treatments. The criteria for evaluation of thetreatment effectiveness were: 1) increased composite shear strengths(equivalent or superior to those of manufacturers), 2) little or nodecrease in fiber tensile strengths, and 3) short processing timesrequired to achieve the desired results.
The fiber structure was analyzed using scanning electron microscopy,transmission electron microscopy, and light microscopy (polarizedand sensitive tint). This work is reported in NOLTR 71-166 . Fibersurfaces were analyzed using Raman spectroscopy, gas chromatography,energy dispersive X-ray, and measurements of the fiber wettability,surface energy and Lurface area. Fibers were surface treated usingoxidation, vapor deposition, and solution-reduction techniques. Theeffects of the treatments on the fiber were investigated using Ramanspectroscopy, gas chromatography, and measurements of the surfaceenergy and surface area. The intent of this research was to improvethe overall performance of carbon fiber composites through betterunderstanding of the shear strength problem and specific methods toovercome it.
3

NOLTR 71-165
BACKGROUND
A)FIBER SURFACE AND SURFACE CHEMISTRY. Wo.ck concerning the fibersurface, surface chemistry, and surface treatments was initiatedbecause of the low interlaminar shear strengths developed in carbonfiber composites. This work has now branched into many areas anddisciplines.
Early work concerning the fiber surface consisted of the measurementof fiber surface areas. The results showed the area measured by BETnitrogen adsorption for untreated fibers to be 0.25 to 1.0 m2 /gm.(18,46,47). Various treatments produced two to ten-fold increasesin the surface area (47). These increases were often accompanied byincreases in composite shear strengths. Degassing of certain fibersat elevated temperatures produced increases in the measured surfaceareas but no increases in shear strengths of composites fabricatedfrom degassed fibers were observed (40). This would lead on to con-clude, and it has been verified by several investigators, that surfacearea of the fiber is not the only contributing factor towards compositeshear strengths (25,28). One reason the relationship between surfacearea and shear strength may not hold true is that the measured inireasein surface area is a result of pores having diameters of 6 to 20 (40).Such pores are too small for resin molecules to enter and, therefore,the effective surface area is much lower than the measured area.
Scanning photomicrographs of fiber surfaces reveal a surface whichis fairly rough on a microscale (46,47). The surface of the fibersappears to be somewhat smoothed by treatment in certain cases eventhough the surface area is increased. Again this is the case of areaincreases in very small pores. In high-magnification micrographs,the appearance of the surface is somewhat rougher (46).
Chemically the fiber surface contains one or more types of oxygen-containing function groups. Carboxyl and hydroxyl groups have beenmeasured in low concentrations on untreated fiber surfaces (30).Other functional groups which have been identified on carbon surfacesinclude carbonyl and lactone groups (28,47). Increased shearstrengths in composites have been attributed to increased function-ality on the fibers through surface treatments (29). However,investigators have treated fibers and shown increased shear strengthsalong with increased functionality, then destroyed the functionality,and still retained the improved composite shear strength (16).
I4
NOLTR 71-165
A new technique has recently been employed for characterizing fibersurfaces. This technique involves the use of Raman spectroscopy.From the Raman spectrum of a fiber, the form in which the carbon ispresent on the surface of the fiber, whether graphite or carbon, canbe determined (55,56). The apparent crystallite size and the rela-tive amount of edge dislocations, vacancies, and crystal edges can becalculated. A correlation between these and composite shear strengthsfor untreated fibers has been shown (56).
The final question concerniic, the fiber surface is its wettabilityby the resin matrix and the reactivity between the matrix resin andthe fiber surtace. To date these factors have not been fully exploredor quantitatively assessed. Investigations of fiber surface reactivityusing gas chromatography have shown that the fiber has an increasedaffinity for various adsorbent vapors (37,38). Certain treatmentsincreased while others decreaseA *he adsorption coefficients. Theadso' tion coefficients were no, -orrelated with fiber or compositeproperties.
The wettability of carbon fibers has been a difficult problembecause of measurement techniques. Early work was done indirectly
k by using graphite coupons rather than the fibers themselves (13,46).The degree to which a graphite coupon models the fiber surface isquestionable. Direct measurements of contact angles have beenattempted (47,62), but these results have not been conclusive. Onevalue which has been reported is 46 dynes/cm. (51). This value isvery near the value for the surface tension of common epoxy resins(44 dynes/cm.). Another new method, that of calculating contactangles from wicking rate measurements offers some promise (17). Thedifficulties in obtaining reliable measurements of the critical surfacetension of carbon fibers arise from the small diameters of the fila-ments, the irregular surfaces, and the inherent limitations of themethods themselves.
D)SURFACE TREATMENTS. Fiber surface treatments have been aimed atdeveloping higher composite shear strengths through altering thefiber surface. In the past, many of the treatment methods have beenguarded with utmost secrecy. The most frequently used methods can beclassed as oxidation treatments of two types--liquid and gaseous.The liquid oxidations can double the composite shear strengths withslight reductions (4 to 6%) in fiber tensile strengths (24). A
* .doubling of shear strength represents an increase from around 4000 psiSfor an untreated high-modulus fiber to 8000 psi. Common liquid oxi-
dation treatments are nitric acid boil, electrolytic oxidation withsodium hydroxide, and the British treatment with sodium hypochlorite(1,24,53). The gaseous oxidations affect the fiber differently inthat in some cases the fiber tensile strength is significantly reduced(12 to 25%) while the composite shear strength is not always improved(24,53). Typical gaseous oxidation treatments include air and ozone.
While a reasonable amount of success has been achieved by the manu-facturers using oxidation treatments, the treatment times are usuallyquite long (from several hours to several days). A qraph of shear
5
NOLTR 71-165
strength versus treatment time for the sodium hypochlorite oxidationis shown in Figure 2. Similar results have been shown for otheroxidation treatment3 (41).
Other approaches to fiber surface treatment have been investigated.Many of these have been-based on the addition of material to thefiber surface. Coupling agents, similar to those used on glass fiberswere not effective (28). Polymer coatings and metal coatings havealso been tried with little success (28,42). One successful approachhas been that of growing silicbn carbide whiskers of the fibers (48).With this method, increases in composite shear strengths and trans-verse tensile strengths have resulted.
6
Li

: I • . • .... • _ ;,•• • N..a"
NOLTR 71-165
10
z CLI-
-J 8
6
IraI . I I I I I I
0 2 4 8 16 24 48 72
TREATMENT TIME, HOURS
FIG. 2 SHEAR STRENGTH VS. TREATMENT TIME FOR THE SODIUMHYPOCHLORITE OXIDATION TREATMENT (1)
h7

NOLTR 71-165
EXPERIMENTAL APPROACH
A) INTRODUCTION. The fibers used in this investigation are listed inTable 1 along with their mechanical strengths. Not all of the fiberswere us-td in each phase of the study.
The size and orientation cf crystallites within a fiber determine,to a great extent, the mechanical properties cf the fiber. Moreimportant, the crystallite orientation at the surface along with pores,vacancies, and dislocations determine the condition of the surfacewith respect to resin bonding. Since most attempts at shear strengthimprovement are based on improved resin bonding through modificationof the fiber surface, it is important that the surface be as welldefined as possible. With a better understanding of the fiber surface,approaches to more effective treatments become evident. Our experi-mental approach has been based on this philosophy.
B) SURFACE TREATMENTS
1. Introduction. Surface treatments of three basic types wereinvestigated; oxidation, vapor deposition, and solution reduction.".'he oxidation treatments were generally of the batch type and requiredlong exposures. The other treatments were mede as continuous aspossible in order to arrive at treatments which could be a part of acontinuous fabrication process with a minimum residence time. Thefibers used for treatments were untreated as received from the manu-facturers.
2. Oxidation Methods. Oxidation tieatments can be divided intoliquid and gaseous treatments. The three liquid methods investigatedwere the nitric acid boil, sodium hypochlorite, anad electrolytic NaOH.The first two use essentially the same procedure. The fibers werewound on glass spools and immersed in the oxidizing solution atelevated temperatures for a period of time. In the nitric acid boil,the fibers were immersed ir 60% aqueous nitric acid at 120*C refluxingtemperature for periods of 3 to 60 hours. The fibers were thenwashed to remove all traces of the acid. Since previous work hadbeen done using this method (24,41), fibers were treated only toanalyze the effects of the oxidation to the fiber surface. in thesodium hypochlorite treatment, solutions of 5.5% to 10% (ph 5.5) havebeen studied by other investigators (16,24). Exposures up to 72 hoursare required at 45WC to achieve sufficient oxidation of the surface.Addition of acetic acid to form hypochlorous acid reduces the time (1).
'.1 - * -. 8 -

TABLE 1
CARBON FIBERS AND THEIR MECHANICAL PROPERTIES
(Manufacturer's Stated Values)
Fiber Tensile Ultimate CompositeModulus Tensile Shear
Strength3 Strengthpsi x 10 -6 psi x i0"-3 psi
HMG 50 treated* 45-53 200-275 7000
(Rayon)untreated 45-53 230-330 4000
Thornel 50 treated* 45-55 175-220 7500
(Rayon)untreated 45-55 230-285 3500
Courtalds HMS* 50-60 250-350 8500
(PAN)HM 50-60 250-350 3000
HTS* 32-40 300-400 14000
HT 32-40 300-400 6500
Modmor I treated* 55-65 200-300 8000
(PAN)I untreated 55-65 200-300 3000
II treated* 35-45 350-450 15000
II untreated 35-45 350-450 7000
Fortafil 6T treated* 60 400 800U
(PAN)Thornel 75S treated* 75 400-425 6000
(Rayon)VYB untreated 6 170 13000
*Treated in this case refers to the as-received fibers
with the proprietary surface treatments of the
manufacturers
9

NOLTR 71-165
Since this process is used commercially, manufacturer treated fiberswere used for the investigation of the treatment effects on the fibers.
The electrolytic NaOH treatment differs from the other two liquidoxidations in that it is a continuous method. A 5% NaOH electrolyticsolution was used with a three minute residence time. With thisresidence time, currents up to 1.0 amps were required to achieve
sufficient current densities. An optimum current density had beensuggested by other investigators (53). A schematic of the electro-lytic oxidation apparatus is shown in Figure 3. The pull-through ratewas 10.5 feet per minute with a residence time of 25 seconds in thedrying tube at 15 0 °F. Electrolytic oxidations were evaluated foreffects on the fiber surfaces and the fiber mechanical strengths.
Gaseous oxidations using air, ozone, and RF plasma have been inves-tigated (24). Generally these treatments have not been as successfulas other methods because of the resulting decreases in the fibertensile strengths. Therefore, they were not considered in this program.Recent information, however, indicates that moist air oxidations caneffectively increase shear strengths without reducing the fiber tensile Istrengths (60).
3. Vapor Deposition Methods. Three vapor deposition treatmentswere investigated. The first two (SiC and FeC) were accomplishedusing a gas generator while the third (CH4 ) was done directly from thegas phase. The gas generator used was merely a flask partially filledwith solution into which a carrier gas, nitrogen or argon, was bubbled.The solutions were silicon hydride for the SiC treatment and ironpentacarbonyl for the FeC treatment. The exit gases from the flaskpassed into a resistance treater (Figure 4). The fibers passed con-tinuously through the treater where they were heated to the desiredtemperatures (400-1600*C) by applied current across the graphitepulleys. For fiber yarns 1.5 to 3.0 amps were required while towsrequired 15 to 20 amps. The fiber temperature was measured using anoptical pyrometer. Pull-through rates of fibers through the treaterwere 10.5 and 5.25 feet per minute giving residence times of 6 seconds
rand 12 seconds respectively. Variour treatment temperatures and gasflow rates were also investigated. Tor the methane treatments, themethane gas was introduced directly into the carrier gas stream andthe methane decomposed upon contact with the hot fiber (1200*C).Fiber tensile strengths and composite shear strengths were measuredfor vapor deposition treated fibers.
4. Solution-Reduction Methods. The solution-reduction treatmentswere generally two-step methods where the fiber was passed through asolution and dried in the first step. In the second step, the fiberwas heated and the material which had been deposited on the surfacewas thermally decomposed forming decomposition products which couldreact with the carbon fiber. The equipment utilized to accomplish thetwo steps was the treatment section shown in Figure 5 and the reactionsection previously shown in Figure 4. In the treatment section, thefiber was passed through the solution then through a heated dryingtube to remove the solvent. Warm air passed through the tube
10

NOLTR 71-165
LU LU
00
ce. I-
II.
Ln Lu4
0 xu
LUJ
Q IL
00
UU

ILI
NO LTR 71-165
00
V I o1z u w
< LUILLUU
tA
LU
-Js
00C-%na-
12

NOLTR 71-165
0
z
z.
zz
ui 0
00
a-A4 0
S 4..
13

NOLTR 71-165
.countercurrent to the direction of fiber travel. (See Appendix E fordetails of treatment parameters). In the reaction section, the processwas similar to the vapor deposition treatments except an inert carriergas was used. The gas was introduced at 3 liters per minute for10 minutes prior to treatment in order to purge the oxygen from thesystem. The solution treatments which were successful were ferricchloride (1% to 5% in benzene and in water), ferrocene (1% to 3% intoluene), and phenylated polyquinoxaline (PPQ) (0.1% in chloroform).Other treatments which were not as successful were ammonium ferrocyanide,ferric oxalate, ferric citrate, ferrous ammonium sulphate, andchromium acetylacetonate. The successful treatments were evaluatedfor effects on the fiber and composite.
C)CHARACTERIZATION OF TREATED AND UNTREATED FIBERS
1. Introduction. Various methods were used to characterize thephysical, chemical, and surface properties of fibers and the treat-ments applied to them. The methods were aimed at gaining a broadunderstanding of the fiber surface and the effects which could bemeasured from treatments to the surface.
2. Surface Area. Surface areas were determined from kryptonadsorption isotherms. A standard volumetric apparatus for makingsuch measurements, located at the Naval Research Laboratories,Washington, D. C., was used for these measurements. The surface areaswere calculated using the Brunauer, Emmett, and Teller (BET) equations(45). A detailed explanation of the method is given in Appendix A.Comparisons were made between surfac- areas of treated and untreatedfibers.
3. Surface Wettability. In order for strong bonds to formbetween the carbon fibers and the resin matrix, it is essential thatthe liquid resin adequately wets the fibers, producing a large inter-facial area of intimate contact. Su-h a condition will occurspontaneously when the surface energy of the fiber exceeds that of theliquid resin (63). Determination of the liquid resin surface tensionis a straight forward procedure. A Cenco-du Nouy Tensiometer ringmethod was used (14). Several different standard methods wereattempted for measuring the critical surface tensions of the fibers.Because of the small diameter of the carbon filaments (7-10 microns),the standard contact angle method is difficult to use (47). Measure-ments using this method vary from 12' (10) to 720 (62). Criticalsurface tensions estimated from these values would range from40 dynes/cm. to 25 dynes/cm. A floatation method has been suggestedas a means of determining fiber critical surface tensions (47).Problems associated with this method arise from the small differencesbetween the fiber density and the floatation liquid densities, theirregular fiber surfaces, and the large area to volume ratio of thefibers.
A new method was devei.-ed to measure the critical surface tensionof carbon fibers. It is similar to the ring method of determiningsurface tensions of liquids where a platinum ring is used which is
14

NOLTR 71-165
completely wet by the liquids. To determine the critical surfacetensions of fibers, a small strand of fibers was mounted to a wirefixture such that it formed a triangle (Figure 6). This ring of fiberwas then calibrated with liquids of known surface tensions using thestandard torsion balance ring procedure for surface tension determina-tions. A calibration constant was determined for liquids which havelow enough surface tensions to wet the fibers. (See Appendix B fora complete discussion of the method). Surface tensions of otherliquids and matrix resins were then measured using the fibez ring andthe measured values were plotted against the known values. Such aplot is linear to the point where the liquid does not spontaneouslyand completely wet the fiber, at which point there is a change in theslope of the line. There are several difficulties with this method:the fiber must be cleaned and dried after each measurement as moistureor solvent of the fiber surface drastically affects the measurements;it is somewhat tedious to mount the fibers on the wire fixture; andthe plane formed by the triangle of fibers is difficult to alignparallel to the surface of the measurement liquid. These difficulties,however, are not insurmountable. It was found that the slope of theline on the wettability plot in the region where the liquid does notwet the fibers is a function of the type of fibers being measured.The wettabilities of treated and untreated fibers were compared.
4. Surface Morphology. Fiber surface morphologies of treatedand untreated fibers were determined using scanning and transmissionelectron microscopy. Since much work has previously been done onuntreated fibers, the bulk of the effort was concentrated on thefiber surfaces after treatment. Fibers were prepared for SEM viewingby mounting on a stub with conductive silver paint and depositing by.vapor evaporation first a thin layer of carbon and then a thin (200 A)layer of gold on the fibers to render them conductive. The carbonlayer is necessary since the fiber surfaces are irregular and ofsmall diameter. Carbon migrates into areas where the gold will not.The fibers were then viewed in an Ultrascan SM-2 SEM using standardtechniques (35). Fibers were prepared for TEM viewing by replication.Cellulose acetate was applied to the fiber surface, stripped, andshadowed with chromium and then carbon backing. The coated plasticwas placed on a microscope grid and the plastic dissolved with acetoneleaving the thin replicate for viewing.
5. Gas Chromatograph Reactivity. One method of measuring thereactivity of a fiber surface is to use the fiber as packing in a gaschromatugraph column. Various vapors are passed through the column,and the affinity of the fiber packing for these adsorbate vapors canbe measured by the pulse retention time represented by the peak basewidth (11). (See Appendix C for details). The adsorption coefficient,K, calculated from the peak width is a measure of the retention volumeor time it takes a vapor flowing at a given rate to adsorb onto thefibers and subsequently desorb. Columns of glass six feet long andeight millimeters in diameter were packed with seven grams of fiber.The continuous fibers were packed into the column using vacuum suctionon one end. The measurements of reactivity were made using anF&M 720 Dual Column gas chromatograph. Six adsorbate vapors consisting
15

NOLTR 711-165
BALANCE ARM DIAL INDICATOR(CONNECTED TO
TORSION WIRE)
SURAC TENSION
LQUID
FIG. 6a SCHEMATIC OF TORSION BALANCE WiTH FIBER RING
WIRE FIXTURE
FIBER RING
FIG. 6b DETAIL OF WIRE FIXTURE HOLDING FIBER
161

NOLTR 71-165
of compounds containing no oxygen groups; n-hexane, and compoundscontaining different kinds of oxygen bound groups; methyl alcohol,ethyl ether, acetic acid, ethylene glycol, and water, were injectedin 1 microliter pulses into the column. The adsorption coefficientsat room temperature, 120 0 C and 220 0 C for treated and untreated fiberswere calculated and compared.
6. Energy Dispersive X-Ray. Wavelength dispersive X-ray has beena standard method for analyzing fiber structure. Energy dispersiveX-ray is a siwilar method of materials analysis in which the energiesof the characteristic X-rays are analyzed rather than the wavelengthsat which they are produced. Energy dispersive X-ray analysis was usedin conjunction with the scanning microscope using the electron beamin the microscope as the X-ray exciter. Surfaces of treated fiberscontaining detectable elements, (elements below Na are not detectable)especially Fe and Si, were examined. The output from the NuclearDiodes EDAX 504-A X-ray analyzer was fed back into the microscopeelectronics to be displayed on the CRT to determijie the distributionof the elements of interest on the fiber surface.
7. Raman Spectroscopy. Raman spectroscopy has been shown to bea useful tool fcr identifying carbon in its various forms (55). Theadvent of the laser as a powerful light source has made the Ramanspectroscopy of carbons and graphites possible. Materials which arecompletely graphitic, natural Yraphite single crystals, exhibit asingle Raman peak at 1575 cm.- . ?ther forms of graphites and carbons
exhibit a second peak at 1355 cm.- with the intensity of this peakproportional to the amount of non-graphitic carbon in the specimen Iand inversely a function of the graphite crystal size (55). Fr ,m therelative intensities of the two peaks, the average apparent crystalsize on the specimen surface can be calculated. (See Appendix D fora more detailed discussion). Since the las r beam does not penetratedeeply into the specimen due to the hifrh extinction coefficient ofgraphite, a thin surface layer is the only contributor of signal.For carbon fibers, the intensity ratio of the two peaks has been N
related to the crystal size on the surface and the amount of crystalboundary, edge dislocations, and vacancies on the surface (56).Treated and untreated fibers were mounted on special holders whichwould hold the fibers stable in the laser beam. The fibers weremounted such that they were in the plane formed by the beam, thespecimen, and the spectrometer. They were placed at a low angle (200) 1to the incoming beam (Figure 7). The light source was a 1000 mWCoherent Radiation Ar-ion laser with a Spex 1401 double monochrometer |spectrometer monitoring the radiation from the specimen. A largebundle of fibers (1000-2000 filaments) was used and the laser powerhad to b adjusted so as not to burn the fibers. A rejection filterof 4880 A light (the wavelength of the laser beam) was used at theentrance slits of the spectrometer to eliminate background "ghosts"in the region of interest. It was essential that the surface of thefiber be located at the focal point of the objective lens and thatthe signal be focused on the slits of the spectrometer. Spectra wererun for treated and untreated fibers of several different types.
17

NOLTR 71-165
SPECIMEN CHAMBERSAMPLE
FOCUSING LENS
SPECTROMETER
OBJECTIVE LENS
PRISM LASER LIGHT SOURCE
FIG. 7a SCHEMATIC OF LASER RAMAN INSTRUMENT SHOWING SAMPLE POSITIONING
F. DE LOF -FIBER
FIG. 7b DETAIL OF FIBER SPECIMEN HOLDER (TWO VIEWS)
I

NOLTR 71-165
D)TESTING
1. rensile Strengths. Fiber tensile strengths were determinedfrom a standard strand test (3). The fiber yarn or tow was dippedinto a resin bath, removed and drained, and cured under tension.(See Appendix F for resin formulations and curing cycles). The curedstrands were cut into 8-inch long sections. Cardboard tabs were bondedon the strands to form the desired guage length (2 inches) and topermit better gripping of the strands in the testing equipment.Seven to ten replicates of each specimen were tested in an Instrontesting machine. Fiber tensile strengths were calculated from thefiber cross-sectional area (determined from the fiber density andweight per unit length) and the breaking load.
2. Shear Strengths. Composite interlaminar shear strengths weremeasured using the short beam method on specimens cut fr(mc NOL rings(32). Specimens 0.25 inches wide were machined to a 0.5 inch guagelength and 0.125 inches thick. This gives a span/depth ratio of4:1 rather than the usual 5:1. Such a ratio was necessary to preventflexural failures in the specimen and to insure true shear breaks.In composites where the shear strengths were above 11,000 psi,flexural failures often occurred anyway. For these cases, the trueshear strengths are higher than the calculated values. The specimens(5 rerLicates of each) were tested under three-point shear loadingsin a Baldwin testing machine (32). The shear strengths were calculatedfrom the breaking loads and the cross-sectional areas of the fibers(shear strength = 3/4 load/area). Surface treatments were firstevaluated for their effects on composite shear strengths.
3. Fractography. Studies were made of shear failures in compositesto determine the location of failure, whether in the matrix resin, inthe fiber-resin interface, or within the outer layers of the fibers.Fractured specimens were examined in the SEM to determine if anytraces of resin remained bonded to the fibers as is often seen inglass fiber composite shear fractures (35). Specimens were alsoprepared such that under tensile loading the fiber bundle would shearor pull out o- the surrounding resin tab. The shear surface of theresin was then examined using Raman spectroscopy to determine if anythin layers of carbon or graphite remained bodAed to the resin, thusindicating failures within the fibers themselves.
19
NOLTR 71-165
RESULTS AND DISCUSSION
A) SURFACE TLEATMENTS
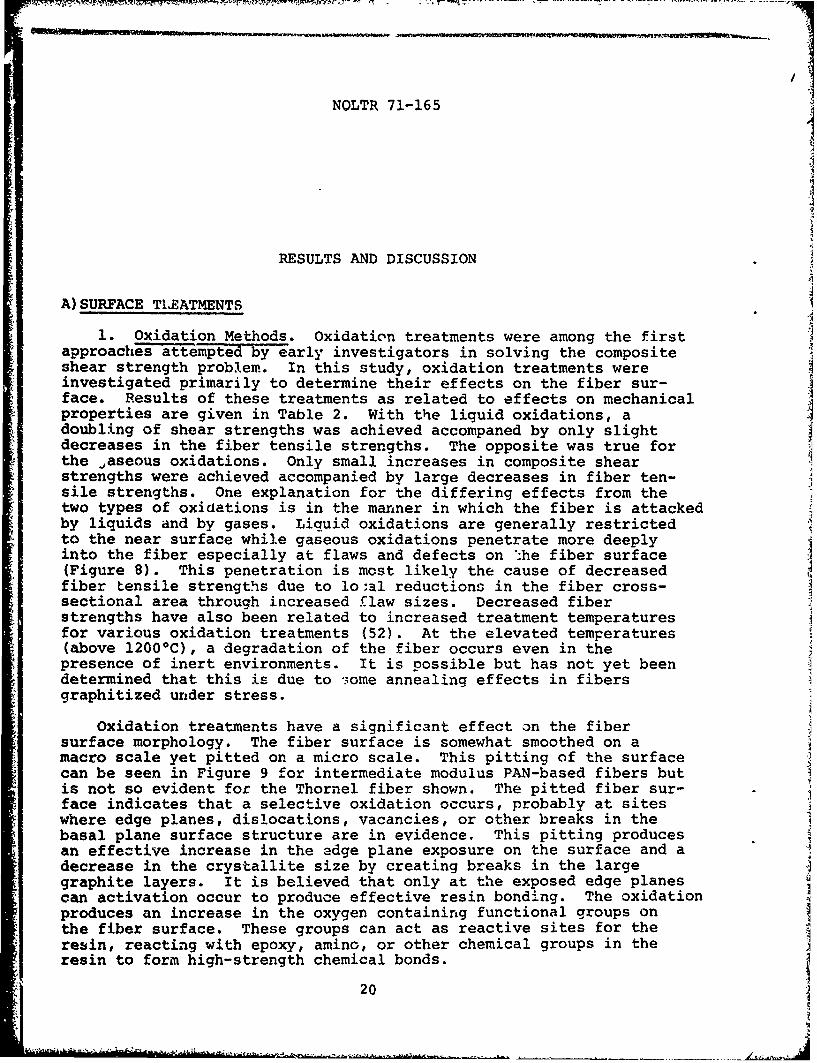
1. Oxidation Methods. Oxidation treatments were among the firstapproaches attempted by early investigators in solving the compositeshear strength problem. In this study, oxidation treatments wereinvestigated primarily to determine their effects on the fiber sur-face. Results of these treatments as related to effects on mechanicalproperties are given in Table 2. With the liquid oxidations, adoubling of shear strengths was achieved accompaned by only slightdecreases in the fiber tensile strengths. The opposite was true forthe Jaseous oxidations. Only small increases in composite shearstrengths were achieved accompanied by large decreases in fiber ten-sile strengths. One explanation for the differing effects from thetwo types of oxidations is in the manner in which the fiber is attackedby liquids and by gases. Liquid oxidations are generally restrictedto the near surface while gaseous oxidations penetrate more deeplyinto the fiber especially at flaws and defects on *.he fiber surface(Figure 8). This penetration is most likely the cause of decreasedfiber tensile strengths due to o:al reductions in the fiber cross-sectional area through increased flaw sizes. Decreased fiberstrengths have also been related to increased treatment temperaturesfor various oxidation treatments (52). At the elevated temperatures(above 12000C), a degradation of the fiber occurs even in thepresence of inert environments. It is possible but has not yet beendetermined that this is due to -3ome annealing effects in fibersgraphitized under stress.
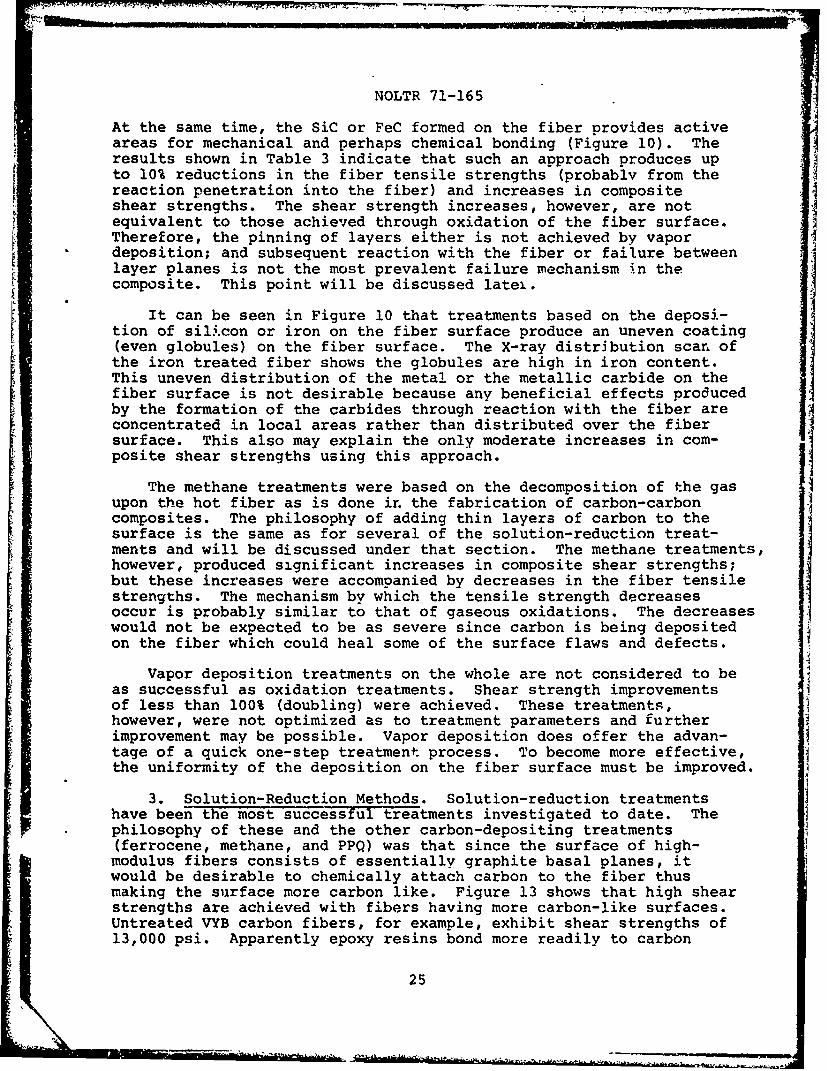
Oxidation treatments have a significant effect on the fibersurface morphology. The fiber surface is somewhat smoothed on amacro scale yet pitted on a micro scale. This pitting of the surfacecan be seen in Figure 9 for intermediate modulus PAN-based fibers butis not so evident for the Thornel fiber shown. The pitted fiber sur-face indicates that a selective oxidation occurs, probably at siteswhere edge planes, dislocations, vacancies, or other breaks in thebasal plane surface structure are in evidence. This pitting producesan effective increase in the adge plane exposure on the surface and adecrease in the crystallite size by creating breaks in the largegraphite layers. It is believed that only at the exposed edge planescan activation occur to produce effective resin bonding. The oxidationproduces an increase in the oxygen containing functional groups onthe fiber surface. These groups can act as reactive sites for theresin, reacting with epoxy, amino, or other chemical groups in theresin to form high-strength chemical bonds.
20S

NOLTR 71-165
TABLE 2
L• OXIDATION TREATMENT RESULTS
Oxidation Method Average AverageTensile Strength Shear Strength
Effect Effect
Liouid
HNO 3 Boil -6% +100%
Electrolytic NaOH -4% +120%
SodiumHypochlorite* - +100%
Gaseous
Air** -23% + 0.6%
RF Plasma -12% + 10%
* Manufacturer treatment
** Better results have been obtained by other investigatorsusing air oxidations
Notes: The above results are based on the following untreatedfiber properties for HMG-50 and Thornel 50 fibers--
Tensile Strength 265,000 to 285,000 psi
Composite Shear Strength 3800 to 4200 psi
21

NO'LTR 71-165
luLuuII"
Ine
Lu
LU cc
Lu.
0 L0
U 0 An 0
M x IALL. 0 :3I0 0
u Ji

I wr:~ 2 -
NOLTR 71-165
do Surface of Intermediate Modulus PAN-Based Fiber II Oxidation Surface Treated by the Manufacturer
bo Srfac ofThorel iberSurfce reatd btha MnufaturePIWM9 MCROGAPH OFFIBE SUFACE SHWIN
OXIDTION(40,00 XI2

NOLTR 71-165
Both the nitric acid boil and the electrolytic sodium hydroxidetreatments produced around 5% decreases in the fiber tensile strengths.The air and plasma oxidations produced even greater strength decreases(over 10%) and only slight increases (less than 10%) in compositeshear strengths. The manufacturer oxidation treatments of high-modulusfibers (50-75 million psi) produce essentially the same results as theliquid oxidations studied; i.e., doubling of composite shear strengthswith little or no decrease in fiber tensile strengths. With theintermediate-modulus fibers, the manufacturer oxidation treatmentsare more effective. In the first place, the untreated fiber compositesexhibit higher shear strengths (around 6000 psi) than the high modulusfibers (around 3500 psi). After treatment, the intermediate-modulusfibers can exhibit composite shear strength values of 14,000 to16,000 psi. These values are in the same range as glass and boronfibers and are considered adequate.
The results from oxidation treatments on high-modulus fibers arenot considered to be good enough. Part of the problem lies in thelower tensile strengths of some high-modulus fibers. In compositesthe stress needed to produce shear failures in the 10,000 to 15,000 psirange would also produce tensile stresses in the fibers above theirultimate tensile strengths and, therefore, failures would be tensilerather than shear. The 8000 psi shear strengths exhibited bytreated high-modulus fibers lie somewhat below the point where ten-sile failures occur first and, therefore, an increase in the shearstrengths to over 10,000 psi could be effective in improving thecomposite performance. This is especially true in compressiveapplications where compressive strength (which is very low in carbonfiber composites) is proportional to the shear strength.
Oxidation treatments have one further shortcoming; that of lengthyresidence time requirements (up to 72 hours) which practicallynecessitates batch processing. One factor in the high cost of thefibers is certainly the time required to produce the fibers andeffectively treat them. Considerable reductions in the treatmenttime should effectively reduce the cost of the fibers. Oxidationtreatments, therefore, could be considered impractical as far asimproved processing is concerned. When the effectiveness of thetreatments in improving composite shear strengths is considered,oxidation treatments can be classed as marginally effective.
2. Vapor Deposition Methods. Other treatment methods investigatedwere aimed at introducing a coupling agent on the fiber surface whichbonds to the fiber and to which the resin matrix can bond. Vapordeposition and solution-reduction treatment results are presented inTable 3. The silicon and iron vapor deposition treatments along withthe FeCI 3 solution-reduction treatment were partially based on theassumption that relatively weak Van der Waals forces exist betweenlayer planes. Even if good bonding was achieved to outer layers, the Iinherent shear strength within the fiber itself may be so poor thatshear failures between layer planes could easily occur. Iron andsilicon were deposited on the fiber surface so that they could reactwith the fiber such that the outer layers would be pinned together.
24
NOLTR 71-165
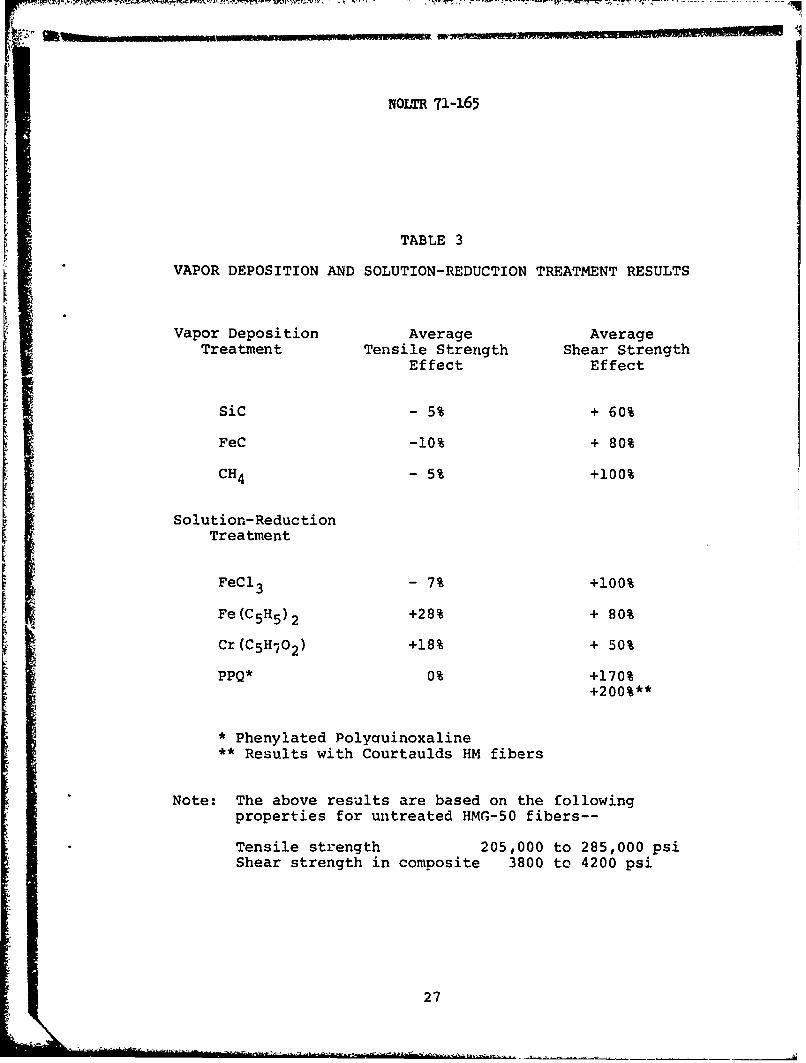
At the same time, the SiC or FeC formed on the fiber provides activeareas for mechanical and perhaps chemical bonding (Figure 10). Theresults shown in Table 3 indicate that such an approach produces upto 10% reductions in the fiber tensile strengths (probably from thereaction penetration into the fiber) and increases in compositeshear strengths. The shear strength increases, however, are notequivalent to those achieved through oxidation of the fiber surface.Therefore, the pinning of layers either is not achieved by vapor"deposition; and subsequent reaction with the fiber or failure betweenlayer planes is not the most prevalent failure mechanism in thecomposite. This point will be discussed latei.
It can be seen in Figure 10 that treatments based on the deposi-tion of sili.con or iron on the fiber surface produce an uneven coating(even globules) on the fiber surface. The X-ray distribution scan ofthe iron treated fiber shows the globules are high in iron content.This uneven distribution of the metal or the metallic carbide on thefiber surface is not desirable because any beneficial effects produced
by the formation of the carbides through reaction with the fiber areconcentrated in local areas rather than distributed over the fibersurface. This also may explain the only moderate increases in com-posite shear strengths using this approach.
The methane treatments were based on the decomposition of the gasupon the hot fiber as is done i. the fabrication of carbon-carboncomposites. The philosophy of adding thin layers of carbon to thesurface is the same as for several of the solution-reduction treat-ments and will be discussed under that section. The methane treatments,however, produced significant increases in composite shear strengths;but these increases were accompanied by decreases in the fiber tensilestrengths. The mechanism by which the tensile strength decreasesoccur is probably similar to that of gaseous oxidations. The decreaseswould not be expected to be as severe since carbon is being depositedon the fiber which could heal some of the surface flaws and defects.
Vapor deposition treatments on the whole are not considered to beas successful as oxidation treatments. Shear strength improvementsof less than 100% (doubling) were achieved. These treatments,however, were not optimized as to treatment parameters and furtherimprovement may be possible. Vapor deposition does offer the advan-tage of a quick one-step treatment process. To become more effective,the uniformity of the deposition on the fiber surface must be improved.
3. Solution-Reduction Methods. Solution-reduction treatmentshave been the most successful treatments investigated to date. Thephilosophy of these and the other carbon-depositing treatments(ferrocene, methane, and PPQ) was that since the surface of high-modulus fibers consists of essentially graphite basal planes, itwould be desirable to chemically attach carbon to the fiber thusmaking the surface more carbon like. Figure 13 shows that high shearstrengths are achieved with fibers having more carbon-like surfaces.Untreated VYB carbon fibers, for example, exhibit shear strengths of13,000 psi. Apparently epoxy resins bond more readily to carbon
25

NOLTR 71-165
/'uo141
44~r
"A4 it!
I,0
Cu,, If
Ir~4
0q4i
0zrz 12
04 0
26I
'i - ---
I P
NOLTR 71-165
TABLE 3
VAPOR DEPOSITION AND SOLUTION-REDUCTION TREATMENT RESULTS
Vapor Deposition Average AverageTreatment Tensile Strength Shear Strength
Effect Effect
sic - 5% + 60%
FeC -10% + 80%
CH4 - 5% +100%
Solution-ReductionTreatment
FeCI 3 - 7% +100%
Fe(C 5 H5 ) 2 +28% + 80%
Cr(C 5 HT0 2 ) +18% + 50%
PPQ* 0% +170%+200%**
* Phenylated Polycuinoxaline** Results with Courtaulds HM fibers
Note: The above results are based on the followingproperties for untreated HMG-50 fibers--
Tensile strength 205,000 to 285,000 psiShear strength in composite 3800 to 4200 psi
27

NOLTR 71-165
surfaces because of the presence of more reactive sites. On graphiticfibers, the thin carbon layer on the surface acts as a coupling agentbetween the fiber and the epoxy resin much like the silane couplingagents for glass fibers. The results of the carbon depositing treat-ments shown in Table 3 bear this out. With the PPQ treatment, (PPQis an acronym for phenylated polyquinoxaline resin - reference 4)shear strengths of 11,000 psi were achieved with HMG-50 fiber and12,000 psi with Courtaulds HM fiber. These are among the highestshear strength values reported for high-modulus carbon fibers. PPQhas a high char yield upon thermal decomposition. The formation ofthis char on the surface modifies both the chemistry and structureof the fiber surface.
Table 4 shows the changes in carbon, hydrogen, and oxygen producedwith the PPQ treatment. With both fibers, the oxygen content issubstantially increased by the treatment. The oxygen, bound infunctional groups, may not be reactive to epoxy resins. Investigatorshave shown that increased functionality does not necessarily meanincreased composite shear strengths. In the table, the values foroxygen and hydrogen are compared with values for VYB low-moduluscarbon fiber. The increased oxygen on the fiber surface may berelated to improved resin bonding and higher shear strengths, but itis apparent that oxygen or hydrogen content alone do not account forthe improvement. The VYB fiber, which contains 15 times more oxygenand 8 times more hydrogen than either of the treated fibers, exhibitsonly slightly higher snear strengths. The untreated fibers, on theother hand, contain only about 1/8 the amount of oxygen as the treatedfiber yet exhibit about 1/3 the shear strengths. Of course, oxygencontent may be essential in the forming of bonds only up to a givenlevel, above which increased oxygen content does little good.
The PPQ treatment was generally done by applications of the resinfrom dilute (0.1%) solutions in chloroform. Concentrations otherthan the 0.1% were investigated, but the results were not as satis-factory. A 0.2% solution produces bridges between the fibers afterdecomposition, thus forming a kind of carbon-carbon composite. Theresult was a reduction in fiber tensile strengths and composite shearstrengths. The reduction in tensile strengths may be due to too muchreaction between the decomposing polymer and the fiber. The decreasesin composite shear strengths occur because the bridging between fibersprevents the resin matrix from penetrating the fiber bundle. A 0.05%solution treatment did not achieve shear strenqth improvementsequivalent to the 0.1% solution. With such a dilute solution, thecarbon coverage of the fiber surface is probably not adequate.
The organometallic complexes (ferrocene and others) were tried asanother attempt to introduce carbon onto the fiber surface, this timein the presence of a catalyst. The results obtained with thisapproach showed moderate increases in composite shear strengthsaccompanied by significant increases in the fiber tensile strengths.This was the first time that increased tensile strengths resultedfrom fiber treatments and can be explained by the flaw sensitivityof the fibers. The reaction of the carbon on the fiber surface,
28

___ ,_______ ,-:• • /• • • - -" ' L • ' •. . -••". • - • ... - :- •'• . .
NOJJDR 71-165
TABLE 4
CHEMICAL COMPOSITION CHANGES WITH
SOLUTION-REDUCTION TREATMENTS
SC% H% 0%*
HM Untreated as received 99.7% 0.17% 0.1%
HM PPQ treated 99.1 0.15 0.7
HMG-50 Untreated as received 99.8 0.10 0.1
HMG-50 PPQ treated 98.9 0.18 0.9
VYB Untreated as received 82.9 1.43 15.7
* Oxygen by difference
29
------------------------

NOLTR 71-165
especially in the presence of the metallic catalyst, evidentlv actsto smooth and heal some surface flaws and defects. This flaw healingis apparently opposed hv the degradation of the fiber with increasedtreatment temperature. Treatments made above 12001C did not produceincreased tensile strengths. Those below 800 0 C, the decompositiontemperature of ferrocene, had no significant effect on the shear ortensile strengths. All organometallic complex treatments at tempera-tures above 800 0 C produced increased composite shear strengths. Theincreases, however, were not as great as with the PPQ polymer treat-ment. These complex treatments, however, are attractive where hightensile strengths along with moderate shear strengths are requiredwith a high-modulus fiber. Resultant changes in the fiber surfacestructure from these and other treatments are discussed later.
The methane method of depositing carbon, being a vapor treatment,resulted in reduced fiber tensile strengths similar to those exhibitedby the gaseous oxidations. The doubling of shear strength was equi-valent to several other treatment methods, but the reduced tensilestrength is not desirable.
B)FIBER SURFACE CHARACTERIZATION
1. Surface Structure. As can readily be seen from Figures 6, 16,and 21, the arrangement of crystallites at the surface of carbonfibers is parallel to the fiber surface. It has been shown by otherinvestigators that the crystallites are also parallel to the fiberaxis (13,23). Thus the fiber presents primarily a basal plane surface.It therefore becomes evident that the smaller the crvstallites, thegreater will be the number of edges which are available for resinbonding (resins cannot bond well to basal surfaces). Also, withlarge crystallites, some of the surface areas are held to the fibercore by relatively weak interlayer forces. This presents the problemthat even when good bonding to the outer layers is achieved, compositeshear strengths may be low due to interlayer failures. It would bedesirable to have more bridges bonding the outer layers to the innerfiber core. This can be most easily achieved when the crvstallitesare smaller.
Sa. Raman Spectroscopy. Raman spectroscopy is one method ofdetermining the crystallite size on carbon fiber surfaces. Typicalspectra of treated and untreated fibers and qraphites are shown inFigure 11. The increase in Raman activity at 1355 cm.-I (induced bycrystal edge effects) is evident for the less graphitic, more carbon-like specimens. The relationship of the intensity ratio of the twopeaks shown in these spectra to apparent crystallite size on thesurface of the specimen is shown in Figure 12 (55,56). nrowth in the1355 cm.. peak intensity reflects a decrease in apparent crystallitesize. Large differences in cr stallite size as measured by Ramanspectroscopy were found between fiber types with a range from 42 to220 A (Table 5). The spectra of high-modulus fibers are similar to Ithose of coimnercial graphite indicating a graphite-type surfacestructure. Intermediate and low-modulus fibers exhibit spectrasimilar to carbon. With high-modulus PAN-based fibers, there was asignificant decrease in apparent crvstallite size (from over 200 A to
0 30

NOLTR 71-165
PPQ 1REATED HIGH MODULUS
SINGLE CRYSTAL
GRAPHITE
1575 1355 1575 1355
INTERMEDIATE MODULUS FIBER
PYROLYTIC GRAPHITE
1575 1355 1575 1355
VYB LOW MODULUS FIBER
HIGH MODULUS FIBER
1575 1355 cm.-l 1575 1355 cm.- 1
FIG. 11 COMPARISON OF RAMAN SPECTRA OF VARIOUS GRAPHITES AND CARBONS

NOLTR 71-165
30
1 20
10
o
0.1 0.5 1.0!1355/117
FIG. 12 X-RAY CRYSTALLITE SIZE VS. RAMAN INTENSITY RATIO (55)
32;

r}
KOLTR 71-165 11TABLE 5
RAMAN INTENSITY RATIO (1355/I1575) FOR VARIOUS
CARBON FIBERS AND GRAPHITES
Material Intensity CalculatedRatio Crystallite
Size,
Natural Ticonderoga Graphite 0 (No 1355 peak)
Synthetic General Electric 0 (No 1355 peak)Graphite Single Crystals
Pyrolytic Graphite Basal 0-12 500Exposure
Pyrolytic Graphite Edge 0.22 220Exposure
Commercial Graphite 0.22 220Modmor I Untreated 0.22 220
Courtaulds HM Untreated 0.22 220
HMG-50 FeCl 3 Treated 0.25 190
Modmor I Treated* 0.30 150
Courtaulds HMS Treated* 0.32 145
HMG-50 Uixtratedated 0.38 120
HMG-50 Fe;:rocene Treated 0.41 110
Courtaulds HM PPQ Treated 0.44 100
HMG-50 PPQ Treated 0.48 85
Courtaulds HT Untreated 0.80 55
Modmor iI Untreated 0.82 50
VYB Untreated (Carbon) 0.89 45
Courtaulds HTS Treated* 0.93 42
* Manufacturer Treatments
33

NOLTR 71-165
less than 100 A) when the outer surfaces of the fibers were removedby severe oxidations. This helps to reinforce the theory of a radialorientation in the fiber center which becomes exposed as the circum-ferential layers are removed. The radially oriented center with theexposed edge planes would produce a lower apparent crystallite size.The center of the fibers may also be less crystalline than the surfaceand this would also produce the same effect.
Treatment of the fiber surface by oxidation or carbon deposi-tion decreased the apparent crystallite size. The mechanism by whichthe decrease is achieved is related to the type of treatment.Oxidation treatments probably "break up" large crystallites by pittingand etching the large layers. Carbon depositing treatments producethe same effect by introduction of smaller carbon crystallites on thesurface. In terms of increased peak intensity ratio, the manufactureroxidation treatments are only half as effective as the PPQ treatment.They also are about half as effective in the shear strength improve-ment as the PPQ treatment. The PPQ treated high-modulus fibersexhibit intensities in the 1355 cm.-' peak half as strong as carbonand twice as strong as graphite or the untreated fibers. This changein the carbon nature of the fiber surface is believed to be one majorcontributor towards the high shear values obtained from this treatment.Other tr3atments produced similar decreases in crystallite size exceptfor the FeCI 3 treatment. In this case, the thick coatings of iron onthe surface of the fibers, even though they are localized, perhapsreduce the edge effects contributing to the 1355 cm.-I signal. Theimproved shear strength achieved from this treatment method may be aresult of mechanical bonding to the roughened surface created by theiron carbide rather than bonding to activated crystal edges.
: The correlations between Raman peak intensity ratio andcomposite shear strength are given in Figure 13. Figure 14 shows asimilar relationship between fiber modulus and composite shear strength.Since the curve for the R of untreated fibers versus shear strengthin Figure 13 is almost identical to the curve for the fiber modulusversus shear strength in Figure 14, a good correlation can be madebetween R for untreated fibers and the fiber modulus. As the fibermodulus increases, the intensity ratio (R) decreases. This would beexpected since the fiber modulus has been shown to be a function ofthe crystallite size in the fiber with higher-modulus fibers havinglarger crystallites, i.e., lower R values. Raman peak intensityratios for treated fibers do not f.ll on the same curve as theuntreated fibers as was previously thought (56). As seen in Figure 13,effective treatments of the fiber surface reduce the apparent crystal-lite size (increased R) but not in proportion to the increasesachieved in shear strength. For example, the manufacturer oxidationtreatment of high-modulus PAN-based fibers produced a 1/3 reductionin crystallite size (50% increase in R) and a doubling (100% increase)in the composite shear strengths. Similar oxidations of Rayon-basedfibers produced a 1/2 reduction in crystallite size and a 70% increasein composite shear strengths (56). With the PPQ treatment, a 1/2reduction in crvstallite size (doubling of R values) produced a3-fold increase in shear strengths. Therefore, while the apparentcrystallite size as measured by Raman spectroscopy may indicate trends
34

NOLTR 71-165 )
.4'
.14
14 UNTREATED FIBERS
AHTS A TREATED FIBERS
12VYB • M PPQ
X 10 A HMG 50 PPQ× IO
PLUTON B
zS~I
"En HMG 50
MU• HMS
HT FERROCENE
HGHMG 50
THORNEL 25, THORNEL 40
2 MIHM
1.0 0.8 0.6 0.4 0.2 0
R =1355/I 1575
FIG. 13 RAMAN PEAK INTENSITY RATIO (R) VS. COMPOSITE SHEAR STRENGTH
35

NOLTR 71-165
12-1
14-
10 PLUTONB
'x 8-
6
4HRE 9 HMG 50 THORNEL25 7
40 .4
2
01 pI
0 10 20 30 40 50 60 70
MODULUS
PSI x 10 6
FIG. 14 SHEAR STRENGTH VS. FIBER MODULUS (51)(UNTREATED FIBERS)
36

NOLTR 71-165
in composite shear strengths produced by fiber treatments; it by nomeans can be used to predict the composite shear strengths. Theshear strengths of untreated fiber composites, on the other hand, areclosely reflected by the R values. Good correlation exists betweencrystallite size (hence R values) and composite shear strengths forthe untreated fibers.
The changes in compssite shear strengths which are producedby surface treatments are reflected by relatively small changes in 4the R values. The nature of the surface actually may be modifiedmore extensively and be more carbon like than reflected by the changesin R values. The PPQ treatment produces a very thin carbon laver onthe fiber which may not be continuous. Such thin layers may be pene- A
trated by the laser beam, thus Raman signal would be generated fromthe more graphitic regions below as well as from the carbon surface.The Raman spectra would then reflect a semi-graphitic, semi-carbonsurface while the surface would actually be more carbon like.Therefore, high shear strengths can be achieved by two mechanisms;1) low-temperature treatment (1500 0 C) of the fiber in fabricationsuch that an essentially carbon fiber is produced, or 2) treatment ofa graphitic fiber by modification of the surface making it morecarbon like. "
b. Surface Area. Measurement of fiber surface areas was oneof the early methods of characterizing fiber surfaces. While surfacearea alone cannot be correlated with shear strengths, it does give anindication of the condition and morphology of the surface.
Fiber surface areas are functions of the type of precursorand the type of processing the precursor undergoes in the graphitizingprocess. HMG-50 fibers, which are fabricated by electrical resistanceheating, have a surface area of 0.9 m /gm. while Thornel 50 fibers,also from a Rayon precursor and fabricated by heating in a furnace,have a surface area of 0.55 m2 /qm. (Table 6). It has also been shownthat outgassing the fiber in vacuum at elevated temperatures producessignificant increases in the fiber surface area (41). Therefore, thesurface area of fibers as produced can exhibit large variations and isnot a true reflection of the fiber properties.
Surface treatments of the fibers produce varied changes inthe fiber surface area. On Thornel fibers, nitric acid oxidationtreatments produced large increases in the fiber surface area whilegaseous oxidations increased the surface area by relatively smallamounts. Heat treatment in an inert environment also increases thefiber surface area (40). Increases in composite shear strengths,however, are not proportional to surface area increases. Some of theincreases in area are attributable to small pores which are too smallfor resin molecules to enter. Pore diameters of 8 X have beenmeasured (45). For the manufacturer treatments of fibers from bothprecursor types, increases in shear strengths of 100% (doubling)were achieved with little increase (less than 20%)in the fiber surfacearea. It should be noted from Table 6 that surface areas of thesame fibers measured by different investigators .can differ significantly.
37

NOWR 71-165
TABLE 6
SURFACE AREAS OF CARBON FIBERS - TREATED AND UNTREATED
Fiber and Treatment Area (m2 /gm.)
HMG-50 Untreated 0.90
Oxidation Treated 3.4 - 2 4 . 0 a
Manufacturer Ireated 0 . 6 6 a
PPQ Treated 5.38
Thornel 50 Untreated 0.55a
Air Oxidation -.4
HN03 Boil 11. 3b
Courtaulds HM Untreated 0.35
Manufacturer Treated 0.43
PPQ Treated 3.55
Modmor I Untreated 0.ii 0.38c
Manufacturer Treated 0 . 1 3 a
HNO 3 Boil 1.64c
HNO 3 Boil + Outgass at 900 0 C 4 . 2 6 c
Modmor II Manufacturer Treated 0.24
VYB 0.47
aReference 46 bReference 24 cReference 41
38

NOLTR 71-165
This may be due to differences in zquipment or the measurement methods.Treatments which deposit carbon on the fiber significantly increasethe surface area. Values of treated fibers run well over 3.0 m2 /gm.,over six times the values for the untreated fibers. That these highsurface areas are not necessary for high shear strengths is seen withthe VYB carbon fiber whose surface area is 0.47 m2 /gm. and whosecomposite shear strength typically is 13,000 psi. Thus, the measure-ment of surface area serves only as a method to characterize thechange in surface morphology produced by surface treatments and thesurface area is not the most important contributing factor to shearstrength.
2. Surface Reactivity. Carbon fiber surface reactivity can beestimated by various methods among which are surface energy, wettabilitv,and gas chromatograph reactivity.
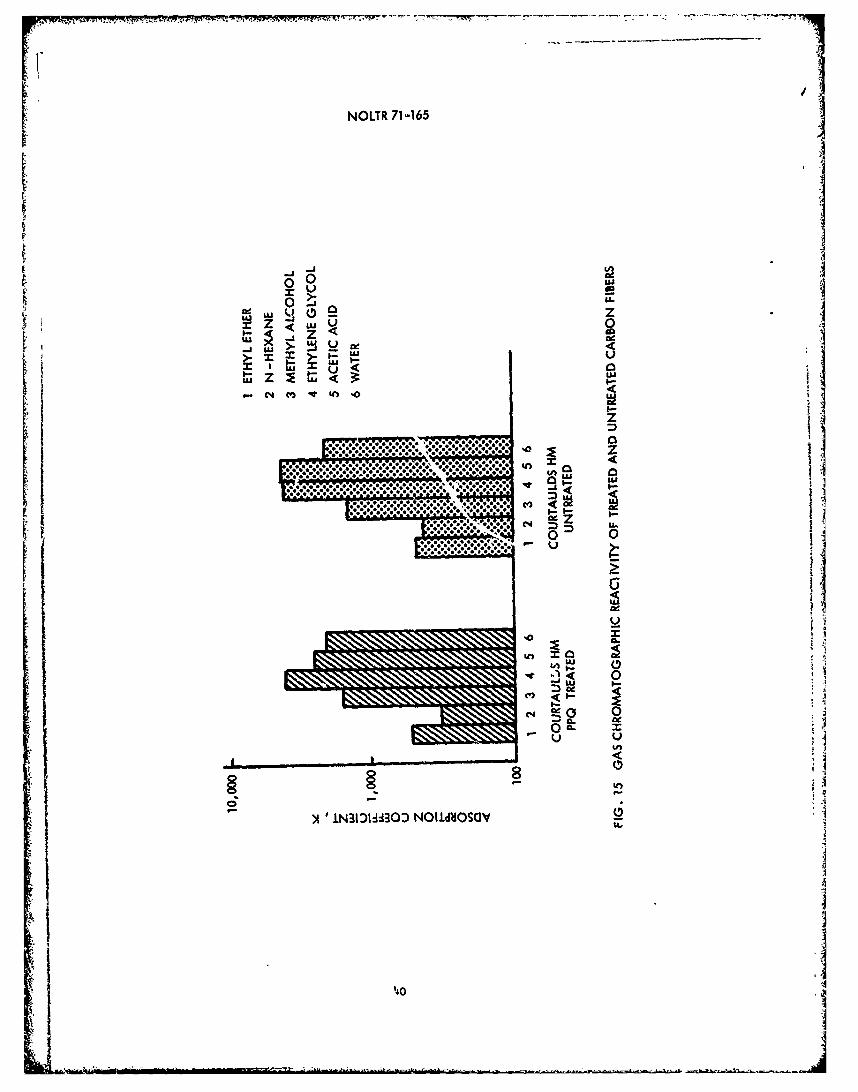
a. Gas Chromatograph Reactivity. Investigations of fiberreactivity using gas chromatography have shown increased affinity oftreated fibers for various adsorbent vapors. Nitric acid oxidation,which increases the surface area, was not as effective in increasingthe adsorption coefficients as was H2 or air oxidations. For hiqh-modulus fibers, only small differences could be discerned between thereactivity of treated and untreated fibers for 6 adsorbent vapors atthree temperatures; room temperature, 120*C, and 220 0 C. It wasexpected that the fibers tested would exhibit the greatest differencesin reactivity between treated and untreated fibers because theyshowed the greatest shear strength improvement after treatment. This,however, was not the case as is shown in Figure 15, where a comparisonof treated and untreated fiber reactivity is presented. There is atendency for greater reactivity of both treated and untreated fiberswith vapors containing oxygen groups, the more available the oxygenthe higher the reactivity. Classification of the reactivity of the6 vapors tested for treated fibers is as follows: ethylene glycol >acetic acid > water > methyl alcohol > ethyl ether > n-hexane. Thesame order holds true for untreated fibers except the reactivity ofethylene glycol and acetic acid are about the same. One of the mostreactive vapors, ethylene glycol, is a reactive component of ERLB 4617epoxy resin systems. This indicates that the fiber reactivity withthe resin may be quite high.
Differences in the reactivity between treated and untreatedfibers, however, were not significant enough to be used as indicatorsof treatment effectiveness. The coefficient for water was 2500 at220 0 C for both treated and untreated fibers. This compares withsimilar values for water of other investigators (11). Acetic acidshowed the greatest change in reactivity between one treated anduntreated fiber at 220 0 C, almost doubling. For another fiber whichexhibited equal shear strength improvement upon treatment, the aceticacid reactivity was the same for the treated and untreated fiber.Based on the small differences observed in reactivity between treatedand untreated fibers and the rather random increases in reactivityfor treated fibers with some vapors and decreases in reactivity forothers at various temperatures, this method is not useful for
39
NOLTR 71-165
LU -3
LU z*.......i:. u.......***** 0
m* * * * . . . . . .~ .. I--. ** * * 9* * * *C 0i
I Dz
100
q0 .1 t1

NOLTR 71-165
treatment evaluation. Of course, the sensitivity of the method maynot be great enough to measure subtle differences between fibers. 4The information obtained may be of some theoretical use but to dateis of little practical value to investigators of fiber treatments.
b. Wettability and Surface Energy. The measured surfacetensions of treated and untreated fibers measured by the fiber ringmethod (Appendix B) differed only slightly with the treated fibershaving critical surface tensions of 44 dynes/cm. and the untreatedfibers having critical surface tensions of 43 dynes/cm. Standardepoxy resins have surface tensions of 40 to 45 dynes/cm. Wetting of Athe fibers by the resins, therefore, should in most cases be spon-taneous. This doesn't occur in all cases, however, because of theirregular, rough nature of the surface. In the case of ERLB 4617epoxy resin, the measured surface tension was 45 dynes/cm. and itwould appear that wetting could be marginal. When the other factors(surface roughness, adsorbed gases, and contamination) are considered,the wetting properties of the surface could change drastically.
In most cases, resins are applied to fibers from prepregsolutions. The resins are diluted with solvents which have signifi-cantly lower surface tensions than the resins themselves, and thesedilute solutions readily wet the fibers without difficulty. Therefore,the problem of wetting the fibers with the resin, previously consideredto be serious, can be substantially overcome using preimpregnationtechniques. The other factors of adhesion play more important rolesin the fiber-resin bond, and it is for this reason that furtherstudies of wettability were not pursued. One factor which has notbeen considered and is beyond the scope of this study is the changein the surface tension of the resin while curing and the effects thismay have upon the bond formed between the resin and the fiber. Otherfactors of adhesion also have not been considered.
Scanning microscope examinations of shear fractured carbon-fiber composites have revealed that little or no resin remains bondedto fibers along the shear fracture plane. Fractures perpendicular tothe fiber direction often reveal separations of up to 1 micron in theregion of the fiber-resin interface. This .indicates that failure isnot occurring in the resin but at the resin-fiber interface or withinthe outer layers of the fiber. Experiments using Raman spectroscopyof resin areas where fibers had sheared out were not conclusive indetermining the presence of thin fiber layers bonded to tIe resin.The fluorescence induced by the laser in the resin was so great thatit would be impossible to detect by this means any thin layers ofgraphite bonded to the resin. Other investigators have shown thepresence of these layers using diffraction techniques (56). Theshear strength between the layers of pyrolytic graphite was measuredat less than 2000 psi. For commercial graphite, it was less than3000 psi. Therefore, it is very possible that failure is occurringwithin the outer layers of the fiber; but further work is needed tosubstantiate this.
41
/I
NCLTR 71-165
CONCLUSIONS AND RECOMMENDATIONS
This investigation has encompassed many areas involving the struc-ture, surface, and surface treatment of carbon fibers. The objectiveswere 1) to determine the structure and surface properties of thefibers, (NOLTR 71- ), 2) to relate these properties to composite
,shear strengths, and 3) to devise new effective treatment methodswhich would improve the composite shear strengths of high-moduluscarbon fibers without degrading the fiber tensile strengths. Theneed for such a study arose from the lack of understanding of thefiber structure and the nature of the surface, and from the lowcomposite shear strengths achieved with high-modulus carbon fibers.It was postulated that some correlation exists between the fiber sur-face structure and the low shear strength values.
The greatest improvement in composite shear strengths resulted whenthe number of oxygen containing groups on the surface was increasedand also when the average surface crystallite size was decreased.Such surfaces are more carbon like and less graphitic in nature andmay be considerably different than the fiber interior. Thu compositeshear strength is related to the carbon-like nature of the fibersurface.
Effective surface treatments using oxidation, vapor deposition, and
solution-reduction methods were investigated. Of these, the solution-reduction treatments were the most effective and easiest to process(requiring residence times of less than one minute in continuousfabrication). This in itself has significant commercial applicationand a patent has been applied for. Shear strengths of 11,000 and12,000 psi were achieved with high-modulus (50-60 million psi) Rayonand PAN-based fibers respectively. These values are the highestreported to date and compare with the 8000 psi values obtained by themanufacturers with the currently used lengthy oxidation treatments.
The most attractive approach achieved a carbon-like surface bysolution coating the fiber with a polymer and the subsequent thermaldecomposition of the polymer. This totally new approach to fibertreatments can be contrasted with surface oxidations which achievesiT.*i2.ar yet less effective results.
The nature of carbon on the fiber surface and its crystallite sizecan readily be determined by using Raman spectroscopy. This initself does not characterize the surface and cannot be used to pre-dict composite shear strengths. However, when used in conjunction with
42

NOLTR 71-165
known fiber properties, a fair indication of the composite performancecan be obtained.
Future work is recommended in the study of fiber structure relatedto the surface condition and processing of the fibers. A study ofthe changes in fiber structure with varying low-temperature oxidation
* times from very short to very long should be made. The investigationof the fiber surface chemistry for surface reactivity needs to be
* pursued in greater detail. It has been suggested that this can beaccomplished using Raman spectroscopy at highly oblique angles.Further study of the fiber-resin bond also needs attention. Finallythe treatments which have been shown to be successful should beoptimized as to the treatment parameters. Action should be taken thento introduce solution-reduction treated fibers into Navy programs
such that the benefits of the imptoved shear strengths can be realized.
ACKNOWLEDGEMENTS
The following persons are acknowledged for their contribution.this work.
F. Robert Barnet for his supervision, timely ideas and suggestions,and review of this paper,
H. B. McLelland for preparation of the figures and L. A. Grymes forpreparation of the photographs,
E. T. Dyer for testing the fiber and composite specimens,John C. Goan, formerly of this laboratory now with Great Lakes
Carbon Company, for his preliminary work in fiber oxidation and vapordeposition treatments,
W. C. Elban for his suggestions and help with organometallictreatments,
Dr. J. M. Augl for his suggestion of trying the thermal decomposi-tion of PPQ as a treatment method,
J. V. Duffy for his suggestions on carbon depositing treatments,Dr. Gerald Cessac and the Center for Materials Research at the
University of Maryland for use of and help with the Raman equipment,Dr. Victor Deitz at the Naval Research Laboratory for his help with
surface area measurements and chemical analysis.
43\4

NOLTR 71-165
I
RErERENCES
1. Aitken, I. D., Rhodes, G., and Spencer, R. A. P., "Development ofa Wet Oxidation Process for the Surface Treatment of Carbon Fiber",3rd Conference on Industrial Carbons and Graphite, London:SCI,(1970).
2. Araki, T., and Comi, S., "Production of Molten Pitch Carbon Fiber",American Chemical Society Polymer Preprints, 9, 1388 (1968).
3. ASTM D-20, Subcommittee XVLLL, Sect. K and D-30, Subcommitte'-and V, "Proposed Method of Test for Tensile Properties of Sti • ,,Yarns and Rovings", (1969).
4. Augl, J. M. and Wrasidlo, W. J., "Phenylated Polyauinoxaline.-from Bis(phenyl-glyoxaoyl) Benzene", Journal of Polymer Science,A-l, 7, p. 339, (1969).
5. Bacon, R., "Growth Structure and Properties of Graphite Whiskers",Journal of Applied Physics, 31, pp. 283-290, (1960).
6. Bacon, R., and Tang, M. M., "Carbonization of Cellulose Fibers-II.Physical Properties Study", Carbon, 2, pp. 221-225, (1964).
7. Bacon, R. a.id Schalamon, W. A., "Physical Properties of HighModulus Graphite Fibers Made from a Rayon Precursor", AmericanChemical Society Polymer Preprints, 9, 1338 (1968).
8. Badami, D. V., Joiner, J. C. and Jones, G. A., "Microstructures ofHigh Strength, High Modulus Carbon Fibers", Nature, 215, pp. 386-387,(1967).
9. Bailey, J. E. and Clarke, A. J., "Carbon Fibers", Chemistr. inBritain, 6, No. 11, pp. 484-489, (1970).
10. Bobka, R. J. and Lowell, L. P., "Integrated Research on CarbonComposite Materials", AFAPL-TR-310, Pt. I, (1966).
11. Brooks, C. S. and Scola, D. A., "An Examination of the SurfaceReactivity of Graphite Fibers by Gas Chromatography",Journal of Colloid and Interface Science, 32, No. 4, (1970).
12. Brunauer, S., Emmett, P. H. and Teller, E., "Adsorption of Gases"in Multiznolecular Layers", Journal of the American Chemical Society,60, pp. 309-318, (1938).
44
- J
NOLTR 71-165
13. Butler, B. L., "The Effects of Carbon Fiber Microstructure on theShear Strength of Carbon-Epoxy Composites", Ph. D. Thesis,Rensselaer Polytechnic Institute, (1969).
14. Central Scientific Company, "Surface and Interfacial Tensions bythe Ring Method", Bulletin 101, Chicago, (1935).
15. Chemical Engineering News, 43, p. 23 (Nov. 1965).
16. Chwastiak, S., Union Carbide Corporation, private communicacion.
17. Chwastiak, S., "Wetting of Carbon Yarns from Wicking RateMeasurements", American Chemical Society Polymer Preprints, 31,No. 1, pp. 437-442, (1971).
18. Didchenko, R., "Carbon and Graphite Surface Properties Relevant 1to Fiber Reinforced Composites", AFML TR-68-45, (1968).
19. Ezekiel, H. M. and Spain, R. G., "Preparation of Graphite Fibersfrom Polymeric Fibers", Journal of Polymer Science: PT. C,No. 19, pp. 249-265, (1967).
20. Ezekiel, H. M., "The Direct Graphitization of Polymer Yarns",American Chemical Society Polymer Preprints, 31, No. 1, pp. 415-425,(1971). -
H21. Ezekiel, H. M., "High sý-rength, High Modulus Graphite Fibers",
AFML TR-70-100, (1971).
22. Fiedler, A. K., Fitzer, E. and Muller, P. J., "Cyclization ofPolyacryloizitrile as a First Step for Carbon Fiber Fabrication",American Chemical Society Polymer Preprints, 31, No. 1, pp. 380-387,(197]).
23. Fourdeux, A., Perret, R. and Roland, W., "General StructuralFeatures of Carbon Fibers-Their Composites and Applications",London, pp. 9/1 - 9/10, (1971).
24. Goan, J. C., "Graphite Fiber Oxidation", NOLTR-69-153, (1969).
25. Goan, J. C. and Prosen, S. P., "Interfacial Bonding in GraphiteFiber-Resin Composites", Interfaces and Ccmoosites, ASTP 452,American Society for Testing and Materials, pp. 3-26, (1969).
26. Harling, D. F., "High Resolution Microscopy of Carbon Fibers",Proc. 28th Annual Electron Microscopy Society of America,Houston, pp. 468-469, (1970).
27. Harling, D. F., "High Resolution Microscopy of Carbon Fibers",JOEL News, 9e, No. 2, pp. 22-26, (1971).
28. Herrick, J. W., "Surface Treatments for Fibrous CarbonReinforcements", AFML TR-66-178, Pt. II, (1967).
45

NOLTR 71-165
29. Johnson, W. and Watt, W., "Structure of High Modulus Carbon Fibers",Nature, 215, pp. 384-386, (1967).
30. Johnson, J. W., Marjoram, J. R. and Rose, P. G., "StressGraphitization of Polyacrylonitrile Based Carbon Fibers",Nature, 221, p. 357, (1969).
31. Johnson, D. J., "The Microstructure of Various Carbon Fibers",International Conference on Carbon Fibers, Their Composites andApplications, London, pp. 8/1 - 8/5, (1971).
32. Kinna, M. A., "NOL Ring Test Methods", NOLTR 64-156, (1964).
33. Knibbs, R. K., AERE, Harwell, private communication.
34. Kraus, E. H., Hunt, W. F. and Ramsdell, L. S., Minerology,McGraw Hill, Inc., New York, (1951).
35. Larsen, J. V., "The Scanning Electron Microscope and ItsApplications in Fracture Studies of Composite Materials",NOLTR 69-189, (1969).
36. Liberman, M. L., "The Chemistry of Sulfur in Rayon-Based CarbonFibers", American Chemical Society Polymer Preprints, 31, No. 1,pp. 370-379, (1971).
37. Lin, R. Y. and **Ionomy, J., "Crystallite Orientation in GlassyCarbon Fibers", -:,erican Chemical Society Polymer Preprints,31, No. 1, pp. 403-405, (1971).
38. Mantell, C. L., Carbon and Graphite Handbook, IntersciencePublishers, New York, (1968).
39. McCreight, L. R., Rauch, H. W. and Sutton, W. H.,Ceramic and G7aphite Fibers and Whiskers, Academic Press,New York,-(196)T.
40. Mimeault, V. J. and McKee, D. W., "Surface Areas of Carbon Fibers",Nature, 224, pp. 793-794, (1969).
41. Mimeault, V. J., "Carbon Fiber Composites", American ChemicalSociety Polymer Preprints, 31, No. 1, pp. 479-487, (1971).
42. Moreton, R., Watt, W. and Johnson, W., "Carbon Fibers of HighStrength and High Breaking Strain", Nature, 213, p. 690, (1967).
43. Norr, M. K., NOL, unpublished results.
44. Pease, E. C., Histological Techniques for Electron Microscopy,Academic Press, New Yor , (1964).
45. Quackenbush, N. E. and Thomas, R. L., "Investigation of CarbonFilament Reinforced Plastics", Aeroneutronic Publication No. U-4065,(1967).
46

POLTR 71-165
46. Scola, D. A. and Brooks, C. S., "Investigation and Chemical Natureof the Surface of Recently Developed:Fibers", AFML TR-67-218,Pt. II, (1968).
47. Scola, D. A. and Brooks, C. S., "Surface Aspects of New Fibers,Boron, Silicon Carbide and Graphite", Journal, of Adhesion, 2,pp. 213-237, (1970).
48. Shaver, R. G., "Silicon-Carbide Whiskered Graphite Fibers",AIChE Materials Conference, Phila., (1968).
49. Shindo, A., "Studies on Graphite Fiber", Journal of the CeramicSociety of Japan, 69, c 195 (1961); Reoort No. 317 of theGovernment Industr-al Research Institute, Osaka, (1961).
50. Shindo, A. and Soma, I., "The Carbonization of Polyvinyl AlcoholFiber", Preprints of the Carbon Conference, Tokyo, (1964).
51. Simon, R. A., Prosen, S. and Duffy, J., "Carbon Fiber Composites",
Nature, 213, pp. 1113-1114, (1967).
52. Standage, A. E. and Prescott, R., "High Elastic Modul': 'arbonFiber", Nature, 211, p. 139, (1966).
53. Steingiser, S. and Cass, R. A., "Graphite Fiber ReinforcedComposites", AFML TR-68-357, Pt. II, (1970).
54. Tang, M. M. and Bacon, R., "Carbonization of Cellulose Fibers - I.Low Temperature Pyrolysis", Carbon, 2, pp. 211-220, (1964).
55. Tuinstra, F., and Koenig, J. L., "Raman Spectrum of Graphite",Journal of Chemical Physics, 53, No. 3, pp. 1125-1129, (1970).
56. Tuinstra, F. and Koenig, J. L., "Characterization of Graphite5.Fiber Surfaces with Raman Spectroscopy", Journal of Composite
Materials, 4, pp. 492-499, (1970).
57. Watt, I.., Phillips, L. N. and Johnson, W., "High Modulus, HighStrength Carbon Fibers", The Engineer, 221, p. 813, (1966).
58. Watt, W. and Johnson, W., "The Effect of Lenqth Changes DuringOxidation of Polyacrylonitrile Fibers on the Young's Modulus ofCdrbon Fibers", American Chemical society Polymer Preprints, 9,No. 2, pp. 1245-1255, (1968).
59. Watt, W. and Green, J., "The Pyrolysis of Polyacrylonitrile",International Conference on Carbon Fibers, Their Compositesand Applications, London, pp. 4/1 - 4/9, (1971).
60. Watt, W., priva,.e communication.
31. Winchell, A. N., Elements of Optical Minerology, John Wiley,New York, (1937).
47

/
NOLTR 71-165
62. Yamamoto, M., et al, "Determination of Wettability of HighModulus Carbon Fiber by Its Matrix Resin", InternationalConference on Carbon Fibers, Their Composites and Applications,London, pp. 21/1 - 21/5, (1971).
63. 'isman, W. A., "Surface Chemistry of Plastics Reinforced byStrong Fibers", NRL Report 6911, (1969).
48
S~48
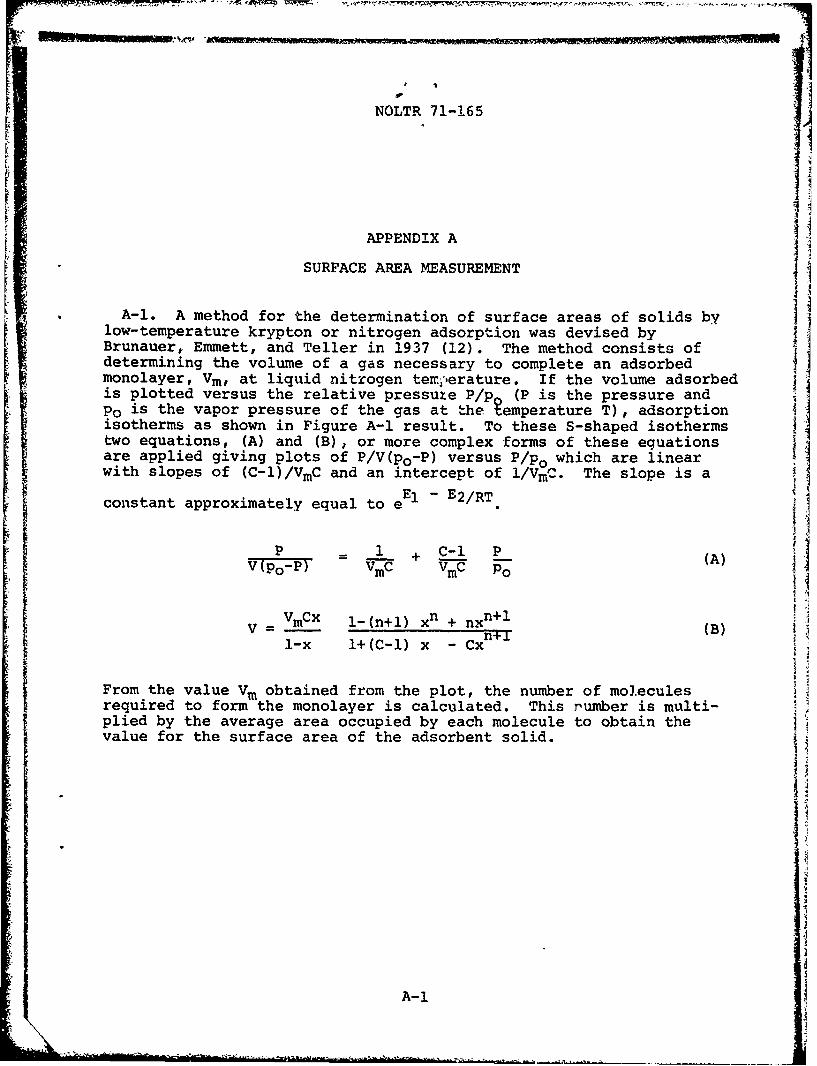
NOLTR 71-165
APPENDIX A[ SURFACE AREA MEASUREMENT
S* A-I. A method for the determination of surface areas of solids bylow-temperature krypton or nitrogen adsorption was devised byBrunauer, Emmett, and Teller in 1937 (12). The method consists ofdetermining the volume of a gas necessary to complete an adsorbedmonolayer, Vm, at liquid nitrogen tenperature. If the volume adsorbedis plotted versus the relative pressuze P/p (P is the pressure andp0 is the vapor pressure of the gas at Ihe temperature T), adsorptionisotherms as shown in Figure A-i result. To these S-shaped isothermstwo equations, (A) and (B), or more complex forms of these eguationsare applied giving plots of P/V(po-P) versus P/po which are linearwith slopes of (C-I)/VmC and an intercept of lI/VmC. The slope is a
constant approximately equal to eEl - E2/RT.
P 1 1 + c-l (A)V(po-P) VmC VmC Po
- VmCX l-(n+l) xn + nxn+lV -- xn~i(B)
1-x l+(C-l) x - n+
From the value V. obtained from the plot, the number of moleculesrequired to form the monolayer is calculated. This number is multi-plied by the average area occupied by each molecule to obtain thevalue for the surface area of the adsorbent solid.
A-1

Is IiNOLTR 71 -165
41
11
3
, ,2
0 0.2 0.4 0.6 0.8 1.0P/Po
A. TYPICAL ADSORPTION ISOTHERM
0.003 0.06 .1HM PPQ TREATED
0.002 0.04t • HIMUNTREATEC •
S0.001 0.02
0.000 00 0.05 0.1 0.15 0.2
P/Po
B. BET PLOTS OF TREATED AND UNTREATED FIBERS
FIG. A-1 SURFACE AREA MEASUREMENT
A-2
k* A -*-*.-~

NOLTR 71-165
APPENDIX B
CRITICAL SURFACE TENSION BY THE FIBER-RING METHOD
B-I. Surface tensions of liquids are routinely measured by thering method where 6 = (mg/2L)F
S= surface tension of the liquid
m = measured separation force
g = gravitational constant
L = circumference of ring
F = correction factor for the particular ring and liauid used
When performed correctly, such a method can be very accurate. Aplatinum riing is usually used and assumed to be completely and spon-taneously wetted by the liquid (contact angle = 0).
B-2. Measurement of the critical surface tension of solids hasbeen much more difficult. Contact angle measurements (the angle adrop of liquid makes with a clean flat solid surface) is the standardmethod. Various liquids of known surface tensions are used to obtaina plot of the cosine of the contact angles versus the liquid surface
tensions. This is usually measured or extrapolated to the pointwhere the contact angle equals zero which is defined as the criticalsurface tension of the solid. Moisture or other contaminants on thesolid will greatly effect the contact angle measurements.
B-3. Measurement of contact angles of liquid droplets in contactwith the irregular surface of small diameter fibers presents evengreater problems. N, -eally good method for doing this, especiallywith carbon fibers, exists. It was, therefore, proposed that acombination of the two methods be ured to determine the surfacetensions of fibers. A fiber ring instead of the usual platinum ringwas used. This fiber ring was calibrated using very low surfacetension liquids which were assumed to completely wet the fibers andthe correction factor F was determined so that the surface tensionvalues measured by the platinum ring and the fiber ring were equi-valent.
B-4. Surface tensions of various liquids were then measured withthe fiber ring and plotted versus the known surface tensions of theliquids. Such a plot (shown in Figure B-i) is linear as long as the
B-1

NOLTR 71-165
liquid wets the fiber. The point where a sharp discontinuity occurswas assumed to be the critical surface tension of the fiber, since itwas the point where the fiber no longer was wet by the liquid.
B-2

Neill mm m I-- -
NOLTR 71-165
SURFACE TENSION MEASURED BY FIBER RINGSURFACE TENSION OF LIQUID
=1 WHEN THE FIBER RING IS WET BY THE LIQUID
1.0 0d0%%ICRITICAL SURFACE TENSIONVERIB 4617 RESIN
0.8
UNTREATED HMG 50--TEEDHG5
0
zp 0.4 -Lu i
0.2-
0I
25 35 45 55 65
SURFACE TENSION OF LIQUID, DYNES/cm. VI
FIG. B-1 CRITICAL SURFACE TENSION OF FIBERS DETERMINED BY THE FIBER RING METHOD
B-3

NOLTR 71-165
APPENDIX C
GAS CHROMATOGRAPHY OF CARBON FIBERS
C-1. The surface reactivity of carbon fibers can be measured to anextent by the affinity the fibers have for various vapors and thelength of time the vapors take to traverse a column packed with thefibers. The specific relationships of gas-solid chromatography canbe used to calculate the retention volume (Vg) or the adsorptioncoefficient (K) from the pulse retention time (Tr) measured from thebase width of the peak (11).
Vg = K = (Tr/Tm-l) (Vm/W)
Tm = transit time" fbr the carrier gas
Vm = total gas free volume in the column
W = adsorbent weight
The transit time is a function of the volume of the column, theamount of packing and its density, the gas flow rate, and the tempera- .1
ture of the column.
T-r2L - W/pV(T 2 /TI)
wr 2 L = volume of column
V = volume flow rate of carrier gas
p = density of packing
T1 = absolute temperature at flow meter
T = absolute temperature of column
C-2, Since pulse retention times as conventionally measured wouldbe too short for accurate determination, the peak base widths wereused as a measure of the time required to adsorb and desorb thevarious vapors. With the greater affinity of the fibers for certainvapors, the peaks become very unsymmetrical especially when thedesorption times are long. Great stability is required in theinstrument to maintain a constant base line over such periods of time.In the author's judgement, this method may be of some significance to
C-1
-",I-- -- U.
NOLTR 71-165
a pure researcher; but the information obtained does not show enoughdifference between treated and untreated fibers to be of practicalsignificance for characterizing surface treatments.
C-2
NOLTR 71-165
APPENDIX D
RAMAN SPECTROSCOPY OF CARBON FIBERS
D-1. Ramna spectroscopy can discriminate between different typesof carbons and graphites. For the single graphite crystal, a singleband is active at 1575 cm.-I from asymmetrical in-plane vibrationsof the carbon layers in phase or in opposite phase. This active bandcontains two fundamental modes from the phasing, but the differencein energy between the two modes is small due to weak forces betweenlayers and appears as a single band. The band does not depend onorder between graphite layer planes as it appears at the same fre-quency in ordered and turbostatic graphites. For graphites andcarbons other than single crystal graphites, an additional band becomesRaman active at 1355 cm.- 1 . This additional activity appears from aparticle size effect. The activity is attributed to symmetric ringstretching vibrations which in the infinite lattice are cancelledout due to the symmetry of the lattice. As the crystallite sizebecomes smaller (of the order of magnitude of the incident beamdiameter), the symmetry is destroyed due to the crystal edges andRaman activity is achieved (55). The activity arising from theborders of the crystallites, due to this loss in translationalsymmetry is, therefore, a function of the amount of crystal boundaryin the specimen or the average crystal diameter. Larger crystallitesexhibit fewer boundary edges and from the intensity of the 1355 cm.-lactivity the crystallite size can be calculated.
D-J. The Raman signal is generated in a thin surface layer (about500 A thick for graphite) and, therefore, reflects primarily thecondition of the surface. Crystal size and orientation have certaineffects on the intensity ratio (R) of the 1355 and 1575 cm.- 1 peaks.This ratio presents a fairly good estimate of the number of vacancies,edge planes, and crystal edges to which resin can bond. It alsorepresents to a degree the proportion of carbon and graphite near thespecimen surface.
D-1

NOLTR 71-165
APPENDIX E
SOLUTION-REDUCTION TREATMENT ARAMETERS
E-1. Several variables in the solution treatment of carbon fibers
remain unexplored. The following variables are readily apparent:
1) Choice of solvent[ 2) Concentration of the solution
3) Residence time of fiber in solution (4 sec.)(Fiber travel rate - 10.5 fpm)
4) Drying time and temperature (25 sec., 150 0 F)(Air flow rate - 10 cfm)
5) Temperature of heater
6) Residence time in heatei (6 sec.)(Fiber travel rate - 10.5 fpm)
E-2. For various treatments, certain of these variables remainedconstant by design (3,4, and 6). Of the others, the choice of solventis restricted somewhat by the type of treatment. With PPQ one isrestricted to three or four convenient solvents. (Only one was used -
chloroform). With the FeCI 3 treatment, three solvents (benzene,toluene, and water) were tried but not fully explored. Variationsin the solution concentration were investigated with the PPQ treatment,and the results of these variations are discussed in the text.
E-3. The treatment temperature was varied on several of thetreatments. Temperatures that are too high produce reactions whichdegrade the fiber tensile properties. At low temperatures, notenough reaction occurs between the fiber and the deposited materialto achieve the desired results.
E-4. All in all, a much more thorough investigation of all theseparameters would be necessary to optimize the most promising treatments.
E-1
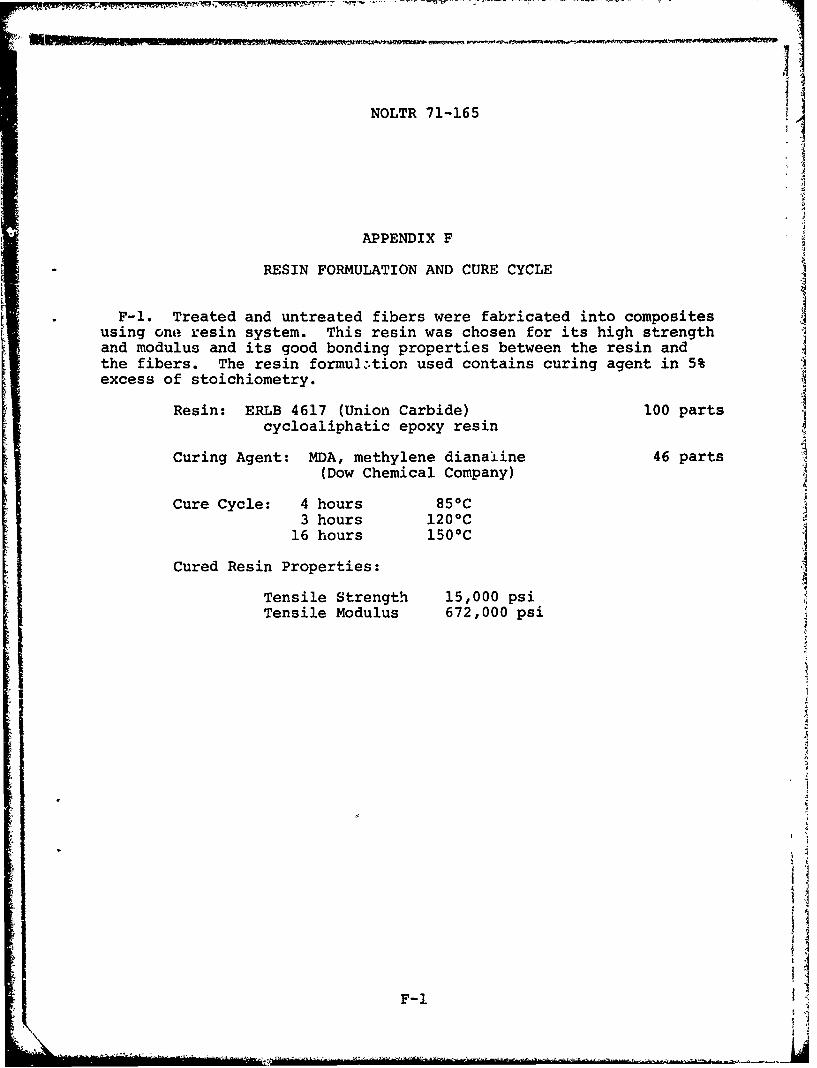
NOLTR 71-165 A
APPENDIX F
RESIN FORMULATION AND CURE CYCLE
F-I. Treated and untreated fibers were fabricated into compositesusing one resin system. This resin was chosen for its high strengthand modulus and its good bonding properties between the resin andthe fibers. The resin formulation used contains curing agent in 5%excess of stoichiometry.
Resin: ERLB 4617 (Union Carbide) 100 partscycloaliphatic epoxy resin
Curing Agent: MDA, methylene dianaline 46 parts
(Dow Chemical Company)
Cure Cycle: 4 hours 850C3 hours 120 0C
16 hours 150 0C
Cured Resin Properties: I
Tensile Strength 15,000 psiTensile Modulus 672,000 psi
F-i