Hyperspectral Imaging to Discern Malignant and Benign ... · Hyperspectral imaging is capable of...
32
Hyperspectral Imaging to Discern Malignant and Benign Canine Mammary Tumors A Thesis Proposal Submitted to the Temple University Graduate Board In Partial Fulfillment of the requirements for the Degree Masters of Science in Electrical Engineering By Amrita Sahu December 2012 _______________________ Dr. Chang-Hee Won Thesis Advisor Dr. Nancy Pleshko Dr. Joseph Picone Committee Member Committee Member _________________ _________________
Transcript of Hyperspectral Imaging to Discern Malignant and Benign ... · Hyperspectral imaging is capable of...
Hyperspectral Imaging to Discern Malignant and Benign Canine
Mammary Tumors
A Thesis Proposal
Submitted to the
Temple University Graduate Board
In Partial Fulfillment
of the requirements for the Degree
Masters of Science in Electrical Engineering
By
Amrita Sahu
December 2012
_______________________
Dr. Chang-Hee Won
Thesis Advisor
Dr. Nancy Pleshko Dr. Joseph Picone
Committee Member Committee Member
_________________ _________________

Abstract
Hyperspectral imaging is an emerging technology in the field of biomedical engineering which may be
used as a non-invasive modality for cancer characterization. In this project, we propose to investigate
near-infrared (NIR) hyperspectral imaging for the characterization of canine mammary cancer. Near-
infrared hyperspectral imaging has been used for the detection of various kinds of human cancer; breast,
gastric, prostate and tongue. A research group has also investigated the use of NIR reflectance imaging to
detect canine cancer using fluorescent dyes. The use of NIR hyperspectral imaging, however, has been
limited for the characterization of canine cancer. In this project, we have already acquired hyperspectral
images of 22 canine mammary tumors. Preliminary results of 2 canine patients show that the spectra of
canine cancer tissue differ from those of benign tissue. The malignant tissue has relatively low reflectance
intensity compared to the benign tissue; in the wavelength range between 650nm to 1100nm.The
decreased reflectance intensity observed for malignant tumors is due to the increased microvasculature
and therefore higher blood content of cancerous tissue relative to benign tissue. In the future, we will
normalize and preprocess the spectral dataset. We propose to apply various algorithms such as Support
Vector Machine, Linear Discriminant Analysis, Principal Component Analysis and Tissue Optical
Methods on the spectral data to discern the malignant and benign tumors. The advantage of cancer
detection using hyperspectral imaging is that it is non-invasive and less time consuming than traditional
methods like biopsy.
Keywords: Hyperspectral imaging, canine mammary tumor, near-infrared spectroscopy, tumor
characterization

Table of Content
List of Figures
1. Introduction………………………………………………………………………………… 1
1.1 Motivation……………………………………………………………………………… 1
1.2 Statement of Problem…………………………………………………………………... 2
1.3 Research Objectives……………………………………………………………………. 2
1.4 Organization of Thesis Proposal……………………………………………………….. 3
2. Background………………………………………………………………………………... 3
2.1 Infrared Hyperspectral Imaging………………………………………………………... 3-5
2.2 Cancer Detection Using Infrared Hyperspectral Imaging……………………………… 6
2.2.1 Prostate Cancer Detection……………………………………………………… 6-7
2.2.2 Tongue Cancer Detection…………………………………………………........ 7-8
2.2.3 Gastric Cancer Detection……………………………………………………… 8-9
2.2.4 Breast Cancer Detection………………………………………………………. 9-10
2.2.5 Skin Cancer Detection………………………………………………………….. 10
2.3 Other diseases diagnosed by Hyperspectral Imaging…………………………………… 11
3. Experimental Setup and Data Acquisition……………………………………………………12
3.1 Hyperspectral Imaging System Description…………………………………………….. 12
3.2 Method of Data Acquisition from Canine patients…………………………………...... 13-14
4. Normalizing and Preprocessing of data…………………………………………………….. 15
4.1 Normalization Using Standard Reflectance Standards………………………………….15
4.2 Other normalization methods used in NIR Imaging ……………………………………16
4.3 Derivative Methods and its applications………………………………………………...17
5. Data Analysis………………………………………………………………………………...17
5.1 Support Vector Machine………………………………………………………………..17-19
5.2 Linear Discriminant Analysis…………………………………………………………..19-21
5.3 Principal Component Analysis…………………………………………………………....21
5.4 Tissue Optical Indices Method…………………………………………………………..21-22
6. Preliminary Results…………………………………………………………………………..22-23
7. Discussion…………………………………………………………………………………....23-25
8. Future Research Plan………………………………………………………………………...25-26
References

List of Figures
Figure 1: Needle biopsy for breast cancer…………………………………………………………………1
Figure 2: A hyperspectral three dimensional imaging cube ………………………………………………4
Figure 3: A hyperspectral imaging setup for tissue analysis………………………………………………5
Figure 4a: Detection of prostate cancer tissue (green area) using the classification method …………......6
Figure 4b: In-vivo spectral signature of benign and malignant lesion. …………………………………..6
Figure 5: The hyperspectral imaging setup used by the authors for the gastric cancer experiment………8
Figure 6: Schematic view of the hyperspectral imaging acquisition system……………………………..13
Figure 7: The canine patient with multiple mammary tumors held by the doctor as…………………….14
images are being captured by the hyperspectral system
Figure 8a: The hyperspectral image of canine mammary tumors………………………………………..14
Figure 8b: The digital image of canine mammary tumors………………………………………………14
Figure 9: The reflectance spectra of canine patient Kiki………………………………………………..22
Figure 10: The reflectance spectra of canine patient Tinkerbell…………………………………………23
Figure 11: The 500W quartz tungsten halogen lamp used in the canine experiment……………………24
Figure 12: The 300W Sunbeam Xenon Lightsource ……………………………………………………24

1
1. Introduction
1.1 Motivation
Mammary tumor or neoplasm originates in the mammary gland. The frequency of mammary neoplasia
varies highly across different species. For example, among domestic species, dog has the highest
prevalence of mammary neoplasia which is approximately three times higher than that of women [1]. The
frequency of malignant mammary tumor also varies across species. In dogs, approximately 50% of all
mammary gland tumors are malignant or cancerous and have the potential for metastasis whereas in cats
the figure is approximately 90% [2]. Once a tumor reaches metastatic stage, the chances of successful
treatment become very low. Therefore, early detection of malignant tumors is necessary for successful
treatment of cancer. Currently, biopsy is the gold standard for cancer diagnosis, which involves removal
of tissue from the mammary tumor, and then be examined by a pathologist. It is invasive, expensive and
requires highly trained surgeons and pathologists. The results require several days to be prepared and
therefore the technique is time consuming. Moreover, in a biopsy, the whole tumor is not analyzed, only a
few tissue samples from the tumor are taken. To avoid the above disadvantages, we develop a portable
hyperspectral imaging system for characterizing canine mammary tumors.
Figure 1: Needle biopsy for breast cancer. The method is invasive and time-consuming
2
Recently, hyperpsectral imaging is an emerging technology in the field of biomedical engineering which
may be used as a non-invasive modality for cancer characterization. For example, using hyperspectral
imaging (HSI), prostate cancer has been detected with 92.8% sensitivity and 96.9% specificity [3]. Also
cancers like gastric cancer [4] and tongue cancer [5] has been detected using hyperspectral imaging. For
tongue cancer, the authors in [5] obtain 96.5% recognition rate. HSI was used by Medina for the
characterization of iris reflectance to non-invasively diagnose ocular diseases [6] and by Panasyuk for the
detection of tumor and normal breast tissues [7]. This imaging technology has also been used for the
detection and analysis of intestinal ischemia [8], diagnose hemorrhage shock [9], detection and
characterization of emphysema from healthy lung tissue [10] and in-vivo detection and grading of
cervical precancers and of pigmented skin lesions [11].
Hyperspectral imaging is capable of providing both the spectral and spatial information of tissues over
hundred or more spectral bands. So it extends invisible wavelength regions to human vision range. Thus
hyperspectral imaging may aid a surgery, and allow the assessment of tissue continuously without
interrupting surgery. Thus, it can be used as a virtual biopsy [3]. So HSI is non-invasive less time-
consuming. In this project, near infrared hyperspectral imaging will be used for canine cancer
characterization.
1.2 Statement of Problem
The ultimate goal of this project is to discern benign and malignant canine mammary cancer by near-
infrared hyperspectral imaging.
1.3 Research Objectives
The research objectives of this project are:
a) Conduct a thorough literature search on cancer detection using hyperspectral imaging.
b) Design an experiment to acquire the hyperspectral images of the canine mammary tumors from
the canine patients
c) Find the best normalization and preprocessing techniques to normalize the spectra.
d) Develop an algorithm to discern the malignant tumors from the benign tumors.

3
1.4 Organization of Thesis Proposal
This thesis proposal document is organized as follows. A background is given in order to lay the
foundation for this work. The concept of infrared hyperspectral imaging is described. Then cancer
detection using hyperspectral imaging is introduced. The method of breast, gastric, prostrate, skin and
tongue cancer characterization using hyperspectral imaging is described. Following the background
section, the experimental setup and data acquisition method is detailed. Normalization of the spectral data
is very important for data analysis. So the normalization and other preprocessing techniques are
described, followed by the different types of algorithms which will be tried out on the canine spectral data
to discern malignant and benign canine mammary tumors. Preliminary results are shown thereafter,
followed by the Discussion section, where different issues faced during the project are discussed. Finally
the proposal document ends with a detailed research plan.
2. Background
2.1 Infrared Hyperspectral Imaging
Conventional color cameras acquire intensity information from the visible electromagnetic spectrum, that
is, red, green and blue. Hyperspectral imaging measures and collects intensity information over more than
hundred spectral bands across the electromagnetic spectrum. So it extends invisible wavelength regions to
human vision range. Hyperspectral images are acquired by ‘hyperspectral sensors’ and these sensors have
a variety of applications in the fields of agriculture, physics, remote sensing and surveillance. This
technique was used originally for the purpose of remote sensing, and that project was initiated and
developed by NASA [12]. But recently, hyperspectral imaging is also being used in the field of medicine,
particularly cancer detection. This is because this kind of novel technology can quantify several
biomarkers found in tissue, and thereby can be used for non-invasive tissue analysis.
During hyperspectral imaging, the data produced by the sensor consists of a collection of images. This set
of images can be represented by a three dimensional cube of image, where the first two coordinates
represent the spatial coordinate of a pixel and the third coordinate gives the wavelength of a particular
spectral band. Thus it gives both the spectral and spatial information at the same time. The accuracy of
these sensors is measured in terms of two parameters: spatial resolution and spectral resolution. Spectral
resolution is the width of each band of the spectrum and is given by ∆λ, where ∆λ is the minimum
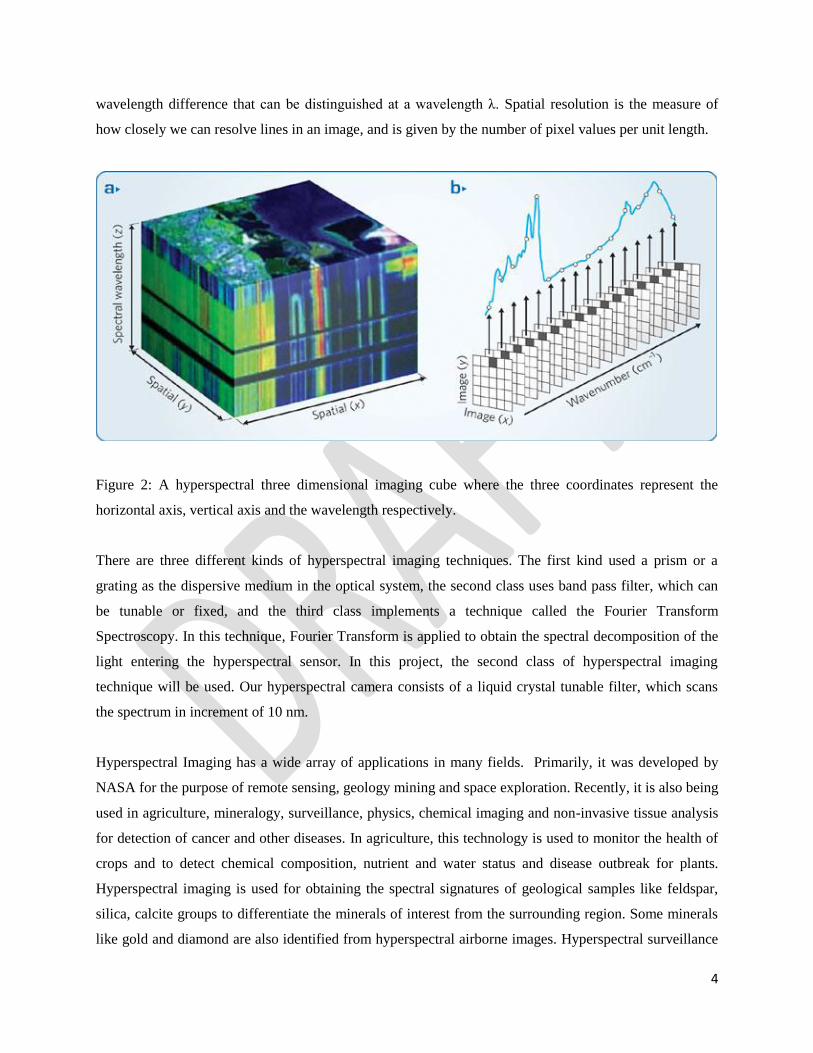
4
wavelength difference that can be distinguished at a wavelength λ. Spatial resolution is the measure of
how closely we can resolve lines in an image, and is given by the number of pixel values per unit length.
Figure 2: A hyperspectral three dimensional imaging cube where the three coordinates represent the
horizontal axis, vertical axis and the wavelength respectively.
There are three different kinds of hyperspectral imaging techniques. The first kind used a prism or a
grating as the dispersive medium in the optical system, the second class uses band pass filter, which can
be tunable or fixed, and the third class implements a technique called the Fourier Transform
Spectroscopy. In this technique, Fourier Transform is applied to obtain the spectral decomposition of the
light entering the hyperspectral sensor. In this project, the second class of hyperspectral imaging
technique will be used. Our hyperspectral camera consists of a liquid crystal tunable filter, which scans
the spectrum in increment of 10 nm.
Hyperspectral Imaging has a wide array of applications in many fields. Primarily, it was developed by
NASA for the purpose of remote sensing, geology mining and space exploration. Recently, it is also being
used in agriculture, mineralogy, surveillance, physics, chemical imaging and non-invasive tissue analysis
for detection of cancer and other diseases. In agriculture, this technology is used to monitor the health of
crops and to detect chemical composition, nutrient and water status and disease outbreak for plants.
Hyperspectral imaging is used for obtaining the spectral signatures of geological samples like feldspar,
silica, calcite groups to differentiate the minerals of interest from the surrounding region. Some minerals
like gold and diamond are also identified from hyperspectral airborne images. Hyperspectral surveillance

5
is used for military purposes, and it is able to detect the presence of opposition even if countermeasures
are taken to avoid airborne surveillance. Nowadays, hyperspectral camera which incorporates thermal
infrared imaging are used for this purpose. Chemical Imaging is another application for which
hyperspectral imaging is used. At war, soldiers are exposed to chemical agents and harmful plumes which
are difficult to detect. But using hyperspectral imaging, detection and identification of such harmful
chemicals have now become possible. This technology is also used in many countries for the continuous
montitoring of oil drills. If oil leaks from the oil drill, it could cause extensive damage to the ecosystem.
So hyperspectral sensors can be deployed to build detection and warning system for oil drills .
In this project, we will focus on the use of hyperspectral imaging for non-invasive canine cancer
detection. Near-infrared hyperspectral imaging has been used for the detection of various kinds of cancer;
breast, gastric, prostate, tongue. In this project, we focus on the near-infrared region (NIR) that extends
from 650nm to 1100nm. This is because NIR light is absorbed by certain chromophores that are
biochemically significant, namely, hemoglobin, water and lipid. Thus using NIR spectroscopy, we can
quantify the concentration of these important biomarkers. Literature shows that NIR light penetrates into
tissue farther than light in any other spectrum, because tissue has low absorptivity in this region. Thus
weakly absorbed NIR light that can penetrate several centimeters is used for the hyperspectral imaging of
thick tissue such as brain, breast and muscle [19]. Literature shows some favorable results in the detection
of breast cancer using NIR spectroscopy. Since canine mammary tumor is physiologically similar to
human breast tumor, we use NIR spectral range (650-1100nm) as the light transmission range for our
project.
Figure 3: A hyperspectral imaging setup for tissue analysis. In our experiment we will use halogen
tungsten light instead of laser

6
2.2 Cancer Detection Using Infrared Hyperspectral Imaging
2.2.1 Prostate Cancer Detection
Devising non-invasive techniques for early detection of cancer has now become a promising field in the
area of biomedical engineering and medical science Paper by Akbari et al. [3] describes a non-invasive
detection method of prostate cancer cell in mice using hyperspectral image processing and machine
learning techniques.
Using least square support vector machines, the authors classify the hyper spectral images of the
cancerous and normal tissue. They also indicate the differences of reflectance properties in cancer and
normal tissue using spatially resolved images. The experiment is carried out on diseased mice (in-vivo) as
well as on pathological slides (in-vitro).
To remove the spectral non-uniformity of illumination device, the authors use a normalization technique.
The technique is to minimize the influence of dark current. To solve the classification problem, the
authors employ least square support vector machine in which we solve a linear equation (instead of
quadratic programming) in high dimensional space or kernel space. In any least square method, we aim to
minimize the sum of the square of the error.
Figure 4a: Detection of prostate cancer tissue
(green area) using the classification method
with least square support vector machine.
Figure 4b: In-vivo spectral signature of benign
and malignant lesion. The dashed red lines
represent the malignant lesion and the
continuous line represents the benign regions.

7
The authors evaluate the classification technique using two parameters: sensitivity and specificity.
Sensitivity measures the percentage of correctly identified tumor tissue and specificity measures the
percentage of healthy tissue correctly identified. The results show the specificity of the classification
technique is 92.8% (with a margin of 2.0%) and sensitivity of 96.9 % (with a margin of 1.3%) for 11 mice
[3].
The method describe above is superior to conventional methods like tissue biopsy because it measures
spectra of tissue point by point. It also spectrally and spatially verifies the spectral variations of different
types of tissue. Therefore, it is a continuous non-intervening evaluation technique for suspicious cancer
tissues and can be used as a virtual biopsy [3].
2.2.2 Tongue Cancer Detection
The paper by Liu [5], describes tongue cancer detection using hyperspectral imaging. The reflectance
spectra dataset of 34 tongue tumors were collected using an acousto-optic tunable filter (AOTF) and a
spectral adapter. For medical applications, most hyperspectral systems use tunable filters rather than
spatial scanning, because they do not need mechanically moving part and are faster. AOTF is a solid state
tunable filter and is based on the principle of acoustic diffraction of light in an anisotropic medium. They
are advantageous over other spectrometers, because they are not sensitive to mechanical shock or
vibration. AOTF technology also provides wider tuning range, more field of view, and can be easily
programmed. For illumination purposes, the authors have used 500W halogen lamps. Noise is present in
the tumor spectral data because of the saliva on the tongue and its instinctive squirming. For denoising,
the authors used median filters. To remove the spectral non-uniformity, a normalization procedure has
been used using standard reflectance boards.
Sparse representation (SR) has been used as the classification algorithm to detect the cancerous tongue
tumors. Sparse signal representation has been proven to be an extremely powerful computer vision tool
for representing high dimensional signals [5]. This is because some classes of signals have naturally
occurring sparse properties. The authors have first shown the difference in the spectral properties of the
tumor and normal tissue. The SR classifier was used to develop an algorithm to detect the cancerous
pixels from the non-cancerous pixels. The authors achieved a recognition rate of 96.5%.
To prove that SR algorithm is computationally superior to traditional hyperspectral algorithms like
support vector machine (SVM) or relevance vector machine (RVM), the authors have compared the
performance of the SR algorithm to that of the SVM and RVM. The SR method worked better than the
other two even when the tumors were less than 3mm deep and was covered with mucosa. The authors

8
have also shown that the classification time for their method is less than SVM and RVM. The false
negative rate (FNR) and the false positive rate (FPR) were calculated for each hyperspectral image. The
SR method showed a FNR and FPR of 6.3% and 8.7% respectively [5].
Thus this method shows promise in the detection of tongue cancer using hyperspectral imaging and sparse
representation. This computer aided tool can help the doctors decide non-invasively as to whether a
patient has tongue cancer.
2.2.3 Gastric Cancer Detection
The paper by Akbari [4] describes gastric cancer detection using infrared hyperspectral imaging. Gastric
tumors were imaged from 10 human subjects and the results were correlated with the histopathology
results. A total of 101 images were taken from the 10 patients. So each sample was imaged 10 times, to
ensure repeatability of the system. The NIR spectral range of 1000-2500 nm was used for this project.
The hyperspectral imaging device was a tunable optical band pass filter, and the spectral resolution of the
camera was 6.29 nm. The light source for illumination consisted of two 150W halogen lamps, with
diffuse reflectors. In this experimental setup, the camera was attached to a frame and the frame was fixed.
The frame was controlled by a linear actuator. This made sure that the distance between the lens and the
sample is constant. This is a very important factor that should be kept in mind while designing our canine
experiment.
Figure 5: The hyperspectral imaging setup used by the authors for the gastric cancer experiment

9
In this paper, the authors have normalized the data using standard reflectance boards. The noise was
removed by median filtering. The differences in the spectral characteristics of the tumor and the normal
tissue have been shown. The standard deviation of the spectral signature of the tumors is higher compared
to the normal tissue. Four different classification methods, the support vector machine (SVM), standard
deviation (SD) method, integral method and the normalized difference cancer index (NDCI) method were
used to detect the cancerous tumors. Out of these four algorithms, NDCI gave the best results. Using this
method, the authors obtained a sensitivity and specificity of 93% and 91% respectively [4].
The above proposed method shows potential in the non-invasive detection of gastric cancer. This method
could detect tumors less than 0.5mm in size [4]. Also, determining the tumor bed during surgery is also
challenging for the doctors. Such imaging technology can be used to determine the tumor bed during
surgery and also to ensure that the entire tumor has been removed after tumor resection. This it can help
in the segmentation of tumors and remove ambiguity between the malignant and benign regions.
2.2.4 Breast Cancer Detection
Diffuse optical spectroscopy using the near-infrared light spectrum has been investigated for the detection
and clinical management of breast cancer [13] [14]. In these papers, instrumentation consists of a
broadband steady-state spectrometer system (650-1100nm) and a six wavelength frequency domain
instrument which consists of six laser diodes (661, 686, 786, 808, 822, and 852 nm). A fiber optic cable
delivers the laser light to the tissue. A hand held probe which consists of an avalanche photodiode
detector, records the diffused light signals from the tissue. Although this system is different from the
hyperspectral imaging setups used in the previous papers, the principle is the same; they investigate non-
invasive tissue analysis using laser scanners and NIR light.
Currently, the most common non-invasive procedure for breast cancer screening is mammography;
however this method suffers from low sensitivity and specificity and does not work well for dense breast
masses. Because of these disadvantages, many research groups have tried to use optical methods for
breast cancer screening. Optical methods are non-invasive, less time-consuming, do not use ionizing
radiation and is less expensive. In these papers, the authors have used NIR laser diodes to enhance
physiological and biochemical contrast between the malignant and normal breast tissues.
Paper by Cerussi [15] presents the clinical results from 58 malignant breast tumors. Physiological
properties like hemoglobin, water and lipid content was significantly different between malignant and
normal breast tumors. Malignant tumors showed higher concentration of deoxy-hemoglobin, oxy-

10
hemoglobin and water and lower contents of tissue lipid compared to normal tissue. A tissue optical index
was defined which increased the contrast between the malignant and normal tissue.
2
2
[ ][ ]
[ ][ ]
H O HbTTOI
Lipid StO
These measurements have underlying physiological meaning: Higher content of hemoglobin (HbT)
suggests elevated tissue volume and angiogenesis; higher water content (H2O) suggest edema and
increased cellularity, decreased StO2 indicated tissue hypoxia (a pathological condition in which tissue is
deprived of adequate oxygen supply) driven by metabolically active tumor cells, decreased lipid content
[Lipid] reflects displacement of parenchymal adipose. A higher TOI suggest that the tumor is malignant,
because it indicates higher metabolic activity of the cells [14].
Also, an important application of the above proposed method is monitoring the response of patients to
cancer therapies. One of the cancer therapy methods for women in advanced stages of breast cancer is
pre-surgical chemotherapy, which can shrink tumors to a smaller size, so that they can be operated and
surgically removed. In order to maximize the therapeutic effectiveness, the above proposed non-invasive
optical method can be used to examine and assess the physiological properties of the tumor.
2.2.5 Skin Cancer Detection
Skin cancer is a common form of cancer and more than a million people are annually affected by this
form of cancer in the United States. Dermatologists identify skin melanomas, but biopsy is required for
definitive evaluation. But biopsy is not feasible for a patient with a large number of melanomas.
Therefore, a non-invasive method to detect skin cancer in place of the traditional biopsy is in great
demand.
The paper by Zeng [16] describes a method of skin cancer detection using Raman spectroscopy. In this
paper, the authors develop a clinical research prototype that can obtain Raman spectra from skin in vivo
within 1 second. The imaging instrument consists of a diode laser (785 nm), a spectrograph, a CCD
detector and Raman optical probe. The probe was designed in such a way that the collection of Raman
signals is maximum. In order to process the raw spectral data, a polynomial fitting algorithm was used to
remove the background fluorescence. Data from 274 skin lesion were analyzed which included cancers,
precancerous tumors and benign lesions. Using Raman spectroscopy, the authors obtained sensitivity and
specificity of 90% and 75%.

11
2.2.6 Canine Mammary Tumor Detection
In the paper by Gurfinkel [21], fluorescent dyes have been used to discern canine adenocarcinoma from
normal tissue. Two fluorescent dyes: indocyanine green (ICG) and carotene-conjugated 2-devinyl-2-(1-
hexyloxyethyl) pyropheophorbide (HPPH-car) were administered intravenously in the canine patient. For
illumination of the tissue, a 660 nm laser diode beam was used. The fluorescence generated by the dyes
upon propagating to the tissue surface, is captured by a CCD camera. The uptake and release rates of the
dye were studies and they varied considerably in the diseased and normal tissue. Pharmacokinetic model
was used to monitor the delivery of the dyes.
2.3 Other diseases diagnosed by Hyperspectral Imaging
Hyperspectral imaging has also been used to detect diseases such as intestinal ischemia and lung
emphysema [17] [10]. Paper by Akbari [17] describes the detection of intestinal ischemia using
hyperspectral imaging both in the visible and the invisible wavelength range. Intestinal Ischemia is caused
by the insufficient flow of oxygenated blood to the intestine, which may result in bloody diarrhea,
gangrene and other infection. The spectral signatures of the intestinal ischemic region of a pig’s intestine
were extracted using two hyperspectral imagers (400-1000nm and 900-1700nm). Two filters were
designed as the classification algorithm and the results were compared with that of the traditional support
vector machine (SVM) method. One of the filter classification method could detect ischemic tissue from
normal intestinal tissue and other organs with a FPR (False Positive Rate) and FNR (False Negative Rate)
of 1% and 1% respectively. The SVM method gave a FPR and FNR of 5% and 6% respectively.
The paper by Jong-Ha Lee [10] describes the characterization of emphysema from healthy tissue using
hyperspectral imaging. The NIR spectral range of 650nm to 1100nm was used. Peak absorption intensity
was observed at four wavelengths (760, 805, 915, and 970 nm), which is characteristic of the four tissue
chromophores. Spectral signatures from the normal pig’s lung phantom and the smoker’s lung phantom
were extracted and compared. The reflectance intensity of the smoker’s lung tissue was considerably
higher than the normal lung tissue over the entire wavelength range (650-1100nm). This information
could be useful for detecting lung emphysema from healthy lung tissue.

12
3. Experimental Setup and Data Acquisition
In this section, the hyperspectral imaging system will be described. Also, the method of acquiring
hyperspectral images of the canine mammary tumors from the canine patients will be described.
3.1 Hyperspectral Imaging System Description
To capture the hyperspectral imaging data, a portable hyperspectral tunable imaging system was used. It
consists of digital imager (Qimaging Inc., Surrey, British Columbia), a Liquid Crystal Tunable Filter
(LCTF Cambridge Research & Instrumentation Inc., Massachusetts), and LCTF controller. The digital
imager was a 1.4 megapixel, mono-cooled CCD (charged coupled device) camera; with a cell size of 6.45
µm x 6.45µm and 12 bit output. The filter is placed in front of the digital imager and has a transmission
wavelength range between 650 to 1100nm with a 10nm increment. While capturing the image, the
distance between the lens and the sample to be imaged should be constant. And care should be taken that
the light falls as uniformly as possible on the subject.
The LCTF controller synchronizes between digital imager and LCTF. It also varies the programmed
sequential bands of filter. The tuning speed of the filter is between 50 ms to 150 ms. During acquisition of
the images, dual 500W quartz tungsten halogen lamps have been used for illumination. An Apple
Macbook Pro laptop computer is used for the spectral image acquisition purposes. The image is visualized
and the spectral signature is plotted using ENVI software (Ver. 4.5, ITT Visual information solutions,
Boulder, CO) and ‘The Unscrambler’ version 10.1 (CAMO Software AS, Oslo, Norway) . Figure 1 shows
the proposed HSI system setup.

13
Figure 6: Schematic view of the hyperspectral imaging acquisition system. The LCTF and the computer
are connected by a firewire (1394) cable. The camera and the controller are connected by a USB cable. To
connect the LCTF controller and the camera, a parallel port cable has been used.
3.2 Data Acquisition from canine patients
The data was acquired in collaboration with the University of Pennsylvania Veterinary Hospital. These
canine patients had multiple mammary tumors in their abdomen. The animal experiments were approved
by the University of Pennsylvania IACUC Protocol #803829. In this study, the hyperspectral imaging
experiment was performed on 9 dogs. Prior to image acquisition, the tumors were marked with a black
marker, so that it would be easier to recognize the tumor during image analysis. During image acquisition,
the dogs were held by the veterinary doctor. Each dog had to undergo biopsy to detect the malignancy of
the tumors. The histopathology results were compared with our imaging analysis results. Figure 2 shows a
canine patient with multiple mammary tumors.

14
Figure 7: The canine patient with multiple mammary tumors held by the doctor as images are being
captured by the hyperspectral system.
Figure 8a: The hyperspectral
image of canine mammary tumors
at 760nm wavelength
Figure 8b: The digital image of
canine mammary tumors.

15
4. Normalizing and Preprocessing of data
This section describes the normalization and preprocessing techniques that will be investigated. In the
first section, data normalization using standard reflectance boards will be described. This is the standard
normalization procedure followed by most research groups. However, these standards were not used
during our canine experiment. There are a number of normalization techniques which are available in The
Unscrambler 10.1.These techniques are also widely used normalizing NIR data. Taking first and second
derivative of the spectral data is a way of preprocessing the data to correct the baseline effects. Derivative
methods and their applications are also discussed in this section.
4.1 Data Normalization by the radiometric reflection calibration process
The captured data should be normalized to treat the spectral non-uniformity of the illumination device.
The raw data changes due to several factors like illumination conditions, temperature and non-uniform
contour of the subject. To minimize these varying conditions, spectral data has to be normalized. The
radiometric reflectance normalization process involves a pixel-to-pixel normalization of the hyperspectral
image data to percentage reflectance. This is the most common approach for radiometric calibration and
has been widely used [3] [4] [5]. White reference and dark current are two data that should be captured
for normalization. White reference is the spectrum acquired by the hyperspectral sensor by placing the
white reference board in the field of view. For this purpose, Spectralon diffuse reflectance standard SRS-
99 for an approximately 99% reflectance (Labsphere Inc., Sutton, NH) should be used. The dark current is
measured by taking a dark image in the absence of light. For this purpose, Spectralon diffuse reflectance
standard SRS-02 for an approximately 2% reflectance (Labsphere Inc., Sutton, NH) should be used [2].
White reflectance is used to show the maximum reflectance in each wavelength. Dark current is used to
address the defects by calculating the peaks in the dark current spectrum with temperature. Then the raw
data is corrected using the following equation:
( ) ( ) ( )
( ) ( )
Where ( ) is calculated reflectance value for each wavelength, ( ) is the reflectance intensity of
the raw data, and ( ) and ( ) are the reflectance intensity of the 2% reflectance standard board
and the 99% reflectance standard board, respectively.

16
4.2 Other Normalization Methods
Normalization is a family of transformations that are computed sample-wise. Its purpose is to “scale”
samples in order to get all data on approximately the same scale. The following normalization methods
are also used in normalizing NIR spectral data [18]:
Area Normalization
This transformation normalizes a spectrum by calculating the area under the curve for the observation.
The area under the curve becomes the same for all samples. It attempts to correct the transmission spectra
for indeterminate path length when there is no way of measuring it.
Unit Vector Normalization
This transformation normalizes sample-wise data to unit vectors. It is useful for pattern recognition
applications. The normalized samples have a length (“norm”) of 1.
Mean Normalization
This is the most classical case of normalization. It consists in dividing each row (each observation) of a
data matrix by its average. This transformation is used in chromatography to express the results in the
same units for all samples, no matter which volume was used for each of them.
Maximum Normalization
This is an alternative to classical normalization which divides each row by its maximum absolute value. If
all values are positive the maximum value becomes +1. If all values are negative the minimum value
becomes -1. If the sign of the values changes over the curve either the maximum value becomes +1 or the
minimum value becomes -1.
Range Normalization
Here each row is divided by its range, i.e. “max value – min value”.

17
4.3 Derivative Methods and its applications
Derivative method is a preprocessing tool and it is applied to the reflectance spectra. Derivatives are
applied to correct for baseline effects in spectra for the purpose of removing nonchemical effects and
creating robust calibration models. Derivatives may also aid in resolving overlapped bands.
First derivative
The first derivative of a spectrum is simply a measure of the slope of the spectral curve at every point.
The slope of the curve is not affected by baseline offsets in the spectrum, and thus the first derivative is a
very effective method for removing baseline offsets. However, peaks in raw spectra usually become zero-
crossing points in first derivative spectra, which can be difficult to interpret.
Second derivative
The second derivative is a measure of the change in the slope of the curve. In addition to ignoring the
offset, it is not affected by any linear “tilt” that may exist in the data, and is therefore a very effective
method for removing both the baseline offset and slope from a spectrum. The second derivative can help
resolve nearby peaks and sharpen spectral features. Peaks in raw spectra change sign and turn to negative
peaks with lobes on either side in the second derivative. Also, we can identify the wavelengths
characteristic of deoxy-hemoglobin, oxy-hemoglobin, lipid and water respectively by applying second
derivative method on the reflectance/absorbance spectra of the canine spectral dataset. The negative peaks
obtained in the second derivative curve would give the wavelengths corresponding to the chromophores.
5. Data Analysis
In this section, we will be discussing the various algorithms that will be applied on the canine spectral
data set in order to differentiate the malignant and benign spectra.
5.1 Support Vector Machines
Support Vector Machine (SVM) is a pattern recognition method that is used widely in data mining
applications, and provides a means of supervised classification. SVM was originally developed for the
linear classification of separable data, but is applicable to nonlinear data with the use of kernel functions.

18
SVM are used in machine learning, optimization, statistics, bioinformatics, and other fields that use
pattern recognition. The algorithm used within The Unscrambler 10.1 is based on code developed by
Chih-Chung Chang and Chih-Jen Lin of the National Taiwan University. Hsu et al, 2009 [20].
SVM is a classification method which is based on statistical learning. For classification purposes, it
constructs a hyperplane in a high dimensional space. As the linear function is not always able to model
such a separation, data are mapped into a new feature space and a dual representation is used with the data
objects represented by their dot product. To handle non-linear classification cases, a kernel based SVM
was proposed. Kernel based SVM maps high dimensional data from the original feature space to the
kernel space, after which they solve the equations in the kernel space linearly. The support vector is
defined as the reduced training data from the kernel.
SVM has advantages over classification methods such as neural networks, as it has a unique solution, and
has less tendency of over fitting when compared to other nonlinear classification methodologies. Of
course, the model validation is the critical aspect in avoiding overfitting for any method. SVMs are
effective for modeling of nonlinear data, and are relatively insensitive to variation in parameters. SVM
uses an iterative training algorithm to achieve separation of different classes.
Two SVM classification types are available in The Unscrambler 10.1 which is based on different means
of minimizing the error function of the classification. C-SVC: also known as Classification SVM Type 1
and nu-SVC: also known as Classification SVM Type 2. In the c-SVM classification, a capacity factor, C,
can be defined. The value of C should be chosen based on knowledge of the noise in the data being
modeled. Its value can be optimized through cross-validation procedures. When using nu-SVM
classification, the nu value must be defined. Nu serves as the upper bound of the fraction of errors and is
the lower bound for the fraction of support vectors.Increasing nu will allow more errors, while increasing
the margin of class separation. The kernel type to be used as a separation of classes can be chosen from
the following four options:
Linear
Polynomial
Radial basis function
Sigmoid
The radial basis function is set as the default kernel because it is the simplest and can model systems of
varying complexity. It is an extension of the linear kernel. If the number of variables is very large the data

19
do not need to be mapped to a higher dimensional space and the linear kernel function is preferred. If a
polynomial kernel is chosen, the order of the polynomial must also be given.
In the Unscambler version 10.1, when an SVM model is created a new node is added in the project
navigator with a folder for the data used in the model, and the results folder. The results folder has the
following matrices:
Confusion matrix
Parameters
Probabilities
Prediction
The main result of the SVM is the confusion matrix, which indicates how many samples were classified
in each class, and the prediction matrix, which indicates the classification determined for each sample in
the training set [20].
5.2 Linear Discriminant Analysis
Linear Discriminant Analysis (LDA) is a classification method that provides a linear transformation of n-
dimensional feature vectors into an m-dimensional space (m < n). LDA is a supervised classification
method, as the categories to which objects are to be classified is known before the model is created. The
objective of LDA is to determine the best fit parameters for classification of samples by a developed
model. The model can then be used to classify unknown samples.
LDA is the simplest of all possible classification methods that are based on Bayes’ formula. From Bayes’
rule one develops a classification model assuming the probability distribution within all groups is known,
and that the prior probabilities for groups are given, and sum to 100% over all groups. It is based on the
normal distribution assumption and the assumption that the covariance matrices of the two (or more)
groups are identical. This means that the variability within each group has the same structure. The only
difference between groups is that they have different centers. LDA considers both within-group variance
and between-group variance. The estimated covariance matrix for LDA is obtained by pooling covariance
matrices across groups.
When the variability of each group does not have the same structure (unequal covariance matrix), the
shape of the curve separating groups is not linear, and therefore quadratic discriminant analysis will

20
provide a better classification model. The distance of observations from the center of the groups can also
be measured using the Mahalanobis distance.
LDA is used for classifying objects (samples, people, foods, etc.) into groups based on features that can
be used to describe the objects. This could include developing classifications models for a library of
products, good vs. bad quality product, or healthy vs. cancerous cells. A typical example related to
classifying objects or, more generally, recognizing patterns is not a simple task for automated procedures,
particularly when the objects are of biological interest. For example, identifying species, predicting
species distributions or finding gene expression patterns that predict the risk of developing a particular
type of tumor are generally difficult tasks. Data can be different analytical techniques related to
chromatographic hyphenated techniques, like liquid chromatography with diode array detection (LC-
DAD), where a set of UV-Vis spectra are used for classification. Data from any type of measurement,
including spectroscopic data, imaging data, or generic data such as a table of physical properties of
samples, can be used for classification, if those measurements have features which describe the objects.
But for an LDA to be a well-posed problem, the number of objects in the calibration set should be larger
than the number of variables. Often variable selection is used during model development when LDA is
applied to spectral data.
In order to overcome the constraint of requiring more objects than features, we may use PCA-LDA which
reduces the data dimensionality using PCA prior to running LDA. The number of components would still
need to be less than the number of objects in each class. PCA-LDA makes use of a common projection
space for all the classes. This option may be chosen for classification using spectral data by enabling it in
the Options tab of the analysis dialog.
Discriminant analysis can be done in The Unscrambler 10.1 using linear discriminant analysis, which is
described in the following, or by partial least squares regression methods (PLS-DA). LDA can be done in
many different ways and The Unscrambler version 10.1 has options for Linear, Quadratic and
Mahalanobis classifiers.
The linear method is used when the difference between two groups can be represented by a linear
function. When a curved line separates the distance between groups, the quadratic method is effective.
This is the case when the covariance matrices differ from group to group. Quadratic discriminant analysis
may perform better in situations where the different groups being classified have their main variability in
different directions, but only when the training sets used are large. The Mahalanobis distance is a way of
measuring the distance of an observation to the centers of the groups, and uses ellipses to define the
distances.
21
The results of the LDA classification are the predicted class for each sample, presented in the results
matrix Prediction, and the matrix containing the Confusion matrix. The prediction matrix exhibits the
probability of membership for each class, as well as the predicted class for each sample added as a
category variable in the column Predicted. For an LDA to be performed, the number of samples within
each category must be more than the number of variables.
5.3 Principal Component Analysis
Principal Component analysis is a mathematical variable reduction procedure, that converts a larger
number of observed variables into a smaller number of variable (called principal components), that will
take in account most of the variance in the observed variables. Number of original variables is more than
or equal to the number of principal componnets. In this technique, the first principal component has the
highest variance; the second principal component has the second highest variance and so on. But each
principal component should be orthogonal to the one before that.
PCA helps us to identify pattern in data and emphasize on the similarities and differences of the dataset.
When the data had a large number of variables, patterns in the dataset are difficult to be recognized. So
PCA is a useful tool for analyzing data In this project, we can use PCA on the raw canine data, and also
the normalized data to see if we get separate clusters of the benign, malignant and normal Region of
Interests (ROI). We will be using the PCA plot tool in the Unscrambler 10.1 for this purpose.
5.4 Tissue Optical Indices
A variety of optical indices have been developed in literature, that best correlate with the pathological
state of breast tissue or with tissue density levels [13 ]. For example, tissue optical indices (TOI) aimed at
enhancing contrast between cancerous and healthy tissue has been defined as follows:
2
2
[ ][ ]
[ ][ ]
H O HbTTOI
Lipid StO
(1)
These measurements have underlying physiological meaning . Higher content of hemoglobin (HbT)
suggests elevated tissue volume and angiogenesis; higher water content (H2O) suggest edema and
increased cellularity, decreased StO2 indicated tissue hypoxia (a pathological condition in which tissue is
deprived of adequate oxygen supply) driven by metabolically active tumor cells, decreased lipid content
[Lipid] reflects displacement of parenchymal adipose. A higher TOI suggest that the tumor is malignant,
because it indicates higher metabolic activity of the cells.

22
For this method, we need to find out the four wavelengths characteristic of the four tissue chromophores.
Then we have to find a relationship between the two parameters: concentration and the reflectance
intensity. This is because the above formula is in terms of concentration but our spectral data is in terms
of reflectance intensity.
6. Preliminary Results
In this section, we discuss the preliminary results. The aim of these experiments is to demonstrate the
potential of hyperspectral imaging system for mammary tumor characterization and discriminate benign
and malignant mammary tumors. A total of 22 mammary tumors were used for the in vivo imaging study.
Hyperspectral images were acquired from each canine patient. Quantitative analysis of the spectral
images was performed to compare the spectra of cancer, benign and normal tissue.
As shown in Figure 9 and 10, the spectra of cancer tissue clearly differ from those of benign and normal
tissue. It is interesting that the cancer tissue, within a single patient, has relatively low reflectance
intensity compared to the benign and normal tissue, in the wavelength range between 650nm to 1100nm. .
Previous studies have shown that cancerous tissues are associated with higher hemoglobin and water
content, and lower lipid concentration with respect to benign tissue. The decreased reflectance intensity
observed for malignant tumors is due to the increased microvasculature and therefore higher blood
content of cancerous tissue relative to benign tissue.
Figure 9: The reflectance spectra of canine patient Kiki. The malignant tumor has a lower reflectance
intensity in the wavelength range 650-1100nm, which indicates increased absorption in this region. This
correlates with the literature results discussed in the previous section.
0
10
20
30
40
50
60
650 700 750 800 850 900 950 1000 1050 1100
Ref
lect
ance
inte
nsi
ty
Wavelength in nm
R1 (benign)
L3 (malignant)
Normal tissue 1
Normal tissue 2
Normal tissue 3
Normal tissue 4

23
Figure 10: The reflectance spectra of canine patient Tinkerbell. The malignant tumor has a lower
reflectance intensity in the wavelength range 650-1100nm, which indicates increased absorption in this
region. This correlates with the literature results discussed in the previous section.
7. Discussion
In this study, we propose to use a hyperspectral imaging system for canine mammary cancer detection.
The preliminary results are promising, and we see that within a single canine patient, we can differentiate
the malignant and benign spectra based on the reflectance intensities. The malignant spectra has a lower
reflectance intensity than the benign spectra over the NIR spectral range of 650-1100nm. This is due to
the fact that the malignant tumors exhibit increased metabolic activity and thus the tissue concentration of
oxy-hemoglobin and deoxy-hemoglobin is more in malignant tumors. Total hemoglobin concentration is
directly related to blood volume. Since the blood volume of malignant tissue is more, the reflectance
intensity value decreases.
There are a few issues that we faced during the hyperspectral imaging experiment of the mammary
tumors of the canine patients. The lighting provided to the sample should be as uniform as possible. We
used 500W white tungsten halogen lights to provide illumination. However, the temperature of the light is
very high and it is uncomfortable for the patient to be under such high power light for a long time. In
future experiments, we need to address this problem. Fiber optic cables can absorb some heat generated
by the lights. So using a lamp to which a fiber optic cable is attached can be one approach to address the
above issue. Also, the lamp that we are using at present is very large in size and not flexible. Using a lamp
0
10
20
30
40
50
60
70
80
90
650 700 750 800 850 900 950 1000 1050 1100
Refle
ctan
ce in
tens
ity
Wavelength in nm
L1 (malignant)
Normal tissue 1
Normal tissue 2
Normal tissue 3
Normal tissue 4

24
with a fiber optic cable would increase the flexibility of the setup. Figure 11 shows the quartz tunsten
halogen lamps that we are currently using. In future experiments, we can use the lightsources to which
fiberoptic cable can be attached , as shown in Figure12.
Figure 12: The 300W Sunbeam Xenon Lightsource to which a fiber optic cable can be attached.
Normalization of the data is also an important issue. Using the reflectance standards to normalize the data
is the most common approach. The images of the reflectance standards should be taken under similar
conditions and at the same time as the sample is imaged. However, during our data collection procedure,
we did not use the standards. Therefore, we will investigate the best way to normalize the data using one
of the software normalization methods. But in future experiments, we should definitely use the reflectance
standards to normalize the data. Another aspect that needs to be discussed is the fact that the canine
patients were not of uniform skin color. Some dogs had lighter skin color than the others. The skin color
could be a problem during spectral analysis, because the ligher skin would automatically reflect more
light than the darker skin.
Figure 11: The 500W quartz tungsten halogen lamp used in the canine experiment.
25
The evolving imaging modality may have many potential applications in the medical field. In patients
with cancer, if the cancer is diagnosed and treated early, the patient will have a better prognosis and a
much greater chance of full recovery. HIS can be used not only for diagnosis, but also to determine the
tumor margin. A safe resection margin can reduce operative mortality and morbidity, reduce the risk of
complications and side effects, and therefore, yield greater long-term patient survival and a significantly
more successful treatment outcome. Using HSI, a surgeon’s visual capability is extended to invisible
wavelengths. This technology expands the visual field from the three RGB spectral bands to more than a
hundred spectral bands. As the large amount of data in hyperspectral images can be processed to broaden
the spectral range, it can provide useful information for surgeons. HSI can also be used as a visual support
tool during surgery. For example, by extending the visual field to infrared or far-infrared regions,
previously invisible information can be exactly processed and then visually presented to a surgeon during
an operation. Spectral data with a wealth of information can be automatically analyzed and quantified in
order to aid in the identification of various tissue types. In this way, the imaging technique can extend a
surgeon’s visual field and thus help to continuously detect suspicious cancer tissues without interrupting
the surgical procedure.
HSI also has the potential to detect important molecular biomarkers of cancer based on the unique
spectral signature. Although the biochemical descriptions of the spectra are not known yet, it has been
shown that the differences between the two spectra are caused by the mammary cancer having increased
concentration of tissue water and hemoglobin and reduced concentration of lipid and StO2. Tumor tissue
displays decreased reflectance intensity in the 650-1100nm spectral range, corresponding to elevated
tissue hemoglobin and water content. Higher content of hemoglobin suggests elevated tissue volume and
angiogenesis; higher water content suggest edema and increased cellularity, decreased StO2 indicated
tissue hypoxia (a pathological condition in which tissue is deprived of adequate oxygen supply) driven by
metabolically active tumor cells.
8. Future Research Plan
From the preliminary results obtained, we clearly see that there are spectral differences between the
malignant, benign and normal Region of Interests (ROI). In future, we have to try out the different
algorithms described in the Section 5, and find out which algorithm gives the best sensitivity and
specificity.

26
To use the TOI method, we need to identify four wavelengths which are characteristic of deoxy-
hemoglobin, oxy-hemoglobin, lipid and water. We can do this in two ways: Plot the absorption spectra to
see if there are any peaks in the spectra which correspond to the four chromophores or plot the second
derivative reflectance/absorbance spectra and then look for the negative peaks. To use the TOI method we
have to find a relationship between the concentration of the chromophores and their reflectance
intensities. This is because the equation for the TOI is in terms of concentration, but in our spectral
dataset we have the reflectance values.
Also, as mentioned before, normalization of the data is very important for preparing the data for analysis.
So we have to figure the best way to normalize the data using the methods discussed in Section 4.2.
To ensure repeatability of the hyperspectral sensor, we can conduct an experiment where the spectral
image of a particular sample is taken in similar light conditions over 7 consecutive days, and the spectral
plots are compared to check how repeatable the system is.
Also, we have to find out what are the minimum size tumors that our spectral system can detect. And also
how deep into the tissue (depth of interrogation) the tumors can be detected.
References
[1] “Mammary Tumors: Introduction”. The Merck Veterinary Manual, 2006.
[2] http://www.caninecancer.com/mammary.html
[3] Akbari,Hamed, Halig,Luma V, Schuster, David M, Osunkoya, Adeboye, Master,Viraj, Nieh,Peter
T, Chen,Georgia Z, Fei,Baowei, Hyperspectral imaging and quantitative analysis for prostate cancer
detection, Journal of Biomedical Optics, 2012
[4] Hamed Akbari1, Kuniaki Uto, Yukio Kosugi, Kazuyuki Kojima, Naofumi Tanaka, Cancer detection
using infrared hyperspectral imaging, Cancer Science, pp: 852-857, 2011.
[5] Liu, Z.; Wang, H.; Li, Q. Tongue Tumor Detection in Medical Hyperspectral Images. Sensors 2012,
12, 162-174.
[6] Medina JM, Pereira LM, Correia HT, Nascimento SM, Hyperspectral optical imaging of human iris

27
in vivo: characteristics of reflectance spectra, J Biomed Opt, 2011.
[7] Panasyuk SV, Yang S, Faller DV, Ngo D, Lew RA, Freeman JE, Rogers AE, Medical
hyperspectral imaging to facilitate residual tumor identification during surgery, Cancer Biol Ther,
pp:439-46, 2007
[8] Akbari H, Kosugi, Y. ; Kojima, K. ; Tanaka, N, Detection and Analysis of The Ischemia Using
Visible and Invisible Hyperspectral Imaging, IEEE Transactions of Biomedical Engineering, pp. 2011-
2017, August 2010.
[9] Cancio LC, Batchinsky AI, Mansfield JR, Panasyuk S, Hetz K, Martini D, Jordan BS, Tracey B,
Freeman JE, Hyperspectral Imaging: A new Approach to the Diagnosis of hemorrhagic shock, J
Truama, pp: 1087-95, 2006 .
[10] Jong-Ha Lee, Chang-Hee Won, “Characterization of Lung Tissues using Liquid-Crystal Tunable
Filter an Hyperspectral Imaging System,” Proceedings of IEEE EMBC 09, 31th Annual International
Conference of the IEEE Engineering in Medicine and Biology Society, Minneapolis, MN, September 6-
9, 2009.
[11] C. Balas, G. Themelis, A. Papadakis, E. Vasgiouraki, A. Argyros, E. Koumantakis, A Tosca, E.
Helidonis, A Novel Hyper-Spectral Imaging System : Application on in-vivo Detection and Grading of
Cervical Precancers and of Pigmented Skin Lesions, In Proc. of "Computer Vision Beyond the Visible
Spectrum" CVBVS'01 Workshop, Hawaii, USA, Dec. 2001.
[12] A.F. H. Goetz, “Three decades of hyperspectral remote sensing of the earth: a personal view,”
Remote Sens. Environ. 113 (Suppl. 1), S5-S16, 2009
[13] Sergio Fantini and Angelo Sassaroli, Near-Infrared Optical Mammography for Breast Cancer,
Detection with Intrinsic Contrast, Annals of Biomedical Engineering, Vol 40, No. 2, 2011, pp. 398-407.
[14] Shah, N., A. E. Cerussi, D. Jakubowski, D. Hsiang, J. Butler, and B. J. Tromberg, The role of
diffuse optical spectroscopy in the clinical management of breast cancer. Dis. Markers 19:95–105,
2003.
28
[15]A. Cerussi, N. Shah, D. Hsiang, J. Butler, B. J. Tromberg, In vivo absorption, scattering, and
physiologic properties of 58 malignant breast tumors determined by broadband diffuse optical
spectroscopy, Journal of Biomedical Optics, 11(4), 044005, 2006.
[16] D. T. Dicker, J. Lerner, P. V. Belle, S. F. Barth, D. Guerry, M. Herlyn, D. E. Elder, W. S. El-Deiry,
Differentiation of Normal Skin and Melanoma using High Resolution Hyperspectral Imaging, Cancer
Biology and Therapy, 1033-1038, August 2006.
[17] H. Akbari, Y. Kosugi, K. Kojima, N. Tanaka, Detection and Analysis of the Intestinal Ischemia
Using Visible and Invisible Hyperspectral Imaging, IEEE Transactions on Biomedical Engineering, Vol
57, No. 8, August 2010.
[18]A. Rinnan, F. Berg, S. Engelsen, Review of the most common pre-processing techniques for near-
infrared spectra, Trends in Analytical Chemistry, Vol. 28, No. 10, 2009
[19] B.J. Tromberg, N. Shah, R. Lanning, A. Cerussi, J. Espinoza,T. Pham, L. Svaasand and J. Butler,
Non-invasive in vivo characterization of breast tumors using photon migration spectroscopy, Neoplasia
2 (2000), 26–40.
[20] The Unscrambler 10.1 Software Manual.
[21] M. Gurfinkel, A.B. Thompson, W. Ralston, T. L. Troy, A. L. Moore, T. A. Moore, J. Devens Gust,
D. Tatman, J. S. Reynolds, B. Muggenburg, K. Nikula, R. Pandey, R. H. Mayer, D. J. Hawrysz and E.
M. Sevick-Muraca, Pharmacokinetics of ICG and HPPH-car for the Deetction of Normal and Tumor
Tissue Using Fluorescence, Near-Infrared Reflectance Imaging: A Case Study, Photochemistry and
Photobiology, 2000, 72(1), 94-102