Hyperspectral-based characterization of grassland for the control of agri-environmental measures
20
Hyperspectral-based characterization Hyperspectral-based characterization of grassland for the control of agri- of grassland for the control of agri- environmental measures environmental measures Airborne Imaging Spectroscopy Workshop Airborne Imaging Spectroscopy Workshop 8 October 2004 - Bruges 8 October 2004 - Bruges Biometry, Data management and Agrometeorology Unit [email protected] – [email protected] CENTRE WALLON DE RECHERCHES AGRONOMIQUES
description
Hyperspectral-based characterization of grassland for the control of agri-environmental measures. Airborne Imaging Spectroscopy Workshop 8 October 2004 - Bruges. CENTRE WALLON DE RECHERCHES AGRONOMIQUES. Biometry, Data management and Agrometeorology Unit - PowerPoint PPT Presentation
Transcript of Hyperspectral-based characterization of grassland for the control of agri-environmental measures
Hyperspectral-based characterization Hyperspectral-based characterization of grassland for the control of of grassland for the control of
agri-environmental measuresagri-environmental measures
Airborne Imaging Spectroscopy WorkshopAirborne Imaging Spectroscopy Workshop8 October 2004 - Bruges8 October 2004 - Bruges
Biometry, Data management and Agrometeorology Unit
[email protected] – [email protected]
CENTRE WALLON DE RECHERCHES AGRONOMIQUES
Airborne Imaging Spectroscopy Workshop – Bruges, October, 8 2004Airborne Imaging Spectroscopy Workshop – Bruges, October, 8 2004
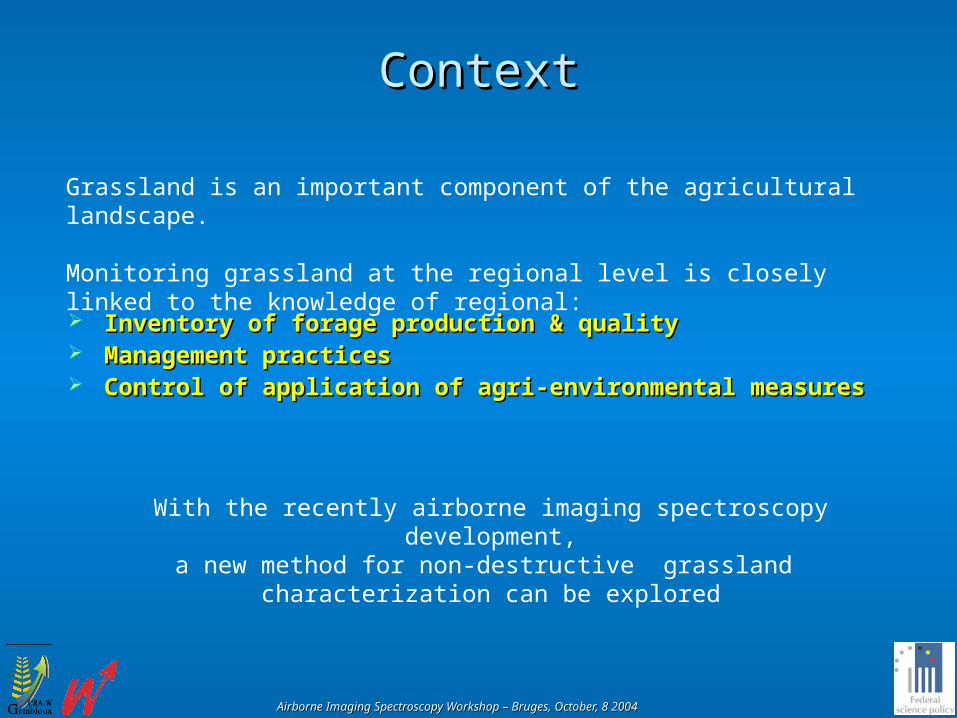
ContextContext
With the recently airborne imaging spectroscopy development,a new method for non-destructive grassland
characterization can be explored
Inventory of forage production & quality Inventory of forage production & quality Management practicesManagement practices Control of application of agri-environmental measuresControl of application of agri-environmental measures
Grassland is an important component of the agricultural landscape.
Monitoring grassland at the regional level is closely linked to the knowledge of regional:
Airborne Imaging Spectroscopy Workshop – Bruges, October, 8 2004Airborne Imaging Spectroscopy Workshop – Bruges, October, 8 2004
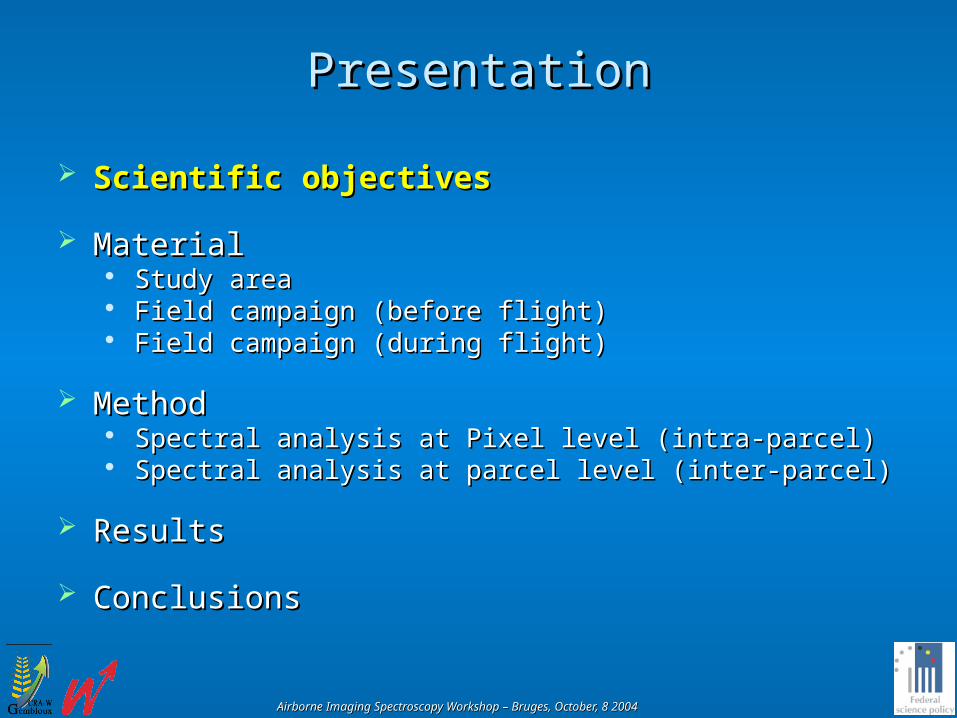
PresentationPresentation
Scientific objectivesScientific objectives
MaterialMaterial Study areaStudy area Field campaign (before flight)Field campaign (before flight) Field campaign (during flight)Field campaign (during flight)
MethodMethod Spectral analysis at Pixel level (intra-parcel)Spectral analysis at Pixel level (intra-parcel) Spectral analysis at parcel level (inter-parcel)Spectral analysis at parcel level (inter-parcel)
ResultsResults
ConclusionsConclusions
Airborne Imaging Spectroscopy Workshop – Bruges, October, 8 2004Airborne Imaging Spectroscopy Workshop – Bruges, October, 8 2004
Scientific objectivesScientific objectives
Agri-Environmental Measures (AEM):
• Now compulsory (CAP reform, WR regulations)• Temporal constraints (Specific cutting or grazing periods)• Opportunity of using airborne imaging spectroscopy to trace the
recent history of grasslands in terms of managements
Working hypothesis: cutting or grazing actions
• Can be considered as major stresses, which have an impact on the spectral signatures of grass canopy.
• Changes of spectral signature depend not only on the nature and the intensity of the action, but also on the time spent between the action and the remote sensing data acquisition.
Airborne Imaging Spectroscopy Workshop – Bruges, October, 8 2004Airborne Imaging Spectroscopy Workshop – Bruges, October, 8 2004
Scientific objectivesScientific objectives
CASI-ATM 2003 project :CASI-ATM 2003 project :
A continuum and a possible validation of the first campaign:
• CASI-2 (VIS/NIR) and SASI (SWIR) sensor• August 2002• Lorraine test site• Biophysical (wet matter, biomass, grass height…) • Biochemical (protein, VEM, DVE…)
Tries to enlighten how imaging spectroscopy are capable to:
• Determine grassland management practices• Control of application of Agri-Environmental Measures
Airborne Imaging Spectroscopy Workshop – Bruges, October, 8 2004Airborne Imaging Spectroscopy Workshop – Bruges, October, 8 2004
PresentationPresentation
Scientific objectivesScientific objectives MaterialMaterial
Study areaStudy area Field campaign (before flight)Field campaign (before flight) Field campaign (during flight)Field campaign (during flight)
MethodMethod Spectral analysis at Pixel level (intra-parcel)Spectral analysis at Pixel level (intra-parcel) Spectral analysis at parcel level (inter-parcel)Spectral analysis at parcel level (inter-parcel)
ResultsResults ConclusionsConclusions
Airborne Imaging Spectroscopy Workshop – Bruges, October, 8 2004Airborne Imaging Spectroscopy Workshop – Bruges, October, 8 2004
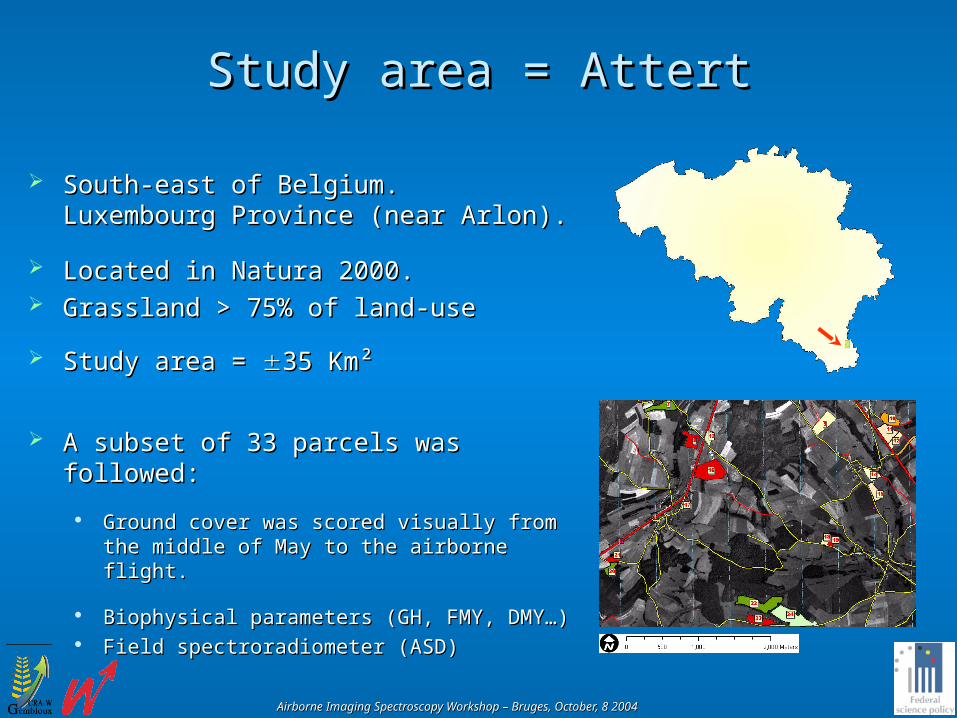
Study area = AttertStudy area = Attert
South-east of Belgium.South-east of Belgium.Luxembourg Province (near Arlon).Luxembourg Province (near Arlon).
Located in Natura 2000.Located in Natura 2000. Grassland > 75% of land-useGrassland > 75% of land-use
Study area = Study area = 35 Km² 35 Km²
A subset of 33 parcels was followed:A subset of 33 parcels was followed:
Ground cover was scored visually from the Ground cover was scored visually from the middle of May to the airborne flight.middle of May to the airborne flight.
Biophysical parameters (GH, FMY, DMY…)Biophysical parameters (GH, FMY, DMY…) Field spectroradiometer (ASD)Field spectroradiometer (ASD)
Airborne Imaging Spectroscopy Workshop – Bruges, October, 8 2004Airborne Imaging Spectroscopy Workshop – Bruges, October, 8 2004
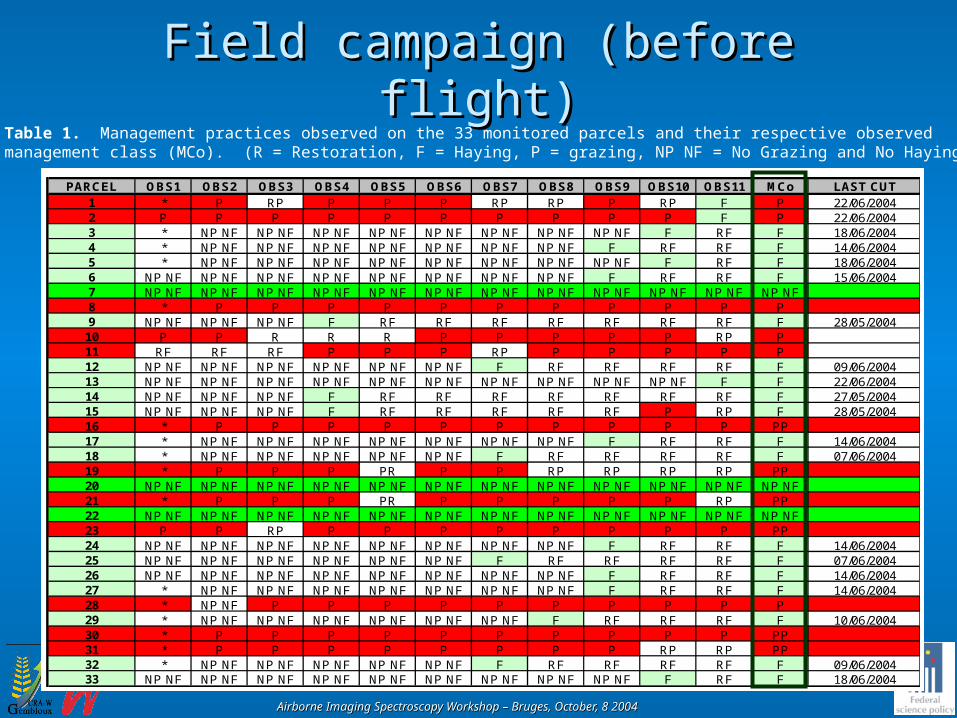
Field campaign (before flight)Field campaign (before flight)
PARCEL OBS1 OBS2 OBS3 OBS4 OBS5 OBS6 OBS7 OBS8 OBS9 OBS10 OBS11 MCo LAST CUT1 * P RP P P P RP RP P RP F P 22/06/20042 P P P P P P P P P P F P 22/06/20043 * NP NF NP NF NP NF NP NF NP NF NP NF NP NF NP NF F RF F 18/06/20044 * NP NF NP NF NP NF NP NF NP NF NP NF NP NF F RF RF F 14/06/20045 * NP NF NP NF NP NF NP NF NP NF NP NF NP NF NP NF F RF F 18/06/20046 NP NF NP NF NP NF NP NF NP NF NP NF NP NF NP NF F RF RF F 15/06/20047 NP NF NP NF NP NF NP NF NP NF NP NF NP NF NP NF NP NF NP NF NP NF NP NF8 * P P P P P P P P P P P9 NP NF NP NF NP NF F RF RF RF RF RF RF RF F 28/05/200410 P P R R R P P P P P RP P11 RF RF RF P P P RP P P P P P12 NP NF NP NF NP NF NP NF NP NF NP NF F RF RF RF RF F 09/06/200413 NP NF NP NF NP NF NP NF NP NF NP NF NP NF NP NF NP NF NP NF F F 22/06/200414 NP NF NP NF NP NF F RF RF RF RF RF RF RF F 27/05/200415 NP NF NP NF NP NF F RF RF RF RF RF P RP F 28/05/200416 * P P P P P P P P P P PP17 * NP NF NP NF NP NF NP NF NP NF NP NF NP NF F RF RF F 14/06/200418 * NP NF NP NF NP NF NP NF NP NF F RF RF RF RF F 07/06/200419 * P P P PR P P RP RP RP RP PP20 NP NF NP NF NP NF NP NF NP NF NP NF NP NF NP NF NP NF NP NF NP NF NP NF21 * P P P PR P P P P P RP PP22 NP NF NP NF NP NF NP NF NP NF NP NF NP NF NP NF NP NF NP NF NP NF NP NF23 P P RP P P P P P P P P PP24 NP NF NP NF NP NF NP NF NP NF NP NF NP NF NP NF F RF RF F 14/06/200425 NP NF NP NF NP NF NP NF NP NF NP NF F RF RF RF RF F 07/06/200426 NP NF NP NF NP NF NP NF NP NF NP NF NP NF NP NF F RF RF F 14/06/200427 * NP NF NP NF NP NF NP NF NP NF NP NF NP NF F RF RF F 14/06/200428 * NP NF P P P P P P P P P P29 * NP NF NP NF NP NF NP NF NP NF NP NF F RF RF RF F 10/06/200430 * P P P P P P P P P P PP31 * P P P P P P P P RP RP PP32 * NP NF NP NF NP NF NP NF NP NF F RF RF RF RF F 09/06/200433 NP NF NP NF NP NF NP NF NP NF NP NF NP NF NP NF NP NF F RF F 18/06/2004
Table 1. Management practices observed on the 33 monitored parcels and their respective observedmanagement class (MCo). (R = Restoration, F = Haying, P = grazing, NP NF = No Grazing and No Haying).
Airborne Imaging Spectroscopy Workshop – Bruges, October, 8 2004Airborne Imaging Spectroscopy Workshop – Bruges, October, 8 2004
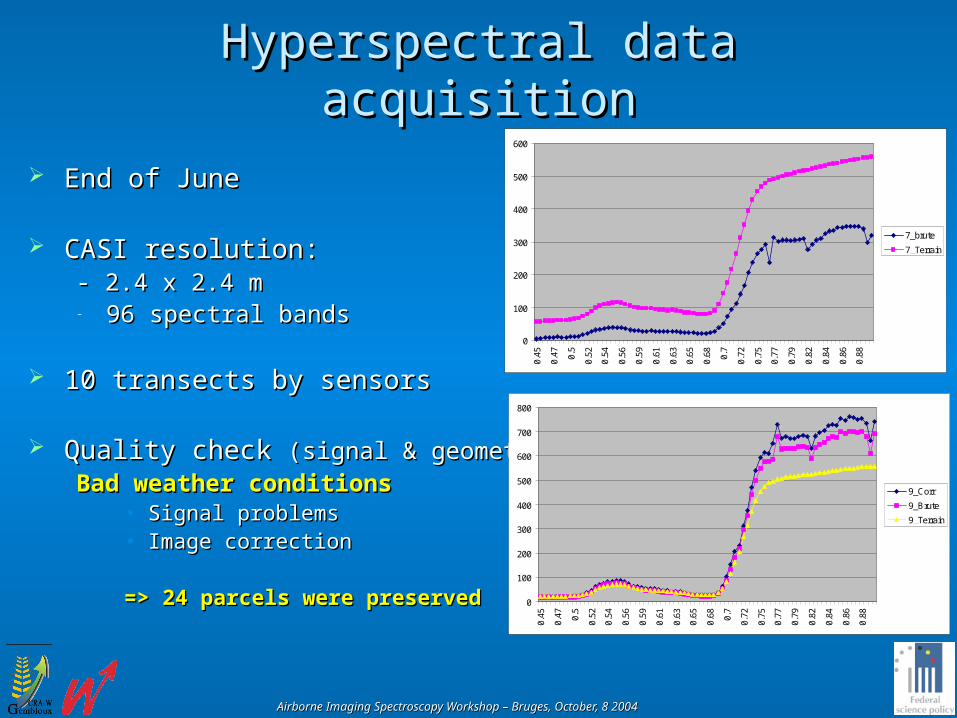
Hyperspectral data acquisitionHyperspectral data acquisition
End of JuneEnd of June
CASI resolution: CASI resolution: - 2.4 x 2.4 m- 2.4 x 2.4 m- 96 spectral bands96 spectral bands
10 transects by sensors10 transects by sensors
Quality check Quality check (signal & geometric)(signal & geometric)Bad weather conditionsBad weather conditions
• Signal problemsSignal problems• Image correctionImage correction
=> 24 parcels were preserved=> 24 parcels were preserved 0
100
200
300
400
500
600
700
800
0.45
0.47 0.5
0.52
0.54
0.56
0.59
0.61
0.63
0.65
0.68 0.7
0.72
0.75
0.77
0.79
0.82
0.84
0.86
0.88
9_Corr
9_Brute
9_Terrain
0
100
200
300
400
500
600
0.45
0.47 0.5
0.52
0.54
0.56
0.59
0.61
0.63
0.65
0.68 0.7
0.72
0.75
0.77
0.79
0.82
0.84
0.86
0.88
7_brute
7_Terrain
Airborne Imaging Spectroscopy Workshop – Bruges, October, 8 2004Airborne Imaging Spectroscopy Workshop – Bruges, October, 8 2004
PresentationPresentation
Scientific objectivesScientific objectives
MaterialMaterial Study areaStudy area Field campaign (before flight)Field campaign (before flight) Field campaign (during flight)Field campaign (during flight)
MethodMethod Spectral analysis at Pixel level (intra-parcel)Spectral analysis at Pixel level (intra-parcel) Spectral analysis at parcel level (inter-parcel)Spectral analysis at parcel level (inter-parcel)
ResultsResults
ConclusionsConclusions
Airborne Imaging Spectroscopy Workshop – Bruges, October, 8 2004Airborne Imaging Spectroscopy Workshop – Bruges, October, 8 2004
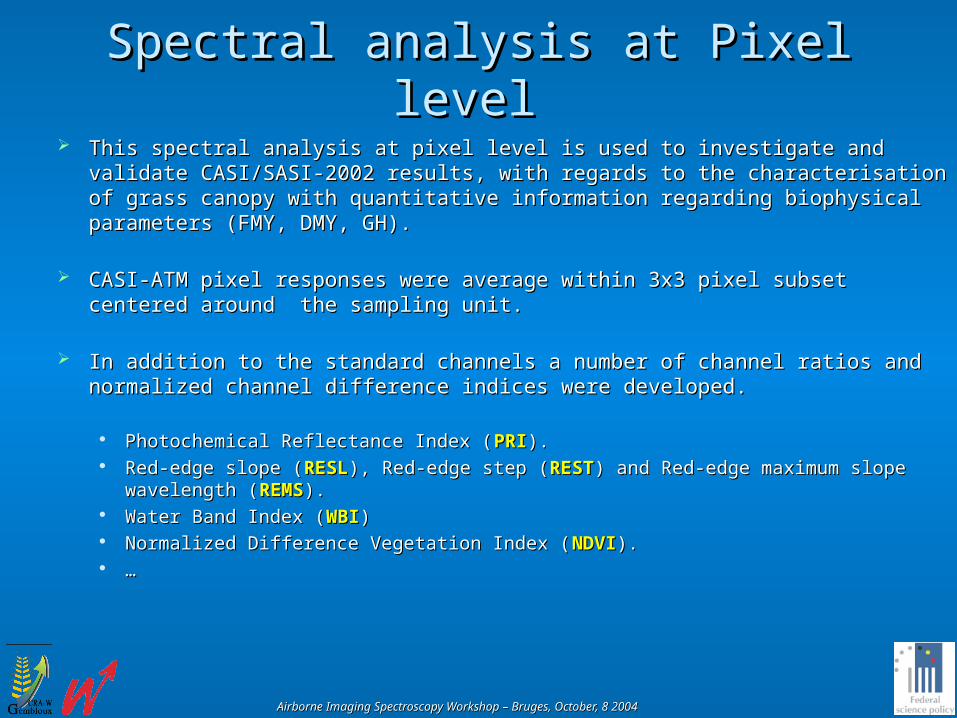
Spectral analysis at Pixel level Spectral analysis at Pixel level This spectral analysis at pixel level is used to investigate and validate This spectral analysis at pixel level is used to investigate and validate
CASI/SASI-2002 results, with regards to the characterisation of grass canopy CASI/SASI-2002 results, with regards to the characterisation of grass canopy with quantitative information regarding biophysical parameters (FMY, DMY, with quantitative information regarding biophysical parameters (FMY, DMY, GH).GH).
CASI-ATM pixel responses were average within 3x3 pixel subset centered CASI-ATM pixel responses were average within 3x3 pixel subset centered around the sampling unit.around the sampling unit.
In addition to the standard channels a number of channel ratios and In addition to the standard channels a number of channel ratios and normalized channel difference indices were developed.normalized channel difference indices were developed.
Photochemical Reflectance Index (Photochemical Reflectance Index (PRIPRI).). Red-edge slope (Red-edge slope (RESLRESL), Red-edge step (), Red-edge step (RESTREST) and Red-edge maximum slope ) and Red-edge maximum slope
wavelength (wavelength (REMSREMS).). Water Band Index (Water Band Index (WBIWBI) ) Normalized Difference Vegetation Index (Normalized Difference Vegetation Index (NDVINDVI).). ……
Airborne Imaging Spectroscopy Workshop – Bruges, October, 8 2004Airborne Imaging Spectroscopy Workshop – Bruges, October, 8 2004
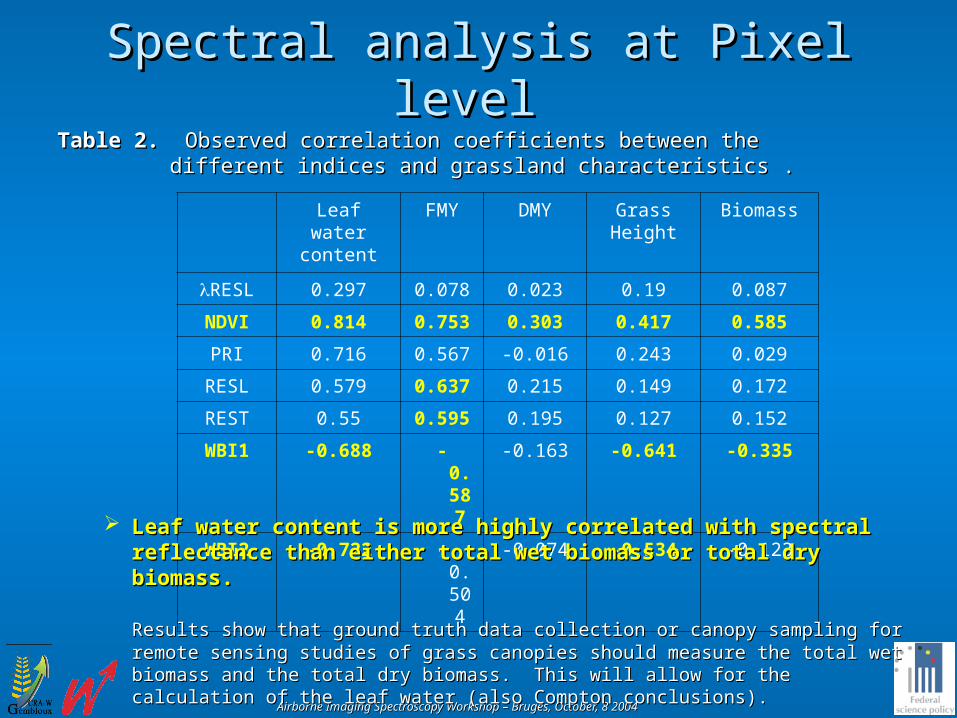
Spectral analysis at Pixel level Spectral analysis at Pixel level Table 2.Table 2. Observed correlation coefficients between the different indices and Observed correlation coefficients between the different indices and
grassland characteristicsgrassland characteristics . .
Leaf water content
FMY DMY Grass Height
Biomass
RESL 0.297 0.078 0.023 0.19 0.087
NDVI 0.814 0.753 0.303 0.417 0.585
PRI 0.716 0.567 -0.016 0.243 0.029
RESL 0.579 0.637 0.215 0.149 0.172
REST 0.55 0.595 0.195 0.127 0.152
WBI1 -0.688 -0.587 -0.163 -0.641 -0.335
WBI2 -0.722 -0.504 -0.074 -0.534 -0.123
Leaf water content is more highly correlated with spectral reflectance than Leaf water content is more highly correlated with spectral reflectance than either total wet biomass or total dry biomass.either total wet biomass or total dry biomass.
Results show that ground truth data collection or canopy sampling for remote sensing studies Results show that ground truth data collection or canopy sampling for remote sensing studies of grass canopies should measure the total wet biomass and the total dry biomass. This will of grass canopies should measure the total wet biomass and the total dry biomass. This will allow for the calculation of the leaf water (also Compton conclusions).allow for the calculation of the leaf water (also Compton conclusions).
Airborne Imaging Spectroscopy Workshop – Bruges, October, 8 2004Airborne Imaging Spectroscopy Workshop – Bruges, October, 8 2004
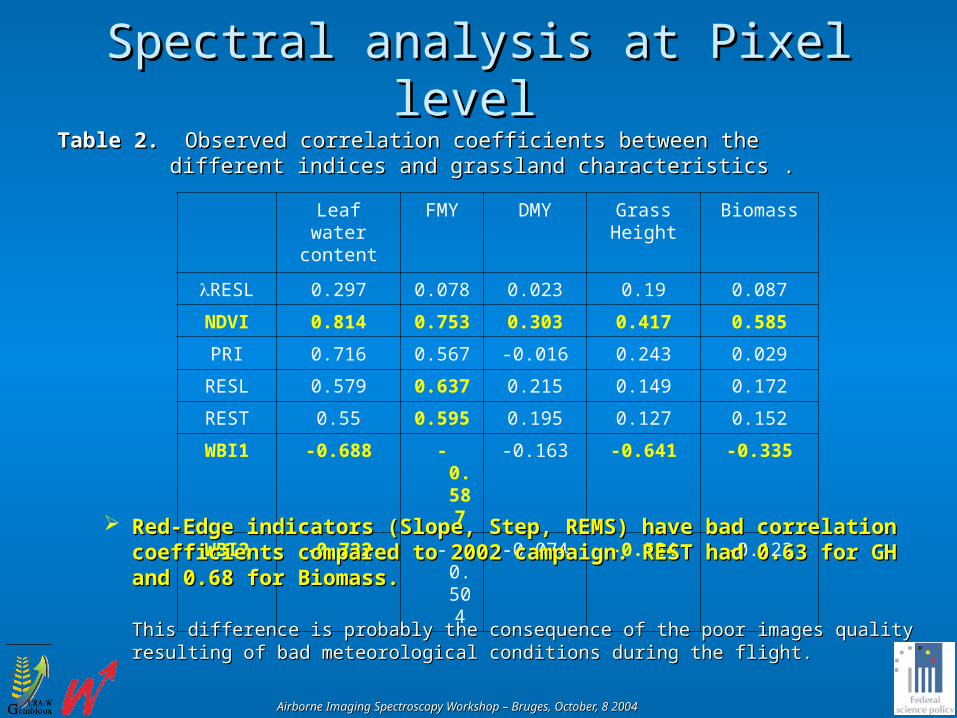
Spectral analysis at Pixel level Spectral analysis at Pixel level Table 2.Table 2. Observed correlation coefficients between the different indices and Observed correlation coefficients between the different indices and
grassland characteristicsgrassland characteristics . .
Leaf water content
FMY DMY Grass Height
Biomass
RESL 0.297 0.078 0.023 0.19 0.087
NDVI 0.814 0.753 0.303 0.417 0.585
PRI 0.716 0.567 -0.016 0.243 0.029
RESL 0.579 0.637 0.215 0.149 0.172
REST 0.55 0.595 0.195 0.127 0.152
WBI1 -0.688 -0.587 -0.163 -0.641 -0.335
WBI2 -0.722 -0.504 -0.074 -0.534 -0.123
Red-Edge indicators (Slope, Step, REMS) have bad correlation coefficients Red-Edge indicators (Slope, Step, REMS) have bad correlation coefficients compared to 2002 campaign. REST had 0.63 for GH and 0.68 for Biomass.compared to 2002 campaign. REST had 0.63 for GH and 0.68 for Biomass.
This difference is probably the consequence of the poor images quality resulting of bad This difference is probably the consequence of the poor images quality resulting of bad meteorological conditions during the flight.meteorological conditions during the flight.
Airborne Imaging Spectroscopy Workshop – Bruges, October, 8 2004Airborne Imaging Spectroscopy Workshop – Bruges, October, 8 2004
Spectral analysis at Pixel level Spectral analysis at Pixel level
Red-edge indicators seems to be too sensible to the meteorological Red-edge indicators seems to be too sensible to the meteorological conditions and can not be considered for an operational system.conditions and can not be considered for an operational system.
Inspection of the regression results obtained in the 2002 and 2003 Inspection of the regression results obtained in the 2002 and 2003 campaigns indicates that NDVI, WBI1 and PRI are the best indicators campaigns indicates that NDVI, WBI1 and PRI are the best indicators to estimate biophysics characteristicsto estimate biophysics characteristics..
Confirm CASI-SASI 2002 results on biophysical parameters (FMY, DMY, GH) Confirm CASI-SASI 2002 results on biophysical parameters (FMY, DMY, GH) directly linked to the age and the management practices supported by directly linked to the age and the management practices supported by grasslands.grasslands.
Airborne Imaging Spectroscopy Workshop – Bruges, October, 8 2004Airborne Imaging Spectroscopy Workshop – Bruges, October, 8 2004
Spectral analysis at Parcel level Spectral analysis at Parcel level
In a second step, the project has analysed the possibility to classify In a second step, the project has analysed the possibility to classify grassland in 3 management classes:grassland in 3 management classes:
• Haying grasslands (P)Haying grasslands (P)• Grazing grasslands (F)Grazing grasslands (F)• Neither haying nor grazing grasslands (NP NF)Neither haying nor grazing grasslands (NP NF)
The grassland classification is based on the hypothesis that management The grassland classification is based on the hypothesis that management practices can be identified by the combination of practices can be identified by the combination of
• Textural indices (Textural indices (qualitative parametersqualitative parameters) with) with• Vegetation indices (Vegetation indices (quantitative parametersquantitative parameters) selected at the pixel ) selected at the pixel
levellevel
Different textural indices were calculated:Different textural indices were calculated:
• Global approach (global variance)Global approach (global variance)• Local approach (moving windows of 3x3 pixels)Local approach (moving windows of 3x3 pixels)
Airborne Imaging Spectroscopy Workshop – Bruges, October, 8 2004Airborne Imaging Spectroscopy Workshop – Bruges, October, 8 2004
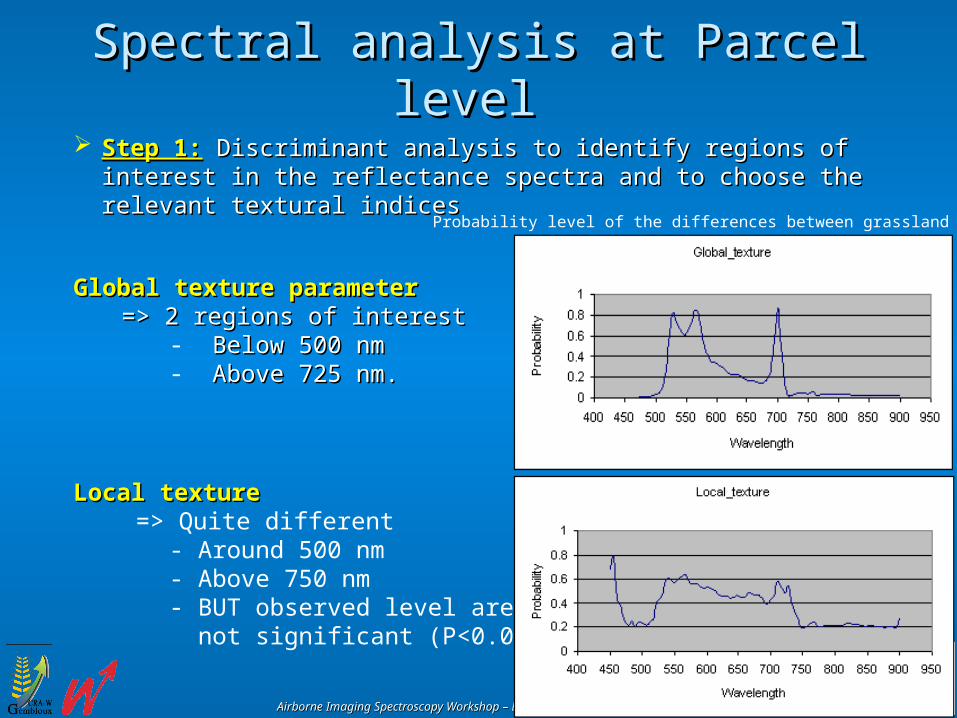
Spectral analysis at Parcel level Spectral analysis at Parcel level Step 1:Step 1: D Discriminant analysis to identify regions of interest in the reflectance iscriminant analysis to identify regions of interest in the reflectance
spectra and to choose the relevant textural indicesspectra and to choose the relevant textural indices
Probability level of the differences between grassland classes
Global texture parameterGlobal texture parameter=> 2 regions of interest=> 2 regions of interest
- Below 500 nm Below 500 nm - Above 725 nm. Above 725 nm.
Local texture Local texture => Quite different
- Around 500 nm - Above 750 nm - BUT observed level are not significant (P<0.05).
Airborne Imaging Spectroscopy Workshop – Bruges, October, 8 2004Airborne Imaging Spectroscopy Workshop – Bruges, October, 8 2004
Spectral analysis at Parcel level Spectral analysis at Parcel level Step 1:Step 1: Based on these results, 2 wave bands from the global texture
analysis have been selected (450 nm and 725 nm) together with previously defined vegetation indices.
Step 2:Step 2: Discriminant analysis with all the selected dependent variables (vegetation indicators & textural indicator)
• The stepwise discriminant analysis identified 3 vegetation indices, (PRI, NDVI and WBI1) and one textural global index (450nm) as significant.
• Cross validation procedure show that about 83% of correct classifications may be obtained.
Airborne Imaging Spectroscopy Workshop – Bruges, October, 8 2004Airborne Imaging Spectroscopy Workshop – Bruges, October, 8 2004
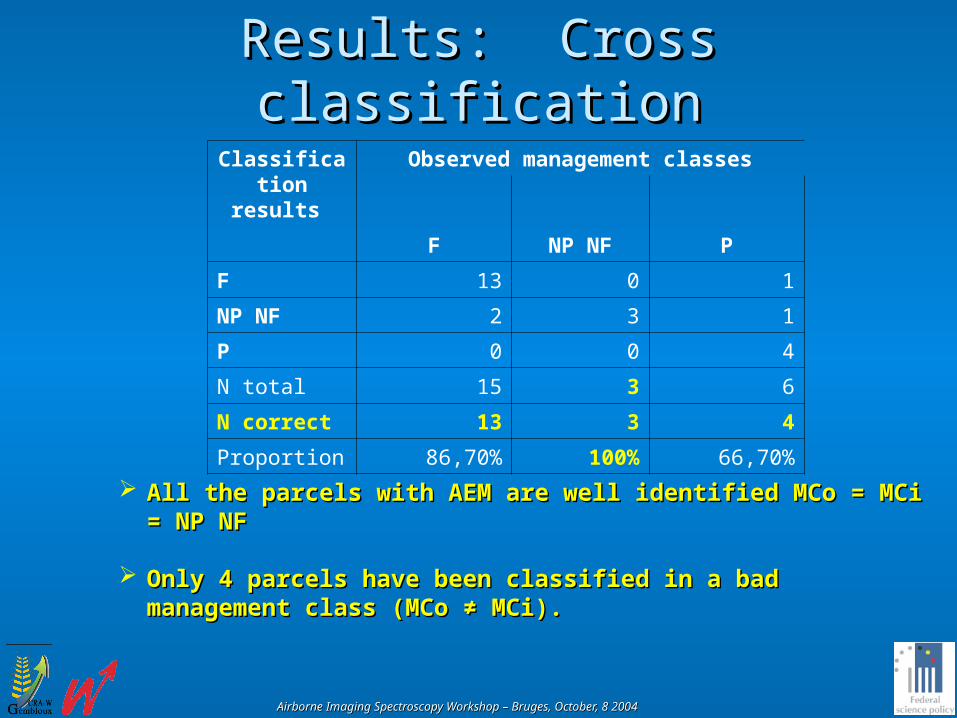
Results: Cross classificationResults: Cross classification
All the parcels with AEM are well identified MCo = MCi = NP NFAll the parcels with AEM are well identified MCo = MCi = NP NF
Only 4 parcels have been classified in a bad management class Only 4 parcels have been classified in a bad management class (MCo (MCo ≠ ≠ MCi).MCi).
Classification results
Observed management classes
F NP NF P
F 13 0 1
NP NF 2 3 1
P 0 0 4
N total 15 3 6
N correct 13 3 4
Proportion 86,70% 100% 66,70%
Airborne Imaging Spectroscopy Workshop – Bruges, October, 8 2004Airborne Imaging Spectroscopy Workshop – Bruges, October, 8 2004
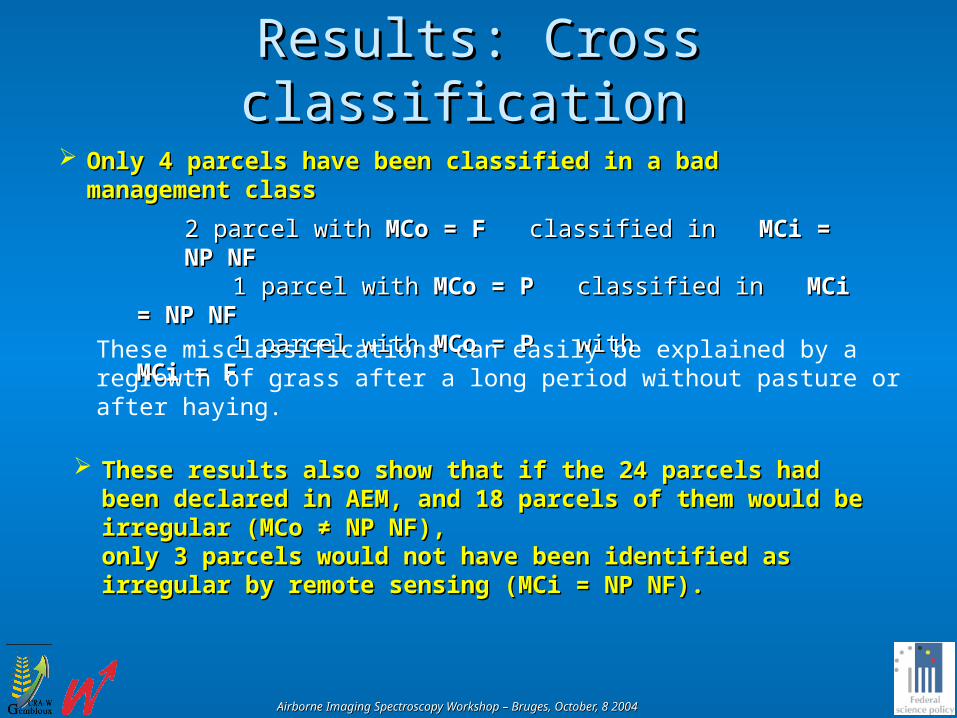
Results: Cross classification Results: Cross classification Only 4 parcels have been classified in a bad management classOnly 4 parcels have been classified in a bad management class
2 parcel with 2 parcel with MCo = FMCo = F classified in classified in MCi = NP NFMCi = NP NF1 parcel with 1 parcel with MCo = P MCo = P classified in classified in MCi = NP NFMCi = NP NF1 parcel with 1 parcel with MCo = PMCo = P with with MCi = FMCi = F
These misclassifications can easily be explained by a regrowth of grass after a long period without pasture or after haying.
These results also show that if the 24 parcels had been declared in These results also show that if the 24 parcels had been declared in AEM, and 18 parcelsAEM, and 18 parcels of them would be irregular (MCo of them would be irregular (MCo ≠ NP NF),≠ NP NF),only 3 parcels would not have been identified as irregular by remote only 3 parcels would not have been identified as irregular by remote sensing (MCi = NP NF).sensing (MCi = NP NF).
Airborne Imaging Spectroscopy Workshop – Bruges, October, 8 2004Airborne Imaging Spectroscopy Workshop – Bruges, October, 8 2004
Conclusions Conclusions
These study assess the ability of Imaging Spectroscopy to be reliable These study assess the ability of Imaging Spectroscopy to be reliable method for estimating grassland management practices and to control if method for estimating grassland management practices and to control if AEM are correctly applied.AEM are correctly applied.
3 vegetation indices (PRI, NDVI and WBI13 vegetation indices (PRI, NDVI and WBI1 ) are confirmed as good are confirmed as good quantitative parameters quantitative parameters
Textural indices (qualitative parameters) and vegetation indices Textural indices (qualitative parameters) and vegetation indices (quantitative parameters ) are linked to the age and the management (quantitative parameters ) are linked to the age and the management practices supported by grasslandspractices supported by grasslands
Changes of spectral signature depend not only on the nature and the Changes of spectral signature depend not only on the nature and the intensity of the action, but also on the time spent between the action and intensity of the action, but also on the time spent between the action and the remote sensing data acquisition.the remote sensing data acquisition.
Classification results are promising and must be validated with better Classification results are promising and must be validated with better images quality due to the bad meteorological conditions.images quality due to the bad meteorological conditions.