Hydrothermal Alteration in the Propylitic Suite at Butte, Montana (Haggart 2014)
31
Haggart 1 Hydrothermal Alteration in the Propylitic Suite at Butte, Montana By: Kyle Haggart, University of Oregon May 2014 Introduction The Butte porphyry copper deposit formed 65 to 62 million years ago when the Butte Quartz Monzonite was fractured and altered by magmatic hydrothermal fluids (Mercer and Reed, 2013). Porphyry copper deposits are most commonly found at subductive plate boundaries, which provides the needed magma and fluids to form the deposits (Sillitoe 2010). Porphyry deposits form when a magma body at depth begins to crystallize, resulting in high pressures in the cupola of the magma body. Once the fluids become over pressured they break the overlying rock, creating porphyry dikes with a stock work of fractures (Mercer and Reed, 2013) (figure 1). The released fluids from the magma body flow through the network of fractures and as they travel upwards and outwards they interact with the surrounding rock producing hydrothermal alteration of the fractured wall rocks (Mercer and Reed 2013). As the fluids cool they precipitate large quantities of sulfides and quartz and lesser amounts of copper, molybdenite, and potentially trace amounts of other metals such as silver. (Seedorff et al. 2005) Porphyry copper deposits all around the world provide an important source of resources needed to sustain our lives. The alteration types vary depending on how far the alteration is from the magma source, the acidity of the fluid, as well as the size of the vein (Rusk et al. 2008). The Butte porphyry copper deposit is separated into zones based on the alteration types; there is the potassic zone, the sericitic zone, and the propylitic zone (figure 2) Figure 1: Shows the evolution of a magma body at depth which produces porphery copper deposits. First the cupola begins to crystallize (a), which results in increased pressure causing the magma to eventually break though and intrude into the wall rock (b). The fractures then seal (c) and the cupula begins to repressurizing once until once again it becomes over pressured and hydrofracturing occurs releasing the fluids that cause metasoatism of the wall rock (d). ( Mercer and Reed, 2013)
-
Upload
kyle-haggart -
Category
Documents
-
view
271 -
download
2
Transcript of Hydrothermal Alteration in the Propylitic Suite at Butte, Montana (Haggart 2014)

Haggart 1
Hydrothermal Alteration in the Propylitic Suite at Butte, Montana
By: Kyle Haggart, University of Oregon
May 2014
Introduction
The Butte porphyry copper deposit formed 65 to 62 million years ago when the
Butte Quartz Monzonite was fractured and altered by magmatic hydrothermal fluids
(Mercer and Reed, 2013). Porphyry copper deposits are most commonly found at
subductive plate boundaries, which provides the needed magma and fluids to form the
deposits (Sillitoe 2010). Porphyry deposits form when a magma body at depth begins to
crystallize, resulting in high pressures in the cupola of the magma body. Once the fluids
become over pressured they break the overlying rock,
creating porphyry dikes with a stock work of fractures
(Mercer and Reed, 2013) (figure 1). The released fluids
from the magma body flow through the network of
fractures and as they travel upwards and outwards they
interact with the surrounding rock producing hydrothermal
alteration of the fractured wall rocks (Mercer and Reed
2013). As the fluids cool they precipitate large quantities
of sulfides and quartz and lesser amounts of copper,
molybdenite, and potentially trace amounts of other metals
such as silver. (Seedorff et al. 2005) Porphyry copper
deposits all around the world provide an important source
of resources needed to sustain our lives.
The alteration types vary depending on how far the
alteration is from the magma source, the acidity of the
fluid, as well as the size of the vein (Rusk et al. 2008). The
Butte porphyry copper deposit is separated into zones
based on the alteration types; there is the potassic zone,
the sericitic zone, and the propylitic zone (figure 2)
Figure 1: Shows the evolution of a magma body at depth which produces porphery copper deposits. First the cupola begins to crystallize (a), which results in increased pressure causing the magma to eventually break though and intrude into the wall rock (b). The fractures then seal (c) and the cupula begins to repressurizing once until once again it becomes over pressured and hydrofracturing occurs releasing the fluids that cause metasoatism of the wall rock (d). ( Mercer and Reed, 2013)

Haggart 2
(Sillitoe 2010). Porphyry copper deposits all around the world display similar alteration
patterns to the ones found at the Butte deposit, but Butte is unique because it has two
domes with the sericitic alteration zone in between them (Rusk et al., 2008). The more
highly altered zones are founded towards the center of the deposit and the least altered,
propylitic zone, is found in the periphery.
Since the propylitic zone is at the edge of the deposit it experiences the smallest
degree of alteration, leaving the granitic texture intact (Sillitoe, 2010). Small degrees of
alteration do occur, such as feldspar and biotite being altered to chlorite, epidote, albite
and carbonates. Possible accessory minerals in this zone include actinolite, hematite, and
magnetite and the sulfides present are predominantly pyrite, with some sphalerite and
Figure 2: A schematic showing the basic layout of a porphyry copper deposit. The highly altered zones are in the center, above the magma body with the propylitic zone around the other alteration zones. The zones are distinguished based on the alteration types that occur. The deposit at Butte is unique because it has two domes with the sericitic alteration in between them. (Sillitoe, 2010)

Haggart 3
galena (Sillitoe, 2010). The propylitic zone has the smallest concentrations of metal
compared to the other zones, but it is commonly volumetrically large.
The main alterations present at the Butte Porphyry Copper deposit are described
by the vein types they are associated with, which are: early dark micaceous (EDM), pale
green sericitic (PGS), barren quartz/quartz-molybdenite (BQ/QMB), gray sericitic (GS),
and main stage (MS) veins. Studies of fluid inclusions from the veins at Butte provide an
estimated temperature and pressure of formation (Rusk et al, 2008). The main stage veins
were found to have formed from fluids between 230°C and 400°C and at pressures
between 40 and 70 MPa (Rusk et al. 2008). The deepest alteration (EDM) formed at
temperatures between 575°C and 650ºC with pressures ranging from 200 to 250 MPa
(Rusk et al 2008). Considering that the propylitic alteration occurs relatively far from the
heat source it can be guessed that the temperature range should be closer to the main
stage vein temperatures. A study on the alteration of granitic biotite to chlorite by
Eggleton and Banfield shows that the alteration of two biotite sheets to one chlorite sheet
though metasomatism occurs at roughly 330°- 340°C (1985). In another study on
hydrothermal alteration mineralogy done by Lagat, the alteration from biotite to chlorite
occurred in a temperature range of 220° to 340° C (2009). From these studies we can
conclude an expected temperature range of roughly 230° C to 340°C for the propylitic
zone.
The propylitic zone has small veinlets of quartz sulfides throughout the area,
resulting in smaller alteration envelopes than the other zones. The veinlets observed
consist of mostly quartz with some pyrite, chalcopyrite, and sphalerite. The alteration
envelopes surrounding the veins consist of clusters of chlorite and epidote making it
distinctly different than any other alteration envelope (Sillitoe 2010). The main
metasomatic reaction in the propylitic zone is biotite being altered to chlorite and sphene.
The alteration does not consistently replace all of the original biotite, but commonly
leaves behind remnant material. Plagioclase and potassium feldspars are also commonly
altered to sericite and epidote and are usually found in close proximity to altered biotite.
In general, most of the economically recoverable metals are found in the other
zones (Sillitoe 2010) and as a result the propylitic zone has received little study. The zone
of the propylitic suite is volumetrically large thus, even though the concentrations of
Haggart 4
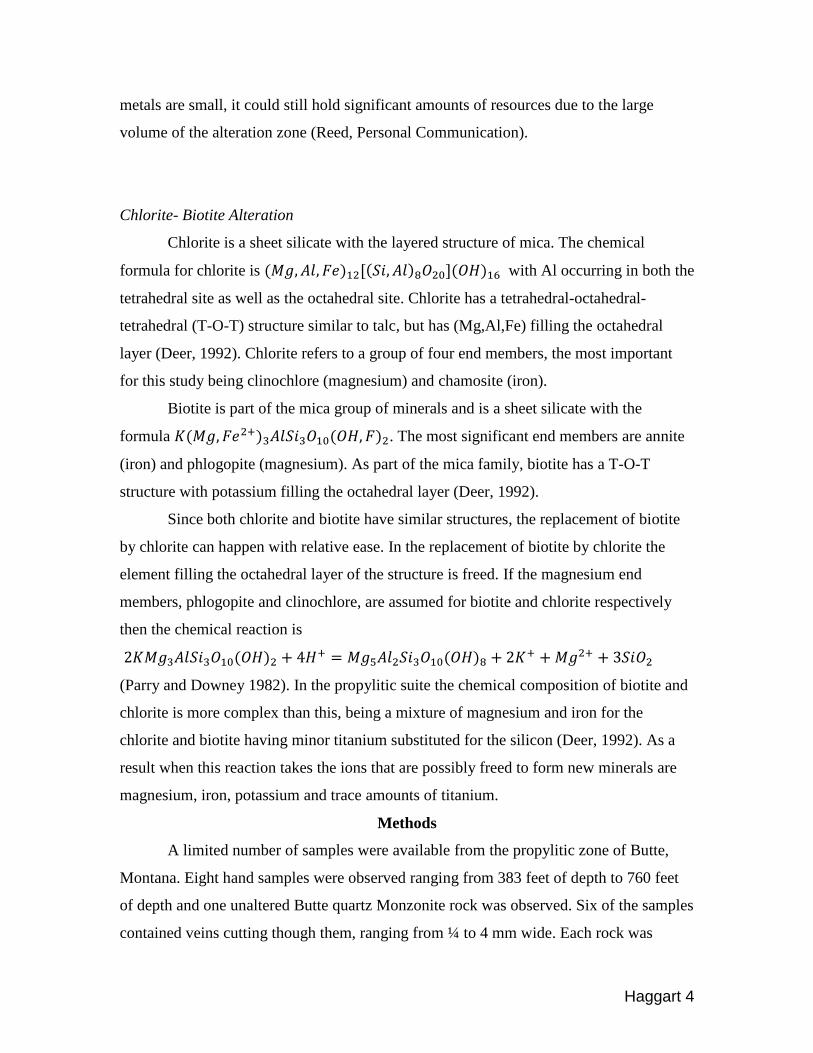
metals are small, it could still hold significant amounts of resources due to the large
volume of the alteration zone (Reed, Personal Communication).
Chlorite- Biotite Alteration
Chlorite is a sheet silicate with the layered structure of mica. The chemical
formula for chlorite is (𝑀𝑔, 𝐴𝑙, 𝐹𝑒)12[(𝑆𝑖, 𝐴𝑙)8𝑂20](𝑂𝐻)16 with Al occurring in both the
tetrahedral site as well as the octahedral site. Chlorite has a tetrahedral-octahedral-
tetrahedral (T-O-T) structure similar to talc, but has (Mg,Al,Fe) filling the octahedral
layer (Deer, 1992). Chlorite refers to a group of four end members, the most important
for this study being clinochlore (magnesium) and chamosite (iron).
Biotite is part of the mica group of minerals and is a sheet silicate with the
formula 𝐾(𝑀𝑔, 𝐹𝑒2+)3𝐴𝑙𝑆𝑖3𝑂10(𝑂𝐻, 𝐹)2. The most significant end members are annite
(iron) and phlogopite (magnesium). As part of the mica family, biotite has a T-O-T
structure with potassium filling the octahedral layer (Deer, 1992).
Since both chlorite and biotite have similar structures, the replacement of biotite
by chlorite can happen with relative ease. In the replacement of biotite by chlorite the
element filling the octahedral layer of the structure is freed. If the magnesium end
members, phlogopite and clinochlore, are assumed for biotite and chlorite respectively
then the chemical reaction is
2𝐾𝑀𝑔3𝐴𝑙𝑆𝑖3𝑂10(𝑂𝐻)2 + 4𝐻+ = 𝑀𝑔5𝐴𝑙2𝑆𝑖3𝑂10(𝑂𝐻)8 + 2𝐾+ +𝑀𝑔2+ + 3𝑆𝑖𝑂2
(Parry and Downey 1982). In the propylitic suite the chemical composition of biotite and
chlorite is more complex than this, being a mixture of magnesium and iron for the
chlorite and biotite having minor titanium substituted for the silicon (Deer, 1992). As a
result when this reaction takes the ions that are possibly freed to form new minerals are
magnesium, iron, potassium and trace amounts of titanium.
Methods
A limited number of samples were available from the propylitic zone of Butte,
Montana. Eight hand samples were observed ranging from 383 feet of depth to 760 feet
of depth and one unaltered Butte quartz Monzonite rock was observed. Six of the samples
contained veins cutting though them, ranging from ¼ to 4 mm wide. Each rock was

Haggart 5
closely examined with a hand lens noting texture, vein relationships, alterations, and
possible compositions. Sample names indicate the depth at which the sample was taken
from within the propylitic zone, e.g. sample 620 is from 620 feet below the surface. All
the samples were taken from drill hole 10969 except sample 760, which is from 11166.
The fresh quartz Monzonite was sampled from an outcrop outside of the alteration zone
of the porphyry copper deposit at Butte, Montana.
Light Microscopy
A transmitted light microscope was used to examine seven thin sections. Four of
the seven thin sections had been previously prepared and stained resulting in the
potassium feldspars appearing yellow making them easily distinguishable from quartz.
The previously prepared thin sections are sampled from 383, 500, 534, and 620 feet of
depth. Two more thin sections were created for samples at 383 feet and 534 feet of depth
and one additional one for the fresh Butte quartz monzonite. Objective lenses of 4 times
and 10 times were used to examine the thin sections, resulting in 40 times to 100 times
magnification. Samples were observed under plane polarized light and cross polarized
light. Birefringence, interference colors, and interference figures were used to help
identify minerals present in each section.
Scanning Electron Microscopy
The SEM analysis was done using an FEI Quanta 200 FEG scanning electron
microscope equipped with a Thermo SDD energy dispersive spectrometer detector
located at the University of Oregon. The three polished thin sections prepared from
samples 534, 620, and Bu were carbon coated and analyzed. The scanning electron
microscope was set to 20kV with a working distance of 10mm. A spot size of 4 microns
was used for single point analysis, then was changed to 6 microns for elemental mapping.
The SEM was used to gather qualitative data for twenty-two different areas of interest
and three elemental maps were collected. The SEM was used to identify minerals and the
unique textures displayed by the alteration in this zone.
Electron Microprobe
Haggart 6
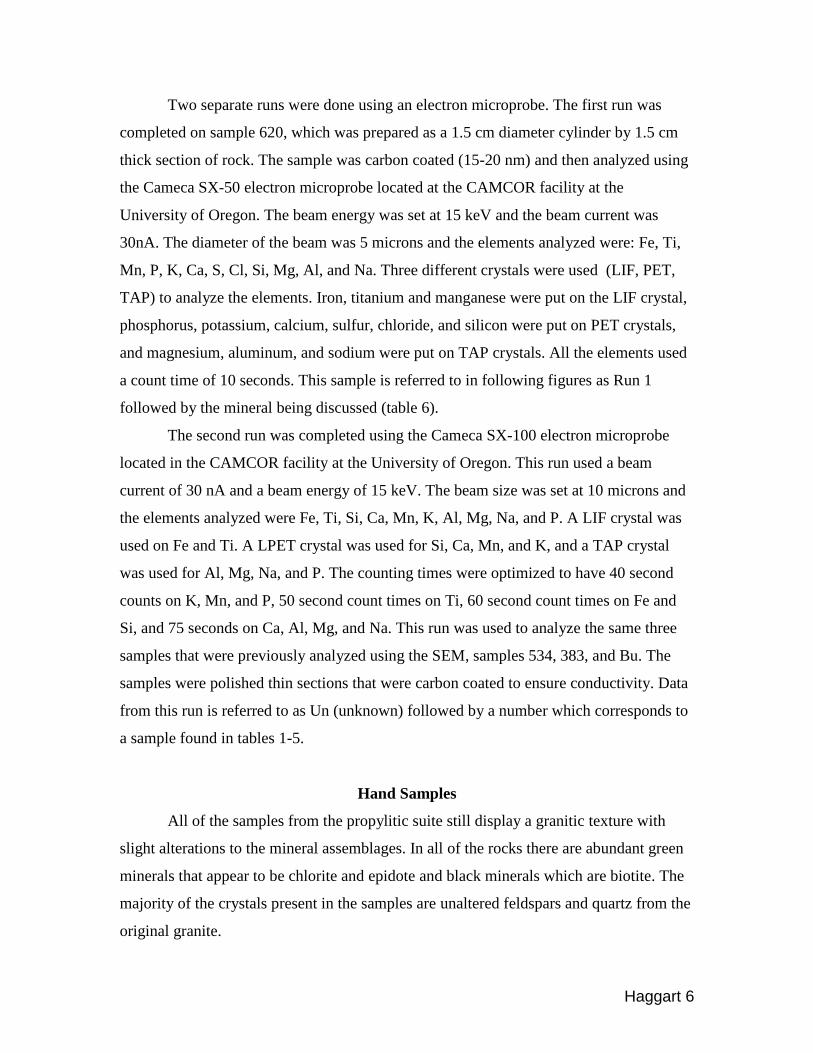
Two separate runs were done using an electron microprobe. The first run was
completed on sample 620, which was prepared as a 1.5 cm diameter cylinder by 1.5 cm
thick section of rock. The sample was carbon coated (15-20 nm) and then analyzed using
the Cameca SX-50 electron microprobe located at the CAMCOR facility at the
University of Oregon. The beam energy was set at 15 keV and the beam current was
30nA. The diameter of the beam was 5 microns and the elements analyzed were: Fe, Ti,
Mn, P, K, Ca, S, Cl, Si, Mg, Al, and Na. Three different crystals were used (LIF, PET,
TAP) to analyze the elements. Iron, titanium and manganese were put on the LIF crystal,
phosphorus, potassium, calcium, sulfur, chloride, and silicon were put on PET crystals,
and magnesium, aluminum, and sodium were put on TAP crystals. All the elements used
a count time of 10 seconds. This sample is referred to in following figures as Run 1
followed by the mineral being discussed (table 6).
The second run was completed using the Cameca SX-100 electron microprobe
located in the CAMCOR facility at the University of Oregon. This run used a beam
current of 30 nA and a beam energy of 15 keV. The beam size was set at 10 microns and
the elements analyzed were Fe, Ti, Si, Ca, Mn, K, Al, Mg, Na, and P. A LIF crystal was
used on Fe and Ti. A LPET crystal was used for Si, Ca, Mn, and K, and a TAP crystal
was used for Al, Mg, Na, and P. The counting times were optimized to have 40 second
counts on K, Mn, and P, 50 second count times on Ti, 60 second count times on Fe and
Si, and 75 seconds on Ca, Al, Mg, and Na. This run was used to analyze the same three
samples that were previously analyzed using the SEM, samples 534, 383, and Bu. The
samples were polished thin sections that were carbon coated to ensure conductivity. Data
from this run is referred to as Un (unknown) followed by a number which corresponds to
a sample found in tables 1-5.
Hand Samples
All of the samples from the propylitic suite still display a granitic texture with
slight alterations to the mineral assemblages. In all of the rocks there are abundant green
minerals that appear to be chlorite and epidote and black minerals which are biotite. The
majority of the crystals present in the samples are unaltered feldspars and quartz from the
original granite.

Haggart 7
Most of the samples have veinlets cross cutting though the samples which
consisted mainly of quartz and some sulfides. In many of the veins the black mineral was
identified as magnetite based on hand samples, but SEM analyzes the most abundant
sulfide is sphalerite, which can appear black in hand samples. Sample 500 displays a
reddish hue along the vein, indicating an oxidation of possibly magnetite, which would
mean magnetite and sphalerite are both present in the veins. The veins range anywhere
from ¼ mm to 4 mm think and appear scattered throughout all samples except for sample
338. Immediately near the veins more extreme alteration is present in the form of
increased epidote and chlorite, which could be seen with a 10x hand lens.
Figure 3: From left to right: Sample Bu, 383, 620, and 534. These four samples were analyzed on the SEM as well as the EMPA. Sample 620 has a 3mm vein of quartz and pyrite. Sample 534 has a .25mm vein of a black mineral most likely magnetite. The granitic texture of the altered rocks (383, 620, and 534) resembles that of the unaltered Butte quartz Monzonite (Bu). Green and
black minerals can be seen throughout the samples which are identified as biotite, chlorite and epidote.
4.5 cm

Haggart 8
Figure 4: From top to bottom: Sample 500, 555, 338, and 760. All the samples display the original Butte quartz monzonite texture. Sample 760 has a 4mm vein of black mineral which could be magnetite, but SEM work on other veins shows it could be sphalerite. Sample 555 has a 0.5mm vein consisting of quartz and pyrite through it. Sample 383 appears more highly altered to epidote and chlorite than the rest of the samples, even though no vein is present. Sample 500 has some red coloration along the 0.5mm vein
indicating an oxidation affect associated with magnetite present in the vein.
4 cm

Haggart 9
Petrography
All of the thin sections contain similar alterations, but some samples contain more
advanced alteration than others due to the presence of veinlets. Samples 534 and 383
have visible veinlets in the thin sections resulting in increased alteration immediately next
to the vein. Figure 5 shows part of the vein that consists mostly of quartz with some
small concentrations of sulfides bordering the vein. Within the vein primary chlorite is
present and can be observed within 0.2 mm of the quartz vein. The envelope minerals
within 1 mm from the vein have been highly altered to chlorite, epidote, and sericite.
Chlorite that is 1 mm away from the vein in the bottom right of figure 5 displays a more
platey texture than the irregular shape of the primary chlorite immediately near the quartz
vein.
As biotite is altered to chlorite a mixture of chlorite (65%), epidote (10%), sphene
(10%) and void space (15%) is created (Eggleton and Banfield, 1984). The alteration of
biotite to chlorite, sphene, and epidote is most clearly seen immediately near veins (figure
5), but can be found in the propylitic zone as a whole. In all the samples, epidote and
sericized plagioclase occurs within close proximity to or touching chlorite that replaces
biotite (figure 8).
Figure 5: Sample 534 at 40 times magnification in plane polarized light. The sample displays a 1/8mm vein cutting across the sample. The vein consists of mainly quartz with sulfides and chlorite immediately adjacent to it. The alteration envelope (about 1mm from vein) in the rest of the view displays chlorite, epidote, and sericite that has replaced feldspars and biotite.
Figure 6: Sample 534 at 40 times magnification in cross polarized light. The vein (1/8 mm think) is mostly quartz that has gone to extinction and is surrounded by highly altered plagioclase. The light blue plagioclase crystal has been replaced mainly by sericite. Roughly 0.3 mm from the vein in the upper right corner is a cluster of bright colored crystals, which are epidote.

Haggart 10
Throughout all the samples, the main minerals of alteration are biotite and
feldspars, mainly plagioclase. In figure 7 it can be seen that around the vein the majority
of the alteration is occurring in one mineral. The mineral is identified as a feldspar from
the observed birefringence, extinction behaviors, as well as the albite twinning (figure 7).
This type of alteration is found in varying degrees throughout all the samples. Feldspars
within close proximity to veins observed display high degrees of seritization. In the
samples without veins or further than 0.5 mm from a vein, sericitic alteration is abundant,
but usually does not result in complete replacement of the original feldspar crystal.
Alteration of plagioclase is necessary for many of the alterations to occur because of the
limited supply of calcium throughout the rock.
Plagioclase is an important mineral of alteration because in most cases it supplies
the calcium needed to form sphene and epidote. All the alteration chlorite forms with
sphene scattered within the chlorite grain and epidote close to the crystal. As biotite is
replaced by chlorite many elements are released that are needed to form sphene and
epidote, but calcium must come from another source. Plagioclase is abundant in the Butte
quartz monzonite and as it is altered to muscovite calcium is released. Close to veins it
appears that more alteration can take place because of a supply of calcium from the
hydrothermal fluid.
Figure 7: Sample 620 at 40 times magnification under cross polarized light. The centered plagioclase crystal displays albite twinning and is partially
replaced by sericite.
Figure 8: Sample 383 at 40 times magnification under cross polarized light. An alteration chlorite crystal is centered in the image with opaque sphene scattered within the grain. Epidote clusters of many small epidote crystals are shown in the upper left and right corner, which have replaced plagioclase. The bottom right crystal is a plagioclase crystal,
which appears to also have epidote throughout it.
Haggart 11
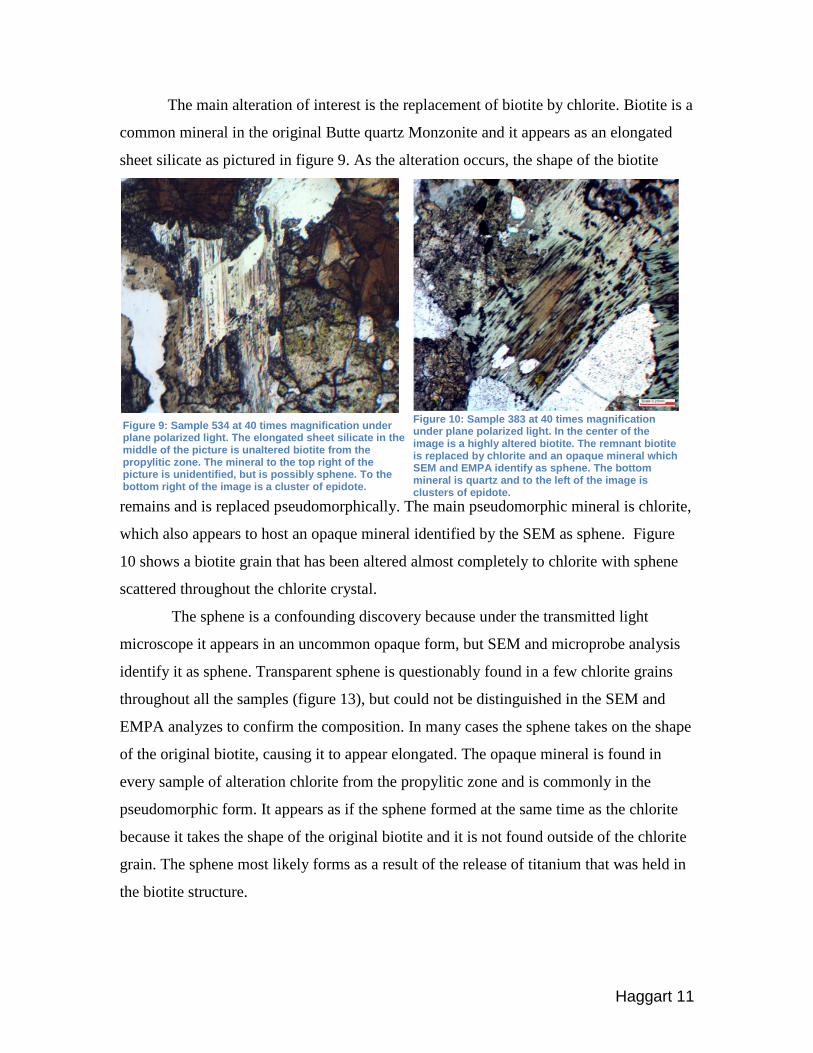
The main alteration of interest is the replacement of biotite by chlorite. Biotite is a
common mineral in the original Butte quartz Monzonite and it appears as an elongated
sheet silicate as pictured in figure 9. As the alteration occurs, the shape of the biotite
remains and is replaced pseudomorphically. The main pseudomorphic mineral is chlorite,
which also appears to host an opaque mineral identified by the SEM as sphene. Figure
10 shows a biotite grain that has been altered almost completely to chlorite with sphene
scattered throughout the chlorite crystal.
The sphene is a confounding discovery because under the transmitted light
microscope it appears in an uncommon opaque form, but SEM and microprobe analysis
identify it as sphene. Transparent sphene is questionably found in a few chlorite grains
throughout all the samples (figure 13), but could not be distinguished in the SEM and
EMPA analyzes to confirm the composition. In many cases the sphene takes on the shape
of the original biotite, causing it to appear elongated. The opaque mineral is found in
every sample of alteration chlorite from the propylitic zone and is commonly in the
pseudomorphic form. It appears as if the sphene formed at the same time as the chlorite
because it takes the shape of the original biotite and it is not found outside of the chlorite
grain. The sphene most likely forms as a result of the release of titanium that was held in
the biotite structure.
Figure 10: Sample 383 at 40 times magnification under plane polarized light. In the center of the image is a highly altered biotite. The remnant biotite is replaced by chlorite and an opaque mineral which SEM and EMPA identify as sphene. The bottom mineral is quartz and to the left of the image is clusters of epidote.
Figure 9: Sample 534 at 40 times magnification under plane polarized light. The elongated sheet silicate in the middle of the picture is unaltered biotite from the propylitic zone. The mineral to the top right of the picture is unidentified, but is possibly sphene. To the bottom right of the image is a cluster of epidote.

Haggart 12
Non-replacement chlorite (primary chlorite) is found only in the veins of samples
534 and 383. The primary chlorite appears sporadically throughout the vein and occurs in
small clusters. The primary chlorite has a much more irregular shape than the alteration
chlorite as well as having an unusual banding pattern when looked at in cross polarized
light (figure 13).
Chlorite easily replaces biotite because both minerals are sheet silicates, which
allows for minimal structure change, and both minerals contain Mg, Fe, Al, and Si. All
the samples displayed a similar behavior of alteration in which if any biotite remained it
was almost in the exact middle of the chlorite, meaning that the alteration occurred from
the outside inward at a constant rate around the whole grain. As the replacement occurs,
titanium and potassium are freed from biotite and the Ti becomes the building block for
sphene, which forms at the same time as the chlorite. The sphene in figure 10 appears to
be elongated, taking the shape of the original biotite. Most of the pseudomorphic chlorite
appears throughout the sample volume with remnant biotite present and sphene, which
are commonly present near epidote and sericite.
Figure 12: Primary chlorite in a vein from sample 534 at 100 times magnification seen in cross polarized light. The chlorite displays a unique banding pattern, which alteration chlorite lacks. The white mineral is quartz and the bottom left corner has a seritized plagioclase crystal. Scattered epidote crystals display bright interference colors.
Figure 11: Sample 534 at 40 times magnification under plane polarized light. Centered in the image is a vein filled with almost entirely chlorite and some quartz. The primary chlorite displays an irregular shape. Surrounding the vein is highly altered plagioclase. Surrounding the vein is epidote and
highly altered plagioclase.
Haggart 13
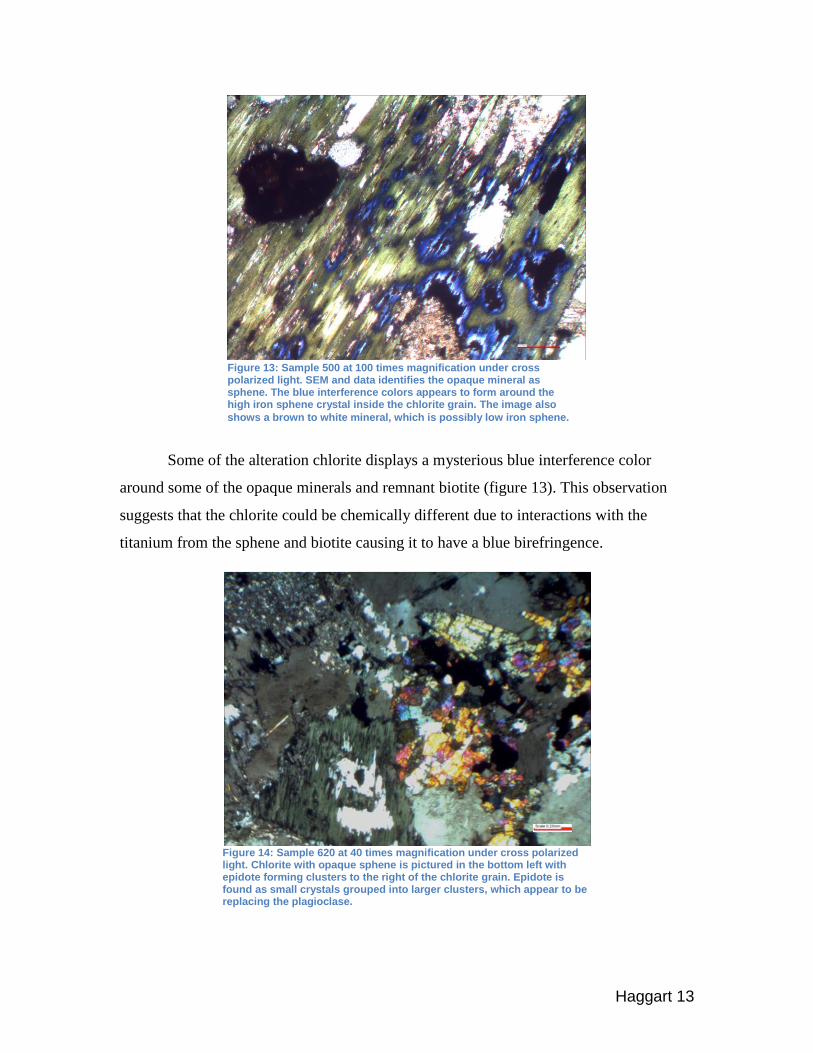
Some of the alteration chlorite displays a mysterious blue interference color
around some of the opaque minerals and remnant biotite (figure 13). This observation
suggests that the chlorite could be chemically different due to interactions with the
titanium from the sphene and biotite causing it to have a blue birefringence.
Figure 13: Sample 500 at 100 times magnification under cross polarized light. SEM and data identifies the opaque mineral as sphene. The blue interference colors appears to form around the high iron sphene crystal inside the chlorite grain. The image also
shows a brown to white mineral, which is possibly low iron sphene.
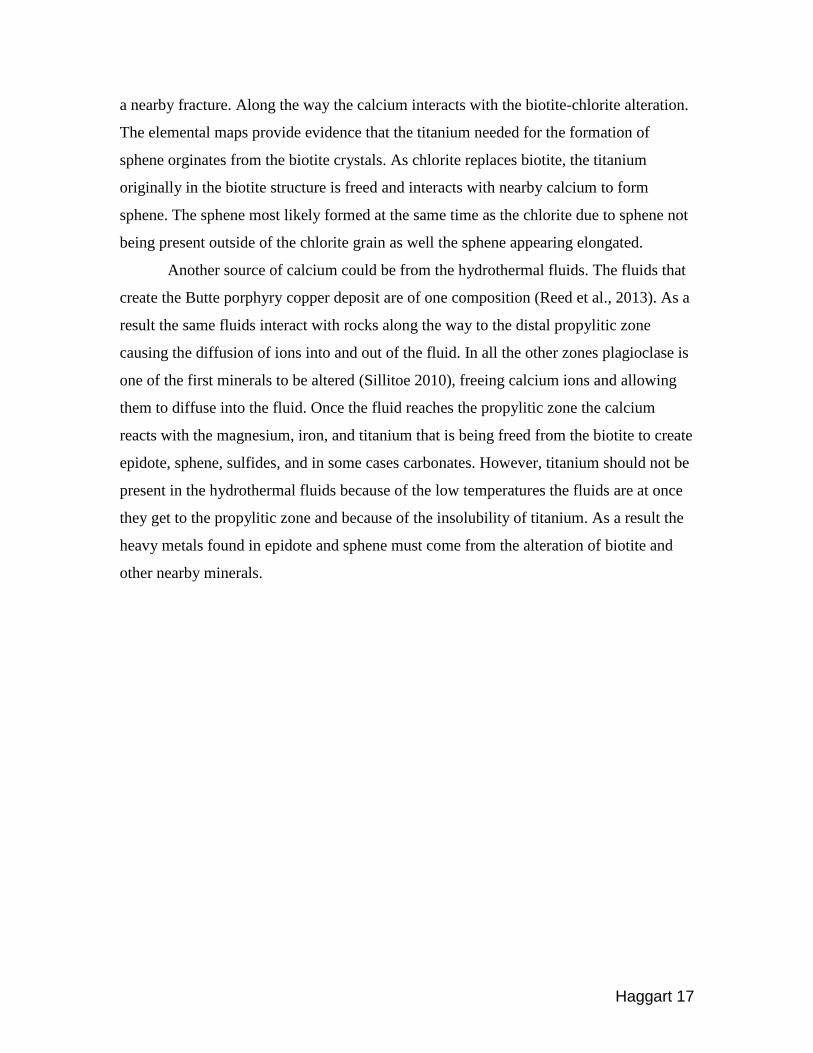
Figure 14: Sample 620 at 40 times magnification under cross polarized light. Chlorite with opaque sphene is pictured in the bottom left with epidote forming clusters to the right of the chlorite grain. Epidote is found as small crystals grouped into larger clusters, which appear to be replacing the plagioclase.

Haggart 14
Epidote is another very common alteration mineral in the propylitic suite. It
appears to replace feldspars, mainly plagioclase due to the supply of calcium needed to
form these crystals. The epidote found throughout these samples is always in close
proximity to chlorite due to the iron and magnesium released from the chlorite alteration.
The epidote forms relatively small crystals and is always found in large clusters (figure
14
Scanning Electron Microscope Imaging
To further analyze the samples from the propylitic suite, a scanning electron
microscope was used to get a general makeup of the elements present in the selected
samples. The SEM allowed for three samples to be mapped using elemental mapping and
backscatter electron detection. The two altered rocks analyses showed similar
characteristics in texture and composition despite the rocks being 150 feet of depth apart.
Sample 383 has a quartz sulfide vein cutting through the sample that also contains
primary chlorite (figure 15 & 16). Primary chlorite is distinctly different from alteration
chlorite because it exhibits a distinct pattern that occurs in all of the primary chlorite
found in the vein. The interlaced light and dark band pattern shown on the SEM (figure
15 & 16) implies that the lighter chlorite bands have a heavier mean atomic number and
the darker bands have a lighter mean atomic number. An analysis on the same grain as in
Figure 16: Sample 383 displaying a primary chlorite grain surrounded by sphalerite in a vein. The chlorite displays the same banding pattern as other primary chlorite found in veins. SEM work also showed that the primary sulfide in the veins was sphalerite. (white mineral).
Figure 15: Sample 383 highly magnified on a chlorite grain in a cross cutting vein. The chlorite grain displays a banding pattern of two different bands. The lighter band has a higher mean atomic number than the darker bands. The primary chlorite grain is in a quartz vein with a sulfide present (white mineral).

Haggart 15
figure 15 on the EMPA shows that the lighter bands consist of more iron and less
magnesium than the darker bands.
The alteration chlorite is distinctly different from the primary chlorite in quartz
veinlets. Alteration chlorite commonly occurs as a pseudomorph of biotite and in many
observed samples contains remnant biotite. The alteration also results in the formation of
another mineral throughout the chlorite crystal. The SEM confirmed that the mineral
present in the chlorite was CaTiSiO5, or sphene. Figure 17 shows the chlorite, and
surprisingly, the sphene holding the original biotite shape. Sphene commonly occurs in a
more blocky shape, but since this alteration replaces a sheet silicate, the sphene forms as
Figure 19: Sample 383 shows a chlorite grain surrounded by blocky sphene, which is surrounded by chlorite. This image is the only found instance in which sphene appeared in its more common blocky form and at is found at a larger scale than most
other sphene.
Figure 18: SEM image of sample 383. Chlorite is displayed having replaced all but the center biotite grain. Sphene is scattered throughout the chlorite as an elongated mineral. Unaltered quartz and potassium feldspar are in the upper and lower left corner. Slightly altered k-feldspar is visible in the upper right corner.
Figure 17: Sample 534 shows a chlorite crystal that has fully replaced the original biotite. As a result the chlorite and the sphene have taken the shape of the original biotite grain.

Haggart 16
a platy elongated mineral. In one case sphene is found to be forming around a chlorite
grain that is located inside another chlorite grain (figure 19). In this example the sphene
appears to be taking a more blocky
shape, coming to a point on one side of
the crystal.
Figure 21 is an element map
view of figure 18 in which chlorite is
replacing a biotite grain and creating
sphene in the process. The grain is
surrounded by potassium feldspars and
quartz. The elemental map (figure 21)
clearly shows titanium being present in
the biotite grain as well as concentrated
amounts in the scattered sphene grains.
In figure 21 the elemental map view
makes the distinctly different minerals obvious. Potassium feldspar (blue) remains
unaltered in the corners of
the figure and the
magnesium and iron became
more concentrated in the
chlorite grains. The
pseudomorphic behavior of
sphene is shown as the
streaky teal color (figure
20).
The calcium needed
to form sphene could come
from freed calcium ions as
plagioclase undergoes
alteration. As plagioclase
decalcifies through sericitic alteration, the calcium diffuses from the point of alteration to
Figure 21: A elemental map of figure 15 (sample 383). Each element of interested are given the following color code: Green=Calcium, Teal=Titanium, yellow=magnesium and iron, and blue=potassium. The chlorite is shown consisting of large quantities of iron and magnesium and the biotite can be seen having titanium. The sphene has large quantities of both calcium and titanium. The upper right and bottom left corners consist of potassium feldspars.
Figure 20: An elemental map from sample 383, same view as figure 15. The teal color displays only the titanium found in the sample, which can be seen to be concentrated in the sphene crystals as well as in the remnant biotite.
Haggart 17
a nearby fracture. Along the way the calcium interacts with the biotite-chlorite alteration.
The elemental maps provide evidence that the titanium needed for the formation of
sphene orginates from the biotite crystals. As chlorite replaces biotite, the titanium
originally in the biotite structure is freed and interacts with nearby calcium to form
sphene. The sphene most likely formed at the same time as the chlorite due to sphene not
being present outside of the chlorite grain as well the sphene appearing elongated.
Another source of calcium could be from the hydrothermal fluids. The fluids that
create the Butte porphyry copper deposit are of one composition (Reed et al., 2013). As a
result the same fluids interact with rocks along the way to the distal propylitic zone
causing the diffusion of ions into and out of the fluid. In all the other zones plagioclase is
one of the first minerals to be altered (Sillitoe 2010), freeing calcium ions and allowing
them to diffuse into the fluid. Once the fluid reaches the propylitic zone the calcium
reacts with the magnesium, iron, and titanium that is being freed from the biotite to create
epidote, sphene, sulfides, and in some cases carbonates. However, titanium should not be
present in the hydrothermal fluids because of the low temperatures the fluids are at once
they get to the propylitic zone and because of the insolubility of titanium. As a result the
heavy metals found in epidote and sphene must come from the alteration of biotite and
other nearby minerals.

Haggart 18
Other minerals found throughout the samples are sphalerite, chalcopyrite, pyrite,
and sphene. In the vein, sphalerite is the main sulfide with chalcopyrite being the second
most abundant and very little pyrite is present. Metal bearing sulfides are mainly in the
veins because the hydrothermal fluids that flow in the fractures contain a supply of zinc
and copper (Sillitoe, 2010). Throughout the rest of the samples the main sulfide present is
pyrite. Despite the previous observation that galena was common in the propylitic zone
(Mercer and Reed, 2013), no galena was found in any of the samples.
In the propylitic suite small veinlets are widely abundant similar to the magnified
vein shown in figure 22. If these veins contain sphalerite and chalcopyrite in similar
quantities such as found in sample 383, then this zone could hold a huge reserve of zinc
and copper.
Figure 22: A vein found in sample 383. The lightest shade of gray (white) is identified as sphalerite. The surrounding minerals were not identified, but based on other SEM analysis’s the vein is mostly quartz with some feldspars and sparse chlorite.

Haggart 19
Micro Probe Analysis
Two runs were completed using the EPMA in the CAMCOR Lokey laboratory at
the University of Oregon. Both runs were optimized for the analyses of chlorite, biotite,
epidote, feldspars, and sulfides in the samples. The alteration of biotite to chlorite was the
focus of the two runs in hope that it could be used as a geothermometer to tell us what the
temperature was at the time of chlorite precipitation. The analysis showed that chlorite
has a large range of iron to magnesium concentrations (graph 1). The samples seemed to
show a pattern of more iron and less magnesium as depth increases. Primary chlorite
(samples Un 12,13, and 14) is shown to have a higher magnesium content than alteration
chlorite, but still has a large amount of variability in the compositions (Mg3.995-5.572Fe4.127-
4.723Mn0.18-0.248Al2.908-2.212)[(Si5961-0.5Al2.039-2.5)O20] (table 1). The primary chlorite also
exhibits a banding pattern in which one band has a higher mean atomic number than the
other band. Analyses of the chlorite in figure 12 shows that the two zones range by
almost 2 weight percent in iron content.
Graph 1: Iron verses magnesium is shown on the above graph. Sample Un 12, 13, and 14 are primary chlorite found in the vein of sample 383. Sample Un 13 corresponds with the chlorite pictured in figure 9. All other points are alteration chlorite and are average of all the points analyzed on the EMPA.

Haggart 20
Anaylsis of feldspars showed a large range of compositions, from plagioclase to
alkali feldspars. The fresh rock had less pure alkali feldspars compared to the altered
rocks. Sample 383 contains an altered potassium feldspar grain with the formula
(K0.962Na0.049)(Al1.048Si2.96O8) and the unaltered rock had the composition of
(K0.709Na0.301Ca0.013)(Al1.062Si2.942O8). The altered rock has a 0.253 increase in the
potassium cation concentration. In the fresh Butte granite the plagioclase was found to be
(Na0.611-0.542Ca0.459-0.414K0.02-0.013)(Al1.469Si2.53O8). In the altered rock plagioclase is
almost always altered to some degree, but one analysis was done on sample 383 which
fell in the range of plagioclase found in the unaltered rock. Plagioclase is not common in
the altered rock because it is the first mineral to alter to epidote, chlorite, and sericite
(Sillitoe 2010). The potassium feldspars were much more abundant and are less altered
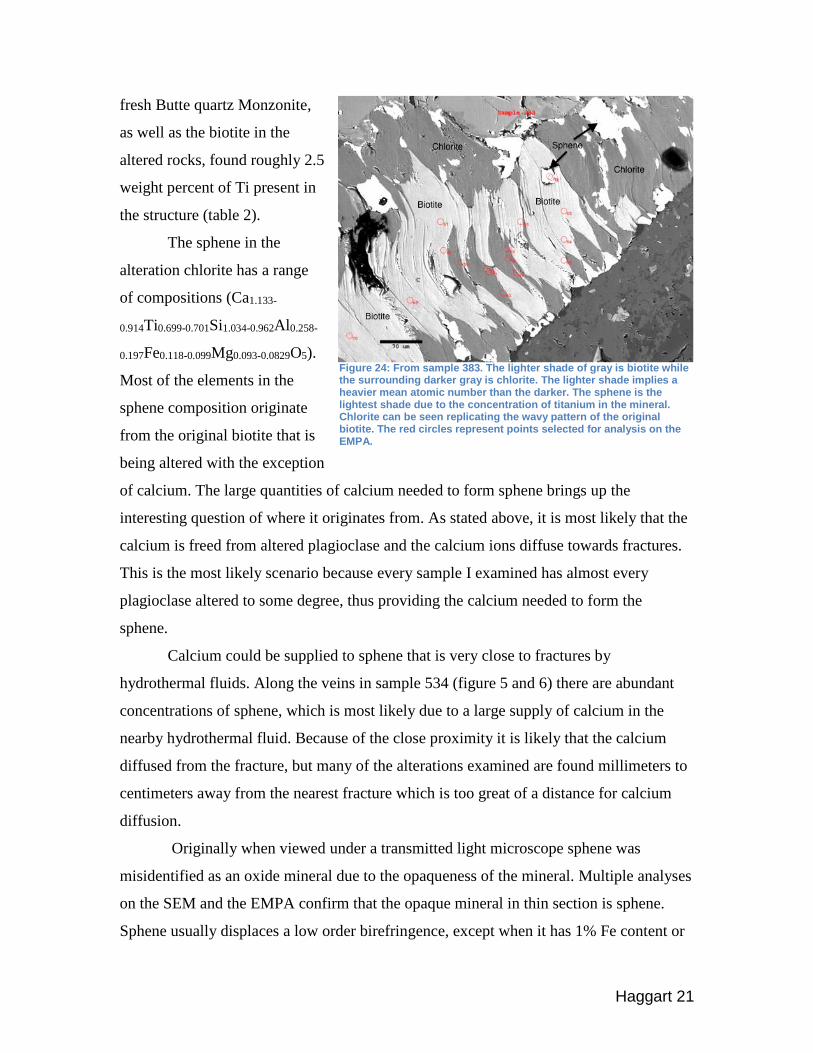
than the plagioclase. The biotite compositions analyzed in the altered rocks are similar to those
analyzed in the unaltered rock, indicating that all the biotite is unaltered igneous biotite.
Figure 21 shows a BSE image from the microprobe of chlorite replacing biotite. The
biotite originally has a wavy sheet silicate appearance that the chlorite replicates where it
replaced it. Biotite commonly contains trace amounts of titanium and the analysis of the
Figure 23: Ternary diagram displaying the varying compositions found in the propylitic suite. Circled is the fresh granite plagioclase. Ab=Albite, Or=Orthoclase, An=Anorthite.
Haggart 21
fresh Butte quartz Monzonite,
as well as the biotite in the
altered rocks, found roughly 2.5
weight percent of Ti present in
the structure (table 2).
The sphene in the
alteration chlorite has a range
of compositions (Ca1.133-
0.914Ti0.699-0.701Si1.034-0.962Al0.258-
0.197Fe0.118-0.099Mg0.093-0.0829O5).
Most of the elements in the
sphene composition originate
from the original biotite that is
being altered with the exception
of calcium. The large quantities of calcium needed to form sphene brings up the
interesting question of where it originates from. As stated above, it is most likely that the
calcium is freed from altered plagioclase and the calcium ions diffuse towards fractures.
This is the most likely scenario because every sample I examined has almost every
plagioclase altered to some degree, thus providing the calcium needed to form the
sphene.
Calcium could be supplied to sphene that is very close to fractures by
hydrothermal fluids. Along the veins in sample 534 (figure 5 and 6) there are abundant
concentrations of sphene, which is most likely due to a large supply of calcium in the
nearby hydrothermal fluid. Because of the close proximity it is likely that the calcium
diffused from the fracture, but many of the alterations examined are found millimeters to
centimeters away from the nearest fracture which is too great of a distance for calcium
diffusion.
Originally when viewed under a transmitted light microscope sphene was
misidentified as an oxide mineral due to the opaqueness of the mineral. Multiple analyses
on the SEM and the EMPA confirm that the opaque mineral in thin section is sphene.
Sphene usually displaces a low order birefringence, except when it has 1% Fe content or
Figure 24: From sample 383. The lighter shade of gray is biotite while the surrounding darker gray is chlorite. The lighter shade implies a heavier mean atomic number than the darker. The sphene is the lightest shade due to the concentration of titanium in the mineral. Chlorite can be seen replicating the wavy pattern of the original biotite. The red circles represent points selected for analysis on the EMPA.

Haggart 22
higher (Deer, 1992). Table 5 shows that the Fe content of three different sphene crystals
range from 1.7 to 3.3 percent, which causes it to appear black or opaque in thin section.
Epidote compositions vary slightly where it lies distal from veins, but has
significantly more calcium where it is immediately next to a vein. Next to a vein the
composition is Ca3.1195Al2.477Fe0.828Mn0.26Si3.1195 and away from the vein the calcium
drops to 2.1 cations. The increase in Ca content in the sphene that forms near the veins is
evidence for a calcium rich hydrothermal fluid that originally flowed through the
fractures. Distal sphene has a lower calcium concentration, which is contributed to lower
supply of calcium from the alteration of plagioclase.
Chlorite Geothermometer
There have been many chlorite geothermometers proposed over the years based
on varying criteria. The chlorite geothermometer reviewed by Caritat et al. provides
multiple techniques for using chlorite as a geothermometer. The first empirical formula
attempted in this study was one derived by Cathelineau (1987). The relationship between
temperature and AlIV was computed to be:
𝑇 = −61.92 + 321.98𝐴𝑙𝐼𝑉
This equation is supposed to be applicable in diagenetic, hydrothermal, and metamorphic
settings (Cathelineau 1987), but was found to have little value with the chlorite
compositions in this study. Equation 1 resulted in temperatures ranging from 600°C to
800°C, which is much higher than the expected 340°C.
Kranidiotis and Maclean offered a correction to Cathelineau’s work by taking in
account the variation in Fe/(Fe+Mg). As iron is increased in chlorite AlIV also increases
with little or no change to the Al in the octahedral site (Kranidiotis & MacLean 1987). To
correct for this a new AlIV is computed using equation 2.
𝐴𝑙𝐶𝐼𝑉 = 𝐴𝑙𝐼𝑉 + 0.7(
𝐹𝑒
𝐹𝑒 +𝑀𝑔)
The temperature is then computed using equation 3, which is calibrated for pressures
ranging from 100-700 bars. Based on previous studies the pressure of the Butte samples
falls within this range.
𝑇 = 106𝐴𝑙𝐶𝐼𝑉 + 18
Equation 1
Equation 2
Equation 3

Haggart 23
(Caritat). I applied this method on the new set of data from Butte, Montana and obtained
more reasonable temperatures. The temperatures range from 253° C to 321° C with the
higher end being a primary chlorite that formed in the vein (graph 2). Un 14 and Un 12
are also primary chlorites from veins and, as expected, Un 12 yields a higher temperature.
Un 13 is also a primary chlorite and is calculated to have formed at 272° C which is
lower than the other two, but is still feasible if it formed at a later stage once the fluids
had already begun to cool.
A third empirical formula was derived by Jowett (1991) in which another
correction derived from an isothermal Fe/(Fe+Mg) ratio normalized based on their data
from the Salton Sea and Los Azufres. Their new equation is supposed to able to find
temperatures for chlorites that formed between 150°C and 325°C (Patrice and Walshe,
1993). When applied to the set of data collected from Butte the temperature ranges
calculated were from 620°C to 720°C. The temperatures reported are far out of the range
of the expected 340°C to 350°C.
A new chlorite geothermometer has been proposed by Bourdelle et al. for
diagenetic to low-grade metamorphic chlorites. Unlike the chlorite geothermometers
based solely on stoichiometry, this new method uses thermodynamics to find the
temperatures the chlorites formed at (Bourdelle 2013). The geothermometer has been
tested and proved accurate for conditions where the temperature is less than 350°C and
less than 4kbar of pressure. Chlorites from the Butte propylitic suite fit in these
Graph 2: All temperatures calculated using equations 2 and 3 then plotted against their depths. Sample 12,13, and 14 are primary chlorite while the rest are alteration chlorites. Temperatures fall within the expected range of 220 to 340 degrees Celsius.
0
100
200
300
400
500
600
250 270 290 310 330D
epth
(m
)Temperature (C)
Temperture vs. Depth
Un 4
Un 7
Un 12
Un 13
Un 14
Un 20
Un 24

Haggart 24
conditions, making them a good candidate for this geothermometer. Once applied it could
give a clearer picture of the temperatures at which chlorite replaces biotite in
hydrothermal systems similar to the one that created this porphyry copper depsosit.
Conclusions
Alteration in the propylitic zone in porphyry copper deposits is not as extreme as
found in other zones, but it still offers insight into how porphyry copper deposits form as
a whole and the fluids that form them. As the alteration of titaniferous biotite to chlorite
occurs sphene forms, owing to increase concentrations of titanium. The release of
calcium from altered plagioclase provides the calcium needed to form the sphene and
epidote that occurs near the chlorite alterations. An abundance of epidote and sphene
around veins could indicate a high supply of calcium from the hydrothermal fluids, which
gives further insight into the composition of the fluids.
The sphene found throughout the propylitic zone exhibits uniquely different
behaviors than expected. It forms as a pseudomorph of biotite, which is uncommon for
the sphene structure, as well as appearing opaque in thin section. The pseudomorphism
could be due to the low temperatures it formed at, thus not allowing it to form the blocky
shape it usually takes. The temperature of formation could also be a controlling factor on
the amount of iron that substitutes into the structure causing it to appear black in thin
section. Uranium can also substitute into the structure for calcium which in theory could
be used for dating of the rock (reference), giving a more accurate time of formation for
the deposit as a whole.
In this study the geothermometer created by Cathelineau did not prove to be
accurate or reliable, but the revised version created by Kranidiotis did prove to be more
realistic. It cannot be said with absolute certainty that the temperatures recorded are
correct, due to the lack of available information of the formation temperatures, but 280°
to 360° is a more expected temperature ranged based on previous research. The new
geothermometer created by Bourdelle et al. uses a semi-empirical model which appears
to provide a more accurate temperature for conditions under 350°C.

Haggart 25
Na
me
S
i W
T%
T
i W
T%
A
l W
T%
F
e W
T%
M
n W
T%
M
g W
T%
C
a W
T%
N
a W
T%
K
WT
%
P W
T%
O
WT
%
H W
T%
Un 4
-
Sam
ple
383
13.4
62
0.3
44
8.7
02
18.2
79
0.5
15
9.5
34
0.0
56
0.0
00
0.8
97
-0.0
05
46.7
55
1.4
59
Un 7
-
Sam
ple
383
12.6
45
0.4
66
9.6
65
18.2
27
0.8
81
10.0
12
0.4
72
-0.0
03
0.0
10
-0.0
04
46.2
80
1.3
50
Un 1
2 -
Sam
ple
383
11.9
48
0.0
21
10.5
96
20.3
97
1.0
54
8.0
76
0.0
32
0.0
95
0.1
05
-0.0
03
46.2
13
1.4
66
Un 1
3 -
Sam
ple
383
11.7
02
0.0
22
10.5
46
20.5
50
0.9
98
8.2
53
0.0
34
0.0
02
0.1
34
-0.0
03
46.2
65
1.4
98
Un 1
4 -
Sam
ple
383
12.3
43
0.0
26
9.9
49
18.2
41
0.7
83
10.5
99
0.0
23
0.0
04
0.0
26
-0.0
13
46.6
03
1.4
17
Un 2
0 -
Sam
ple
534
12.1
48
0.0
17
10.9
58
13.9
75
0.7
94
12.1
91
0.0
13
0.0
03
0.0
18
-0.0
05
48.3
19
1.5
69
Un 2
4 -
Sam
ple
534
12.2
48
0.0
29
10.3
24
13.9
48
0.8
06
12.1
65
0.0
16
-0.0
01
0.0
45
-0.0
09
48.7
46
1.6
82
Ta
ble
1:
Ch
lori
te c
om
po
sit
ion
s f
rom
th
e s
ec
on
d E
MP
A r
un
. O
xyg
en
an
d h
yd
rog
en
are
ca
lcu
late
d b
as
ed
on
sto
ich
iom
etr
y d
on
e b
y t
he
mic
rop
rob
e s
oft
wa
re.

Haggart 26
Na
me
S
i W
T%
T
i W
T%
A
l W
T%
F
e W
T%
M
n W
T%
M
g W
T%
C
a W
T%
N
a W
T%
K
WT
%
P W
T%
O
WT
%
H W
T%
Un 5
- S
am
ple
383
17.1
7308
2.5
31627
7.0
76002
14.7
3373
0.2
50343
7.1
62036
0.0
12045
0.0
43242
7.7
23579
-0.0
0756
42.7
2546
0.5
76424
Un 1
5 -
Sam
ple
383
16.7
3533
2.6
63094
7.1
6152
14.8
5208
0.2
42569
7.2
34604
0.0
01118
0.0
48185
8.1
7977
-0.0
1299
42.3
4468
0.5
50087
Un 2
1 -
Sam
ple
534
29.5
623
0.0
06601
10.1
137
0.2
49261
0.0
07742
0.0
02236
0.0
0131
0.2
89244
13.9
0653
-0.0
1345
45.8
5353
0.0
21041
Un 2
6 -
Sam
ple
Bu
16.7
528
2.5
56823
6.8
5102
14.1
435
0.1
99606
7.4
65855
-0.0
0218
0.0
72947
8.0
13218
-0.0
1228
43.2
4297
0.7
15743
Un 2
8 -
Sam
ple
Bu
16.8
587
2.5
3176
6.9
7184
14.7
0705
0.2
15847
7.3
3825
0.0
03451
0.0
67864
8.1
47058
-0.0
1183
42.5
786
0.5
91459
Un 3
4 -
Sam
ple
383
16.6
7915
2.4
9936
7.1
79745
15.3
7595
0.4
68961
7.1
1277
0.0
54189
0.0
49125
7.7
2049
-0.0
0886
42.3
12
0.5
57125
Ta
ble
2:
Bio
tite
Co
mp
os
itio
ns
fro
m t
he s
eco
nd
EM
PA
ru
n.
Ox
yg
en
an
d h
yd
rog
en
are
ca
lcu
late
d b
as
ed
on
sto
ich
iom
etr
y d
on
e b
y t
he
mic
rop
rob
e s
oft
wa
re.

Haggart 27
Na
me
S
i W
T%
T
i W
T%
A
l W
T%
F
e W
T%
M
n W
T%
M
g W
T%
C
a W
T%
N
a W
T%
K
WT
%
P W
T%
O
WT
%
H W
T%
Un 9
- S
am
ple
383
29.7
471
-0.0
2074
10.1
2108
0.0
33083
-0.0
016
0.0
00525
0.0
15876
0.4
06344
13.4
6643
-0.0
0985
46.2
5885
0.0
60239
Un 1
7 -
Sam
ple
383
26.3
788
0.0
03257
14.5
7323
0.1
30932
0.0
02271
0.0
03567
5.6
6978
5.1
65507
0.1
66153
0.0
29054
47.8
0083
0.0
76636
Un 1
8 -
Sam
ple
534
25.8
9464
0.0
16509
13.2
3292
1.3
32618
0.0
59363
1.0
25431
0.2
76643
1.7
97972
8.6
07076
-0.0
0682
47.4
373
0.3
26367
Un 2
2 -
Sam
ple
534
29.2
883
-0.0
068
10.5
6485
0.0
67523
-0.0
0374
0.0
01814
0.2
16782
1.5
08544
11.6
5652
-0.0
0727
46.6
078
0.1
05698
Un 2
5 -
Sam
ple
Bu
25.9
679
-0.0
0632
14.4
8115
0.1
42165
-0.0
0097
0.0
05161
6.0
56725
5.1
3519
0.1
87939
0.0
33305
47.8
63
0.1
3478
Un 2
7 -
Sam
ple
Bu
29.2
9888
-0.0
0805
10.1
5711
0.0
68382
-0.0
0178
0.0
01692
0.1
8558
2.4
51825
9.8
3482
-0.0
0341
47.7
1858
0.2
96389
Un 2
9 -
Sam
ple
Bu
29.4
0207
-0.0
0305
10.2
9827
0.0
98498
0.0
01875
-0.0
0056
0.0
57685
1.2
99145
12.2
891
-0.0
1176
46.4
671
0.1
01688
Un 3
1 -
Sam
ple
Bu
25.3
4755
0.0
18347
14.8
6345
0.2
54526
-0.0
0009
0.0
07755
6.6
7882
4.5
2835
0.2
89467
0.0
37735
47.8
1365
0.1
60368
Ta
ble
3:
Fe
lds
pa
r c
om
po
sit
ion
s f
rom
th
e s
ec
on
d E
MP
A r
un
. O
xyg
en
an
d h
yd
rog
en
are
ca
lcu
late
d b
as
ed
on
sto
ich
iom
etr
y d
on
e b
y t
he
mic
rop
rob
e s
oft
wa
re.

Haggart 28
Na
me
S
i W
T%
T
i W
T%
A
l W
T%
F
e W
T%
M
n W
T%
M
g W
T%
C
a W
T%
N
a W
T%
K
WT
%
P W
T%
O
WT
%
H W
T%
Un 1
0 -
Sam
ple
383
17.0
011
0.0
60546
12.6
1492
9.0
96722
0.4
03564
0.2
28427
16.0
6927
-0.0
0013
0.3
15093
0.1
42902
43.6
3142
0.4
3621
Un 1
9 -
Sam
ple
535
16.8
4039
0.0
19207
12.8
4779
8.8
89775
0.2
77025
0.0
29499
16.5
9608
-0.0
0768
0.0
06273
0.1
23238
43.8
9498
0.4
83478
Un 2
3 -
Sam
ple
534
17.2
178
0.0
07795
12.5
6448
9.2
4869
0.1
19564
0.0
40605
16.2
1925
0.3
35105
0.0
16063
0.1
07439
43.6
8908
0.4
34208
Un 3
2 -
Sam
ple
534
16.7
4364
0.0
01627
12.7
707
9.5
84056
0.1
20045
0.0
36556
16.6
9868
-0.0
0025
0.0
08891
0.1
02598
43.4
9808
0.4
35391
Un 3
3 -
Sam
ple
383
16.5
7175
0.0
33356
12.1
6295
10.3
858
0.5
40727
0.0
27886
16.2
726
-0.0
0257
-0.0
0032
0.1
03801
43.4
1155
0.4
92531
Ta
ble
4:
Ep
ido
te C
om
po
sit
ion
s f
rom
th
e s
ec
on
d E
MP
A r
un
. O
xyg
en
an
d h
yd
rog
en
are
c
alc
ula
ted
ba
sed
on
sto
ich
iom
etr
y d
on
e b
y t
he
mic
rop
rob
e s
oft
wa
re.

Haggart 29
Ta
ble
5:
Sp
he
ne
Co
mp
os
itio
ns
fro
m t
he
sec
on
d E
MP
A r
un
. O
xyg
en
an
d h
yd
rog
en
are
ca
lcu
late
d b
ase
d o
n
sto
ich
iom
etr
y d
on
e b
y t
he
mic
rop
rob
e s
oft
wa
re.
Na
me
S
i W
T%
T
i W
T%
A
l W
T%
F
e W
T%
M
n W
T%
M
g W
T%
C
a W
T%
N
a W
T%
K
WT
%
P W
T%
O
WT
%
H W
T%
Un 6
-
Sam
ple
383
13.3
1865
16.6
645
2.6
2238
1.7
0007
0.0
18055
0.0
32362
22.3
8975
-0.0
0442
0.0
71714
2.0
46327
41.0
967
0.0
43997
Un 8
-
Sam
ple
383
14.6
0677
16.8
7627
3.4
99337
3.2
9957
0.1
16799
1.1
32758
18.4
2733
0.0
06367
0.0
15028
0.1
53789
41.6
9237
0.1
7363
Un 1
6 -
Sam
ple
383
13.8
8873
17.8
8793
3.3
27753
2.7
5871
0.1
06022
1.0
05513
19.0
9463
-0.0
0632
0.0
16376
0.1
47324
41.5
7847
0.1
94907

Haggart 30
SA
MP
LE S
i WT%
Mg
WT%
Fe
WT%
Al W
T% C
a W
T% N
a W
T%
K W
T% T
i WT%
Mn
WT%
Cl W
T%
Ch
lori
te (
1)13
.472
0411
.614
6412
.499
5210
.529
120.
0191
648
0.00
5760
80.
0683
342
0.01
1129
80.
5773
848
0.01
6319
2
Bio
tite
(1)
17.4
8738
57.
3905
6923
111
.522
6069
8.02
8033
080.
0151
2862
0.07
3527
696.
9630
154
2.27
8056
20.
4885
6561
50.
1828
3192
Bio
tite
(2)
17.7
5826
77.
7178
8666
710
.540
1458
8.10
6215
0.01
6331
670.
0686
7042
7.18
6595
82.
1450
858
0.51
5326
0.18
1483
25
Feld
spar
(1)
25.0
2416
70.
4569
9483
31.
2251
5842
13.8
9889
170.
1707
2575
0.12
8179
257.
8644
80.
0036
285
0.01
5869
50.
0218
4783
Feld
spar
(2)
30.2
324
-0.0
0037
292
0.06
8645
699.
1450
4077
0.01
9461
920.
4546
3477
13.2
4689
20.
0252
401
-0.0
0122
308
0.02
1321
62
Bio
tite
(1)
17.3
884
6.89
8048
9.36
1052
8.75
4334
0.04
4819
40.
0618
274
7.25
775
2.56
4788
0.40
5455
80.
0904
544
Ap
atit
e0.
1982
660.
0140
435
0.08
4650
50.
0539
8738
.607
50.
0233
495
0.11
5993
0.00
9359
50.
0900
450.
2385
47
Bio
tite
(2)
15.1
1374
9.38
6892
10.9
729
10.8
0682
20.
0528
376
0.01
1038
81.
1608
694
0.17
0675
60.
4993
850.
0349
7
Bio
tite
(3)
16.4
4726
7.82
251
10.5
9547
810
.356
910.
0334
116
0.03
8785
23.
3865
184
1.03
1962
0.48
0892
20.
0993
43
Bio
tite
(4)
17.3
6652
8.04
8288
9.97
0785
8.62
895
0.01
5377
40.
0432
787
8.17
859
0.84
9774
40.
4499
151
0.10
0168
7
Ta
ble
6:
Ru
n 1
EM
PA
an
aly
sis
of
sa
mp
le 6
20.

Haggart 31
References
Bourdelle, Franck, et al. "A new chlorite geothermometer for diagenetic to
low-grade metamorphic conditions." Contributions to Mineralogy and Petrology165.4 (2013): 723-735.
Cathelineau, Michel, and David Nieva. "A chlorite solid solution
geothermometer the Los Azufres (Mexico) geothermal system." Contributions to Mineralogy and Petrology 91.3 (1985): 235-244.
DE, PATRICE, and L. WALSHE. "Chlorite geothermometry: a
review." Clays and clay minerals 41.2 (1993): 219-239. Deer, W. A., R. A. Howie, and J. Zussman. An Introduction to the Rock-
forming Minerals. Harlow, Essex, England: Longman Scientific & Technical, 1992. Print.
Eggleton, Richard A., and Jillian F. Banfield. "The alteration of granitic
biotite to chlorite." American Mineralogist 70.9-10 (1985): 902-910. Lagat, John. "Hydrothermal alteration mineralogy in geothermal fields with
case examples from Olkaria domes geothermal field, Kenya." Short Course II on Surface Exploration for Geothermal Resources. Organized by UNU-GTP and KenGen, at Lake Naivasha, Kenya (2007): 2-17.
Mercer, Celestine N., and Mark H. Reed. "Porphyry Cu-Mo Stockwork
Formation by Dynamic, Transient Hydrothermal Pulses: Mineralogic Insights from the Deposit at Butte, Montana." Economic Geology 108.6 (2013): 1347-1377.
Rusk, Brian G., Mark H. Reed, and John H. Dilles. "Fluid inclusion
evidence for magmatic-hydrothermal fluid evolution in the porphyry copper-molybdenum deposit at Butte, Montana." Economic Geology 103.2 (2008): 307-334.
Seedorff, Eric, et al. "Porphyry deposits: characteristics and origin of
hypogene features." Economic Geology 100th Anniversary Volume 29 (2005): 251-298.
Sillitoe, Richard H. "Porphyry copper systems." Economic Geology 105.1
(2010): 3-41. .