Hydrothermal Alteration and Veins at the Epithermal Au-Ag...
29
0361-0128/11/3975/945-29 945 Introduction GOLD AND SILVER in adularia-sericite epithermal deposits typ- ically occur in structurally controlled veins that are mineral- ized over a relatively confined vertical extent and are en- veloped by extensive zones of hydrothermal alteration that may extend over tens, hundreds, or thousands of meters (e.g., Mule Canyon, Nevada: John et al., 2003; Comstock: Hudson, 2003; Favona, New Zealand: Simpson and Mauk, 2007). Many papers describe alteration in terms of general mineral associations that have been adopted from terminology used to describe alteration of porphyry Cu deposits (i.e., potassic, argillic, propylitic), whereas others describe the distribution of individual alteration minerals and vein types (e.g., Conrad et al., 1992; Hudson, 2003; Simpson and Mauk, 2007). Al- though the former method is very useful for field mapping, the recognition and delineation of associations is complicated by overlapping mineralogy and does not take into account the formation of different minerals at different times. In geother- mal fields, the active analogues of some epithermal deposits, the distributions of individual alteration minerals are rou- tinely determined during drilling to assess reservoir tempera- ture, inferred permeability, and fluid compositions that are only directly measurable following drilling and well testing (e.g., Henley and Ellis, 1983; Reyes, 1990; Simmons and Browne, 2000; Mas et al., 2006). Here, we describe the geo- logic setting, hydrothermal alteration, and vein types at the volcanic rock-hosted epithermal Au-Ag deposits and prospects in the Waitekauri area of the southern Hauraki goldfield, North Island, New Zealand (Figs. 1, 2). The area has been well drilled, and we present alteration and vein min- eralogy and fluid inclusion data along three cross sections that total 3 km in length; these sections range from the center to the margin of the hydrothermally altered area, and provide a 600-m reconstructed vertical range of the Waitekauri deposits Hydrothermal Alteration and Veins at the Epithermal Au-Ag Deposits and Prospects of the Waitekauri Area, Hauraki Goldfield, New Zealand MARK P. SIMPSON † AND JEFFREY L. MAUK School of Environment, The University of Auckland, Private Bag 92019, Auckland, New Zealand Abstract The Waitekauri area of the Hauraki goldfield, New Zealand, contains several adularia-sericite epithermal Au-Ag deposits and prospects. From west to east, the area contains the Sovereign, Jubilee, Scimitar, Scotia, Teutonic, and Jasper Creek deposits and prospects, which are hosted by andesitic and dacitic flows, breccias, and localized pyroclastic and air fall deposits. Drill core reveals spatial and temporal zonation of alteration and vein minerals along a 3-km-long composite cross section through the area. Most host rocks are intensely al- tered, with 100 percent of the igneous minerals replaced by hydrothermal minerals, although the alteration in- tensity becomes more variable and weaker toward the east. Alteration minerals include quartz, adularia, albite, chlorite, pyrite, illite, interstratified illite-smectite, smectite, calcite, hematite, and minor epidote. Many of these minerals have zoned distributions; adularia is widespread at Sovereign, but is restricted to shallow levels at both Scotia and Jasper Creek. Albite occurs in a discrete zone below adularia at Scotia, and minor epidote is restricted to Sovereign and Jubilee. Illite occurs throughout Sovereign and Jubilee and at the western mar- gin of Scotia and Scimitar, where it grades eastward into interstratified illite-smectite and smectite at Teutonic and Jasper Creek. Veins are typically less than 10 cm wide, but have diverse mineralogy with zoned distribu- tions. Quartz veins dominate at Sovereign and Jubilee, whereas calcite veins are more abundant at Scotia, Scimitar, and Jasper Creek. Laumontite occurs at Scotia and locally at Scimitar, whereas veins of clinoptilolite and mordenite ± calcite occur at Jasper Creek and stilbite veins occur at Teutonic. Fluid inclusions in quartz and calcite homogenized between 132º and 310ºC and trapped a dilute solution with an apparent salinity of less than 2.6 wt percent NaCl equiv. Homogenization temperatures are highest at Sovereign (avg. 241ºC), Jubilee (avg 239ºC), and Scimitar (avg 236ºC), lower at Scotia (avg 204ºC) and lowest at Teutonic (avg 168 ºC) and Jasper Creek (avg 162ºC). Estimated positions of the paleowater table above Sov- ereign, Jubilee, Scimitar, Scotia, Jasper Creekg and Teutonic relative to present elevations was at least 690, 750, 575, 450, 225, and 150 m above sea level, respectively; the deposits and prospects, therefore, span a 600-m ver- tical interval. Individual deposits and prospects have undergoen at least 35 to more than 455 m of erosion with the greatest erosion to the west. Alteration intensity, alteration and vein mineral distributions, and fluid inclusion microthermometry are in- terpreted to indicate that Sovereign and Jubilee formed at relatively high temperatures, whereas Teutonic and Jasper Creek formed at relatively cooler temperatures. Several hydrologic reconstructions are possible, in- cluding (1) a single hydrothermal system with an inclined water table and significant lateral outflow to the east, or 2) a single low-relief hydrothermal system with a flat-lying water table that has subsequently been displaced by postmineral faults or tilted approximately 10º to the east. Regardless of the preferred reconstruction, the Sovereign and Jubilee deposits appear to have formed in the main zone of fluid upflow, whereas the Teutonic and Jasper Creek prospects appear to have formed toward the margin. Moreover, the greatest erosion has oc- curred at the Jubilee and Sovereign deposits (~300–400 m), and these may represent the roots of a more ex- tensive vein network that has largely been eroded. † Corresponding author: e-mail, [email protected] ©2011 Society of Economic Geologists, Inc. Economic Geology, v. 106, pp. 945–973
Transcript of Hydrothermal Alteration and Veins at the Epithermal Au-Ag...
0361-0128/11/3975/945-29 945
IntroductionGOLD AND SILVER in adularia-sericite epithermal deposits typ-ically occur in structurally controlled veins that are mineral-ized over a relatively confined vertical extent and are en-veloped by extensive zones of hydrothermal alteration thatmay extend over tens, hundreds, or thousands of meters (e.g.,Mule Canyon, Nevada: John et al., 2003; Comstock: Hudson,2003; Favona, New Zealand: Simpson and Mauk, 2007).Many papers describe alteration in terms of general mineralassociations that have been adopted from terminology used todescribe alteration of porphyry Cu deposits (i.e., potassic,argillic, propylitic), whereas others describe the distributionof individual alteration minerals and vein types (e.g., Conradet al., 1992; Hudson, 2003; Simpson and Mauk, 2007). Al-though the former method is very useful for field mapping,the recognition and delineation of associations is complicated
by overlapping mineralogy and does not take into account theformation of different minerals at different times. In geother-mal fields, the active analogues of some epithermal deposits,the distributions of individual alteration minerals are rou-tinely determined during drilling to assess reservoir tempera-ture, inferred permeability, and fluid compositions that areonly directly measurable following drilling and well testing(e.g., Henley and Ellis, 1983; Reyes, 1990; Simmons andBrowne, 2000; Mas et al., 2006). Here, we describe the geo-logic setting, hydrothermal alteration, and vein types at thevolcanic rock-hosted epithermal Au-Ag deposits andprospects in the Waitekauri area of the southern Haurakigoldfield, North Island, New Zealand (Figs. 1, 2). The areahas been well drilled, and we present alteration and vein min-eralogy and fluid inclusion data along three cross sections thattotal 3 km in length; these sections range from the center tothe margin of the hydrothermally altered area, and provide a600-m reconstructed vertical range of the Waitekauri deposits
Hydrothermal Alteration and Veins at the Epithermal Au-Ag Deposits and Prospects of the Waitekauri Area, Hauraki Goldfield, New Zealand
MARK P. SIMPSON† AND JEFFREY L. MAUK
School of Environment, The University of Auckland, Private Bag 92019, Auckland, New Zealand
AbstractThe Waitekauri area of the Hauraki goldfield, New Zealand, contains several adularia-sericite epithermal
Au-Ag deposits and prospects. From west to east, the area contains the Sovereign, Jubilee, Scimitar, Scotia,Teutonic, and Jasper Creek deposits and prospects, which are hosted by andesitic and dacitic flows, breccias,and localized pyroclastic and air fall deposits. Drill core reveals spatial and temporal zonation of alteration andvein minerals along a 3-km-long composite cross section through the area. Most host rocks are intensely al-tered, with 100 percent of the igneous minerals replaced by hydrothermal minerals, although the alteration in-tensity becomes more variable and weaker toward the east. Alteration minerals include quartz, adularia, albite,chlorite, pyrite, illite, interstratified illite-smectite, smectite, calcite, hematite, and minor epidote. Many ofthese minerals have zoned distributions; adularia is widespread at Sovereign, but is restricted to shallow levelsat both Scotia and Jasper Creek. Albite occurs in a discrete zone below adularia at Scotia, and minor epidoteis restricted to Sovereign and Jubilee. Illite occurs throughout Sovereign and Jubilee and at the western mar-gin of Scotia and Scimitar, where it grades eastward into interstratified illite-smectite and smectite at Teutonicand Jasper Creek. Veins are typically less than 10 cm wide, but have diverse mineralogy with zoned distribu-tions. Quartz veins dominate at Sovereign and Jubilee, whereas calcite veins are more abundant at Scotia,Scimitar, and Jasper Creek. Laumontite occurs at Scotia and locally at Scimitar, whereas veins of clinoptiloliteand mordenite ± calcite occur at Jasper Creek and stilbite veins occur at Teutonic.
Fluid inclusions in quartz and calcite homogenized between 132º and 310ºC and trapped a dilute solutionwith an apparent salinity of less than 2.6 wt percent NaCl equiv. Homogenization temperatures are highest atSovereign (avg. 241ºC), Jubilee (avg 239ºC), and Scimitar (avg 236ºC), lower at Scotia (avg 204ºC) and lowestat Teutonic (avg 168 ºC) and Jasper Creek (avg 162ºC). Estimated positions of the paleowater table above Sov-ereign, Jubilee, Scimitar, Scotia, Jasper Creekg and Teutonic relative to present elevations was at least 690, 750,575, 450, 225, and 150 m above sea level, respectively; the deposits and prospects, therefore, span a 600-m ver-tical interval. Individual deposits and prospects have undergoen at least 35 to more than 455 m of erosion withthe greatest erosion to the west.
Alteration intensity, alteration and vein mineral distributions, and fluid inclusion microthermometry are in-terpreted to indicate that Sovereign and Jubilee formed at relatively high temperatures, whereas Teutonic andJasper Creek formed at relatively cooler temperatures. Several hydrologic reconstructions are possible, in-cluding (1) a single hydrothermal system with an inclined water table and significant lateral outflow to the east,or 2) a single low-relief hydrothermal system with a flat-lying water table that has subsequently been displacedby postmineral faults or tilted approximately 10º to the east. Regardless of the preferred reconstruction, theSovereign and Jubilee deposits appear to have formed in the main zone of fluid upflow, whereas the Teutonicand Jasper Creek prospects appear to have formed toward the margin. Moreover, the greatest erosion has oc-curred at the Jubilee and Sovereign deposits (~300–400 m), and these may represent the roots of a more ex-tensive vein network that has largely been eroded.
† Corresponding author: e-mail, [email protected]
©2011 Society of Economic Geologists, Inc.Economic Geology, v. 106, pp. 945–973
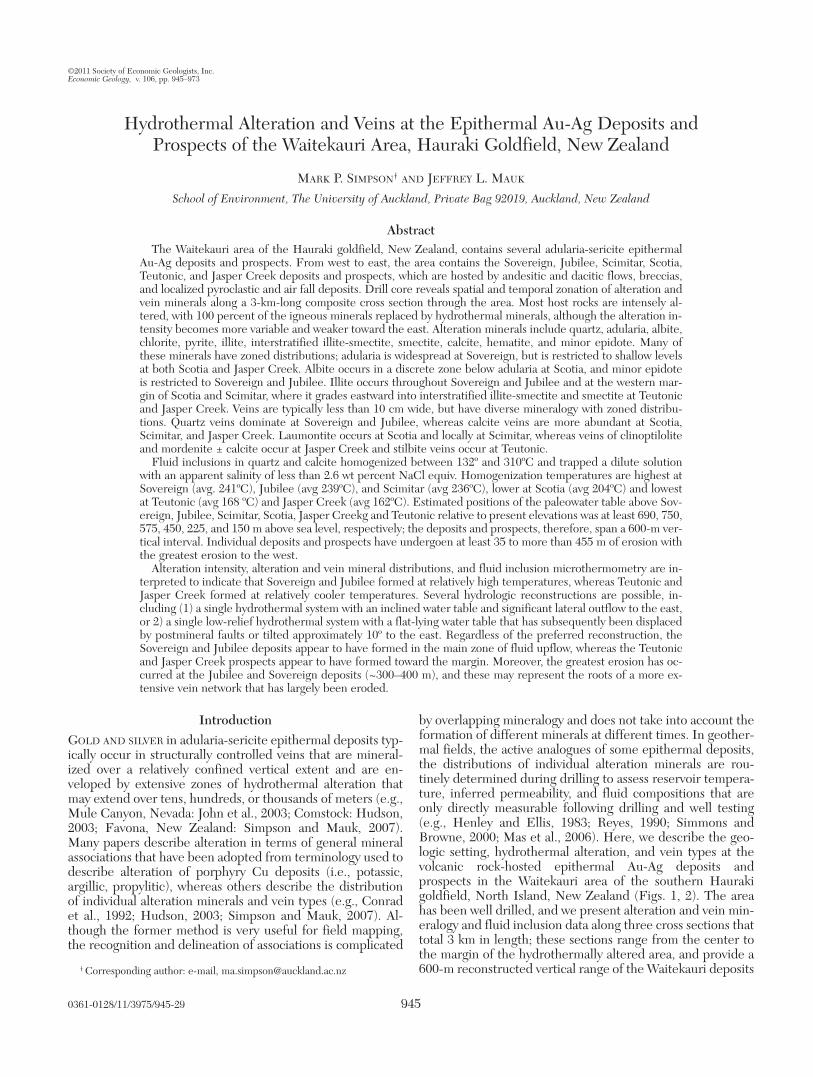
and prospects. Booden et al. (2011) further document thegeochemistry of hydrothermal alteration along these sections.We use alteration, vein, and fluid inclusion data to interpretthe physical and chemical conditions that prevailed duringhydrothermal activity, which allows us to infer the nature ofthe hydrothermal system(s) that formed these deposits andprospects.
Regional GeologyThe Waitekauri deposits and prospects occur in the south-
ern part of the Hauraki goldfield (Fig. 1), a 200-km-long by40-km-wide metallogenic province that contains approxi-mately 50 epithermal Au-Ag deposits and several porphyryCu-Au-Mo occurrences (Christie et al., 2007). Deposits arehosted in a Miocene to Pliocene continental margin volcanic
946 SIMPSON AND MAUK
0361-0128/98/000/000-00 $6.00 946
0 20 km
Hauraki R
ift
37°0´S
N
CoromandelPeninsula
Great BarrierIsland
175°5´E
38 S°
176°E
HaurakiGoldfield
Auckland
0 200 km
Komata
Thames
Hauraki-Success
Golden Cross
Major fault
Coromandel Group
Manaia Hill Group
metagreywacke
diorite intrusives(L. Miocene)
(Jurassic)
Alluvial sediments(Quaternary)
Whitianga Group(Pliocene - Pleistocene)
Coromandel Group(L. Miocene - Pliocene)andesites and dacites
rhyolites and ignimbrites
Epithermal Au-Ag deposit
Porphyry Cu+Au±Mo occurrence
Martha-FavonaWaitekauri deposits
& prospectsKarangahake
FIG. 1. Geologic map of the Coromandel peninsula showing the location of the Waitekauri deposits and prospects plusother significant deposits (Skinner, 1986; Christie et al., 2007).
arc, the subaerial sector of the Coromandel volcanic zone thatformed due to convergence along the Pacific-Australian plateboundary (Nicholson et al., 2004; Mortimer et al., 2007).Basement rocks consist of Late Jurassic graywacke andargillites of the Manaia Hill Group that are unconformablyoverlain by Miocene to Pliocene (ca. 18–4 Ma) andesitic anddacitic flows and volcaniclastic rocks of the CoromandelGroup (Skinner, 1986, 1995; Adams et al., 1994). Thesegroups are intruded by subvolcanic dikes and rare quartzdiorite to granodiorite stocks with locally associated porphyryCu-Au-Mo mineralization (Brathwaite et al., 2001a). LateMiocene to Pliocene (ca. 11–1.9 Ma) rhyolitic flows and py-roclastic rocks of the Whitianga Group form several calderacomplexes with eruptive products that interfinger with andoverlie the Coromandel Group andesite (Skinner, 1986;
Adams et al., 1994). Farther south, the volcanic rocks of theCoromandel volcanic zone merge with and are overlain byQuaternary (2.0 Ma to present) volcanic rocks of the Taupovolcanic zone (Houghton et al., 1995; Briggs et al., 2005).
The Hauraki goldfield is cut by north-northwest– andnorth-northeast– to east-northeast–striking faults (Skinner,1986). North-northwest–striking faults displace rocks down-ward to the east and west, whereas most north-northeast– toeast-northeast–striking faults displace rocks downward to thesouth; this results in increased exposure of the graywackebasement in the north, and thicker exposures of volcanicrocks to the south (Fig. 1).
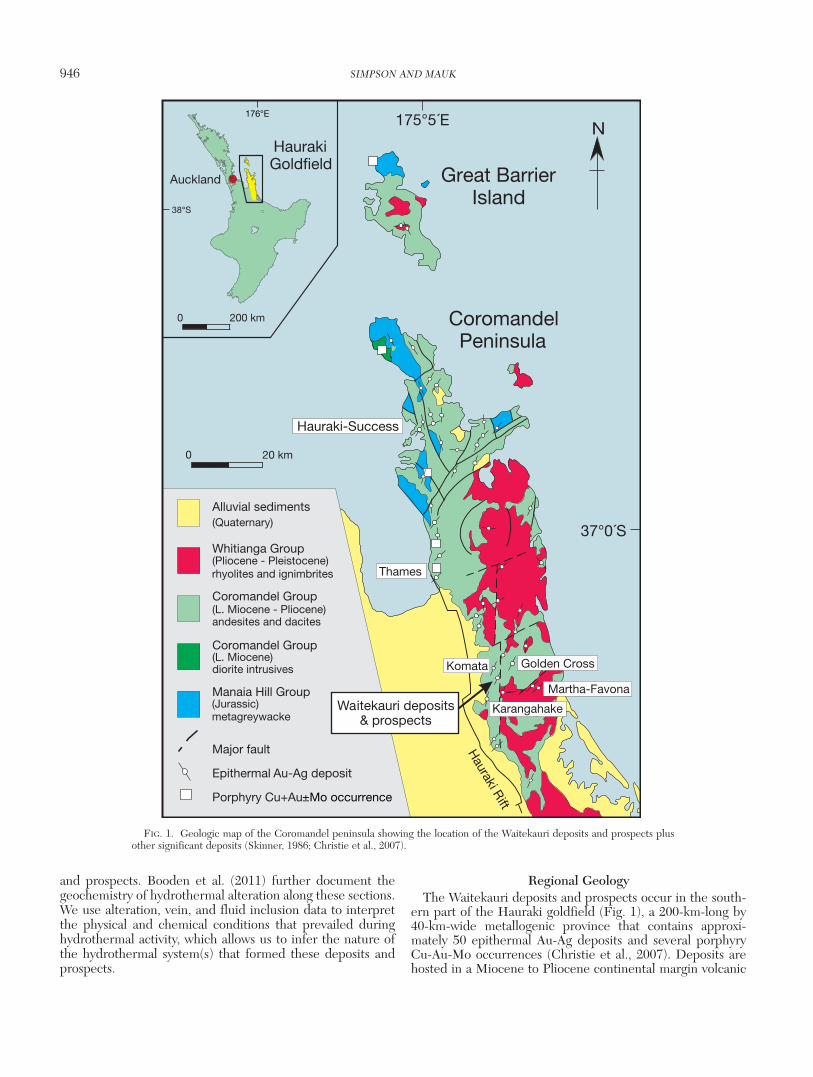
Epithermal deposits are hosted in andesite, dacite, rhyolite,and graywacke (Figs. 1, 2), with more than 96 percent of allAu extracted from quartz veins hosted in andesite and dacite
HYDROTHERMAL ALTERATION AND VEINS OF Au-Ag DEPOSITS IN THE WAITEKAURI AREA, NEW ZEALAND 947
0361-0128/98/000/000-00 $6.00 947
x
xx
Omahine Subgroup
Quartz veinWhitianga Group
Waiwawa SubgroupCoromandel Group
Coroglen Subgroup
Minden Rhyolite Subgroup
Fault
Alluvium
Ohinemuri Subgroup
Kaimai Subgroup
Whitianga Group
Coromandel Group
0 4 Km
N
Scotia
Karangahake
Jubilee
Sovereign
Fig. 3
Jasper Ck
Teutonic
Owharoa
Golden Cross
Maratoto
Martha
Favona
Komata
Dunbar
Grace Darling
Wharekirauponga
FIG. 2. Regional geologic map of the southern Coromandel peninsula, showing the location of the Waitekauri depositsand prospects, which includes the Sovereign, Jubilee, and Scotia deposits, and the Scimitar, Teutonic, and Jasper Creekprospects. Redrawn from Brathwaite and Christie (1996) and unpublished Newmont Waihi operations maps. Other ep-ithermal Au-Ag deposits in the area include Golden Cross (~0.75 Moz Au), Karangahake (~0.95 Moz Au), Martha (>6.7 MozAu), and Favona (>0.6 Moz Au) (Christie et al., 2007).
(Christie et al., 2007). Veins are steeply dipping, vary from300 to 1,300 m in length, are 1 to 5 m wide, and most weremined over vertical intervals of 170 to 330 m, although manycontinued at depth with low Au and Ag content (e.g., GoldenCross; Simpson et al., 2001). Total production from 1862through 2009 was 334,600 kg Au and 1.56 Mkg Ag (Christieet al., 2007, updated with 2006–2009 production figures fromNewmont Waihi Gold).
Local GeologyGold was discovered at Jubilee Hill at the Old Waitekauri
claim by Daniel Leahy in 1875 (Bell and Fraser, 1912); thiswas followed by additional discoveries at nearby Owharoa,Grace Darling, Durbar, Komata, Golden Cross, Maratoto,and neighboring Karangahake and Waihi (Martha) deposits(Fig. 2). The Waitekauri area includes the Sovereign, Jubilee,and Scotia deposits, which produced 37,090 oz Au-Ag bullionfrom intermittent mining between 1875 and 1929 (Downey,1935), and the recently explored Jasper Creek, Scimitar, andTeutonic prospects (Figs. 2, 3). Renewed exploration began in1978 following a regional aeromagnetic survey by AmocoMinerals NZ Ltd that identified targets in the area. Between1980 and 1996, exploration by Cyprus Minerals (formerlyAmoco), and Coeur Gold NZ Ltd included geologic map-ping, soil, outcrop, and adit sampling, resistivity surveys and87 drill holes (10,605 m). Best drill intercepts include 11 m @3.34 g Au/t at Sovereign and 10.2 m @ 6.04 g Au/t at Scotia.Continuous chip sampling in an adit at Scotia also returned 5m @ 11.87 g Au/t (McOnie, 2001). The area was more re-cently explored from 2004 to 2008, by Welcome Gold NZLtd, and tested by 19 drill holes (6,830 m).
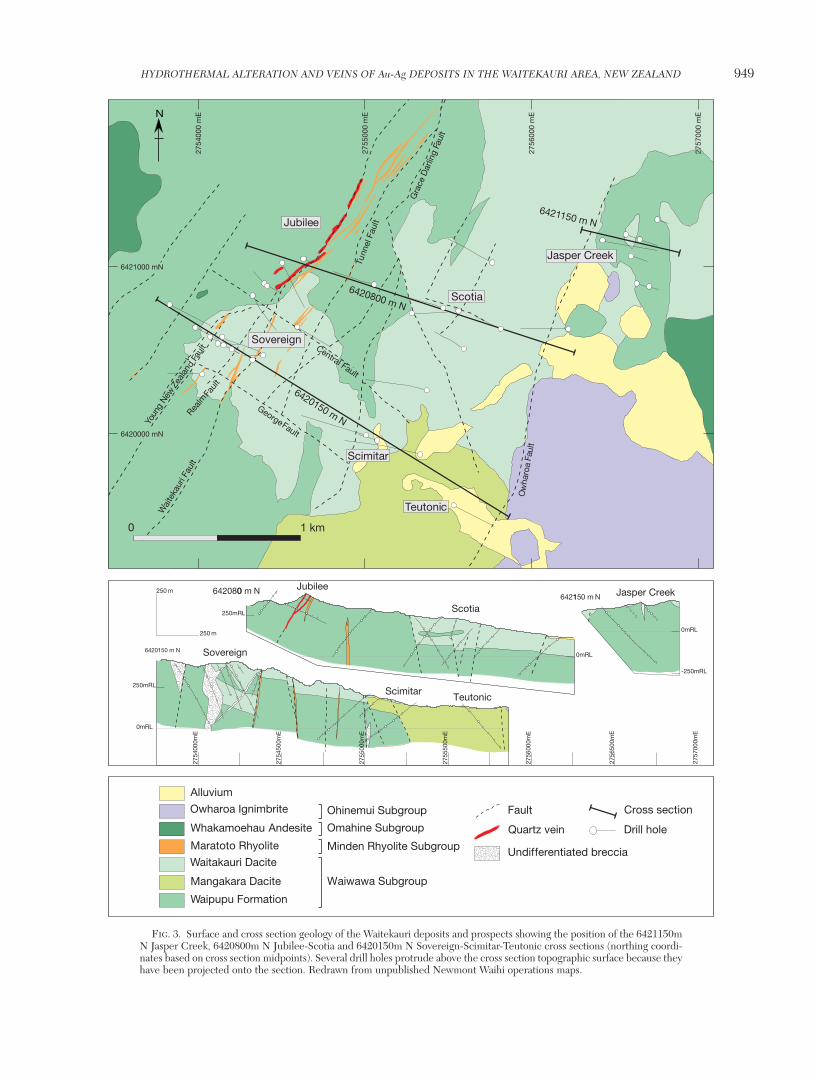
The Waitekauri deposits and prospects are hosted by an-desitic and dacitic flows, breccias, and pyroclastics of theWaipupu Formation, Mangakara Dacite, and WaitekauriDacite, which are intruded by dikes of Maratoto Rhyolite(Fig. 3). These are unconformably overlain by postmineralWhakamoehau Andesite and Owharoa Ignimbrite (Brath-waite and Christie, 1996).
The Waipupu Formation (ca. 7.9–6.7 Ma) consists of two-pyroxene andesitic lava flows, lesser volcanic breccias and lo-calized intercalations of lithic-crystal tuffs, and minor epiclas-tic sedimentary rocks (Brathwaite and Christie, 1996). Thisunit is the most important host rock at Jubilee and JasperCreek; it occurs at depth below Scotia and Scimitar, and it iscommon at Sovereign (Fig. 3). The Mangakara Dacite (ca.6.90 Ma) overlies or is in fault contact with the Waipupu For-mation and consists of pyroxene-hornblende dacite and rhyo-dacite flows that occur at and near the Teutonic and Scimitarprospects (Fig. 3; Haworth and Briggs, 2006). The WaitekauriDacite consists of xenolithic two-pyroxene dacitic lava flowswith local tuff breccias and lithic-crystal tuffs; it overlies theMangakara Dacite (Brathwaite and Christie, 1996; Haworthand Briggs, 2006). At Scotia, the Waitekauri Dacite mostlyconsists of lava flows, whereas at Sovereign it is dominated bylithic tuffs, tuff breccias, breccias, and minor lava flows (Fig.3). Some breccias may be either intrusive or hydrothermal,but intense alteration precludes genetic determination (Mc-Connochie, pers. commun., 2006). Northeast-trending dikesof Maratoto Rhyolite that are up to 720 m in length and 1 to15 m in width intrude Waipupu Formation andesite and
Waitekauri Dacite at Jubilee and Sovereign (Brathwaite andChristie, 1996; Haworth and Briggs, 2006). There are alsorare andesite dikes and drill hole WV016 contains a 2-m-wideintensely altered dike of coarse-grained quartz diorite. Post-mineral andesite to dacite lava flows of Whakamoehau An-desite (ca. 6.70–6.61 Ma) unconformably overlie all the aboveunits, and the area east of Teutonic is blanketed by OwharoaIgnimbrite (ca. 3.69 ± 0.06 Ma; Hoskin et al., 1998).
Veins occur in, or are separated by, a series of north-north-east–striking normal faults that include the Waitekauri, Tun-nel, Grace Darling, and Owharoa faults (Fig. 3); these faultsdip east-southeast, except for the Waitekauri fault, which dipswest-northwest (Haworth and Briggs, 2006). The most im-portant structures controlling mineralization are the Wait-ekauri and Tunnel faults (Fig. 3). The Jubilee vein and veinsat Sovereign occur along the north-northeast–striking andsteeply (60°–80°) west-northwest–dipping Waitekauri fault,which at Sovereign further splays into the Realm and YoungNew Zealand faults (Grodzicki et al., 2007). West- to north-west-striking faults are less common and include the Centraland George faults with the former dipping 65° to the south-southwest. All faults display normal displacements, althoughthe amount of offset is not known owing to poor exposuresand a lack of marker horizons (Grodzicki et al., 2007).
The main Au-Ag mineralized quartz vein is the north-northeast–trending Jubilee vein that historically produced28,965 oz Au-Ag bullion from 18,923 t of ore and accounts for78 percent of production at Waitekauri (Downey, 1935). Thisvein consists of a single vein at depth that splays into severalnarrow veins near surface. It has a strike length of 990 m, avertical extent that exceeds 215 m, and it averages 2.4 m inwidth, although it is strongly lenticular and commonly nar-rows to several centimeters (Bell and Fraser, 1912; Downey,1935). Quartz is typically massive to coarsely crystalline andlocally comb, with Au and Ag associated with fine-grainedvolumetrically minor crustiform banded quartz. Assay resultsindicate Ag/Au ratios of 1.0 to 1.8 and up to 36.8 g/t Au and37 g/t Ag, although much of the vein is subeconomic (Hartleyand McConnochie, 1991). Base metal sulfide minerals, in-cluding sphalerite, galena and chalcopyrite, occur at depth andare associated with up to 318 g/t Ag (Bell and Fraser, 1912;Hartley and McConnochie, 1991). By contrast, quartz veins atSovereign and Scotia are typically narrow and rarely exceed 1m in width. At Sovereign, Au and Ag also occur in silicifiedand fractured breccia zones (Bell and Fraser, 1912; White,1991). No significant veins or mineralization have been foundat Jasper Creek, however, a polymict breccia contains clasts ofandesite and rare sinter with relict plant fragments.
Adularia from a quartz vein at the Sovereign deposityielded 40Ar/39Ar plateau, isochron, and total gas dates thatoverlap within error, and a preferred age of 6.70 ± 0.16 Ma(Mauk et al., 2011).
Sampling and Analytical TechniquesHydrothermal altered rocks and veins were examined in
drill holes along three cross sections that collectively total 3km in length and transect the (1) Sovereign, Scimitar, Teu-tonic (6420150m N), (2) Jubilee and Scotia (6420800m N),and (3) Jasper Creek (6421150m N) deposits and prospects(Figs. 3, 4). Cross section numbers refer to the New Zealand
948 SIMPSON AND MAUK
0361-0128/98/000/000-00 $6.00 948
HYDROTHERMAL ALTERATION AND VEINS OF Au-Ag DEPOSITS IN THE WAITEKAURI AREA, NEW ZEALAND 949
0361-0128/98/000/000-00 $6.00 949
1 km0
2754
000
mE
2755
000
mE
2756
000
mE
2757
000
mE
Sovereign
2754
500m
E
2754
000m
E
2755
000m
E
2755
500m
E
2756
000m
E
2756
500m
E
2757
000m
E
Sovereign6420150 m N
6420800 m N6421150 m N
ScimitarTeutonic
0mRL
0mRL
250mRL
-250mRL
Jasper CreekJubilee
Scotia
0mRL
250mRL
250 m
250 m
N
6421000 mN
6420000 mN
Jubilee
Scotia
Scimitar
Teutonic
Jasper Creek
Wai
teka
uri F
ault
Realm
Faul
t
Ow
haro
a Fa
ult
Gra
ceD
arlin
gFa
ult
Tunn
el F
ault
GeorgeFault
Central Fault
Youn
gNew
Zeal
and
Faul
t
6420150 m N
6420800 m N
6421150 m N
Mangakara Dacite
Quartz vein
Minden Rhyolite Subgroup
Waipupu Formation
Undifferentiated breccia
Waiwawa Subgroup
Maratoto Rhyolite
Waitakauri Dacite
Fault
Whakamoehau Andesite
Ohinemui Subgroup
Omahine Subgroup
Alluvium
Owharoa Ignimbrite
Drill hole
Cross section
FIG. 3. Surface and cross section geology of the Waitekauri deposits and prospects showing the position of the 6421150mN Jasper Creek, 6420800m N Jubilee-Scotia and 6420150m N Sovereign-Scimitar-Teutonic cross sections (northing coordi-nates based on cross section midpoints). Several drill holes protrude above the cross section topographic surface because theyhave been projected onto the section. Redrawn from unpublished Newmont Waihi operations maps.
950 SIMPSON AND MAUK
0361-0128/98/000/000-00 $6.00 950
?
?
?
?
?
?
?
?
?
?
??
?
?
?
?
?
??
?
Hyd
roth
erm
alA
dul
aria
Hyd
roth
erm
alA
lbite
Ad
ular
ia +
Alb
ite
Pla
gioc
lase
(ign
eous
)2754500mE
2754000mE
2755000mE
2755500mE
2756000mE
2756500mE
2757000mE
Sov
erei
gn
6420
150
m N
6420
800
m N
6421
150
m N
Sci
mita
rTe
uton
ic
0mR
L
0mR
L
250m
RL
-250
mR
L
Jasp
er C
reek
Jub
ilee
Sco
tia
0mR
L
250m
RL
250
m
250
m
?
?
?
?
?
?
?
? No
clay
det
ecte
d
?
?
60%
10%
10% 10
%
10%
10%
60%
20%
10%
70%
80%
80%
90%
90%
90%
90%
70%
70%
70%
80%
60%
90%
75%
90%
90%
90%
80%
80%
80%
80%
70%
85%
30%
50%
80%
90%
90%
90%
90%
60%
90%
90%
80%
90%
90%
70%
90%
90% 90
%
Illite
Inte
rstr
atifi
ed il
lite-
smec
tite
Sm
ectit
e
Sm
ectit
e (o
verp
rintin
g)
2754500mE
2754000mE
2755000mE
2755500mE
2756000mE
2756500mE
2757000mE
Sov
erei
gn
6420
150
m N
6420
800
m N
6421
150
m N
Sci
mita
rTe
uton
ic
0mR
L
0mR
L
250m
RL
-250
mR
L
Jasp
er C
reek
Jub
ilee
Sco
tia
0mR
L
250m
RL
250
m
250
m
A B
FIG
. 4.
Cro
ss s
ectio
ns s
how
ing
the
dist
ribu
tion
of A
) hy
drot
herm
al a
dula
ria,
hyd
roth
erm
al a
lbite
, plu
s re
lict
igne
ous
plag
iocl
ase,
and
B)
illite
, int
erst
ratif
ied
illite
-sm
ectit
e, a
nd s
mec
tite.
Per
cent
ages
sho
wn
besi
de s
ampl
es c
onta
inin
g in
ters
trat
ified
illit
e-sm
ectit
e in
dica
te th
e am
ount
of i
llite
with
in th
ese
clay
min
eral
s. S
ever
al s
am-
ples
con
tain
eith
er il
lite
or in
ters
trat
ified
illit
e-sm
ectit
e th
at h
ave
been
ove
rpri
nted
by
late
r sm
ectit
e; F
igur
e 3
show
s cr
oss
sect
ion
loca
tions
.
map grid north coordinate at the midpoint of each cross sec-tion. Samples were collected from 9,000 m of drill core at 30-to 50-m intervals and selected to represent the intensity andtype of hydrothermal alteration, veins and lithology. Hy-drothermal alteration minerals have been determined for 225samples using standard whole-rock and clay-separate X-raydiffraction (XRD) techniques. An additional 33 vein sampleswere analyzed by XRD to determine zeolite mineralogy. Inthe clay-separate XRD study, the ≤2 µm clay fraction was ex-tracted and analyzed under air-dried and glycolated condi-tions. The diffractogram data of Reynolds (1980) and Mooreand Reynolds (1997) were used to determine clay mineralogyand degree of interstratification. From this suite of 258 sam-ples, 60 rock and vein samples were examined by thin andpolished section petrography.
Fluid inclusion homogenization (Th) and final ice melting(Tm) temperatures were measured for inclusions in quartz (n= 23) and calcite (n = 22) veins. Measurements were made ondoubly polished sections (100–200 µm thick) using a FluidInc.-adapted USGS heating and freezing stage. The thermo-couple was calibrated at 0.0° and –56.6°C using Syn Flincfluid inclusion standards, with the data reproducible to ±2.0°C for homogenization temperatures and ± 0.2°C for finalice melting temperatures.
The stable isotopic compositions of oxygen in vein quartzand of oxygen and carbon in calcite was determined at GNSScience, New Zealand, using standard fluoridation and massspectrometer techniques (Faure and Brathwaite, 2006). Iso-topic ratios are reported in per mil relative to the interna-tional standard Vienna Standard Mean Ocean Water(VSMOW) for oxygen isotope ratios and Vienna PeeDeeBelemnite (VPDB) for carbon isotope ratios, using conven-tional delta notation. Oxygen and carbon isotope measure-ments have reproducibilities of better than ±0.1 per mil.
Hydrothermal AlterationThe regional extent of hydrothermal alteration has been
broadly determined from field mapping based on limited out-crops (Brathwaite and Christie, 1996) and from an aeromag-netic survey. The aeromagnetic survey shows that depositsand prospects of the Waitkauri area occur within an irregularelongated magnetic quiet zone that is 22 km2 in size and in-cludes the Maratoto, Golden Cross, and Komata deposits(Fig. 2; Morrell et al., 2011). This magnetic quiet zone delin-eates the area where igneous magnetite has been destroyedby hydrothermal alteration, and it is broadly coincident witha K/Th anomaly of similar size that reflects widespread potas-sium metasomatism (Booden et al., 2011; Morrell et al.,2011). Even though they occur in the same alteration enve-lope, the distinct ages of the Maratoto (6.41 ± 0.04 Ma),Golden Cross (6.98 ± 0.11 Ma), Komata (6.06 ± 0.06 Ma),and Sovereign (6.70 ± 0.16 Ma) deposits indicate that thesedeposits formed at different times, possibly from different hy-drothermal systems whose alteration halos overlapped (Mauket al., 2011).
At the Waitekauri deposits and prospects, hydrothermal al-teration of the host volcanic flows, breccias, and pyroclasticrocks as seen from drill core is typically intense, with com-plete replacement of igneous minerals by hydrothermal min-erals (>98–100% replacement). Primary igneous textures in
volcanic flows are well preserved; however, textures in brec-cias at Sovereign are poorly preserved and differentiation be-tween volcanic and possibly intrusive-related or hydrothermalbreccias is not possible. The degree of alteration toward theeast at Teutonic and Jasper Creek is more variable, and in-cludes areas of strongly, moderately, and weakly altered rocks.In moderately altered rocks, where 20 to 50 percent of the ig-neous minerals have been replaced, igneous plagioclase andmagnetite are partially replaced, whereas augite, hyperstheneand groundmass interstitial glass are completely replaced byhydrothermal minerals. In weakly altered rocks, less than 20percent of the igneous minerals are replaced; augite and hy-persthene are partially preserved, whereas igneous plagio-clase and magnetite are essentially unaltered. Shallow andsurface exposures of volcanic rocks at the deposits andprospects are strongly weathered to iron oxyhydroxide, localjarosite, halloysite, kaolinite, and manganese oxides, with oxi-dation variably penetrating 20 to 65 m below the ground sur-face, and locally extending up to 260 m along fracture zones.A variety of alteration minerals occur in the Waitekauri area(Table 1). The occurrence, spatial distribution, and temporalrelationships of selected minerals are described below.
Quartz
Quartz is the most abundant replacement mineral, occur-ring in every sample and typically forming 40 to 60 percent ofthe rock by volume with slightly lower amounts in moderatelyand weakly altered rocks. Quartz predominantly replacesglass in the groundmass of volcanic rocks, occurring as fine-grained to microscopic interlocking anhedral grains inter-grown with chlorite, illite, or interstratified illite-smectite orsmectite and disseminated pyrite. In strongly silicified rocks,quartz also replaces augite, hypersthenes, and, rarely, plagio-clase phenocrysts. Quartz is also the most abundant mineralin veins as discussed below.
Hydrothermal adularia and albite
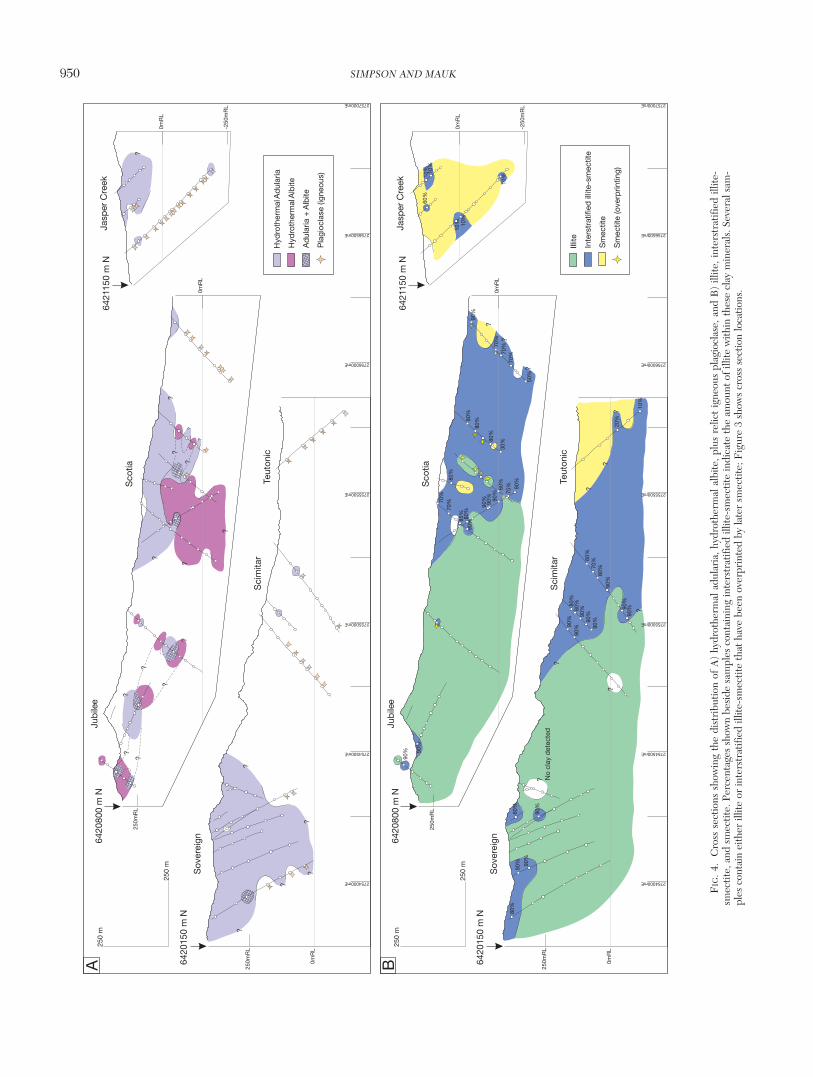
Hydrothermal adularia occurs in 80 percent of samplesstudied from Sovereign, in more than 45 percent of samplesfrom Jubilee, Scotia, and Jasper Creek, but is essentially ab-sent at Scimitar and Teutonic (Fig. 4A). Adularia at Sovereignoccurs at all depths (>350 m vertically), although at Scotiaand Jasper Creek, it is restricted to a shallow carapace that is~180 and ~120 m thick, respectively. By contrast, less com-mon hydrothermal albite prominently occurs in a discretezone below adularia at Scotia, and patchily coexists with adu-laria at Scotia and at Jubilee (Fig. 4A).
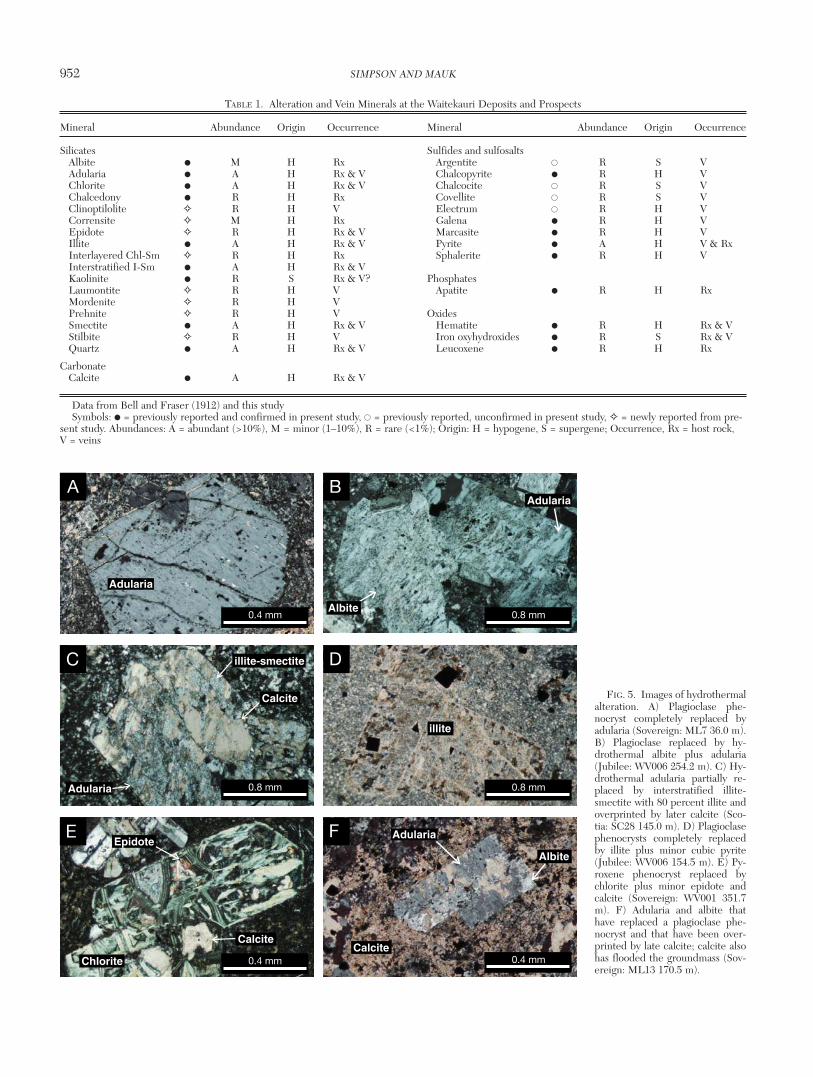
Hydrothermal adularia and albite are among the earliestformed alteration minerals that preferentially replace plagio-clase phenocrysts, laths, and the groundmass (Fig. 5A, B).Adularia and lesser albite make up 1 to 15 percent of the hostrocks by volume, but are variably replaced by either illite orinterstratified illite-smectite and locally overprinted by latecalcite and/or smectite (Fig. 5C). The degree of adularia re-placement by illite or interstratified illite-smectite is highlyvariable and ranges from less than 5 to greater than 95 per-cent, but typically exceeds 40 percent. It is possible that adu-laria may have been more extensive at Jubilee and Scimitar.However, if so, it has been completely replaced by illite or in-terstratified illite-smectite and calcite (Fig. 5D).
HYDROTHERMAL ALTERATION AND VEINS OF Au-Ag DEPOSITS IN THE WAITEKAURI AREA, NEW ZEALAND 951
0361-0128/98/000/000-00 $6.00 951
952 SIMPSON AND MAUK
0361-0128/98/000/000-00 $6.00 952
TABLE 1. Alteration and Vein Minerals at the Waitekauri Deposits and Prospects
Mineral Abundance Origin Occurrence Mineral Abundance Origin Occurrence
Silicates Sulfides and sulfosaltsAlbite l M H Rx Argentite ll R S VAdularia l A H Rx & V Chalcopyrite l R H V Chlorite l A H Rx & V Chalcocite ll R S VChalcedony l R H Rx Covellite ll R S VClinoptilolite G R H V Electrum ll R H VCorrensite G M H Rx Galena l R H VEpidote G R H Rx & V Marcasite l R H V Illite l A H Rx & V Pyrite l A H V & RxInterlayered Chl-Sm G R H Rx Sphalerite l R H VInterstratified I-Sm l A H Rx & VKaolinite l R S Rx & V? PhosphatesLaumontite G R H V Apatite l R H RxMordenite G R H VPrehnite G R H V OxidesSmectite l A H Rx & V Hematite l R H Rx & VStilbite G R H V Iron oxyhydroxides l R S Rx & VQuartz l A H Rx & V Leucoxene l R H Rx
CarbonateCalcite l A H Rx & V
Data from Bell and Fraser (1912) and this studySymbols: l = previously reported and confirmed in present study, ll = previously reported, unconfirmed in present study, G = newly reported from pre-
sent study. Abundances: A = abundant (>10%), M = minor (1–10%), R = rare (<1%); Origin: H = hypogene, S = supergene; Occurrence, Rx = host rock, V = veins
D
A B
C D
E F
0.8 mm0.4 mm
Adularia
Adularia
Chlorite
Calcite
Calcite
Calcite
Epidote
Adularia
Adularia
Albite
Albite
illite
illite-smectite
0.4 mm
0.8 mm0.8 mm
0.4 mm
FIG. 5. Images of hydrothermalalteration. A) Plagioclase phe-nocryst completely replaced byadularia (Sovereign: ML7 36.0 m).B) Plagioclase replaced by hy-drothermal albite plus adularia(Jubilee: WV006 254.2 m). C) Hy-drothermal adularia partially re-placed by interstratified illite-smectite with 80 percent illite andoverprinted by later calcite (Sco-tia: SC28 145.0 m). D) Plagioclasephenocrysts completely replacedby illite plus minor cubic pyrite(Jubilee: WV006 154.5 m). E) Py-roxene phenocryst replaced bychlorite plus minor epidote andcalcite (Sovereign: WV001 351.7m). F) Adularia and albite thathave replaced a plagioclase phe-nocryst and that have been over-printed by late calcite; calcite alsohas flooded the groundmass (Sov-ereign: ML13 170.5 m).

Illite, interstratified illite-smectite, and smectite
Illite, interstratified illite-smectite, and smectite are com-mon clay minerals, comprising up to 30 percent of the hostrock by volume, and they have zoned distributions from westto east. Illite predominates at Sovereign and Jubilee and onthe western margin of Scimitar and Scotia, where it gradeseastward into interstratified illite-smectite (Fig. 4B) that con-tains 10 to 40 percent smectite (Fig. 6). At Teutonic, inter-stratified illite-smectite with 80 to 90 percent smectite gradesinto smectite, whereas smectite dominates at Jasper Creek,together with patchy interstratified illite-smectite with 90percent smectite. In the clay-separate XRD profiles for sam-ples from Jasper Creek and Teutonic, many samples haveslightly shifted peak positions suggesting trace amounts of il-lite (~5%), although definitive identification is beyond theresolution of the technique. All three clay minerals have vari-ably replaced plagioclase, earlier formed hydrothermal adu-laria and albite (Fig. 5C, D), and they have also flooded thegroundmass. Late-stage smectite has locally overgrown inter-stratified illite-smectite and illite at Scotia.
Chlorite, interlayered chlorite-smectite and corrensite
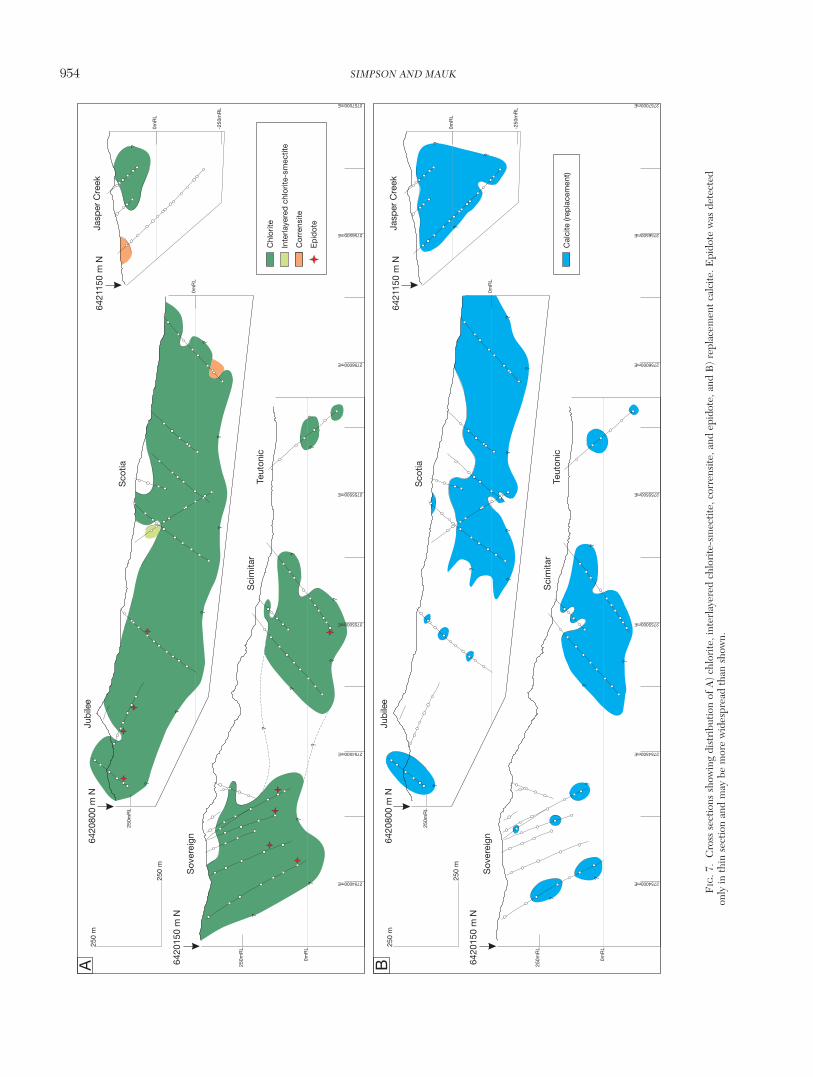
Chlorite is widespread and occurs in more than 70 percentof samples from Sovereign, Jubilee, Scotia, and Scimitar (Fig.7A); it is less common at Jasper Creek and Teutonic, where itoccurs in 39 and 50 percent of samples, respectively. Chloriteis absent in the deepest drill hole from Jasper Creek and alsoin several near-surface samples; in the latter locations, due toweathering. In contrast, both corrensite—an ordered, inter-layered chlorite-smectite with subequal chlorite and smectite(50:50)—and interlayered chlorite-smectite are rare, and occurin less than 1 and 3 percent of samples, respectively (Fig. 7A).The amount of smectite within interlayered chlorite-smectiteis typically indeterminable owing to low peak intensity;
however, in more defined profiles this interlayered clay con-tains 10 to 20 percent smectite.
Petrographic examination reveals that chlorite replaces upto 25 percent of the host rock by volume. It is a significant re-placement mineral of the groundmass as well as augite andhypersthene phenocrysts (Fig. 5E). Less commonly, chloritereplaces plagioclase phenocrysts where it occurs along andadjacent to microfractures. Chlorite also fills vesicles, cavities,and rare veins, where it commonly overgrows quartz.
Epidote
Epidote is a volumetrically minor alteration mineral thattypically makes up less than 1 percent of the host rock by vol-ume and was only observed during petrographic examinationof the samples. Based on a limited number of thin sections (n= 60), epidote occurs in 25 percent of the samples from Sov-ereign and Jubilee; it was also seen in a single sample fromScimitar (Fig. 7A). The full extent of epidote at Sovereign andJubilee is not known; it may be more extensive than shownhere (Fig. 7A). Epidote replaces phenocrystic plagioclase to-gether with adularia and rare albite, and it is overprinted bylate calcite. Together with chlorite, it also replaces mafic phe-nocrysts (Fig. 5E) and is a rare replacement mineral in thegroundmass. Epidote further occurs within a 2-mm-wide veinas clusters of prismatic crystals intergrown with chlorite orprehnite and is overprinted by calcite.
Pyrite, iron oxyhydroxides, and hematite
Pyrite is by far the most common sulfide mineral; it occurs inalmost every rock, except for weakly altered rocks and stronglyweathered near-surface rocks where pyrite has been oxidizedto iron oxyhydroxides. Pyrite appears as minute anhedral to eu-hedral cubic grains disseminated throughout the groundmassand as a trace replacement mineral of augite and hypersthenephenocrysts together with chlorite with or without quartz.
HYDROTHERMAL ALTERATION AND VEINS OF Au-Ag DEPOSITS IN THE WAITEKAURI AREA, NEW ZEALAND 953
0361-0128/98/000/000-00 $6.00 953
R = 0
R = 3
R = 1
R = 2
Glycolated XRD trace6.0
5.0
8.0
7.0
9.0
0.0 1.0 2.0 3.0
Smectite
illite
80%60%
22Degrees two theta
122(n = 143)
20%
4.0 6.05.0
100%
60%
40%2
22
2
Sovereign (n=37)Jubilee (n=26)Scimitar (n=21)Scotia (n =38)Teutonic (n=4)Jasper Creek (n=32)
FIG. 6. A plot of ∆2Θ1 versus ∆ 2Θ2 showing (degree of) Reichweite (R) ordering and the proportion of smectite in in-terstratified illite-smectite (Watanabe, 1981; Inoue and Utada, 1983).
954 SIMPSON AND MAUK
0361-0128/98/000/000-00 $6.00 954
?
?
?
?
?
?
?
?
?
?
??
?
?
?
??
?
Chl
orite
Inte
rlaye
red
chl
orite
-sm
ectit
e
Cor
rens
ite
Ep
idot
e2754500mE
2754000mE
2755000mE
2755500mE
2756000mE
2756500mE
2757000mE
Sov
erei
gn
6420
150
m N
6420
800
m N
6421
150
m N
Sci
mita
rTe
uton
ic
0mR
L
0mR
L
250m
RL
-250
mR
L
Jasp
er C
reek
Jub
ilee
Sco
tia
0mR
L
250m
RL
250
m
250
mA B
?
??
?
?
?
?
?
?
?
?
?
? ?
?
?
Cal
cite
(rep
lace
men
t)
2754500mE
2754000mE
2755000mE
2755500mE
2756000mE
2756500mE
2757000mE
Sov
erei
gn
6420
150
m N
6420
800
m N
6421
150
m N
Sci
mita
rTe
uton
ic
0mR
L
0mR
L
250m
RL
-250
mR
L
Jasp
er C
reek
Jub
ilee
Sco
tia
0mR
L
250m
RL
250
m
250
m
FIG
. 7.
Cro
ss s
ectio
ns s
how
ing
dist
ribu
tion
of A
) ch
lori
te, i
nter
laye
red
chlo
rite
-sm
ectit
e, c
orre
nsite
, and
epi
dote
, and
B)
repl
acem
ent c
alci
te. E
pido
te w
as d
etec
ted
only
in th
in s
ectio
n an
d m
ay b
e m
ore
wid
espr
ead
than
sho
wn.
The most common occurrence of iron oxides is as orange toyellow iron oxyhydroxides that occur near surface and also atdepth along fracture zones; these are interpreted to formfrom weathering. In contrast, hematite that occurs indepen-dently of iron oxyhydroxides is patchily distributed in drillcore from the eastern margin of Scotia, Teutonic, and JasperCreek. The strongest development of hematite is seen over a60-m interval in the deepest drill hole at Jasper Creek—be-tween 233 to 293 m downhole. Hematite occurs as submicro-scopic disseminated grains throughout the groundmass thatcolors the host rock red to pale pink or purple. Where thishematite occurs as a pervasive and widespread mineral, itmay have formed during cooling and degassing of the lava atsubsolidus temperatures. However, hematite also occurs inquartz-hematite-pyrite and quartz-hematite veins that are cutby later calcite veins and this hematite is inferred to be hy-drothermal in origin, as described below.
Calcite
Replacement calcite is a widespread alteration mineral thatis most abundant at Scotia, Scimitar, and Jasper Creek, whereit occurs in more than 60 percent of samples. It is less commonand sporadically distributed at Jubilee, Sovereign, and Teu-tonic (Fig. 7B). Calcite makes up as much as 15 vol percent ofthe host rock; it replaces plagioclase, augite, and hypersthenephenocrysts, and locally floods the groundmass (Fig. 5F). Cal-cite also overprints hydrothermal adularia, albite, illite, and in-terstratified illite-smectite (Fig. 5C, F). At Scotia, replacementcalcite is overprinted by rare smectite. Calcite also formsveins with a distribution identical to replacement calcite.
Kaolinite
Trace amounts of kaolinite were identified in XRD andSWIR (shortwave near-infrared mineral spectroscopy using the
TerraSpec) profiles of near-surface iron oxyhydroxide stainedsamples from both Sovereign and Jubilee. This near-surfaceoccurrence of kaolinite and the association with iron oxyhy-droxides suggest that this mineral is most likely supergene.
Vein Types and MineralogyThe Jubilee vein is the largest vein in the area, and was
mined to a depth of 215 m. It is ~1,000 m in strike length andstrongly lenticular, ranging from several centimeters up to 9.8m in width, with an average width of 2.4 m. Most other veinsare narrow and seldom exceed 15 cm in width but show con-siderable diversity in vein mineralogy (Figs. 8–10). The morecommon veins are described below and limited to those in-tercepted in drill holes that selectively targeted areas adjacentto historical workings. Details on historically mined veins arebased on published descriptions (Bell and Frazer, 1912) be-cause most old mine workings are inaccessible.
Pyrite
Thin pyrite veins with subordinate quartz were the first toform and mainly occur at Sovereign and Jubilee. They are ingeneral less than 2 mm wide and exhibit both planar and ir-regular geometries. Pyrite and quartz also form the matrix ce-ment of crackle and possible hydrothermal breccias at Sover-eign. Both pyrite-quartz veins and breccia cement are cut bymassive to coarsely crystalline and comb quartz veins.
Quartz
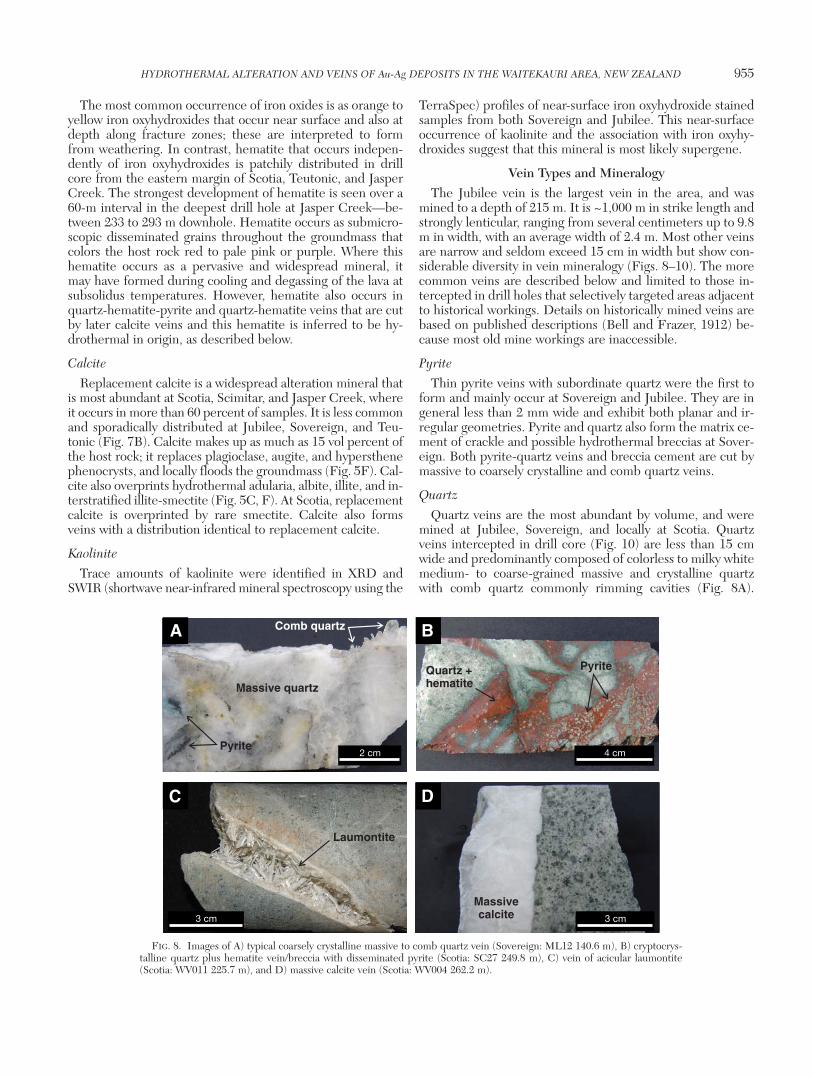
Quartz veins are the most abundant by volume, and weremined at Jubilee, Sovereign, and locally at Scotia. Quartzveins intercepted in drill core (Fig. 10) are less than 15 cmwide and predominantly composed of colorless to milky whitemedium- to coarse-grained massive and crystalline quartzwith comb quartz commonly rimming cavities (Fig. 8A).
HYDROTHERMAL ALTERATION AND VEINS OF Au-Ag DEPOSITS IN THE WAITEKAURI AREA, NEW ZEALAND 955
0361-0128/98/000/000-00 $6.00 955
2 cm 4 cm
3 cm3 cm
C D
A B
C D
Massivecalcite
PyriteQuartz +hematite
Laumontite
Massive quartz
Comb quartz
Pyrite
FIG. 8. Images of A) typical coarsely crystalline massive to comb quartz vein (Sovereign: ML12 140.6 m), B) cryptocrys-talline quartz plus hematite vein/breccia with disseminated pyrite (Scotia: SC27 249.8 m), C) vein of acicular laumontite(Scotia: WV011 225.7 m), and D) massive calcite vein (Scotia: WV004 262.2 m).
Banding is weakly developed, localized, and characterized byfiner-grained quartz. Casts of quartz after platy calcite arerare at Sovereign. Most veins are almost entirely quartz, al-though some contain minor amounts of pyrite (<1 vol %) and
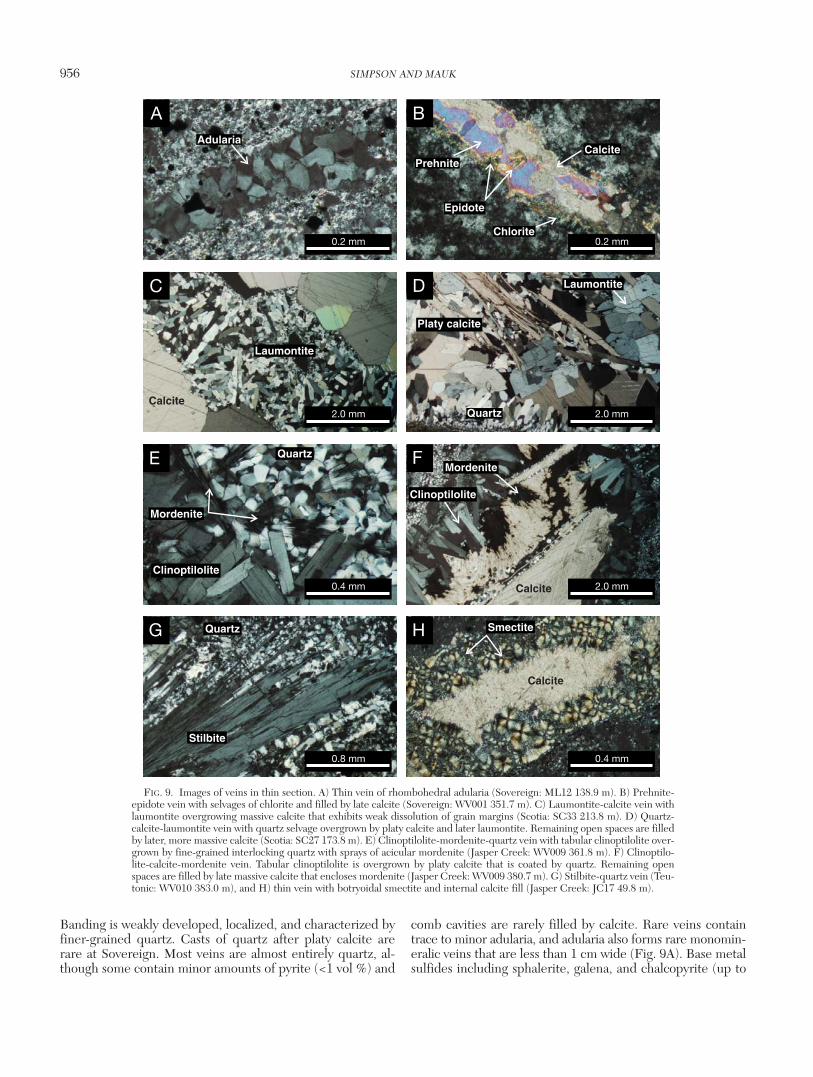
comb cavities are rarely filled by calcite. Rare veins containtrace to minor adularia, and adularia also forms rare monomin-eralic veins that are less than 1 cm wide (Fig. 9A). Base metalsulfides including sphalerite, galena, and chalcopyrite (up to
956 SIMPSON AND MAUK
0361-0128/98/000/000-00 $6.00 956
C D
A B
C D
E
G
F
H
0.2 mm0.2 mm
Adularia
Chlorite
Prehnite
Epidote
Calcite
Mordenite
Mordenite
CalciteQuartz
Clinoptilolite
Clinoptilolite
Platy calcite
Stilbite
Quartz
Quartz
Smectite
Calcite
Calcite
Laumontite
0.4 mm0.8 mm
Laumontite
2.0 mm 2.0 mm
0.4 mm 2.0 mm
FIG. 9. Images of veins in thin section. A) Thin vein of rhombohedral adularia (Sovereign: ML12 138.9 m). B) Prehnite-epidote vein with selvages of chlorite and filled by late calcite (Sovereign: WV001 351.7 m). C) Laumontite-calcite vein withlaumontite overgrowing massive calcite that exhibits weak dissolution of grain margins (Scotia: SC33 213.8 m). D) Quartz-calcite-laumontite vein with quartz selvage overgrown by platy calcite and later laumontite. Remaining open spaces are filledby later, more massive calcite (Scotia: SC27 173.8 m). E) Clinoptilolite-mordenite-quartz vein with tabular clinoptilolite over-grown by fine-grained interlocking quartz with sprays of acicular mordenite (Jasper Creek: WV009 361.8 m). F) Clinoptilo-lite-calcite-mordenite vein. Tabular clinoptilolite is overgrown by platy calcite that is coated by quartz. Remaining openspaces are filled by late massive calcite that encloses mordenite (Jasper Creek: WV009 380.7 m). G) Stilbite-quartz vein (Teu-tonic: WV010 383.0 m), and H) thin vein with botryoidal smectite and internal calcite fill (Jasper Creek: JC17 49.8 m).
HYDROTHERMAL ALTERATION AND VEINS OF Au-Ag DEPOSITS IN THE WAITEKAURI AREA, NEW ZEALAND 957
0361-0128/98/000/000-00 $6.00 957
6420
150
m N
6420
800
m N
6421
150
m N
2754500mE
2754000mE
2755000mE
2755500mE
2756000mE
2756500mE
2757000mE
Sov
erei
gn
Sci
mita
rTe
uton
ic
0mR
L
0mR
L
250m
RL
-250
mR
L
Jasp
er C
reek
Jub
ilee
Sco
tia
0mR
L
250m
RL
250
m
250
m
Ep
idot
eQ
uart
z
Qua
rtz
Cal
cite
Sm
ectit
e
Cal
cite
Laum
ontit
e
Laum
ontit
e
Mor
den
ite
Mor
den
ite /
Clin
optil
olite
/ S
tilb
ite
Pre
hnite
Clin
optil
olite
Stil
bite
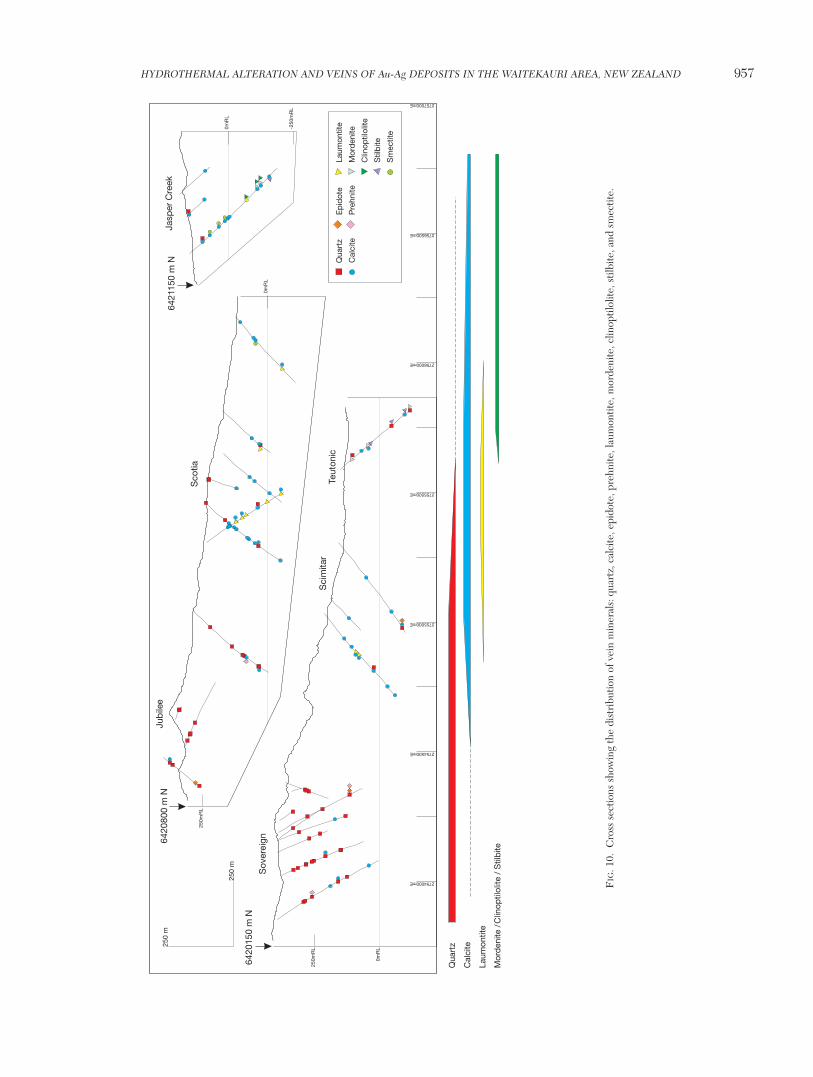
FIG
. 10.
Cro
ss s
ectio
ns s
how
ing
the
dist
ribu
tion
of v
ein
min
eral
s: q
uart
z, c
alci
te, e
pido
te, p
rehn
ite, l
aum
ontit
e, m
orde
nite
, clin
optil
olite
, stil
bite
, and
sm
ectit
e.
3 wt % combined Zn, Pb, and Cu) and associated Ag (up to318 g/t) were reported at depth in the Jubilee vein (Bell andFraser, 1912; Hartley and McConnochie, 1991). Chalcopy-rite, sphalerite, and galena also occur in a vein breccia at Sov-ereign.
Quartz-hematite-pyrite and hematite
Veins and brecciated veins of quartz-hematite-pyrite arerare and restricted to a single drill hole at Scotia. They are asmuch as 5 cm wide and composed of reddish-brown cryp-tocrystalline quartz that contains abundant micro-inclusionsof disseminated hematite and irregularly distributed cubiccrystals and clusters of pyrite (Fig. 8B). Adjacent host rocksare strongly altered to chlorite. Locally, these veins appear tobe cut by irregular domains of cryptocrystalline quartz thatlacks both hematite and pyrite. Thin, 1- to 10-mm-wide,quartz-hematite-rich veins and hematite-filled fractures thatlack pyrite occur on the eastern margin of Scotia, and at Scim-itar, Jasper Creek, and Teutonic. Later calcite commonly cutsor centrally fills these veins.
Zeolites (laumontite, clinoptilolite, mordenite, and stilbite)
Scotia and Scimitar contain laumontite veins, whereasJasper Creek and Teutonic contain clinoptilolite plus mor-denite or stilbite veins (Fig. 10). Laumontite veins at Scotiaare up to 2 cm wide and mainly consist of microcrystallinemasses or elongated prismatic crystals up to 15 mm in length(Fig. 8C). Most laumontite veins contain massive (Fig. 9C) orplaty calcite (Fig. 9D), and selvages of comb quartz with orwithout chlorite are rare; monomineralic laumontite veins arerare. The relative timing of calcite and laumontite varies; inmost veins laumontite has overgrown calcite but in some, cal-cite has overgrown laumontite. In the case of the former, theedges of some calcite crystals have thin reaction rims whereovergrown by laumontite, indicating disequilibrium and mu-tually exclusive precipitation (Fig. 9C). However, no dissolu-tion occurs where laumontite is overgrown by calcite.
At Jasper Creek and Teutonic, the main zeolite minerals areclinoptilolite, mordenite, and stilbite, which form veins thatare less than 1.5 cm wide. At Jasper Creek, these veins haveselvages of tabular clinoptilolite overgrown by acicular mor-denite plus quartz (Fig. 9E); platy calcite and late massive cal-cite fill remaining open spaces (Fig. 9F). Stilbite occurs asmonomineralic veins, with prismatic crystal plates, but also asquartz-stilbite veins (Fig. 9G).
Calcite
The distribution of calcite veins is broadly converse to thatof quartz veins; calcite veins are mostly restricted to Scotia,Scimitar, Teutonic, and Jasper Creek (Fig. 10). Calcite mostprominently occurs at Scotia as a stockwork of 1- to 15-cm-wide, massive to coarsely crystalline monomineralic veins(Fig. 8D). Elsewhere, calcite veins are typically less than 2 cmwide. Rare, weakly banded fine-grained calcite veins occur atJasper Creek and on the eastern margin of Scotia. Massiveand platy calcite further occurs in small amounts in zeoliteveins where it precedes and postdates zeolite deposition.Platy calcite forms blades up to 4 cm in length that are cut bylaumontite at Scotia (Fig. 9D) and are overgrown by clinop-tilolite and mordenite at Jasper Creek (Fig. 9F). Quartz
replacement of platy calcite is rare; it occurs as localized do-mains in quartz veins at Sovereign. The platy morphology in-dicates formation under boiling conditions (Simmons andChristenson, 1994). Calcite also occurs in the center of raresmectite veins (Fig. 9H). Due to spatial separation of quartzand calcite veins, there are few crosscutting relationships, butcalcite has overgrown comb quartz in rare veins.
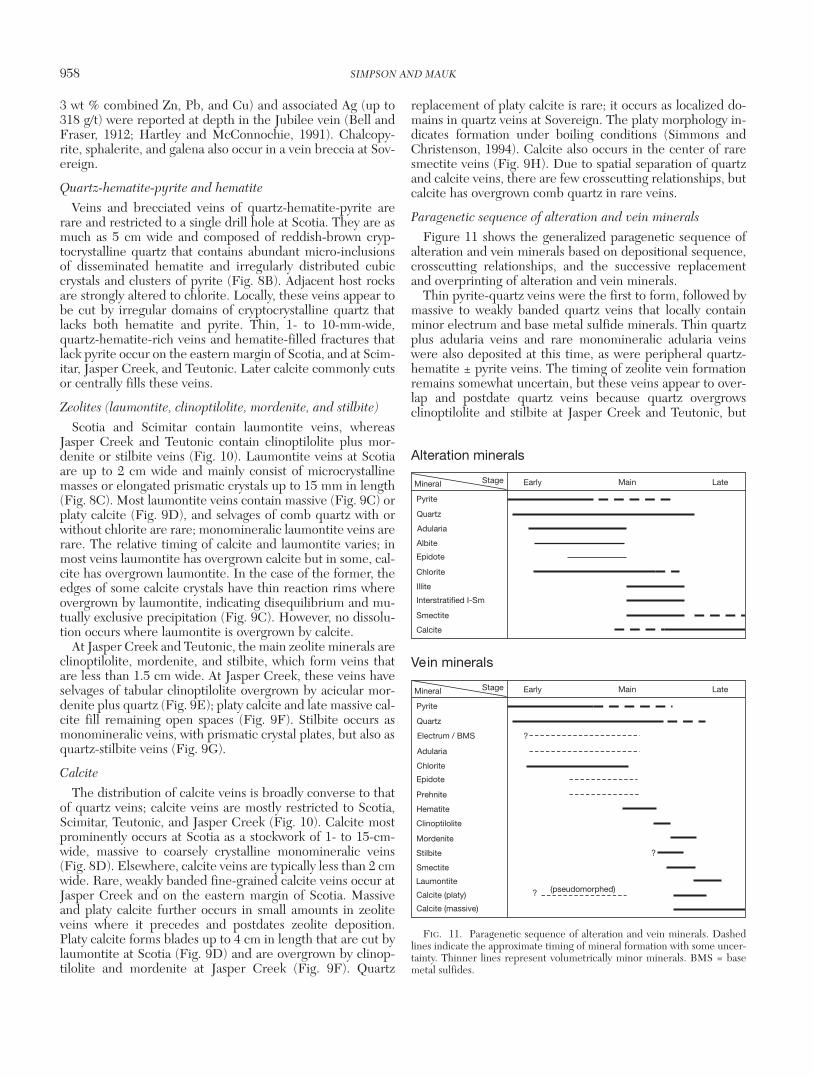
Paragenetic sequence of alteration and vein minerals
Figure 11 shows the generalized paragenetic sequence ofalteration and vein minerals based on depositional sequence,crosscutting relationships, and the successive replacementand overprinting of alteration and vein minerals.
Thin pyrite-quartz veins were the first to form, followed bymassive to weakly banded quartz veins that locally containminor electrum and base metal sulfide minerals. Thin quartzplus adularia veins and rare monomineralic adularia veinswere also deposited at this time, as were peripheral quartz-hematite ± pyrite veins. The timing of zeolite vein formationremains somewhat uncertain, but these veins appear to over-lap and postdate quartz veins because quartz overgrowsclinoptilolite and stilbite at Jasper Creek and Teutonic, but
958 SIMPSON AND MAUK
0361-0128/98/000/000-00 $6.00 958
StageMineral Early Main Late
Alteration minerals
Pyrite
Quartz
Adularia
Albite
Epidote
Chlorite
Illite
Interstratified I-Sm
Smectite
Calcite
StageMineral Early Main Late
Vein minerals
Pyrite
Quartz
Electrum / BMS
Adularia
Chlorite
Epidote
Prehnite
Hematite
Laumontite
Clinoptilolite
Mordenite
Stilbite
Smectite
Calcite (platy)
Calcite (massive)
?
? (pseudomorphed)
?
FIG. 11. Paragenetic sequence of alteration and vein minerals. Dashedlines indicate the approximate timing of mineral formation with some uncer-tainty. Thinner lines represent volumetrically minor minerals. BMS = basemetal sulfides.
precedes laumontite at Scotia. Similarly, zeolite and calcitedeposition overlap, because platy and massive calcite precedeand overprint laumontite at Scotia. Calcite was the last veinmineral to form at Jasper Creek because clinoptilolite andmordenite are overprinted by later platy and massive calcite.
Host-rock alteration involved the coeval formation ofquartz, adularia, albite, chlorite, rare epidote, and pyrite,which presumably was contemporaneous with the formationof quartz veins. Both adularia and albite were subsequentlyand variably altered to either illite, interstratified illite-smec-tite, or smectite. Furthermore, adularia and illite or inter-stratified illite-smectite are overprinted by late calcite thatlikely formed coevally with some calcite veins. Weatheringformed supergene iron oxyhydroxides, halloysite, and kaolin-ite at shallow levels.
Fluid InclusionsFluid inclusion microthermometric measurements were
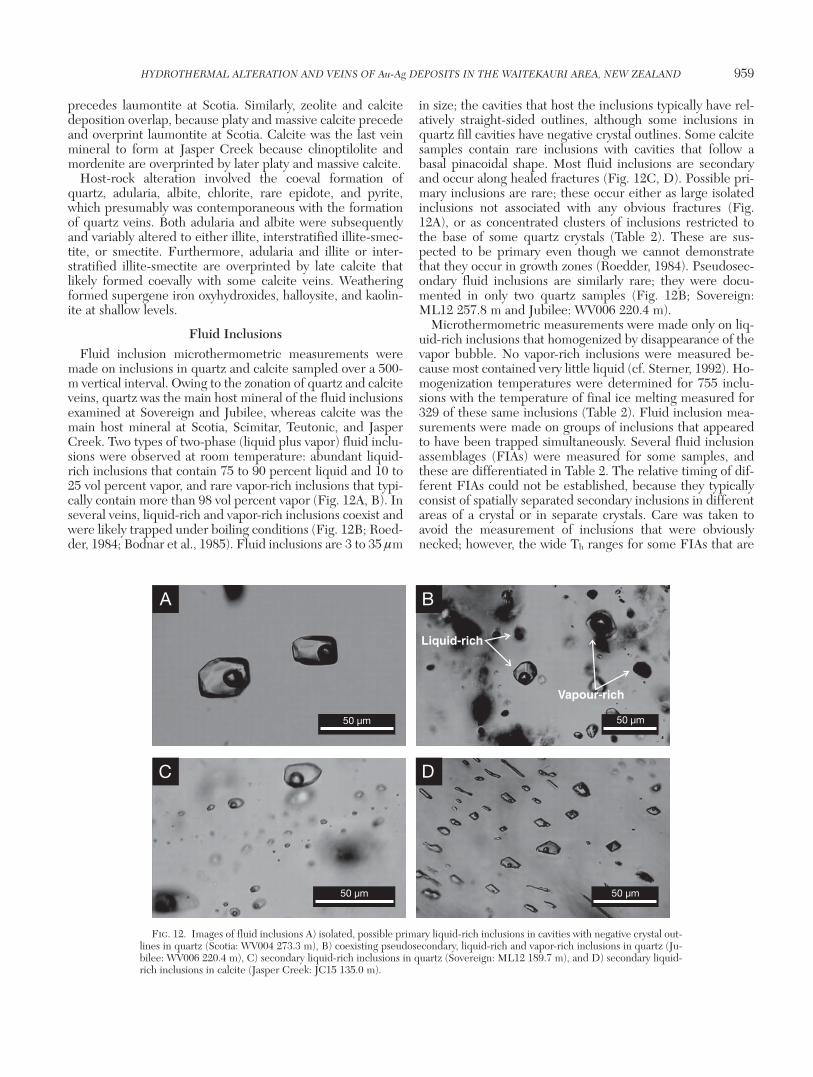
made on inclusions in quartz and calcite sampled over a 500-m vertical interval. Owing to the zonation of quartz and calciteveins, quartz was the main host mineral of the fluid inclusionsexamined at Sovereign and Jubilee, whereas calcite was themain host mineral at Scotia, Scimitar, Teutonic, and JasperCreek. Two types of two-phase (liquid plus vapor) fluid inclu-sions were observed at room temperature: abundant liquid-rich inclusions that contain 75 to 90 percent liquid and 10 to25 vol percent vapor, and rare vapor-rich inclusions that typi-cally contain more than 98 vol percent vapor (Fig. 12A, B). Inseveral veins, liquid-rich and vapor-rich inclusions coexist andwere likely trapped under boiling conditions (Fig. 12B; Roed-der, 1984; Bodnar et al., 1985). Fluid inclusions are 3 to 35 µm
in size; the cavities that host the inclusions typically have rel-atively straight-sided outlines, although some inclusions inquartz fill cavities have negative crystal outlines. Some calcitesamples contain rare inclusions with cavities that follow abasal pinacoidal shape. Most fluid inclusions are secondaryand occur along healed fractures (Fig. 12C, D). Possible pri-mary inclusions are rare; these occur either as large isolatedinclusions not associated with any obvious fractures (Fig.12A), or as concentrated clusters of inclusions restricted tothe base of some quartz crystals (Table 2). These are sus-pected to be primary even though we cannot demonstratethat they occur in growth zones (Roedder, 1984). Pseudosec-ondary fluid inclusions are similarly rare; they were docu-mented in only two quartz samples (Fig. 12B; Sovereign:ML12 257.8 m and Jubilee: WV006 220.4 m).
Microthermometric measurements were made only on liq-uid-rich inclusions that homogenized by disappearance of thevapor bubble. No vapor-rich inclusions were measured be-cause most contained very little liquid (cf. Sterner, 1992). Ho-mogenization temperatures were determined for 755 inclu-sions with the temperature of final ice melting measured for329 of these same inclusions (Table 2). Fluid inclusion mea-surements were made on groups of inclusions that appearedto have been trapped simultaneously. Several fluid inclusionassemblages (FIAs) were measured for some samples, andthese are differentiated in Table 2. The relative timing of dif-ferent FIAs could not be established, because they typicallyconsist of spatially separated secondary inclusions in differentareas of a crystal or in separate crystals. Care was taken toavoid the measurement of inclusions that were obviouslynecked; however, the wide Th ranges for some FIAs that are
HYDROTHERMAL ALTERATION AND VEINS OF Au-Ag DEPOSITS IN THE WAITEKAURI AREA, NEW ZEALAND 959
0361-0128/98/000/000-00 $6.00 959
50 µm
50 µm 50 µm
50 µm
C D
A B
C D
Vapour-rich
Liquid-rich
FIG. 12. Images of fluid inclusions A) isolated, possible primary liquid-rich inclusions in cavities with negative crystal out-lines in quartz (Scotia: WV004 273.3 m), B) coexisting pseudosecondary, liquid-rich and vapor-rich inclusions in quartz (Ju-bilee: WV006 220.4 m), C) secondary liquid-rich inclusions in quartz (Sovereign: ML12 189.7 m), and D) secondary liquid-rich inclusions in calcite (Jasper Creek: JC15 135.0 m).
960 SIMPSON AND MAUK
0361-0128/98/000/000-00 $6.00 960
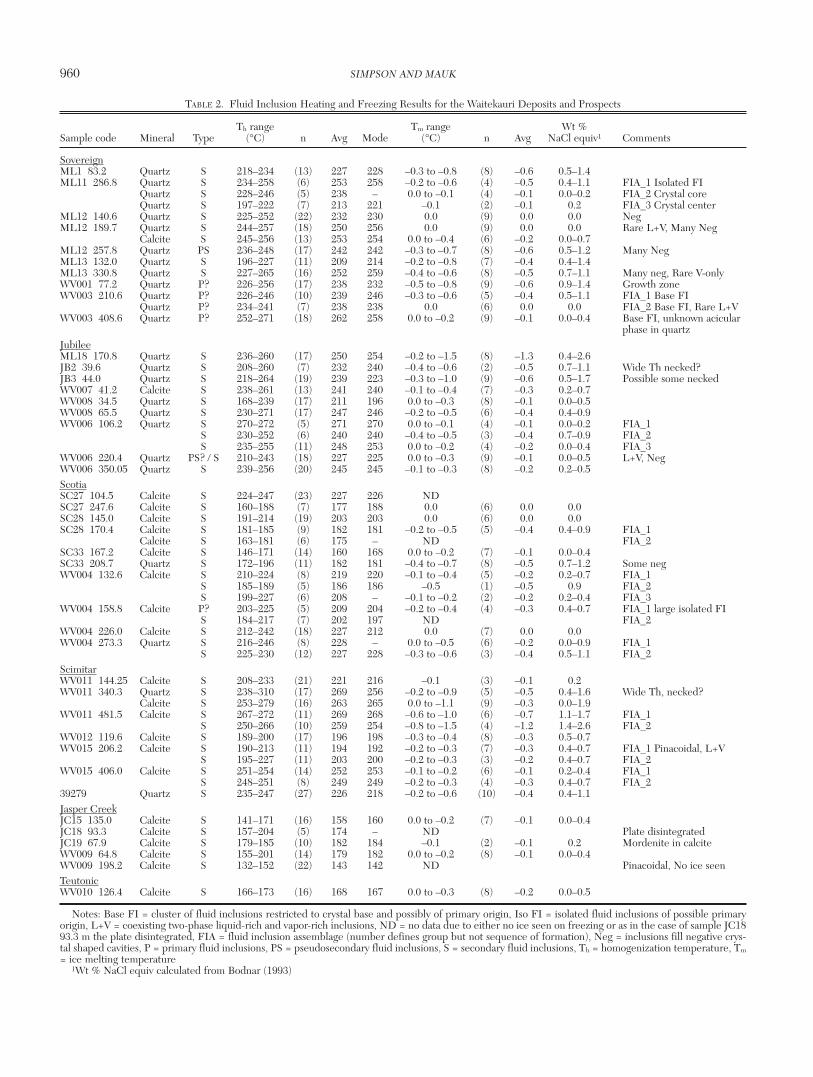
TABLE 2. Fluid Inclusion Heating and Freezing Results for the Waitekauri Deposits and Prospects
Th range Tm range Wt % Sample code Mineral Type (°C) n Avg Mode (°C) n Avg NaCl equiv1 Comments
SovereignML1 83.2 Quartz S 218–234 (13) 227 228 –0.3 to –0.8 (8) –0.6 0.5–1.4 ML11 286.8 Quartz S 234–258 (6) 253 258 –0.2 to –0.6 (4) –0.5 0.4–1.1 FIA_1 Isolated FI
Quartz S 228–246 (5) 238 – 0.0 to –0.1 (4) –0.1 0.0–0.2 FIA_2 Crystal coreQuartz S 197–222 (7) 213 221 –0.1 (2) –0.1 0.2 FIA_3 Crystal center
ML12 140.6 Quartz S 225–252 (22) 232 230 0.0 (9) 0.0 0.0 Neg ML12 189.7 Quartz S 244–257 (18) 250 256 0.0 (9) 0.0 0.0 Rare L+V, Many Neg
Calcite S 245–256 (13) 253 254 0.0 to –0.4 (6) –0.2 0.0–0.7ML12 257.8 Quartz PS 236–248 (17) 242 242 –0.3 to –0.7 (8) –0.6 0.5–1.2 Many NegML13 132.0 Quartz S 196–227 (11) 209 214 –0.2 to –0.8 (7) –0.4 0.4–1.4ML13 330.8 Quartz S 227–265 (16) 252 259 –0.4 to –0.6 (8) –0.5 0.7–1.1 Many neg, Rare V-only WV001 77.2 Quartz P? 226–256 (17) 238 232 –0.5 to –0.8 (9) –0.6 0.9–1.4 Growth zoneWV003 210.6 Quartz P? 226–246 (10) 239 246 –0.3 to –0.6 (5) –0.4 0.5–1.1 FIA_1 Base FI
Quartz P? 234–241 (7) 238 238 0.0 (6) 0.0 0.0 FIA_2 Base FI, Rare L+VWV003 408.6 Quartz P? 252–271 (18) 262 258 0.0 to –0.2 (9) –0.1 0.0–0.4 Base FI, unknown acicular
phase in quartz JubileeML18 170.8 Quartz S 236–260 (17) 250 254 –0.2 to –1.5 (8) –1.3 0.4–2.6JB2 39.6 Quartz S 208–260 (7) 232 240 –0.4 to –0.6 (2) –0.5 0.7–1.1 Wide Th necked?JB3 44.0 Quartz S 218–264 (19) 239 223 –0.3 to –1.0 (9) –0.6 0.5–1.7 Possible some neckedWV007 41.2 Calcite S 238–261 (13) 241 240 –0.1 to –0.4 (7) –0.3 0.2–0.7WV008 34.5 Quartz S 168–239 (17) 211 196 0.0 to –0.3 (8) –0.1 0.0–0.5WV008 65.5 Quartz S 230–271 (17) 247 246 –0.2 to –0.5 (6) –0.4 0.4–0.9WV006 106.2 Quartz S 270–272 (5) 271 270 0.0 to –0.1 (4) –0.1 0.0–0.2 FIA_1
S 230–252 (6) 240 240 –0.4 to –0.5 (3) –0.4 0.7–0.9 FIA_2S 235–255 (11) 248 253 0.0 to –0.2 (4) –0.2 0.0–0.4 FIA_3
WV006 220.4 Quartz PS? / S 210–243 (18) 227 225 0.0 to –0.3 (9) –0.1 0.0–0.5 L+V, NegWV006 350.05 Quartz S 239–256 (20) 245 245 –0.1 to –0.3 (8) –0.2 0.2–0.5ScotiaSC27 104.5 Calcite S 224–247 (23) 227 226 NDSC27 247.6 Calcite S 160–188 (7) 177 188 0.0 (6) 0.0 0.0SC28 145.0 Calcite S 191–214 (19) 203 203 0.0 (6) 0.0 0.0SC28 170.4 Calcite S 181–185 (9) 182 181 –0.2 to –0.5 (5) –0.4 0.4–0.9 FIA_1
Calcite S 163–181 (6) 175 – ND FIA_2SC33 167.2 Calcite S 146–171 (14) 160 168 0.0 to –0.2 (7) –0.1 0.0–0.4SC33 208.7 Quartz S 172–196 (11) 182 181 –0.4 to –0.7 (8) –0.5 0.7–1.2 Some negWV004 132.6 Calcite S 210–224 (8) 219 220 –0.1 to –0.4 (5) –0.2 0.2–0.7 FIA_1
S 185–189 (5) 186 186 –0.5 (1) –0.5 0.9 FIA_2S 199–227 (6) 208 – –0.1 to –0.2 (2) –0.2 0.2–0.4 FIA_3
WV004 158.8 Calcite P? 203–225 (5) 209 204 –0.2 to –0.4 (4) –0.3 0.4–0.7 FIA_1 large isolated FIS 184–217 (7) 202 197 ND FIA_2
WV004 226.0 Calcite S 212–242 (18) 227 212 0.0 (7) 0.0 0.0WV004 273.3 Quartz S 216–246 (8) 228 – 0.0 to –0.5 (6) –0.2 0.0–0.9 FIA_1
S 225–230 (12) 227 228 –0.3 to –0.6 (3) –0.4 0.5–1.1 FIA_2ScimitarWV011 144.25 Calcite S 208–233 (21) 221 216 –0.1 (3) –0.1 0.2WV011 340.3 Quartz S 238–310 (17) 269 256 –0.2 to –0.9 (5) –0.5 0.4–1.6 Wide Th, necked?
Calcite S 253–279 (16) 263 265 0.0 to –1.1 (9) –0.3 0.0–1.9WV011 481.5 Calcite S 267–272 (11) 269 268 –0.6 to –1.0 (6) –0.7 1.1–1.7 FIA_1
S 250–266 (10) 259 254 –0.8 to –1.5 (4) –1.2 1.4–2.6 FIA_2WV012 119.6 Calcite S 189–200 (17) 196 198 –0.3 to –0.4 (8) –0.3 0.5–0.7WV015 206.2 Calcite S 190–213 (11) 194 192 –0.2 to –0.3 (7) –0.3 0.4–0.7 FIA_1 Pinacoidal, L+V
S 195–227 (11) 203 200 –0.2 to –0.3 (3) –0.2 0.4–0.7 FIA_2WV015 406.0 Calcite S 251–254 (14) 252 253 –0.1 to –0.2 (6) –0.1 0.2–0.4 FIA_1
S 248–251 (8) 249 249 –0.2 to –0.3 (4) –0.3 0.4–0.7 FIA_239279 Quartz S 235–247 (27) 226 218 –0.2 to –0.6 (10) –0.4 0.4–1.1Jasper CreekJC15 135.0 Calcite S 141–171 (16) 158 160 0.0 to –0.2 (7) –0.1 0.0–0.4JC18 93.3 Calcite S 157–204 (5) 174 – ND Plate disintegrated JC19 67.9 Calcite S 179–185 (10) 182 184 –0.1 (2) –0.1 0.2 Mordenite in calciteWV009 64.8 Calcite S 155–201 (14) 179 182 0.0 to –0.2 (8) –0.1 0.0–0.4WV009 198.2 Calcite S 132–152 (22) 143 142 ND Pinacoidal, No ice seenTeutonicWV010 126.4 Calcite S 166–173 (16) 168 167 0.0 to –0.3 (8) –0.2 0.0–0.5
Notes: Base FI = cluster of fluid inclusions restricted to crystal base and possibly of primary origin, Iso FI = isolated fluid inclusions of possible primaryorigin, L+V = coexisting two-phase liquid-rich and vapor-rich inclusions, ND = no data due to either no ice seen on freezing or as in the case of sample JC1893.3 m the plate disintegrated, FIA = fluid inclusion assemblage (number defines group but not sequence of formation), Neg = inclusions fill negative crys-tal shaped cavities, P = primary fluid inclusions, PS = pseudosecondary fluid inclusions, S = secondary fluid inclusions, Th = homogenization temperature, Tm= ice melting temperature
1Wt % NaCl equiv calculated from Bodnar (1993)
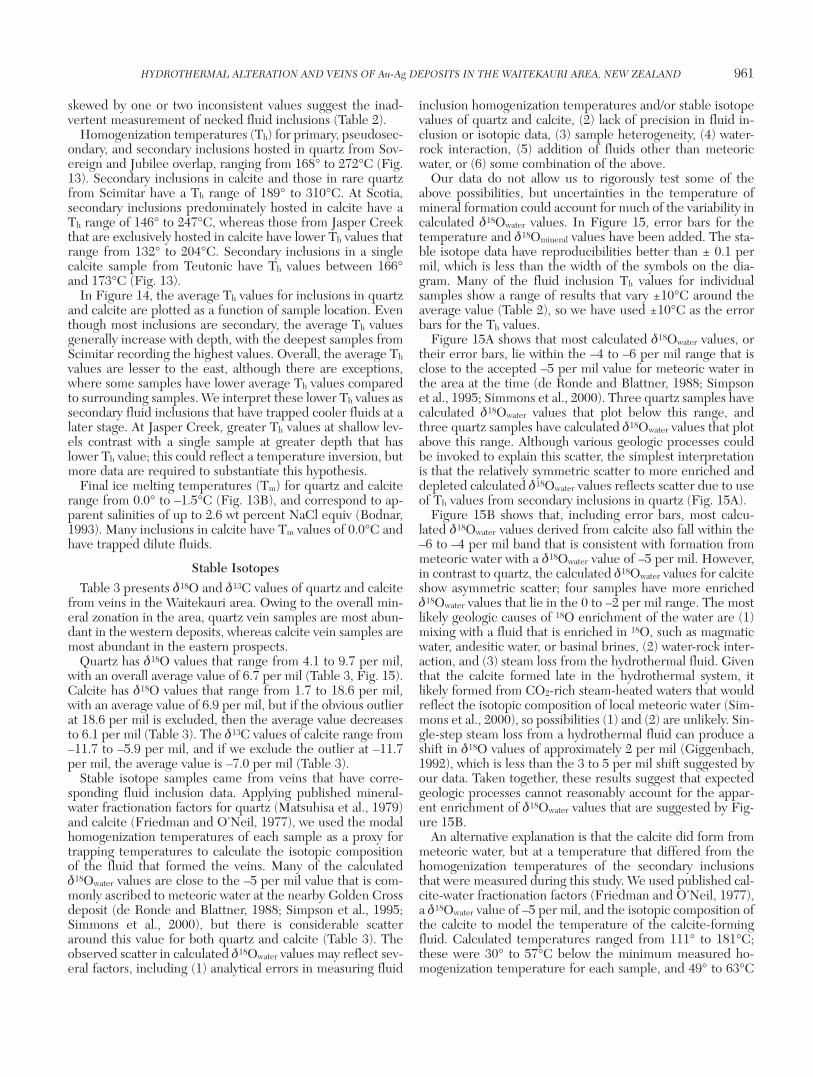
skewed by one or two inconsistent values suggest the inad-vertent measurement of necked fluid inclusions (Table 2).
Homogenization temperatures (Th) for primary, pseudosec-ondary, and secondary inclusions hosted in quartz from Sov-ereign and Jubilee overlap, ranging from 168° to 272°C (Fig.13). Secondary inclusions in calcite and those in rare quartzfrom Scimitar have a Th range of 189° to 310°C. At Scotia,secondary inclusions predominately hosted in calcite have aTh range of 146° to 247°C, whereas those from Jasper Creekthat are exclusively hosted in calcite have lower Th values thatrange from 132° to 204°C. Secondary inclusions in a singlecalcite sample from Teutonic have Th values between 166°and 173°C (Fig. 13).
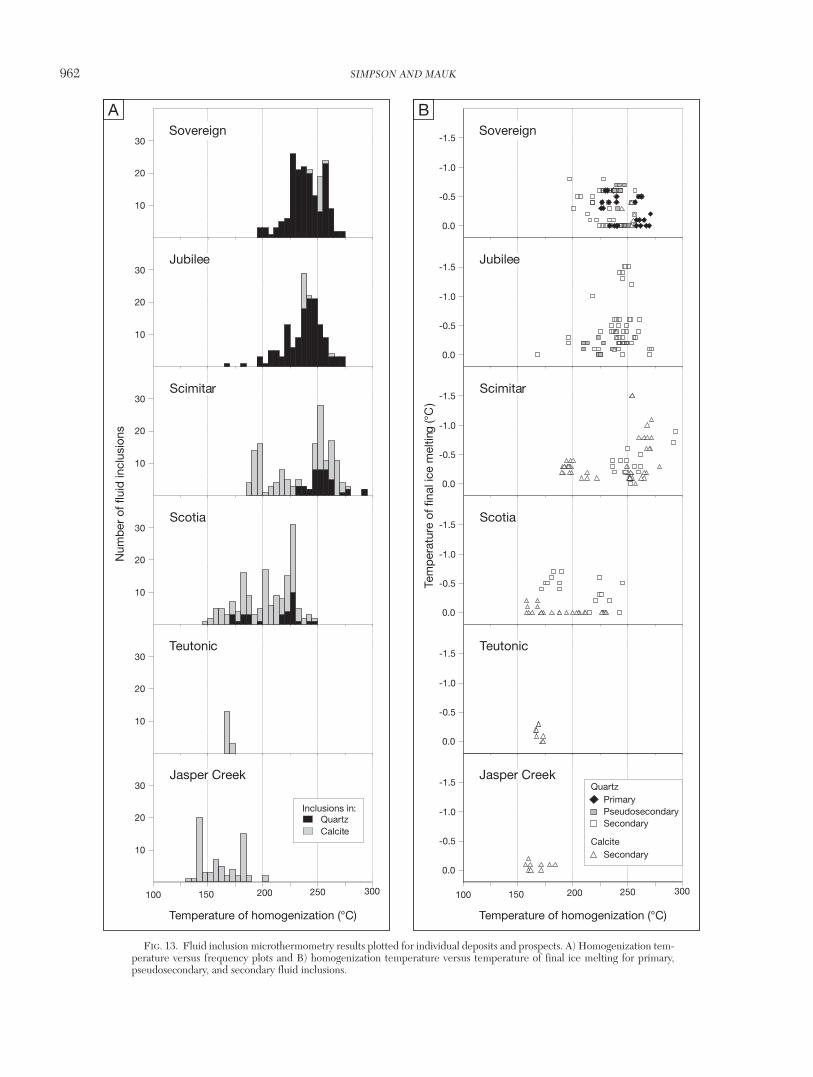
In Figure 14, the average Th values for inclusions in quartzand calcite are plotted as a function of sample location. Eventhough most inclusions are secondary, the average Th valuesgenerally increase with depth, with the deepest samples fromScimitar recording the highest values. Overall, the average Th
values are lesser to the east, although there are exceptions,where some samples have lower average Th values comparedto surrounding samples. We interpret these lower Th values assecondary fluid inclusions that have trapped cooler fluids at alater stage. At Jasper Creek, greater Th values at shallow lev-els contrast with a single sample at greater depth that haslower Th value; this could reflect a temperature inversion, butmore data are required to substantiate this hypothesis.
Final ice melting temperatures (Tm) for quartz and calciterange from 0.0° to –1.5°C (Fig. 13B), and correspond to ap-parent salinities of up to 2.6 wt percent NaCl equiv (Bodnar,1993). Many inclusions in calcite have Tm values of 0.0°C andhave trapped dilute fluids.
Stable IsotopesTable 3 presents δ18O and δ13C values of quartz and calcite
from veins in the Waitekauri area. Owing to the overall min-eral zonation in the area, quartz vein samples are most abun-dant in the western deposits, whereas calcite vein samples aremost abundant in the eastern prospects.
Quartz has δ18O values that range from 4.1 to 9.7 per mil,with an overall average value of 6.7 per mil (Table 3, Fig. 15).Calcite has δ18O values that range from 1.7 to 18.6 per mil,with an average value of 6.9 per mil, but if the obvious outlierat 18.6 per mil is excluded, then the average value decreasesto 6.1 per mil (Table 3). The δ13C values of calcite range from–11.7 to –5.9 per mil, and if we exclude the outlier at –11.7per mil, the average value is –7.0 per mil (Table 3).
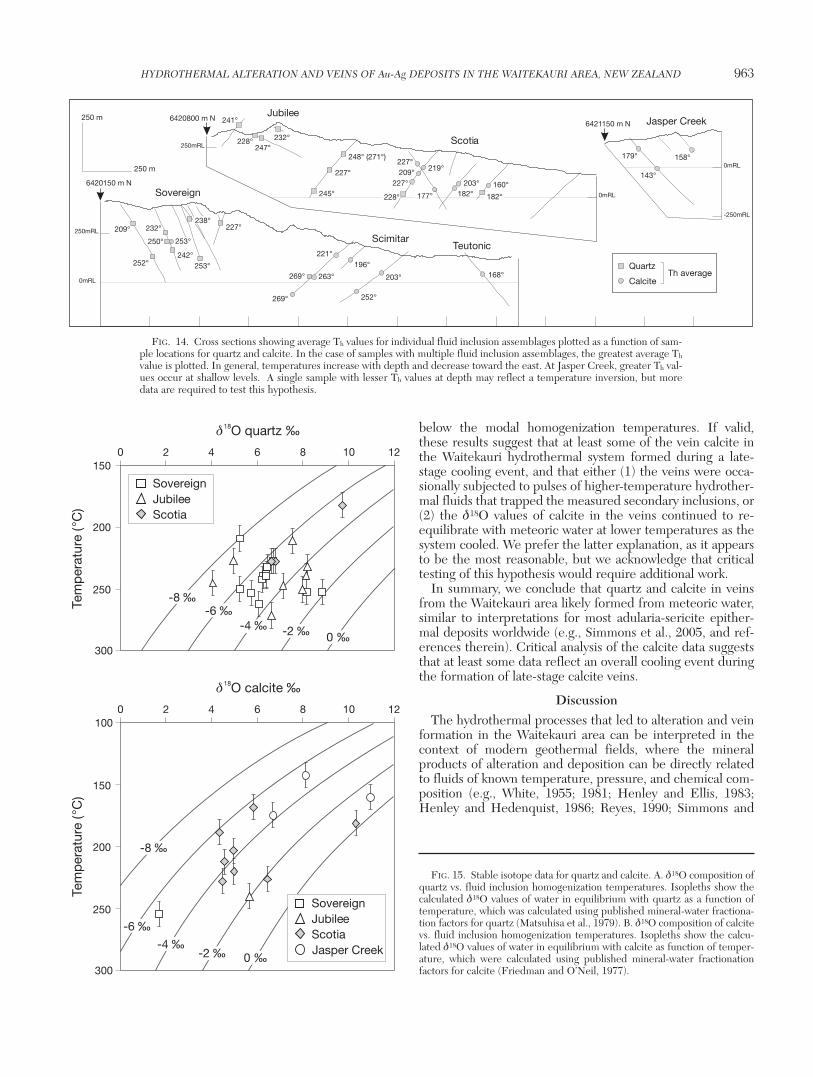
Stable isotope samples came from veins that have corre-sponding fluid inclusion data. Applying published mineral-water fractionation factors for quartz (Matsuhisa et al., 1979)and calcite (Friedman and O’Neil, 1977), we used the modalhomogenization temperatures of each sample as a proxy fortrapping temperatures to calculate the isotopic compositionof the fluid that formed the veins. Many of the calculatedδ18Owater values are close to the –5 per mil value that is com-monly ascribed to meteoric water at the nearby Golden Crossdeposit (de Ronde and Blattner, 1988; Simpson et al., 1995;Simmons et al., 2000), but there is considerable scatteraround this value for both quartz and calcite (Table 3). Theobserved scatter in calculated δ18Owater values may reflect sev-eral factors, including (1) analytical errors in measuring fluid
inclusion homogenization temperatures and/or stable isotopevalues of quartz and calcite, (2) lack of precision in fluid in-clusion or isotopic data, (3) sample heterogeneity, (4) water-rock interaction, (5) addition of fluids other than meteoricwater, or (6) some combination of the above.
Our data do not allow us to rigorously test some of theabove possibilities, but uncertainties in the temperature ofmineral formation could account for much of the variability incalculated δ18Owater values. In Figure 15, error bars for thetemperature and δ18Omineral values have been added. The sta-ble isotope data have reproducibilities better than ± 0.1 permil, which is less than the width of the symbols on the dia-gram. Many of the fluid inclusion Th values for individualsamples show a range of results that vary ±10°C around theaverage value (Table 2), so we have used ±10°C as the errorbars for the Th values.
Figure 15A shows that most calculated δ18Owater values, ortheir error bars, lie within the –4 to –6 per mil range that isclose to the accepted –5 per mil value for meteoric water inthe area at the time (de Ronde and Blattner, 1988; Simpsonet al., 1995; Simmons et al., 2000). Three quartz samples havecalculated δ18Owater values that plot below this range, andthree quartz samples have calculated δ18Owater values that plotabove this range. Although various geologic processes couldbe invoked to explain this scatter, the simplest interpretationis that the relatively symmetric scatter to more enriched anddepleted calculated δ18Owater values reflects scatter due to useof Th values from secondary inclusions in quartz (Fig. 15A).
Figure 15B shows that, including error bars, most calcu-lated δ18Owater values derived from calcite also fall within the–6 to –4 per mil band that is consistent with formation frommeteoric water with a δ18Owater value of –5 per mil. However,in contrast to quartz, the calculated δ18Owater values for calciteshow asymmetric scatter; four samples have more enrichedδ18Owater values that lie in the 0 to –2 per mil range. The mostlikely geologic causes of 18O enrichment of the water are (1)mixing with a fluid that is enriched in 18O, such as magmaticwater, andesitic water, or basinal brines, (2) water-rock inter-action, and (3) steam loss from the hydrothermal fluid. Giventhat the calcite formed late in the hydrothermal system, itlikely formed from CO2-rich steam-heated waters that wouldreflect the isotopic composition of local meteoric water (Sim-mons et al., 2000), so possibilities (1) and (2) are unlikely. Sin-gle-step steam loss from a hydrothermal fluid can produce ashift in δ18O values of approximately 2 per mil (Giggenbach,1992), which is less than the 3 to 5 per mil shift suggested byour data. Taken together, these results suggest that expectedgeologic processes cannot reasonably account for the appar-ent enrichment of δ18Owater values that are suggested by Fig-ure 15B.
An alternative explanation is that the calcite did form frommeteoric water, but at a temperature that differed from thehomogenization temperatures of the secondary inclusionsthat were measured during this study. We used published cal-cite-water fractionation factors (Friedman and O’Neil, 1977),a δ18Owater value of –5 per mil, and the isotopic composition ofthe calcite to model the temperature of the calcite-formingfluid. Calculated temperatures ranged from 111° to 181°C;these were 30° to 57°C below the minimum measured ho-mogenization temperature for each sample, and 49° to 63°C
HYDROTHERMAL ALTERATION AND VEINS OF Au-Ag DEPOSITS IN THE WAITEKAURI AREA, NEW ZEALAND 961
0361-0128/98/000/000-00 $6.00 961
962 SIMPSON AND MAUK
0361-0128/98/000/000-00 $6.00 962
Temperature of homogenization (°C)
100 150 200 250 300
Temperature of homogenization (°C)
Num
ber
of f
luid
incl
usio
nsSovereign
A B
Jubilee
Scimitar
Scotia
100 150 200 250 300
10
20
-1.5
10
20
30
10
20
30
10
20
30
10
20
30
Jasper Creek30
10
20
30
Teutonic
Inclusions in:QuartzCalcite
Sovereign
Jubilee
Scimitar
Scotia
Teutonic
Jasper Creek
0.0
-0.5
-1.0
-1.5
0.0
-0.5
-1.0
-1.5
0.0
-0.5
-1.0
-1.5
0.0
-0.5
-1.0
-1.5
0.0
-0.5
-1.0
-1.5
0.0
-0.5
-1.0
Tem
per
atur
e of
fina
l ice
mel
ting
(°C
)
PrimaryPseudosecondarySecondary
Secondary
Quartz
Calcite
FIG. 13. Fluid inclusion microthermometry results plotted for individual deposits and prospects. A) Homogenization tem-perature versus frequency plots and B) homogenization temperature versus temperature of final ice melting for primary,pseudosecondary, and secondary fluid inclusions.
below the modal homogenization temperatures. If valid,these results suggest that at least some of the vein calcite inthe Waitekauri hydrothermal system formed during a late-stage cooling event, and that either (1) the veins were occa-sionally subjected to pulses of higher-temperature hydrother-mal fluids that trapped the measured secondary inclusions, or(2) the δ18O values of calcite in the veins continued to re-equilibrate with meteoric water at lower temperatures as thesystem cooled. We prefer the latter explanation, as it appearsto be the most reasonable, but we acknowledge that criticaltesting of this hypothesis would require additional work.
In summary, we conclude that quartz and calcite in veinsfrom the Waitekauri area likely formed from meteoric water,similar to interpretations for most adularia-sericite epither-mal deposits worldwide (e.g., Simmons et al., 2005, and ref-erences therein). Critical analysis of the calcite data suggeststhat at least some data reflect an overall cooling event duringthe formation of late-stage calcite veins.
DiscussionThe hydrothermal processes that led to alteration and vein
formation in the Waitekauri area can be interpreted in thecontext of modern geothermal fields, where the mineralproducts of alteration and deposition can be directly relatedto fluids of known temperature, pressure, and chemical com-position (e.g., White, 1955; 1981; Henley and Ellis, 1983;Henley and Hedenquist, 1986; Reyes, 1990; Simmons and
HYDROTHERMAL ALTERATION AND VEINS OF Au-Ag DEPOSITS IN THE WAITEKAURI AREA, NEW ZEALAND 963
0361-0128/98/000/000-00 $6.00 963
Sovereign6420150 m N
6420800 m N6421150 m N
ScimitarTeutonic
0mRL
0mRL
250mRL
-250mRL
Jasper CreekJubilee
Scotia
0mRL
250mRL
250 m
250 m
227°
221°
269° 263°
269°
196°
203° 168°
252°
253°
232°
250°
242°
209°
252°
232°
248 (271°)°
227°
245°
247°
241°
228°
227°
177°
203°182° 182°
219°209°
227°
228°
160°
158°179°
143°
238°
Th averageQuartz
Calcite
253°
FIG. 14. Cross sections showing average Th values for individual fluid inclusion assemblages plotted as a function of sam-ple locations for quartz and calcite. In the case of samples with multiple fluid inclusion assemblages, the greatest average Th
value is plotted. In general, temperatures increase with depth and decrease toward the east. At Jasper Creek, greater Th val-ues occur at shallow levels. A single sample with lesser Th values at depth may reflect a temperature inversion, but moredata are required to test this hypothesis.
δ18O quartz ‰
-8 ‰-6 ‰
-4 ‰ -2 ‰ 0 ‰
Tem
per
atur
e (
C)
°
0 4 8 122 6 10150
200
250
300
δ18O calcite ‰
Tem
per
atur
e (
C)
°
0 4 8 122 6 10
150
100
200
250
300
-8 ‰
-6 ‰
-4 ‰-2 ‰ 0 ‰
Sovereign
Sovereign
Jubilee
Jubilee
Scotia
Scotia
Jasper Creek
FIG. 15. Stable isotope data for quartz and calcite. A. δ18O composition ofquartz vs. fluid inclusion homogenization temperatures. Isopleths show thecalculated δ18O values of water in equilibrium with quartz as a function oftemperature, which was calculated using published mineral-water fractiona-tion factors for quartz (Matsuhisa et al., 1979). B. δ18O composition of calcitevs. fluid inclusion homogenization temperatures. Isopleths show the calcu-lated δ18O values of water in equilibrium with calcite as function of temper-ature, which were calculated using published mineral-water fractionationfactors for calcite (Friedman and O’Neil, 1977).
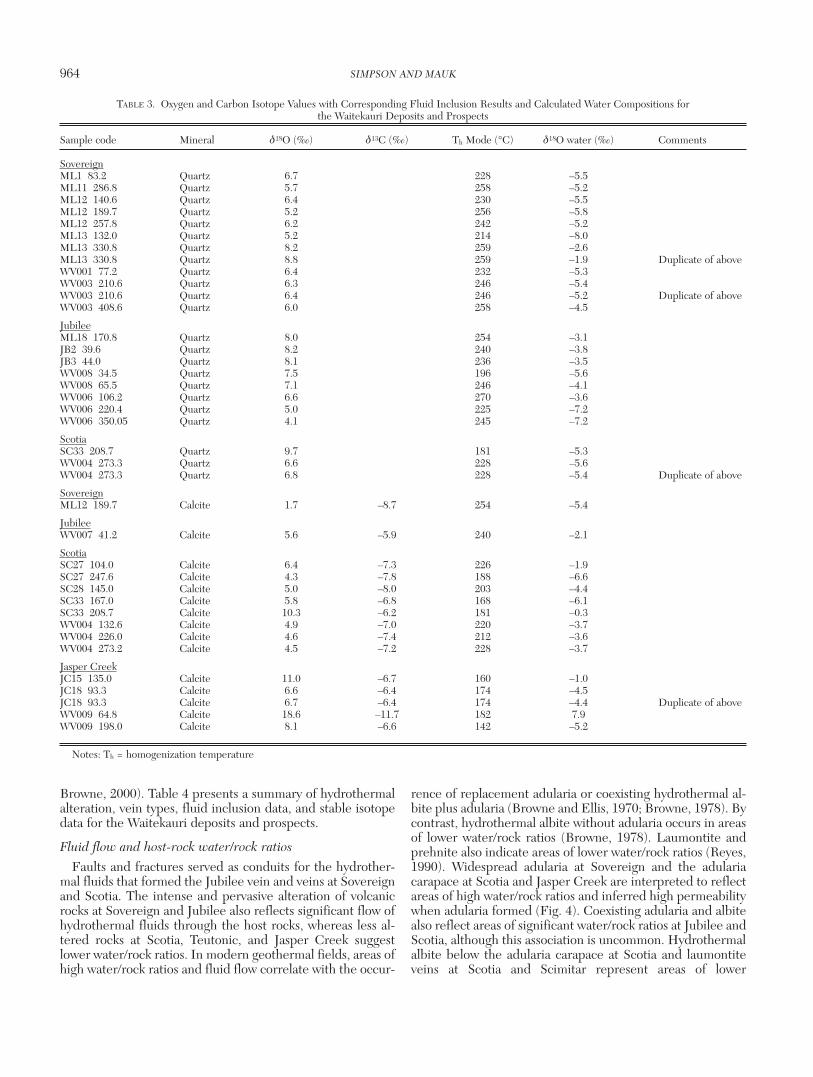
Browne, 2000). Table 4 presents a summary of hydrothermalalteration, vein types, fluid inclusion data, and stable isotopedata for the Waitekauri deposits and prospects.
Fluid flow and host-rock water/rock ratios
Faults and fractures served as conduits for the hydrother-mal fluids that formed the Jubilee vein and veins at Sovereignand Scotia. The intense and pervasive alteration of volcanicrocks at Sovereign and Jubilee also reflects significant flow ofhydrothermal fluids through the host rocks, whereas less al-tered rocks at Scotia, Teutonic, and Jasper Creek suggestlower water/rock ratios. In modern geothermal fields, areas ofhigh water/rock ratios and fluid flow correlate with the occur-
rence of replacement adularia or coexisting hydrothermal al-bite plus adularia (Browne and Ellis, 1970; Browne, 1978). Bycontrast, hydrothermal albite without adularia occurs in areasof lower water/rock ratios (Browne, 1978). Laumontite andprehnite also indicate areas of lower water/rock ratios (Reyes,1990). Widespread adularia at Sovereign and the adulariacarapace at Scotia and Jasper Creek are interpreted to reflectareas of high water/rock ratios and inferred high permeabilitywhen adularia formed (Fig. 4). Coexisting adularia and albitealso reflect areas of significant water/rock ratios at Jubilee andScotia, although this association is uncommon. Hydrothermalalbite below the adularia carapace at Scotia and laumontiteveins at Scotia and Scimitar represent areas of lower
964 SIMPSON AND MAUK
0361-0128/98/000/000-00 $6.00 964
TABLE 3. Oxygen and Carbon Isotope Values with Corresponding Fluid Inclusion Results and Calculated Water Compositions for the Waitekauri Deposits and Prospects
Sample code Mineral δ18O (‰) δ13C (‰) Th Mode (°C) δ18O water (‰) Comments
SovereignML1 83.2 Quartz 6.7 228 –5.5ML11 286.8 Quartz 5.7 258 –5.2ML12 140.6 Quartz 6.4 230 –5.5ML12 189.7 Quartz 5.2 256 –5.8ML12 257.8 Quartz 6.2 242 –5.2ML13 132.0 Quartz 5.2 214 –8.0ML13 330.8 Quartz 8.2 259 –2.6ML13 330.8 Quartz 8.8 259 –1.9 Duplicate of aboveWV001 77.2 Quartz 6.4 232 –5.3WV003 210.6 Quartz 6.3 246 –5.4WV003 210.6 Quartz 6.4 246 –5.2 Duplicate of aboveWV003 408.6 Quartz 6.0 258 –4.5
JubileeML18 170.8 Quartz 8.0 254 –3.1JB2 39.6 Quartz 8.2 240 –3.8JB3 44.0 Quartz 8.1 236 –3.5WV008 34.5 Quartz 7.5 196 –5.6WV008 65.5 Quartz 7.1 246 –4.1WV006 106.2 Quartz 6.6 270 –3.6WV006 220.4 Quartz 5.0 225 –7.2WV006 350.05 Quartz 4.1 245 –7.2
ScotiaSC33 208.7 Quartz 9.7 181 –5.3WV004 273.3 Quartz 6.6 228 –5.6WV004 273.3 Quartz 6.8 228 –5.4 Duplicate of above
SovereignML12 189.7 Calcite 1.7 –8.7 254 –5.4
JubileeWV007 41.2 Calcite 5.6 –5.9 240 –2.1
ScotiaSC27 104.0 Calcite 6.4 –7.3 226 –1.9SC27 247.6 Calcite 4.3 –7.8 188 –6.6SC28 145.0 Calcite 5.0 –8.0 203 –4.4SC33 167.0 Calcite 5.8 –6.8 168 –6.1SC33 208.7 Calcite 10.3 –6.2 181 –0.3WV004 132.6 Calcite 4.9 –7.0 220 –3.7WV004 226.0 Calcite 4.6 –7.4 212 –3.6WV004 273.2 Calcite 4.5 –7.2 228 –3.7
Jasper CreekJC15 135.0 Calcite 11.0 –6.7 160 –1.0JC18 93.3 Calcite 6.6 –6.4 174 –4.5JC18 93.3 Calcite 6.7 –6.4 174 –4.4 Duplicate of aboveWV009 64.8 Calcite 18.6 –11.7 182 7.9WV009 198.0 Calcite 8.1 –6.6 142 –5.2
Notes: Th = homogenization temperature
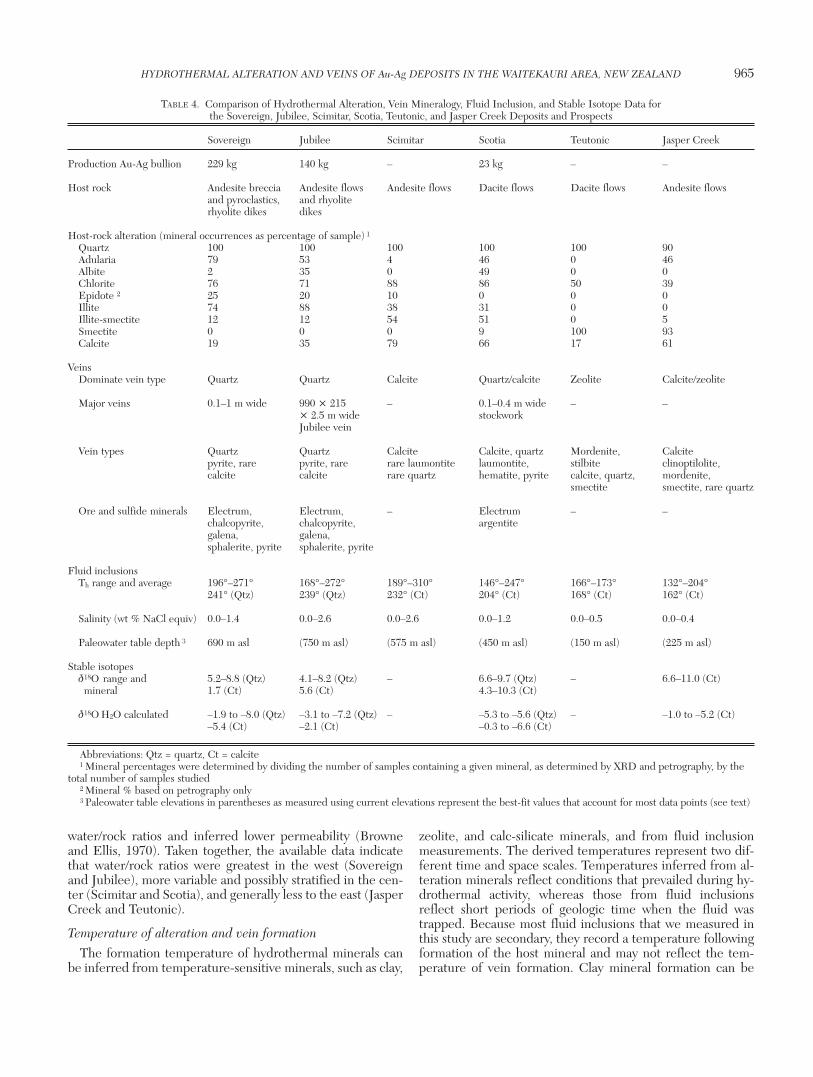
water/rock ratios and inferred lower permeability (Browneand Ellis, 1970). Taken together, the available data indicatethat water/rock ratios were greatest in the west (Sovereignand Jubilee), more variable and possibly stratified in the cen-ter (Scimitar and Scotia), and generally less to the east (JasperCreek and Teutonic).
Temperature of alteration and vein formation
The formation temperature of hydrothermal minerals canbe inferred from temperature-sensitive minerals, such as clay,
zeolite, and calc-silicate minerals, and from fluid inclusionmeasurements. The derived temperatures represent two dif-ferent time and space scales. Temperatures inferred from al-teration minerals reflect conditions that prevailed during hy-drothermal activity, whereas those from fluid inclusionsreflect short periods of geologic time when the fluid wastrapped. Because most fluid inclusions that we measured inthis study are secondary, they record a temperature followingformation of the host mineral and may not reflect the tem-perature of vein formation. Clay mineral formation can be
HYDROTHERMAL ALTERATION AND VEINS OF Au-Ag DEPOSITS IN THE WAITEKAURI AREA, NEW ZEALAND 965
0361-0128/98/000/000-00 $6.00 965
TABLE 4. Comparison of Hydrothermal Alteration, Vein Mineralogy, Fluid Inclusion, and Stable Isotope Data for the Sovereign, Jubilee, Scimitar, Scotia, Teutonic, and Jasper Creek Deposits and Prospects
Sovereign Jubilee Scimitar Scotia Teutonic Jasper Creek
Production Au-Ag bullion 229 kg 140 kg – 23 kg – –
Host rock Andesite breccia Andesite flows Andesite flows Dacite flows Dacite flows Andesite flowsand pyroclastics, and rhyolite rhyolite dikes dikes
Host-rock alteration (mineral occurrences as percentage of sample) 1
Quartz 100 100 100 100 100 90Adularia 79 53 4 46 0 46Albite 2 35 0 49 0 0Chlorite 76 71 88 86 50 39Epidote 2 25 20 10 0 0 0Illite 74 88 38 31 0 0Illite-smectite 12 12 54 51 0 5Smectite 0 0 0 9 100 93Calcite 19 35 79 66 17 61
VeinsDominate vein type Quartz Quartz Calcite Quartz/calcite Zeolite Calcite/zeolite
Major veins 0.1–1 m wide 990 × 215 – 0.1–0.4 m wide – –× 2.5 m wide stockworkJubilee vein
Vein types Quartz Quartz Calcite Calcite, quartz Mordenite, Calcite pyrite, rare pyrite, rare rare laumontite laumontite, stilbite clinoptilolite, calcite calcite rare quartz hematite, pyrite calcite, quartz, mordenite,
smectite smectite, rare quartz
Ore and sulfide minerals Electrum, Electrum, – Electrum – –chalcopyrite, chalcopyrite, argentitegalena, galena, sphalerite, pyrite sphalerite, pyrite
Fluid inclusionsTh range and average 196°–271° 168°–272° 189°–310° 146°–247° 166°–173° 132°–204°
241° (Qtz) 239° (Qtz) 232° (Ct) 204° (Ct) 168° (Ct) 162° (Ct)
Salinity (wt % NaCl equiv) 0.0–1.4 0.0–2.6 0.0–2.6 0.0–1.2 0.0–0.5 0.0–0.4
Paleowater table depth 3 690 m asl (750 m asl) (575 m asl) (450 m asl) (150 m asl) (225 m asl)
Stable isotopesδ18O range and 5.2–8.8 (Qtz) 4.1–8.2 (Qtz) – 6.6–9.7 (Qtz) – 6.6–11.0 (Ct)
mineral 1.7 (Ct) 5.6 (Ct) 4.3–10.3 (Ct)
δ18O H2O calculated –1.9 to –8.0 (Qtz) –3.1 to –7.2 (Qtz) – –5.3 to –5.6 (Qtz) – –1.0 to –5.2 (Ct)–5.4 (Ct) –2.1 (Ct) –0.3 to –6.6 (Ct)
Abbreviations: Qtz = quartz, Ct = calcite1 Mineral percentages were determined by dividing the number of samples containing a given mineral, as determined by XRD and petrography, by the
total number of samples studied2 Mineral % based on petrography only3 Paleowater table elevations in parentheses as measured using current elevations represent the best-fit values that account for most data points (see text)
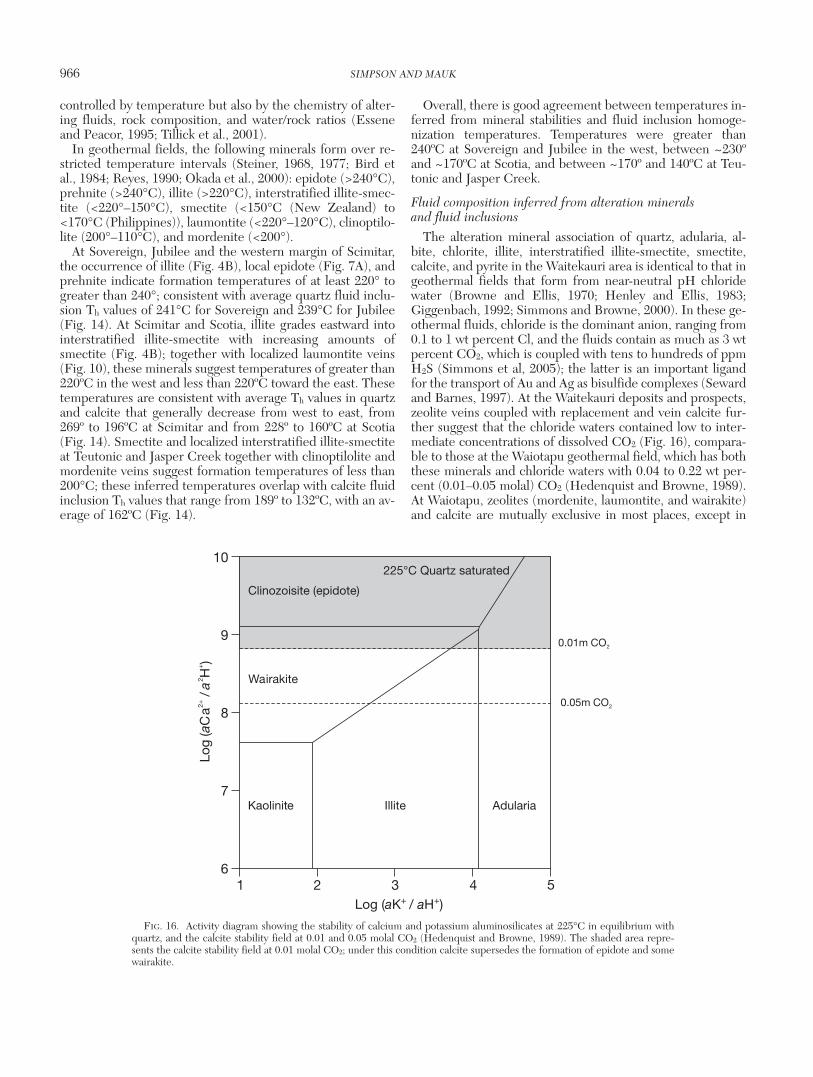
controlled by temperature but also by the chemistry of alter-ing fluids, rock composition, and water/rock ratios (Esseneand Peacor, 1995; Tillick et al., 2001).
In geothermal fields, the following minerals form over re-stricted temperature intervals (Steiner, 1968, 1977; Bird etal., 1984; Reyes, 1990; Okada et al., 2000): epidote (>240°C),prehnite (>240°C), illite (>220°C), interstratified illite-smec-tite (<220°–150°C), smectite (<150°C (New Zealand) to<170°C (Philippines)), laumontite (<220°–120°C), clinoptilo-lite (200°–110°C), and mordenite (<200°).
At Sovereign, Jubilee and the western margin of Scimitar,the occurrence of illite (Fig. 4B), local epidote (Fig. 7A), andprehnite indicate formation temperatures of at least 220° togreater than 240°; consistent with average quartz fluid inclu-sion Th values of 241°C for Sovereign and 239°C for Jubilee(Fig. 14). At Scimitar and Scotia, illite grades eastward intointerstratified illite-smectite with increasing amounts ofsmectite (Fig. 4B); together with localized laumontite veins(Fig. 10), these minerals suggest temperatures of greater than220ºC in the west and less than 220ºC toward the east. Thesetemperatures are consistent with average Th values in quartzand calcite that generally decrease from west to east, from269º to 196ºC at Scimitar and from 228º to 160ºC at Scotia(Fig. 14). Smectite and localized interstratified illite-smectiteat Teutonic and Jasper Creek together with clinoptilolite andmordenite veins suggest formation temperatures of less than200°C; these inferred temperatures overlap with calcite fluidinclusion Th values that range from 189º to 132ºC, with an av-erage of 162ºC (Fig. 14).
Overall, there is good agreement between temperatures in-ferred from mineral stabilities and fluid inclusion homoge-nization temperatures. Temperatures were greater than240ºC at Sovereign and Jubilee in the west, between ~230ºand ~170ºC at Scotia, and between ~170º and 140ºC at Teu-tonic and Jasper Creek.
Fluid composition inferred from alteration minerals and fluid inclusions
The alteration mineral association of quartz, adularia, al-bite, chlorite, illite, interstratified illite-smectite, smectite,calcite, and pyrite in the Waitekauri area is identical to that ingeothermal fields that form from near-neutral pH chloridewater (Browne and Ellis, 1970; Henley and Ellis, 1983;Giggenbach, 1992; Simmons and Browne, 2000). In these ge-othermal fluids, chloride is the dominant anion, ranging from0.1 to 1 wt percent Cl, and the fluids contain as much as 3 wtpercent CO2, which is coupled with tens to hundreds of ppmH2S (Simmons et al, 2005); the latter is an important ligandfor the transport of Au and Ag as bisulfide complexes (Sewardand Barnes, 1997). At the Waitekauri deposits and prospects,zeolite veins coupled with replacement and vein calcite fur-ther suggest that the chloride waters contained low to inter-mediate concentrations of dissolved CO2 (Fig. 16), compara-ble to those at the Waiotapu geothermal field, which has boththese minerals and chloride waters with 0.04 to 0.22 wt per-cent (0.01–0.05 molal) CO2 (Hedenquist and Browne, 1989).At Waiotapu, zeolites (mordenite, laumontite, and wairakite)and calcite are mutually exclusive in most places, except in
966 SIMPSON AND MAUK
0361-0128/98/000/000-00 $6.00 966
Adularia
Log (aK+ / aH+)
Log
(C
a/
Ha
a2+
+2
)
IlliteKaolinite
Wairakite
Clinozoisite (epidote)
16
7
8
9
10
2 3 4 5
225°C Quartz saturated
0.05m CO2
0.01m CO2
FIG. 16. Activity diagram showing the stability of calcium and potassium aluminosilicates at 225°C in equilibrium withquartz, and the calcite stability field at 0.01 and 0.05 molal CO2 (Hedenquist and Browne, 1989). The shaded area repre-sents the calcite stability field at 0.01 molal CO2; under this condition calcite supersedes the formation of epidote and somewairakite.
rare cavities where they alternate in bands. In the Waitekauriarea, thin zeolite veins commonly contain calcite; mordeniteand clinoptilolite are both overgrown by massive and platycalcite, whereas massive or platy calcite is typically overgrownby laumontite. In the latter case, calcite has thin dissolutionrims where it is overgrown by laumontite, which indicates dis-equilibrium and mutually exclusive deposition. This alterna-tion may be due to fluctuating CO2 concentrations caused byboiling. Boiling results in the deposition of platy calcite nearthe point of boiling (Simmons and Christenson, 1994) withpartitioning of CO2 into the steam phase resulting in chloridewaters with significantly lower CO2 content that would favorzeolite formation. Because zeolites and calcite alternate, thissuggests that the boiling front fluctuated in position, resultingin variable CO2 concentrations that at times favored zeoliteformation, and at other times, calcite deposition (Fig. 16).The lack of zeolite minerals at Sovereign and Jubilee suggeststhat greater CO2 concentrations here may have precludedtheir formation.
Thin quartz-hematite veins with or without pyrite togetherwith hematite alteration of the host rock are locally developedon the eastern margin of Scotia, as well as at Teutonic andJasper Creek. The presence of hematite suggests change inthe redox state of the chloride waters that stabilized hematiteover pyrite (Vaughan and Craig, 1997). This change couldhave resulted from the mixing of chloride waters with moreoxygenated groundwaters.
Fluid inclusion final ice melting temperatures of –1.5ºC forquartz and calcite correspond to dilute fluids with apparentsalinities of up to 2.6 wt percent NaCl (Bodnar, 1993). Alter-natively, these final ice melting temperatures could be ex-plained by up to 3.5 wt percent CO2 (Hedenquist and Hen-ley, 1985). The presence of zeolites indicates low CO2
concentrations in the fluids (Hedenquist and Browne, 1989),so most of the freezing point depression likely reflects dis-solved salts rather than dissolved gas. Despite uncertaintywith respect to the timing of secondary inclusion entrapment,the apparent salinity and/or CO2 content for fluid inclusionsappear to decrease from the west to east, possibly due to boil-ing and gas loss, dilution due to mixing, or a combination ofthe two (Fig. 13B).
Late-stage replacement calcite and overprinting smectite,possibly together with some monomineralic calcite veins, mayhave formed from steam-heated CO2-rich waters. In geother-mal fields, these steam-heated CO2-rich fluids that containgreater than 1 wt percent CO2 originate by the condensationof CO2 into shallow groundwaters that occur above and drapethe margins of the upflow zone (Hedenquist and Stewart,1985; Simmons and Christenson, 1994). During thermal col-lapse, these steam-heated CO2-rich waters can also descendinto and overprint the former zone of upwelling chloride wa-ters (Simmons et al., 2000) with heating of these fluids on de-scent resulting in the deposition of calcite due to its inversesolubility with respect to temperature (Ellis, 1959; Simmonsand Christenson, 1994).
Depth of formation
The depth of vein formation below the paleowater tablecan be estimated from the trapping temperature and salinityof primary fluid inclusions that show evidence of boiling in
the form of coexisting liquid- and vapor-rich inclusions(Roedder, 1984). Under hydrostatic conditions (Haas, 1971),suspected primary, liquid-rich inclusions that coexist withvapor-rich inclusions in a quartz vein at Sovereign, with an av-erage trapping temperature (TT) of 253ºC and dilute salinity(<1 wt % NaCl equiv) indicate that the paleowater table was690 m above sea level relative to current elevations (Fig. 17).Paleowater table elevations above Jubilee, Scimitar, Scotia,Teutonic, and Jasper Creek have been estimated from sec-ondary inclusions in quartz and calcite and are based on sev-eral assumptions. At each of these locations the boiling pointfor depth curve is fitted for a single centrally located sampleusing the maximum Th value (excluding obvious outliers) andassumes entrapment under boiling conditions. Althoughthese samples did not show fluid inclusion evidence of boilingin the form of coexisting liquid-rich and vapor-rich inclusions,the occurrence of platy calcite, quartz pseudomorphs of platycalcite, vein adularia, and, indirectly, common replacementadularia (Fig. 17) indicate that the fluids were commonlyboiling throughout the Waitekauri area (Browne and Ellis,1970; Simmons and Christenson, 1994). The highest averageTh was used because this reflects the upper limit of tempera-ture conditions and corresponds to the highest elevation ofthe water table. However, because these calculations arebased on secondary inclusions trapped at some time followingvein formation, they may not represent the temperature atwhich the host mineral formed and therefore the estimatedpaleodepths must be treated with caution. Nonetheless, thepaleowater table above the Jubilee, Scimitar, Scotia, JasperCreek, and Teutonic prospects, based on the maximum Th ofsecondary inclusions and assuming boiling conditions, occursat 750, 575, 450, 225, and 150 m above sea level (using cur-rent elevations), respectively, spanning a 600-m vertical inter-val and corresponding to at least 35 to 560 m erosion (Fig.17). These calculated depths indicate that the veins in the eastformed at shallower levels than the veins to the west. A shal-low formation depth at Jasper Creek is consistent with the oc-currence of a hydrothermal eruption breccia that presumablyhad a maximum focal depth of 90 m, as documented in geot-hermal fields (cf. Browne and Lawless, 2001). Moreover, al-teration and vein minerals indicate cooler temperatures offormation to the east, suggesting shallower formation depthsconsistent with the fluid inclusion calculations.
Figure 18 shows the estimated paleowater table elevationsfrom the Waitekauri area determined for a greater number ofsamples. Most depths were calculated based on secondary in-clusions using the highest Th values and assuming trappingunder near-boiling conditions. If all inclusions were trappedat the same time from fluids in a single geothermal system,then the water table above Sovereign, Jubilee, and JasperCreek appears to be relatively flat lying (3°–10° dip), but issteeply inclined (35°–47° dip) over Scotia and Scimitar. Al-though a steeply dipping water table is possible, it is morelikely that the apparent steep dip is due to postmineralizationoffset by one or more faults with a combined vertical dis-placement of more than 100 m or the trapping of inclusionsat different times from either a heating or cooling fluid. Al-ternatively, this apparent slope may represent the boundarybetween two separate geothermal systems that formed at dif-ferent times and at different elevations.
HYDROTHERMAL ALTERATION AND VEINS OF Au-Ag DEPOSITS IN THE WAITEKAURI AREA, NEW ZEALAND 967
0361-0128/98/000/000-00 $6.00 967
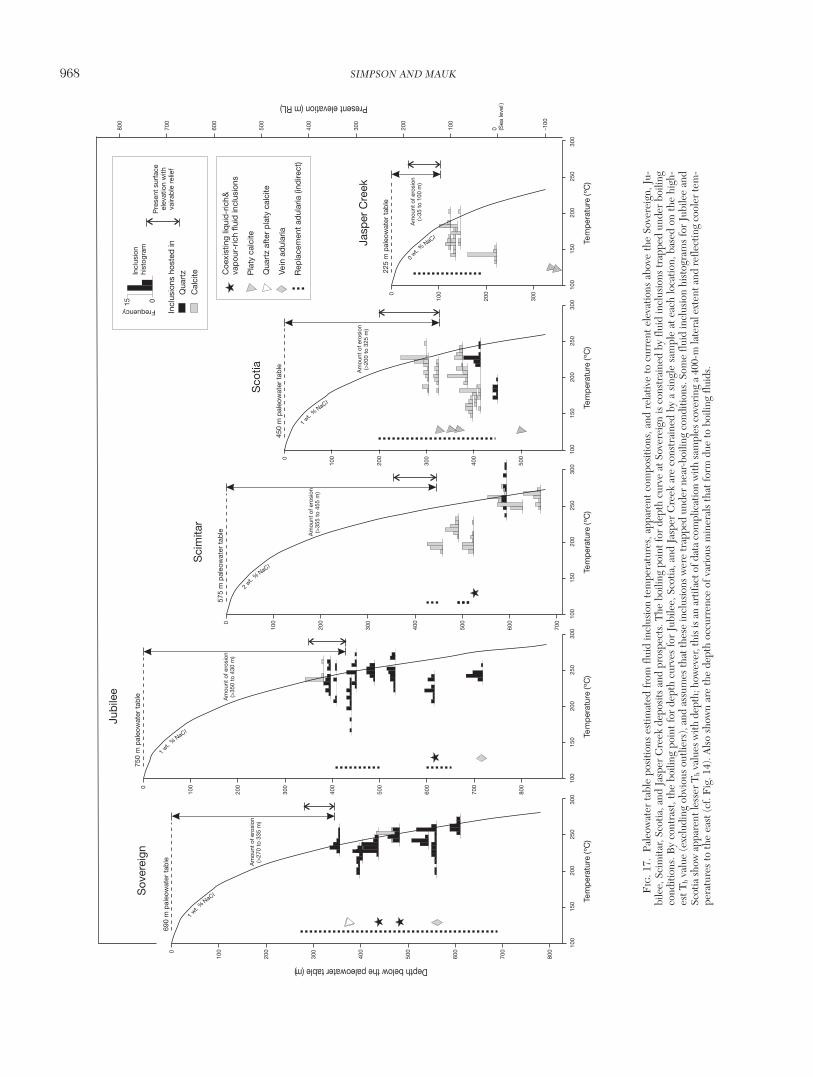
968 SIMPSON AND MAUK
0361-0128/98/000/000-00 $6.00 968
Incl
usio
ns h
oste
d in
Incl
usio
nhi
stog
ram
Qua
rtz C
oexi
stin
g liq
uid
-ric
h &
vap
our-
rich
fluid
incl
usio
ns
Pla
ty c
alci
te
Qua
rtz
afte
r p
laty
cal
cite
Vein
ad
ular
ia
Rep
lace
men
t ad
ular
ia (i
ndire
ct)
15 0
Frequency
Cal
cite
Pre
sent
sur
face
elev
atio
n w
ithva
irab
le r
elie
f
Am
ount
of e
rosi
on(>
270
tom
)33
5
690
m p
aleo
wat
er t
able
1
wt.%
NCa
l
1wt.
C
%Na
l
1wt.
C%
Nal
0wt.
C
%Na
l2
wt.
C%
Nal
Sov
erei
gn
Tem
per
atur
e (º
C)
300
200
100
250
1000
200
300
500
600
700
800
400
Jasp
er C
reek
300
Am
ount
of e
rosi
on(>
35 t
o 10
0 m
)
225
m p
aleo
wat
er t
able
Tem
per
atur
e (º
C)
200
150
250
100
1000
200
300
Depth below the paleowater table (m)
500
600
400
300
100
0 (Sea
leve
l)
200
700
-100
800
150
1000
200
300
500
600
700
800
400
Jub
ilee
Am
ount
of e
rosi
on(>
350
to 4
30 m
)
750
m p
aleo
wat
er t
able
Tem
per
atur
e (º
C)
300
200
100
250
150
1000
200
300
500
400
Sco
tia Am
ount
of e
rosi
on(>
200
to 3
25 m
)
450
m p
aleo
wat
er t
able
Tem
per
atur
e (º
C)
300
200
150
250
100
Present elevation (m RL)
Tem
per
atur
e (º
C)
1000
200
300
500
600
700
400
Sci
mita
r
Am
ount
of e
rosi
on(>
355
to 4
55 m
)
575
m p
aleo
wat
er t
able
300
200
250
150
100
FIG
. 17.
Pal
eow
ater
tab
le p
ositi
ons
estim
ated
fro
m f
luid
incl
usio
n te
mpe
ratu
res,
app
aren
t co
mpo
sitio
ns, a
nd r
elat
ive
to c
urre
nt e
leva
tions
abo
ve t
he S
over
eign
, Ju-
bile
e, S
cim
itar,
Scot
ia, a
nd J
aspe
r C
reek
dep
osits
and
pro
spec
ts. T
he b
oilin
g po
int f
or d
epth
cur
ve a
t Sov
erei
gn is
con
stra
ined
by
fluid
incl
usio
ns tr
appe
d un
der
boili
ngco
nditi
ons.
By
cont
rast
, the
boi
ling
poin
t for
dep
th c
urve
s fo
r Ju
bile
e, S
cotia
, and
Jas
per
Cre
ek a
re c
onst
rain
ed b
y a
sing
le s
ampl
e at
eac
h lo
catio
n, b
ased
on
the
high
-es
t Th
valu
e (e
xclu
ding
obv
ious
out
liers
), an
d as
sum
es th
at th
ese
incl
usio
ns w
ere
trap
ped
unde
r ne
ar-b
oilin
g co
nditi
ons.
Som
e flu
id in
clus
ion
hist
ogra
ms
for
Jubi
lee
and
Scot
ia s
how
app
aren
t les
ser
Th
valu
es w
ith d
epth
; how
ever
, thi
s is
an
artif
act o
f dat
a co
mpl
icat
ion
with
sam
ples
cov
erin
g a
400-
m la
tera
l ext
ent a
nd r
efle
ctin
g co
oler
tem
-pe
ratu
res
to th
e ea
st (
cf. F
ig. 1
4). A
lso
show
n ar
e th
e de
pth
occu
rren
ce o
f var
ious
min
eral
s th
at fo
rm d
ue to
boi
ling
fluid
s.
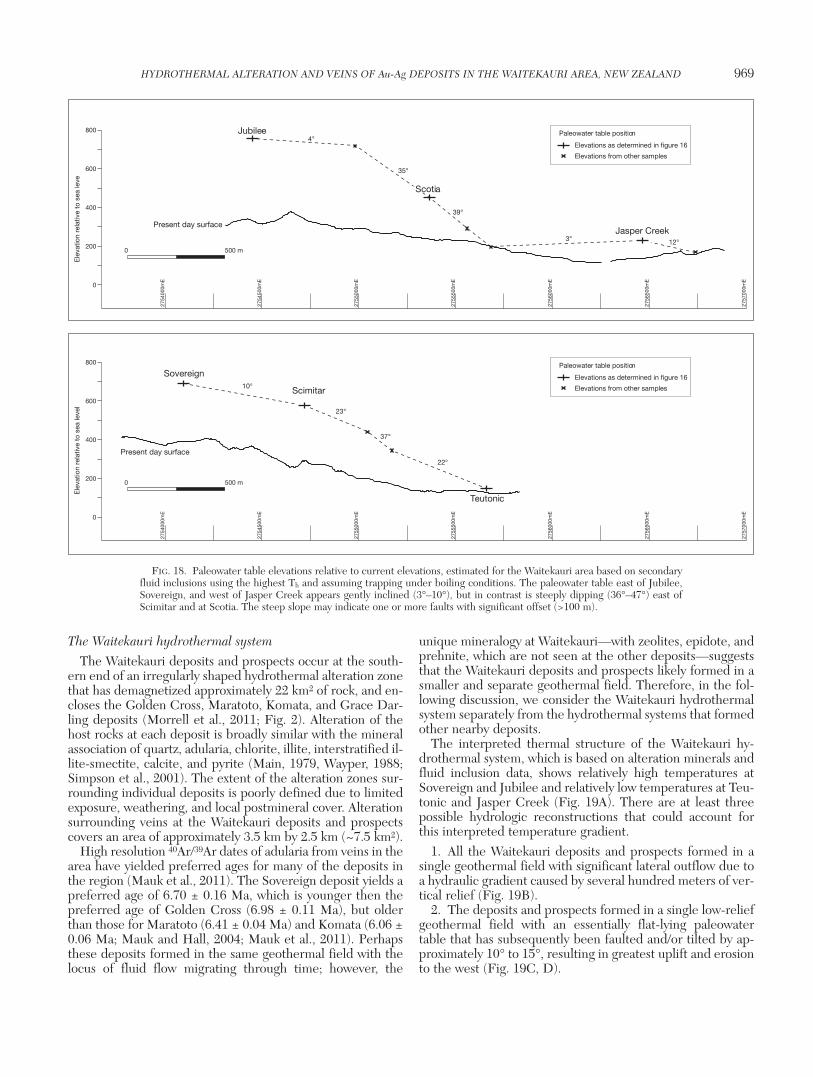
The Waitekauri hydrothermal system
The Waitekauri deposits and prospects occur at the south-ern end of an irregularly shaped hydrothermal alteration zonethat has demagnetized approximately 22 km2 of rock, and en-closes the Golden Cross, Maratoto, Komata, and Grace Dar-ling deposits (Morrell et al., 2011; Fig. 2). Alteration of thehost rocks at each deposit is broadly similar with the mineralassociation of quartz, adularia, chlorite, illite, interstratified il-lite-smectite, calcite, and pyrite (Main, 1979, Wayper, 1988;Simpson et al., 2001). The extent of the alteration zones sur-rounding individual deposits is poorly defined due to limitedexposure, weathering, and local postmineral cover. Alterationsurrounding veins at the Waitekauri deposits and prospectscovers an area of approximately 3.5 km by 2.5 km (~7.5 km2).
High resolution 40Ar/39Ar dates of adularia from veins in thearea have yielded preferred ages for many of the deposits inthe region (Mauk et al., 2011). The Sovereign deposit yields apreferred age of 6.70 ± 0.16 Ma, which is younger then thepreferred age of Golden Cross (6.98 ± 0.11 Ma), but olderthan those for Maratoto (6.41 ± 0.04 Ma) and Komata (6.06 ±0.06 Ma; Mauk and Hall, 2004; Mauk et al., 2011). Perhapsthese deposits formed in the same geothermal field with thelocus of fluid flow migrating through time; however, the
unique mineralogy at Waitekauri—with zeolites, epidote, andprehnite, which are not seen at the other deposits—suggeststhat the Waitekauri deposits and prospects likely formed in asmaller and separate geothermal field. Therefore, in the fol-lowing discussion, we consider the Waitekauri hydrothermalsystem separately from the hydrothermal systems that formedother nearby deposits.
The interpreted thermal structure of the Waitekauri hy-drothermal system, which is based on alteration minerals andfluid inclusion data, shows relatively high temperatures atSovereign and Jubilee and relatively low temperatures at Teu-tonic and Jasper Creek (Fig. 19A). There are at least threepossible hydrologic reconstructions that could account forthis interpreted temperature gradient.
1. All the Waitekauri deposits and prospects formed in asingle geothermal field with significant lateral outflow due toa hydraulic gradient caused by several hundred meters of ver-tical relief (Fig. 19B).
2. The deposits and prospects formed in a single low-reliefgeothermal field with an essentially flat-lying paleowatertable that has subsequently been faulted and/or tilted by ap-proximately 10° to 15°, resulting in greatest uplift and erosionto the west (Fig. 19C, D).
HYDROTHERMAL ALTERATION AND VEINS OF Au-Ag DEPOSITS IN THE WAITEKAURI AREA, NEW ZEALAND 969
0361-0128/98/000/000-00 $6.00 969
2754
500m
E
2754
000m
E
2755
000m
E
2755
500m
E
2756
000m
E
2756
500m
E
2757
000m
E
0
200
400
600
Jubilee
Elevations as determined in figure 16
Paleowater table position
Present day surface
Present day surface
Ele
vatio
n re
lativ
e to
sea
leve
Elevations from other samples
Jasper Creek
800
39°
35°
4°
3° 12°500 m0
Scotia
2754
500m
E
2754
000m
E
2755
000m
E
2755
500m
E
2756
000m
E
2756
500m
E
2757
000m
E
0
200
400
600
Sovereign Elevations as determined in figure 16
Paleowater table position
Ele
vatio
n re
lativ
e to
sea
leve
l
Elevations from other samples
Teutonic
Scimitar
800
37°
22°
23°
10°
500 m0
FIG. 18. Paleowater table elevations relative to current elevations, estimated for the Waitekauri area based on secondaryfluid inclusions using the highest Th and assuming trapping under boiling conditions. The paleowater table east of Jubilee,Sovereign, and west of Jasper Creek appears gently inclined (3°–10°), but in contrast is steeply dipping (36°–47°) east ofScimitar and at Scotia. The steep slope may indicate one or more faults with significant offset (>100 m).
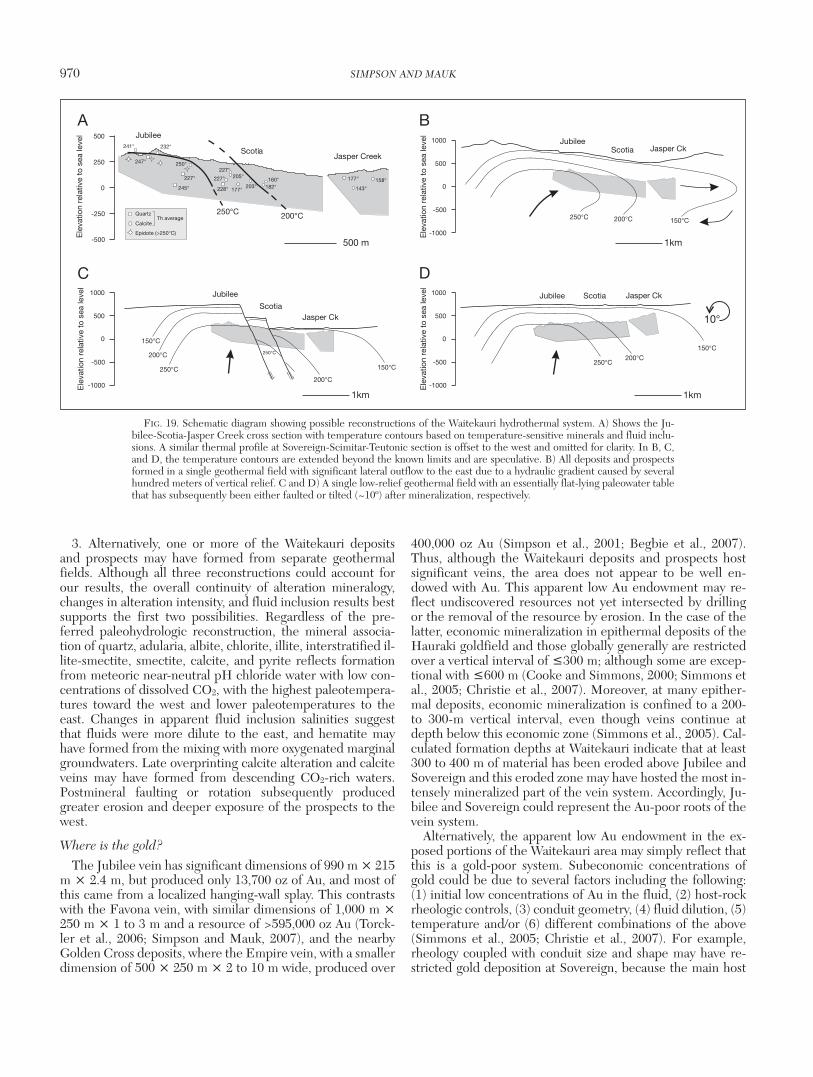
3. Alternatively, one or more of the Waitekauri depositsand prospects may have formed from separate geothermalfields. Although all three reconstructions could account forour results, the overall continuity of alteration mineralogy,changes in alteration intensity, and fluid inclusion results bestsupports the first two possibilities. Regardless of the pre-ferred paleohydrologic reconstruction, the mineral associa-tion of quartz, adularia, albite, chlorite, illite, interstratified il-lite-smectite, smectite, calcite, and pyrite reflects formationfrom meteoric near-neutral pH chloride water with low con-centrations of dissolved CO2, with the highest paleotempera-tures toward the west and lower paleotemperatures to theeast. Changes in apparent fluid inclusion salinities suggestthat fluids were more dilute to the east, and hematite mayhave formed from the mixing with more oxygenated marginalgroundwaters. Late overprinting calcite alteration and calciteveins may have formed from descending CO2-rich waters.Postmineral faulting or rotation subsequently producedgreater erosion and deeper exposure of the prospects to thewest.
Where is the gold?
The Jubilee vein has significant dimensions of 990 m × 215m × 2.4 m, but produced only 13,700 oz of Au, and most ofthis came from a localized hanging-wall splay. This contrastswith the Favona vein, with similar dimensions of 1,000 m ×250 m × 1 to 3 m and a resource of >595,000 oz Au (Torck-ler et al., 2006; Simpson and Mauk, 2007), and the nearbyGolden Cross deposits, where the Empire vein, with a smallerdimension of 500 × 250 m × 2 to 10 m wide, produced over
400,000 oz Au (Simpson et al., 2001; Begbie et al., 2007).Thus, although the Waitekauri deposits and prospects hostsignificant veins, the area does not appear to be well en-dowed with Au. This apparent low Au endowment may re-flect undiscovered resources not yet intersected by drillingor the removal of the resource by erosion. In the case of thelatter, economic mineralization in epithermal deposits of theHauraki goldfield and those globally generally are restrictedover a vertical interval of ≤300 m; although some are excep-tional with ≤600 m (Cooke and Simmons, 2000; Simmons etal., 2005; Christie et al., 2007). Moreover, at many epither-mal deposits, economic mineralization is confined to a 200-to 300-m vertical interval, even though veins continue atdepth below this economic zone (Simmons et al., 2005). Cal-culated formation depths at Waitekauri indicate that at least300 to 400 m of material has been eroded above Jubilee andSovereign and this eroded zone may have hosted the most in-tensely mineralized part of the vein system. Accordingly, Ju-bilee and Sovereign could represent the Au-poor roots of thevein system.
Alternatively, the apparent low Au endowment in the ex-posed portions of the Waitekauri area may simply reflect thatthis is a gold-poor system. Subeconomic concentrations ofgold could be due to several factors including the following:(1) initial low concentrations of Au in the fluid, (2) host-rockrheologic controls, (3) conduit geometry, (4) fluid dilution, (5)temperature and/or (6) different combinations of the above(Simmons et al., 2005; Christie et al., 2007). For example,rheology coupled with conduit size and shape may have re-stricted gold deposition at Sovereign, because the main host
970 SIMPSON AND MAUK
0361-0128/98/000/000-00 $6.00 970
A
C
Jasper CkJasper Creek
JubileeJubilee
ScotiaScotia
1km
250°C250°C
200°C200°C150°C
1000
0
-500
-1000
500
232°
250°
245°
227°
247°
241°
227°205°
203°177°
160°
228°
227° 158°177°
143°
Jasper Ck
Jubilee
Scotia
250°C
250°C
200°C
200°C
150°C
150°C
1000
0
-500
-1000
500
250
0
-250
500
1km
500 m
Jasper CkJubilee Scotia
250°C200°C
150°C
1000
0
-500
-1000
500 10°
1km
Th averageQuartz
Calcite
Epidote (>250°C)
182°
Ele
vatio
n re
lativ
e to
sea
leve
lE
leva
tion
rela
tive
to s
ea le
vel
D
B
Ele
vatio
n re
lativ
e to
sea
leve
lE
leva
tion
rela
tive
to s
ea le
vel
-500
FIG. 19. Schematic diagram showing possible reconstructions of the Waitekauri hydrothermal system. A) Shows the Ju-bilee-Scotia-Jasper Creek cross section with temperature contours based on temperature-sensitive minerals and fluid inclu-sions. A similar thermal profile at Sovereign-Scimitar-Teutonic section is offset to the west and omitted for clarity. In B, C,and D, the temperature contours are extended beyond the known limits and are speculative. B) All deposits and prospectsformed in a single geothermal field with significant lateral outflow to the east due to a hydraulic gradient caused by severalhundred meters of vertical relief. C and D) A single low-relief geothermal field with an essentially flat-lying paleowater tablethat has subsequently been either faulted or tilted (~10º) after mineralization, respectively.
rock is a breccia and the veins are narrow and discontinuous(cf. Brathwaite et al., 2001b). At Jasper Creek, fluid dilutionmay have reduced metal solubility and suppressed Au depo-sition (e.g., Simmons and Browne, 2000).
Many of the above factors relate to the physical conditionsof the gold “trap” but another fundamental control on the for-mation of an economic deposits is the Au-carrying capacity ofthe fluid. For example, the Taupo volcanic zone, NewZealand, contains both low and high gas geothermal fieldswhere there is a close relationship between concentrations ofCO2, H2S, and Au content; the CO2 concentration also con-trols alteration mineralogy (calcite, zeolites, calc-silicates;Brown, 1986; Giggenbach, 1992, 1997; Brown and Simmons,2003; Simmons and Brown, 2006, 2007). Geothermal fieldswith high levels of dissolved CO2 and H2S, and that haveabundant calcite but lack zeolites can deposit ore-grade pre-cipitates of Au and Ag on the back pressure plates of some ge-othermal wells (Weissberg, 1969; Brown, 1986; Krupp andSeward, 1987; Hedenquist, 1990). In contrast, geothermalfields with low CO2 and H2S concentrations, which have com-mon zeolites, epidote, and little to no calcite, lack gold pre-cipitates (Steiner, 1977; Rosenburg et al., 2009). Therefore,the occurrence of zeolites in the Waitekauri area may suggestthat at least some veins formed from hydrothermal fluids withlow gas and gold concentrations, and therefore the Au en-dowment at Waitekauri may originally have been low.
ConclusionsDrill core reveals spatial and temporal zonation of hy-
drothermal alteration and vein minerals along a 3-km-longcomposite cross section and a reconstructed 600-m verticalextent of epithermal adularia-sericite deposits and prospectsin the Waitekauri area. Hydrothermal alteration is typicallyintense, although it becomes more variable and weaker to-ward the east; alteration and vein minerals show zoned distri-butions (this study), which is reflected by the geochemistry ofthe altered host rocks (Booden et al., 2011). Alteration min-erals and fluid inclusion microthermometry suggest that theSovereign and Jubilee deposits formed at relatively highertemperatures and at greater depth than the Jasper Creekprospect. Several reconstructions of the overall hydrothermalsystem are possible, but we infer that the Sovereign and Ju-bilee deposits formed in the main upflow area, whereasJasper Creek formed toward the margin. The Waitekauri de-posits and prospects may have formed in a single geothermalfield with (1) significant lateral outflow to the east due to a hy-draulic gradient imposed by several hundred meters of verti-cal relief or (2) in a single low-relief geothermal field with aflat-lying paleowater table that was faulted or tilted by 10º to15º following mineralization. In either case, the greatest ero-sion (~300–400 m) has occurred at the Jubilee and Sovereigndeposits and these may represent the roots of a more exten-sive vein network that has largely been eroded.
AcknowledgmentsWe thank Newmont Waihi Operations for providing access
to the Waitekauri deposits and prospects, and for permissionto publish. We thank Ross McConnochie, Rohan Worland,and Lorranace Torckler for geologic maps and for many in-sightful discussions. Kevin Faure of GNS Science is thanked
for stable isotope analyses. Finally, we thank Economic Geol-ogy reviewers Peter Vikre, David John, and Jim Saunders forconstructive reviews. This research has been funded by New-mont Waihi Operations and the New Zealand Foundation forResearch Science and Technology (FRST).
REFERENCESAdams, C.J., Graham, I.J., Seward, D., and Skinner, D.N.B., 1994,
Geochronological and geochemical evolution of the late Cenozoic volcan-ism in the Coromandel peninsula, New Zealand: New Zealand Journal ofGeology and Geophysics, v. 37, p. 359–379.
Begbie, M.J., Spörli, K.B., and Mauk, J.L., 2007, Structural evolution of theGolden Cross epithermal Au-Ag deposit, New Zealand: ECONOMIC GEOL-OGY, v. 102, p. 873–892.
Bell, J.M., and Fraser, C., 1912, The Geology of the Waihi-Tairua subdivi-sion, Hauraki, Auckland; New Zealand: New Zealand Geological SurveyBulletin, v. 15, 193p.
Bird, D.K., Schiffman, P., Elders, W.A., Williams, A.E., and McDowell, S.D.,1984, Calc-silicate mineralization in active geothermal systems: ECONOMIC
GEOLOGY, v. 79, p. 671–695.Bodnar, R.J., 1993, Revised equation and table for determining the freezing
point depression of H2O-NaCl solutions: Geochimica et CosmochimicaActa, v. 57, p. 683–684.
Bodnar, R.J, Reynolds, T.J., and Kuehn, C.A., 1985, Fluid inclusions sys-tematics in epithermal system: Reviews in Economic Geology, v. 2, p.73–98.
Booden, M.A., Mauk, J.L., and Simpson, M.P., 2011, Quantifying metasoma-tism in epithermal Au-Ag deposits: A case study from the Waitekauri area,New Zealand: ECONOMIC GEOLOGY, v. 106, p. 999–1030.
Brathwaite, R.L., and Christie, A.B., 1996, Geology of the Waihi area, scale1:50 000: Institute of Geological and Nuclear Sciences, Geological map 21,1 sheet, 64 p.
Brathwaite, R.L., Simpson, M.P., Faure, K., and Skinner, D.N.B., 2001a,Telescoped porphyry Cu-Mo-Au mineralization, advanced argillic alter-ation and quartz-sulphide-gold-anhydrite veins in the Thames district, NewZealand: Mineralium Deposita, v. 36, p. 623-640.
Brathwaite, R.L., Cargill, H.J., Christie, A.B., and Swain, A., 2001b, Controlson the distribution of veining in andesite- and rhyolite- hosted gold-silverepithermal deposits of the Hauraki Goldfields, New Zealand: MineraliumDeposita, v. 36, p. 1–12.
Briggs, R.M., Houghton, B.F., McWilliams, M., and Wilson, C.N.J., 2005,40Ar/39Ar ages of silicic volcanic rocks in the Tauranga-Kaimai area, NewZealand: Dating the transition between volcanism in the Coromandel arcand the Taupo volcanic zone: New Zealand Journal of Geology and Geo-physics, v. 48, p. 459–469.
Brown, K.L., 1986, Gold deposition from geothermal discharges in NewZealand: ECONOMIC GEOLOGY, v. 81, p. 979–983.
Brown, K.L., and Simmons, S.F., 2003, Precious metals in high temperaturegeothermal systems in New Zealand: Geothermics, v. 32, p. 619–625.
Browne, P. R.L., 1978, Hydrothermal alteration in active geothermal fields:Annual Reviews in Earth and Planetary Sciences, v. 6, p. 229–250.
Browne, P.R.L., and Ellis, A.J., 1970, The Ohaki-Broadlands hydrothermalarea, New Zealand: Mineralogy and related geochemistry: American Jour-nal Science, v. 269, p. 97–131.
Browne, P.R.L., and Lawless, J. V., 2001, Characteristics of hydrothermaleruptions, with examples from New Zealand and elsewhere: Earth ScienceReviews, v. 52, p. 299–331.
Christie, A.B., Simpson, M.P., Brathwaite, R.L., Mauk, J L., and Simmons,S.F., 2007, Epithermal Au-Ag and Related Deposits of the Hauraki Gold-field, Coromandel volcanic zone, New Zealand: ECONOMIC GEOLOGY, v.102, 785–816.
Conrad, M.E., Petersen, U., and O’Neil, J.R., 1992, Evolution of an Au-Aghydrothermal system: The Tayoltita mine, Durango, Mexico: ECONOMIC
GEOLOGY, v. 87, p. 1451–1474.Cooke, D.R., and Simmons, S.F., 2000, Characteristics and genesis of ep-
ithermal gold deposits: Reviews in Economic Geology, v. 13, p. 221–244.de Ronde, C.E.J., and Blattner, P., 1988, Hydrothermal alteration, stable iso-
topes, and fluid inclusions of the Golden Cross epithermal gold deposit,Waihi, New Zealand: ECONOMIC GEOLOGY, v. 83, p. 895–917.
Downey, J.F., 1935, Gold mines of the Hauraki district: Wellington, NewZealand, Government Printer, 315 p.
HYDROTHERMAL ALTERATION AND VEINS OF Au-Ag DEPOSITS IN THE WAITEKAURI AREA, NEW ZEALAND 971
0361-0128/98/000/000-00 $6.00 971
Ellis, A.J., 1959, The solubility of calcite in carbon dioxide solutions: TheAmerican Journal of Science, v. 257, p. 354–365.
Essene, E.J. and Peacor, D.R., 1995, Clay mineral thermometry—a criticalperspective: Clays and Clay Minerals, v. 43, p. 540–553.
Faure, K., and Brathwaite, R.L., 2006, Mineralogical and stable isotope stud-ies of gold-arsenic mineralisation in the Sams Creek peralkaline porphyriticgranite, South Island, New Zealand: Mineralium Deposita, v. 40, p.802–827.
Friedman, I. and O’Neil, J.R., 1977, Compilation of stable isotope fractiona-tion factors of geochemical interest: U.S. Geological Survey Prof. Paper440-KK, 12 p.
Giggenbach, W.F., 1992, Magma degassing and mineral deposition in hy-drothermal systems along convergent plate boundaries: ECONOMIC GEOL-OGY, v. 87, p. 1927–1944.
——1997, The origin and evolution of fluids in magmatic-hydrothermal sys-tems, in Barnes, H.L., ed., Geochemistry of hydrothermal ore deposits, 3rd
ed.: New York, John Wiley and Sons, p. 737–796.Grodzicki, K.R., Mauk, J.L., McConnochie, R., and Rowland, J.V., 2007,
Structural geology of the Sovereign prospect, lower Waitekauri Valley,Hauraki goldfield, New Zealand: Proceedings of the 40th Annual Confer-ence of the New Zealand Branch of the Australasian Institute of Miningand Metallurgy (AusIMM), p. 103–108.
Haas, J.L., 1971, The effects of salinity on the maximum thermal gradient ofa hydrothermal system at hydrostatic pressure: ECONOMIC GEOLOGY, v. 66,p. 940–946.
Hartley, R.J., and McConnochie, M.R., 1991, Jubilee prospect, Waitekauriproject PL 31-1777, Cyprus Gold NZ Ltd: Crown Minerals, Ministry ofEconomic Development, Wellington, unpublished open-file mineral reportMR3043, 36 p.
Haworth, A.V., and Briggs, R.M., 2006, Epithermal Au-Ag mineralization inthe Lower Waitekarui valley, Hauraki goldfield: Australasian Institute ofMining and Metallurgy (AusIMM) Monograph 25 p. 157–162.
Hedenquist, J.W., 1990, The thermal and geochemical structure of theBroadlands-Ohaaki geothermal system, New Zealand: Geothermics, v. 19,p. 151–185.
Hedenquist, J.W., and Browne, P.R.L., 1989, The evolution of the Waiotapugeothermal system, New Zealand, based on the chemical and isotopic com-position of its fluids, minerals and rocks: Geochimica et CosmochimicaActa, v. 53, p. 2235–2257.
Hedenquist, J.W., and Henley, R.W., 1985, Effect of CO2 on freezing pointdepression measurements of fluid inclusions: Evidence from active systemsand application to epithermal studies: ECONOMIC GEOLOGY, v. 80, p.1379–1406.
Hedenquist, J.W., and Stewart, M.K., 1985, Natural CO2-rich steam-heatedwaters at Broadlands, New Zealand: Their chemistry, distribution and cor-rosive nature: Proceedings Geothermal Resources Council Annual Meet-ing, Transactions, v. 9, p. 245–250.
Henley, R.W., and Ellis, A.J., 1983, Geothermal systems ancient and modern:A geochemical review: Earth Science Reviews, v. 19, p. 1–50.
Henley, R.H., and Hedenquist, J.W., 1986, Introduction to the geochemistryof active and fossil geothermal systems: Berlin-Stuttgart, Gerbruder Born-trager, Monograph Series Mineral Deposits, v. 26, p. 1–22.
Hoskin, P.W.O., Wysoczanski, R.J., and Briggs, R.M., 1998, U-Pb age deter-mination of “Lenticulite” (Owharoa Ignimbrite) at Waikino, Waihi area,Coromandel peninsula, and implications [abs.]: Geological Society of NewZealand Miscellaneous Publication 101A, p. 123.
Houghton, B.F., Wilson, C.J.N., McWilliams, M.O., Lanphere, M.A.,Weaver, S.D., Briggs, R.M., and Pringle, M.S., 1995, Chronology and dy-namics of a large silicic magmatic system: central Taupo volcanic zone, NewZealand: Geology, v. 23, p. 13–16.
Hudson, D.M., 2003, Epithermal alteration and mineralization in the Com-stock district, Nevada: ECONOMIC GEOLOGY, v. 98, p. 367–386.
Inoue, A., and Utada, M., 1983, Further investigations of a conversion seriesof dioctahedral mica/smectites in the Shinzan hydrothermal alteration area,northeast Japan: Clays and Clay Minerals, v. 31, p. 401–412.
John, D.A., Hofstra, A. H., Fleck, R.J., Brummer, J.E., and Saderholm, E.C.,2003, Geologic setting and genesis of the Mule Canyon low-sulfidation ep-ithermal gold-silver deposit, north-central Nevada: ECONOMIC GEOLOGY, v.98, p. 425–464.
Krupp, R.E., and Seward, T.M., 1987, The Rotokawa geothermal system,New Zealand: An active epithermal gold-depositing environment: ECO-NOMIC GEOLOGY, v. 82, p. 1109–1129.
Main, J.V., 1979, Precious metal bearing veins of the Maratoto-Wentwortharea, Hauraki goldfield, New Zealand: New Zealand Journal of Geologyand Geophysics, v. 22, p. 41–51.
Mas, A., Guisseau, D., Patrier Mas, P., Beaufort, D., Genter, A., Sanjuan, B.,and Girard, J. P., 2006, Clay minerals related to the hydrothermal activityof the Bouillante geothermal field (Guadeloupe): Journal of Volcanologyand Geothermal Research, v. 158, p. 380–400.
Matsuhisa, Y., Goldsmith, J.R., and Clayton, R.N., 1979, Oxygen isotopicfractionation in the system quartz-albite-anorthite-water: Geochimica etCosmochimica Acta, v. 43, p. 1131–1140.
Mauk, J.L., and Hall, C.M., 2004, 40Ar/39Ar ages of adularia from Golden Cross,Neavesville, and Komata epithermal deposits, Hauraki goldfield, NewZealand: New Zealand Journal of Geology and Geophysics, v. 47, p. 227–231.
Mauk, J.L., Hall, C.M, Chesley, J.T., and Barra, F., 2011, Punctuated evolu-tion of a large epithermal province: The Hauraki goldfield, New Zealand:ECONOMIC GEOLOGY, v. 106, p. 921–943.
McOnie, A., 2001, Waitekauri project—progress report, exploration permit40 344, year ending March 2001, Coeur Gold New Zealand Ltd: CrownMinerals, Ministry of Economic Development, Wellington, unpublishedopen-file mineral report MR3874, 15 p.
Moore, D.M., and Reynolds, R.C., 1997, XRD and the identification andanalysis of clay minerals (second edition): Oxford University Press, 378 p.
Morrell, A.E., Locke, C.A., Cassidy, J., Mauk, J.L., 2011, Geophysical charac-teristics of adularia-sericite epithermal gold-silver deposits in the Waihi-Wait-ekauri region, New Zealand: ECONOMIC GEOLOGY, v. 106, p. 1031– 1041.
Mortimer, N., Herzer, R.H., Gans, P.B., Laporte-Magoni, C., Calvert, A.T.,and Bosch, D., 2007, Oligocene-Miocene tectonic evolution of the SouthFiji basin and Northland Plateau, SW Pacific Ocean: Evidence from petrol-ogy and dating of dredged rocks: Marine Geology, v. 237, p. 1–24.
Nicholson, K.N., Black, P.M., Hoskin, P.W.O., and Smith, I.E.M., 2004, Sili-cic volcanism and back-arc extension related to migration of the late Cain-ozoic Australian-Pacific plate boundary: Journal of Volcanology and Geot-hermal Research, v. 131, p. 295–306.
Okada, H., Yasudaa, Y., Yagi, M., and Kaia, K., 2000, Geology and fluid chem-istry of the Fushime geothermal field, Kyushu, Japan: Geothermics, v. 29,p. 279–311.
Reyes, A.G., 1990, Petrology of Philippine geothermal systems and the ap-plication of alteration mineralogy to their assessment; Journal of Volcanol-ogy and Geothermal Research, v. 43, p. 279–309.
Reynolds, R.C., 1980, Interstratified clay minerals, in Brindley, G,W., andBrown, G., eds., Crystal structures of clay minerals and their X-ray identi-fication: Mineralogical Society of London, p. 249–303.
Roedder, E., 1984, Fluid inclusions: Reviews in Mineralogy, v. 12, 644 p.Rosenburg, M.D., Bignall, G., and Rae, A.J., 2009, The geological framework
of the Wairakei-Tauhara geothermal system, New Zealand: Geothermics, v.38, p. 72–84.
Seward, T.M., and Barnes, H.L., 1997, Metal transport by hydrothermal flu-ids, in Barnes, H.L., ed., Geochemistry of hydrothermal ore deposits, 3rdedition: John Wiley and Sons, Inc, p. 435–486.
Simmons, S.F., and Brown, K.L., 2006, Gold in magmatic hydrothermal so-lutions and the rapid formation of a giant ore deposit: Nature, v. 314, p.288–291.
——2007, The flux of gold and related metals through a volcanic arc, Taupovolcanic zone, New Zealand: Geology, v. 35, p. 1099–1102.
Simmons, S.F., and Browne, P.R.L., 2000, Hydrothermal minerals and pre-cious metals in the Broadlands-Ohaaki geothermal system: Implications forunderstanding low-sulfidation epithermal environments: ECONOMIC GEOL-OGY, v. 95, p. 971–1000.
Simmons, S.F., and Christenson, B.W., 1994, Origins of calcite in a boilinggeothermal system: American Journal Science, v. 294, p. 361–400.
Simmons, S.F., Arehart, G., Simpson, M.P., Mauk, J.L., 2000, Origin of mas-sive calcite veins in the Golden Cross, low-sulfidation epithermal Au-Agdeposit, New Zealand, ECONOMIC GEOLOGY, v. 95, p. 99–112.
Simmons, S.F., White, N.C., and John, D., 2005, Geological characteristics ofepithermal precious and base metal deposits: ECONOMIC GEOLOGY 100thANNIVERSARY VOLUME, p. 485–522.
Simpson, C.R.J., Mauk, J.L., and Arehart, G., 1995, The formation of bandedepithermal quartz veins at the Golden Cross mine, Waihi, New Zealand:Australasian Institute of Mining and Metallurgy, Pacrim Congress 1995,Auckland, New Zealand, Nov. 19–22, p. 545–550.
Simpson, M.P., and Mauk, J.L., 2007, The Favona epithermal gold-silver de-posit, Waihi, New Zealand: Hydrothermal alteration, hydrologic evolutionand implications for exploration: ECONOMIC GEOLOGY, v. 102, p. 817–839.
972 SIMPSON AND MAUK
0361-0128/98/000/000-00 $6.00 972
Simpson, M.P., Simmons, S.F., and Mauk, J.L., 2001, Hydrothermal alter-ation and hydrologic evolution of the Golden Cross epithermal Au-Ag de-posit, New Zealand: ECONOMIC GEOLOGY, v. 96, p. 773–796.
Skinner, D.N.B., 1986, Neogene volcanism of the Hauraki volcanic region:Royal Society of New Zealand Bulletin, v. 23, p. 20–47.
——1995, Geology of the Mercury Bay area: Institute of Geological and Nu-clear Sciences geological map 17, scale 1:50,000, 1 sheet, 56 p.
Steiner, A., 1968, Clay minerals in hydrothermally altered rocks at Wairakei,New Zealand: Clays and Clay Minerals, v. 16, p. 193–213.
——1977, The Wairakei geothermal area, North Island, New Zealand: NewZealand Geological Survey Bulletin, 90, 136 p.
Sterner, S.M., 1992, Homogenization of fluid inclusions to the vapor phase:The apparent homogenization phenomenon: ECONOMIC GEOLOGY, v. 87, p.1616–1623.
Tillick, D.A., Peacor, D.R., Mauk, J.L., and Peacor, D.R., 2001, Genesis ofdioctahedral phyllosilicates during hydrothermal alteration of volcanicrocks: 1. The Golden Cross epithermal ore deposit, New Zealand: Claysand Clay Minerals, v. 49, p. 126–140.
Torckler, L.K., McKay, D., and Hobbins, J., 2006, Geology and exploration ofthe Favona Au-Ag deposit, Waihi, Hauraki goldfield: Australasian Instituteof Mining and Metallurgy Monograph 25 p. 179–184.
Vaughan, D.J., and Craig, J.R., 1997, Sulfide ore mineral stability, morpholo-gies, and intergowth textures, in Barnes, H.L., ed., Geochemistry of hy-drothermal ore deposits, 3rd edition: John Wiley and Sons, Inc, p. 367–434.
Watanabe, T., 1981, Identification of illite/montmorillonite interstratifica-tions by X-ray diffraction: Journal Mineralogical Society Japan, SpecialIssue, v. 15, 32–41. (in Japanese)
Wayper, R.Y., 1988, Petrology of the Komata gold-silver epithermal ore de-posit, Coromandel peninsula, New Zealand: Unpublished M.Sc. thesis,Wellington, Victoria, University of Wellington, 152 p.
Weissberg, B.G, 1969, Gold-silver ore-grade precipitates from New Zealandthermal waters: ECONOMIC GEOLOGY, v. 64, p. 95–108.
White, D.E., 1955, Thermal springs and epithermal ore deposits: ECONOMICGEOLOGY 50th ANNIVERSARY VOLUME, p. 99–154.
——1981, Active geothermal systems and hydrothermal ore deposits: ECO-NOMIC GEOLOGY 75th ANNIVERSARY VOLUME, p. 392–423.
White, P.D., 1991, Progress report on Scotia prospect PL 31-1777, Wait-ekauri Valley: Cyprus Gold NZ Ltd. Crown Minerals, Ministry of EconomicDevelopment, Wellington, unpublished open-file mineral report MR3051,34 p.
HYDROTHERMAL ALTERATION AND VEINS OF Au-Ag DEPOSITS IN THE WAITEKAURI AREA, NEW ZEALAND 973
0361-0128/98/000/000-00 $6.00 973


![Performance Evaluation of Wireless Sensor …tarjomefa.com/wp-content/uploads/2019/01/F1184-TarjomeFa...Conference, Aug. 2010, pp V2-650 - V2-653. [4] C. Gomez and J. Paradells, "Wireless](https://static.fdocuments.net/doc/165x107/5fe33c64187b633ab4079b8a/performance-evaluation-of-wireless-sensor-conference-aug-2010-pp-v2-650-.jpg)