TrueZONE for Hydronic Control - PEX - Radiant Heat - Radiant
CODES AND STANDARDS ENHANCEMENT INITIATIVE (CASE)
Hydronic Low Temperature Radiant Cooling
Systems
2013 California Building Energy Efficiency Standards
California Utilities Statewide Codes and Standards Team September 2011
This report was prepared by the California Statewide Utility Codes and Standards Program and funded by the California utility customers under the auspices of the California Public Utilities Commission.
Copyright 2011 Pacific Gas and Electric Company, Southern California Edison, SoCalGas, SDG&E.
All rights reserved, except that this document may be used, copied, and distributed without modification.
Neither PG&E, SCE, SoCalGas, SDG&E, nor any of its employees makes any warranty, express of implied; or assumes any legal liability or
responsibility for the accuracy, completeness or usefulness of any data, information, method, product, policy or process disclosed in this document; or
represents that its use will not infringe any privately-owned rights including, but not limited to, patents, trademarks or copyrights
Measure Information Template – Hydronic Radiant Cooling Page 2
2013 California Building Energy Efficiency Standards September 2011
CONTENTS
1. Purpose ........................................................................................................................ 4
2. Overview ....................................................................................................................... 5
3. Methodology................................................................................................................. 8
3.1 Data Collection on Status of Radiant Cooling Technologies .....................................................8
3.1.1 Literature Review.................................................................................................................8
3.1.2 Interviews with Manufacturers and Designers ....................................................................8
3.1.3 Review Field Monitored Data ..............................................................................................9
3.2 Simulation Tools Review ...........................................................................................................9
3.3 Building Energy Analysis ...........................................................................................................9
3.4 Stakeholder Meeting Process....................................................................................................10
4. Analysis and Results ................................................................................................. 11
4.1 Status of Radiant Cooling Technologies ..................................................................................11
4.1.1 Summary of Literature .......................................................................................................11
4.1.2 Summary of Interviews ......................................................................................................12
4.2 EnergyPlus Simulation Capabilities .........................................................................................15
4.2.1 Low Temperature Radiant System: Variable Volume .......................................................16
4.2.2 Low Temperature Radiant System: Constant Volume ......................................................21
4.3 Energy Simulation Analysis and Results..................................................................................27
4.3.1 Prototype Design ................................................................................................................27
4.3.2 Simulation Analysis Setup .................................................................................................28
4.3.3 Simulation Results .............................................................................................................32
4.3.4 Proposed ACM Recommendations ....................................................................................41
5. Recommended Language for the Standards Document, ACM Manuals, and the Reference Appendices ....................................................................................................... 43
6. Bibliography and Other Research ............................................................................ 44
6.1 Experts Consulted .....................................................................................................................44
6.2 Reports Reviewed .....................................................................................................................44
7. Appendix: Simulation Prototype Plan ...................................................................... 46

Measure Information Template – Hydronic Radiant Cooling Page 3
2013 California Building Energy Efficiency Standards September 2011
FIGURES
Figure 1: Projected Savings from Radiant Cooling .............................................................................. 12
Figure 2: 3D Rendition of Radiant Zones ............................................................................................ 29
Figure 3: Radiant System Inputs for Sensitivity Analysis .................................................................... 30
Figure 4: Radiant System Inputs for Annual Energy Savings Analysis ............................................... 31
Figure 5: Site Monitored Data July 5th 2010....................................................................................... 32
Figure 6: Modeled Space Mean Temperature vs. Site Data ................................................................. 33
Figure 7: Modeled Radiant CHW Supply and Temp July 5th
vs. Site Data ......................................... 34
Figure 8: Modeled Radiant CHW Supply and Temp March 4th
vs. Site Data ...................................... 34
Figure 9: Modeled Space Temperature – March 4th
vs. Site Data ........................................................ 35
Figure 10: Sensitivity of Zone Temperature to CHW Supply Temp .................................................... 36
Figure 11: Sensitivity of Heat Extraction from Slab to CHW Supply Temp ....................................... 36
Figure 12: Sensitivity Runs – Floor Slab Temperature (July 5th
) ......................................................... 37
Figure 13: Sensitivity Runs – Floor Slab Temperature (March 4th
) ..................................................... 38
Figure 14: Sensitivity Run – Slab CHW Supply Flow Rate (July 5th
) ................................................. 39
Figure 15: Sensitivity Run – Slab CHW Supply Flow Rate (March 4th
) .............................................. 39
Figure 16: Annual Energy Usage for Runs R1-R4 ............................................................................... 40
Figure 17: Energy Savings - Constant Temp, Variable Flow (R2) vs. Constant Temp, Flow (R1) ..... 40
Figure 18: Energy Savings -Variable Temp, Constant Flow (R3) vs. Constant Temp, Flow (R1) ...... 40
Figure 19: Energy Savings - Variable Temp, Variable Flow (R4) vs. Constant Temp, Flow (R1) ..... 40
Figure 20: Prototype Store Plan ............................................................................................................ 46
Measure Information Template – Hydronic Radiant Cooling Page 4
2013 California Building Energy Efficiency Standards September 2011
1. Purpose
Hydronic radiant cooling systems rely on chilled water flowing through pipes to distribute cooling
throughout a building rather than a conventional system that uses chilled air and ductwork. Radiant
cooling systems rely mainly on the direct cooling of occupants by radiative heat transfer, because the
pipes, which are commonly run through ceilings or floors, maintain cooler surface temperatures.
Because the radiative surface is typically a whole floor or ceiling surface, the water can be as warm as
65ºF and still provide comfort.
Due to water‘s superior ability to store and transport energy when compared to air, thermal energy
can be transported in water through pipes with lower pump energy than that used by fans to deliver
conditioned air in a building. By controlling water flow and temperature of water entering the
embedded water pipes, independent control of different areas of the building can be achieved.
In many climates, dehumidification is an important aspect of air conditioning. Radiant cooling
systems require exacting design and, possibly, added equipment and controls to assure that indoor
environments are comfortable and free from excess moisture that can result in surface condensation.
To maintain indoor air quality, a separate ventilation system to supply fresh air is needed.
This CASE topic proposes the creation of a dedicated system type in the nonresidential Alternative
Compliance Method (ACM) for modeling hydronic radiant cooling systems for the proposed design
when the performance method for compliance is used.
Measure Information Template – Hydronic Radiant Cooling Page 5
2013 California Building Energy Efficiency Standards September 2011
2. Overview
a. Measure Title Nonresidential ACM Capabilities to Model Radiant Cooling Systems
b. Description Provide an optional HVAC system type in the Nonresidential Alternative
Calculation Method (ACM) for hydronic floor-based radiant cooling
systems.
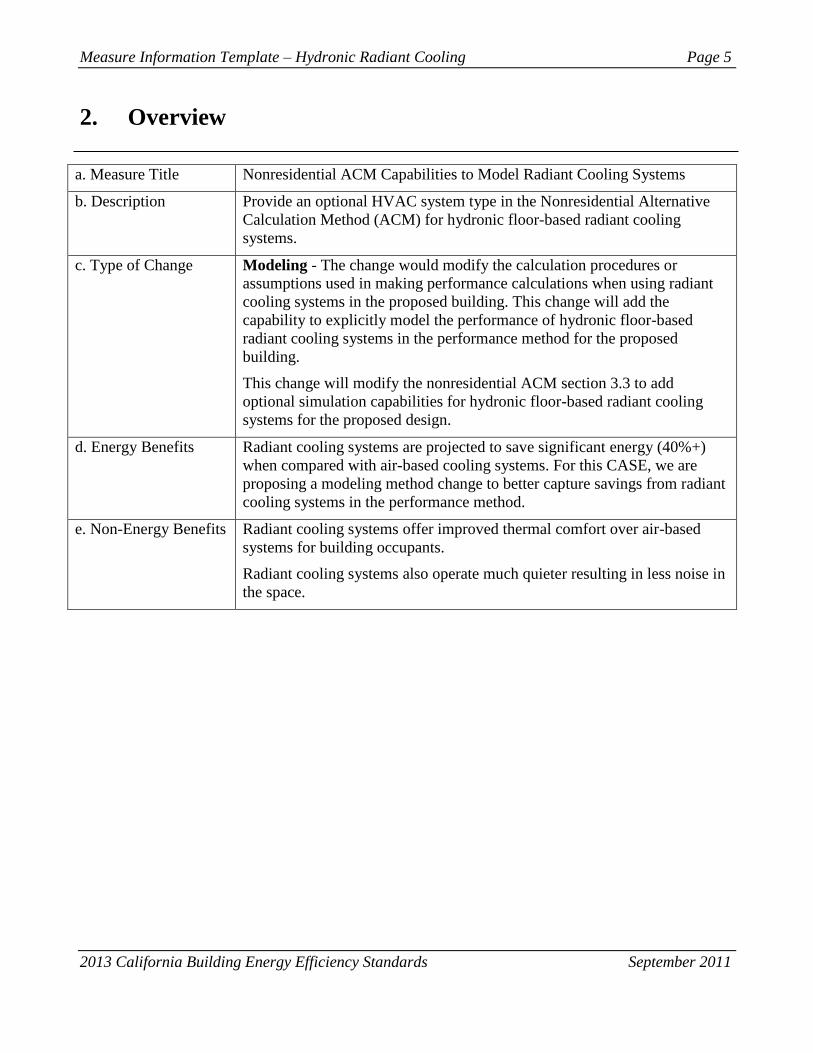
c. Type of Change Modeling - The change would modify the calculation procedures or
assumptions used in making performance calculations when using radiant
cooling systems in the proposed building. This change will add the
capability to explicitly model the performance of hydronic floor-based
radiant cooling systems in the performance method for the proposed
building.
This change will modify the nonresidential ACM section 3.3 to add
optional simulation capabilities for hydronic floor-based radiant cooling
systems for the proposed design.
d. Energy Benefits Radiant cooling systems are projected to save significant energy (40%+)
when compared with air-based cooling systems. For this CASE, we are
proposing a modeling method change to better capture savings from radiant
cooling systems in the performance method.
e. Non-Energy Benefits Radiant cooling systems offer improved thermal comfort over air-based
systems for building occupants.
Radiant cooling systems also operate much quieter resulting in less noise in
the space.
Measure Information Template – Hydronic Radiant Cooling Page 6
2013 California Building Energy Efficiency Standards September 2011
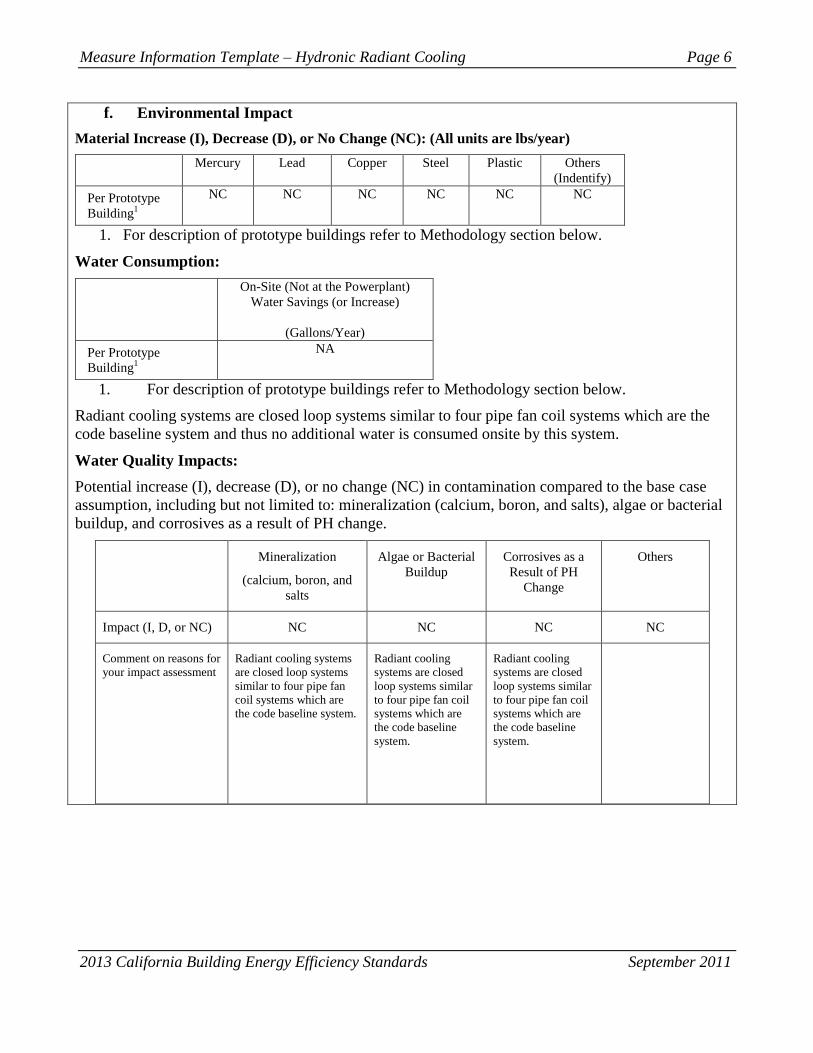
f. Environmental Impact
Material Increase (I), Decrease (D), or No Change (NC): (All units are lbs/year)
Mercury Lead Copper Steel Plastic Others
(Indentify)
Per Prototype
Building1
NC NC NC NC NC NC
1. For description of prototype buildings refer to Methodology section below.
Water Consumption:
On-Site (Not at the Powerplant)
Water Savings (or Increase)
(Gallons/Year)
Per Prototype
Building1
NA
1. For description of prototype buildings refer to Methodology section below.
Radiant cooling systems are closed loop systems similar to four pipe fan coil systems which are the
code baseline system and thus no additional water is consumed onsite by this system.
Water Quality Impacts:
Potential increase (I), decrease (D), or no change (NC) in contamination compared to the base case
assumption, including but not limited to: mineralization (calcium, boron, and salts), algae or bacterial
buildup, and corrosives as a result of PH change.
Mineralization
(calcium, boron, and
salts
Algae or Bacterial
Buildup
Corrosives as a
Result of PH
Change
Others
Impact (I, D, or NC) NC NC NC NC
Comment on reasons for
your impact assessment
Radiant cooling systems
are closed loop systems
similar to four pipe fan
coil systems which are
the code baseline system.
Radiant cooling
systems are closed
loop systems similar
to four pipe fan coil
systems which are
the code baseline
system.
Radiant cooling
systems are closed
loop systems similar
to four pipe fan coil
systems which are
the code baseline
system.

Measure Information Template – Hydronic Radiant Cooling Page 7
2013 California Building Energy Efficiency Standards September 2011
g.
Technology
Measures
Measure Availability:
Radiant cooling systems are readily available in the market and are manufactured by
several manufacturers. Radiant tubing systems are manufactured and sold by at least
three manufacturers in the state of California. In addition, components of radiant
systems such as manifolds, PEX piping, thermostats and other controls are readily
available for commercial use.
Useful Life, Persistence, and Maintenance:
Once properly installed, radiant cooling systems operate and last as long as traditional
hydronic heating and cooling systems such as four pipe fan coil systems.
h.
Performance
Verification
of the
Proposed
Measure
Current Acceptance Testing requirements in Title 24 as applicable to HVAC systems
and hydronic systems will be applicable to the measures proposed in this CASE topic.
i. Cost Effectiveness
No cost-effectiveness analysis is needed for this CASE topic since no mandatory or prescriptive
requirements are being proposed.
j. Analysis
Tools
EnergyPlus is needed to evaluate the energy use and peak demand use and savings for
hydronic radiant cooling systems.
k.
Relationship
to Other
Measures
There are no other measures directly related to this topic. This CASE supports the
California Energy Commission intent of opening nonresidential compliance analysis
to tools including EnergyPlus.
Measure Information Template – Hydronic Radiant Cooling Page 8
2013 California Building Energy Efficiency Standards September 2011
3. Methodology
This section describes the methodology that we followed to assess the measure availability, energy
savings and feasibility of the proposed code change. The key elements of the methodology are as
follows:
Data Collection
Review of Simulation Tool Capabilities
Savings Analysis
This work was publicly vetted through our stakeholder outreach process, which through in-person
meetings, webinars, email correspondence and phone calls, requested and received feedback on the
direction of the proposed changes. The stakeholder meeting process is described at the end of the
Methodology section.
3.1 Data Collection on Status of Radiant Cooling Technologies
HMG evaluated the availability, market readiness and savings potential for radiant cooling
technologies by collecting data from a combination of sources. We conducted a literature review of
scientific papers, journal articles, and industry publications; conducted interviews with manufacturers
and mechanical engineers; and held ongoing communications with leading research groups.
3.1.1 Literature Review
HMG conducted a literature review of the technical potential and applicability of hydronic radiant
cooling technologies as well as energy simulation modeling protocols for these systems. HMG
reviewed manufacturers‘ literature, research papers, conference presentations and reports on studies
conducted by leading national laboratories such as the Pacific Northwest National Laboratories
(PNNL) and National Renewable Energy Laboratory (NREL).
A short list of selected literature most relevant to the CASE topics is presented in Section 6. A
summary of the literature review is presented in Section 4.1.1.
3.1.2 Interviews with Manufacturers and Designers
HMG developed a comprehensive questionnaire to collect information about radiant cooling systems
from manufacturers, distributors, and practicing engineers who have experience with radiant cooling
technologies. Using the questionnaire, HMG collected information on the following topics:
Types of radiant cooling systems
Availability and sales channels
Relative market share of various types of radiant cooling systems
Costs (purchase and installation)
Performance ratings
Control strategies
Condensation control
Measure Information Template – Hydronic Radiant Cooling Page 9
2013 California Building Energy Efficiency Standards September 2011
Field validation of system performance
Occupant feedback on system operation
Interest in stakeholder process participation
The interviews were structured in sections, and questions were tailored differently for each trade
(manufacturer/ distributor/ engineer). Consequently, the questions were relevant to each interviewee,
and information was gathered for each stage in the process (manufacturing, distribution, design and
installation). Respondents were encouraged to give free-form answers, rather than chose from a
prescribed set of answers, to elicit feedback beyond the content of the specific question. HMG chose
this structure so that all relevant information could be gathered from the survey, even if a particular
issue was not explicitly asked on the survey. A copy of the survey is presented in the Appendix.
3.1.3 Review Field Monitored Data
HMG collaborated with the Western Cooling Efficiency Center (WCEC) staff who are evaluating the
performance of a radiant cooling system installed in a retail store. WCEC is working for a leading
retailer on energy analysis of a retail store in Sacramento, California that has a hydronic radiant
cooling system with pipes embedded in the floor slab under the main sales floor areas. This store also
uses an innovative method for providing cold water to the radiant system that combines fluid coolers,
chillers and refrigeration equipment that are staged to achieve optimal efficiency for both space
cooling and refrigeration equipment. The building also uses an indirect evaporative cooling system for
dedicated outdoor air supply (DOAS). This strategy is more complex than the average radiant cooling
installations and HMG‘s review concentrated on the performance of the radiant slab in response to the
temperature and flow rate of chilled water flowing through the slab.
3.2 Simulation Tools Review
HMG reviewed the capabilities of energy simulation tools to evaluate energy use of hydronic radiant
cooling technologies. This included a review of existing algorithms in the nonresidential Alternate
Calculation Method (ACM) for the 2008 Title 24 standards, the engineering manual for the DOE2.1 E
simulation tool, and the reference manuals for EnergyPlus.
In addition, HMG collaborated with a leading mechanical engineer – Peter Simmonds - with
extensive experience with designing radiant cooling systems to evaluate the simulation tools and
ACM requirements against the ‗real-world‘ applications and tools used by designers to design, specify
and verify radiant system operation.
3.3 Building Energy Analysis
HMG conducted energy simulation analysis using the EnergyPlus simulation engine for a hydronic
radiant cooling system with pipes embedded in the floor. The intent was to evaluate the capabilities of
the EnergyPlus simulation engine to simulate various control strategies that are commonly employed
for hydronic radiant cooling systems.
HMG developed a prototype design based on the radiantly cooled retail store in Sacramento described
in Section 4.3.1. Initial simulation runs were conducted to compare the EnergyPlus simulation results
with field monitored data. A set of sensitivity runs were then conducted by varying temperature and
flow-rate of water entering the radiant cooling pipes embedded in the floor. Finally, HMG conducted
Measure Information Template – Hydronic Radiant Cooling Page 10
2013 California Building Energy Efficiency Standards September 2011
a comparative study of annual energy use of various control strategies using the same prototype
design.
Final energy analysis and recommendations are described in Section 4 of this report.
3.4 Stakeholder Meeting Process
All of the main approaches, assumptions, and methods of analysis used in this proposal have been
presented for review at one of two public Nonresidential HVAC Stakeholder Meetings funded by the
California investor-owned utilities (Pacific Gas and Electric, Southern California Edison, and
Southern California Gas Company).
At each meeting, the utilities' CASE team asked for feedback on the proposed language and analysis
thus far. The CASE team then sent out a summary of the meeting discussion and a summary of
outstanding questions and issues.
A record of the Stakeholder Meeting presentations, summaries, and other supporting documents can
be found at www.calcodes.com.
Stakeholder meetings were held on the following dates and locations:
First HVAC Stakeholder Meeting: April 27th
2010, California Lighting Technology Center,
Davis, CA
Second HVAC Stakeholder Meeting: December 9th
2010, Webinar

Measure Information Template – Hydronic Radiant Cooling Page 11
2013 California Building Energy Efficiency Standards September 2011
4. Analysis and Results
This section describes our analysis and assumptions in detail.
4.1 Status of Radiant Cooling Technologies
4.1.1 Summary of Literature
HMG reviewed existing literature on calculation and simulation methods, savings estimates, costs and
validation results for radiant cooling systems.
Radiant cooling has received positive press recently due to successes with radiant cooling installations
by WalMart which has installed the system on an experimental basis in several stores. These high
efficiency prototype stores have been developed as a way to evaluate promising technologies that can
meet stringent cost-effectiveness criteria while also being on the leading edge of the efficiency
spectrum for retail stores.
In a December 2010 ASHRAE Journal article, Ian Doebber, Michael Deru (NREL) and Mike Moore
(Newpoprt Partners) provide a detailed case study of one such store in Sacramento. This store, named
as the high-efficiency prototype 6 or HE6 incorporates several efficiency features including hydronic
radiant cooling in the sales floor. The store decouples comfort cooling from space ventilation such
that a dedicated outdoor air supply (DOAS) system provides continuous ventilation as required by
Title 24 while the radiant cooling system provides sensible cooling. The DOAS system is also capable
of handling latent loads and provide sensible space cooling as needed if the radiant system does not
meet loads. The DOAS system used is an indirect evaporative cooling system. The radiant cooling
system itself is served cold water by a combination of chillers and fluid coolers that serve both the
need for the radiant system as well as chilled water for refrigeration systems. The store was modeled
by NREL using EnergyPlus to develop the control scheme and to explore various options for the
configuration of the radiant system prior to store construction.
The radiant system design for this high efficiency prototype made several changes from then standard
practices for radiant hydronic floor-based systems. As described in more detail in the following
section, installing radiant piping in the floor can be time consuming and adds significant costs to the
project. For this store, WalMart worked with the radiant system supplier to develop a rapid install
system consisting of pre-assembled pipe ‗mats‘ that can be easily rolled out on site rather than
installing individual pipe loops. Other measures to reduce first costs over a standard radiant floor
included reducing slab thickness, eliminating under-slab insulation, and specifying smaller diameter
tubing resting directly on the compacted gravel base below the slab.
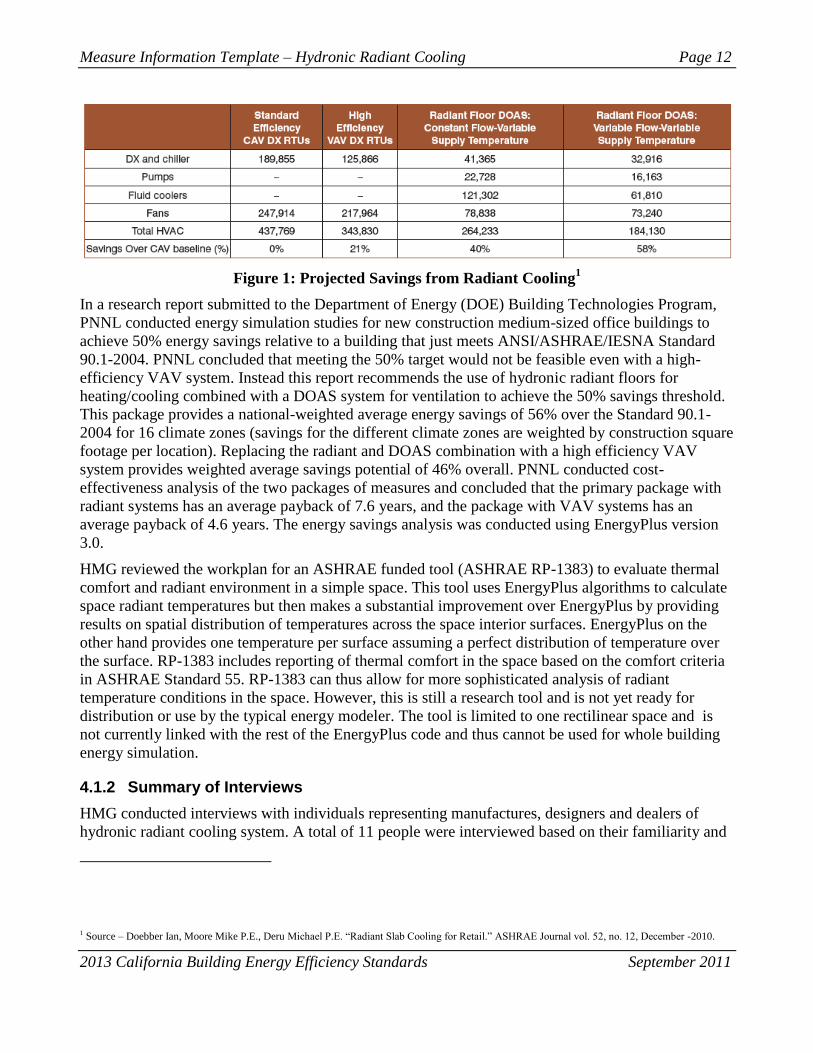
The resulting system is projected to save significant energy compared to a traditional air-based
cooling system based on energy simulations with EnergyPlus. The combined radiant cooling/DOAS
system is projected to save 40%-58% over a constant volume (CAV) air-based system for cooling and
ventilation and 19%-37% over a high efficiency variable air volume (VAV) system as seen in Figure
1. The savings are projected to be higher for the system that has variable flow of water into the radiant
piping as well as variable temperature of the water entering the piping.
Measure Information Template – Hydronic Radiant Cooling Page 12
2013 California Building Energy Efficiency Standards September 2011
Figure 1: Projected Savings from Radiant Cooling1
In a research report submitted to the Department of Energy (DOE) Building Technologies Program,
PNNL conducted energy simulation studies for new construction medium-sized office buildings to
achieve 50% energy savings relative to a building that just meets ANSI/ASHRAE/IESNA Standard
90.1-2004. PNNL concluded that meeting the 50% target would not be feasible even with a high-
efficiency VAV system. Instead this report recommends the use of hydronic radiant floors for
heating/cooling combined with a DOAS system for ventilation to achieve the 50% savings threshold.
This package provides a national-weighted average energy savings of 56% over the Standard 90.1-
2004 for 16 climate zones (savings for the different climate zones are weighted by construction square
footage per location). Replacing the radiant and DOAS combination with a high efficiency VAV
system provides weighted average savings potential of 46% overall. PNNL conducted cost-
effectiveness analysis of the two packages of measures and concluded that the primary package with
radiant systems has an average payback of 7.6 years, and the package with VAV systems has an
average payback of 4.6 years. The energy savings analysis was conducted using EnergyPlus version
3.0.
HMG reviewed the workplan for an ASHRAE funded tool (ASHRAE RP-1383) to evaluate thermal
comfort and radiant environment in a simple space. This tool uses EnergyPlus algorithms to calculate
space radiant temperatures but then makes a substantial improvement over EnergyPlus by providing
results on spatial distribution of temperatures across the space interior surfaces. EnergyPlus on the
other hand provides one temperature per surface assuming a perfect distribution of temperature over
the surface. RP-1383 includes reporting of thermal comfort in the space based on the comfort criteria
in ASHRAE Standard 55. RP-1383 can thus allow for more sophisticated analysis of radiant
temperature conditions in the space. However, this is still a research tool and is not yet ready for
distribution or use by the typical energy modeler. The tool is limited to one rectilinear space and is
not currently linked with the rest of the EnergyPlus code and thus cannot be used for whole building
energy simulation.
4.1.2 Summary of Interviews
HMG conducted interviews with individuals representing manufactures, designers and dealers of
hydronic radiant cooling system. A total of 11 people were interviewed based on their familiarity and
1 Source – Doebber Ian, Moore Mike P.E., Deru Michael P.E. ―Radiant Slab Cooling for Retail.‖ ASHRAE Journal vol. 52, no. 12, December -2010.
Measure Information Template – Hydronic Radiant Cooling Page 13
2013 California Building Energy Efficiency Standards September 2011
direct experience with radiant cooling projects. This included four design engineers, five
manufacturers and two owners‘ representatives. Following is a summary of the interview findings.
System Type
There are three system types available for floor-based radiant cooling systems
PEX pipe systems
PEX pipe ‗mats‘, and
Radiant panels
PEX pipe systems involve pipes embedded in the concrete floor at the time of construction of the slab,
usually 2‖-4‘ below the slab interior surface. To achieve this, each length of pipe needs to be
manually installed by tying the pipe to spacers that suspend the pipe at the specific depth below the
slab finished surface. A typical labor crew with some experience with radiant tubing can lay and tie
1000-1200 ft of pipes per person per day. At this rate, installing radiant pipes in large buildings can
add significant upfront labor costs. This is a significant barrier to greater adoption of radiant
technologies.
PEX pipe ‗mats‘ are a recent innovation in radiant tubing to overcome this barrier where the radiant
tubing comes in pre-installed sections and can be rolled out onsite in pre-determined lengths and
widths. This saves significant amount of time (manufacturer estimates range from 60%-80%
reduction in labor hours) and thus costs for installing radiant systems. Currently at least two
manufacturers have such modular radiant pipe mats available.
Radiant panels are more common in wooden floors where pre-assembled radiant panels are installed
underneath the wood floor. The panels themselves consist of metal or PEX piping that is then covered
with metal fins to distribute the effects of the chilled water in the pipe to a broader surface area of the
wooden floor.
Building Types Suitable for Radiant Cooling
Building types suitable for radiant cooling include institutional buildings, airports, museums,
universities, churches, commercial ―Big-Box‖ retail and office buildings with a lobby or foyer.
Radiant systems are also a good cooling solution for any building with high solar gains. Many recent
applications of radiant systems have been for projects seeking LEED certification.
Typical Radiant Cooling Piping Sizes
While radiant pipes can come in various sizes, the typical radiant cooling installation uses pipe sizes
between ½‖- ¾‖ diameter with 5/8‖ diameter being the most common. Typical spacing for radiant
pipes is 6‖-9‖ on center for cooling and can be up to 12‖ for heating.
Radiant Cooling Control Strategies
There are several control strategies employed in practice to regulate the performance of the radiant
cooling system. All of these involve supply water temperature and flow rate controls through the
pipes. The simplest and some argue the most stable control strategy is to keep both the supply
temperature and flow rate constant throughout the day. The radiant system is a self-regulating system
whereby the heat extraction from the slab increases as the delta between the slab temperature and
supply water temperature increases. Conversely, during periods of low cooling needs, there is
Measure Information Template – Hydronic Radiant Cooling Page 14
2013 California Building Energy Efficiency Standards September 2011
minimal heat extraction from the slab and the radiant system can ‗coast‘ at a set temperature. Variable
temperature with constant flow systems are getting more common, though some use variable
temperature and variable flow for optimized control which is the most complex strategy.
Radiant cooling systems can be controlled using similar thermostatic controls as air-based systems. In
addition, radiant systems can be controlled using the mean radiant temperature (MRT) and operative
temperature. The most common strategy though is to maintain a set zone air temperature similar to
traditional DX systems.
With radiant cooling systems, it is possible to ‗charge‘ the slab at night or off-peak with chilled water
and then let the system float during the peak periods to reduce peak demand. The argument is that the
slab is cold enough due to the night cooling and it retains enough of that ‗coolth‘ to maintain comfort
in the space during peak periods. Some people have claimed that this strategy can also save energy
compared to running the system continuously. However the general consensus of the interviews is
that the pre-cooling or night-cooling strategies are not used in the field due to concerns about the slab
being too cold in the early morning causing discomfort, but more importantly, the potential for
condensation on the slab surface. There are systems however that use an optimal start or adaptive
control that varies the temperature and/or flow of water to the slab to reduce energy use and provide
steady space conditions while avoiding condensation.
Radiant systems are designed to meet sensible loads only and do not provide any humidity control.
Dedicated air systems are required to handle the latent loads as well as minimum outdoor ventilation
requirements for buildings. Latent loads are not a big issue in California due to the weather
conditions. Interviewees expressed concerns about the amount of outdoor air supply mandated by
code for retail buildings which results in large DOAS systems and the energy use of these systems
makes the overall energy consumption higher for the radiant/DOAS combination.
Condensation Control
Condensation on the radiantly cooled slab surface is a cause for concern with radiant systems. This
can occur if the slab temperature is lower than the dewpoint of the ambient air in the space. To avoid
this issue it is standard practice to maintain the slab surface temperature at least a degree or two above
the dewpoint temperature of space air. To achieve this, the controls have to continuously monitor the
indoor dry bulb and humidity conditions as well as slab surface temperature to determine if the slab is
reaching dewpoint temperature. In the California context, this is made easier due to the warm/dry
summer conditions. In some installations, designers can set a threshold temperature based on typical
weather patterns in a given location. ASHRAE specifies slab surface temperature maintained at or
above 66˚ F to prevent floors from being too cold or causing condensation at typical indoor air
conditions.
Analyzing Radiant System Performance
Analyzing the performance of radiant cooling systems requires sophisticated analysis tools that are
currently not in prevalence for code compliance or energy efficiency analysis. Manufacturers have
developed and use their own finite element analysis programs to evaluate performance of radiant
cooling systems. Mechanical engineers who specialize in radiant cooling system design have also
developed custom spreadsheet tools based on first principles and rules of thumb. Of the commercially
available software, EnergyPlus is the only full-featured energy simulation software that can model the
performance of radiant cooling systems.
Measure Information Template – Hydronic Radiant Cooling Page 15
2013 California Building Energy Efficiency Standards September 2011
Of the rules of thumb for verifying radiant system performance, one that is most commonly cited is
the rate of heat extraction expected from a slab due to cold water flowing through the slab. The
consensus of experts and manufacturers is that 12-18 btu-h/sf heat extraction is a reasonable
performance for a floor-based radiant cooling system. In a building with high direct solar gains on the
slab, the system capacity can significantly increase to 25-32 btu-h/sf.
Costs of radiant systems vary significantly depending on the type of product used for radiant tubing in
the slab, the source for cold water for the radiant system and the complexity of controls. Typical costs
for newer rapid-install radiant piping mats range from $1-$2/sf for the radiant piping and associated
fittings and valves. Total installed cost of pipes depends on the type of radiant pipes, but a
conservative estimate from RS Means is about $4-$5.25/sf without the cost of controls. The cost of
controls ranges from $2-$30/sf depending on the number of sensors needed, zoning and the
complexity of the control scheme. The cost of the cooling water source (chiller/fluid cooler) is
separate from these costs as is the cost for the DOAS system. As a point of reference, researchers and
Pacific Northwest National Laboratory (PNNL) estimated the total cost of the entire system including
DOAS and central plant to be about $9.30/sf.
4.2 EnergyPlus Simulation Capabilities
EnergyPlus includes a fully integrated suite of HVAC system options that can model performance of
radiant cooling systems. EnergyPlus includes three major improvements over the DOE2.1E
simulation engine which enables it to calculate energy use for radiant cooling systems:
The space load calculation accounts for the radiant effects of interior surface temperature of
the envelope. The surface temperatures are calculated based on the transient heat transfer
through the envelope assemblies that accounts for thermal mass and bi-directional heat
transfer.
The envelope construction assemblies account for the storage of heat/cool through sources
embedded within the construction assemblies. Further these sources and the amount of
heat/cool that is added to the construction assembly can be controlled.
EnergyPlus allows more than one system type to be defined for a given space and allows the
user to set preference for which system takes priority over the other(s).
EnergyPlus offers a range of models for system modules for radiant/convective systems:
ZoneHVAC:Baseboard:Convective:Electric
ZoneHVAC:Baseboard:RadiantConvective:Water
ZoneHVAC:Baseboard:RadiantConvective:Steam
ZoneHVAC:Baseboard:RadiantConvective:Electric
ZoneHVAC:Baseboard:Convective:Water
ZoneHVAC:HighTemperatureRadiant
ZoneHVAC:LowTemperatureRadiant:Electric
ZoneHVAC:LowTemperatureRadiant:ConstantFlow
ZoneHVAC:LowTemperatureRadiant:VariableFlow

Measure Information Template – Hydronic Radiant Cooling Page 16
2013 California Building Energy Efficiency Standards September 2011
Of these system types, the two that are relevant to hydronic radiant cooling systems are the last two
‗LowTemperatureRadiant‘ systems highlighted in bold text above. Below are details of the simulation
inputs and outputs for these two modules.
4.2.1 Low Temperature Radiant System: Variable Volume
This system is zonal equipment that is intended to model any ―radiant system‖ where water is used to
supply/remove energy to/from a building surface (wall, ceiling, or floor). Control is accomplished by
throttling the hot or chilled water flow to the unit.
The radiant system model is self-contained in that it controls the system operation based on control
criteria defined by input syntax within the radiant cooling module and not via a zone thermostat such
as is used for forced air systems. If the radiant system is serving a zone with forced air equipment, the
radiant system will follow the priority order established by the zone thermostat but will still base its
response on the controls defined by the user for the radiant system. EnergyPlus allows the radiant
system to be controlled based on zone air temperature but this is achieved through inputs within the
radiant model and not referenced to the zone thermostat used for the forced air equipment.
Following are key inputs and outputs of the variable volume model excerpted from the EnergyPlus
Input/Output Reference Manual.
Simulation Inputs
Field: Availability Schedule Name
This field is the name of the schedule (Ref: Schedule) that denotes whether the hydronic low
temperature radiant system can run during a given hour. A schedule value greater than 0 (usually 1 is
used) indicates that the unit is available and can be on during the hour. A value less than or equal to 0
(usually 0 is used) denotes that the unit is not available and must be off for the hour.
Field: Zone Name
This field is the name of the zone (Ref: Zone) in which the hydronic low temperature radiant system
is principally located and intended to affect. A system that is between two zones will still act upon
each zone; however, the zone name referenced here should be the zone that controls the radiant
system response.
Field: Surface Name or Radiant Surface Group Name
This field is the name of the surface (Ref: BuildingSurface) or surface list (Ref:
ZoneHVAC:LowTemperatureRadiant:SurfaceGroup) in which the hydronic tubing is
embedded/contained. This specification attaches the source or sink from the radiant system to a
particular surface and the contribution of the system to the heat balances of that surface. If this field is
a surface list, then the source or sink is attached to all of the surfaces in the list with the radiant system
surface group defining the breakdown of how flow rate is split between the various surfaces. Only
base surfaces (e.g., BuildingSurface:Detailed) are valid. Window/Door surfaces and Internal Mass are
not valid surface types for embedded radiant systems.
Field: Hydronic Tubing Inside Diameter
Measure Information Template – Hydronic Radiant Cooling Page 17
2013 California Building Energy Efficiency Standards September 2011
This field is the inside diameter of the tubes through which water is circulated for the system being
defined by this statement. The inside diameter should be recorded in meters and is used to determine
the convective heat transfer from the water to the inside surface of the hydronic tubing.
Field: Hydronic Tubing Length
This field is the total length of pipe embedded in the surface named above in the surface name field.
The length of the tube should be entered in meters and is used to determine the effectiveness of heat
transfer from the fluid being circulated through the tubes and the tube/surface. Longer tubing lengths
result in more heat will be transferred to/from the radiant surface to the circulating fluid. Note that if
the user elects to autosize this field that a standard zone thermostat such as would be used for a forced
air system must be defined as autosizing calculations are based on the zone thermostat value and not
on the radiant system control values.
Field: Temperature Control Type
This field specifies along with the throttling range and setpoint schedules how the user wishes to
control the hydronic radiant system. The temperature denoted in the setpoint schedule can refer to one
of five different temperatures: the zone mean air temperature, the zone mean radiant temperature, the
zone operative temperature, the outdoor dry-bulb temperature, or the outdoor wet-bulb temperature.
The choice of temperature is controlled by the current field—temperature control type. The user must
select from the following options:
MeanAirTemperature
MeanRadiantTemperature
OperativeTemperature
OutdoorDryBulbTemperature
OutdoorWetBulbTemperature
Operative temperature for radiant system controls is the average of Mean Air Temperature and Mean
Radiant Temperature. If the user does not select a control type, MeanAirTemperature control is
assumed by EnergyPlus.
Field: Maximum Hot Water Flow
This field is the maximum flow rate of hot water through the radiant system in m3/sec. The controls
for the radiant system will vary the flow rate of hot water through the surface using zero flow and the
maximum flow rate specified in this field as the lower and upper bounds, respectively. Note that if the
user elects to autosize this field that a standard zone thermostat such as would be used for a forced air
system must be defined as autosizing calculations are based on the zone thermostat value and not on
the radiant system control values.
Field: Heating Water Inlet Node Name
This field contains the name of the hot water inlet node to the radiant system. Note that this node
name must also show up in the branch description when defining the plant demand side network in a
manner identical to defining a heating coil.
Field: Heating Water Outlet Node Name
Measure Information Template – Hydronic Radiant Cooling Page 18
2013 California Building Energy Efficiency Standards September 2011
This field contains the name of the hot water oulet node to the radiant system. Note that this node
name must also show up in the branch description when defining the plant demand side network in a
manner identical to defining a heating coil.
Field: Heating Control Throttling Range
This field specifies the range of temperature in degrees Celsuis over which the radiant system throttles
from zero flow rate up to the maximum defined by the maximum hot water flow rate field described
above. The throttling range parameter is used in conjunction with the control temperature to define the
response of the system to various zone conditions. The heating control temperature schedule specifies
the ―setpoint‖ temperature where the flow rate to the system is at half of the maximum flow rate. For
example, if the heating control temperature setpoint is currently 15˚C and the heating throttling range
is 2˚C, the water flow rate to the radiant system will be zero when the controlling temperature (MAT,
MRT, Operative Temperature, ODB, or OWB; see control type field above) is at or above 16˚C and
the maximum flow rate when the controlling temperature is at or below 14˚C. This represents a
throttling range of 2˚C around the setpoint of 15˚C. In between 14˚C and 16˚C, the flow rate to the
radiant system is varied linearly.
Field: Heating Control Temperature Schedule Name
This field specifies the heating setpoint or control temperature for the radiant system in degrees
Celsius. Used in conjunction with the previous field (heating control throttling range), it will define
whether or not the system is running and the current flow rate. Water flow rate to the system is varied
linearly around the setpoint temperature based on the throttling range and the maximum heating flow
rate parameters (see above). It should be noted that this control schedule will allow different setpoint
temperatures throughout the year for heating. The control of the radiant system is based solely on the
heating control temperature schedule, the cooling control temperature schedule (see below), and the
control temperature type listed above. The radiant system will not use any zone thermostat that might
be used by other systems serving the zone in which the radiant system resides.
Field: Maximum Cold Water Flow
This field is the maximum flow rate of cold water through the radiant system in m3/sec. The controls
for the radiant system will vary the flow rate of cold water through the surface using zero flow and the
maximum flow rate specified in this field as the lower and upper bounds, respectively. Note that this
field is optional and not required for a heating only system. Note also that if the user elects to autosize
this field that a standard zone thermostat such as would be used for a forced air system must be
defined as autosizing calculations are based on the zone thermostat value and not on the radiant
system control values.
Field: Cooling Water Inlet Node Name
This field contains the name of the cold water inlet node to the radiant system. Note that this node
name must also show up in the branch description when defining the plant demand side network in a
manner identical to defining a cooling coil. As with the maximum cold water flow rate, this field is
optional and not required for a heating only system.
Field: Cooling Water Outlet Node Name
This field contains the name of the cold water oulet node to the radiant system. Note that this node
name must also show up in the branch description when defining the plant demand side network in a
Measure Information Template – Hydronic Radiant Cooling Page 19
2013 California Building Energy Efficiency Standards September 2011
manner identical to defining a cooling coil. As with the maximum cold water flow rate, this field is
optional and not required for a heating only system.
Field: Cooling Control Throttling Range
This field specifies the range of temperature in degrees Celsuis over which the radiant system throttles
from zero flow rate up to the maximum defined by the maximum cold water flow rate field described
above. The throttling range parameter is used in conjunction with the control temperature to define the
response of the system to various zone conditions. The cooling control temperature schedule specifies
the ―setpoint‖ temperature where the flow rate to the system is at half of the maximum flow rate. For
and the cooling throttling
range is 2˚C, the water flow rate to the radiant system will be zero when the controlling temperature
(MAT, MRT, Operative Temperature, ODB, or OWB; see control type field above) is at or below
24˚C and the maximum flow rate when the controlling temperature is at or above 26˚C. This
represents a throttling range of 2˚C around the setpoint of 25˚C. In between 24˚C and 26˚C, the flow
rate to the radiant system is varied linearly.
Field: Cooling Control Temperature Schedule Name
This field specifies the cooling setpoint or control temperature for the radiant system in degrees
Celsius. Used in conjunction with the previous field (cooling control throttling range), it will define
whether or not the system is running and the current flow rate. Water flow rate to the system is varied
linearly around the setpoint temperature based on the throttling range and the maximum cooling flow
rate parameters (see above). It should be noted that this control schedule will allow different setpoint
temperatures throughout the year for cooling. The control of the radiant system is based solely on the
heating control temperature schedule listed above, the cooling control temperature schedule, and the
control temperature type listed above. The radiant system will not use any zone thermostat that might
be used by other systems serving the zone in which the radiant system resides.
Field: Condensation Control Type
When radiant systems do cooling, there is the possibility that condensation will occur on the surface
that is being cooled. This is due to the fact that the surface temperature may drop below the dew-point
temperature of the space. When this occurs, condensation on the surface will occur. In EnergyPlus,
users have several options for handling this situation including: Off and SimpleOff. When the user
chooses the Off option, EnergyPlus will not do anything other than produce a warning message when
condensation is predicted to occur. The program will simply continue on; no moisture will be
removed from the zone air and there will be no adjustment of the surface temperature as a result of the
condensation. When the user chooses the SimpleOff option, the program will predict cases where
condensation will occur and shut-off the radiant system to avoid this situation. With this option, the
users also have the opportunity to adjust when the system will shut down. This is specified with the
next parameter (field: condensation differential parameter). This parameter is optional and EnergyPlus
will use the SimpleOff strategy when this parameter is not specified.
Field: Condensation Control Dewpoint Offset
This optional parameter is only valid with the SimpleOff condensation handling algorithm (see
previous input parameter). It establishes the difference between the calculated dew-point temperature
of the space and the allowed surface temperature to which the surface can drop before the radiant
system shuts down in degrees Celsius. This parameter can be any positive, negative, or zero value.
Measure Information Template – Hydronic Radiant Cooling Page 20
2013 California Building Energy Efficiency Standards September 2011
When this parameter is zero, the radiant system will shut down when the surface temperature drops to
the dew-point temperature or below. When this parameter is positive, the radiant system will shut
down when the surface is the number of degrees Celsius above the dew-point temperature. This
allows some extra safety to avoid condensation. When this parameter is negative, the radiant system
will shut down when the surface temperature is the number of degrees Celsius below the dew-point
temperature. While not recommended, this strategy allows the user to simulate a situation where small
amounts of condensation are tolerable.
Simulation Outputs
Hydronic Low Temp Radiant Heating Rate[W]
This field reports the heating input rate to the low temperature radiant system in Watts. This is the
heat source to the surface that is defined as the radiant system. The heating rate is determined by the
zone conditions and the control scheme defined in the user input.
Hydronic Low Temp Radiant Heating Energy[J]
This field reports the heating input to the low temperature radiant system in Joules. This is the heat
source to the surface that is defined as the radiant system. The heating rate is determined by the zone
conditions, the control scheme defined in the user input, and the timestep.
Hydronic Low Temp Radiant Cooling Rate[W]
This field reports the cooling input rate to the low temperature radiant system in Watts. This is the
heat sink to the surface that is defined as the radiant system. The cooling rate is determined by the
zone conditions and the control scheme defined in the user input.
Hydronic Low Temp Radiant Cooling Energy[J]
This field reports the cooling input to the low temperature radiant system in Joules. This is the heat
sink to the surface that is defined as the radiant system. The cooling rate is determined by the zone
conditions, the control scheme defined in the user input, and the timestep.
Hydronic Low Temp Radiant Water Mass Flow Rate[kg/s]
This field reports the mass flow rate of water through the low temperature radiant system in kilograms
per second.
Hydronic Low Temp Radiant Water Inlet Temp[C]
This field reports the temperature of water entering the low temperature radiant system in Celsius.
Hydronic Low Temp Radiant Water Outlet Temp[C]
This field reports the temperature of water leaving the low temperature radiant system in Celsius.
Hydronic Low Temp Radiant Time Condensation Occurring[s]
This field reports the amount of time when condensation is occurring. When using the Off
condensation control, this simply reports the amount of time when condensation occurs. When using
the SimpleOff condensation control, this indicates the amount of time when the system has been shut
off because of the potential danger of condensation.
Measure Information Template – Hydronic Radiant Cooling Page 21
2013 California Building Energy Efficiency Standards September 2011
4.2.2 Low Temperature Radiant System: Constant Volume
This low temperature radiant system (hydronic) is a component of zone equipment that is intended to
model any ―radiant system‖ where water is used to supply/remove energy to/from a building surface
(wall, ceiling, or floor).
The constant flow system differs from the variable flow system described above in what it controls.
The variable flow system varies the flow rate through the radiant system based on some control
temperature. The constant flow system keeps flow rate constant via a local circulation pump and
varies the water temperature that is sent to the radiant system. This is accomplished with a mixing
valve that is controlled by a sensor.
One of the other differences between this model and the variable flow hydronic radiant system is that
the constant flow radiant system has a built-in local secondary loop. It will recirculate flow coming
out of the system and mix this with flow from the supply loop to arrive at the desired inlet
temperature to the radiant system (note that this model has the temperature sensor AFTER the pump
to insure proper inlet temperature to the radiant system). The local loop also contains a pump which is
assumed to be upstream of the radiant system and after the mixing valve. So, the local loop can have
some recirculation. The flow from the main loop may also bypass the radiant system if more than
enough flow is available and the main loop is also a constant flow system.
Following are key inputs to and outputs from the variable volume model excerpted from the
EnergyPlus Input/Output Reference Manual.
Simulation Inputs
Field: Name
This field is an unique user assigned name for an instance of a constant flow low temperature radiant
system. Any reference to this unit by another object will use this name.
Field: Availability Schedule Name
This field is the name of the schedule (ref: Schedule) that denotes whether the constant flow low
temperature radiant system can run during a given hour. A schedule value greater than 0 (usually 1 is
used) indicates that the unit is available and can be on during the hour. A value less than or equal to 0
(usually 0 is used) denotes that the unit is not available and must be off for the hour.
Field: Zone Name
This field is the name of the zone (Ref: Zone) in which the constant flow low temperature radiant
system is principally located and intended to affect. A system that is between two zones will still act
upon each zone; however, the zone name referenced here should be the zone that controls the radiant
system response.
Field: Surface Name or Radiant Surface Group Name
This field is the name of the surface (Ref: BuildingSurface:Detailed) or surface list (Ref:
ZoneHVAC:LowTemperatureRadiant:SurfaceGroup) in which the hydronic tubing is
embedded/contained. This specification attaches the source or sink from the radiant system to a
particular surface and the contribution of the system to the heat balances of that surface. If this field is
a surface list, then the source or sink is attached to all of the surfaces in the list with the radiant system
surface group defining the breakdown of how flow rate is split between the various surfaces. Only
Measure Information Template – Hydronic Radiant Cooling Page 22
2013 California Building Energy Efficiency Standards September 2011
base surfaces (BuildingSurface:Detailed) are valid. Window/Door surfaces and Internal Mass are not
valid surface types for embedded radiant systems.
Field: Hydronic Tubing Inside Diameter
This field is the inside diameter of the tubes through which water is circulated for the system being
defined by this statement. The inside diameter should be recorded in meters and is used to determine
the convective heat transfer from the water to the inside surface of the hydronic tubing.
Field: Hydronic Tubing Length
This field is the total length of pipe embedded in the surface named above in the surface name field.
The length of the tube should be entered in meters and is used to determine the effectiveness of heat
transfer from the fluid being circulated through the tubes and the tube/surface. Longer tubing lengths
result in more heat being transferred to/from the radiant surface to the circulating fluid.
Field: Temperature Control Type
This field specifies along with setpoint (control) and water schedules how the user wishes to control
the constant flow radiant system. The temperature denoted in the setpoint schedule can refer to one of
five different temperatures: the zone mean air temperature, the zone mean radiant temperature, the
zone operative temperature, the outdoor dry-bulb temperature, or the outdoor wet-bulb temperature.
The choice of temperature is controlled by the current field—temperature control type. The user must
select from the following options:
MeanAirTemperature
MeanRadiantTemperature
OperativeTemperature
OutdoorDryBulbTemperature
OutdoorWetBulbTemperature
Operative temperature for radiant system controls is the average of Mean Air Temperature and Mean
Radiant Temperature. If the user does not select a control type, MeanAirTemperature control is
assumed by EnergyPlus. See the throttling range and control temperature schedule fields below for
more information.
Field: Rated Flow Rate
This field is the maximum flow rate of water through the radiant system in m3/sec. This flow rate is
held constant by the local component pump, but the user has the option of varying this flow rate via a
schedule (see next input field). The constant flow system will accept this flow rate and control the
inlet temperature based on the control and water temperature schedules defined below.
Field: Pump Flow Rate Schedule Name
This field modifies the maximum flow rate of water through the radiant system in m3/sec. This input
is ―optional‖. If the user does not enter a schedule, the flow rate through the radiant system is assumed
to be constant during all hours that it is operating based on the value entered in the previous input
field. Note that the values for this schedule must be between zero and one.
Field: Rated Pump Head
Measure Information Template – Hydronic Radiant Cooling Page 23
2013 California Building Energy Efficiency Standards September 2011
This numeric field contains the pump‘s rated head in Pascals.
Field: Rated Power Consumption
This numeric field contains the pump‘s rated power consumption in Watts.
Field: Motor Efficiency
This numeric field contains the pump‘s efficiency in decimal form (0 = 0%, 1 = 100%).
Field: Fraction of Motor Inefficiencies to Fluid Stream
This numeric field contains the pump‘s fraction of power loss to the fluid.
Field: Heating Water Inlet Node Name
This field contains the name of the hot water inlet node to the radiant system. Note that this node
name must also show up in the branch description when defining the plant demand side network in a
manner identical to defining a heating coil.
Field: Heating Water Outlet Node Name
This field contains the name of the hot water outlet node to the radiant system. Note that this node
name must also show up in the branch description when defining the plant demand side network in a
manner identical to defining a heating coil.
Field: Heating High Water Temperature Schedule Name
This field specifies the high water temperature in degrees Celsius for the temperature control of a
constant flow radiant heating system. Water and control temperatures for heating work together to
provide a linear function that determines the water temperature sent to the radiant system. The current
control temperature (see Temperature Control Type above) is compared to the high and low control
temperatures at the current time. If the control temperature is above the high temperature, then the
system will be turned off and the water mass flow rate will be zero. If the control temperature is
below the low temperature, then the inlet water temperature is set to the high water temperature. If the
control temperature is between the high and low value, then the inlet water temperature is linearly
interpolated between the low and high water temperature values.
Field: Heating Low Water Temperature Schedule Name
This field specifies the low water temperature in degrees Celsius for the temperature control of a
constant flow heating radiant system. For more information on its interpretation, see Heating High
Water Temperature Schedule above.
Field: Heating High Control Temperature Schedule Name
This field specifies the high control temperature in degrees Celsius for the temperature control of a
constant flow heating radiant system. For more information on its interpretation, see Heating High
Water Temperature Schedule above.
Field: Heating Low Control Temperature Schedule Name
Measure Information Template – Hydronic Radiant Cooling Page 24
2013 California Building Energy Efficiency Standards September 2011
This field specifies the low control temperature in degrees Celsius for the temperature control of a
constant flow heating radiant system. For more information on its interpretation, see Heating High
Water Temperature Schedule above.
Field: Cooling Water Inlet Node Name
This field contains the name of the cold water inlet node to the radiant system. Note that this node
name must also show up in the branch description when defining the plant demand side network in a
manner identical to defining a cooling coil. As with the maximum cold water flow rate, this field is
optional and not required for a heating only system.
Field: Cooling Water Outlet Node Name
This field contains the name of the cold water outlet node to the radiant system. Note that this node
name must also show up in the branch description when defining the plant demand side network in a
manner identical to defining a cooling coil. As with the maximum cold water flow rate, this field is
optional and not required for a heating only system.
Field: Cooling High Water Temperature Schedule Name
This field specifies the high water temperature in degrees Celsius for the temperature control of a
constant flow radiant cooling system. Water and control temperatures for heating work together to
provide a linear function that determines the water temperature sent to the radiant system. The current
control temperature (see Temperature Control Type above) is compared to the high and low control
temperatures at the current time. If the control temperature is above the high temperature, then the
inlet water temperature is set to the low water temperature. If the control temperature is below the low
temperature, then system will be turned off and the water mass flow rate will be zero. If the control
temperature is between the high and low value, then the inlet water temperature is linearly
interpolated between the low and high water temperature values. For more information and a graph of
how the water and control schedules affect the system operation, please consult the Engineering
Reference document.
Field: Cooling Low Water Temperature Schedule Name
This field specifies the low water temperature in degrees Celsius for the temperature control of a
constant flow cooling radiant system. For more information on its interpretation, see Cooling High
Water Temperature Schedule above.
Field: Cooling High Control Temperature Schedule Name
This field specifies the high control temperature in degrees Celsius for the temperature control of a
constant flow cooling radiant system. For more information on its interpretation, see Cooling High
Water Temperature Schedule above.
Field: Cooling Low Control Temperature Schedule Name
This field specifies the low control temperature in degrees Celsius for the temperature control of a
constant flow cooling radiant system. For more information on its interpretation, see Cooling High
Water Temperature Schedule above.
Field: Condensation Control Type
When radiant systems do cooling, there is the possibility that condensation will occur on the surface
that is being cooled. This is due to the fact that the surface temperature may drop below the dew-point
Measure Information Template – Hydronic Radiant Cooling Page 25
2013 California Building Energy Efficiency Standards September 2011
temperature of the space. When this occurs, condensation on the surface will occur. In EnergyPlus,
users have several options for handling this situation including: Off and SimpleOff. When the user
chooses the Off option, EnergyPlus will not do anything other than produce a warning message when
condensation is predicted to occur. The program will simply continue on; no moisture will be
removed from the zone air and there will be no adjustment of the surface temperature as a result of the
condensation. When the user chooses the SimpleOff option, the program will predict cases where
condensation will occur and shut-off the radiant system to avoid this situation. With this option, the
users also have the opportunity to adjust when the system will shut down. This is specified with the
next parameter (field: condensation differential parameter). This parameter is optional and EnergyPlus
will use the SimpleOff strategy when this parameter is not specified.
Field: Condensation Control Dewpoint Offset
This optional parameter is only valid with the SimpleOff condensation handling algorithm (see
previous input parameter). It establishes the difference between the calculated dew-point temperature
of the space and the allowed surface temperature to which the surface can drop before the radiant
system shuts down in degrees Celsius. This parameter can be any positive, negative, or zero value.
When this parameter is zero, the radiant system will shut down when the surface temperature drops to
the dew-point temperature or below. When this parameter is positive, the radiant system will shut
down when the surface is the number of degrees Celsius above the dew-point temperature. This
allows some extra safety to avoid condensation. When this parameter is negative, the radiant system
will shut down when the surface temperature is the number of degrees Celsius below the dew-point
temperature. While not recommended, this strategy allows the user to simulate a situation where small
amounts of condensation are tolerable.
Simulation Outputs
Constant Flow Low Temp Radiant Heating Rate[W]
This field reports the heating input rate to the low temperature radiant system in Watts. This is the
heat source to the surface that is defined as the radiant system. The heating rate is determined by the
zone conditions and the control scheme defined in the user input.
Constant Flow Low Temp Radiant Heating Energy[J]
This field reports the heating input to the low temperature radiant system in Joules. This is the heat
source to the surface that is defined as the radiant system. The heating rate is determined by the zone
conditions, the control scheme defined in the user input, and the timestep.
Constant Flow Low Temp Radiant Cooling Rate[W]
This field reports the cooling input rate to the low temperature radiant system in Watts. This is the
heat sink to the surface that is defined as the radiant system. The cooling rate is determined by the
zone conditions and the control scheme defined in the user input.
Constant Flow Low Temp Radiant Cooling Energy[J]
This field reports the cooling input to the low temperature radiant system in Joules. This is the heat
sink to the surface that is defined as the radiant system. The cooling rate is determined by the zone
conditions, the control scheme defined in the user input, and the timestep.
Constant Flow Low Temp Radiant Water Mass Flow Rate[kg/s]

Measure Information Template – Hydronic Radiant Cooling Page 26
2013 California Building Energy Efficiency Standards September 2011
This field reports the mass flow rate of water through the low temperature radiant system in kilograms
per second. This should be identical to the pump flow rate for the system.
Constant Flow Low Temp Radiant Injection Mass Flow Rate[kg/s]
This field reports the mass flow rate of water that is injected into the radiant system from the main
loop. A valve will control the injection and recirculation mass flow rates (see next field) to match the
temperature controls specified by the user and dictated by the current simulation conditions.
Constant Flow Low Temp Radiant Recirculation Mass Flow Rate[kg/s]
This field reports the mass flow rate of water that is recirculated from the radiant system outlet and
mixed with the injection flow from the main loop. A valve will control the injection and recirculation
mass flow rates (see next field) to match the temperature controls specified by the user and dictated
by the current simulation conditions.
Constant Flow Low Temp Radiant Water Inlet Temp[C]
This field reports the temperature of water entering the low temperature radiant system in Celsius.
This may differ from the inlet node temperature for the component since this component has its own
local secondary loop.
Constant Flow Low Temp Radiant Water Outlet Temp[C]
This field reports the temperature of water leaving the low temperature radiant system in Celsius. This
may differ from the outlet node temperature for the component since this component has its own local
secondary loop.
Constant Flow Low Temp Pump Water Inlet Temp[C]
This field reports the temperature of water entering the low temperature radiant system pump in
Celsius. This may differ from the inlet node temperature for the component since this component has
its own local secondary loop. It is assumed that the pump is upstream of the radiant system.
Constant Flow Low Temp Pump Electric Power[W]
This field reports the rate of electric power consumption for the pump which supplies flow to the
constant flow radiant system in Watts.
Constant Flow Low Temp Pump Electric Consumption[J]
This field reports the electric power consumption for the pump which supplies flow to the constant
flow radiant system in Joules.
Constant Flow Low Temp Radiant Pump Water Mass Flow[kg/s]
This field reports the mass flow rate of water through the low temperature radiant system pump in
kilograms per second. This should be identical to the flow rate for the system.
Constant Flow Low Temp Pump Heat to Fluid[W]
This field reports the rate at which heat is added to the fluid stream as it passes through the pump in
Watts. This heat is reflected in the radiant system inlet temperature which will be different from the
pump inlet temperature if this field has a non-zero value.
Constant Flow Low Temp Pump Heat to Fluid Energy[J]

Measure Information Template – Hydronic Radiant Cooling Page 27
2013 California Building Energy Efficiency Standards September 2011
This field reports the amount of heat energy added to the fluid stream as it passes through the pump in
Joules. This heat is reflected in the radiant system inlet temperature which will be different from the
pump inlet temperature if this field has a non-zero value.
Constant Flow Low Temp Radiant Time Condensation Occurring[s]
This field reports the amount of time when condensation is occurring. When using the Off
condensation control, this simply reports the amount of time when condensation occurs. When using
the SimpleOff condensation control, this indicates the amount of time when the system has been shut
off because of the potential danger of condensation.
4.3 Energy Simulation Analysis and Results
4.3.1 Prototype Design
HMG conducted energy simulation analysis for a prototype building design based on a retail store in
Sacramento, CA that has hydronic radiant cooling system.
Building Description
The prototype design has the main sales floor (including merchandise aisles, grocery, check-out areas)
in the middle of the store. Ancillary spaces such as storage, offices, and spaces occupied by tenants
are on the perimeter of the store. A detailed plan of the store in presented in the Appendix for
reference. For the energy simulation analysis, only the merchandise and checkout areas of the store
were modeled since the hydronic radiant cooling system is installed in those sections of the store.
Construction
Walls are constructed of eight inch uninsulated concrete blocks. The built up roof is insulated with
R30 rigid insulation. The floor is four inch thick concrete slab-on-grade with hydronic pipes located
within the slab. The roof over the central merchandise areas has evenly spaced rows of double-glazed
5x6 skylights.
System Type(s)
The store has two separate systems - the radiant system provides sensible cooling and a dedicated out-
side air system (DOAS) provides ventilation air and dehumidification.
Radiant System
The as-designed radiant floor cooling system is separated into the ―front merchandise‖ zone and
―back merchandise‖ zone which are further divided into several sub-zones that can be individually
controlled. Each of the radiant floor zones is designed for a maximum flow of 306 gpm through half-
inch piping. Chilled water to the radiant floors is provided by an air-cooled chiller. In addition, three
fluid coolers provide waterside economizing for the radiant floor. For the energy simulation analysis,
the chilled water source was modeled as district cooling to minimize the complexity of modeling
chillers and fluid coolers.
Measure Information Template – Hydronic Radiant Cooling Page 28
2013 California Building Energy Efficiency Standards September 2011
DOAS System
Four separately controlled dedicated outside air unit provide ventilation air, additional cooling using
indirect-direct evaporative cooling, and heating, to both zones.
4.3.2 Simulation Analysis Setup
HMG conducted building energy simulation analysis for the prototype store using EnergyPlus version
6.0.0, which is the latest version as of October 2010.
The simulation analysis was conducted in three stages. First an EnergyPlus model of the radiant floor
was compared to the monitored site data to compare EnergyPlus input capabilities versus the
operation of the store for a design day condition. The slab surface temperature and the resulting space
mean air temperature were key performance metrics used for comparison.
Second, sensitivity analysis was performed by adjusting various inputs to the EnergyPlus model to
evaluate impact on slab surface temperature and space mean air temperature.
Third, a comparative analysis was conducted to compare the constant flow and variable flow modules
in EnergyPlus in terms of their ability to model slab surface temperatures and resulting space air
temperatures on an annual basis as well as associate energy usage.
Initial Model Development
The radiant system as operated in the store uses both a variable temperature and variable water flow
controls. The input capabilities for both of the low-temperature radiant hydronic systems in
EnergyPlus assume a constant supply temperature to the slab. Thus it was not possible to directly
model the variable temperature through input keywords identified in Section 4.2 of this document.
To get around this limitation, HMG modeled the system in EnergyPlus using the low temperature
variable volume system which allows modeling of the variable flow explicitly. A temperature
schedule was separately added to the chilled water supply side at the plant to model the variable
chilled water supply temperature. This work-around allowed HMG to model the system as a variable
flow and variable temperature system. Site monitored chilled water supply temperatures and flow
rates were obtained from the energy management system, converted to hourly schedules, and
implemented in EnergyPlus using the schedule setpoint manager.
HMG chose July 5th
, 2010 as a representative summer design-day condition to specify a chilled water
supply temperature schedule at 15 minute intervals based on actual data recorded onsite.
To simplify the energy modeling and allow a focus on the radiant cooling component of the system,
purchased chilled water was used as the chilled water source rather than explicitly defining chillers
and fluid coolers that provide the chilled water to the radiant floor systems.
HMG used mean air temperature for thermostatic control in the analysis based on monitored data. A
cooling temperature control setpoint of 76°F and a cooling throttling range of 2.7°F was used based
on site data. Under these conditions, the radiant system flow rate is approximately 50% of total flow
when the zone mean temperature is 76°F, at minimum flow at 73.3°F, and at full flow when zone
mean temperature is 78.7°F.
HMG simplified the zoning of the radiant system by combining similar zones to form a ‗front
merchandise radiant zone‘ and ‗back merchandise radiant zone‘. Each of these zones is
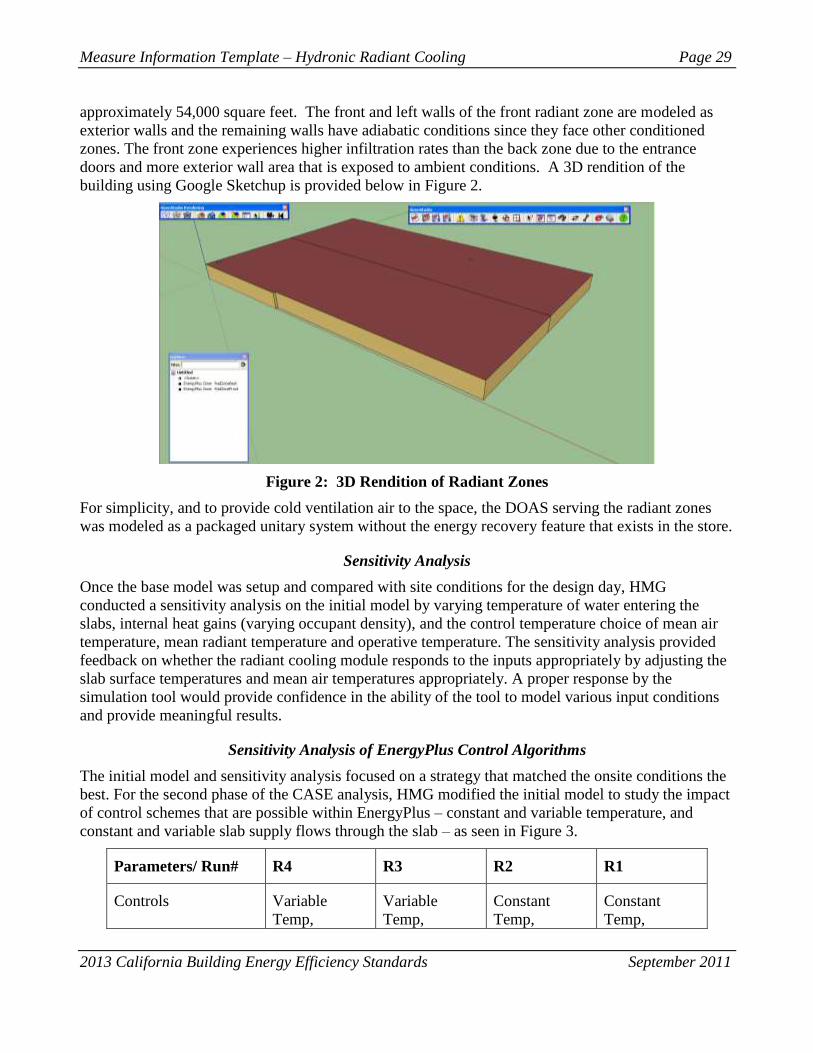
Measure Information Template – Hydronic Radiant Cooling Page 29
2013 California Building Energy Efficiency Standards September 2011
approximately 54,000 square feet. The front and left walls of the front radiant zone are modeled as
exterior walls and the remaining walls have adiabatic conditions since they face other conditioned
zones. The front zone experiences higher infiltration rates than the back zone due to the entrance
doors and more exterior wall area that is exposed to ambient conditions. A 3D rendition of the
building using Google Sketchup is provided below in Figure 2.
Figure 2: 3D Rendition of Radiant Zones
For simplicity, and to provide cold ventilation air to the space, the DOAS serving the radiant zones
was modeled as a packaged unitary system without the energy recovery feature that exists in the store.
Sensitivity Analysis
Once the base model was setup and compared with site conditions for the design day, HMG
conducted a sensitivity analysis on the initial model by varying temperature of water entering the
slabs, internal heat gains (varying occupant density), and the control temperature choice of mean air
temperature, mean radiant temperature and operative temperature. The sensitivity analysis provided
feedback on whether the radiant cooling module responds to the inputs appropriately by adjusting the
slab surface temperatures and mean air temperatures appropriately. A proper response by the
simulation tool would provide confidence in the ability of the tool to model various input conditions
and provide meaningful results.
Sensitivity Analysis of EnergyPlus Control Algorithms
The initial model and sensitivity analysis focused on a strategy that matched the onsite conditions the
best. For the second phase of the CASE analysis, HMG modified the initial model to study the impact
of control schemes that are possible within EnergyPlus – constant and variable temperature, and
constant and variable slab supply flows through the slab – as seen in Figure 3.
Parameters/ Run# R4 R3 R2 R1
Controls Variable
Temp,
Variable
Temp,
Constant
Temp,
Constant
Temp,

Measure Information Template – Hydronic Radiant Cooling Page 30
2013 California Building Energy Efficiency Standards September 2011
Variable Flow Constant Flow Variable Flow Constant Flow
Inside pipe diameter 0.5‖ 0.5‖ 0.5‖ 0.5‖
Hydronic pipe length 19,768‘ 19,768‘ 19,768‘ 19,768‘
Maximum Cold
Water Flow (GPM)
612 612 612 612
Temperature Control
Type
Mean Air
Temp
Mean Air
Temp
Mean Air
Temp
Mean Air
Temp
Temperature Control
Setpoint (Variable
Flow)
76°F N/A 76°F N/A
Cooling Throttling
Range (Variable
Flow)
2.7°F N/A 2.7°F N/A
Slab Supply
Temperature 63°F - 68°F 63°F - 68°F 68°F 68°F
Figure 3: Radiant System Inputs for Sensitivity Analysis
Annual Energy Savings Analysis
For the final phase of the CASE analysis, the Runs 1-4 above were modified to make them more
‗generic‘ by using control temperatures and flow rates based on findings from interviews with
stakeholders rather than matching the specific control scheme in the prototype store. These revised
runs R1 through R4 were simulated for the entire year to estimate whole building annual energy
consumption and peak electric demand. The 2013 CEC TDV version 4 and 2013 CA weather files for
CZ 12 (Sacramento) were used for the energy savings analysis. Simulation inputs are provided in
Figure 4.
Runs R1 and R3 were modeled using the EnergyPlus LowTemperatureRadiant:ConstantFlow system
type to simulate a constant flow system on an annual basis. Using space mean air temperature as the
control variable, the slab supply temperature in run R3 was controlled in a range of 63°F – 68°F. Run
R1 was simulated with a constant 63°F slab supply temperature. Runs R2 and R4 were modeled
using the LowTemperatureRadiant:VariableFlow system. This system does not directly model
variable temperature for the slab supply temperature, though an hourly schedule could be applied on a
seasonal or monthly basis to simulate a varying slab supply temperature during a 24-hour period.
Employing such as schedule for Title 24 compliance is not realistic due to the difficulties in verifying
and enforcing the schedule during code compliance verification. Therefore for the run R4 annual
energy analysis, the slab supply temperature was simulated at a constant 65.2°F. This temperature
approximates the average annual slab temperature based on monitored data.
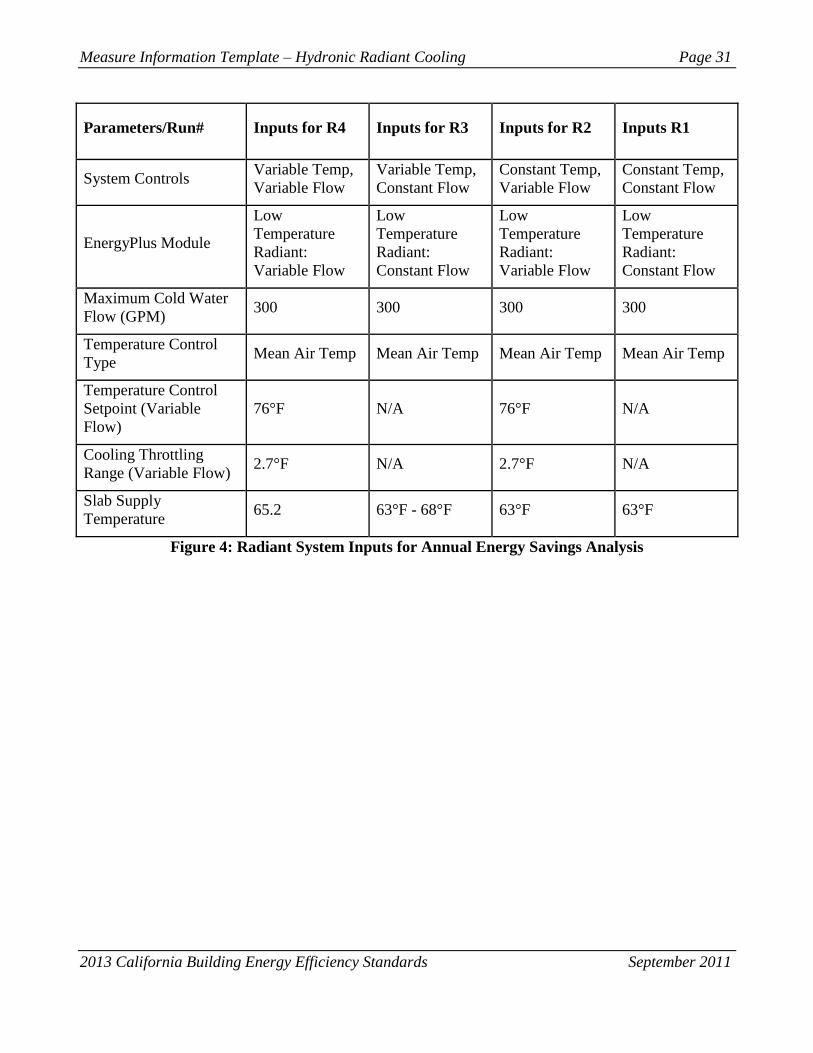
Measure Information Template – Hydronic Radiant Cooling Page 31
2013 California Building Energy Efficiency Standards September 2011
Parameters/Run# Inputs for R4 Inputs for R3 Inputs for R2 Inputs R1
System Controls Variable Temp,
Variable Flow
Variable Temp,
Constant Flow
Constant Temp,
Variable Flow
Constant Temp,
Constant Flow
EnergyPlus Module
Low
Temperature
Radiant:
Variable Flow
Low
Temperature
Radiant:
Constant Flow
Low
Temperature
Radiant:
Variable Flow
Low
Temperature
Radiant:
Constant Flow
Maximum Cold Water
Flow (GPM) 300 300 300 300
Temperature Control
Type Mean Air Temp Mean Air Temp Mean Air Temp Mean Air Temp
Temperature Control
Setpoint (Variable
Flow)
76°F N/A 76°F N/A
Cooling Throttling
Range (Variable Flow) 2.7°F N/A 2.7°F N/A
Slab Supply
Temperature 65.2 63°F - 68°F 63°F 63°F
Figure 4: Radiant System Inputs for Annual Energy Savings Analysis
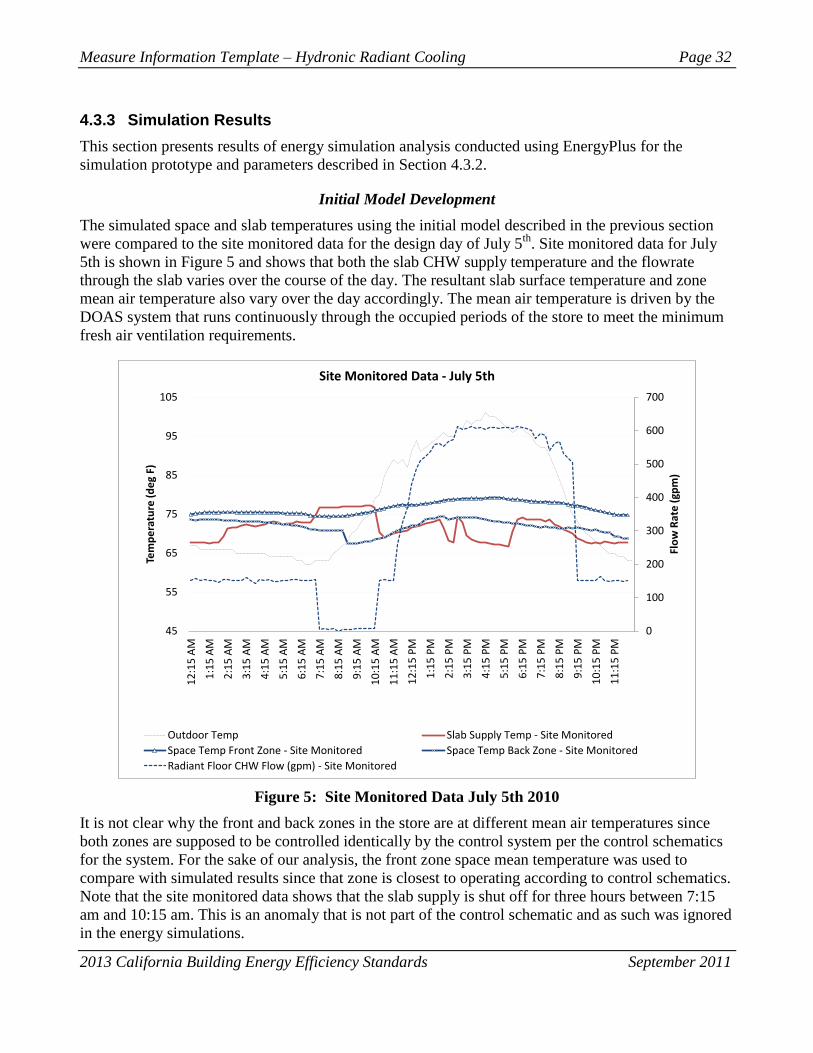
Measure Information Template – Hydronic Radiant Cooling Page 32
2013 California Building Energy Efficiency Standards September 2011
4.3.3 Simulation Results
This section presents results of energy simulation analysis conducted using EnergyPlus for the
simulation prototype and parameters described in Section 4.3.2.
Initial Model Development
The simulated space and slab temperatures using the initial model described in the previous section
were compared to the site monitored data for the design day of July 5th
. Site monitored data for July
5th is shown in Figure 5 and shows that both the slab CHW supply temperature and the flowrate
through the slab varies over the course of the day. The resultant slab surface temperature and zone
mean air temperature also vary over the day accordingly. The mean air temperature is driven by the
DOAS system that runs continuously through the occupied periods of the store to meet the minimum
fresh air ventilation requirements.
Figure 5: Site Monitored Data July 5th 2010
It is not clear why the front and back zones in the store are at different mean air temperatures since
both zones are supposed to be controlled identically by the control system per the control schematics
for the system. For the sake of our analysis, the front zone space mean temperature was used to
compare with simulated results since that zone is closest to operating according to control schematics.
Note that the site monitored data shows that the slab supply is shut off for three hours between 7:15
am and 10:15 am. This is an anomaly that is not part of the control schematic and as such was ignored
in the energy simulations.
0
100
200
300
400
500
600
700
45
55
65
75
85
95
105
12
:15
AM
1:1
5 A
M
2:1
5 A
M
3:1
5 A
M
4:1
5 A
M
5:1
5 A
M
6:1
5 A
M
7:1
5 A
M
8:1
5 A
M
9:1
5 A
M
10
:15
AM
11
:15
AM
12
:15
PM
1:1
5 P
M
2:1
5 P
M
3:1
5 P
M
4:1
5 P
M
5:1
5 P
M
6:1
5 P
M
7:1
5 P
M
8:1
5 P
M
9:1
5 P
M
10
:15
PM
11
:15
PM
Flo
w R
ate
(gp
m)
Tem
pe
ratu
re (
de
g F)
Site Monitored Data - July 5th
Outdoor Temp Slab Supply Temp - Site Monitored
Space Temp Front Zone - Site Monitored Space Temp Back Zone - Site Monitored
Radiant Floor CHW Flow (gpm) - Site Monitored
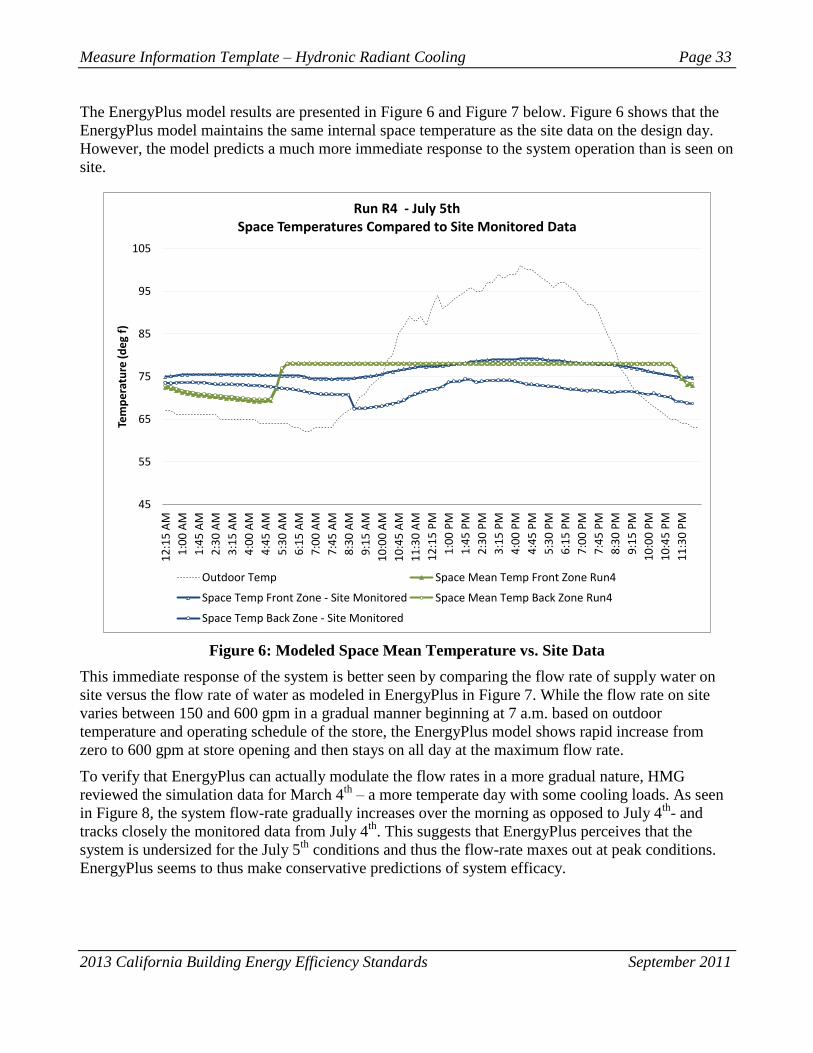
Measure Information Template – Hydronic Radiant Cooling Page 33
2013 California Building Energy Efficiency Standards September 2011
The EnergyPlus model results are presented in Figure 6 and Figure 7 below. Figure 6 shows that the
EnergyPlus model maintains the same internal space temperature as the site data on the design day.
However, the model predicts a much more immediate response to the system operation than is seen on
site.
Figure 6: Modeled Space Mean Temperature vs. Site Data
This immediate response of the system is better seen by comparing the flow rate of supply water on
site versus the flow rate of water as modeled in EnergyPlus in Figure 7. While the flow rate on site
varies between 150 and 600 gpm in a gradual manner beginning at 7 a.m. based on outdoor
temperature and operating schedule of the store, the EnergyPlus model shows rapid increase from
zero to 600 gpm at store opening and then stays on all day at the maximum flow rate.
To verify that EnergyPlus can actually modulate the flow rates in a more gradual nature, HMG
reviewed the simulation data for March 4th
– a more temperate day with some cooling loads. As seen
in Figure 8, the system flow-rate gradually increases over the morning as opposed to July 4th
- and
tracks closely the monitored data from July 4th
. This suggests that EnergyPlus perceives that the
system is undersized for the July 5th
conditions and thus the flow-rate maxes out at peak conditions.
EnergyPlus seems to thus make conservative predictions of system efficacy.
45
55
65
75
85
95
105
12
:15
AM
1:0
0 A
M
1:4
5 A
M
2:3
0 A
M
3:1
5 A
M
4:0
0 A
M
4:4
5 A
M
5:3
0 A
M
6:1
5 A
M
7:0
0 A
M
7:4
5 A
M
8:3
0 A
M
9:1
5 A
M
10
:00
AM
10
:45
AM
11
:30
AM
12
:15
PM
1:0
0 P
M
1:4
5 P
M
2:3
0 P
M
3:1
5 P
M
4:0
0 P
M
4:4
5 P
M
5:3
0 P
M
6:1
5 P
M
7:0
0 P
M
7:4
5 P
M
8:3
0 P
M
9:1
5 P
M
10
:00
PM
10
:45
PM
11
:30
PM
Tem
pe
ratu
re (
de
g f)
Run R4 - July 5thSpace Temperatures Compared to Site Monitored Data
Outdoor Temp Space Mean Temp Front Zone Run4
Space Temp Front Zone - Site Monitored Space Mean Temp Back Zone Run4
Space Temp Back Zone - Site Monitored
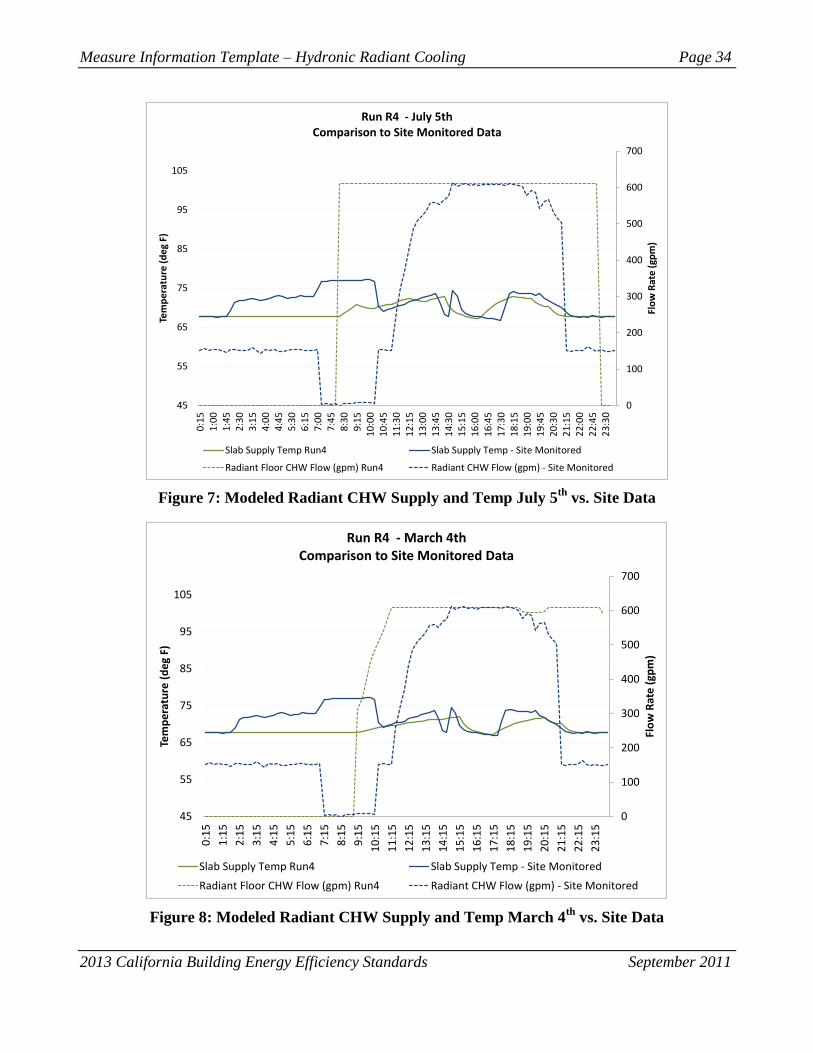
Measure Information Template – Hydronic Radiant Cooling Page 34
2013 California Building Energy Efficiency Standards September 2011
Figure 7: Modeled Radiant CHW Supply and Temp July 5th
vs. Site Data
Figure 8: Modeled Radiant CHW Supply and Temp March 4th
vs. Site Data
0
100
200
300
400
500
600
700
45
55
65
75
85
95
105
0:1
51
:00
1:4
52
:30
3:1
54
:00
4:4
55
:30
6:1
57
:00
7:4
58
:30
9:1
51
0:0
01
0:4
51
1:3
01
2:1
51
3:0
01
3:4
51
4:3
01
5:1
51
6:0
01
6:4
51
7:3
01
8:1
51
9:0
01
9:4
52
0:3
02
1:1
52
2:0
02
2:4
52
3:3
0
Flo
w R
ate
(gp
m)
Tem
pe
ratu
re (
de
g F)
Run R4 - July 5thComparison to Site Monitored Data
Slab Supply Temp Run4 Slab Supply Temp - Site Monitored
Radiant Floor CHW Flow (gpm) Run4 Radiant CHW Flow (gpm) - Site Monitored
0
100
200
300
400
500
600
700
45
55
65
75
85
95
105
0:1
5
1:1
5
2:1
5
3:1
5
4:1
5
5:1
5
6:1
5
7:1
5
8:1
5
9:1
5
10
:15
11
:15
12
:15
13
:15
14
:15
15
:15
16
:15
17
:15
18
:15
19
:15
20
:15
21
:15
22
:15
23
:15
Flo
w R
ate
(gp
m)
Tem
pe
ratu
re (
de
g F)
Run R4 - March 4thComparison to Site Monitored Data
Slab Supply Temp Run4 Slab Supply Temp - Site Monitored
Radiant Floor CHW Flow (gpm) Run4 Radiant CHW Flow (gpm) - Site Monitored
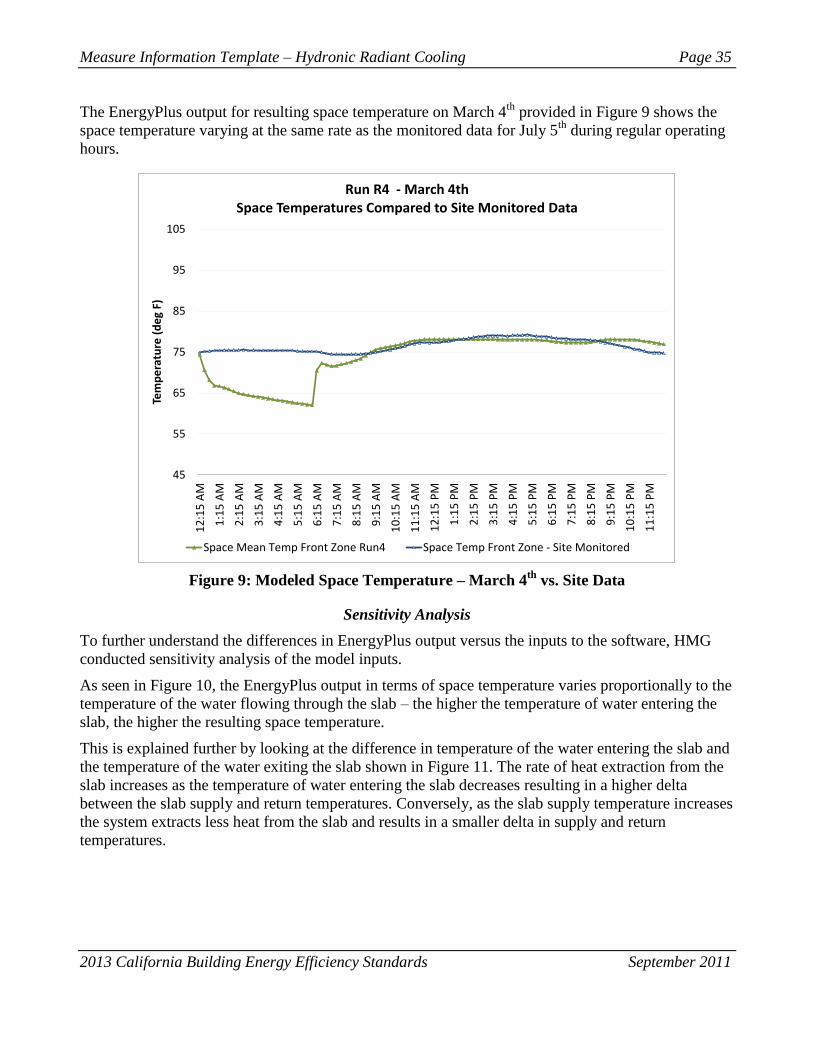
Measure Information Template – Hydronic Radiant Cooling Page 35
2013 California Building Energy Efficiency Standards September 2011
The EnergyPlus output for resulting space temperature on March 4th
provided in Figure 9 shows the
space temperature varying at the same rate as the monitored data for July 5th
during regular operating
hours.
Figure 9: Modeled Space Temperature – March 4th
vs. Site Data
Sensitivity Analysis
To further understand the differences in EnergyPlus output versus the inputs to the software, HMG
conducted sensitivity analysis of the model inputs.
As seen in Figure 10, the EnergyPlus output in terms of space temperature varies proportionally to the
temperature of the water flowing through the slab – the higher the temperature of water entering the
slab, the higher the resulting space temperature.
This is explained further by looking at the difference in temperature of the water entering the slab and
the temperature of the water exiting the slab shown in Figure 11. The rate of heat extraction from the
slab increases as the temperature of water entering the slab decreases resulting in a higher delta
between the slab supply and return temperatures. Conversely, as the slab supply temperature increases
the system extracts less heat from the slab and results in a smaller delta in supply and return
temperatures.
45
55
65
75
85
95
105
12
:15
AM
1:1
5 A
M
2:1
5 A
M
3:1
5 A
M
4:1
5 A
M
5:1
5 A
M
6:1
5 A
M
7:1
5 A
M
8:1
5 A
M
9:1
5 A
M
10
:15
AM
11
:15
AM
12
:15
PM
1:1
5 P
M
2:1
5 P
M
3:1
5 P
M
4:1
5 P
M
5:1
5 P
M
6:1
5 P
M
7:1
5 P
M
8:1
5 P
M
9:1
5 P
M
10
:15
PM
11
:15
PM
Tem
pe
ratu
re (
de
g F)
Run R4 - March 4thSpace Temperatures Compared to Site Monitored Data
Space Mean Temp Front Zone Run4 Space Temp Front Zone - Site Monitored
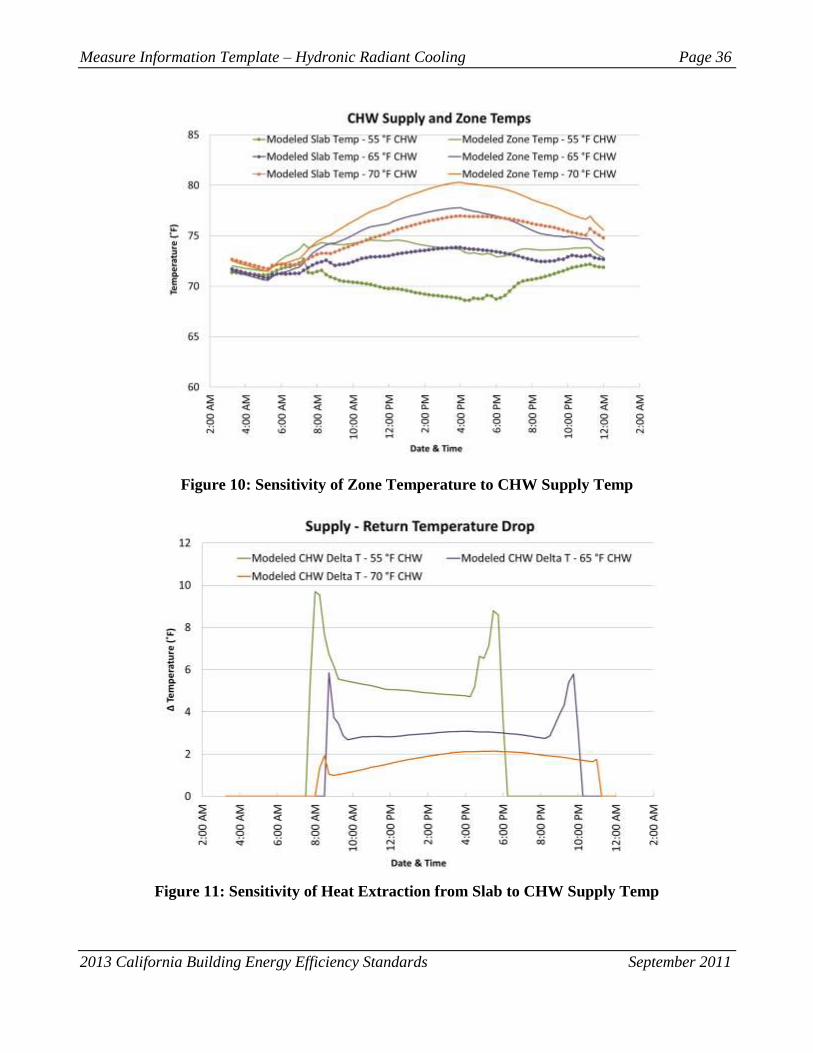
Measure Information Template – Hydronic Radiant Cooling Page 36
2013 California Building Energy Efficiency Standards September 2011
Figure 10: Sensitivity of Zone Temperature to CHW Supply Temp
Figure 11: Sensitivity of Heat Extraction from Slab to CHW Supply Temp
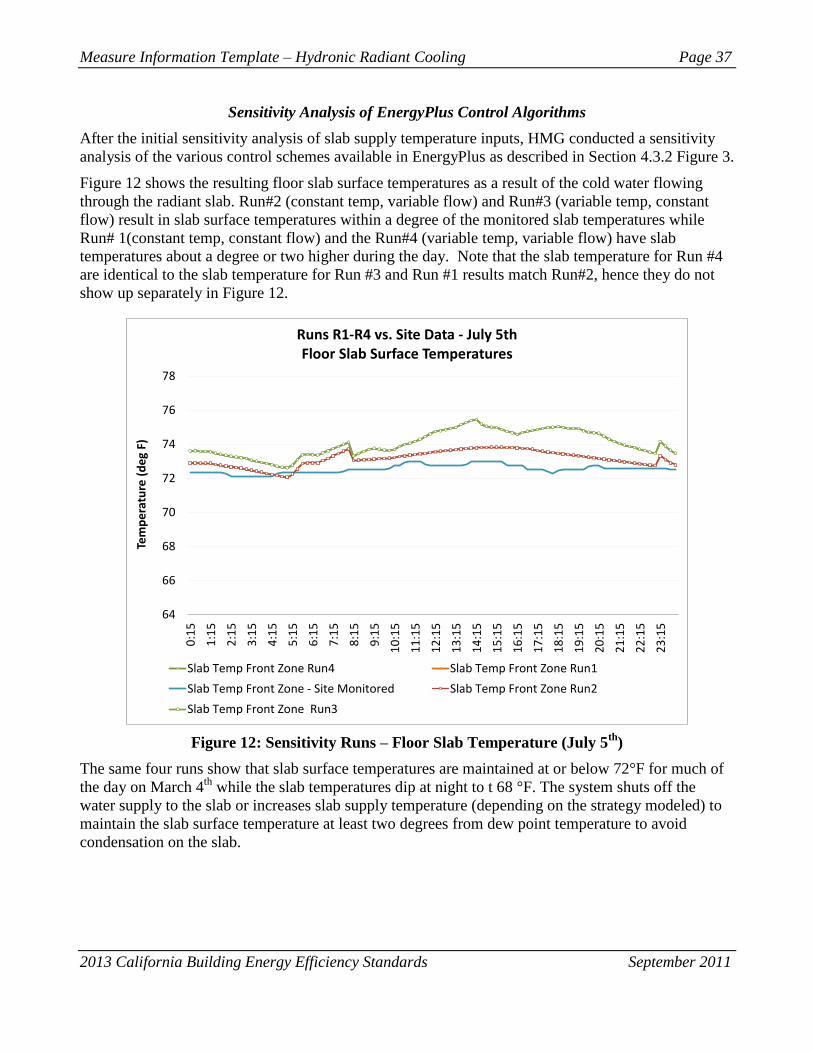
Measure Information Template – Hydronic Radiant Cooling Page 37
2013 California Building Energy Efficiency Standards September 2011
Sensitivity Analysis of EnergyPlus Control Algorithms
After the initial sensitivity analysis of slab supply temperature inputs, HMG conducted a sensitivity
analysis of the various control schemes available in EnergyPlus as described in Section 4.3.2 Figure 3.
Figure 12 shows the resulting floor slab surface temperatures as a result of the cold water flowing
through the radiant slab. Run#2 (constant temp, variable flow) and Run#3 (variable temp, constant
flow) result in slab surface temperatures within a degree of the monitored slab temperatures while
Run# 1(constant temp, constant flow) and the Run#4 (variable temp, variable flow) have slab
temperatures about a degree or two higher during the day. Note that the slab temperature for Run #4
are identical to the slab temperature for Run #3 and Run #1 results match Run#2, hence they do not
show up separately in Figure 12.
Figure 12: Sensitivity Runs – Floor Slab Temperature (July 5th
)
The same four runs show that slab surface temperatures are maintained at or below 72°F for much of
the day on March 4th
while the slab temperatures dip at night to t 68 °F. The system shuts off the
water supply to the slab or increases slab supply temperature (depending on the strategy modeled) to
maintain the slab surface temperature at least two degrees from dew point temperature to avoid
condensation on the slab.
64
66
68
70
72
74
76
78
0:1
5
1:1
5
2:1
5
3:1
5
4:1
5
5:1
5
6:1
5
7:1
5
8:1
5
9:1
5
10
:15
11
:15
12
:15
13
:15
14
:15
15
:15
16
:15
17
:15
18
:15
19
:15
20
:15
21
:15
22
:15
23
:15
Tem
pe
ratu
re (
de
g F)
Runs R1-R4 vs. Site Data - July 5thFloor Slab Surface Temperatures
Slab Temp Front Zone Run4 Slab Temp Front Zone Run1
Slab Temp Front Zone - Site Monitored Slab Temp Front Zone Run2
Slab Temp Front Zone Run3
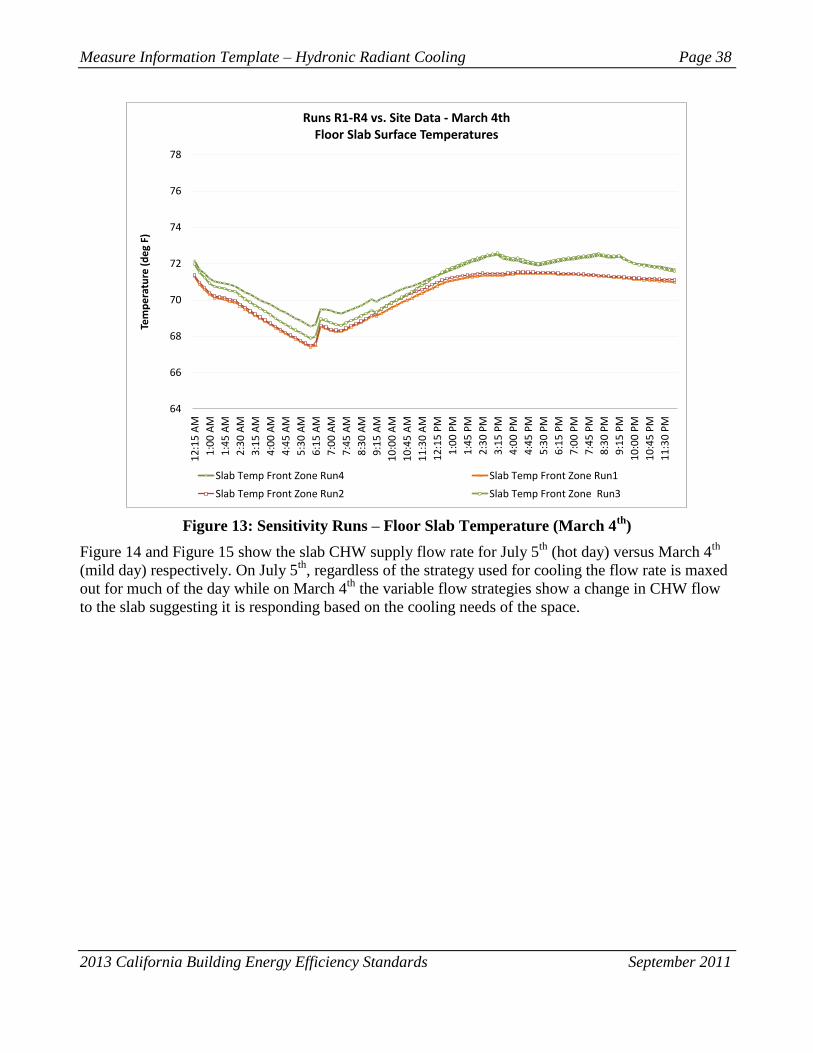
Measure Information Template – Hydronic Radiant Cooling Page 38
2013 California Building Energy Efficiency Standards September 2011
Figure 13: Sensitivity Runs – Floor Slab Temperature (March 4th
)
Figure 14 and Figure 15 show the slab CHW supply flow rate for July 5th
(hot day) versus March 4th
(mild day) respectively. On July 5th
, regardless of the strategy used for cooling the flow rate is maxed
out for much of the day while on March 4th
the variable flow strategies show a change in CHW flow
to the slab suggesting it is responding based on the cooling needs of the space.
64
66
68
70
72
74
76
78
12
:15
AM
1:0
0 A
M
1:4
5 A
M
2:3
0 A
M
3:1
5 A
M
4:0
0 A
M
4:4
5 A
M
5:3
0 A
M
6:1
5 A
M
7:0
0 A
M
7:4
5 A
M
8:3
0 A
M
9:1
5 A
M
10
:00
AM
10
:45
AM
11
:30
AM
12
:15
PM
1:0
0 P
M
1:4
5 P
M
2:3
0 P
M
3:1
5 P
M
4:0
0 P
M
4:4
5 P
M
5:3
0 P
M
6:1
5 P
M
7:0
0 P
M
7:4
5 P
M
8:3
0 P
M
9:1
5 P
M
10
:00
PM
10
:45
PM
11
:30
PM
Tem
pe
ratu
re (
de
g F)
Runs R1-R4 vs. Site Data - March 4thFloor Slab Surface Temperatures
Slab Temp Front Zone Run4 Slab Temp Front Zone Run1
Slab Temp Front Zone Run2 Slab Temp Front Zone Run3
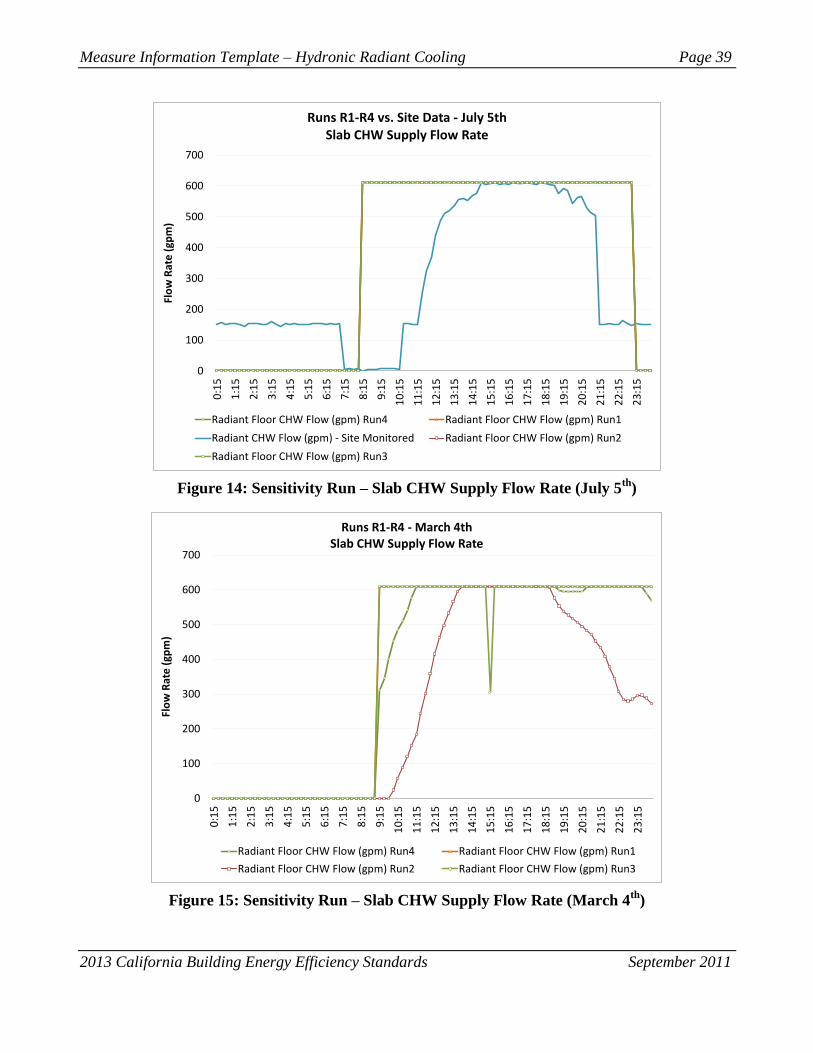
Measure Information Template – Hydronic Radiant Cooling Page 39
2013 California Building Energy Efficiency Standards September 2011
Figure 14: Sensitivity Run – Slab CHW Supply Flow Rate (July 5th
)
Figure 15: Sensitivity Run – Slab CHW Supply Flow Rate (March 4th
)
0
100
200
300
400
500
600
700
0:1
5
1:1
5
2:1
5
3:1
5
4:1
5
5:1
5
6:1
5
7:1
5
8:1
5
9:1
5
10
:15
11
:15
12
:15
13
:15
14
:15
15
:15
16
:15
17
:15
18
:15
19
:15
20
:15
21
:15
22
:15
23
:15
Flo
w R
ate
(gp
m)
Runs R1-R4 vs. Site Data - July 5thSlab CHW Supply Flow Rate
Radiant Floor CHW Flow (gpm) Run4 Radiant Floor CHW Flow (gpm) Run1
Radiant CHW Flow (gpm) - Site Monitored Radiant Floor CHW Flow (gpm) Run2
Radiant Floor CHW Flow (gpm) Run3
0
100
200
300
400
500
600
700
0:1
5
1:1
5
2:1
5
3:1
5
4:1
5
5:1
5
6:1
5
7:1
5
8:1
5
9:1
5
10
:15
11
:15
12
:15
13
:15
14
:15
15
:15
16
:15
17
:15
18
:15
19
:15
20
:15
21
:15
22
:15
23
:15
Flo
w R
ate
(gp
m)
Runs R1-R4 - March 4th Slab CHW Supply Flow Rate
Radiant Floor CHW Flow (gpm) Run4 Radiant Floor CHW Flow (gpm) Run1
Radiant Floor CHW Flow (gpm) Run2 Radiant Floor CHW Flow (gpm) Run3
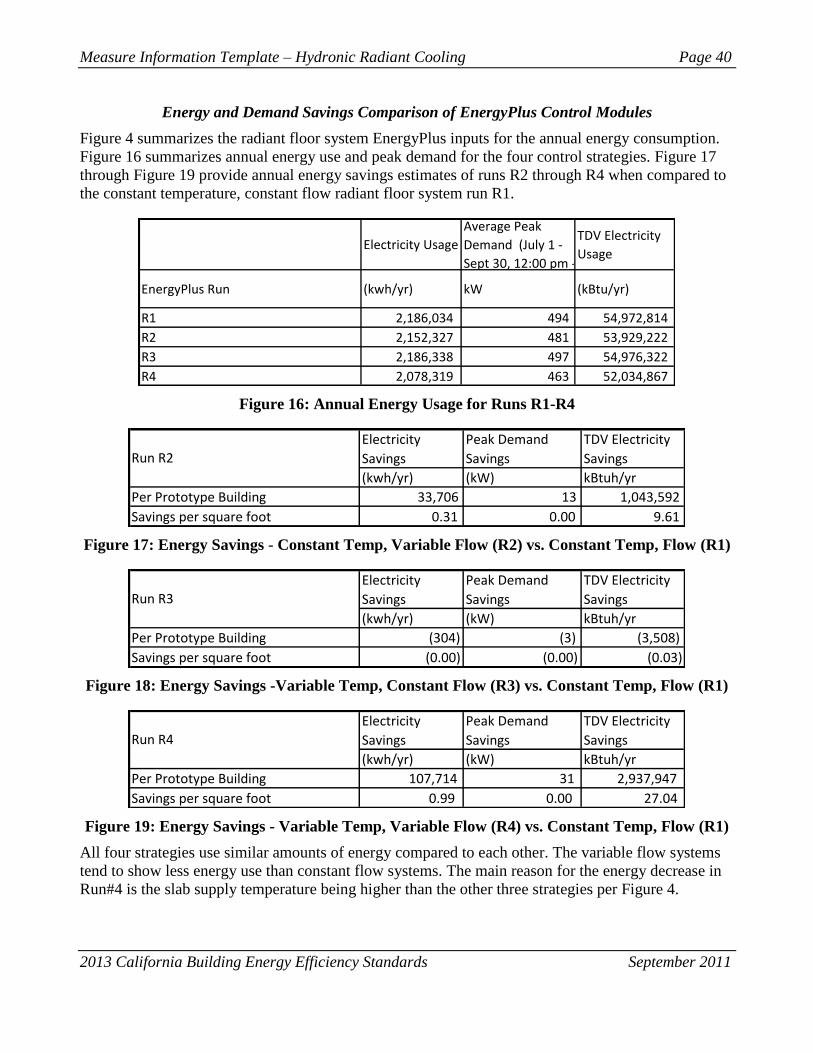
Measure Information Template – Hydronic Radiant Cooling Page 40
2013 California Building Energy Efficiency Standards September 2011
Energy and Demand Savings Comparison of EnergyPlus Control Modules
Figure 4 summarizes the radiant floor system EnergyPlus inputs for the annual energy consumption.
Figure 16 summarizes annual energy use and peak demand for the four control strategies. Figure 17
through Figure 19 provide annual energy savings estimates of runs R2 through R4 when compared to
the constant temperature, constant flow radiant floor system run R1.
Figure 16: Annual Energy Usage for Runs R1-R4
Figure 17: Energy Savings - Constant Temp, Variable Flow (R2) vs. Constant Temp, Flow (R1)
Figure 18: Energy Savings -Variable Temp, Constant Flow (R3) vs. Constant Temp, Flow (R1)
Figure 19: Energy Savings - Variable Temp, Variable Flow (R4) vs. Constant Temp, Flow (R1)
All four strategies use similar amounts of energy compared to each other. The variable flow systems
tend to show less energy use than constant flow systems. The main reason for the energy decrease in
Run#4 is the slab supply temperature being higher than the other three strategies per Figure 4.
Electricity Usage
Average Peak
Demand (July 1 -
Sept 30, 12:00 pm -
TDV Electricity
Usage
EnergyPlus Run (kwh/yr) kW (kBtu/yr)
R1 2,186,034 494 54,972,814
R2 2,152,327 481 53,929,222
R3 2,186,338 497 54,976,322
R4 2,078,319 463 52,034,867
Electricity
Savings
Peak Demand
Savings
TDV Electricity
Savings
(kwh/yr) (kW) kBtuh/yr
Per Prototype Building 33,706 13 1,043,592
Savings per square foot 0.31 0.00 9.61
Run R2
Electricity
Savings
Peak Demand
Savings
TDV Electricity
Savings
(kwh/yr) (kW) kBtuh/yr
Per Prototype Building (304) (3) (3,508)
Savings per square foot (0.00) (0.00) (0.03)
Run R3
Electricity
Savings
Peak Demand
Savings
TDV Electricity
Savings
(kwh/yr) (kW) kBtuh/yr
Per Prototype Building 107,714 31 2,937,947
Savings per square foot 0.99 0.00 27.04
Run R4
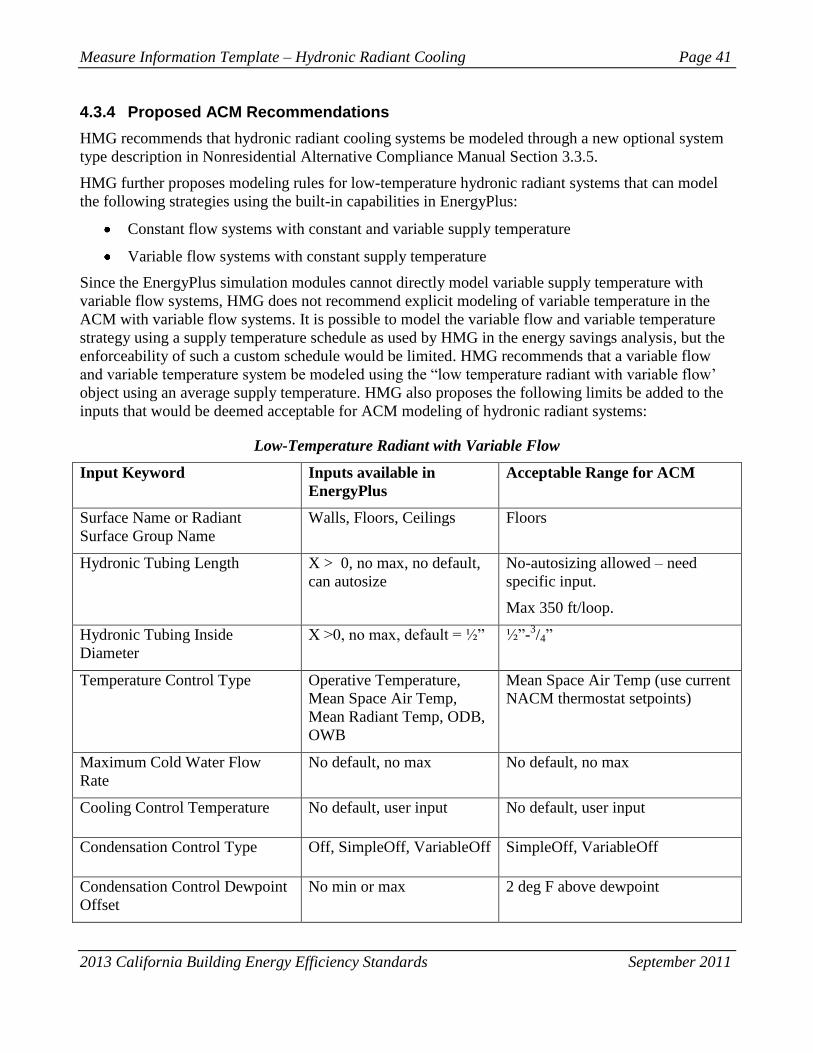
Measure Information Template – Hydronic Radiant Cooling Page 41
2013 California Building Energy Efficiency Standards September 2011
4.3.4 Proposed ACM Recommendations
HMG recommends that hydronic radiant cooling systems be modeled through a new optional system
type description in Nonresidential Alternative Compliance Manual Section 3.3.5.
HMG further proposes modeling rules for low-temperature hydronic radiant systems that can model
the following strategies using the built-in capabilities in EnergyPlus:
Constant flow systems with constant and variable supply temperature
Variable flow systems with constant supply temperature
Since the EnergyPlus simulation modules cannot directly model variable supply temperature with
variable flow systems, HMG does not recommend explicit modeling of variable temperature in the
ACM with variable flow systems. It is possible to model the variable flow and variable temperature
strategy using a supply temperature schedule as used by HMG in the energy savings analysis, but the
enforceability of such a custom schedule would be limited. HMG recommends that a variable flow
and variable temperature system be modeled using the ―low temperature radiant with variable flow‘
object using an average supply temperature. HMG also proposes the following limits be added to the
inputs that would be deemed acceptable for ACM modeling of hydronic radiant systems:
Low-Temperature Radiant with Variable Flow
Input Keyword Inputs available in
EnergyPlus
Acceptable Range for ACM
Surface Name or Radiant
Surface Group Name
Walls, Floors, Ceilings Floors
Hydronic Tubing Length X > 0, no max, no default,
can autosize
No-autosizing allowed – need
specific input.
Max 350 ft/loop.
Hydronic Tubing Inside
Diameter
X >0, no max, default = ½‖ ½‖-3/4‖
Temperature Control Type Operative Temperature,
Mean Space Air Temp,
Mean Radiant Temp, ODB,
OWB
Mean Space Air Temp (use current
NACM thermostat setpoints)
Maximum Cold Water Flow
Rate
No default, no max No default, no max
Cooling Control Temperature No default, user input No default, user input
Condensation Control Type Off, SimpleOff, VariableOff SimpleOff, VariableOff
Condensation Control Dewpoint
Offset
No min or max 2 deg F above dewpoint
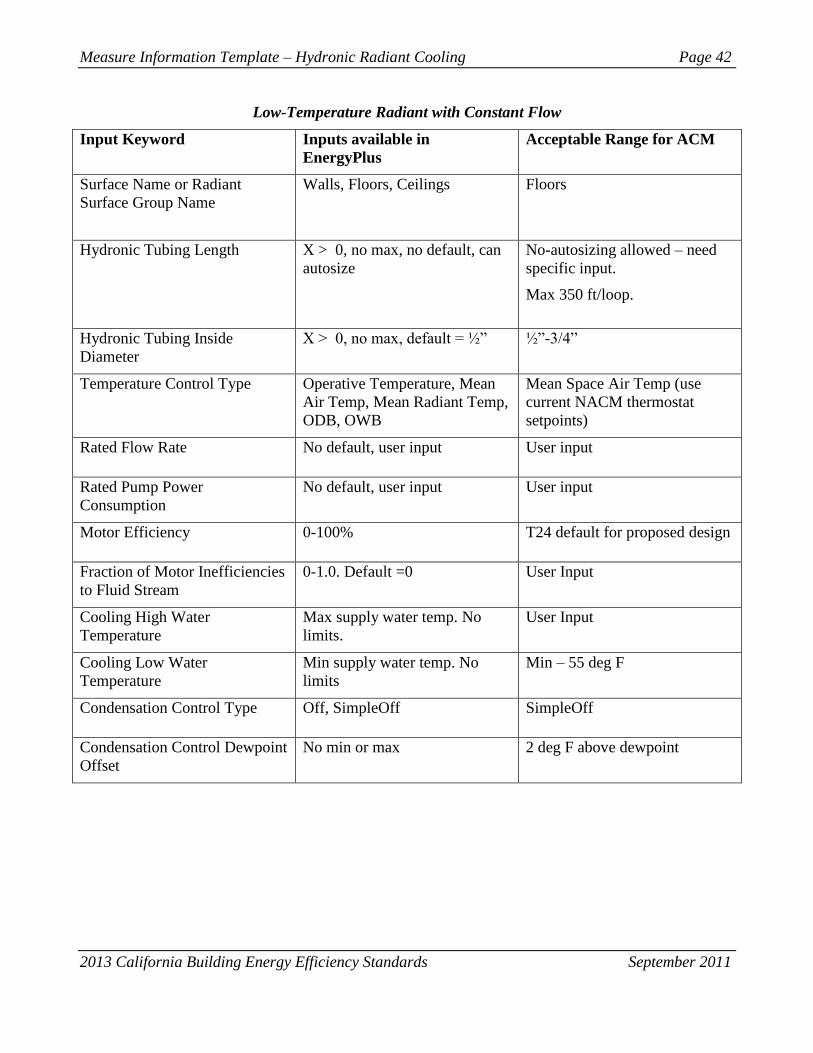
Measure Information Template – Hydronic Radiant Cooling Page 42
2013 California Building Energy Efficiency Standards September 2011
Low-Temperature Radiant with Constant Flow
Input Keyword Inputs available in
EnergyPlus
Acceptable Range for ACM
Surface Name or Radiant
Surface Group Name
Walls, Floors, Ceilings Floors
Hydronic Tubing Length X > 0, no max, no default, can
autosize
No-autosizing allowed – need
specific input.
Max 350 ft/loop.
Hydronic Tubing Inside
Diameter
X > 0, no max, default = ½‖ ½‖-3/4‖
Temperature Control Type Operative Temperature, Mean
Air Temp, Mean Radiant Temp,
ODB, OWB
Mean Space Air Temp (use
current NACM thermostat
setpoints)
Rated Flow Rate No default, user input User input
Rated Pump Power
Consumption
No default, user input User input
Motor Efficiency 0-100% T24 default for proposed design
Fraction of Motor Inefficiencies
to Fluid Stream
0-1.0. Default =0 User Input
Cooling High Water
Temperature
Max supply water temp. No
limits.
User Input
Cooling Low Water
Temperature
Min supply water temp. No
limits
Min – 55 deg F
Condensation Control Type Off, SimpleOff SimpleOff
Condensation Control Dewpoint
Offset
No min or max 2 deg F above dewpoint
Measure Information Template – Hydronic Radiant Cooling Page 43
2013 California Building Energy Efficiency Standards September 2011
5. Recommended Language for the Standards Document,
ACM Manuals, and the Reference Appendices
The proposed nonresidential ACM language will be developed in coordination with the California
Energy Commission (CEC) contractors who are developing the 2013 ACM. These efforts include
making the ACM software neutral through the use of standard data dictionary definitions being
developed by the CEC contractors instead of DOE2.1E specific keywords and calculation algorithms.

Measure Information Template – Hydronic Radiant Cooling Page 44
2013 California Building Energy Efficiency Standards September 2011
6. Bibliography and Other Research
This section lists research studies, reports, presentations and personal communications that provided
background for this CASE topic.
6.1 Experts Consulted
HMG consulted with experts at various organizations per below:
Peter Simmonds – Peter Simmonds provided technical oversight to the CASE team. Mr.
Simmonds provided references to research reports and articles on radiant cooling applications,
shared his extensive knowledge of designing radiant cooling systems including rules of thumb
and detailed calculation procedures for radiant cooling system design.
National Renewable Energy Laboratories (NREL) – Ian Doebber of NREL shared results from
monitoring projects conducted by NREL for the WalMart high efficiency stores in
Sacramento, CA and Las Vegas, NV. Mr Doebber also shared simulation results for the
Sacramento store conducted using EnergyPlus and documented in an ASHRAE journal article.
Brent Griffith of NREL provided assistance with troubleshooting EnergyPlus models
developed by HMG.
6.2 Reports Reviewed
Doebber Ian, Moore Mike P.E., Deru Michael P.E. ―Radiant Slab Cooling for Retail.‖
ASHRAE Journal vol. 52, no. 12, December -2010.
Strand, R.K., Pedersen, C.O. ―Implementation of a Radiant Heating and Cooling Model into
an Integrated Building Energy Analysis Program.‖ ASHRAE Trans. 1997, Vol.103, Part 1,
Paper number PH-97-14-2, 949-958.
Strand, R.K., Pedersen, C.O. ―Modeling Radiant Systems in an Integrated Heat Balance Based
Energy Simulation Program.‖ ASHRAE 2002 Annual Conference Proceedings.
Simmonds Peter. ―Control Strategies for Combined Heating and Cooling Radiant Systems.‖
ASHRAE Trans., 1994, vol.100, part 1, paper no.NO-94-13-4, 1031-1039.
Simmonds Peter. ―Practical Applications of Radiant Heating and Cooling to Maintain Comfort
Conditions.‖ ASHRAE Trans., 1996, vol.102, part 1, paper no. AT-96-7-2, 659-666. 1996.
Genest Frederic, Minea Vasile. ―High-Performance Retail Store with Integrated HVAC
Systems.‖ ASHRAE Trans., vol. 112, pt. 2, paper no. QC-06-032, p. 342-348.
Simmonds Peter, Mehlomakulu Bungane, Ebert Thilo. ―Radiant Cooled Floors— Operation
and Control Dependant upon Solar Radiation.‖ ASHRAE Transactions, vol. 112(2):358-367,
2006
ANSI/ASHRAE Standard 55-2010, Thermal Environmental Conditions for Human
Occupancy.
2009 ASHRAE Handbook—Fundamentals, Chapter 9, Thermal Comfort.
Olesen, B.W., Michel, E., Bonnefoi, F., De Carli, M. 2000. ―Heat exchange coefficient
between floor surface and space by floor cooling: theory or a question of definition.‖
ASHRAE Transactions 106(1):684-694.
DOE. 2010. ―EnergyPlus Energy Simulation Software.‖ Washington, D.C., U.S. Department
of Energy. www.eere.energy.gov/buildings/energyplus/.
Measure Information Template – Hydronic Radiant Cooling Page 45
2013 California Building Energy Efficiency Standards September 2011
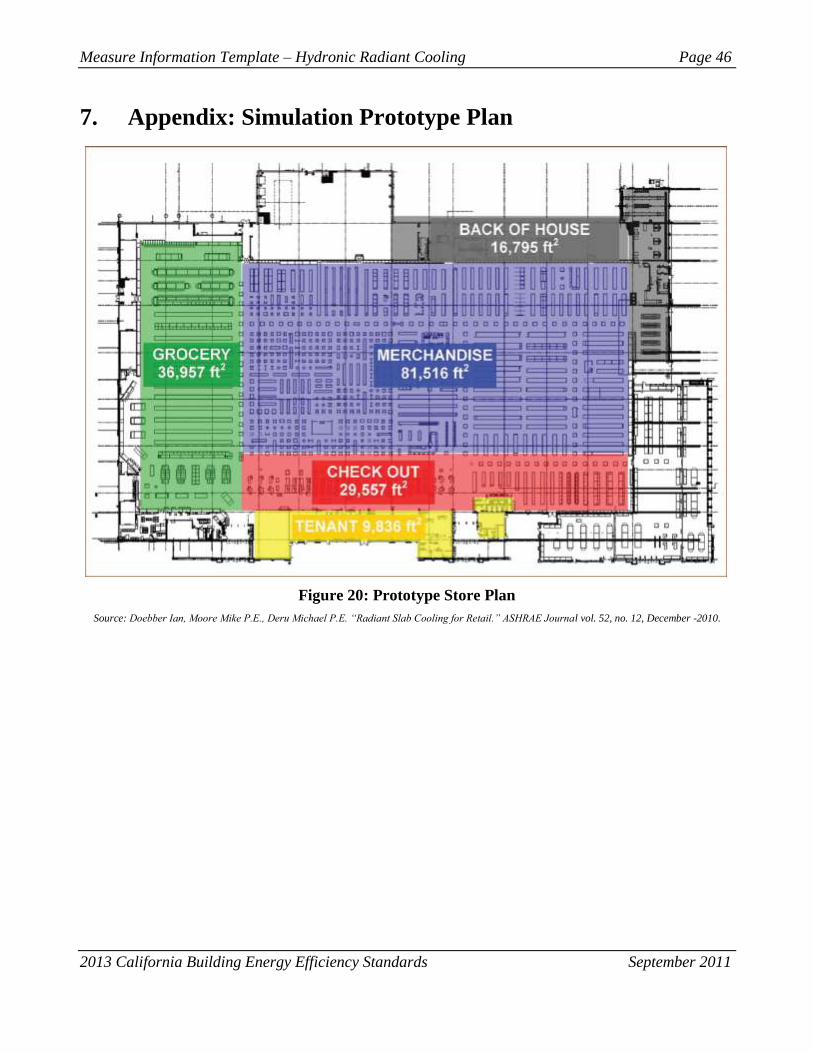
Measure Information Template – Hydronic Radiant Cooling Page 46
2013 California Building Energy Efficiency Standards September 2011
7. Appendix: Simulation Prototype Plan
Figure 20: Prototype Store Plan
Source: Doebber Ian, Moore Mike P.E., Deru Michael P.E. “Radiant Slab Cooling for Retail.” ASHRAE Journal vol. 52, no. 12, December -2010.