HYDROLOGY OF BEDROCK AQUIFERS N THE … · hydrology of bedrock aquifers n the north^^^reat plains...
96
HYDROLOGY OF BEDROCK AQUIFERS N THE NORTH^^^REAT PLAINS ARTS OF MO NTjMi NORTH DAKOTA, SOUTH DAKOTA, AND WYOMING I U.S. GEOLOGICAL SURVEY PROFESSIONAL PAPER 1402-E
-
Upload
phungtuyen -
Category
Documents
-
view
218 -
download
0
Transcript of HYDROLOGY OF BEDROCK AQUIFERS N THE … · hydrology of bedrock aquifers n the north^^^reat plains...

HYDROLOGY OF BEDROCK AQUIFERS N THE NORTH^^^REAT PLAINS ARTS OF MO NTjMi NORTH DAKOTA, SOUTH DAKOTA, AND WYOMING
I
U.S. GEOLOGICAL SURVEY PROFESSIONAL PAPER 1402-E

Geohydrology of Bedrock Aquifers in the Northern Great Plains in Parts of Montana, North Dakota, South Dakota, and Wyoming
By JOE S. DOWNEY
REGIONAL AQUIFER-SYSTEM ANALYSIS
U.S. GEOLOGICAL SURVEY PROFESSIONAL PAPER 1402-E
U.S. GOVERNMENT PRINTING OFFICE, WASHINGTON : 1986

DEPARTMENT OF THE INTERIOR
DONALD PAUL HODEL, Secretary
U.S. GEOLOGICAL SURVEY
Dallas L. Peck, Director
Library of Congress Cataloging-in-Publication Data
Downey, Joe S.Geohydrology of bedrock aquifers in the northern Great Plains in parts of Montana, North Dakota, South Dakota, and
Wyoming.
(U.S. Geological Survey professional paper ; 1402-E)"A contribution of the Regional Aquifer Systems Analysis Program."Bibliography: p. 82Supt. of Docs. no. : I 19.16:1402/E1. Groundwater flow Great Plains Data processing. 2. Groundwater flow Great Plains Mathematical models. 3. Aquif
ers Great Plains. 4. Geology Great Plains. I. National Aquifer Systems Analysis Program (U.S.). II. Title. III. Series.
GB1197.7.D69 1986 551.49'0978 84-600378
For sale by the Books and Open-File Reports Section, U.S. Geological Survey, Federal Center, Box 25425, Denver, CO 80225

FOREWORD
THE REGIONAL AQUIFER-SYSTEM ANALYSIS PROGRAM
The Regional Aquifer-System Analysis (RASA) program was started in 1978 after a congressional mandate to develop quantitative appraisals of the major ground-water systems of the United States. The RASA program represents a systematic effort to study a number of the Nation's most important aquifer systems that, in aggregate, underlie much of the country and that represent an important component of the Nation's total water supply. In general, the boundaries of these studies are identified by the hydrologic extent of each system and accordingly transcend the political subdivi sions to which investigations have often been arbitrarily limited in the past. The broad objective for each study is to assemble geologic, hydrologic, and geochemical informa tion, to analyze and develop an understanding of the system, and to develop predictive capabilities that will contribute to the effective management of the system. The use of computer simulation is an important element of the RASA studies, both to develop an understanding of the natural, undisturbed hydrologic system, and the changes brought about in it by human activities, and to provide a means of predicting the regional effects of future pumping or other stresses.
The final interpretive results of the RASA program are presented in a series of U.S. Geological Survey Professional Papers that describe the geology, hydrology, and geochemistry of each regional aquifer system. Each study within the RASA program is assigned a single Professional Paper number, and, where the volume of interpretive material warrants, separate topical chapters that consider the principal elements of the investigation may be published. The series of RASA interpretive reports begins with Professional Paper 1400 and thereafter will continue in numerical sequence as the interpretive products of subsequent studies become available.
Dallas L. Peck Director
III


CONTENTS
Abstract- ----------------------------------- ElIntroduction --------------------------------- i
Geographic setting --------------------------- 2Previous work ----------------------------- 3Acknowledgments --------------------------- 3
Geologic setting ------------------------------- 3Precambrianrocks --------------------------- 5Cambrian and Lower Ordovician rocks ---------------- 5Ordovicianrocks ---------------------------- 7Silurian and Devonian rocks ---------------------- 9Mississippian rocks --------------------------- 10Pennsylvanian and Permian rocks ------------------ 13Triassic rocks ------------------------------ 15Jurassic rocks ------------------------------ 16Lower Cretaceous rocks ------------------------ 18Upper Cretaceous rocks ------------------------ 20Tertiary rocks ------------------------------ 20
Geologic structure ------------------------------ 22Hydrologic setting ------------------------------ 23
Digital-simulation model -------------------------- E27Theory ---------------------------------- 27Assumptions and limitations of the model analysis --------- 31Model calibration ---------------------------- 31Boundary conditions -------------------------- 32Hydraulic head ----------------------------- 32
Cambrian-Ordovician, Madison, andPennsylvanian aquifers ------------------- 32
Lower and Upper Cretaceous aquifers --------------- 32Transmissivity ----------------------------- 38
Cambrian-Ordovician, Madison, and Pennsylvanianaquifers --------------------------- 38
Lower and Upper Cretaceous aquifers --------------- 57Vertical hydraulic conductivity -------------------- 62Storage coefficient --------------------------- 64
Discussion of the regional flow system on the basis of modelsimulations ------------------------------ 64
Summary ----------------------------------- 81Glossary- ----------------------------------- 82Selected references ----------------------------- 82
ILLUSTRATIONS
[Plates are in pocket]
PLATE 1. Generalized geologic correlation chart of Paleozoic rocks of the northern Great Plains.2. Generalized geologic correlation chart of Jurassic, Cretaceous (Mesozoic), and Tertiary rocks of the northern Great Plains.3. Map showing hydrologic flow system in Paleozoic and Mesozoic aquifers in the northern Great Plains.
Page
FIGURE 1. Map showing location of study area, Fort Union coal region, and U.S. Geological Survey test wells -------------- E22. Map showing present-day structural and physiographic features of the northern Great Plains ----------------- 43. Diagrammatic cross section from ground-water recharge area to discharge area showing relation of aquifers and confining
layers in the northern Great Plains, Montana and North Dakota ------------------------------ 54-11. Maps showing:
4. Thickness and extent of Cambrian and Lower Ordovician rocks ------------------------------- 65. Thickness and lithology of the Deadwood and Emerson Formations of Late Cambrian and Early Ordovician age - - - 76. Thickness and extent of Ordovician rocks ------------------------------------------- 87. Thickness and lithology of the Red River Formation of Late Ordovician age ------------------------ 98. Thickness and lithology of the Interlake Formation of Late Ordovician and Silurian age ----------------- 109. Thickness of Devonian rocks --------------------------------------------------- H
10. Location and extent of the Bakken Formation of Late Devonian and Early Mississippian age -------------- 1211. Thickness and lithology of the Madison Limestone of Mississippian age --------------------------- 13
12. Photograph showing solution features in marine limestone ------------------------------------ 14

VI REGIONAL AQUIFER-SYSTEM ANALYSIS
Page FlGURK 13-22. Maps showing:
13. Thickness and lithology of the Big Snowy Group of Late Mississippian age ------------------------- E1514. Thickness and lithology of Pennsylvanian and Permian rocks -------------------------------- 1615. Thickness and lithology of Triassic rocks -------------------------------------------- 1716. Thickness and extent of Jurassic rocks --------------------------------------------- 1817. Thickness and extent of Lower Cretaceous rocks --------------------------------------- 19
18. Thickness of Cretaceous sedimentary deposits, from the top of the Newcastle Sandstone to the top ofthe Pierre Shale ------------------------------------------------------- 21
19. Major Paleozoic structural features ----------------------------------------------- 2320. Linear trends in sedimentary deposits of the Madison aquifer -------------------------------- 2421. Lineament patterns in the northern Great Plains, from Landsat imagery -------------------------- 2522. Subsurface paleolineament zones of Jurassic and Cretaceous age ------------------------------ 26
23. Chart showing Pleistocene glaciations and interglaciations ------------------------------------ 2824. Map showing extent of Laurentide (Wisconsin) ice in the northern Great Plains ------------------------- 2925. Finite-difference grid for digital simulation of the hydrologic system ------------------------------- 30
26-48. Maps showing:26. Constant-head nodes used in model simulation of the Cambrian-Ordovician aquifer -------------------- 3327. Constant-head nodes used in model simulation of the Madison aquifer --------------------------- 3428. Constant-head nodes used in model simulation of the Pennsylvanian aquifer ------------------------ 3529. Constant-head nodes used in model simulation of the Lower Cretaceous aquifer ---------------------- 3630. Constant-head nodes used in model simulation of the Upper Cretaceous aquifer ---------------------- 3731. Potentiometric surface of the Cambrian-Ordovician aquifer --------------------------------- 3832. Potentiometric surface of the Madison aquifer ----------------------------------------- 3933. Potentiometric surface of the Pennsylvanian aquifer ------------------------------------- 4034. Concentration of dissolved solids in water from the Cambrian-Ordovician aquifer --------------------- 4135. Concentration of dissolved solids in water from the Silurian and Devonian formations ------------------ 4236. Concentration of dissolved solids in water from the Madison aquifer ---------------------------- 4337. Concentration of dissolved solids in water from the Pennsylvanian aquifer ------------------------- 4438. Concentration of dissolved solids in water from the Triassic and Jurassic formations ------------------- 4539. Concentration of dissolved solids in water from the Lower Cretaceous aquifer ----------------------- 4640. Potentiometric surface of the Lower Cretaceous aquifer ----------------------------------- 4741. Potentiometric surface of the Upper Cretaceous aquifer ----------------------------------- 4342. Simulated potentiometric surface of the Cambrian-Ordovician aquifer --------------------------- 4943. Simulated potentiometric surface of the Madison aquifer ----------------------------------- 5944. Simulated potentiometric surface of the Pennsylvanian aquifer ------------------------------- 5145. Simulated potentiometric surface of the Lower Cretaceous aquifer ----------------------------- 5246. Transmissivity distribution used in the Cambrian-Ordovician aquifer simulations --------------------- 5347. Transmissivity distribution used in the Madison aquifer simulations ---------------------------- 5448. Transmissivity distribution used in the Pennsylvanian aquifer simulations ------------------------- 55
49. Graph showing relation between viscosity of water and temperature ------------------------------- 5650-61. Maps showing:
50. Water temperatures in the Cambrian-Ordovician aquifer ----------------------------------- 5751. Water temperatures in the Madison aquifer ------------------------------------------ 5852. Water temperatures in the Lower Cretaceous aquifer ------------------------------------- 5953. Water temperatures in the Upper Cretaceous aquifer ------------------------------------- 6054. Porosity distribution in the Cambrian-Ordovician aquifer ----------------------------------- 6155. Porosity distribution in the Madison aquifer ------------------------------------------ 62
56. Transmissivity distribution used in the Lower Cretaceous aquifer simulations ----------------------- 6357. Transmissivity distribution used in the Upper Cretaceous aquifer simulations ----------------------- 6458. Vertical hydraulic conductivity of confining layer TK1 used in the aquifer simulations ------------------ 6559. Vertical hydraulic conductivity of confining layer TK2 used in the aquifer simulations ------------------ 6660. Vertical hydraulic conductivity of confining layer TK3 used in the aquifer simulations ------------------ 6761. Vertical hydraulic conductivity of confining layer TK4 used in the aquifer simulations ------------------ 68
62. Generalized hydrogeologic cross section showing characteristics of ground-water recharge, flow, leakage, and discharge inthe northern Great Plains ---------------------------------------------------- 69
63. Map showing rates of movement of water in the Cambrian-Ordovician aquifer ------------------------- 7164. Map showing rates of movement of water in the Madison aquifer --------------------------------- 7265. Diagrammatic cross section showing general locations of brine in the Williston basin of the northern Great Plains ----- 7366. Generalized hydrogeologic cross section across eastern Walsh County, N. Dak., showing discharge area of Cambrian-
Ordovician aquifer -------------------------------------------------------- 74
67. Generalized hydrogeologic cross section showing ground-water discharge from Paleozoic to Mesozoic rocks --------- 7568-72. Maps showing:
68. Area of inferred leakage between Paleozoic and Mesozoic aquifers ----------------------------- 7669. Distribution of chemical facies for water in the Cambrian-Ordovician aquifer ----------------------- 77

GEOHYDROLOGY OF BEDROCK AQUIFERS IN THE NORTHERN GREAT PLAINS VII
Page
FIGURE 70. Distribution of chemical facies for water in the Madison aquifer ------------------------------- E7871. Distribution of chemical facies for water in the Pennsylvanian aquifer --------------------------- 7972. Distribution of chemical facies for water in the Lower Cretaceous aquifer ------------------------- 80
TABLES
TABLE 1. Adjustments to transmissivity, based on water temperature in aquifers ----------------------------- E562. Transmissivity adjustment factors based on thickness of rock with porosity greater than 10 percent ------------- 57
METRIC CONVERSION TABLE
Inch-pound units in this report may be converted to International System of Units (SI) by using the following conversion factors:
Multiply inch-pound units By To obtain SI units
acre-feet (acre-ft) 1,233.50 cubic meters (m3) cubic feet per second (ft3/s) 0.02832 cubic meters per
second (m3/s)cubic miles (mi3) 4.168 cubic kilometers (km3) feet (ft) 0.3048 meters (m)
30.48 centimeters (cm)feet per second (ft/s) 0.3048 meters per second (m/s) square feet per day (ft2/d) 0.0929 square meters per day
(m2/d) square feet per second (ft2/s) 0.0929 square meters per
second (m2/s)inches (in.) 2.540 centimeters (cm)
25.40 millimeters (mm)miles (mi) 1.609 kilometers (km) pounds per square inch (lb/in2) 0.07037 kilograms per square
centimeter (kg/cm2) square miles (mi2) 2.59001 square kilometers
(km2)degrees Fahrenheit (°F) °C =(°F-32)/1.8 degrees Celsius (°C) million gallons per year 0.003785 cubic meters per annum
(Mgal/yr) (m3/a)


REGIONAL AQUIFER-SYSTEM ANALYSIS
GEOHYDROLOGY OF BEDROCK AQUIFERS IN THE NORTHERN GREAT PLAINS IN PARTS OF MONTANA, NORTH DAKOTA, SOUTH
DAKOTA, AND WYOMING
By JOE S. DOWNEY
ABSTRACT
Development of energy-related resources in the northern Great Plains of the United States, an area that includes northeastern Wyoming and eastern Montana, North Dakota, and South Dakota, will require large quan tities of ground water. Because Montana, North Dakota, South Dakota, and Wyoming are semiarid, the primary local sources of nonappropriated water are the deep bedrock aquifers of Paleozoic and Mesozoic age. Because of the need to understand the hydrologic system of these bedrock aquifers, the U.S. Geological Survey undertook a 4-year interdisciplinary study that has culminated in a digital-simulation model of the regional flow system and incorporates the results of geochemical, hydrologic, and geologic studies.
Rocks of Paleozoic and Mesozoic age underlie the entire northern Great Plains. These rocks form at least five artesian aquifers that are recharged in the mountainous areas of Montana, South Dakota, and Wyoming. The aqui fers extend for more than 600 mi to discharge areas in the northeastern part of North Dakota and in the Canadian province of Manitoba. In general, the direction of flow in each aquifer is east to northeast, but flow is deflected to the north and south around the Williston basin. Flow through the Williston basin is restricted because of brine (200,000-350,000 mg/L), halite beds, geologic structures, and decreased permeability of rocks in the deeper parts of the basin.
Fracture systems and lineaments transverse the entire area and act either as conduits or as barriers to ground-water flow, depending on their hydrogeologic and geochemical history. Vertical leakage from the aquifers is restricted by shale with low permeability, by halite beds, and by stratigraph- ic traps or low-permeability zones associated with petroleum accumulations. However, interaquifer leakage appears to occur through and along some of the major lineaments and fractures. Interaquifer leakage may be a major consideration in determining the quality of water produced from wells.
INTRODUCTION
The northern Great Plains (NGP) physiographic prov ince includes an area of more than 300,000 mi2 in the north- central part of the United States. The area is bounded on the west by the Middle and Northern Rocky Mountains and on the east by the Central Lowland province. The NGP physio graphic province extends into Canada on the north; in gener al, however, this study was limited to the areas south of the United States-Canadian border (fig. 1). This study also in
cluded a part of the Central Lowland province in eastern North Dakota and South Dakota.
In general, the study area is characterized by broad, flat, gently rolling plains, underlain by sandstone and shale, that have been dissected by streams crossing the plains. At sites where streams deeply cut into the soft rocks, the relief may reach several hundreds of feet.
The broad, flat expanse of plains is interrupted by the Black Hills of South Dakota and by the Rocky Mountains (fig. 2). These highland areas are the site of major recharge to the NGP aquifers.
Development of energy-related resources, power gener ation, industrial development, increasing irrigation, and in creased water supply for domestic and municipal use in the NGP area are dependent on the availability of water re sources. Streamflow historically has satisfied many of the water needs; however, surface water not only has been ap propriated fully in much of the area but also is an undepend- able supply because flows are extremely variable. Long-term, large-scale water needs will require development of produc tive bedrock aquifers, some of which have been little used in the past. Without knowledge of the hydrologic characteristics of the ground-water system and of its response to withdraw als, large, sustained yields of ground water cannot be pro duced efficiently, and sound management plans cannot be formulated.
Proper development, use, and conservation of ground- water resources can be achieved only through an understand ing of the regional geologic framework (pis. 1 and 2; fig. 3) and its effect on the response of the hydrologic system to climate and water-supply development. Within the limits of time, personnel, and available data, the objectives of the Northern Great Plains Aquifer Project were as follows:1. to define the regional geologic framework that controls
ground-water flow,2. to define the chemical characteristics of the water in the
aquifers,
El

E2 REGIONAL AQUIFER-SYSTEM ANALYSIS
3. to define the ground-water flow patterns, and4. to determine areas suitable for development with opti
mum well yields.To accomplish these objectives, studies of stratigraphy,
mineralogy, hydrology, geophysics, sedimentary and struc tural controls that govern permeability distribution, and hy- drologic properties of the aquifers were conducted on a re gional basis. This report is one of several resulting from the study; the report covers the geohydrologic aspects of the rock units from the Precambrian basement to the land surface. Some interpretations in the report depend heavily on infor mation obtained during a study of the Madison aquifer
(Brown and others, 1982; MacCary, Gushing, and Brown, 1983; Downey, 1982).
GEOGRAPHIC SETTING
This study encompasses parts of the NGP and Central Lowland physiographic provinces of the United States and includes northeastern Wyoming and eastern Montana, North Dakota, and South Dakota (fig. 1). Major physiographic fea tures in the western part of the study area include the Big horn Mountains, the Laramie Mountains, the Hartville uplift,
\ CHEYENNE
.COLORADO .
200 MILES
-i H r'
200 KILOMETERS
EXPLANATION
APPROXIMATE BOUNDARY OF STUDY AREA
FORT UNION COAL REGION
US. GEOLOGICAL SURVEYTEST WELL PENE TRATING THE PIERRE SHALE
U S GEOLOGICAL SURVEY TEST WELL PENE TRATING THE MADISON AQUIFER
FIGURE 1. Location of study area, Fort Union coal region, and U.S. Geological Survey test wells.

GEOHYDROLOGY OF BEDROCK AQUIFERS IN THE NORTHERN GREAT PLAINS E3
the Big Snowy Mountains, and the Black Hills uplift. In the east, the study area is characterized by a nearly flat area that contains the broad, flat, lake plain formed by glacial Lake Agassiz in the northeastern part of North Dakota (pi. 3).
Glacial Lake Agassiz covered an area of about 200,000 mi2 during the late Pleistocene, in the Canadian provinces of Ontario, Manitoba, and Saskatchewan and in Minnesota, North Dakota, and the northeastern part of South Dakota (Elson, 1967). However, during most phases of Lake Agas siz, the surface area probably did not exceed 80,000 mi2 .
The NGP regional aquifer study area is located in the interior of the North American Continent; this location has a major effect on the prevailing climate. The climate is classi fied as middle-latitude steppes and occupies a transitional zone between arid lands to the west and more humid climate to the east. In general, winters in the study area are cold and snowy with occasional blizzards. Summers have warm days and cool nights and isolated thunderstorms that occur in the late afternoons and evenings. The major weather systems that cross the area, however, bring a variety of weather in all seasons. Precipitation in the form of rain and snow occurs throughout the area, with the least precipitation in the interi or of the area and the greatest precipitation in the mountain ous highland areas in the west.
The major rivers draining the area include the Yellow- stone, Missouri, North Platte, and Red River of the North and their tributaries. The Red River of the North forms the eastern boundary of the study area.
PREVIOUS WORK
Abundant mineral resources, including petroleum, natu ral gas, uranium, and coal, lie within the project area. Eco nomic interest has prompted many reports on geologic struc ture, stratigraphy, mineralization, and economic geology of the area. Important publications on regional geologic struc ture and subsurface and surface stratigraphy of the project area and surrounding regions include Thorn (1923); Nord- quist (1953); Agatston (1954); Andrichuck (1955); Sonnen- berg (1956); Peterson (1957, 1966, 1972, 1978, 1981); Sandberg and Hammond (1958); Sandberg (1961); Irwin (1965); Keefer and Van Lieu (1966); Maughan (1966, 1967); Jennings (1967); Roehl (1967); Sales (1968); Stone (1969, 1970, 1971); Keefer (1970); Thomas (1971, 1974); Sando, MacKenzie, and Dutro (1975); Rose (1976); Sando and others (1976); Sando (1976a, b); Sandberg and Poole (1977); Brown (1978); Warner (1978); Head, Kilty, and Knottek (1979); and Brown and others (1982).
The number of regional and subregional studies of the hydrology and geochemistry of the project area and sur rounding region is limited. Some of the more important are Darton (1896); Swenson (1968); Downey (1973, 1982); Wyo ming State Engineer's Office (1974); Konikow (1976); Miller
(1976); Swenson and others (1976); Hopkins (1978); Miller and Strausz (1980a, b); and Busby, Lee, and Hanshaw (1983).
Historically, the geologic environment of the project area was that of a stable shelf margin throughout most of Paleozoic time. Most authors agree that periods of transgres sion and regression occurred, when seas advanced from west to east in response to mountain-building activity of the Ant ler orogeny to the west (Sandberg, 1962; Sandberg and Poole, 1977).
The style of structural deformation has been explained in terms of horizontal compression (Sales, 1968; Stone, 1969), vertical tectonics (Sterns, Sacrison, and Hanson, 1975), and wrench-fault tectonics (Brown, 1978). Although the mechanics of deformation have little effect on the ex isting hydrologic system, geologists generally agree that the present-day structure is controlled by the preexisting struc tural grain in the Precambrian basement and modified by the Laramide orogeny. Several authors, including Sandberg (1962), Maughan (1966), Miller (1966), Sando and others (1976), Rose (1976), and Slack (1981), have suggested that paleostructure in various parts of the study area has had a pronounced effect on the thickness and environment of depo sition of sediments. Knowledge of sediment thickness is im portant in estimating various hydrologic parameters for the aquifer units at locations where test holes are absent.
ACKNOWLEDGMENTS
The NGP regional aquifer study was conducted by per sonnel of the U.S. Geological Survey in the Central Regional and District Offices in the States of Montana, North Dakota, South Dakota, and Wyoming. The author wishes to express his appreciation to all who spent many weeks and months assembling the data on which this report is based. The au thor also thanks the members of the many State agencies who contributed their support and cooperation.
GEOLOGIC SETTING
During most of Paleozoic time, the study area was part of the Cordilleran platform. This broad flat area was bor dered on the west by the Cordilleran miogeosyncline, which was oriented approximately north and south in Idaho and western Montana. Most of the detrital sediments in the syn clinal trough came from the Antler Orogenic Belt, which probably was an island arc system to the west that had intermittent tectonism during parts of Paleozoic time. The Transcontinental arch, southeast of the study area, was low lying and sporadically contributed minor amounts of sedi ment that ocean currents spread thinly across the platform. In general, the Cordilleran platform was a shallow-water depositional shelf on which predominantly carbonate and

REGIONAL AQUIFER-SYSTEM ANALYSIS
CRAZYMOUNTAIN
GREEN RIVERN AROCK / J BASIN
SPRINGS / / UPLIFT -^J BOW MTS
I URnA"i'!. ALUANCEi
WNTAi'Mt* i j WASHAKIE
200 KILOMETERS
FIGURE 2. Present-day structural and physiographic features of the northern Great Plains (includes lines of section A-A', B-B',C-C'). Modified fromPeterson (1981).
evaporite sediments were deposited during most of Paleozoic time.
The Black Hills uplift (fig. 2) was not a regionally sig nificant tectonic element until Late Cretaceous time (Agnew and Tychsen, 1965) and had little effect on sedimentation during most of Paleozoic time. During the Mississippian, the study area generally was covered by a shallow warm sea probably less than 10 ft deep; however, small areas seem to be characterized by deep-water sediments. The warm sea was conducive to prolific biologic productivity, accumulation, and preservation. Shoals and reefs were common under the generally shallow water conditions that prevailed in the study area. These shallow-water areas continually changed and shifted because of the effects of geologic forces. Many of these shallow-sea areas had small reefs associated with them, in addition to many oolite- and crinoid-bank shoals and lagoons. Lagoons were evaporating basins in which gypsum and halite precipitated and became incorporated into the lime-rich bottom sediments. Gypsum could precipitate in a
lagoonal environment that received influxes of sea water, whereas evaporation seldom would proceed to the point of halite precipitation. Accumulations of bedded halite that oc cur in the Williston basin and the central Montana trough evidence areas of more restricted circulation or greater evap oration rates.
During Cretaceous time, the study area was covered by a north-south trending sea, which extended from the Gulf of Mexico to the Arctic Ocean. Source areas to the west provid ed clastic sediments that were deposited in the Cretaceous sea. The Precambrian shield area, northeast of the study area, was a positive feature during the Cretaceous and pro vided sediments that were deposited in the eastern part of the Cretaceous sea. The Sioux uplift in eastern South Dakota provided sediment for two major delta systems that prograde into southeastern Montana.
The present-day structure (fig. 2) of the northern Great Plains is directly related to the geologic history of the Cordil- leran platform, which is a part of the stable interior of the

GEOHYDROLOGY OF BEDROCK AQUIFERS IN THE NORTHERN GREAT PLAINS
GLACIAL MATERIAL
/TERTIARY
UPPER CRETACEOUS
CRETACEOUS
LOWER CRETACEOUS
JURASSIC
TRIASSIC
PENNSYLVANIAN - PERMIAN
MISSISSIPPIAN
DEVONIAN
SILURIAN
CAMBRIAN - ORDOVICIAN
PENNSYLVANIAN - PERMIAN
PRECAMBRIAN
MISSISSIPPIAN
PENNSYLVANIAN - PERMIAN
MISSISSIPPIAN
EXPLANATION
AQUIFER LAYER
CONFINING LAYER
Line of section, A-A'', on figure 2.
FIGURE 3. Diagrammatic cross section from ground-water recharge area to discharge area. Cross section shows relation of aquifers and confining layers in the northern Great Plains, Montana and North Dakota.
North American Continent. During geologic time, many structural features developed that affected the deposition of the various sedimentary units. Most of these structural fea tures exist today and are important in determining the hy- drologic regime of the aquifers underlying the northern Great Plains (Weimer and others, 1982).
PRECAMBRIAN ROCKS
Crystalline rocks of Precambrian age form the basement in the NGP region. Depth to the Precambrian basement from land surface ranges from outcrops in the eastern part of the study area to greater than 17,000 ft at the center of the Williston basin. Precambrian rocks also are found in the central core of the many mountain ranges located in the western part of the study area.
On a regional basis, little is known about the hydrologic properties of the Precambrian rocks. Available data indicate
that the rocks contain only small amounts of water in joints and fractures. Except along major fractures, these rocks are not considered to be water bearing. Along major fractures, Precambrian rocks may yield water that is available from leakage from the overlying sedimentary sequence. Precam brian rocks in the study area represent the lower boundary of the regional aquifer system. In the eastern part of the study area where Precambrian rocks crop out, the rocks are as sumed to be no-flow boundaries of the aquifer system.
CAMBRIAN AND LOWER ORDOVICIAN ROCKS
Rocks of Cambrian and Early Ordovician age (fig. 4) in the northern Great Plains consist of marine sandstone, shale, and limestone that represent the shoreward facies of a trans- gressive sea that occupied the area during Cambrian and Early Ordovician time (Peterson, 1981). Several formations of Middle Cambrian to Early Ordovician age, such as the

E6 REGIONAL AQUIFER-SYSTEM ANALYSIS
Flathead Sandstone, Deadwood Formation, and Emerson Formation (fig. 5), are aquifers; however, their great depth has prevented their use as a source of water, and very little hydrologic data concerning these aquifers are available on a regional scale. Most of the data that exist are from well tests associated with development of oil and gas.
In the subsurface, both the Deadwood and Emerson Formations consist of about 640 ft of fine- to coarse-grained quartz sandstone and dolomitic cement interbedded with do- lomitic limestone and shale (Steece, 1978). Where it is ex posed in the Black Hills of South Dakota, the Deadwood Formation is of the same lithology; however, only about 450
ft of section is present. In the Black Hills, the Deadwood lies unconformably on Precambrian schist and quartzite.
As shown in figure 5, the Deadwood Formation is ab sent in extreme eastern North Dakota except for a small area in the eastern discharge area, where a thickness of about 100 ft of quartzose sandstone is present (Ballard, 1963). Both the Deadwood and Emerson Formations are overlain by the Middle Ordovician age Winnipeg Formation. In areas where the Deadwood or Emerson Formations are in hydrologic connection with the overlying Ordovician units, the formations have been included as part of the Cambrian- Ordovician aquifer.
96°^* CANADA?? , _._ ~ « \\ »
100 200 MILES
100 200 KILOMETERS
EXPLANATION
IGNEOUS INTRUSIVE ROCKS OF TERTIARY AGE
UPLIFT AREA Cambrian age or older rocks exposed at land surface
200 LINE OF EQUAL THICKNESS Interval 200 feet
FIGURE 4. Thickness and extent of Cambrian and Lower Ordovician rocks. Modified from Peterson (1981).

GEOHYDROLOGY OF BEDROCK AQUIFERS IN THE NORTHERN GREAT PLAINS E7
ORDOVICIAN ROCKS
Rocks of Ordovician age (fig. 6) in the northern Great Plains have been divided into several formational units, such as the upper part of the Deadwood and the Emerson Forma tions, the Winnipeg, Red River, and Stony Mountain Forma tions, and the Bighorn Dolomite. Subsurface studies of the Ordovician rocks in the Williston basin and adjoining areas include those by Fuller (1956), Carlson and Anderson (1960), Patterson (1961), Porter and Fuller (1964), Carlson and An derson (1965), Ballard (1969), Foster (1972), Armstrong (1980), and Peterson (1981).
Ordovician rocks are major petroleum reservoirs in the Williston basin, and many exploratory wells have been drilled in these rocks. Ordovician rocks are not present in western Montana, southeastern Wyoming, extreme southwestern and eastern South Dakota, and southeastern North Dakota be cause of nondeposition or removal by erosion during Devoni an and Early Mississippian time. Thickness increases east ward and northward from outcrop in central Montana and northeastern Wyoming to more than 1,400 ft in the central part of the Williston basin (fig. 6).
The Winnipeg Formation is stratigraphically equivalent to the St. Peter Sandstone that occurs in the midwestern
Approximate limit of Cambrian-Lower Ordovician or equivalent rocks
' t
^M-200-
0 100 200
EXPLANATK
IGNEOUS INTRUSIVE ROCKS OF TERTIARY AGE
UPLIFT AREA Cambrian age or older rocks exposed at land surface
- LINE OF EQUAL THICKNESS Interval 200 feet
KILOMETERS
DN
-I-I-I-
-_-_-_-
SANDSTONE FACIES
GREEN SHALE FACIES
SHALE, SANDSTONE, AND I TMFCHDNF FAP.IFc;
MINOR
FIGURE 5. Thickness and lithology of the Deadwood and Emerson Formations of Late Cambrian and Early Ordovician age. Modified from Peterson (1981).

REGIONAL AQUIFER-SYSTEM ANALYSIS
Approximate limit ofj Ordovician rocks I |
100 200 KILOMETERS
EXPLANATION
IGNEOUS INTRUSIVE ROCKS OF TERTIARY AGE
UPLIFT AREA Ordovician age or older rocks exposed at land surface
200 LINE OF EQUAL THICKNESS Interval 100 and 200 feet
FIGURE 6. Thickness and extent of Ordovician rocks. Modified from Peterson (1981).
United States. In the western part of the study area, the Winnipeg consists of a clean, well-sorted, medium-grained sandstone where it is not deeply buried (Peterson, 1978). Where it is deeply buried, the unit is less porous and permea ble because of silica cementation and compaction. In the eastern discharge area (lines of section A-A' in fig. 2; fig. 3), the Winnipeg Formation consists of a sequence of shale, sandstone, and shaly limestone that ranges in thickness from 20 to about 140 ft (Armstrong, 1980). The sandstone con sists of very fine to fine, rounded quartz grains with inter- bedded siltstone and shale. Armstrong (1980) reported that in Dickey and Lamoure Counties, N. Dak., near the eastern discharge area of the Cambrian-Ordovician aquifer, sands of the Winnipeg Formation (which he included in his Black
Island aquifer) have a hydraulic conductivity ranging be tween 9.2 x 10⁻⁴ and 1.1 x 10'3 ft/s.
The Red River Formation (fig. 7), a carbonate sequence that overlies the Winnipeg Formation, extends outward past the borders of the Williston basin (fig. 2). The Red River Formation is more than 700 ft thick in the central part of the Williston basin. Devonian erosion truncated the Red River in the eastern part of the study area along a line extending between the central Black Hills and southern Bighorn Moun tains (Peterson, 1981). According to Porter and Fuller (1964), the Red River Formation in the center of the Willis ton basin consists of a lower unit of fragmental limestone and dolomite and an upper unit with three evaporites of fragmental limestone and anhydrite.

GEOHYDROLOGY OF BEDROCK AQUIFERS IN THE NORTHERN GREAT PLAINS E9
v2-~~~" Approximate limit of
the Red River Formation
100 200 KILOMETERS
EXPLANATIONIGNEOUS INTRUSIVE ROCKS OF
TERTIARY AGE LIMESTONE FACIES
UPLIFT AREA Ordovician age or older 2QO LINE OF EQUAL THICKNESS-Interval rocks exposed at land surface 100 and 2QQ feet
DOLOMITE FACIES
FIGURE 7. Thickness and lithology of the Red River Formation of Late Ordovician age. Modified from Peterson (1981).
The Stony Mountain Formation, which is the Upper Ordovician unit in the study area and which conformably overlies the Red River, is composed of carbonate, shaly car bonate, and anhydrite beds and is gradational upward into the Upper Ordovician and Silurian Interlake Formation (fig. 8). The Stony Mountain includes a lower shaly limestone and a shale interval called the Stoughton Member (Carlson and Eastwood, 1962). The Stoughton, in general, is confined to the interior of the Williston basin, is truncated on the east and south, and is gradational into the upper part of the Bighorn Dolomite to the west (Peterson, 1981).
Both the Red River and Stony Mountain Formations were truncated by Devonian erosion around the periphery of the Williston basin. The Stony Mountain erosional edge is
closer to the basin center than is the edge of the underlying Red River Formation.
SILURIAN AND DEVONIAN ROCKS
Rocks of Silurian and Devonian age (figs. 8 and 9) overlie the formations of Late Ordovician age in most of the study area. Silurian and Devonian units consist mainly of shaly carbonates, shale, and evaporites and include halite of Devonian age near the center of the Williston basin where the Silurian and Devonian section has a total thickness greater than 2,000 ft. The Devonian age halite extends northward into Canada for about 1,200 mi and underlies the

E10 REGIONAL AQUIFER-SYSTEM ANALYSIS
provinces of Alberta, Saskatchewan, and Manitoba and parts of the Northwest Territories. The Prairie salt, one of the principal halites of the Devonian age Prairie Formation in the study area, contains many structural lows along the margin of the halite and locally within the halite area. These struc tural lows have been attributed to postdepositional solution of halite and the resulting collapse of the overlying forma tions into the void created by salt removal (DeMille and others, 1964; Grossman, 1968). Because of the fine-grained lithology and the presence of evaporites in the Silurian and Devonian units, these formations are considered to be confin ing beds for the underlying Cambrian-Ordovician aquifer.
MISSISSIPPIAN ROCKS
Rocks of Mississippian age (pi. 1) overlie the Devonian rocks. The Mississippian rocks have been divided into several formations and one stratigraphic group.
The lowermost Mississippian rock unit is the Bakken Formation (fig. 10), which overlies the Upper Devonian Three Forks Formation in parts of the study area. The Bak ken consists of more than 100 ft of black, organic shale and siltstone and appears to be an excellent confining bed where present. The Bakken is considered to be a source bed for much of the petroleum found in overlying formations. Over-
T\&A sA i
SOUTH- / DAKOTA
PIERRI:
y//\ Approximate jimit ofthe Interlake Formation j
42° J
100 200 KILOMETERS
EXPLANATION
IGNEOUS INTRUSIVE ROCKS OF TERTIARY AGE DOLOMITE FACIES
UPLIFT AREA Ordovician age or older ~20° LINE OF EQUAL THICKNESS Interval rocks exposed at land surface 100 and 200 feet
LIMESTONE FACIES
FIGURE 8. Thickness and lithology of the Interlake Formation of Late Ordovician and Silurian age. From Peterson (1981).

GEOHYDROLOGY OF BEDROCK AQUIFERS IN THE NORTHERN GREAT PLAINS Ell
lying the Bakken is a sequence of Mississippian rocks, pri marily limestone and dolomite, that is termed the Madison Limestone or Madison Group where divided.
The Madison Limestone in the study area (fig. 11) con sists of a sequence of marine carbonates and evaporites de posited mainly in a warm, shallow-water environment similar to that which exists today near the coast of southern Florida and the Yucatan Peninsula. Depositional environments grade both laterally and vertically from shallow-marine carbonate and evaporite facies to deep-water facies. The Madison Group, from oldest to youngest where divided, consists of the Lodgepole Limestone, Mission Canyon Limestone, and Charles Formation or their stratigraphic equivalents in other parts of the study area.
The Lodgepole Limestone is predominantly a cyclic car bonate sequence that consists largely of fossiliferous to micritic dolomite and limestone in most of the study area (Smith, 1972). The unit ranges from <1 to >900 ft in thickness and averages about 300 ft. The Lodgepole overlies the Bakken Formation in the Williston basin, central Mon tana trough, and north-central Montana.
The Mission Canyon Limestone consists of a coarsely crystalline limestone at the base that grades upward to finer crystalline limestone and evaporite minerals near the top (Peterson, 1981). The formation contains one evaporite cycle and shares a second evaporite cycle with the lower part of the Charles Formation. Bedded evaporites are absent in most of Wyoming and South Dakota, but evaporite deposits occur
42° t
200 KILOMETERS
EXPLANATIONIGNEOUS INTRUSIVE ROCKS OF
TERTIARY AGEUPLIFT AREA Devonian age or older
rocks exposed at land surface
200 LINE OF EQUAL THICKNESS Interval 200 feet
-U--LJ--U. LIMIT OF PRAIRIE SALT OFINFORMAL SUBSURFACE USAGE
FIGURE 9. Thickness of Devonian rocks. From Peterson (1981).

E12 REGIONAL AQUIFER-SYSTEM ANALYSIS
Approximate limit of the , Bakken Formation
200 KILOMETERS
EXPLANATION
~T- IGNEOUS INTRUSIVE ROCKS OF ' ' TERTIARY AGE
'^/y UPLIFT AREA Mississippian age or /y ' older rocks exposed at land surface
25 LINE OF EQUAL THICKNESS Interval 25 feet
FIGURE 10. Location and extent of the Bakken Formation of Late Devonian and Early Mississippian age. From Peterson (1981).
in southeastern Montana and northwestern North Dakota and gradually thicken from central Montana toward their maximum thicknesses in the Williston basin. The Mission Canyon Limestone ranges from <1 to >650 ft in thickness and averages about 300 ft.
The Charles Formation, the uppermost unit of the Madi son Group, is a marine evaporite sequence that consists of anhydrite and halite with interbedded dolomite, limestone, and argillaceous units. The Charles ranges from <1 to >300 ft in thickness, with an average thickness of about 250 ft. Pre-Jurassic erosion has removed most of the Charles in the western and southern parts of the study area. Where present, the Charles is a confining bed for the underlying aquifers.
Because the carbonate rocks of the Madison Limestone are relatively soluble in water, the development of karst (solution) features is common. The complex and intercon nected solution features that develop in exposed limestones during the weathering process under subtropical conditions are shown in figure 12. Sando (1974) describes ancient karst features, including enlarged joints, sink holes, caves, and solution breccias, that developed in the Madison Limestone in north-central Wyoming. He further indicates that most of the open spaces were filled by sand and residual products re worked by a transgressive sea during Late Mississippian time. Large and extensive cave systems in outcrop areas of the Madison Limestone in the Bighorn Mountains and in the Black Hills are further evidence of the importance of the

GEOHYDROLOGY OF BEDROCK AQUIFERS IN THE NORTHERN GREAT PLAINS E13
100°CANADA9£__
ATES T X
Approximate limit of the Madison Limestone
100 200 MILES
100 200 KILOMETERS
EXPLANATION
IGNEOUS INTRUSIVE ROCKS OF TERTIARY AGE
UPLIFT AREA Mississippian age or older rocks exposed at land surface
DOLOMITE FACIES
PRIMARILY LIMESTONE AND SHALY LIMESTONE FACIES
200 LINE OF EQUAL THICKNESS Interval 200 feet
* *- LIMIT OF CHARLES SALT OFINFORMAL SUBSURFACE USAGE
>->- -L-*- LIMIT OF THE MIDDLE PART OF THE MADISON LIMESTONE ANHYDRITE
FIGURE 11. Thickness and lithology of the Madison Limestone of Mississippian age. From Peterson (1981).
dissolution process in the development of secondary permea bility in some of the Madison Limestone units.
Overlying the Charles Formation in parts of Montana, North Dakota, and South Dakota are rocks of Late Mississip pian age belonging to the Big Snowy Group (fig. 13). The Big Snowy Group consists of three formations, the Kibbey, Otter, and Heath, and is composed mainly of shale, sand stone, and limestone. In hydraulic analyses made during this study, the Big Snowy Group has been combined with the Charles as a confining layer.
PENNSYLVANIAN AND PERMIAN ROCKS
Rocks of Pennsylvanian age (fig. 14) overlie the Missis sippian units in most of the study area and consist of marine sandstone, shale, siltstone, and carbonate. The Pennsylvani an rocks are divided into many different formations; howev er, most are equivalent units.
The Tyler Formation (pi. 1) is restricted generally to the central Montana trough and the central Williston basin, but the Tyler grades southward and appears to be equivalent to

E14 REGIONAL AQUIFER-SYSTEM ANALYSIS
FIGURE 12. Solution features in marine limestone developed in subtropical conditions similar to those postulated to exist during Late Mississippian time in the northern Great Plains. A, opening in rock due to removal of limestone by solution. Photograph shows north wall of a cenote or well, near Chichen Itza, Yucatan, Mexico (photograph by Joe S. Downey, U.S. Geological Survey).
the lower part of the Amsden Formation in south-central Montana. The Tyler also appears to be equivalent to the lower part of the Minnelusa Formation in northwestern South Dakota, Wyoming, and western North Dakota.
Middle Pennsylvanian rocks are represented by the Ten- sleep Sandstone in southern Montana and north-central Wyo ming and by part of the Minnelusa Formation in the Williston basin, northeastern Wyoming, and western South Dakota. These rocks have been truncated by pre-Jurassic erosion progressively northward across central Montana. They thin out to extinction near the axis of the central Montana trough.
Sandstone units of Pennsylvanian age are present in the Tensleep Sandstone in central to north-central Wyoming and south-central Montana and in the middle part of the Minne lusa Formation in western South Dakota and along the east side of the Williston basin.
The upper part of the Minnelusa Formation in the Pow der River and Williston basins and in the western part of South Dakota consists of sandstone, shale, and carbonate
with interbedded anhydrite of Early Permian age. The sand stone facies extends northward to include the southeastern part of the Williston basin. Source of the sands in the upper part of the Minnelusa is interpreted to be the reworking of earlier deposited Pennsylvanian sands from paleostructures to the west. Additional source areas for elastics were the Sioux uplift and the Canadian Shield on the eastern and northeastern borders of the Williston basin. In this study, the Pennsylvanian formations have been incorporated into a hy- drologic system called the Pennsylvanian aquifer.
Overlying the Minnelusa Formation is the Lower Permi an Opeche, Goose Egg, or equivalent formations (pi. 1). The Opeche Formation is interbedded in the central part of the Williston basin with halites informally termed the Opeche salt. The Minnekahta Limestone overlies the Opeche Forma tion and halites. Above the Minnekahta Limestone, the Spearfish Formation contains more than 300 ft of bedded halite, which limits the vertical flow of water through this formation. The Permian formations are considered to be a confining unit.

GEOHYDROLOGY OF BEDROCK AQUIFERS IN THE NORTHERN GREAT PLAINS E15
114"100-CAN AD A 9^
102° __ r
TVr UNITED'
NORTH DAKOTA
96°
\
HEI ENA c'
46°/ i k
3MARCK ^proximate limit of theBig Snowy Group
\
44°
42°
\.,.~-.iy
^-J, ', 1
A
\1
100 200 KILOMETERS
EXPLANATION
IGNEOUS INTRUSIVE ROCKS OF TERTIARY AGE
UPLIFT AREA Mississippian age or older rocks exposed at land surface
SANDY SHALE AND SANDSTONE FACIES
-_-_-_-. GREEN, GRAY, AND RED SHALE-~-~-~- WITH MINOR LIMESTONE
200 LINE OF EQUAL THICKNESS Interval 200 feet
FIGURE 13. Thickness and lithology of the Big Snowy Group of Late Mississippian age. From Peterson (1981).
TRIASSIC ROCKS
Rocks of Permian age in the study area are overlain by a sequence of redshale, siltstone, and evaporites that belongs to the upper parts of the Goose Egg and Spearfish Forma tions of Triassic age (fig. 15). These formations are about 200-400 ft thick in the central Williston basin and thicken southwesterly to more than 900 ft in the Powder River basin.
Although shale and siltstone are the principal lithologies of the Triassic units in the study area, sandstone occurs to a
limited extent in the eastern part of the Williston basin as elongate, northeast-trending, sandy belts probably deposited by streams flowing off the adjacent Sioux uplift and Canadi an Shield source areas to the east. Triassic beds have been truncated by pre-Middle Jurassic erosion along the southern and eastern margins of the Alberta shelf and on the east side of the Williston basin. Rocks of Triassic age, along with those of Permian age, are considered to be a confining bed for restricting flow from the underlying aquifers to the over lying aquifers of Cretaceous age.

E16 REGIONAL AQUIFER-SYSTEM ANALYSIS
772° 110°106
48°
, . j- ..
Approximate limit of Pennsylvanian and Permian rocks
* RiV
104° 100° CANADA^ _
'^TuftfrE^ \
96°"1
200 KILOMETERS
EXPLANATION
IGNEOUS INTRUSIVE ROCKS OF TERTIARY AGE
UPLIFT AREA Permian age or older rocks exposed at land surface
SANDSTONE FACIES (MORE THAN 25% SANDSTONE)
_-_-__-_ PRIMARILY RED SHALE AND SOME------- SILT WITH SOME CARBONATE
ROCK, GRAY SHALE, AND EVAPORITE
-200 LINE OF EQUAL THICKNESS Interval 200 feet
-i- -LJ- LIMIT OF OPECHE SALT OFINFORMAL SUBSURFACE USAGE, PERMIAN
FIGURE 14. Thickness and lithology of Pennsylvanian and Permian rocks. From Peterson (1981).
JURASSIC ROCKS
Rocks of Jurassic age (fig. 16) overlie formations of Triassic age with a pronounced disconformity. These rocks, consisting of the Nesson, Piper, Rierdon, Swift, and Morrison Formations and their equivalents, are predominately carbon ate, shale, and calcareous shale. The Nesson Formation is divided into three members: (1) a lower anhydrite, which includes the Dunham salt (of informal usage) and occurs in
parts of the Williston basin; (2) a middle shale; and (3) an upper carbonate sequence. The Piper Formation of Jurassic age is divided into three members: (1) a lower shale and sandstone unit; (2) a middle limestone; and (3) an upper shale. In north-central Montana, the Piper Formation thins appreciably and consists chiefly of sandstone. The Rierdon Formation consists mainly of shale, siltstone, and calcareous shale, with small amounts of sandstone along the eastern fringes of the Williston basin.

GEOHYDROLOGY OF BEDROCK AQUIFERS IN THE NORTHERN GREAT PLAINS E17
The Swift Formation was deposited under marine condi tions and, in the western part of the study area, consists of sandstones deposited as offshore bars in a shallow sea. In the eastern part, the Swift consists mostly of silty shale with coarser sediments in the upper part of the formation. The Swift is about 600 ft thick along the northern axis of the Williston basin and thins to extinction in western Montana and in eastern North Dakota and South Dakota. Generally, cementation of the Swift is less than that of adjacent forma tions, possibly due to a lesser primary porosity and less active diagenetic processes. The Swift is less porous than the sand stones that occur in units of Early Cretaceous age, although
in several localities more than 50 ft of sand occurs with greater than 20 percent porosity.
The Morrison Formation was deposited as a continental deposit of sand, silt, and clay, on a plain that emerged after the regression of the sea that existed during the time of deposition of the Swift Formation. The Morrison is about 250 ft thick in south-central Montana and thins eastward to ex tinction in western North Dakota and South Dakota. A re gional unconformity at the base of the Lower Cretaceous units locally truncates both the Morrison Formation and the upper part of the Swift Formation. Total thicknesses of the Jurassic units in the study area range from less than 50 ft
100° CANADA;98°i N
96°
Approximate limits of Triassic rocks
100 200 KILOMETERS
IGNEOUS INTRUSIVE ROCKS OF TERTIARY AGE
EXPLANATION
~ PRIMARILY RED SHALE AND SILTSTONE
UPLIFT AREA Triassic age or older rocks exposed at land surface
TTT^Tj SANDSTONE AND SANDY SHALE ' ' '. ' ' I FACIES
200 LINE OF EQUAL THICKNESS Interval 100 and 200 feet
-J-1- -LJ- LIMIT OF PINE SALT OF INFORMAL SUBSURFACE USAGE, PERMIAN AND TRIASSIC
FIGURE 15. Thickness and lithology of Triassic rocks. From Peterson (1981).

E18 REGIONAL AQUIFER-SYSTEM ANALYSIS
100 200 KILOMETERS
EXPLANATION
^^ JURASSIC AND TRIASSIC AGE OR y//////, OLDER ROCKS EXPOSED AT LAND
SURFACE
600 LINE OF EQUAL THICKNESS Interval 200 feet
LIMIT OF DUNHAM SALT OFINFORMAL SUBSURFACE USAGE
FIGURE 16. Thickness and extent of Jurassic rocks. From L. 0. Anna (written commun., 1981).
along the periphery of the Williston and Powder River basins to more than 1,000 ft, north of the deepest part of the Williston basin.
LOWER CRETACEOUS ROCKS
Rocks of Early Cretaceous age (pi. 2) consist of marine and nonmarine clastic sediments that range in thickness (fig. 17) from nonexistent in eastern North Dakota and South Dakota to more than 1,400 ft in west-central Montana (An na, 1984). The Lakota and Fuson Formations of Early Creta ceous age are composed of fluvial sandstone, siltstone, and shale. The Lakota Formation consists mainly of sandstone
and occasional conglomerate and overlies an erosional sur face cut into the Morrison Formation of Jurassic age. Gener ally, the Lakota Formation is a channel- and valley-fill depos it, although, in the subsurface, distinguishing between the valley fill of the Lakota and the valley fill of the overlying Fuson Formation is difficult.
The Fuson Formation consists mainly of valley-fill and channel-margin deposits of silty shale with occasional sand stone units. Thickness of the Fuson Formation ranges from approximately 400 ft in central Montana to less than a few feet in eastern North Dakota and South Dakota; the Fuson thins out to extinction in eastern South Dakota.
The Fall River Sandstone of Early Cretaceous age rep resents the initial advance of the Early Cretaceous sea, which

GEOHYDROLOGY OF BEDROCK AQUIFERS IN THE NORTHERN GREAT PLAINS E19
100 200 KILOMETERS
EXPLANATION
%^ JURASSIC AND TRIASSIC AGE OR Y/////A OLDER ROCKS EXPOSED AT LAND
SURFACE
300 LINE OF EQUAL THICKNESS Interval 100 feet
FIGURE 17. Thickness and extent of Lower Cretaceous rocks. Modified from L. 0. Anna (written commun., 1981).
deposited fine sand, silt, and clay under shallow-marine, tidal flat, coastal swamp, and deltaic conditions. Silt and shale deposits in central Montana and Wyoming indicate a deeper water environment in the study area.
In the Williston basin, analysis of data on cementation indicates that these Lower Cretaceous formations have more silica cement than calcite cement. A trend surface analysis of cementation indicates northwest linear trends near the Cedar Creek anticline. The analysis also indicates that (1) areas of less cement tend to overlie lineaments or fracture zones and (2) areas of more cement overlie interlineament zones (Anna, 1984).
Porosity trends in these formations show that areas of greater porosity are in the central and eastern parts of the study area, although porosity decreases eastward as overall
thickness of the formations decreases. In the Powder River basin, all the formations have less than 20 percent porosity because of the increase in depth.
The Lakota, Fuson, and Fall River Formations thin east ward and are truncated by pre-Newcastle erosion. Thickness of the three formations ranges from about 700 ft in central Montana to extinction in eastern North Dakota and South Dakota.
The Skull Creek Shale of Early Cretaceous age consists of two marine facies a lower, glauconitic siltstone, often termed basal silt, and an upper shale. The silt facies extends regionally but has increasing sand content in central and south-central Montana. The upper shale facies was deposited under strong reducing conditions and consists mainly of black organic shale with associated pyrite. The formation

E20 REGIONAL AQUIFER-SYSTEM ANALYSIS
ranges in thickness from nonexistent in eastern South Dako ta to more than 250 ft in parts of Montana, Wyoming, and western South Dakota and North Dakota.
Withdrawal of the sea at the end of Skull Creek time resulted in an unconformity at the base of the Newcastle Sandstone in eastern Wyoming and southeastern Montana. Later, the sea transgressed from west to east across the area, with development of extensive delta systems in eastern Montana and northeastern Wyoming and, still later, in south eastern South Dakota. Sediment supply to the deltas originated in eastern and south-central South Dakota, and the deltas supplied sediment to shelf areas in east-central Montana and Wyoming.
Thickness of the Newcastle Sandstone is quite variable, ranging from zero in large areas of North Dakota, to tens of feet in central Montana and Wyoming, to an abrupt increase of several hundred feet in southeastern North Dakota and eastern and south-central South Dakota. Porosity of the Newcastle Sandstone appears to be greater in areas where the sandstone is thicker. Calcite is a more prevalent cement ing agent than silica in the Newcastle Sandstone (Anna, 1984).
As the sea encroached further eastward during upper Newcastle time, the Mowry Shale (pi. 2) was deposited over the central and western part of the study area. The Mowry consists of dark siliceous shale that contains fish scales and bone fragments. In the study area, a bentonitic clay, which is used as a regional time marker, marks the top of the Mowry Shale and also divides the Lower and Upper Cretaceous rocks. Thickness of the Mowry ranges from more than 700 ft in south-central Montana to extinction in eastern and south eastern South Dakota and eastern North Dakota. All of the Lower Cretaceous units except the Mowry Shale have been grouped into the Lower Cretaceous aquifer. The Mowry Shale was incorporated into the overlying confining unit (fig. 18).
UPPER CRETACEOUS ROCKS
The sedimentary pattern of Upper Cretaceous rocks in the northern Great Plains is associated with four main trans gressions and regressions of shallow seas. The Belle Fourche Shale and Greenhorn Formation (pi. 2) were deposited as a continuation of the transgression of the sea during the Early Cretaceous time. The Belle Fourche Shale consists of gray- to-black marine shale with numerous bentonite beds. The Greenhorn Formation consists of a thick sandstone sequence with interbedded shale and chalky shale. The Carlile Shale consists of gray marine shale and interbeds of thin sandstone.
The Frontier Formation is the westward equivalent of the Belle Fourche Shale and Greenhorn Formation. Although the Frontier is restricted areally, the formation is 500 to
2,000 ft thick and consists of alternating beds of deltaic sandstone and shale.
The Niobrara Formation ranges in thickness from non existent to about 160 ft; it consists of gray marine shale with lenticular chalky beds and is characterized by small white calcareous lenses. Lithologic variations range from a domi nant chalk facies in the east to mostly shale facies in the west.
The Pierre Shale directly overlies the Niobrara Forma tion in the study area. The Pierre consists of more than 3,000 ft of dark, montmorillonitic shale and interbedded sandstone that was deposited under marine conditions. Many of the sandstone units have been given formational status in west ern and central Montana and in the Powder River basin of Wyoming (fig. 2). The Pierre Shale contains a number of sandstone units that are aquifers locally. The Pierre Shale is a confining unit to the underlying Lower Cretaceous aquifer over most of the study area.
The final regression of the Late Cretaceous sea deposit ed the Fox Hills Sandstone and the Hell Creek and Lance Formations or their equivalents. These formations are areally extensive, and the Fox Hills and Hell Creek crop out over sizable areas in southern and central North Dakota.
The Fox Hills Sandstone and equivalent units consist of about 300 ft of deltaic and interdeltaic sandstone, siltstone, and shale. The Hell Creek or Lance Formation ranges from about 350 to 1,500 ft thick and consists of fluvial sandstone, siltstone, and carbonaceous claystone, with thin lenticular coal beds in places. The Hell Creek or Lance is the meander belt and delta plain facies of the Fox Hills delta system. The Fox Hills and Hell Creek or Lance, where they exist, are considered a part of the Upper Cretaceous aquifer.
TERTIARY ROCKS
Tertiary units (pi. 2) in the northern Great Plains con tain important aquifers for development of domestic and ag ricultural water supplies because of their relatively shallow drilling depth and better water quality. These units generally were deposited in a continental environment, except for the Cannonball Member of the Fort Union Formation in western North Dakota, which was deposited in a marine environment, and the upper part of the Ludlow Member of the Fort Union, which was deposited in parts of western North Dakota in a marginal marine environment. Most of the sediments com prising the Tertiary deposits were derived from highlands to the west and northwest during and after the Laramide orogeny.
The Fort Union Formation of Paleocene age consists of a total of five members the Ludlow and Tullock, Lebo, Cannonball, Tongue River, and Sentinel Butte. All members consist of alternating gray to buff sandstone, siltstone, and claystone with thin-to-thick lignite and subbituminous coal

GEOHYDROLOGY OF BEDROCK AQUIFERS IN THE NORTHERN GREAT PLAINS E21
0 100 200 KILOMETERS
EXPLANATION
CONFINING BED TK4 MISSING
HIGHLAND RECHARGE AREA
800 LINE OF EQUAL THICKNESS Interval 200 feet. Dashed where inferred
FIGURE 18. Thickness of Cretaceous sedimentary deposits, from the top of the Newcastle Sandstone to the top of the Pierre Shale. From L. 0. Anna(written commun., 1981).
beds. Individual channel systems can be traced in the subsur face for considerable distances, especially in the Powder Riv er basin, even though the texture distribution may have considerable variability.
Contact with the underlying Cretaceous Hell Creek or Lance Formation is at the base of the lowest persistent coal bed. Local unconformities at the base of the Ludlow or Tul- lock Member occur from basal channel scour of the Ludlow or Tullock into the Hell Creek or Lance.
Thickness of the Fort Union Formation ranges from more than 3,000 ft in the Powder River basin to less than 300 ft in the Williston basin and in central North Dakota and
northeast Montana. Sandstone in the Powder River basin generally is coarser grained and better sorted than in eastern Montana, North Dakota, and South Dakota and generally has greater permeability.
The Wasatch Formation of Eocene age is present only in the Powder River basin and consists of about 1,000 ft of alternating beds of valley- and channel-fill sandstone, silt- stone, and claystone, similar to the Tongue River Member, although mineralogical differences have been noted. The con tact between the Wasatch and underlying Tongue River Member is unconformable and is placed at the top of the Roland-Anderson coal bed (Anna, 1984). This bed is about

E22 REGIONAL AQUIFER-SYSTEM ANALYSIS
50-100 ft thick and is areally extensive over most of the southern Powder River basin. At the southernmost end of the basin, the Roland coal bed splits into numerous thinner beds.
The Golden Valley Formation of Paleocene and Eocene age consists of about 150 ft of kaolinitic claystone, mud- stone, lignite, and micaceous sandstone. The formation is present only in western North Dakota and is divided into upper (Eocene) and lower (Paleocene) units.
The White River Formation, or Group where divided, of Oligocene age unconformably overlies the Eocene formations and is about 150 ft thick. The formation is exposed only as erosional remnants, which cap buttes in several localities in the Williston basin, and as areally extensive deposits in the Badlands of south-central South Dakota. The White River Group is divided into the lower Chadron Formation, which consists of a basal conglomerate with overlying tuffaceous sandstone, siltstone, and shale, and the upper Brule Forma tion, which consists of claystone, siltstone, and sandstone.
The Arikaree Formation of Miocene age in the study area is exposed as remnants that resulted from Pliocene and Pleistocene erosion of higher buttes in North Dakota and South Dakota. The Arikaree rests unconformably on the White River Formation and consists of about 250 ft of mas sive tuffaceous sandstone and siltstone and a few thin beds of quartzite, dolomite, and volcanic ash. The Ogallala Forma tion of Miocene age is present in eastern Wyoming and southwestern South Dakota and is an extensive veneer of interbedded sandstone and claystone throughout most of the central Great Plains region.
Deposits of Quaternary age in the study area consist of alluvium and glacial materials. Alluvial deposits, varying in thickness, fill major drainages of the area. Glacial till and outwash deposits are located only in eastern North Dakota, northeast South Dakota, and northernmost Montana. The outwash deposits may range in thickness from a few feet to several hundred feet and consist of silt, sand, and gravel. Widths generally range from less than a mile to several miles, and the deposits are commonly tens of miles in length. Glacial outwash deposits are a major source of ground water in a large part of the study area.
GEOLOGIC STRUCTURE
The structural history of the northern Great Plains is reflected in the sediments, and geologic structure is one of the important factors that control porosity and permeability in carbonate and sedimentary rocks. Movement along struc tural zones creates porosity and increases permeability by fracturing; the porosity and permeability may be modified at a later time by chemical processes that occur in the aquifer as water moves through the fractures.
Much of the present-day structure in the study area is the result of the Laramide deformation that occurred in Late
Cretaceous and early Tertiary time. Zones of weakness that existed prior to Laramide deformation were the most com mon avenues for the release of stress during the Laramide; thus, these zones have existed from very ancient times into the present. Northwest-, east-southeast-, and northeast- trending structural features of Precambrian, Paleozoic, and Mesozoic age (figs. 19-22) occur throughout the study area. Many of these structural features were initiated as Precam brian age shear zones that developed in the basement rocks and since have acted as zones of weakness. For example, the Nashfork-Hartville fault trend in Wyoming and South Dako ta is a component of a broad Precambrian shear zone called the Colorado lineament (Warner, 1978). Warner postulated that this shear zone, which extends from Arizona to the Great Lakes, divides the Precambrian basement into prov inces of two different ages, one 2.4 billion years old on the north and one 1.75 billion years old on the south.
The large fault and lineament systems that have devel oped in the many bedrock units of the northern Great Plains during geologic time are important features in the analysis of the hydrologic system. Both faults and lineaments appear to provide paths for increased water movement, both horizon tally through aquifers and vertically through confining beds (Weimer and others, 1982; Chilingar, Mannon, and Rieke, 1972). These features also may act as barriers to flow nor mal to the direction of the fault or lineament. An example of this barrier effect is presented by Konikow (1976) in his analysis of the flow system in the Powder River basin. In Konikow's study, geologic structure along the eastern edge of the Bighorn Mountain range (B, fig. 21) appears to limit water movement from the recharge area in the Bighorn Mountains to the Powder River basin.
Movement along major faults and lineaments may affect the porosity and permeability of rocks over a large area and through a long span of geologic time. Structural adjustments between large blocks of geologic materials may modify the primary porosity and permeability of the rock by fractures or modification of the flow system through development of secondary porosity. Structural adjustments also may result in a decrease in porosity and permeability by modifying the flow system so that minerals in the water precipitate in the rock pores.
Structural movement along or between these large blocks has a major effect on deposition of clastic sediments such as those in the Lower and Upper Cretaceous bedrock units (Slack, 1981). Block movement may result in shallow- water, near-shore environments where coarse-grained sedi ments are deposited. Later, movement between the blocks may result in a lowered, deep-water environment where fine grained or calcareous sediments are deposited. Maps devel oped during this study (Brown and others, 1982) show pat terns of linear structural trends that may be related to changes in sedimentation rates that resulted because of ad justments between structural blocks.

GEOHYDROLOGY OF BEDROCK AQUIFERS IN THE NORTHERN GREAT PLAINS E23
100° CANADA 98° _' ^ » .. m- *" - " T* \
's^ !x
96°
100 200 KILOMETERS
EXPLANATION
FAULT, PROBABLE FAULT, OR LINEAMENT
- 4 ANTICLINE TREND OR DOME,DASHED LINE SHOWS PROBABLE EXTENSION OF FEATURES
4 MONOCLINEBOUNDARY OF CENTRAL MONTANA
TROUGH
STRUCTURAL TREND, ARCH, OR UPLIFT
FIGURE 19. Major Paleozoic structural features. Modified from D. L. Brown, R. K. Blankennagel, L. M. McCary, and J. A. Peterson (written commun.,1981).
Many of the structural features in the northern Great Plains are associated with present-day physiographic fea tures that affect the deep and shallow ground-water and surface-water flow systems in the study area. A structural feature (A, fig. 21) in eastern North Dakota may be a control on stream channel and lake location in part of the Devils Lake basin of North Dakota. Also, a deep bedrock trench filled with glacial materials (Downey and Armstrong, 1977) appears to lie along the trend of this feature. This bedrock trench may have been a zone of weakness that was eroded by glacial action during the Pleistocene.
The northeast-trending lineament (C, fig. 21) that crosses the central part of the Black Hills appears to be associated with a structural feature that channels ground- water flow in the Cambrian-Ordovician and Madison aquifers along a linear path across eastern South Dakota.
HYDROLOGIC SETTING
The confined ground-water system of the northern Great Plains includes numerous permeable horizons, many of

E24 REGIONAL AQUIFER-SYSTEM ANALYSIS
which are discontinuous and all of which vary considerably in hydraulic properties from one location to another. During the study, five major subdivisions (pis. 1 and 2; fig. 3) of the regional aquifer were made Cambrian-Ordovician (AQ1), Madison (AQ2), Pennsylvanian (AQ3), Lower Cretaceous (AQ4), and Upper Cretaceous (AQ5) aquifers. Each of these is an aggregate of permeable, low permeable, and semicon- fining materials; each has been identified as an aquifer pri marily because vertical head differences within each unit tend to be much smaller than those between it and the
adjacent unit. To some extent, the division is arbitrary and has been made to assist in analysis and discussion of the aquifer system as a whole.
These five major aquifers constitute one of the largest confined aquifer systems in the United States (pi. 3). The flow system extends more than 600 mi from mountainous recharge areas in Montana, Wyoming, and South Dakota to discharge areas in the eastern Dakotas and the Canadian Province of Manitoba (van Everdingen, 1968). The total area involved is more than 300,000 mi2. The geologic units consti-
96° 100" CANADA!}* ,
T \ I
Approximate limit Madison Limestone
I I 0 100 200 KILOMETERS
EXPLANATION
MISSISSIPPIAN AGE OF OLDER orv-ifc pvo/^iccrk AT T AMPI% ROCKS EXPOSED AT LAND SURFACE
MAJOR LINEAR TRENDS OF SEDIMENTS IN THE MADISON GROUP
FIGURE 20. Linear trends in sedimentary deposits of the Madison aquifer. From R. K. Blankennagel and L. M. MacCary (written commun., 1981).

GEOHYDROLOGY OF BEDROCK AQUIFERS IN THE NORTHERN GREAT PLAINS E2596°
44'
0 100 200 KILOMETERS
EXPLANATION
PRECAMBRIAN ROCKS EXPOSED AT LAND SURFACE
LINEAMENT VISIBLE AT SURFACE
FIGURE 21. Lineament pattern in the northern Great Plains, from Landsat imagery. A, Possible control on stream channel and lake location in part of the Devils Lake basin. B, Possible geologic limit to water movement from the recharge area in the Bighorn Mountains to the Powder River basin. C, Northeast-trending lineament that appears to be associated with a structural feature that channels ground-water flow in the Cambrian-Ordovician and Madison aquifers along a linear path across eastern South Dakota. From M. E. Cooley (written commun., 1980).
tuting each of the five major aquifers and the intervening semiconfining zones are summarized on plates 1 and 2 and briefly discussed below.1. Lower boundary. Consists of crystalline rocks of Pre-
cambrian age that underlie the study area. On a regional basis, these rocks normally are not water bearing.
2. Cambrian-Ordovician aquifer (AQ1). Consists of sandstones of Late Cambrian age and limestones of Middle and Late Ordovician age. This aquifer is com posed principally of the Red River Formation but includes the Deadwood Formation of Cambrian and earliest Ordovician age, the Winnipeg Formation, and the overlying Stony Mountain Formation of Or
dovician age. This aquifer underlies about 217,000 mi2 in western Montana, North Dakota, South Dako ta, and northwestern Wyoming and extends into Ca nada where it crops out along the Precambrian shield.
3. Confining layer 1 (TK1). Consists of shale, shaly car bonates, evaporite, and halite beds of Silurian and Devonian age. Although some evidence exists for solution of the halite beds along their margins and indicates limited vertical flow of water over most of the area, the halite beds are considered to be imper meable. The black, organic-rich shales of the Missis- sippian part of the Bakken and Englewood Forma tions are components of this confining layer.

E26 REGIONAL AQUIFER-SYSTEM ANALYSIS
5.
Madison aquifer (AQ2). Consists of siltstone, sand stone, limestone, and dolomite that belong to the Lodgepole and Mission Canyon Limestones of the Madison Group or the Madison Limestone and equivalent units. The limestone and dolomite of the Madison are, in general, fine textured and massive, and most of the formation's permeability is second ary or fracture permeability. The Madison aquifer underlies about 210,000 mi2 of the study area.
Confining layer 2 (TK2). Consists of halite, evaporites, and limestone of the Upper Mississippian Charles Formation or equivalent units of the Madison Limestone and the shale, limestone, and sandstone of the Kibbey, Otter, and Heath Formations of the Big Snowy Group.
Pennsylvanian aquifer (AQ3). Consists of sandstones and limestones of the Minnelusa Formation, Tensleep Sandstone, and Amsden Formation and equivalents of Pennsylvanian age.
Confining layer 3 (TK3). Consists of siltstone, shale, limestone, evaporite, and halite units of the Opeche Formation and Minnekahta Limestone of Permian age; Spearfish Formation of Permian and Triassic age; and the upper part of the Goose Egg and Chugwater Formations of Triassic age. The Piper and Gypsum Spring Formations of Jurassic age also are included in this confining unit. On the basis of information from model simulations (H. L. Case III, written commun., 1982) and geochemical data (J. F. Busby, written commun., 1981), this confining layer
100 200 MILES
0 100 200 KILOMETERS
EXPLANATION
PRECAMBRIAN ROCKS EXPOSED AT LAND SURFACE
LINEAMENT ZONE
FIGURE 22. Subsurface paleolineament zones of Jurassic and Cretaceous age. From L. 0. Anna (written commun., 1982).

GEOHYDROLOGY OF BEDROCK AQUIFERS IN THE NORTHERN GREAT PLAINS E27
appears to be the principal hydrologic barrier to the vertical leakage of water over most of the area be tween the underlying Paleozoic aquifers and the overlying Lower Cretaceous aquifer.
8. Lower Cretaceous aquifer (AQ4). This unit consists of the sandstone and siltstone of the Lakota Formation and the Fall River and Newcastle Sandstones of Ear ly Cretaceous age. These formations or their equivalents underlie much of the northern Great Plains of the United States and extend into Canada. This aquifer unit is known as the Dakota aquifer in North Dakota and as the Inyan Kara aquifer in South Dakota.
9. Confining layer 4 (TK4). Consists of shale, siltstone, and limestone units above the Lower Cretaceous a- quifer (AQ4) and includes the Mowry and Belle Fourche Shales, Greenhorn Formation, Carlile Shale, Niobrara Formation, and Pierre Shale and their equivalents of Late Cretaceous age.
10. Upper Cretaceous and Tertiary aquifer (AQ5). Consists of Upper Cretaceous formations, such as the Fox Hills Sandstone and Hell Creek For mation and their equivalents, that lie above the Low er Cretaceous shale and siltstone of confining unit TK4.
During the Pleistocene Epoch, the NGP aquifer system may have been subjected to changes of recharge-discharge relations associated with the four glaciations and three inter- glacial periods shown in figure 23. At the time of maximum glacial advance during the Wisconsin glacial period, the dis charge area of the aquifer system was covered by a thick mass of ice that may have blocked discharge and caused flow in the aquifers to be toward the southeast (see fig. 24). During interglacial periods, glacial ice was absent from the aquifer discharge areas, and the inferred flow direction was toward the northeast, similar to the present-day pattern (pi. 3). Except for local mountain glaciation, the highland areas in the western part of the northern Great Plains were not affected by continental glaciation and continued to serve as recharge areas for the bedrock aquifers.
DIGITAL-SIMULATION MODEL
Simulation is the most versatile technique for solving large and complex ground-water flow problems, and numeri cal simulation, by a digital computer, was used in the study to evaluate conceptual models of the hydrologic system. The following section briefly describes the theory, limitations of, and data used in the simulations.
THEORY
The flow of ground water with constant density in po rous media in three dimensions may be expressed as:
±( T "U-5-fr »*U-5-lWf ^- ' ± xx x / T su,I -^ r |T ~ ' " *~ -(1)
Txx, T
wherex and y refer to coordinates parallel to bedding,
and z refers to coordinate normal to bed ding, assuming that the bedding plane is parallel to the maximum principal trans- missivity tensor axis;
are the principal components of the trans- missivity tensor (L2T-1 );
h is hydraulic head (L);b is formation thickness (L);Kzz is vertical hydraulic conductivity (LT' 1 );S is the storage coefficient (dimensionless);t is time; andW(x,y,z,t) is a source term that includes well dis
charge and recharge per unit surface area of the aquifer (UT 1 ).
Equation 1 may be approximated by a finite-difference equation by applying Taylor's theorem (Pinder and Brede- hoeft, 1968) to describe head at each node of a rectangular grid. The finite-difference equations that describe heads at nodes then are solved simultaneously by a computer program that uses numerical techniques such as the strongly implicit method (Trescott, 1975). For this study, the finite-difference flow equations were solved by using the program code devel oped by Trescott (1975) and modified by additional subrou tines for calculating effects of water with variable densities (Weiss, 1982).
Analysis of a complex nonhomogeneous aquifer system is accomplished by subdividing the aquifers into a large num ber of rectangular cells, which constitute a finite-difference grid. The horizontal grid (fig. 25) consists of 21 rows and 26 columns with variable cell dimensions. Vertically, the four confining units between the five aquifer layers were simulat ed by using the quasi-three-dimensional approach described by Trescott (1975), in which the effects of vertical flow through the confining bed are incorporated in the vertical components of hydraulic conductivity of the adjacent aqui fers, and then assuming that the effects act simultaneously as head changed in the aquifers and that no water stored in the confining beds was released. For each cell, values of transmissivity, hydraulic head, recharge, and discharge were supplied. These values are assumed to be constant every where in the cell and are the average values.

E28 REGIONAL AQUIFER-SYSTEM ANALYSIS
orLU
oON0ZLU O
PERIOD
QC
Z QCLU1-
D0
O OCL LU
LUZLUO0_l0
LUZLUO
|__
wLU
Q.
LUZLUO0
CL
GEOCHRONOLOGIC UNITS
WISCONSIN(GLACIAL)
SANGAMON(INTERGLACIAL)
ILLINOIAN(GLACIAL)
YARMOUTH(INTERGLACIAL)
KANSAN(GLACIAL)
AFTONIAN(INTERGLACIAL)
NEBRASKAN(GLACIAL)
PRE-FIRSTGLACIAL
ADVANCE
0.01 MILLION YEARS AGE ESTIMATEAT BOUNDARY
2 MILLION YEARS AGE ESTIMATEAT BOUNDARY
FIGURE 23. Pleistocene glaciations and interglaciations.

GEOHYDROLOGY OF BEDROCK AQUIFERS IN THE NORTHERN GREAT PLAINS E29
EXPLANATION
HIGHLAND RECHARGE AREA
\ WINNIPEG /INFERRED DIRECTION OF GROUND-WATER FLOW
ESTIMATED THICKNESS OF 2500 GLACIAL ICE, IN FEET
Lake Wmnipego$i$\ \
LAKE \MANITOBA
CANADA
UNITED] "STATES
Sakakawea \\ \
NORTH DAKOTA\ \
MINNESOTA /
NEBRASKA
Limit of Pre-Wisconsm Ice
0 100I
200 MILES
0 100 200 KILOMETERS
FIGURE 24. Extent of Laurentide (Wisconsin) ice in the northern Great Plains.
Accuracy of the solution of the finite-difference equa tions depends on a number of conditions. One of several possible errors is introduced when the continuous aquifers in space and head changes in time are made discrete and ap proximated by finite-difference equations. This error can be
minimized by choosing the appropriate grid sizes (Finder and Bredehoeft, 1968; Bedinger, Reed, and Griffin, 1973).
Water in the aquifers of the northern Great Plains varies significantly in dissolved-solids concentration and in temper ature. This variation leads to significant variations in fluid

E30 REGIONAL AQUIFER-SYSTEM ANALYSIS
density and viscosity from one point to another. Under undis-concen-
vitnoii,^ cum vio\,\Joi\,y injiii unc ^UHIL IAJ cuiuuuci. unuc
turbed natural conditions, changes in dissolved-solids concen tration or in temperature tend to occur very slowly with time. For purposes of studying the regional flow system, density and viscosity may be assumed to vary with position only andt.n remain r»nnst.ant. wit.Vi time This assnmntinn nrnhahlv alsn
could be made in studying the transient aquifer response to ground-water development, provided that the movement of the water having high dissolved minerals or high tempera ture is not great enough to cause significant change in the overall densitv and viscositv distributions. Under the as-l/UIC 13 11UL glCdU CllUUgll IAJ ^dUOC Ol^lllllVdllL ^lldllgc 111
and viscosity may be assumed to vary with position only and overall density and viscosity distributions. Under the as- to remain constant with time. This assumption probably also sumptions that density and viscosity of water do not vary
EXPLANATION
PRECAMBRIAN ROCKS EXPOSED AT LAND SURFACE
FIGURE 25. Finite-difference grid for digital simulation of the hydrologic system.

GEOHYDROLOGY OF BEDROCK AQUIFERS IN THE NORTHERN GREAT PLAINS E31
with time and that their distribution in space is known, then the flow equations described by equation 1 can be modified and is expressed as:
\£j)
8t
where Wps is a "pseudosource" function, so termed because of its analogy to the source function W. Wps is calculated from the fluid density and from the viscosity, which is esti mated from observed temperature, pressure, and dissolved- solids concentration. Weiss (1982) gives a complete discus sion of the pseudosource term and its use in simulating ground-water movement with variable density where fresh water head is used as a variable. Weiss shows that the error contributed by the pseudosource function is small; that is, less than 0.03 percent when formations dip less than 5 de grees, as do the aquifers of the northern Great Plains. Vis cosity, again under the assumption that changes with time are negligible, can be accounted for by adjustment of trans- missivity and hydraulic conductivity values on the basis of measured temperature.
ASSUMPTIONS AND LIMITATIONS OF THE MODEL ANALYSIS
In using the model to analyze the predevelopment flow pattern, steady-state conditions were assumed, so that total inflow to the aquifer equaled total outflow. The term o^ of
8fequations 1 and 2 was always set to zero. The method of data reduction for input to the digital model was based on the assumption that within the five layers, which represent the five major aquifers in the northern Great Plains, velocity components normal to beddings are very small compared with those parallel to beddings. At the same time, in the confining beds, velocity components parallel to beddings are assumed to be very small compared to those normal to bed dings. The model also incorporates the assumption that an impervious layer (corresponding to Precambrian basement material) underlies the lowermost aquifer layer (AQ1). The model also assumes that leakage through the confining beds occurs simultaneously as heads in the aquifer changed and that no water is released from the storage of the confining beds.
MODEL CALIBRATION
After a model is developed, the model-simulated results should be compared with the observed data. The input of the variables used in the model may be adjusted within a reason able, acceptable range to make the simulated results closely
representative of the observed data. This process is called model calibration. The only data sets available for the study area for comparison with the model-simulated results are the potentiometric surfaces constructed on the basis of water- level measurements and on some general limits as indicated by the water balance. Although transient hydrologic effects due to Pleistocene glaciation still may be present, the con structed potentiometric surfaces are assumed to be in steady- state flow conditions.
The model calibration minimizes the differences be tween observed and simulated potentiometric surfaces by adjusting aquifer properties and, where subject to uncertain ty, specified boundary conditions. Although the number of interrelated factors affecting ground-water flow makes this a subjective procedure, the allowable adjustment of any aqui fer property generally is proportional to the uncertainty of the observed values. In this study, hydraulic head is relative ly well known; therefore, the potentiometric surfaces con structed on the basis of the observed heads were adjusted very little. The transmissivity and vertical hydraulic conduc tivity are relatively unknown; as a result, many adjustments were made, and for some nodes the range of adjustment covered several orders of magnitude.
The objective of simulations in this study was to im prove the conceptual model of the undisturbed flow system that existed before large-scale development of ground water or petroleum in the area (about 1950). The conceptual model is based on an understanding of the physical properties and nature of the aquifers and confining beds, the sources of recharge and discharge, the rates and directions of flow, the spatial variations of aquifer properties, the distribution of heads, and the interaction among aquifers. Digital simulation integrates all these factors. If the conceptual model is sound and is accurately represented in the simulation, computed results will be consistent with field data. A difference be tween simulated results and field measurements indicates that some element of the conceptual model needs to be re vised. In fact, maps depicting the observed potentiometric surfaces have been reinterpreted for parts of the study area on the basis of insight gained from model analysis. Any adjustment of the model input constitutes a modification of the conceptual model.
Assigning different values for aquifer properties, heads, and flux also helps to achieve another objective of calibra tion; that is, to determine sensitivity of the variables that affect the flow. This sensitivity analysis indicates which vari ables are critical to the flow system. Evaluating the impor tance of each variable will help determine which data need to be refined and which data are already adequate or require only minimal definition. Because head data were the basis of the calibration procedure, accuracy of the calibrated model was limited by the accuracy of the head data.

E32 REGIONAL AQUIFER-SYSTEM ANALYSIS
BOUNDARY CONDITIONS
Boundary conditions are used to describe the parametric status of a simulation model and nodes where the hydraulic conditions are known; several different types of boundary conditions can be assigned. They are as follows:1. No-flow boundary. By specifying a transmissivity
equal to zero at a given node, no flow can occur across the boundary of that cell.
2. Constant-head boundary. Where the head in the aqui fer is known and does not change with time, the head in the corresponding node is maintained at a speci fied value throughout the simulation.
3. Specified-flux. A specified rate of withdrawal or recharge is assigned at any node.
4. Vertical leakage. Vertical leakage into or out of the aquifer is represented at any node by specifying the vertical hydraulic conductivity, thickness of the con fining layer, and head in the source layer. The rate of leakage is computed implicitly by the model.
In the steady-state simulations, specified head nodes represent both recharge areas to the west and discharge areas to the east. Vertical leakage into or from the upper layer (AQ5), which, in many cases, represented the land surface, was simulated by specifying heads at nodes that simulated many lakes and rivers in the area. Constant-head boundary nodes used in the five aquifer layers are shown in figures 26-30. Vertical leakage into and from each aquifer layer was simulated by specifying heads in the aquifer layer above and by assigning vertical hydraulic-conductivity values and thickness values for the confining layer. The hydraulic conductivities of the confining layers were subsequently ad justed during calibration.
HYDRAULIC HEAD
Head data were used both as model input and as a base for comparison during calibration. As model input, they were used to establish heads at constant-head boundary nodes and in the aquifer layers for vertical leakage. For calibration, they provided the information for comparing with the com puted heads. Because most head data were calculated from drill-stem tests (DST), the accuracy of the DST recording devices was important.
Accuracy of bottom-hole pressure recorders used in DST's is generally one-quarter to one-half of 1 percent of the total range of the gages, depending on the type, age, and service history of the gages (Earlougher, 1977). However, when comparing drill-stem pressure readings with measured head in a test well, the data indicate that the accuracy of drill-stem recording devices is about ± 2 percent of the full- scale reading (D. H. Lobmeyer, written commun., 1981). For a 5,000-lb/in2 gage, the error in head could range from about ± 58 to ± 200 ft.
The U.S. Geological Survey used gages installed at the surface, along with subsurface gages for several DST's on test wells drilled as part of the study. Calculated heads,
corrected for density differences, were within 50 ft for the surface and subsurface pressure readings. Overall accuracy of the head data shown on the potentiometric surface maps for the Cambrian-Ordovician and Madison aquifers is esti mated to be ± 150 ft. Accuracy of head data for the Penn- sylvanian aquifer may be less.
CAMBRIAN-ORDOVICIAN, MADISON, AND PENNSYLVANIAN AQUIFERS
Head data used for the Cambrian-Ordovician and Madi son aquifers (figs. 31 and 32) are those developed by Miller and Strausz (1980a, b) but modified with later data for the Madison aquifer (K. D. Peter, written commun., 1983) near the Black Hills of South Dakota. Head data for the Penn- sylvanian aquifer (fig. 33) is from unpublished data devel oped by Miller from DST's (W. R. Miller, written commun., 1979).
Potentiometric surface maps developed by Miller and Strausz show the altitudes of freshwater heads that were determined from shut-in pressures of DST's (Miller, 1976, p. 17). Miller used the following equation, modified from Mur phy (1965), to convert the observed bottom-hole pressure to freshwater heads:
h = (FSIP x C)-PRD + LSD, (3) where
h is altitude of water surface, in feet above sea level,
FSIP is final bottom-hole pressure, in pounds per square inch,
C is a factor to convert FSIP to feet of water,PRD is depth to pressure recorder, in feet below
land-surface datum (LSD), andLSD is land-surface datum, in feet above or below
sea level.The factor C is 2.307 ft of water per 1 lb/in2 . The factor C also assumes that pure water at a temperature of 4 °C has a density of 1.00 g/cm3 . The resulting potentiometric maps indicate the altitude at which water levels would stand in tightly cased wells open to an aquifer, if the water in the well had an equivalent density of 1.00 g/cm3 . Gradients of equivalent freshwater head in a variable-density flow system may not be proportional to the magnitude of flow, nor indi cate the direction of flow. However, flow velocity can be calculated from the equivalent freshwater head, provided flu id density is known. In this study, these calculations were made through use of the pseudosource term, which used density data derived from maps of dissolved-solids concentra tion for each aquifer, as shown in figures 34-39.
LOWER AND UPPER CRETACEOUS AQUIFERS
Head data for Lower and Upper Cretaceous aquifers (figs. 40 and 41) are from D. H. Lobmeyer (written com mun., 1982). Lobmeyer used data primarily from DST's and converted the pressure to feet of water similar to that used by Miller and Strausz (1980a, b) for Paleozoic aquifers; how-

GEOHYDROLOGY OF BEDROCK AQUIFERS IN THE NORTHERN GREAT PLAINS E33
EXPLANATION
CONSTANT HYDRAULIC-HEAD NODE
PRECAMBRIAN ROCKS EXPOSED AT LAND SURFACE
FIGURE 26. Constant-head nodes used in model simulation of the Cambrian-Ordovician aquifer.
ever, he pointed out that the equivalent freshwater head maps contain inaccuracies similar to those in the maps of Paleozoic aquifers by Miller and Strausz (1980a, b). He fur ther stated that the accuracy of the equivalent freshwater head as shown in figures 40 and 41 is within one-half the contour interval in eastern North Dakota and eastern South Dakota and within one contour interval for the other areas where the contours are widely spaced. Those areas around the Black Hills on the South Dakota-Wyoming border,
around the edge of the Powder River basin, and in central Montana are accurate to only about 500 ft, or one-half the major contour interval for the Lower Cretaceous head map (fig. 40). The Upper Cretaceous head map (fig. 41) is be lieved to be accurate to within one contour interval, except where contours are inferred from surface elevations that are taken from l:l,000,000-scale contour maps. Heads for four of the major aquifers simulated during model calibration are shown in figures 42-45.

E34 REGIONAL AQUIFER-SYSTEM ANALYSIS
EXPLANATION
D CONSTANT HYDRAULIC-HEAD NODE
MISSISSIPPI AGE OR OLDER ROCKS EXPOSED AT LAND SURFACE
FIGURE 27. Constant-head nodes used in model simulation of the Madison aquifer.

GEOHYDROLOGY OF BEDROCK AQUIFERS IN THE NORTHERN GREAT PLAINS E35
EXPLANATION
a CONSTANT HYDRAULIC-HEAD NODE
PENNSYLVANIAN AGE OR OLDER ROCKS EXPOSED AT LAND SURFACE
FIGURE 28. Constant-head nodes used in model simulation of the Pennsylvanian aquifer.

E36 REGIONAL AQUIFER-SYSTEM ANALYSIS
EXPLANATIONO CONSTANT HYDRAULIC-HEAD
NODECRETACEOUS AGE OR OLDER
ROCKS EXPOSED AT LAND SURFACE
FIGURE 29. Constant-head nodes used in model simulation of the Lower Cretaceous aquifer.

GEOHYDROLOGY OF BEDROCK AQUIFERS IN THE NORTHERN GREAT PLAINS E37
EXPLANATION
D CONSTANT HYDRAULIC-HEAD NODE
CRETACEOUS AGE OR OLDER ROCKS EXPOSED AT LAND SURFACE
FIGURE 30. Constant-head nodes used in model simulation of the Upper Cretaceous aquifer.

E38 REGIONAL AQUIFER-SYSTEM ANALYSIS
Approximate limit of Cambrian-Ordovicianrocks
0 100 200 KILOMETERS
EXPLANATION
Z%%% PRECAMBRIAN ROCKS EXPOSED AT V/////A LAND SURFACE
3500 POTENTIOMETRIC CONTOUR Shows altitude of potentiometric surface. Dashed where no data are available. Contour interval 200 feet. National Geodetic Vertical Datum of 1929
FIGURE 31. Potentiometric surface of the Cambrian-Ordovician aquifer. Modified from Miller and Strausz (1980a).
TRANSMISSIVITY
Transmissivity of an aquifer reflects the rate at which ground water at the prevailing kinematic viscosity will flow through a unit width of the aquifer under a unit hydraulic gradient (Lohman and others, 1972). Very few data are available to describe the spatial transmissivity in any of the NGP aquifers. Transmissivity values for an aquifer may be obtained from aquifer tests, from analyses of data from DST's, from analyses of cores taken from test drilling, or from permeability determined in laboratories; however, all of these data are point information and represent only a small part of an aquifer. The transmissivity derived from DST's also is questionable (Konikow, 1976).
CAMBRIAN-ORDOVICIAN, MADISON, AND PENNSYLVANIAN AQUIFERS
Transmissivity values for the Cambrian-Ordovician, Madison, and Pennsylvanian aquifers (fig. 46-48) were from many sources. Konikow (1976) obtained the transmissivity values from a flow-net analysis of the cone of depression developed in a well field near Midwest, Wyo., that presuma bly tapped the Madison aquifer. Flow-net analysis assumes that a steady-state flow condition exists and that no leakage is occurring from or to adjacent aquifers. Konikow's analysis indicated that transmissivity was about 0.013 ft2/s; however, Konikow stated that this value may be accurate only within a factor of 2 or 3 because of the lack of data about the average rate of long-term withdrawal and the exact configuration of

GEOHYDROLOGY OF BEDROCK AQUIFERS IN THE NORTHERN GREAT PLAINS714°r----^_n2°I T ~^_ -_iar______108° __
^33°°"MONTANA
E39
Approximate limit of the Madison Limestone
200 KILOMETERS
EXPLANATION
^^ MISSISSIPPIAN AGE OR OLDER Y//////S ROCKS EXPOSED AT LAND
SURFACE
3500 POTENTIOMETRIC CONTOUR Shows altitude of potentiometric surface. Dashed where no data are available. Contour interval 200 feet. National Geodetic Vertical Datum of 1929
FIGURE 32. Potentiometric surface of the Madison aquifer. Modified from Miller and Strausz (1980b).
the cone of depression. In addition, Busby, Lee, and Han- shaw (1983), in their analysis of geochemical data from the Midwest area, indicated that some leakage occurred from the overlying Pennsylvanian and Permian formations that was not considered by Konikow in his calculations, and so trans- missivity of the Madison aquifer in the Midwest, Wyo., area may be less than 0.013 ft2/s.
W. R. Miller (1976) states that data from DST's in Montana indicate that transmissivity of the Madison aquifer ranges from about 5xlO'7 to 6xlO'2 ft2/s. However, Miller did not consider water viscosity changes with temperature in his calculations. The reliability of transmissivity values de
rived from DST's also is questionable because of inherent errors in the recording devices and the short shut-in times of most DST's.
On the basis of an analysis of data from step-drawdown tests performed at selected intervals in the Madison Lime stone at Madison test well 3 (fig. 1), Blankennagel, Howells, and Miller (1981) reported a transmissivity range of from 0.037 to 0.052 ft2/s, with an assumed storage coefficient of 2x10~6 . The lower value of transmissivity appears to be asso ciated with the upper part of the Madison aquifer at this location. The range in reported transmissivity values may be related to the significant variability of secondary porosity

E40 REGIONAL AQUIFER-SYSTEM ANALYSIS
,00-CANADA!*-STATES T
*,,_ Approximate limit of Pennsylvanianand Permian r^i~
100 200 KILOMETERS
EXPLANATIONPERMIAN AGE OR OLDER ROCKS
EXPOSED AT LAND SURFACE
3600-- POTENTIOMETRIC CONTOUR Shows altitude of potentiometric surface. Dashed where no data are available. Interval is variable. National Geodetic Vertical Datum of 1929
FIGURE 33. Potentiometric surface of the Pennsylvanian aquifer. From W. R. Miller (written commun., 1980).

GEOHYDROLOGY OF BEDROCK AQUIFERS IN THE NORTHERN GREAT PLAINS E41
Approximate limit of Cambrian-Ordovicianrocks
200 KILOMETERS
EXPLANATION
PRECAMBRIAN ROCKS EXPOSED AT LAND SURFACE
5000 LINE OF EQUAL DISSOLVED SOLIDS CONCENTRATION Interval, in milligrams per liter, is variable
A A' LINE OF SECTION (figure 2)
FIGURE 34. Concentration of dissolved solids in water from the Cambrian-Ordovician aquifer. From J. F. Busby (written commun., 1982).
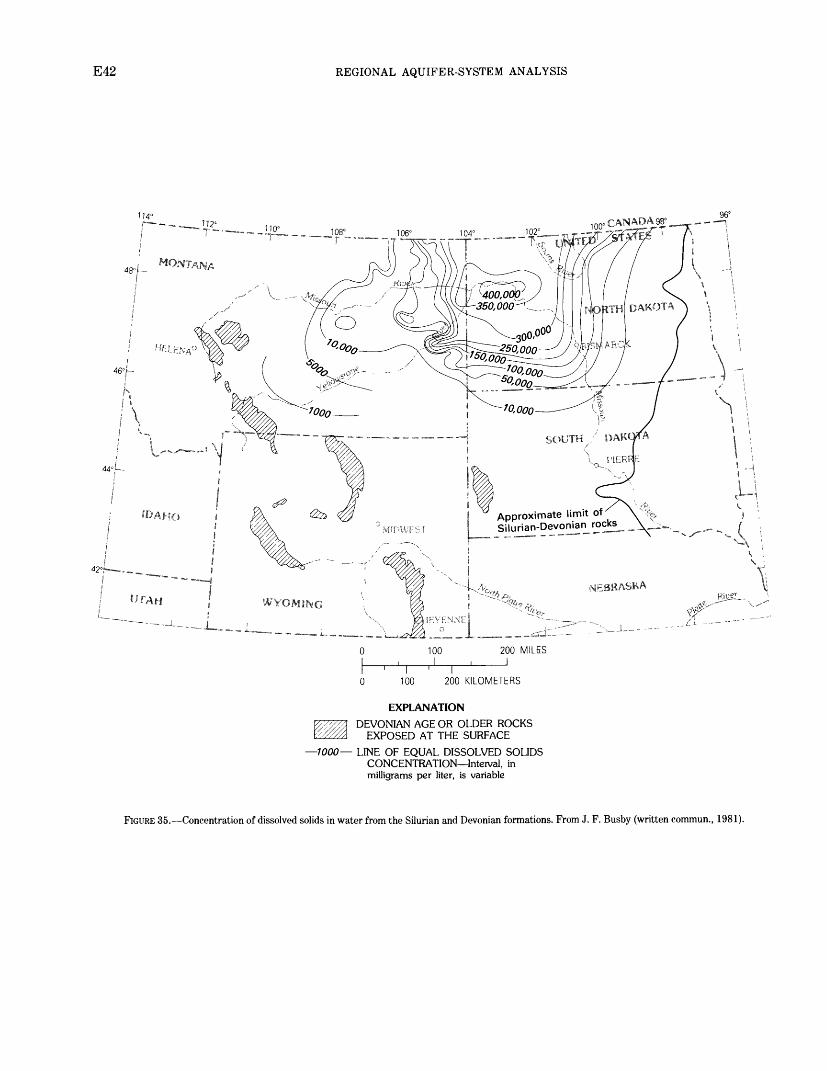
E42 REGIONAL AQUIFER-SYSTEM ANALYSIS
Approximate limit Silurian-Devonian rocks
100 200 MILES _J
100 200 KILOMETERS
EXPLANATIONDEVONIAN AGE OR OLDER ROCKS
EXPOSED AT THE SURFACE-1000 LINE OF EQUAL DISSOLVED SOLIDS
CONCENTRATION Interval, in milligrams per liter, is variable
FIGURE 35. Concentration of dissolved solids in water from the Silurian and Devonian formations. From J. F. Busby (written commun., 1981).

GEOHYDROLOGY OF BEDROCK AQUIFERS IN THE NORTHERN GREAT PLAINS E43
Approximate limit of the Madison Limestone
100 200 KILOMETERS
EXPLANATION
MISSISSIPPIAN AGE OR OLDER ROCKS EXPOSED AT LAND SURFACE
-500 LINE OF EQUAL DISSOLVED-SOLIDS CONCENTRATION Interval, in milligrams per liter, is variable
FIGURE 36. Concentration of dissolved solids in water from the Madison aquifer. From J. F. Busby (written commun., 1981).

E44 REGIONAL AQUIFER-SYSTEM ANALYSIS
. roximatePennsylvanian and Permian rocks
100 200 KILOMETERS
EXPLANATION
PERMIAN AGE OR OLDER ROCKS EXPOSED AT LAND SURFACE
2000 LINE OF EQUAL DISSOLVED-SOLIDS CONCENTRATION Interval, in milligrams per liter, is variable
FIGURE 37. Concentration of dissolved solids in water from the Pennsylvanian aquifer. From J. F. Busby (written commun., 1982).

GEOHYDROLOGY OF BEDROCK AQUIFERS IN THE NORTHERN GREAT PLAINS E45
! 00° CANADA 98j' u
\
Approximate Jriassic rocks
Approximate limitJurassic rocks , Juia v
0 100 200 KILOMETERS
EXPLANATION
JURASSIC AND TRIASSIC AGE OR OLDER ROCKS EXPOSED AT THE SURFACE
-5000 LINE OF EQUAL DISSOLVED-SOLIDS CONCENTRATION Interval, in milligrams per liter, is variable
FIGURE 38. Concentration of dissolved solids in water from the Triassic and Jurassic formations. From J. F. Busby (written commun., 1981).

E46 REGIONAL AQUIFER-SYSTEM ANALYSIS
100 200 MILES
I0 100 200 KILOMETERS
EXPLANATION
JURASSIC AGE OR OLDER ROCKS EXPOSED AT LAND SURFACE
2000 LINE OF EQUAL DISSOLVED-SOLIDS CONCENTRATION Interval, in milligrams per liter, is variable
FIGURE 39. Concentration of dissolved solids in water from the Lower Cretaceous aquifer. Modified from K. D. Peter (written commun., 1982).

GEOHYDROLOGY OF BEDROCK AQUIFERS IN THE NORTHERN GREAT PLAINS E47
100 200 KILOMETERS
EXPLANATION
CRETACEOUS AGE OR OLDER ROCKS EXPOSED AT LAND SURFACE
LOWER CRETACEOUS ROCKS ABSENT BENEATH YOUNGER SEDIMENTS
2000 POTENTIOMETRIC CONTOUR-^Shows altitude of potentiometric surface. Interval 1000 feet. National Geodetic Vertical Datum of 1929
FIGURE 40. Potentiometric surface of the Lower Cretaceous aquifer. Modified from D. H. Lobmeyer (written commun., 1982).

E48 REGIONAL AQUIFER-SYSTEM ANALYSIS
96°100° CANADA^ _ s
ESTATES 1 X i
1 ' T100 200 KILOMETERS
EXPLANATION 7600 POTENTIOMETRIC CONTOUR Shows
altitude of potentiometric surface. Dashed where no data are available. Interval 200 feet. National Geodetic Vertical Datum of 1929
LIMIT OF FOX HILLS SANDSTONE(LATE CRETACEOUS AGE) Dashed where inferred
FIGURE 41. Potentiometric surface of the Upper Cretaceous aquifer. From D. H. Lobmeyer (written commun., 1982).

GEOHYDROLOGY OF BEDROCK AQUIFERS IN THE NORTHERN GREAT PLAINS E49
^Approximate lim Cambrian-OrdoviciaJprocks
100 200 MILES I
0 100 200 KILOMETERS
EXPLANATION
PRECAMBRIAN ROCKS EXPOSED AT LAND SURFACE
3000 POTENTIOMETRIC CONTOUR Shows altitude of potentiometric surface. Dashed where no data are available. Interval 200 feet. National Geodetic Vertical Datum of 1929
FIGURE 42. Simulated potentiometric surface of the Cambrian-Ordovician aquifer. Modified from Downey (1982).

E50 REGIONAL AQUIFER-SYSTEM ANALYSIS
Approximate limit of the Madison Limestone
Proximate limit of the 0nLl' m8&ne
WYOMING
100
\ 'I100 200 KILOMETERS
200 MILES_J
EXPLANATION
Wtt MISSISSIPPIAN AGE OR OLDER ^ ROCKS EXPOSED AT LAND
SURFACE 4400 POTENTIOMETRIC CONTOUR Shows
altitude of potentiometric surface. Dashed where no data are available. Interval 200 feet. National Geodetic Vertical Datum of 1929
FIGURE 43. Simulated potentiometric surface of the Madison aquifer. Modified from Downey (1982).

GEOHYDROLOGY OF BEDROCK AQUIFERS IN THE NORTHERN GREAT PLAINS E51
-^u»^""STATES" T "^.1081
Approximate l/rrv Ul ^ Penn^ylvan/an-Permian
100 200 MILES
100 200 KILOMETERS
EXPLANATION
PERMIAN AGE OR OLDER ROCKS EXPOSED AT LAND SURFACE
1800 POTENTIOMETRIC CONTOUR Shows altitude of potentiometric surface. Dashed where no data are available. Interval, in feet, is variable. National Geodetic Vertical Datum of 1929
FIGURE 44. Simulated potentiometric surface of the Pennsylvanian aquifer.

E52 REGIONAL AQUIFER-SYSTEM ANALYSIS
48°
100I
200 KILOMETERS
EXPLANATION
LOWER CRETACEOUS ROCKS MISSING IN THE SUBSURFACE
JURASSIC AND TRIASSIC AGE OR OLDER ROCKS EXPOSED AT LAND SURFACE
2400 POTENTIOMETRIC CONTOUR Shows altitude of potentiometric surface. Dashed where no data are available. Interval 200 feet. National Geodetic Vertical Datum of 1929
FIGURE 45. Simulated potentiometric surface of the Lower Cretaceous aquifer.

GEOHYDROLOGY OF BEDROCK AQUIFERS IN THE NORTHERN GREAT PLAINS E53
48°
46
Approximate Cambrian-Ordovicianrocks
NEBRASKA
44
100 200 MILES I
1 I ' I 0 100 200 KILOMETERS
EXPLANATION
PRECAMBRIAN ROCKS EXPOSED AT LAND SURFACE
1000 LINE OF EQUAL TRANSMISSIVITY Interval, in square feet per day, is variable. Dashed where no data are available
FIGURE 46. Transmissivity distribution used in the Cambrian-Ordovician aquifer simulations. Modified from Downey (1982).

E54 REGIONAL AQUIFER-SYSTEM ANALYSIS
100° r-T \
NORTH DAKOTA
s£
Approximate limit of the Madison Limestone
100 200 MILES _J
0 100 200 KILOMETERS
EXPLANATIONMISSISSIPPIAN AGE OR OLDER
ROCKS EXPOSED AT LAND SURFACE
1250 LINE OF EQUAL TRANSMISSIVITY Interval, in square feet per day, is variable. Dashed where no data are available
FIGURE 47. Transmissivity distribution used in the Madison aquifer simulations. Modified from Downey (1982).

GEOHYDROLOGY OF BEDROCK AQUIFERS IN THE NORTHERN GREAT PLAINS E55
10~ ,UU
!
%** Approxim
.
I ' I
0 100 200 KILOMETERS
EXPLANATION
^^/ PERMIAN AGE OR OLDER ROCKS 4WKX EXPOSED AT LAND SURFACE
Knn-~ I INF OF FOriAT TRANQMT^TWJTV
Y/////A tXKUbtlJ Al LA1NL) bUKhACt
500 LINE OF EQUAL TRANSMISSIVITY Interval 250 square feet per day. Dashed where inferred
FIGURE 48. Transmissivity distribution used in the Pennsylvanian aquifer simulations.

E56 REGIONAL AQUIFER-SYSTEM ANALYSIS
and to permeability developed by fractures and solution fea tures in the limestone and may indicate that point or local tests of the aquifers do not represent the average transmis- sivity values on a regional scale.
Konikow (1976) assumed an average value of horizontal transmissivity, on the basis of his flow-net analyses, for his simulation of the Madison aquifer. Konikow's value of trans missivity was converted to hydraulic conductivity by dividing the transmissivity value by the thickness of the Madison aquifer. This converted value was used in this study to gener ate the initial values of transmissivity for the Cambrian- Ordovician, Madison, and Pennsylvanian aquifers.
The transmissivity values used in the simulation then were calculated by multiplying the horizontal hydraulic con ductivity obtained from Konikow's analysis by aquifer thick ness at each node and by adjusting for the changes in viscosi ty of water that occur with temperature (table 1).
Available data show that the temperature of the ground water in the Cambrian-Ordovician and Madison aquifers var ies from about 46 °F in or near outcrop areas to more than 300 °F in some deeper parts of the Williston basin. The kinematic viscosity of water decreases as its temperature increases (fig. 49). Thus, higher temperature water can be transmitted through a given aquifer at a smaller hydraulic gradient than equal quantities of cooler temperature water.
TABLE 1. Adjustments to transmissivity, based on water temperature in aquifers
[Table modified from Konikow (1976); °F, degrees Fahrenheit; cm2/s, square centimeters per second; s, second; ft2/s, square feet per second]
Temperature range(°F)
69-104- - - -105-140- - - - 141-176- - - -
Standard reference2m Ot 9 - -
oiq 040 ...
£j^y £j(J^
Median kinematic viscosity,
in centistokes (10-2 cm2/s)
l.ol----- .804
c E* /»
----- .355- - °.9S
.£iOi7
Viscosity ratio 1
0.271 .441 .639 .853
1.00 1.08 1.32 1.56
Adjusted transmissivity
ft2/s
0.006 .010 .015 .020 .023 .025 .030 .036
20 40 60 80 100 120
TEMPERATURE, IN DEGREES CELSIUS
140
FIGURE 49. Relation between viscosity of water and temperature. Modified from Konikow (1976).
'This multiplication factor equals the ratio of (1) the kinematic viscosity at the temperature of the standard of reference to (2) the kinematic viscosity at the mean temperature of a zone.
2A11 transmissivity adjustments are referenced to the standard reference of transmissivity at
Because kinematic viscosity of water is dependent on water temperature, and because transmissivity is inversely propor tional to kinematic viscosity, effective transmissivity of the aquifer will vary as a function of water temperature.
Measured water temperatures in the Cambrian-Ordovi cian and the Madison aquifers are shown in figures 50 and 51. Temperature data for the Cambrian-Ordovician and Madison aquifers are from MacCary (1981), J. F. Busby (written commun., 1981), and Head, Kilty, and Knottek (1979). Temperature data for the Lower and Upper Creta ceous aquifers (figs. 52 and 53) are from D. H. Lobmeyer (written commun., 1982). Lines of equal temperature deline ate temperature zones, which were used in the calculation of the transmissivity for each node of the model. The adjusted transmissivities are transmissivities of freshwater with a specific gravity of 1.0 and with the temperature of the for mation water at the point of interest; these transmissivities were used in the pseudosource approach.
From field tests in the Madison Limestone, transmissivi ty values were found to be apparently related to porosity values determined from borehole geophysical logs (R. K. Blankennagel, D. L. Brown, and L. M. MacCary, written commun., 1981). This relation probably can be explained by transmissivity being modified by the degree of fracturing (secondary porosity). Because of this experimental observa tion, the initial temperature-adjusted transmissivities were further adjusted to account for porosity variations. MacCary (1981) presented maps (figs. 54 and 55) that show total thickness of rock in the Cambrian-Ordovician and Madison aquifers as having porosity of 10 percent or greater. By using these maps, an average thickness of aquifers having porosity of 10 percent or more was calculated for the block associated with each node. A set of transmissivity-adjust- ment factors, which were selected arbitrarily, is shown in table 2. The temperature-adjusted transmissivity value of

GEOHYDROLOGY OF BEDROCK AQUIFERS IN THE NORTHERN GREAT PLAINS
'T2-
E57
Approximate limit of Cambrian-Ordovician
I ' T100 200 KILOMETERS
EXPLANATION
^^ PRECAMBRIAN ROCKS EXPOSED AT Y7////, LAND SURFACE
-700 LINE OF EQUAL TEMPERATURE Interval 20 and 30 degrees Celsius. Dashed where no data are available
FIGURE 50. Water temperatures in the Cambrian-Ordovician aquifer. From J. F. Busby (written commun., 1981).
each node was multiplied by the appropriate factor from table 2, according to the average thickness of the aquifers at that node. The finally adjusted transmissivities were used as
TABLE 2. Transmissivity adjustment factors based on thickness of rock with porosity greater than 10 percent
Thickness of rock with porosity greater than 10 percent
(feet)
L\J
10-20- ----------
30-50- ----------50-100 ----------
100-150 ----------150-200 ----------200-300 ---------->300 -----------
Transmissivity adjustment
'./.£
-------- .4
-------- -1.0
J..£
-------- -1.4------ -_1C
l.o
the initial values for the model variable input during the simulations of the Cambrian-Ordovician, Madison, and Penn- sylvanian aquifers and were further adjusted during model calibration. The final sets of transmissivity values after cali brations used in all model simulations for the Cambrian- Ordovician, Madison, and Pennsylvanian aquifers are shown in figures 46-48.
LOWER AND UPPER CRETACEOUS AQUIFERS
Initial transmissivity of the Lower and Upper Creta ceous aquifers was from data supplied by H. L. Case III and R. D. Butler (written commun., 1980). These data were used in the calibration of a simulation model of the Cretaceous sandstone aquifers of North Dakota and South Dakota. These transmissivity values also were adjusted during model

E58 REGIONAL AQUIFER-SYSTEM ANALYSIS
174
Approximate limit of the Madison Limestone
100 200 MILES
100 200 KILOMETERS
EXPLANATION
MISSISSIPPIAN AGE OR OLDER ROCKS EXPOSED AT LAND SURFACE
100 LINE OF EQUAL TEMPERATURE Interval 20 and 30 degrees Celsius
FIGURE 51. Water temperatures in the Madison aquifer. Modified from MacCary (1981) and Head, Kilty, and Knottek (1979).

GEOHYDROLOGY OF BEDROCK AQUIFERS IN THE NORTHERN GREAT PLAINS E59
UTAH
~1WYOMING
CHEYENNE I
__ _JL_. _ li ___ _
100 200 MILES
0 100 200 KILOMETERS
EXPLANATION
OUTCROP OF ROCKS OF EARLY CRETACEOUS AGE OR OLDER
LOWER CRETACEOUS ROCKS ABSENT BENEATH YOUNGER SEDIMENTS
80 LINE OF EQUAL GROUND-WATER TEMPERATURE Interval is 20 degrees Celsius
FIGURE 52. Water temperatures in the Lower Cretaceous aquifer. Modified from D. H. Lobmeyer (written commun., 1982).

EGO REGIONAL AQUIFER-SYSTEM ANALYSIS
DAKOTA
96°100° CAN ADA 98°" """"""^ I
» -4
100 200 MILES _J
0 100 200 KILOMETERS
EXPLANATION
30 LINE OF EQUAL GROUND-WATER TEMPERATURE Interval is 10 degrees Celsius
FIGURE 53. Water temperatures in the Upper Cretaceous aquifer. Modified from D. H. Lobmeyer (written commun., 1982).

GEOHYDROLOGY OF BEDROCK AQUIFERS IN THE NORTHERN GREAT PLAINS E61
42°. |
lt.YF.NNE I
100 200 MILES
Approximate limit of'Cambrian-Ordovicianrocks
£>, NEBRASKA ^,'ff ^k.
100 200 KILOMETERS
EXPLANATION
PRECAMBRIAN ROCKS EXPOSED AT LAND SURFACE
200 LINE OF EQUAL THICKNESS OF ROCK HAVING POROSITY GREATER THAN 10 PERCENT Interval 50 and 100 feet
FIGURE 54. Porosity distribution in the Cambrian-Ordovician aquifer. Modified from MacCary (1981).

E62 REGIONAL AQUIFER-SYSTEM ANALYSIS
Approximate limit of the Madison Limestone
44
100 200 KILOMETERS
EXPLANATION
7%%Z MISSISSIPPIAN AGE OR OLDER V/////A ROCKS EXPOSED AT LAND
SURFACE WO LINE OF EQUAL THICKNESS OF
ROCK HAVING POROSITY GREATER THAN OR EQUAL TO 10 PERCENT Interval 200 feet
FIGURE 55. Porosity distribution in the Madison aquifer. Modified from MacCary (1981).
calibrations. The final transmissivity for each of the Creta ceous aquifers is shown in figures 56 and 57.
VERTICAL HYDRAULIC CONDUCTIVITY
Vertical hydraulic conductivity is the controlling factor for leakage into and out of aquifers in the northern Great Plains, but it is the least known of the hydrologic properties used for the simulations. Very few cores from oil well drilling have been tested for vertical hydraulic conductivity. In a few
instances, vertical permeability to air has been determined. One test performed on core from the Lodgepole Limestone of the Madison Group in Montana indicated a vertical permea bility ranging from 0.00017 to 0.05 ft/s; however, this analy sis also reported oil saturation ranging from 3.6 to about 25 percent, which may affect the results to vertical flow of water through the formation (Chapman, 1982).
Experience with simulation models indicates that point values of vertical hydraulic conductivity, such as those deter mined in core analysis, rarely represent the average regional value of the vertical hydraulic conductivity of confining units because of the complexity of the hydrologic system. Geologic

GEOHYDROLOGY OF BEDROCK AQUIFERS IN THE NORTHERN GREAT PLAINS E6396°
100° r - - 1
] X '
200 KILOMETERS
EXPLANATION
JURASSIC AND TRIASSIC OR OLDER WOO LINE OF EQUAL TRANSMISSIVITY ROCKS EXPOSED AT THE Interval, in square feet per day, is SURFACE variable. Dashed where inferred
APPROXIMATE AREA WHERE LOWER CRETACEOUS ROCKS ARE MISSING IN THE SUBSURFACE
FIGURE 56. Transmissivity distribution used in the Lower Cretaceous aquifer simulations.
structure and associated fracturing have a major influence on vertical hydraulic conductivity of the confining beds. Data from petroleum reservoir studies indicate that fractures ap proximately 0.02 in. wide account for more than 90 percent of the total flow through dense rock such as limestone.
The importance of fracture flow in shales is illustrated by Neuzil's work (1980) on the Pierre Shale of South Dako ta. The Pierre Shale is considered to be a confining bed to the underlying Lower Cretaceous aquifer. Neuzil indicates that most leakage through the Pierre Shale may occur along fractures spaced about 300-32,000 ft apart. At some loca tions in North Dakota, the Pierre Shale acts as an aquifer with water production from near-surface fracture zones
(Downey, 1973) developed probably by loading and unload ing of glacial materials during the Pleistocene. In this study, a preliminary value of vertical hydraulic conductivity was estimated for each node from lithologic and porosity maps, from confining-bed thickness maps, from water temperature maps, and from maps of geologic structure, such as faults and lineaments.
For each node, the estimated value of vertical hydraulic conductivity was used to calculate a leakage value (hydraulic conductivity divided by thickness) and was used in the pre liminary simulations. During the model calibrations, the ini tial values of leakage for each node then were adjusted within reasonable limits to match the simulated heads with

E64 REGIONAL AQUIFER-SYSTEM ANALYSIS
the observed potentiometric maps. Values of vertical hydrau lic conductivity of each confining layer used in the simula tions are shown in figures 58-61.
STORAGE COEFFICIENT
As with all of the hydrologic properties, few data exist for values of the storage coefficient. The storage coefficient of a confined aquifer may be calculated if the porosity, rock compressibility, and aquifer thickness are known. However, these values are difficult to determine in the field.
For most confined aquifers, the storage coefficient prob ably ranges from l.OxlO'5 to l.OxlO'3 (Lohman, 1979). Estimates of the storage coefficient from aquifer tests in the
Madison Limestone are mostly within this range (Wyoming State Engineer's Office, 1974, 1976; Downey, 1973; Blankennagel and others, 1977). For simulation of the NGP bedrock aquifers, values of 1 x 10'4 and 1 x 10"6 were used for the storage coefficient in transient simulations.
DISCUSSION OF THE REGIONAL FLOWSYSTEM ON THE BASIS OF MODEL
SIMULATION
The five major aquifers in the northern Great Plains constitute one of the largest confined aquifer systems in the United States. This system extends more than 600 mi from mountainous recharge areas in Montana, Wyoming, and
100° CANADA.?* __. i
I 1
FIFKRF.
A
Approximate limit of \ Upper Cretaceous rocks \
\ ' T 100 200 KILOMETERS
EXPLANATION
%/^ JURASSIC AND TRIASSIC OR OLDER ///////< ROCKS EXPOSED AT THE
SURFACE-750 LINE OF EQUAL TRANSMISSIVITY
Interval is 250 square feet per day
FIGURE 57. Transmissivity distribution used in the Upper Cretaceous aquifer simulations.

GEOHYDROLOGY OF BEDROCK AQUIFERS IN THE NORTHERN GREAT PLAINS E65
South Dakota to discharge areas in the eastern Dakotas and the Canadian Province of Manitoba. The total area compris ing the flow system is more than 300,000 mi2.
All five of the aquifers crop out and receive recharge in the highland areas in the western part of the study area (fig. 2). Recharge also occurs in aquifer outcrops in the Black Hills uplift area of South Dakota (pi. 3). The major recharge area for the Madison aquifer in the Black Hills of South Dakota is a plateau on the west flank of the Black Hills uplift. This limestone shows many solution features, such as caves and sinkholes. The Wyoming State Engineer's Office (1974) states that recharge in this area of 187,000 acres amounts to 6.8 in./yr or about 146 ft3/s. Virtually all east
ward-flowing streams draining these areas lose part of their flow (Swenson, 1968; Wyoming State Engineer's Office, 1974) as they cross the aquifer outcrop areas. Although small in quantity, recharge also is received from precipitation falling directly on the exposed rocks.
Streamflow measurements of several streams that drain the east side of the Black Hills (fig. 2) indicate that as much as 10 ft3/s were lost from the streams as they crossed the outcrop of the Madison aquifer (Swenson, 1968). Prior to a stream-channel sealing project during 1937, streamflow losses of about 100 ft3/s were reported by Powell (1940). On the basis of similar aquifer lithology and degree of weather ing, most streams draining the western mountainous areas,
Approximate limit of Cambrian-Ordovician rocks
i ' r100 200 KILOMETERS
EXPLANATION
PRECAMBRIAN ROCKS EXPOSED AT THE SURFACE
CONFINING LAYER IS THIN OR ABSENT
40 LINE OF EQUAL VERTICALHYDRAULIC CONDUCTIVITY Interval, in square feet per day xlO' 7 , is variable
FIGURE 58. Vertical hydraulic conductivity of confining layer TKl used in the aquifer simulations. Modified from Downey (1982).

E66 REGIONAL AQUIFER-SYSTEM ANALYSIS
WHMtnni wag. MM. «».... ^ _-^»«. / \Approximate limit of th'e'/*" "" » ( '
Madison Limestone ^^
r100 200 KILOMETERS
EXPLANATION
MISSISSIPPIAN AGE OR OLDER ROCKS EXPOSED AT LAND SURFACE
AREA OF SALT LAYER Vertical hydraulic conductivity near zero
CONFINING LAYER IS THIN OR ABSENT
-100 LINE OF EQUAL VERTICALHYDRAULIC CONDUCTIVITY Interval, in square feet per day xlO 7 , is variable
FIGURE 59. Vertical hydraulic conductivity of confining layer TK2 used in the aquifer simulations. Modified from Downey (1982).

GEOHYDROLOGY OF BEDROCK AQUIFERS IN THE NORTHERN GREAT PLAINS E67
Approximate limit o Tn' aSSiC r°CkS
DAKOTA
Approximate limit of "A 1
[X Approximate limit of Jurassic rocks
* i , Triassic rocksNFBRASKA
100 200 KILOMETERS
EXPLANATION
JURASSIC AND TRIASSIC AGE OR OLDER ROCKS EXPOSED AT THE SURFACE
AREA OF SALT DEPOSITS Verticalhydraulic conductivity near zero
250 LINE OF EQUAL VERTICALHYDRAULIC CONDUCTIVITY Interval in feet per day xlO' 10
FIGURE 60. Vertical hydraulic conductivity of confining layer TK3 used in the aquifer simulations.

E68 REGIONAL AQUIFER-SYSTEM ANALYSIS
104° 102°
NORTH DAKOTA
Approximate limit of I Triassic rocks
Approximate limita I > Approximate limit of Jurassic rocks
'v / Triassic rocks
1 ' T100 200 KILOMETERS
EXPLANATION
%%%? JURASSIC AND TRIASSIC AGE OR V//////, OLDER ROCKS EXPOSED AT THE
SURFACE
W LINE OF EQUAL VERTICALHYDRAULIC CONDUCTIVITY Interval in feet per day xlO 4
FIGURE 61. Vertical hydraulic conductivity of confining layer TK4 used in the aquifer simulations.
such as the Bighorn Mountains, can be assumed to lose nearly the same amounts of flow as they cross the outcrops of Paleozoic aquifers.
Recharge to the Lower Cretaceous aquifer occurs by infiltration at outcrop areas and leakage from underlying units. Miller and Rahn (1974) calculated 0.8 in./yr of recharge at outcrops of Lower Cretaceous sandstone in the Black Hills. Assuming an outcrop area for the Lower Creta ceous aquifer of about 334 mi2 (H. L. Case III, written commun., 1982) in the Black Hills area and 0.8 in./yr recharge, then approximately 20 ft3/s of recharge would enter this aquifer. C. B. Brown (1944) gaged many streams
along the eastern flank of the Black Hills. In contrast to water losses in Paleozoic aquifers, Brown noted that no mea surable stream loss from any of the observed streams was detected at the outcrop of Cretaceous rock. Recharge to the Cretaceous aquifers may occur from the Paleozoic rocks at shallow depth in the recharge area of the Black Hills. Schoon (1971) postulated that recharge occurs in the Black Hills area but did not distinguish relative amounts of recharge to each unit.
While surface-water data indicate that large quantities of water enter the aquifers along the outcrop areas in the western highlands, not all this water recharges the deep,

GEOHYDROLOGY OF BEDROCK AQUIFERS IN THE NORTHERN GREAT PLAINS E69
regional flow system and moves to the eastern discharge area. A large part of the water entering an aquifer moves at shallow depths and for short distances, then discharges along the flanks of the mountainous areas as springs and seeps (Rahn and Cries, 1973; Hodson, 1974; Swenson, 1968). The fraction of the total recharge that remains in the aquifers enters the regional flow system (shown diagrammatically for the Cambrian-Ordovician and Madison aquifers on plate 3-4 and B). The predevelopment flow regime for both aquifers as indicated by results of the model simulations after completion of calibration is summarized on plate 3A and B.
The rates of recharge shown for selected recharge areas are for the infiltration that enters the aquifers in areas close to or at land surface and that remains within the regional flow system. Discharge from the Madison and Pennsylvanian aquifers is to the adjacent and overlying formations along the
eastern subcrop of both units (pi. 35 and C). Discharge from the Cambrian-Ordovician aquifer is to adjacent shallow aqui fers and from springs and seeps in the Lake Agassiz basin of North Dakota and in Canada where the Cambrian-Ordovi cian formations crop out (pi. 3-4).
Discharge from the Lower Cretaceous aquifer is mainly upward to overlying units in eastern South Dakota (fig. 62) and along the subcrop of the Lower Cretaceous formations in the Lake Agassiz basin of North Dakota (pi. 3D). In 1984, considerable water was discharged from the Lower Creta ceous aquifer through unused wells along the Missouri and James River valleys of South Dakota. Discharge estimates from the Lower Cretaceous aquifer are shown on plate 3Z).
Ground-water discharge as springs that are located along the outcrop of Paleozoic rocks in the Canadian Prov ince of Manitoba (van Everdingen, 1968) appears to have
Note: Ground water leaves the area through the Lower Cretaceous (AQ4) aquifer at a rate of 20 ftVs
GLACIAL MATERIAL TERTIARY
UPPER CRETACEOUS
CRETACEOUS
O i
I I I 20 40
VERTICAL EXAGGERATION x140
LOWER CRETACEOUSJURASSICTRIASSICPENNSYLVANIAN-PERMIANMISSISSIPPIANDEVONIANSILURIANCAMBRIAN-ORDOVICIANPENNSYLVANIAN-PERMIANPRECAMBRIANMISSISSIPPIANPENNSYLVANIAN-PERMIANMISSISSIPPIAN
EXPLANATION
AQ.lJ AQUIFER LAYER | TK1 [ CONFINING LAYER
-^- DIRECTION OF GROUND-WATER MOVEMENT
+ 47 RECHARGE (INFLOW) OF WATER TO THE AQUIFER Number indicates rate of inflow in cubic feet per second
-50 DISCHARGE (OUTFLOW) OF WATER FROMAQUIFER Number indicates rate of outflow in cubic feet per second
Line of section, A-A'', on figure 2.
FIGURE 62. Generalized hydrogeologic cross section showing characteristics of ground-water recharge, flow, leakage, and discharge in the northernGreat Plains.

E70 REGIONAL AQUIFER-SYSTEM ANALYSIS
effects on the composition of water in Lake Winnipegosis and Lake Manitoba (pi. 3). Water of these lakes contains as much as 600 mg/L of chloride; springs along the shoreline dis charge up to 0.1 ft3/s of water, with a concentration of dissolved solids ranging from about 29,000 to 63,000 mg/L. The dominant ions present in the water are sodium and chloride. Seven springs located on the shore of Lake Win nipegosis in northern Manitoba discharge about 0.2 ft3/s from Devonian rocks underlying the lake (Cole, 1915).
Because of slow movement of ground water (figs. 63 and 64) and short residence time since glacial ice covered this area of Manitoba (12,000-14,000 yr), water discharged as springs probably is a mixture of brine from a deeper part of the aquifer and glacial melt water recharged into the aquifer while the aquifer was covered by glacial ice. The range of concentrations of dissolved solids may indicate that the water is a mixture of three flow components: (1) flow from the brine area (see fig. 65), (2) water recharged from the Pleis tocene glacial ice, and (3) fresher water flowing from the south along a flow path from the Black Hills (pi. 3A).
The Madison aquifer does not crop out in the eastern part of the study area. The formations composing the aquifer terminate in the subsurface and are overlain by younger rocks that consist mostly of shale. Thus, the discharge from the Madison aquifer in this area consists of vertical leakage through these overlying units and horizontal leakage (pi. 3A and B) to the Cambrian-Ordovician aquifer. Because, in the Canadian Provinces of Saskatchewan and Manitoba, strati- graphic unconformities between Paleozoic aquifers and over lying confining units result in favorable conditions for accu mulations of oil and gas in stratigraphic traps (McCabe, 1963), ground-water discharge is concentrated along the eastern, rather than the northern, limits of the Madison aqui fer. As a corollary to this, conditions in this area generally must be unfavorable for discharge of ground water from the Madison aquifer by vertical leakage.
An area of minimal ground-water flow on the eastern flank of the Williston basin coincides with an area where water has higher concentrations of dissolved solids (brine) and large fluid density (fig. 65). Three hypotheses were con sidered to interpret the flow in and near the area where the water has this high density.
The first hypothesis is that the brine in this area is static and that the hydrologic situation is similar to that described by Hubbert (1969) in which freshwater flowing through a synclinal structure comes into contact with static, dense brine along a sharp interface. Hubbert shows that a body of saline water under these conditions does not lie uniformly in the deepest part of the structure but, rather, is displaced upward along the base of the outflow flank; that is, while the inflow flank is occupied entirely by moving freshwater, the outflow flank contains static brine in the lower part of the aquifer and moving freshwater above the brine area. The flow of freshwater in the Williston basin is around the dense
brine area, as well as above, and this flow pattern reflects that the structure is actually a basin rather than a simple syncline as analyzed by Hubbert. The flow above the brine area apparently is leaking upward to units overlying the Madison rather than being contained in the upper part of the Madison. Simulation results, however, show small but consis tent flow velocities generally directed to the east and north east, through the high-density brines, in both the Cambrian- Ordovician and Madison aquifers. The simulations indicate that a small component of the regional flow actually moves directly across the Williston basin from west to east, through the high-density brine area. The low-flow velocities in the brine area demonstrate that the brine is not static, as Hub bert theorized in his synclinal model.
The second hypothesis assumes that some slow move ment of flow exists in the brine. This hypothesis allows an explanation of the origin of the brine; that is, that the brine may be attributed to solution of salt from halite beds as water moves through the basin, as described by Grossman (1968). The process of solution is enhanced by an increase in water temperature with depth; the highest salinities are found in regions of high temperature. Reduction in salinity in updip areas on the eastern flank of the basin is presumably due, at least in part, to precipitation of halite associated with cooler temperature, although dilution by fresher water also is undoubtedly a factor. To the extent that precipitation of halite occurs, it should result in a very gradual reduction in permeability, over geologic time intervals, in the areas where precipitation occurs. Velocities of flow are very slow relative to those elsewhere in the system, and most of the flow of fresher water appears to be deflected around the brine to the north or south or as leakage upward through confining beds into aquifers overlying the Madison aquifer. Thus, both the hydraulics and the density distribution resemble what would be observed in a system of totally static brine.
The third hypothesis assumes that the brine is in motion as it seeks to adjust to changes in recharge and discharge associated with the end of Pleistocene glaciation. These changes are discussed further on p. 74. If the brine were in a static condition during Pleistocene glaciation, that condition could not be at equilibrium with the new conditions imposed with the retreat of the ice sheets. The brine would begin to move at the end of glaciation and would seek a new equilibri um with the new recharge and discharge; this readjustment could still be in progress. Such a process could be contribut ing to some extent to the apparent movement of the brine; however, velocities computed from simulations appear to in dicate flow across the basin rather than as adjustment to glacial changes.
In summary, the second hypothesis, that some slow flow movements exist in the brine, seems to agree best with simu lation results and with observed data. Origin of the brine appears to be from the solution of halite. As the density of the brine has increased, the density change had an increasing

GEOHYDROLOGY OF BEDROCK AQUIFERS IN THE NORTHERN GREAT PLAINS E71
0 100 200 KILOMETERS
EXPLANATION
Highland area
Greater than 75 ft/yr
From 50 to 75 ft/yr
From 20 to 50 ft/yr
From 10 to 20 ft/yr
From 2 to 10 ft/yr
Less than 2 ft/yr
FIGURE 63. Rates of movement of water in the Cambrian-Ordovician aquifer (AQl). Modified from Downey (1982).

E72 REGIONAL AQUIFER-SYSTEM ANALYSIS
Approximate limit of the L°te Madison Limestone,
40°
I I 0 100 200 KILOMETERS
EXPLANATION
Highland area
From 50 to 75 ft/yr
From 10 to 20 ft/yr
From 2 to 10 ft/yr
Less than 2 ft/yr
FIGURE 64, Rates of movement of water in the Madison aquifer (AQ2). Modified from Downey (1982).

GEOHYDROLOGY OF BEDROCK AQUIFERS IN THE NORTHERN GREAT PLAINS
GLACIAL MATERIAL
TERTIARY
CRETACEOUS
JURASSIC
PENNSYLVANIAN-PERMIAN
TRIASSIC
PENNSYLVANIAN-PERMIAN
MISSISSIPPIAN
DEVONIAN
SILURIAN
CAMBRIAN-ORDOVICIAN
PRECAMBRIAN
EXPLANATION
AREA OF BRINE THAT EXCEEDS CONCENTRATIONS OF 100,000 mg/L DISSOLVED SOLIDS
I I I 0 20 40 80 160 MILES
VERTICAL EXAGGERATION x140
Line of section, A-A', on figure 2.
FIGURE 65. Diagrammatic cross section showing general locations of brine in the Williston basin of the northern Great Plains (for location of the crosssection, see fig. 2).
influence on the flow pattern. The increasing density has caused fresher water to divert around the brine to the north and south or above the brine and to leak upward into forma tions overlying the Madison aquifer. Although the second hypothesis seems acceptable, elements of the other two hy potheses also can be observed in the field. The present con figuration of the brine on the outflow side of the basin, and its generally low velocity, approximate the static brine situa tion described by Hubbert (1969), even though the brine is not totally static. In addition, distribution of the saline water may still be shifting in response to changes in recharge and discharge at the end of the Pleistocene glaciation.
Saline water also is found in other parts of the project area for example, in deeper parts of the Powder River basin although not at the concentrations encountered in the
Williston basin. Similar processes presumably can be applied to explain the distribution and movement of this saline water.
Because the highland recharge areas were not covered by major ice sheets during the glacial stages of the Pleis tocene, recharge continued to be available to the bedrock aquifers during glaciation. This condition would have enabled the solution of halites along the western edge of the Williston basin during the glacial period. Because of the short resi dence time and low flow velocities involved, the brine would not have had to move but would have tended to remain in the same general location (see pi. 3A and E).
The flow pattern in the Cambrian-Ordovician aquifer (pi. 3A) generally is similar to that in the Madison aquifer, although the Cambrian-Ordovician aquifer extends farther to

E74 REGIONAL AQUIFER-SYSTEM ANALYSIS
the east and north than the Madison does and crops out in the Canadian Province of Manitoba.
It has already been noted (see p. 70) that recharge and discharge patterns may have been significantly different dur ing glacial periods in the Pleistocene than at present. Such variation would have a number of implications in terms of the regional flow pattern. The existence of water at the base of the continental ice sheets has been suggested by many inves tigators (Robin, 1955; Gow, Veda, and Garfield, 1968; Mc- Ginnis, 1968). The water is the result of melting at the base of ice from geothermal and frictional heat. McGinnis (1968) estimated that the heat available to a temperate ice sheet from these sources could produce about 0.32 ft3 of meltwater per square foot of surface area of the ice sheet per year. This water might, at least in some areas, be under high pressure from the weight of overlying ice; in any case, widespread areal recharge to the ground-water system occurred in the areas covered by the continental ice sheets. The configura tion of ice over the northern Great Plains varied continuously during the Pleistocene (Flint, 1971), and the resulting distri bution of recharge would have varied continuously. High regions to the west that form the present recharge areas also presumably would have been recharge areas prior to glacia- tion and during both glacial and interglacial periods of the Pleistocene. However, during periods of strong glacial ad vance, recharge would have occurred over the northern and eastern parts of the study area, as well. The regional flow of ground water under these conditions must have been to the south, toward the only available discharge areas, in Nebras ka. As the continental ice successively retreated and ad vanced, directions of regional ground-water flow would have
varied accordingly and generated a complex history of move ment. However, solution of halite in the deeper parts of the Williston basin must have occurred throughout the history of the flow system, and velocities of flow in the areas of brine accumulation must have remained small regardless of the direction of flow. Results from several hypothetical simula tion conditions indicate that repeated changes in flow direc tion probably would not have resulted in major displacement of the saline water but, rather, in relatively minor shifting of its position. Thus, in terms of the deep brines, the glacial changes probably represented transient disturbances but not major redistributions.
In summary, the flow pattern prior to glaciation pre sumably was similar to that at present, sustained by recharge in high areas to the west. Glaciation produced re peatedly varying patterns of flow, but, in general, the altered patterns do not seem to have prevailed over long periods or to have caused major changes in distribution of the brines.
A generalized hydrogeologic cross section across east ern Walsh County, N. Dak., is shown in figure 66. The location of the cross section is near the eastern terminus of the Cambrian-Ordovician aquifer (see fig. 2). The general relation of the Cambrian-Ordovician aquifer to the shallower aquifers and to the surface-water bodies in this area is illus trated in figure 66. Part of the discharge from the Cambrian- Ordovician aquifer is apparently to a number of saline lakes in eastern North Dakota. The lakes are associated with de pressions that overlie deposits of fine sand and gravel. Origin of these lakes has been attributed to artesian water discharg ing from deep, regional flow systems (Laird, 1944). A sup porting hypothesis (Downey, 1969) relates the formation of
-LAKE DEPOSITS .GLACIAL TILL
.CRETACEOUS, LOWER CRETACEOUS
.JURASSIC.CAMBRIAN-ORDOVICIAN
EXPLANATION
DIRECTION OF GROUND-WATER MOVEMENT B'
FEET Red River of 1000
-800
SEA LEVELLine of section, B-B . on figure 2.
6 MILES
01 23456 KILOMETERS
FIGURE 66. Generalized hydrogeologic cross section across eastern Walsh County, N. Dak., showing discharge area of Cambrian-Ordovician aquifer (forlocation of cross section,see fig. 2). Modified from Downey (1973).

GEOHYDROLOGY OF BEDROCK AQUIFERS IN THE NORTHERN GREAT PLAINS E75
the lakes to alternations in recharge and discharge associat ed with Pleistocene glaciation. During glacial advances, meltwater at the base of the ice sheet (Gow, Veda, and Garfield, 1968; McGinnis, 1968) presumably was forced into the bedrock aquifers by hydrostatic pressure. Upon deglacia- tion, hydrostatic pressure would have been released and would have allowed large quantities of water to move rapidly out of the bedrock system. This rapid movement of water through overlying materials may have resulted in erosion of the lake sediment and formed the depressions in which the lakes exist today.
That these lakes now function as drains for the regional flow is supported by both geologic evidence and water chem istry. Test drilling indicates that fairly thick deposits of gla-
CFEET
3000
cial sand and gravel underlie the lake depressions and hy- draulically connect with the underlying bedrock (Downey, 1973). Chemical analyses of water samples taken from the test holes and lakes (Downey, 1971) indicate a chemical similarity to water from the Cambrian-Ordovician aquifer. These analyses indicate that water is able to move upward from the bedrock aquifers through the glacial sand and gravel deposits at the bottom of the lakes.
Vertical leakage through confining beds is an integral feature of the flow pattern in the bedrock-aquifer systems in the northern Great Plains (fig. 67). Leakage between aqui fers may be detected by geochemical methods, although the lack of geochemical data for many areas limits the applica tion of this method. An area of significant leakage inferred
C'
2000
1000
SEA LEVEL
1000
2000 Sfwsf
EXPLANATION
DIRECTION OF GROUND-WATER MOVEMENT
TRIASSIC-JURASSIC
PENNSYLVANIAN-PERMIAN
MISSISSIPPIAN
CAM BRIAN-DEVO NI AN
PRECAMBRIAN
Line of section, C-C', on figure 2.
0 25 50 100 MILES
0 25 50 100 KILOMETERS
FIGURE 67. Generalized hydrogeologic cross section showing ground-water discharge from Paleozoic to Mesozoic rocks (for location of cross section, see fig.2). Modified from Swenson (1968).

E76 REGIONAL AQUIFER-SYSTEM ANALYSIS
on the basis of similarities in water chemistry is shown in figure 68 (Busby, Lee, and Hanshaw, 1983). Leakage occurs both through the confining-bed matrix and along fractures in the confining bed associated with lineament zones (Weimer and others, 1982). Confining beds are not present every where, having been removed by erosion or, in some areas, never having been deposited. In those areas where a confin ing bed is absent, extensive hydraulic connection exists be tween aquifers, and leakage tends to be high; where the confining bed is thick and unfractured, leakage is low. Leak age along fractures is dependent on the degree of fracturing
and on interconnection between fractures. Work done in con nection with the flow of oil in petroleum reservoirs (Chilin- gar, Mannon, and Rieke, 1972) demonstrates that a fracture about 0.02 in. wide could account for more than 90 percent of the flow through a dense rock, such as limestone. In this study, thick halites, such as those in the Charles Formation, are considered to be poorly permeable to vertical flow.
Geochemical fades maps such as those shown in figures 69-72 for the Cambrian-Ordovician, Madison, Pennsylvani- an, and Lower Cretaceous aquifers may be used to indicate areas where leakage is occurring between aquifers. Similar
100 200 KILOMETERS
EXPLANATION
MISSISSIPPIAN AGE OR OLDER ROCKS EXPOSED AT LAND SURFACE
AREA OF INFERRED LEAKAGEBETWEEN CAMBRIAN-ORDOVICIAN AND MADISON AQUIFERS FROM GEOCHEMICAL DATA
AREA OF LEAKAGE BETWEEN MADISON AND LOWER CRETACEOUS AQUIFERS, INFERRED BY SWENSON (1968)
FIGURE 68. Area of inferred leakage between Paleozoic and Mesozoic aquifers, interpreted on the basis of geochemical data. Modified from J. F. Busby(written commun., 1982).

GEOHYDROLOGY OF BEDROCK AQUIFERS IN THE NORTHERN GREAT PLAINS E77
water types at the same location in adjoining aquifers indi cate that water is able to move between two aquifers through the confining beds at these sites. This type of geochemical data was used in adjusting the vertical leakage during model calibrations.
In this study, thick halites, such as those in the Charles Formation, are considered to be poorly permeable to the vertical flow of water. Geochemical evidence (J. F. Busby, written commun., 1982) indicates that extensive leakage oc curs among the Cambrian-Ordovician, Madison, and Penn- sylvanian aquifers in the northern Great Plains, with the Triassic and Jurassic formations providing low vertical per meability and restricting leakage between the Paleozoic aqui
fers and the Mesozoic aquifers. This restricted leakage indi cates that extensive development of the Paleozoic aquifers in part of the area would not severely affect the Mesozoic aqui fers in most of the area for a period of about 40 yr. The impact of development of the bedrock aquifers on water released from storage in associated confining beds must be considered. Water pumped from the aquifers may be derived, in part, from a confining bed, and water from confining beds may have an entirely different quality than water from the pumped aquifer.
Leakage between the Madison aquifer and the Lower Cretaceous aquifer in eastern South Dakota has been noted in several studies, including Swenson (1968), and was the
46'
44"
>, /\
U^xj
IDAHO S t
I42° I-
UTAH
"1
: Approximate limit of 1 Cambrian-Ordovician
rocks
WYOMINGNEBRASKA
100 200 MILES
100 200 KILOMETERS
PRECAMBRIAN ROCKS EXPOSED AT THE SURFACE
EXPLANATION
, AREA OF PRINCIPALLY BICARBONATE FACIES
~ AREA OF PRINCIPALLY SULFATE FACIES
AREA OF PRINCIPALLY CHLORIDE , FACIES
COMBINATIONS OF THESE NUMBERS INDICATE ORDER OF DOMINANT FACIES
FIGURE 69. Distribution of chemical facies for water in the Cambrian-Ordovician aquifer. From J. F. Busby (written commun., 1981).

E78 REGIONAL AQUIFER-SYSTEM ANALYSIS
Approximate limit of the Madison Limestone
100 200 KILOMETERS
EXPLANATION
MISSISSIPPIAN AGE OR OLDER ROCKS EXPOSED AT LAND SURFACE
AREA OF PRINCIPALLY BICARBONATE FACIES
AREA OF PRINCIPALLY SULFATE FACIES
AREA OF PRINCIPALLY CHLORIDE FACIES
COMBINATIONS OF THESE NUMBERS INDICATE ORDER OF DOMINANT FACIES
FIGURE 70. Distribution of chemical facies for water in the Madison aquifer. From J. F. Busby (written commun., 1982).

GEOHYDROLOGY OF BEDROCK AQUIFERS IN THE NORTHERN GREAT PLAINS E79
774°
r 772°- T _. 110° 108°
Approximate limit of
_106 104°
MONTANA V'vanian and Permian
46'
100 200 KILOMETERS
EXPLANATION
3 PERMIAN AGE OR OLDER ROCKS EXPOSED AT THE SURFACE
AREA OF PRINCIPALLY BICARBONATE FACIES
AREA OF PRINCIPALLY SULFATE FACIES
AREA OF PRINCIPALLY CHLORIDE FACIES
COMBINATIONS OF THESE NUMBERS INDICATE ORDER OF DOMINANT FACIES
FIGURE 71. Distribution of chemical facies for water in the Pennsylvanian aquifer. From J. F. Busby (written commun., 1982).

E80114°
"T- - ~_J'21.~_ no
REGIONAL AQUIFER-SYSTEM ANALYSIS
J08° 106° 104°10o°CANADA98:
""STATES T96°
- -
46'
44
100 200 MILES
r i |100 200 KILOMETERS
EXPLANATION
HIGHLAND RECHARGE AREA
AREA OF PRINCIPALLY BICARBONATE FACIES
AREA OF PRINCIPALLY SULFATE FACIES
~ AREA OF PRINCIPALLY CHLORIDE I J I FACIES
COMBINATIONS OF THESE NUMBERS INDICATE ORDER OF DOMINANT FACIES
FIGURE 72. Distribution of chemical facies for water in the Lower Cretaceous aquifer. Modified from K. D. Peter (written commun., 1982).
basis for Swenson's theory of recharge to the artesian basin of the Dakotas. Swenson suggested that water enters the Madison Limestone in the Black Hills area, moves generally eastward approximately two-thirds across the State of South Dakota, and discharges by vertical leakage to the Lower Cretaceous (Dakota) aquifer. Swenson's area of Madison dis charge to the Lower Cretaceous aquifer is shown in figure 68.
In the areas of significant leakage shown on plate 3 (the discharge areas), confining beds are thin or absent between the Madison aquifer and the overlying Lower Cretaceous aquifer. The Pennsylvanian aquifer is less than 200 ft thick
in this area (Swenson, 1968). Geochemical facies maps (figs. 69-72) indicate that water from the Pennsylvanian aquifer is similar to water in the underlying Madison aquifer and that vertical leakage is occurring between these two aquifers in this area. Swenson (1968) indicates that water from the Lower Cretaceous (Dakota) aquifer is similar to that in both the Madison and Pennsylvanian aquifers in the area of exten sive leakage (see pi. 3).
Except for flow volumes, results from model simulations indicate that Swenson's (1968) explanation that water in the Lower Cretaceous aquifer of South Dakota is partially due to upward leakage from the Madison aquifer is basically cor-

GEOHYDROLOGY OF BEDROCK AQUIFERS IN THE NORTHERN GREAT PLAINS E81
rect. Geochemical data (K. D. Peter, written commun., 1982; Swenson, 1968) also support the conclusion that water is leaking upward from the Madison and Pennsylvanian aqui fers to the Lower Cretaceous aquifer in eastern South Dako ta and North Dakota (figs. 70-72).
Geologic structure appears to be an important factor (Weimer and others, 1982) in the rate and direction of the flow in the study area. For example, the Casper Mountain fault (fig. 2) appears to prevent flow to the south from the Powder River basin, and the major fault system bounding the Bighorn Mountains on the northeast restricts recharge to the Powder River basin. Recharge from the Bighorn Mountains appears to be channeled by geologic structures associated with major lineaments and water flows northeastward (pi. 3A and B) across the northern part of the Powder River basin south of the Cedar Creek anticline, to join the flow from the Black Hills recharge area. This flow continues around the southern part of the Williston basin northeast ward to the discharge area in northeastern North Dakota and eastern Manitoba. The Weldon-Brockton fault zone (fig. 2) appears to be a major channel for water movement from the Big Snowy Mountains and associated highlands areas in Montana to discharge areas in Canada north of the Williston basin.
SUMMARY
Rocks of Paleozoic and Mesozoic age form at least five major aquifers that underlie the northern Great Plains. These aquifers crop out and are recharged in the highland areas in the eastern parts of Montana and Wyoming and in the Black Hills of South Dakota. From these recharge areas, water generally flows northeastward to the discharge areas in the Lake Agassiz basin, in northeastern North Dakota, and in the Canadian Provinces of Manitoba and southern Saskatch ewan. Water also is recharged or discharged by leakage from the aquifers to the adjoining units throughout the entire area; however, leakage increases at those locations where confining beds are traversed by major lineaments, or faults, or where confining beds are thin or absent.
Conceptually, the aquifer system considered in this study incorporates the Precambrian rocks as a no-flow, lower boundary. Rocks of Cambrian and Ordovician age are grouped into the lowermost major aquifer, the Cambrian- Ordovician aquifer, which is composed principally of the lime stone and dolomite of the Red River Formation. Rocks of Silurian and Devonian age, and the Mississippian part of the Bakken Formation, which overlie the Cambrian-Ordovician aquifer, are considered to be a confining layer. The second major aquifer, the Madison aquifer, consists of the Madison Limestone and the Lodgepole and Mission Canyon Forma tions of the Madison Group of Mississippian age. These for mations are composed mainly of limestone or dolomite but also contain minor anhydrite or gypsum beds.
The Madison aquifer is confined by rocks of Late Missis sippian age that consist of the Charles Formation of the Madison Group and formations of the Big Snowy Group and their equivalents. This confining unit contains bedded halites in the Williston basin that reduce the vertical hydraulic con ductivity significantly. This minimal vertical hydraulic con ductivity prevents upward leakage between the Madison aquifer and the overlying Pennsylvanian aquifer in the Willis ton basin.
The third major aquifer, the Pennsylvanian aquifer, is composed of sandstone and limestone of the Minnelusa For mation and its equivalents. This aquifer is limited in general to the western and central part of the study area. The Penn sylvanian aquifer is confined by rocks of Permian, Triassic, and Jurassic age. These rocks are composed of shale and siltstone of minimal vertical permeability that limit the flow of water from the three underlying Paleozoic aquifers to the overlying Lower and Upper Cretaceous aquifers.
Lying above the confining bed of the Pennsylvanian aquifer is a sequence of Lower Cretaceous sandstone and siltstone, which is termed the Lower Cretaceous aquifer. In parts of the study area, this aquifer is known as the Dakota aquifer or Inyan Kara aquifer. The Lower Cretaceous aquifer is the most developed aquifer in the northern Great Plains.
Over a large part of the area, the Lower Cretaceous aquifer is separated from the sandstones and siltstones of the Upper Cretaceous aquifer by up to 3,300 ft of shale and limestone of several Upper Cretaceous formations, such as the Niobrara Formation and the Pierre Shale. The upper boundary of the aquifer system considered in this study con sists of the Upper Cretaceous and Tertiary aquifer and that part of the confining bed at land surface.
Significant geologic structures are important in deter mining the rate and direction of flow in the aquifer system in the northern Great Plains. For example, the Casper fault in Wyoming appears to prevent flow to the south from the Powder River basin, and a major fault system bounding the Bighorn Mountains on the east restricts flow from the recharge area in the mountains to the Powder River basin. Recharge from the Bighorn Mountains appears to be chan neled by geologic structures associated with major linea ments or structural zones. Recharge flows northeastward across the northern part of the Powder River basin, south of the Cedar Creek anticline, to join the flow from the Black Hills recharge area. This flow continues around the southern part of the Williston basin northeastward to a discharge area in the Lake Agassiz basin of northeastern North Dakota and eastern Manitoba. The Weldon-Brockton fault zone in north eastern Montana appears to be a major channel for flow from the Big Snowy Mountains and associated highland areas in Montana to discharge areas in Canada north of the Williston basin.
Vertical leakage from the bedrock aquifers is a major factor in the discharge of water from the systems. Vertical

E82 REGIONAL AQUIFER-SYSTEM ANALYSIS
leakage occurs both through the pores in the confining beds and along fractures in the confining beds associated with major structural zones. Vertical leakage through confining beds is dependent on the thickness and permeability of the confining unit.
Water-quality and temperature data were used to ana lyze the flow in the Paleozoic aquifers. Dissolved-solids con centrations in water from the Paleozoic aquifers range from less than 1,000 mg/L to more than 300,000 mg/L, and temperature from about 80 °C to more than 150 °C. Water temperature has major effects on the viscosity of water and results in large changes in transmissivity.
The solution of halite and other minerals by water mov ing from the recharge areas toward the discharge area has resulted in the accumulation of high-density brine in the deeper parts of both the Powder River and Williston basins. Because of the nature of the flow system, the brine has been forced up the east limb of the Williston basin toward the eastern discharge area. The brine also causes the fresher water to be deflected both upward and north and south around the brine.
On the basis of available data, the brine appears to move very slowly eastward and northeastward toward the discharge areas in northeastern North Dakota and Manitoba and may be reestablishing the flow system that existed before the last glacial advance. Another effect of the appar ent slow brine movement toward the discharge areas is the decrease in formation permeability that results from precipi tation of various minerals, principally halite, from the water as it becomes cooler with decreasing depth.
Prior to Pleistocene glaciation, the flow system probably was similar to that which exists at present, with recharge in high areas to the west and discharge to the east and north east of the Williston basin. Glaciation caused repeated changes in recharge and discharge patterns, with corre sponding alterations in flow direction. However, the period of these changes, relative to the residence time of water in the deeper parts of the basin, probably was short, so that major changes in the distribution of the deep brines probably have not occurred.
GLOSSARY
Aquifer. A formation, group of formations, or a part of a formation that contains sufficient saturated permeable material to yield appreciable quantities of water to wells or springs.
Artesian well. A well in which the static water level is above the top of a confined aquifer; a flowing artesian well is a well in which the water level is above the land surface (see Confined ground water).
Confined ground water. Water in an aquifer that is bounded by confining beds and is under pressure significantly greater than atmospheric.
Confining bed. A body of relatively impermeable material adjacent to one or more aquifers; in nature, the hydraulic conductivity of a confining bed may range from about zero to some value distinctly less than that of the adjacent aquifer.
Gaining stream. A stream whose flow is being increased by the inflow of ground water from springs and upward seeps along its course.
Homogeneous. Identical properties everywhere in space.Hydraulic conductivity. The ease with which a fluid will pass through a
porous material; conductivity is determined by the size, shape, and degree of interconnection of pore spaces in a rock, as well as the viscosity of the fluid. This term replaces field coefficient of permeabili ty; it is expressed in feet per day or feet per second. Hydraulic conduc tivity also may be expressed in cubic feet per day per square foot or cubic meters per day per square meter. Hydraulic conductivity is mea sured at the prevailing water temperature.
Hydraulic or static head. The height above a standard datum at which the upper surface of a column of water can be supported by the static pressure at a given point (the term, which is a measure of potential, is expressed simply as head).
Losing stream. A stream that is losing water into the ground along its course.
Porosity. The ratio of volume of voids in a rock to the total volume; may be expressed as a decimal fraction or as a percentage. The term effective porosity refers to the amount of interconnected pore spaces or voids in a rock or soil and is expressed as a percentage of the total volume occupied by the interconnected pores.
Potentiometric surface. The surface that represents the hydraulic or static heads, such as a water table. It is defined as the level to which water will rise in tightly cased wells.
Specific capacity. The rate of discharge of water from a well divided by the drawdown of the water level, normally expressed as gallons per minute per foot of drawdown.
Storage coefficient. The volume of water an aquifer releases from or takes into storage per unit surface area of the aquifer per unit change in hydraulic head. In an artesian aquifer, the water derived from storage with decline in hydraulic head comes mainly from compression of the aquifer and, to a lesser extent, from expansion of the water. In an unconfined, or water-table aquifer, the water derived from the aquifer is from gravity drainage of the voids.
Transmissivity. The rate at which water, at the prevailing temperature and viscosity, is transmitted through a unit width of an aquifer under a unit hydraulic gradient. Transmissivity is normally expressed in units of square feet per day or square feet per second; it can be expressed as the number of cubic feet of water that will move during 1 day under a hydraulic gradient of 1 ft/ft through a vertical strip of aquifer with the full saturated height of an aquifer 1 ft wide.
SELECTED REFERENCES
Agatston, R. S., 1954, Pennsylvanian and Lower Permian of northern and eastern Wyoming: Bulletin of the American Association of Petroleum Geologists, v. 38, no. 4, p. 508-583.
Agnew, A. F., and Tychsen, P. C., 1965, A guide to the stratigraphy of South Dakota: South Dakota State Geological Survey Bulletin 14, 195 p.
Andrichuck, J. M., 1955, Mississippian Madison Group stratigraphy and sedimentation in Wyoming and southern Montana: Bulletin of the America Association of Petroleum Geologists, v. 39, no. 11, p. 2170-2210.
Anna, L. 0., 1984, Geologic framework of the ground-water flow system in Jurassic and Cretaceous rocks, northern Great Plains: U.S. Geological Survey Professional Paper 1402-B, 111 p.
Armstrong, C. A., 1980, Ground-water resources of Dickey and LaMoure Counties, North Dakota: Pt. Ill of North Dakota State Water Commis sion County Ground Water Studies, no. 28, 61 p.

GEOHYDROLOGY OF BEDROCK AQUIFERS IN THE NORTHERN GREAT PLAINS E83
Ballard, F. V., 1963, Structural and stratigraphic relationships in Paleozoic rocks of eastern North Dakota: North Dakota Geological Survey Bulle tin 40, 42 p.
Ballard, W. W., 1969, Red River of northwest Montana and northwest North Dakota: Montana Geological Society Annual Conference, 20th [Eastern Montana symposium], Billings, Mont., 1969, Proceedings, p. 15-24.
Balster, C. A., 1971, Stratigraphic correlations for Montana and adjacent areas: Montana Bureau of Mines and Geology Special Publication 51, 1 chart.
Barkley, R. C., 1953, Artesian conditions in the area surrounding the Sioux quartzite ridge: South Dakota State Geological Survey Report of Inves tigations 72, 68 p.
Bedinger, M. S., Reed, J. E., and Griffin, J. D., 1973, Digital-computer programs for analysis of ground-water flow: U.S. Geological Survey open-file report, 85 p.
Berry, F. A. F., and Hanshaw, B. B., 1960, Geologic field evidence sug gesting membrane properties of shales [abs.]: International Geological Congress, 21st, Copenhagen, 1960, Proceedings, p. 209.
Blankennagel, R. K., Howells, L. W., and Miller, W. R., 1981, Completion and testing of Madison Limestone test well 3, NW1/4SE1/4 sec. 35, T. 2 N., R. 27 E., Yellowstone County, Montana: U.S. Geological Survey Open-File Report 81-528, 91 p.
Blankennagel, R. K., Howells, L. W., Miller, W. R., and Hansen, C. V., 1979, Preliminary data for Madison Limestone test well 3, NW1/4SE1/4 sec. 35, T. 2 N., R. 27 E., Yellowstone County, Montana: U.S. Geological Survey Open-File Report 79-745, 201 p.
Blankennagel, R. K., Miller, W. R., Brown, D. L., and Gushing, E. M., 1977, Report on preliminary data for Madison Limestone test well 1, NE1/4SE1/4 sec. 15, T. 57 N., R. 65 W., Crook County, Wyoming: U.S. Geological Survey Open-File Report 77-164, 110 p.
Boggs, J. M., and Jenkins, A. M., 1980, Analysis of aquifer tests conducted at the proposed Burdock Uranium Mine Site, Burdock, South Dakota: Tennessee Valley Authority, Office of Natural Resources, Division of Water Resources, Water System Development Branch Report no. WR28-1-520-109, 73 p.
Brown, C. B., 1944, Report on an investigation of water losses in streams flowing east out of the Black Hills, South Dakota: U.S. Department of Agriculture Soil Conservation Service Special Report 8, 45 p.
Brown, D. L., 1978, Wrench-style deformational patterns associated with a meridional stress axis recognized in Paleozoic rocks in parts of Mon tana, South Dakota, and Wyoming: Montana Geological Society Annual Conference, 24th [Williston basin symposium], Billings, Mont, 1978, Guidebook, p. 17-31.
Brown, D. L., Blankennagel, R. K., Busby, J. F., and Lee, R. W., 1977, Preliminary data for Madison Limestone test well 2, SE1/4SE1/4 sec. 18, T. 1 N., R. 54 E., Custer County, Montana: U.S. Geological Survey Open-File Report 77-863, 135 p.
Brown, D. L., Blankennagel, R. K., MacCary, L. M., and Peterson, J. A., 1982, Correlation of paleostructure and sediment deposition in the Madison Limestone and associated rocks in parts of Montana, North Dakota, South Dakota, Wyoming, and Nebraska: U.S. Geological Sur vey Open-File Report 82-906, 80 p.
Busby, J. F., Lee, R. W., and Hanshaw, B. B., 1983, Major geochemical processes related to the hydrology of the Madison aquifer system and associated rocks in parts of Montana, South Dakota, and Wyoming: U.S. Geological Survey Water-Resources Investigations Report 83-4093, 180 p.
Carlson, C. G., and Anderson, S. B., 1960, Stratigraphy of the Winnipeg and Deadwood Formations in North Dakota: North Dakota Geological Sur vey Bulletin 35, 149 p.
____1965, Sedimentary and tectonic history of North Dakota part of Williston basin: Bulletin of the American Association of Petroleum Geologists, v. 49, no. 11, p. 1833-1846.
Carlson, C. G., Bakken, W. E., and Kume, J. B., 1960, Subsurface geology and development of petroleum in North Dakota: North Dakota Geologi cal Survey Bulletin 34, 20 p.
Carlson, C. G., and Eastwood, W. P., 1962, Upper Ordovician and Silurian rocks of North Dakota: North Dakota Geological Survey Bulletin 38, 52P-
Chapman, R. E., 1982, Effects of oil and gas accumulation on water move ment: Bulletin of the American Association of Petroleum Geologists, v. 66, no. 3, p. 368-374.
Chilingar, G. V., Mannon, R. W., and Rieke, H. H., Ill, 1972, Oil and gas production from carbonate rocks: New York, American Elsevier Pub lishing Co., 408 p.
Cole, L. H., 1915, The salt deposits of Canada and the salt industry: Canadi an Department of Energy, Mines and Resources, Mines Branch Report 325, 152 p.
Croft, M. G., 1971, A method of calculating permeability from electric logs, in Geological Survey research 1971: U.S. Geological Survey Profession al Paper 750-B, p. B265-B269.
Darcy, Henri, 1856, Les fontaines publiques de la ville de Dijon [The water supply of Dijon]: Paris, Victor Dalmont, 647 p.
Darton, N. H., 1896, Preliminary report on artesian waters of a portion of the Dakotas: Pt. II of U.S. Geological Survey 17th Annual Report, p. 603-694.
____1909, Geology and underground waters of South Dakota: U.S. Geo- logical Survey Water-Supply Paper 227, 156 p.
Davis, R. W., Dyer, C. F., and Powell, J. E., 1961, Progress report on wells penetrating artesian aquifers in South Dakota: U.S. Geological Survey Water-Supply Paper 1534, 100 p.
DeGraw, H. M., 1969, Subsurface relations of the Cretaceous and Tertiary: Nebraska Geological Survey open-file report, 137 p.
DeMille, G., Shouldice, J. R., and Nelson, H. W., 1964, Collapse structures related to evaporites of the Prairie Formation, Saskatchewan: Geologi cal Society of America Bulletin, v. 75, no. 4, p. 307-316.
DeWild, Grant, 1980, Groundwater investigations Worthing Well #1 South Lincoln rural water system: Sioux Falls, S. Dak., Reckert and Associ ates Co., 86 p.
Dinwiddie, G. A., and others, 1979, Plan of study for the northern Great Plains regional aquifer system analysis in parts of Montana, North Dakota, South Dakota, and Wyoming: U.S. Geological Survey Water- Resources Investigations 79-34, 24 p.
Downey, J. S., 1969, in Pederson, D. T., and Reid, J. R., eds., Geology of northeastern North Dakota: North Dakota Geological Survey Miscella neous Series 39, p. 12.
1971, Ground-water resources of Walsh County, northeastern North Dakota: U.S. Geological Survey Hydrologic Investigations Atlas HA-431, scale 1:126,720.
____1973, Ground-water resources, Nelson and Walsh Counties, North Dakota: Pt. Ill of North Dakota Geological Survey Bulletin 57 and Pt. Ill of North Dakota State Water Commission County Ground-Water Studies 17, 67 p.
____1982, Geohydrology of the Madison and associated aquifers in parts of Montana, North Dakota, South Dakota, and Wyoming: U.S. Geologi cal Survey Open-File Report 82-914, 120 p.
1984, Geohydrology of the Madison and associated aquifers in partsof Montana, North Dakota, South Dakota, and Wyoming: U.S. Geologi cal Survey Professional Paper 1273-G, p. G1-G47.
Downey, J. S., and Armstrong, C. A., 1977, Ground-water resources of Griggs and Steele Counties, North Dakota: Pt. Ill of North Dakota Geological Survey Bulletin 64 and Pt. Ill of North Dakota State Water Commission County Ground-Water Studies 21, 33 p.
Downey, J. S., and Paulson, Q. F., 1974, Predictive modeling of effects of the planned Kindred Lake on ground-water levels and discharge, south eastern North Dakota: U.S. Geological Survey Water-Resources Inves tigations 30-74, 22 p.

E84 REGIONAL AQUIFER-SYSTEM ANALYSIS
Downey, J. S., and Weiss, E. J., 1980, Preliminary data set for three- dimensional digital model of the Red River and Madison aquifers: U.S. Geological Survey Open-File Report 80-756, 8 p.
Dunham, R. J., 1961, Geology of uranium in the Chadron area, Nebraska and South Dakota: U.S. Geological Survey open-file report, 243 p.
Dyer, C. F., and Goehring, A. J., 1965, Artesian water supply of the Dakota Formation, southeastern South Dakota: U.S. Geological Survey open- file report, 49 p.
Earlougher, R. C., Jr., 1977, Advances in well test analysis: Dallas, Tex., Society of the Petroleum Engineers of the American Institute of Min ing, Metallurgical, and Petroleum Engineers Monograph, v. 5, 264 p.
Elson, J. A., 1967, Geology of Glacial Lake Agassiz, in Mayer-Oakes, W. J., ed., Life, land and water Conference on Environmental Studies of the Glacial Lake Agassiz Region, Winnipeg, 1966, Proceedings: Winnipeg, Manitoba, Canada, University of Manitoba Press, p. 37-96.
Erickson, H. D., 1954, Artesian conditions in east-central South Dakota: South Dakota State Geological Survey Report of Investigations 74, 116P-
____1955, Artesian conditions in northeastern South Dakota: South Da kota State Geological Survey Report of Investigations 77, 39 p.
Feltis, R. D., 1980a, Potentiometric surface map of water in the Madison Group, Montana: Montana Bureau of Mines and Geology Hydrogeologic Map 2, scale 1:1,000,000.
____1980b, Dissolved-solids and ratio maps of water in the Madison Group, Montana: Montana Bureau of Mines and Geology Hydrologic Map 3, scale 1:1,000,000, 3 sheets.
Flint, R. F., 1971, Glacial and Quaternary geology: New York, John Wiley, 892 p.
Foster, N. H., 1972, Ordovician system, in Geologic atlas of the Rocky Mountain region: Denver, Rocky Mountain Association of Geologists, p. 76-85.
Fuller, J. G. C. M., 1956, Mississippian rocks and oilfields in southeastern Saskatchewan: Province of Saskatchewan, Department of Mineral Re sources, 72 p.
____1961, Ordovician and contiguous formations in North Dakota, South Dakota, Montana, and adjoining areas in Canada and the United States: Bulletin of the American Association of Petroleum Geologists, v. 45, no. 8, p. 1334-1363.
Gott, G. B., Wolcott, D. E., and Bowles, C. G., 1974, Stratigraphy of the Inyan Kara Group and localization of uranium deposits, southern Black Hills, South Dakota and Wyoming: U.S. Geological Survey Professional Paper 763, 57 p.
Gow, A. J., Veda, H. T., and Garfield, D. E., 1968, Antarctic ice sheet Preliminary results of first core hole to bedrock: Science, v. 161, p. 1011-1013.
Cries, J. P., 1954, Cretaceous rocks of Williston basin: Bulletin of the American Association of Petroleum Geologists, v. 38, no. 4, p. 443-543.
Cries, J. P., Rahn, P. H., and Baker, R. K., 1976, A pump test in the Dakota Sandstone at Wall, South Dakota: South Dakota State Geological Sur vey Circular 43, 9 p.
Grossman, I. G., 1968, Origin of the sodium sulfate deposits of the northern Great Plains of Canada and the United States, in Geological Survey research 1968: U.S. Geological Survey Professional Paper 600-B, p. B104-B109.
Hamilton, L. J., 1982, Geology and water resources of McPherson, Ed munds, and Faulk Counties, South Dakota Pt. 2, Water resources: South Dakota State Geological Survey Bulletin 26, 60 p.
Hanshaw, B. B., Brown, D. L., Gushing, E. M., Konikow, L. F., and Peter- son, J. A., 1977, Hydrogeologic study of a regional carbonate-rock aquifer system: Congress of the International Association of Hydroge- ologists, 13th, Birmingham, England, 1977, Memoires Series, v. XIII, Pt. I, p. A24-A35.
Hanshaw, B. B., Busby, J. F., and Lee, R. W., 1978, Geochemical aspects of the Madison aquifer system: Montana Geological Society Annual Con ference, 24th [Williston basin symposium], Billings, Mont., 1978, Guidebook, p. 385-389.
Head, W. J., Kilty, K. T., and Knottek, R. K., 1979, Maps showing formation temperatures and configurations of the tops of the Minnelusa Forma tion and the Madison Limestone, Powder River basin, Wyoming, Mon tana, and adjacent areas: U.S. Geological Survey Miscellaneous Investi gations Map 1-1159.
Head, W. J., and Merkel, R. H., 1977, Hydrologic characteristics of the Madison Limestone, the Minnelusa Formation, and equivalent rocks as determined by well-logging formation evaluation, Wyoming, Montana, South Dakota, and North Dakota: U.S. Geological Survey Journal of Research, v. 5, no. 4, p. 473-485.
Hilchie, D. W., 1978, Applied openhole log interpretation (for geologists and engineers): Golden, Colo., Douglas W. Hilchie, Inc., p. 782-1445.
Hitchon, Brian, 1969, Fluid flow in the western Canada sedimentary ba sin 2, Effect of geology: Water Resources Research, v. 5, no. 2, p. 469-480.
Hoda, Badrul, 1977, Feasibility of subsurface waste disposal in the Newcas tle Formation, Lower Dakota Group (CRET) and Minnelusa Formation (PENN) western North Dakota: Detroit, Mien., Wayne State Universi ty, unpublished M.S. thesis, 79 p.
Hodson, W. G., 1974, Records of water wells, springs, oil- and gas-test holes, and chemical analyses of water for the Madison Limestone and equivalent rocks in the Powder River basin and adjacent areas, north eastern Wyoming: Wyoming State Engineer Report, 27 p.
Hopkins, W. B., 1978, Deep aquifers of eastern Montana: Montana Geologi cal Society Annual Conference, 24th [Williston basin symposium], Bill ings, Mont, 1978, Guidebook, p. 392-407.
Howells, L. W., 1974 [1976] Geohydrology of Crow Creek and Lower Brule Indian Reservations, South Dakota: U.S. Geological Survey Hydrologic Investigations Atlas HA-499, scales 1:125,000 and 1:250,000, 2 sheets.
____1979, Geohydrology of the Cheyenne River Indian Reservation, South Dakota: U.S. Geological Survey Hydrologic Investigations Atlas HA-585, scales 1:250,000 and 1:500,000, 3 sheets.
1982, Geohydrology of the Standing Rock Indian Reservation, Northand South Dakota: U.S. Geological Survey Hydrologic InvestigationsAtlas HA-644, scales 1:250,000 and 1:500,000, 5 sheets.
Howells, L. W., and Stevens, J. C., 1968, Geology and water resources ofBeadle County, South Dakota Pt. 2, Water resources: South DakotaState Geological Survey Bulletin 18, 65 p.
Hubbert, M. K., 1969, The theory of ground-water motion and relatedpapers: New York, Hafner Publishing Co., 310 p.
Imlay, R. W., 1980, Jurassic paleobiogeography of the conterminous UnitedStates in its continental setting: U.S. Geological Survey ProfessionalPaper 1062, 134 p.
Irwin, M. L., 1965, General theory of epeiric clear water sedimentation:Bulletin of the American Association of Petroleum Geologists, v. 49, no.4, p. 445-459.
Jennings, T. V., 1967, Structural analysis of the northern Bighorn Moun tains, Wyoming: Iowa City, Iowa, University of Iowa, unpublishedPh.D. dissertation, 224 p.
Kanasewich, E. R., 1968, Precambrian rift Genesis of strata-bound oredeposits: Science, v. 161, p. 1002-1005.
Keefer, W. R., 1970, Structural geology of the Wind River basin, Wyoming:U.S. Geological Survey Professional Paper 495-D, p. D1-D35.
Keefer, W. R., and Van Lieu, J. A., 1966, Paleozoic formations in the WindRiver basin, Wyoming: U.S. Geological Survey Professional Paper495-B, p. B1-B60.
Keene, J. R., 1973, Ground-water resources of the western half of Fall RiverCounty, South Dakota: South Dakota State Geological Survey Reportof Investigations 109, 82 p.
Koch, N. C., 1970, Geology and water resources of Campbell County, SouthDakota Pt. 2, Water resources: South Dakota State Geological SurveyBulletin 20, 38 p.
____1975, Geology and water resources of Marshall County, South Dako ta Pt. 2, Water resources: South Dakota State Geological SurveyBulletin 23, 76 p.

GEOHYDROLOGY OF BEDROCK AQUIFERS IN THE NORTHERN GREAT PLAINS E85
____1980, Geology and water resources of Hand and Hyde Counties,South Dakota Pt. 2, Water resources: South Dakota State GeologicalSurvey Bulletin 28, 46 p.
Koch, N. C., and Bradford, Wendall, 1976, Geology and water resources ofBrown County, South Dakota Pt. 2, Water resources: South DakotaState Geological Survey Bulletin 25, 53 p.
Konikow, L. F., 1976, Preliminary digital model of ground-water flow in theMadison Group, Powder River basin and adjacent areas, Wyoming,Montana, South Dakota, North Dakota, and Nebraska: U.S. GeologicalSurvey Water-Resources Investigations 63-75, 44 p.
____1978, Hydrogeologic considerations for an interstate ground-watercompact on the Madison aquifer, northern Great Plains: U.S. GeologicalSurvey Open-File Report 78-138, 15 p.
Kososki, B. A., and Robbins, S. L., 1979, In situ bulk density and porosityestimates from borehole gravity data for the Madison Group test well.no. 1 in Crook County, Wyoming: U.S. Geological Survey Open-FileReport 79-1514, 15 p.
Laird, W. M., 1944, The geology and ground-water resources of the Emer-ado quadrangle: North Dakota Geological Survey Bulletin 17, 35 p.
Landes, K. K, 1970, Petroleum geology of the United States: New York,John Wiley, 571 p.
Lobmeyer, D. H., 1980, Preliminary potentiometric-surface map showingfreshwater heads for the Lower Cretaceous rocks in the northern GreatPlains of Montana, North Dakota, South Dakota, and Wyoming: U.SGeological Survey Open-File Report 80-757, scale 1:1,000,000.
Lobmeyer, D. H., Anna, L. 0., and Busby, J. F., 1982, Preliminary data fornorthern Great Plains test well 1, NW1/4NE1/4 sec. 11, T. 55 N., R. 77W., Sheridan County, Wyoming: U.S. Geological Survey Open-File Re port 82-446, 80 p.
Lohman, S. W., 1972, Ground-water hydraulics: U.S. Geological SurveyProfessional Paper 708, 70 p. [reprinted 1979].
Lohman, S. W., and others, 1972, Definitions of selected ground-waterterms Revisions and conceptual refinements: U.S. Geological SurveyWater-Supply Paper 1988, 21 p.
Lowry, M. E., 1981, The relative importance of regional and local ground- water systems in the Powder River structural basin, Wyoming and Montana [abs.]: Annual Rocky Mountain Groundwater Conference, 10th, Laramie, Wyo., 1981, Proceedings, p. 71.
MacCary, L. M., 1981, Apparent water resistivity, porosity, and ground- water temperature of the Madison Limestone and underlying rocks in parts of Montana, Nebraska, North Dakota, South Dakota, and Wyo ming: U.S. Geological Survey Open-File Report 81-629, 43 p.
MacCary, L. M., Gushing, E. M., and Brown, D. L., 1983, Potentially favorable areas for large-yield wells in the Red River Formation and Madison Limestone in parts of Montana, North Dakota, South Dakota, and Wyoming: U.S. Geological Survey Professional Paper 1273-E, p. E1-E13.
McCabe, H. R., 1963, Mississippian oil fields of southwestern Manitoba: Manitoba Department of Mines and Natural Resources Mines Branch Publication 60-5, 50 p.
McGinnis, L. D., 1968, Glaciation as a possible cause of mineral deposition: Economic Geology, v. 63, p. 390-400.
Maier, L. F., and Ripley, H. E., 1967, Formation evaluation by drill stem testing: Ontario Petroleum Institute Conference, 6th, London, Ontario, 1967, Proceedings, 32 p.
Maughan, E. K., 1966, Environment of deposition of Permian salt in Willis- ton and Alliance basins, in Rau, J. L., ed., Symposium on Salt, Geology, Geochemistry, Mining, 2d, Cleveland, Ohio, 1966, Proceedings: Cleve land, Ohio, Northern Ohio Geological Society, v. 1, p. 35-47.
____1967, Eastern Wyoming, eastern Montana, and the Dakotas, chap. G in McKee, E. D., Oriel, S. S., and others, Paleotectonic investigations of the Permian system in the United States: U.S. Geological Survey Pro fessional Paper 515, p. G125-G152.
Meinzer, 0. E., 1929, Problems of the soft-water supply of the Dakota sandstone, with special reference to the conditions at Canton, South
Dakota: U.S. Geological Survey Water-Supply Paper 597-C, p. C147-C170.
Meyboom, Peter, 1966, Groundwater studies in the Assiniboine River drain age basin: Geological Survey of Canada Bulletin 139, 65 p.
Meyer, R. R., 1963, A chart relating well diameter, specific capacity, and coefficients of transmissibility and storage, in; Bentall, Ray, compiler, Methods of determining permeability, transmissibility and drawdown: U.S. Geological Survey Water-Supply Paper 1536-1, p. 338-340.
Miller, D. N., Jr., 1966, Diagenesis of sedimentary rocks: Wyoming Geologi cal Association Annual Conference, 12th [Symposium on recently de veloped geologic principles and sedimentation of the Permo-Penn- sylvanian of the Rocky Mountains], Casper, Wyo., 1966, Proceedings, p. 17-21.
Miller, R. H., and Rahn, P. H., 1974, Recharge to the Dakota Sandstone from outcrops in the Black Hills, South Dakota: Bulletin of the Associa tion of Engineering Geologists, v. 11, no. 3, p. 221-234.
Miller, W. R., 1976, Water in carbonate rocks of the Madison Group in southeastern Montana A preliminary evaluation: U.S. Geological Sur vey Water-Supply Paper 2043, 51 p.
Miller, W. R., and Strausz, S. A., 1980a, Preliminary map showing fresh water heads for the Red River Formation, Bighorn Dolomite, and equivalent rocks of Ordovician age in the northern Great Plains of Montana, North Dakota, South Dakota, and Wyoming: U.S. Geological Survey Open-File Report 80-730, scale 1:1,000,000.
____1980b, Preliminary map showing freshwater heads for the Mission Canyon and Lodgepole Limestones and equivalent rocks of Mississippi an age in the northern Great Plains of Montana, North Dakota, South Dakota, and Wyoming: U.S. Geological Survey Open-File Report 80-729, scale 1:1,000,000.
Milly, C. D., 1978, Mathematical models of groundwater flow and sulphate transport in the major aquifers of South Dakota: Princeton, N.J., Princeton University, unpublished M.S. thesis, 46 p.
Murphy, W. C., 1965, The interpretation and calculation of formation char acteristics from formation test data: Duncan, Okla., Halliburton Serv ices Division of Halliburton Co., 19 p.
Neuzil, C. E., 1980, Fracture leakage in the Cretaceous Pierre Shale and its significance for underground waste disposal: Baltimore, Md., Johns Hopkins University, unpublished Ph.D. dissertation, 150 p.
Nordquist, J. W., 1953, Mississippian stratigraphy of northern Montana: Billings Geological Society Annual Field Conference, 4th, 1953, Guide book, p. 68-82.
Olsen, H. W., 1969, Simultaneous fluxes of liquid and charge in saturated kaolinite: Soil Science Society of America Proceedings, v. 33, no. 3, p. 338-344.
Patterson, J. R., 1961, Ordovician stratigraphy and correlations in North America: Bulletin of the American Association of Petroleum Geologists, v. 45, no. 6, p. 1364-1377.
Peter, K. D., in press, Hydrochemistry of Lower Cretaceous sandstone aqui fers, northern Great Plains: National Water Well Association Dakota Symposium, 1st, Lincoln, Nebr., 1982, Proceedings.
Peterson, J. A., 1957, Marine Jurassic of the northern Rocky Mountains and Williston basin: Bulletin of the American Association of Petroleum Geologists, v. 41, no. 3, p. 399-440.
____1966, Sedimentary history of the Sweetgrass arch: Billings Geologi cal Society Annual Field Conference, 17th, 1966, Guidebook, p. 112-133.
____1972, Jurassic system, in Geologic atlas of the Rocky Mountain region: Denver, Rocky Mountain Association of Geologists, p. 177-189.
____1978, Subsurface geology and porosity distribution, Madison Lime stone and underlying formations, Powder River basin, northeastern Wyoming and southeastern Montana and adjacent areas: U.S. Geologi cal Survey Open-File Report 78-783, 32 p.
____1981, Stratigraphy and sedimentary facies of the Madison Limestone and associated rocks in parts of Montana, North Dakota, South Dakota, Wyoming, and Nebraska: U.S. Geological Survey Open-File Report 81-642, 92 p.

E86 REGIONAL AQUIFER-SYSTEM ANALYSIS
Finder, G. F., and Bredehoeft, J. D., 1968, Application of digital computer for aquifer evaluation: Water Resources Research, v. 4, no. 5, p. 1069-1093.
Porter, J. W., and Fuller, J. G. C. M., 1964, Ordovician-Silurian, in Geologi cal history of western Canada: Calgary, Alberta, Canada, Alberta Soci ety of Petroleum Geologists, p. 34-42.
Potter, R. W., II, and Brown, D. L., 1977, The volumetric properties of aqueous sodium chloride solutions from 0° to 500° C at pressures up to 2000 bars based on a regression of available data in the literature: U.S. Geological Survey Bulletin 1421-C, 36 p.
Powell, B. F., 1940, Construction history and technical details of Sheridan Dam: Black Hills Engineer, v. 26, p. 180-196.
Rahn, P. H., and Cries, J. P., 1973, Large springs in the Black Hills, South Dakota and Wyoming: South Dakota State Geological Survey Report of Investigations 107, 46 p.
Redden, J. A., and Norton, J. J., 1975, Precambrian geology of the Black Hills, in Mineral and water resources of South Dakota: U.S. 94th Congress, 1st session, Senate Committee on Interior and Insular Af fairs Report, p. 21-28.
Rice, D. D., 1976 [1977], Correlation chart of Cretaceous and Paleocene rocks of the northern Great Plains: U.S. Geological Survey Oil and Gas Investigations Chart OC-70.
Robin, G. de Q., 1955, The movement and temperature distribution on glaciers and ice sheets: Journal of Glaciology, v. 2, p. 523-532.
Rocky Mountain Association of Geologists, 1972, Geological atlas of the Rocky Mountain region: Denver, A. B. Hirschfeld Press, 331 p.
Roehl, P. 0., 1967, Stony Mountain (Ordovician) and Interlake (Silurian) facies analogs of recent low-energy marine and subaerial carbonates, Bahamas: Bulletin of American Association of Petroleum Geologists, v. 51, no. 10, p. 1979-2032.
Rose, P. R., 1976, Mississippian carbonate shelf margins, western United States: U.S. Geological Survey Journal of Research, v. 4, no. 4, p. 449-466.
Rothrock, E. P., 1949, Structures south of the Black Hills: South Dakota State Geological Survey Report of Investigations 62, 52 p.
Rothrock, E. P., and Robinson, T. W., Jr., 1936, Artesian conditions in west- central South Dakota: South Dakota State Geological Survey Report of Investigations 26, 93 p.
Russell, W. L., 1928, The origin of artesian pressure: Economic Geology, v. 23, no. 2, p. 132-157.
Sales, J. K., 1968, Crustal mechanics of Cordilleran foreland deforma tion A regional and scale-model approach: Bulletin of the American Association of Petroleum Geologists, v. 52, no. 10, p. 2016-2044.
Sandberg, C. A., 1961 [1962], Distribution and thickness of Devonian rocks in Williston basin and in central Montana and north-central Wyoming: U.S. Geological Survey Bulletin 1112-D, p. 105-127.
____1962, Geology of the Williston basin, North Dakota, Montana, and South Dakota, with reference to subsurface disposal of radioactive wastes: U.S. Geological Survey Open-File Report TEI-809, 148 p.
Sandberg, C. A., and Hammond, C. R., 1958, Devonian system in Williston basin and central Montana: Bulletin of the American Association of Petroleum Geologists, v. 42, no. 10, p. 2293-2334.
Sandberg, C. A., and Poole, F. G., 1977, Conodont biostratigraphy and depositional complexes of Upper Devonian cratonic-platform and conti nental shelf rocks in the western United States, in Murphy, M. A., Berry, W. B. N., and Sandberg, C. A., eds., Western North America Devonian: University of California at Riverside Campus, Mu seum Contributions 4, p. 144-182.
Sando, W. J., 1974, Ancient solution phenomena in the Madison Limestone (Mississippian) of north-central Wyoming: U.S. Geological Survey Jour nal of Research, v. 2, no. 2, p. 133-141.
____1976a, Madison Limestone, east flank of Bighorn Mountains, Wyo ming: Wyoming Geological Association Annual Field Conference, 28th, 1976, Guidebook, p. 45-52.
____1976b, Mississippian history of the northern Rocky Mountain region:
Sando, W. J., Dutro, J. T., Jr., Sandberg, C. A., and Mamet, B. L., 1976, Revision of Mississippian stratigraphy, eastern Idaho and northeastern Utah: U.S. Geological Survey Journal of Research, v. 4, no. 4, p. 467-479.
Sando, W. J., Gordon, MacKenzie, Jr., and Dutro, J. T., Jr., 1975 [1976], Stratigraphy and geologic history of the Amsden Formation (Mississip pian and Pennsylvanian) of Wyoming: U.S. Geological Survey Profes sional Paper 848-A, p. A1-A83.
Schoon, R. A., 1971, Geology and hydrology of the Dakota Formation in South Dakota: South Dakota State Geological Survey Report of Investi gations 104, 55 p.
Shepard, J. H., 1895, The artesian waters of South Dakota: South Dakota Agriculture College and Experiment Station Bulletin 41, 76 p.
Slack, P. B., 1981, Paleotectonics and hydrocarbon accumulation, Powder River basin, Wyoming: Bulletin of the American Association of Petrole um Geologists, v. 65, no. 4, p. 730-743.
Smith, D. L., 1972, Depositional cycles of the Lodgepole Formation (Missis sippian) in central Montana: Montana Geological Society Annual Field Conference, 21st, 1972, Guidebook, p. 27-36.
Sonnenberg, F. P., 1956, Tectonic patterns of central Montana: Billings Geological Society Annual Field Conference, 7th, 1956, Guidebook, p. 73-81.
Steece, F. V., 1961, Preliminary map of the Precambrian surface of South Dakota: South Dakota State Geological Survey Mineral Resources In vestigations Map 2, scale 1 inch = 17 miles.
____1975, Structural geology outside of the Black Hills, in Mineral and water resources of South Dakota: U.S. 94th Congress, 1st session, Senate Committee on Interior and Insular Affairs Report, p. 50-53.
1978, Deadwood Formation in the Williston basin: Montana Geological Society Annual Conference, 24th [Williston basin symposium], Bill ings, Mont, 1978, Guidebook, p. 63-69.
Steece, F. V., and Howells, L. W., 1965, Geology and ground water supplies in Sanborn County, South Dakota: South Dakota State Geological Soci ety Bulletin 17, 182 p.
Stenzel, Sheila, Buss, Rebecca, and Busby, J. F., 1980, Maps showing dissolved-solids concentration of waters in the Red River Formation and Mission Canyon Limestone in North Dakota, South Dakota, and parts of Wyoming and Montana: U.S. Geological Survey Open-File Report 80-748, scale 1:1,000,000, 2 sheets.
Sterns, D. W., Sacrison, W. R., and Hanson, R. C., 1975, Structural history of southwestern Wyoming as evidenced from outcrop and seismic: Rocky Mountain Association of Geologists Symposium on Deep Drilling Frontiers in the Central Rocky Mountains, Steamboat Springs, Colo., 1975, Proceedings, p. 9-50.
Stone, D. S., 1969, Wrench faulting and Rocky Mountain tectonics: Wyo ming Geological Association Earth Science Bulletin, v. 2, no. 2, p. 27-41.
1970. Principal horizontal stress in the central Rocky Mountains versus California: The Mountain Geologist, v. 7, no. 2, p. 69-82.
1971. Tectonic sketch map of the central Rocky Mountains: Wyo-
U.S. Geological Survey Journal of Research, v. 4, no. 3, p. 317-338.
ming Geological Association Annual Field Conference, 23d, 1971, Guidebook, scale 1 inch = 30 miles.
Stone, H. K., 1968, Iterative solution of implicit approximations of mul tidimensional partial differential equations: Society for Industrial and Applied Mathematics Journal of Numerical Analysis, v. 5, no. 3, p. 530-558.
Swenson, F. A., 1968, New theory of recharge in the artesian basin of the Dakotas: Geological Society of America Bulletin, v. 79, no. 1, p. 163-182.
Swenson, F. A., Miller, W. R., Hodson, W. G., and Visher, F. N., 1976, Map showing the configuration and thickness and potentiometric surface and water quality in the Madison Group, Powder River basin, Wyoming and Montana: U.S. Geological Survey Miscellaneous Investigations Se ries I-847-C, scale 1:1,000,000, 2 sheets.
Thorn, W. T., Jr., 1923, The relation of deep-seated faults to the surface structural features of central Montana: Bulletin of the American Asso ciation of Petroleum Geologists, v. 7, no. 1, p. 1-13.

GEOHYDROLOGY OF BEDROCK AQUIFERS IN THE NORTHERN GREAT PLAINS E87
Thomas, G. E., 1971, Continental plate tectonics, southwest Wyoming, in Renfro, A. R., ed., Symposium on Wyoming tectonics and their econom ic significance, Casper, Wyo., 1971, Guidebook: Casper, Wyo., Wyo ming Geological Association, p. 103-123.
____1974, Lineament-block tectonics Williston-Blood Creek basin: Bul letin of the American Association of Petroleum Geologists, v. 58, no. 7, p. 1305-1322.
Todd, J. E., and Hall, C. M., 1904, Geology and water resources of part of the lower James River valley, South Dakota: U.S. Geological Survey Water-Supply Paper 90, 47 p.
Trescott, P. C., 1975, Documentation of finite-difference model for simula tion of three-dimensional ground-water flow: U.S. Geological Survey Open-File Report 75-438, 30 p.
Trescott, P. C., and Larson, S. P., 1976, Supplement to U.S. Geological Survey Open-File Report 75-438, documentation of finite-difference model for simulation of three-dimensional ground-water flow: U.S. Ge ological Survey Open-File Report 76-591, 17 p.
U.S. Geological Survey, 1975, Plan of study of the hydrology of the Madison Limestone and associated rocks in parts of Montana, Nebraska, North Dakota, South Dakota, and Wyoming: U.S. Geological Survey Open- File Report 75-631, 44 p.
van Everdingen, R. 0., 1968, Studies of formation waters in western Cana da Geochemistry and hydrodynamics: Canadian Journal of Earth Sci ences, v. 5, p. 523-543.
Waage, K. M., 1959, Stratigraphy of the Inyan Kara Group in the Black Hills: U.S. Geological Survey Bulletin 1081-B, p. 11-90.
Warner, L. A., 1978, The Colorado lineament A middle Precambrian wrench fault system: Geological Society of America Bulletin, v. 89, no. 2, p 161-171.
Weertman, Johannes, 1972, General theory of water flow at the base of a glacier or ice sheet: Reviews of Geophysics and Space Physics, v. 10, no. 1, p. 287-333.
Weimer, R. J., Emme, J. J., Farmer, C. L., Anna, L. 0., Davis, T. L., and Kidney, R. L, 1982, Tectonic influences of sedimentation, Early Creta ceous, east flank Powder River basin, Wyoming and South Dakota: Colorado School of Mines Quarterly, v. 77, no. 4, 61 p.
Weiss, Emanuel, 1982, A model for the simulation of flow of variable- density ground water in three dimensions under steady-state condi tions: U.S. Geological Survey Open-File Report 82-352, 70 p.
Wyoming State Engineer's Office, 1974, Underground water supply in the Madison Limestone: Cheyenne, Wyo., 117 p.
____1976, Investigation of recharge to groundwater reservoirs of north eastern Wyoming (the Powder River basin): Washington, D.C., Old West Regional Commission, 111 p.