Hydrological and hydraulic modelling of the Nyl River ...
12
Available on website http://www.wrc.org.za ISSN 0378-4738 = Water SA Vol. 33 No. 1 January 2007 ISSN 1816-7950 = Water SA (on-line) 9 Hydrological and hydraulic modelling of the Nyl River floodplain Part 2: Modelling hydraulic behaviour AL Birkhead 1 *, CS James 2 and MT Kleynhans 2 1 Streamflow Solutions cc, East London, South Africa 2 Centre for Water in the Environment, School of Civil & Environmental Engineering, University of the Witwatersrand, Johannesburg, South Africa Abstract Catchment land-use and water resource developments may threaten the ecological integrity of the Nyl River floodplain, a world-renowned conservation area. The effect of developments on the water supply regime to the floodplain can be pre- dicted by hydrological modelling, but assessing their ecological consequences requires transformation of discharge into eco- logically-relevant hydraulic characteristics. Studies of Wild Rice (Oryza longistaminata) have indicated that the important variables are the extent, depth, duration and timing of flood inundations. One-dimensional hydraulic modelling has been successfully applied to predict these flood characteristics, using a suite of models comprising Quicksurf, RiverCAD, HEC- RAS and HEC-DSSVue. Separate but linked models were developed for three contiguous portions of the large floodplain. The topography was surveyed by airborne laser mapping, and extensive discharge, water level, rainfall, infiltration and eva- potranspiration data were collected for model calibration and verification. The models were successfully calibrated through adjustment of Manning’s n for the main channel and floodplain in each portion, and are able to predict flooding characteristics at a resolution appropriate for ecological interpretation. Keywords: Nyl River floodplain, Nylsvlei, Nylsvley Nature Reserve, modelling wetland hydraulics, wetland evapotranspiration, floodplain water balance, LIDAR. Introduction The Nyl River is situated in the Limpopo Province of South Africa and represents the southernmost tributary of the Mogalakwena River. Along its course, the Nyl River passes through the Nyl River floodplain, known as ‘Nylsvlei’ (Fig. 1), flanked to the north and west by the Waterberg Mountains, and to the south and east by the Springbok Flats (Fig. 2). The flood- plain is a unique and highly biologically productive ecological system (Higgins et al., 1996). Because of its large size and the variety of wildlife it supports, including several Red Data bird species, the area is recognised internationally as an important wetland. The ecological status of the floodplain is under threat from increasing water resource developments in the upstream catch- ments, which affect the amount and timing of water delivered to the floodplain. To assist with future water resources planning, the Department of Water Affairs and Forestry (DWAF) commis- sioned this study in 1996 to develop models for predicting the impacts of upstream development on the flooding regime of the floodplain. The Hadejia-Nguru wetlands in northern Nigeria were modelled by Thompson and Hollis (1995) using a water balance to predict the effects of upstream dam developments on inun- dation. A hydrological monthly mass-balance was calibrated using flood extents and applied to determine the economic impact of the dam construction on wetland productivity. Dincer et al. (1987) also used a water balance at a monthly time-scale to predict water depths, inundation areas and outflows from the Okavango Delta in Botswana. The cell-based model was cali- brated using observed water levels and used to predict changes in inundated areas and outflows due to changes in inflows and channels of the delta. In the Nylsvlei study, temporal and spatial modelling scales were determined by the nature of the ecological inter- pretations required from the output, as defined in the next sec- tion: ’Model scale and resolution‘. Modelling was carried out in two stages. First, hydrological models were used to predict the supply regime to the floodplain (accounting for the effects of land use and water exploitation in the catchments), and then this was transformed into flooding characteristics by hydraulic Figure 1 Photograph of the upper floodplain (between Middelfontein and the Nylsvley Nature Reserve) looking downstream, with the Deelkraal gauge (A6H002) in the distance (Photo: K Rogers, WITS University) * To whom all correspondence should be addressed. +27 (82) 853-5779; fax: +27 43 740-5313; e-mail: streamfl[email protected] Received 16 May 2006; accepted in revised form 22 November 2006.
Transcript of Hydrological and hydraulic modelling of the Nyl River ...
Available on website http://www.wrc.org.zaISSN 0378-4738 = Water SA Vol. 33 No. 1 January 2007ISSN 1816-7950 = Water SA (on-line)
9
Hydrological and hydraulic modelling of the Nyl River floodplainPart 2: Modelling hydraulic behaviour
AL Birkhead1*, CS James2 and MT Kleynhans2
1Streamflow Solutions cc, East London, South Africa2Centre for Water in the Environment, School of Civil & Environmental Engineering, University of the Witwatersrand,
Johannesburg, South Africa
Abstract
Catchment land-use and water resource developments may threaten the ecological integrity of the Nyl River floodplain, a world-renowned conservation area. The effect of developments on the water supply regime to the floodplain can be pre-dicted by hydrological modelling, but assessing their ecological consequences requires transformation of discharge into eco-logically-relevant hydraulic characteristics. Studies of Wild Rice (Oryza longistaminata) have indicated that the important variables are the extent, depth, duration and timing of flood inundations. One-dimensional hydraulic modelling has been successfully applied to predict these flood characteristics, using a suite of models comprising Quicksurf, RiverCAD, HEC-RAS and HEC-DSSVue. Separate but linked models were developed for three contiguous portions of the large floodplain. The topography was surveyed by airborne laser mapping, and extensive discharge, water level, rainfall, infiltration and eva-potranspiration data were collected for model calibration and verification. The models were successfully calibrated through adjustment of Manning’s n for the main channel and floodplain in each portion, and are able to predict flooding characteristics at a resolution appropriate for ecological interpretation.
Keywords: Nyl River floodplain, Nylsvlei, Nylsvley Nature Reserve, modelling wetland hydraulics, wetland evapotranspiration, floodplain water balance, LIDAR.
Introduction
The Nyl River is situated in the Limpopo Province of South Africa and represents the southernmost tributary of the Mogalakwena River. Along its course, the Nyl River passes through the Nyl River floodplain, known as ‘Nylsvlei’ (Fig. 1), flanked to the north and west by the Waterberg Mountains, and to the south and east by the Springbok Flats (Fig. 2). The flood-plain is a unique and highly biologically productive ecological system (Higgins et al., 1996). Because of its large size and the variety of wildlife it supports, including several Red Data bird species, the area is recognised internationally as an important wetland. The ecological status of the floodplain is under threat from increasing water resource developments in the upstream catch-ments, which affect the amount and timing of water delivered to the floodplain. To assist with future water resources planning, the Department of Water Affairs and Forestry (DWAF) commis-sioned this study in 1996 to develop models for predicting the impacts of upstream development on the flooding regime of the floodplain. The Hadejia-Nguru wetlands in northern Nigeria were modelled by Thompson and Hollis (1995) using a water balance to predict the effects of upstream dam developments on inun-dation. A hydrological monthly mass-balance was calibrated using flood extents and applied to determine the economic impact of the dam construction on wetland productivity. Dincer et al. (1987) also used a water balance at a monthly time-scale
to predict water depths, inundation areas and outflows from the Okavango Delta in Botswana. The cell-based model was cali-brated using observed water levels and used to predict changes in inundated areas and outflows due to changes in inflows and channels of the delta. In the Nylsvlei study, temporal and spatial modelling scales were determined by the nature of the ecological inter-pretations required from the output, as defined in the next sec-tion: ’Model scale and resolution‘. Modelling was carried out in two stages. First, hydrological models were used to predict the supply regime to the floodplain (accounting for the effects of land use and water exploitation in the catchments), and then this was transformed into flooding characteristics by hydraulic
Figure 1Photograph of the upper floodplain (between Middelfontein and
the Nylsvley Nature Reserve) looking downstream, with the Deelkraal gauge (A6H002) in the distance (Photo: K Rogers,
WITS University)
* To whom all correspondence should be addressed. +27 (82) 853-5779; fax: +27 43 740-5313; e-mail: [email protected] Received 16 May 2006; accepted in revised form 22 November 2006.

10 Available on website http://www.wrc.org.zaISSN 0378-4738 = Water SA Vol. 33 No. 1 January 2007
ISSN 1816-7950 = Water SA (on-line)
modelling. The hydrological modelling is described in Part 1 (Havenga et al., 2007) of this paper in 3 parts. This paper describes the development of a computational model for simulating the hydraulic behaviour of the flood-plain. The input to the model is provided by output from the hydrological models as discharge time series at differ-ent floodplain entry points. The hydraulic model output is a corresponding set of time series of stage, discharge and inundation areas for the floodplain, including their spatial dis-tributions along its length. This information is provided at appropriate scales for determining ecological impacts associ-ated with an altered flow regime. In this study, attention is focused on floodplain vegetation as an indicator of ecologi-cal impact because the response of a key species (Wild Rice, Oryza longistaminata) to the occurrence of water has been well described (Marneweck, 1988). Scenario applications of the hydrological and hydraulic models to describe impacts of development on the habitat requirements of Wild Rice are pre-sented in Part 3 of this paper by Kleynhans et al. (2007).
Model scale and resolution
Appropriate modelling scale and resolution are determined by the nature of the interpretations to be made from the out-put. Because Wild Rice is used as the ecological indicator, its characteristics define the model requirements. Vegetation along the Nyl River floodplain is differentially distributed along three spatial directions: laterally away from the channel, vertically above the channel, and downstream along the channel (Hig-gins et al., 1997). Flooding frequency, duration and depth all decrease in these directions, especially the last two, and plant species distribution is a manifestation of species tolerance to
flooding and drought fluctuations. Modelling of flooding fre-quency, depth and duration, with respect to these three spatial directions at appropriate spatial and temporal scales provides the data required to link Wild Rice response to changes in the flooding regime. Specification of appropriate scales for hydrau-lic modelling was derived from three key findings from research undertaken at the Nature Reserve, known as “Nylsvley”:• At a broad scale, three vegetation communities on the flood-
plain can be recognised along the vertical axis: the sub-merged and floating leaved aquatic species in the channel, the Wild Rice (Oryza longistaminata) community at mid-elevations, and the Rooigras (Themeda triandra) zone at the highest elevations (Higgins et al., 1997). The elevation dif-ference between these communities is 0.5 to 1.0 m.
• A statistically significant change in plant species composi-tion along a transect can be detected for a 90 mm change in elevation, indicating that this amount of change in water depth during flooding and associated water deficit during dry periods, can alter conditions sufficiently to affect the persistence of some species (Coetzee and Rogers, 1991).
• The species with the most diagnostic potential in terms of response to flooding is the Wild Rice, which has been exten-sively studied on the Nyl River floodplain (Marneweck, 1988). Studies have shown that rice grows best in water depths between 100 and 500 mm. Depths of 500 to 750 mm result in reduced vigour of underground rhizome develop-ment with consequences for persistence during droughts. Above 750 mm, flowering is markedly reduced and the plants become too spindly to remain upright when levels drop. At least 25 days of flooding is needed for rice to flower and set seed if flooding occurs in January/February, but a longer inundation period is needed if flooding occurs earlier or later
16
Figure 2 Location of the study area for hydraulic modelling
Study area
Middelfonteinspruit
Nyl River
Nyl RiverBad se Loop
Boekenhoutfontein
0590307
0590486
10km0
A6H020
A6H021
A6H010
N1
Mokgoopong
Modimolle
N
Figure 2Location of the study area for hydraulic modelling

Available on website http://www.wrc.org.zaISSN 0378-4738 = Water SA Vol. 33 No. 1 January 2007ISSN 1816-7950 = Water SA (on-line)
11
in the season. The growth pattern of rice during this 25-day period shows shorter response periods as floods rise and fall, suggesting that modelling water distribution at 5-day inter-vals would be appropriate for ecological purposes.
Although species show responses to as little as 90 mm changes in elevation, it is unlikely that ecological modelling could be meaningfully conducted at this fine vertical resolution. For detailed modelling of wetland hydraulics, Hammer and Kadlec (1986) used ¼ ft (76 mm) contours, but this level of resolution is not practically achievable for routine applications and Duever (1988) recommends using contours at 100 to 200 mm intervals for reasonably detailed estimates of surface water quantities. Considering the large extent of the Nyl River floodplain and that the accuracy of the survey data used to develop the digital terrain model (DTM) (described below) is ±200 mm, an appro-priate vertical resolution for the hydraulic modelling is consid-ered to be 200 to 250 mm. Because downstream changes are fairly gradual, the longitudinal resolution can be fairly coarse and the floodplain is divided into four reaches between Modi-molle (previously Nylstroom) and Mosdene (the downstream limit of the study area, Fig. 2). The extent of flooding within the study area is interpolated from inundation levels modelled at cross-sections spaced between 20 m and 1 km in the longitu-dinal direction. The passage of floods through the floodplain is slow, and can be adequately described at a time resolution of 1 d. The inflow data (streamflow and rainfall) are therefore specified at a daily time-step. According to Poff et al. (1997), five critical components of the flow regime regulate ecological processes in river ecosys-tems: the magnitude, frequency, duration, timing and rate of change of hydrologic conditions. With the exception of the rate of change, the same temporal characteristics have been identi-fied in the Nylsvlei study using Wild Rice as the indicator of ecological impact, but using inundation depth and area as the hydrological variables. The hydraulic modelling described in this paper provides the link between these and the primary man-agement variable, discharge.
Study area and model structure
The study area extends from the N1 National Road at Middelfon-tein to the Mokgoopong-Roedtan Road (Route 519) at Mosdene (Fig. 2). This area was selected to include the most ecologically important areas along the floodplain, particularly Nylsvley. The extent of the area selected was also influenced by practical con-siderations, including the proximity of hydraulic model bounda-ries to streamflow gauges, suitable locations for flow gauging in a difficult monitoring environment, the lateral extent of the floodplain, the frequency and extent of flooding, the distribu-tion of wetland plant communities, and available resources for topographical surveys. For modelling purposes, the study area was divided into three distinct, contiguous portions, defined by four road cross-ings (illustrated schematically in Fig. 3), for each of which an individually calibrated and verified hydraulic model was developed:• Middelfontein to the Nylsvley Nature Reserve• The Nylsvley Nature Reserve• From Vogelfontein (the downstream boundary of the Nature
Reserve) to Mosdene.
This division was necessary for the processing of the large quantities of survey data and also to facilitate the development of hydraulic models for manageable portions of the floodplain. The mean water surface slopes for the three sub-areas are: • 0.00098 over a channel length of 19.4 km• 0.00052 over 8.4 km• 0.00064 over 13.6 km.
The sub-models are designed to run in sequence, with the out-flow discharge time series from an upstream model providing inflows to the adjacent downstream model. The hydrological analysis (Havenga et al., 2007) provides simulated flows for the Nyl River at the upstream boundary (Middelfontein), and tributary inflows from the Middelfonteinspruit, De Wetspruit, Bad se Loop and the Blindefontein (Figs. 2 and 3). Additional
A6H019
A6H006
A6H012
A6H011
A6H018
Nyl
A6H021A6H020
Olifantspruit
Middelfonteinspruit
GrootNyl
A6H039 A6H002 A6H037GP7
GP2
Nature
Vogelfontein
Deelkraal RoadN1
GP3
GP4
GP5
GP6
Hydraulic models
DWAF gaugesCWE gauge plates
DeelkraalMiddelfontein
Vogelfontein Road
Mosdene
A6H038GP8
A6H010
Boekenhoutfontein Bad se Loop
Blindefontein
I I IO O O
InflowOutflow
IO
Losses LossesLosses
Reserve
Rainfall Rainfall Rainfall
Roedtan Road
NaboomspruitRoad
Figure 3Schematic diagram of the hydraulic modelling area showing its division into three smaller regions. Significant inflows (Nyl River inflow, tributaries and rainfall) and outflows (Nyl River outflow and losses), and the location of water level
gauges along the floodplain are indicated.

12 Available on website http://www.wrc.org.zaISSN 0378-4738 = Water SA Vol. 33 No. 1 January 2007
ISSN 1816-7950 = Water SA (on-line)
inflows and outflows include rainfall on inundated areas, losses to evapotranspiration and infiltration, and ponded water (in both natural landscape depressions and artificial impoundments) that may be lost to evapotranspiration and infiltration during the dry winter season (Fig. 4). Data collection
An extensive data collection programme was carried out to pro-vide information for the development, calibration and verifica-tion of the models.
Topographical and photographic surveys
The Nyl River floodplain is extremely flat (Fig. 5 shows a maxi-mum elevation difference of 1 m over a 1 km wide right bank floodplain), requiring ground elevations to be defined to a high degree of accuracy for meaningful predictions of flow depth and the volume of water required to inundate the floodplain to be made. The study area (Fig. 2) was mapped using airborne Light Detection and Ranging (LIDAR) mapping and photographed digitally. Laser mapping rapidly generates high-density, geo-referenced digital elevation data with accuracies comparable to land surveys, but significantly faster than traditional airborne surveys. Airborne laser mapping systems can determine ground surface topography through vegetated cover, which is particu-larly useful in areas of low relief, such as floodplains. The abso-lute accuracy of the elevation data is 150 mm and relative accu-racy can be less than 50 mm (www.airbornelasermapping.com, 2007). Absolute accuracy of the plan coordinates is dependent on operating parameters such as flight altitude, but is usually hundreds of millimetres to a metre. The survey data for Nylsvlei were thinned using a 200 mm filter, and totalled 1.9m. points. Figure 6 is a plot of the survey points for a section of the Nyls-vley Nature Reserve, illustrating a higher point density coincid-ing with river, road and hill landscape features. In addition to the LIDAR, a digital imaging camera was used to produce geo-referenced orthophotographs. The relative elevations of gauge plates installed along the Nyl River Floodplain, used for water level observations prior to
this study, were unknown. To make use of these and water levels monitored within this study, the elevation of all gauge plates was surveyed relative to the same LO co-ordinate system used for topographical mapping.
Inundation and flow data
Discharge is the fundamental floodplain management variable as well as being the primary input to the hydraulic model. The primary model outputs are time series of water levels, inunda-tion areas and discharge, including their spatial distributions. Appropriate observed records of water level and discharge were required for model calibration and verification, and these were measured at road-crossings. Autographically recorded daily water levels were available from the DWAF hydrological database for two of the five moni-toring stations in the study area, including Deelkraal (A6H002) and Mosdene (A6H013) and for the periods 1922-1949/1971-1991 and 1971-1977, respectively (Fig. 3). These data were not used for model development, since water levels were measured rela-tive to the local gauge datum levels which had been removed or may have shifted during the record period. Furthermore, no cor-responding measurements of discharge were available. Gauge
Figure 5Cross-section through the floodplain in the
Nylsvley Nature Reserve
Figure 4View of the dry wet-land in the Nylsvley Reserve, looking
downstream towards Vogelfontein (Photo:
K Rogers, WITS University)

Available on website http://www.wrc.org.zaISSN 0378-4738 = Water SA Vol. 33 No. 1 January 2007ISSN 1816-7950 = Water SA (on-line)
13
stage records (Fig. 7) and the rating functions (Fig. 8). Figure 9 is a plot of the inflow and outflow discharge hydrographs at Middelfontein and the Nylsvley Nature Reserve, and shows gen-erally higher outflow peaks. Additional inflows to this upper portion of the floodplain include the Middelfonteinspruit, De Wetspruit, and local rainfall.
Nyl RiverDeelkraal Road
Stemmerskop
GP2
GP3
GP4
1996 1997 1998 1999 2000 20011085
1086
1087
1088
1089
1090
1091
1092
1093
GP2
GP3GP4
GP5GP6
GP7
plates had previously been installed at eight locations within the study area, mostly within the Nylsvley Nature Reserve, and water levels were monitored periodically (at approximately 5 d intervals), with 286 readings over the period January 1996 to June 2001. These provided the major source of stage level data used to develop the hydraulic model. The DWAF also upgraded the existing monitoring network by re-installing autodigital recorders at key locations along the floodplain; Deelkraal, Vogelfontein and Mosdene, and a new station was installed at Middelfontein (N1). The record from Mosdene is for only one year – the entire facility was vandalised a year after installation. Daily values were obtained from the periodic visual observa-tions by linear interpolation of missing data for up to 10 consec-utive days. DWAF measurements (derived from instantaneous readings) were substituted for periods of continuous recordings. The time series of stage levels recorded in the Nylsvley Nature Reserve are plotted in Fig. 7. No floodplain discharge measurements existed prior to this study, and flow was therefore measured at key locations during the study. None of the monitoring locations were control sec-tions and the relationship between flow depth and discharge was influenced strongly by vegetation, whose condition and influ-ence changes significantly with season and flood timing. Estab-lishing rating relationships therefore required repeated stream gauging, which was carried out using the velocity-area method (BS 3680, 1980 and 1983) at the stage monitoring locations (The highest gauged inflow at Middelfontein was 15.7 m3/s in April 2000, and an outflow of 35.3 m3/s was measured at Mosdene in February 2000). Rating relationships were thus obtained for the floodplain at the four road crossings bounding the three hydrau-lic models (Fig. 3). As an example (Fig. 8) data for the station at the upstream boundary of the Nylsvley Nature Reserve (GP2) are shown. The scatter in the data is attributed to measurement inaccuracies, effects of unsteady flow, and changes in vegetation resistance. There were insufficient data to isolate seasonal influ-ences, and a single power function (as described by Birkhead and James, 1998) was fitted for each site. The scatter is gener-ally within 200 mm, allowing relationships to be used that are of similar accuracy to the topographical surveys. Additional and more continuous records would be necessary to investigate sea-sonal effects further. Discharge time-series were derived from
1090.0
1090.5
1091.0
1091.5
1092.0
1092.5
Sta
ge le
vel (
mam
sl)
0.01 0.1 1 10 100Discharge, Q (m3/s)
Figure 8Rating data and function plot for the gauge (GP2) at the
upstream boundary of the Nylsvley Nature Reserve
Figure 6 Plot of LIDAR random survey points for a section of the Nylsvley Nature
Reserve
Figure 7Time series of recorded stage levels for the six gauges
(Gauge Plate (GP) 2 to 7 - refer to Fig. 3) in the Nylsvley Nature Reserve for the period January 1996 to June 2001
(x-axis denotes time in years)

14 Available on website http://www.wrc.org.zaISSN 0378-4738 = Water SA Vol. 33 No. 1 January 2007
ISSN 1816-7950 = Water SA (on-line)
The hydraulic records were stored using the Hydrological Engineering Centre-Data Storage System Visual utility engine (HEC-DSSVue). This system was developed by the US Army Corps of Engineers HEC for efficient storage and retrieval of scientific data that are typically sequential. It also provides a graphical user interface program for accessing, visualising and manipulating data in HEC-DSS database files. HEC-DSS is the database utilised by the HEC-River Analysis System (RAS),
which is the hydraulic modelling software used in this study (as described below).
Local rainfall
Local rainfall contributes to the water balance of the floodplain, and its estimation requires data corresponding to the discharge records. Data for 28 rainfall stations exist in the catchments of the Nyl River (Pitman and Bailey, 2004), with only two sta-tions located in close proximity to the study area. Of these, only records for the Nylsvley station (located at the south-east bound-ary of the Nature Reserve) are current, and have been used to estimate the volume of rain falling on the inundated portion of the floodplain (rainfall on the adjacent floodplain has not been included). Calculation of the rainfall volume requires estimation of the inundated area, which is obtained from an empirical rela-tionship between inflow and flooded area (discussed below).
Evapotranspiration, infiltration and ponding
In addition to floodplain inflows and outflows, the modelling must account for losses due to evapotranspiration, infiltration and ponded storage after flooding. A review of suitable methods for estimating evapotranspira-tion at Nylsvley was carried out by Kleynhans (2005). The three main approaches for determining potential evapotranspiration were investigated, including, climatological methods (those hav-ing reasonable data requirements were assessed - refer to Fig. 10), micrometeorological methods (energy balance measurements were carried out by Blight, 2002a), and direct measurements
including the use of lysimeters (reconstructed soil profiles) and evaporation pans. Estimates of average annual evaporation rates at Nylsvley are given in Table 1, and vary from approximately 1 700 to 1 900 mm for Symons pans, to 920 to 1 300 mm for actual evaporation from floodplain and savannah vegetation. Average monthly evaporation rates were used in the hydraulic study. These were obtained using actual evaporation measurements by Blight (2002b) on the floodplain and application of the energy balance method. Measurements were taken over seven isolated days between 1999 and 2001, and since evaporation may vary signifi-cantly between days, continuous pan evapora-tion records from the Donkerpoort Dam weather station (selected through an assessment of record length and geographical position) were used to convert daily measurements to average monthly values. Figure 10 provides a comparison of eva-potranspiration predicted using the energy bal-
1996 1997 1998 1999 2000 20010
5
10
15
20
25
30
35
40
45
50
TABLE 1Average annual evaporation at Nylsvley
Average annual evaporation (mm)
Method Weather station Period Reference
2 400(1 870)
Unshielded class A-pan(equivalent class S-pan)
Nylsvley 1975-1982 Scholes and Walker, 1993
1 897 Penman equation (open water) Nylsvley 1975-1982 Scholes and Walker, 19931 708 Class S-pan Du Toits Kraal (A6E005) 1970/71-2000/01 Kleynhans, 20051 770 Class S-pan Nylsvley 2000/01 Kleynhans, 2005929 Energy balance (floodplain) Donkerpoort (A6E006) 1999-2001 Kleynhans, 2005
1 314 Neutron probe (savannah) 1980 Moore, 1980
Figure 9Inflow (blue) and outflow (red) discharge hydrographs to the
upper modelled portion of the study area for the period 1996 to 2001 (x-axis denotes time in years)
0
1
2
3
4
5
6
7
8
9
10
Jan Feb Mar Apr May Jun Jul Aug Sep Oct Nov Dec
Months
Evap
otra
nspi
ratio
n/Ev
apor
atio
n (m
m/d
ay) Scholes & Walker, 1993 (A-Pan)
Linacre, 1977 (lake)
Scholes & Walker, 1993(equilibrium ET)Linacre, 1977 (vegetation)
Hargreaves, 1994
Jensen & Haise, 1963
Thornthwaite, 1948
Nylsvley floodplain (energy balance)
Figure 10Evapotranspiration from the Nylsvley floodplain predicted using the energy
balance method, various empirical models, and A-Pan data from Scholes and Walker (1993)

Available on website http://www.wrc.org.zaISSN 0378-4738 = Water SA Vol. 33 No. 1 January 2007ISSN 1816-7950 = Water SA (on-line)
15
ance method, various empirical models, and A-pan data from Scholes and Walker (1993). The empirical models display smooth seasonal trends with maximum values in mid- sum-mer when the highest radiation and average temperature occur. Of these models, those of Thornthwaite (1948) and Jensen and Haise (1963) compare best with the energy balance measure-ments derived from the floodplain. The energy balance esti-mates display greater variability (particularly in February and August) which may be attributed to limited water availability on the floodplain, the actual growth response of Wild Rice, and the periodic nature of the observed data. The low rate for August (0.4 mm) may be attributed to the dormant state of the vegetation cover at this time of year, which is unaffected by water availabil-ity (Marneweck, 2003). The measurement-based evaporation rates from the floodplain have also been compared with esti-mates using various pan factors (to assess actual evapotranspi-ration), with the Pure Grassveld A-pan factor providing the best comparative rates. Infiltration measurements were carried out in different parts of the floodplain, on selected soil types and at different depths, using a Guelph Permeameter. Infiltration rates were variable, ranging from approximately 0.1 mm/h (2.4 mm/d) at a depth of 200 mm, to values too low to measure (less than 0.04 mm/h) below a depth of 400 mm in the floodplain alluvium. Because of the low rates, infiltration was not modelled independently, but incorporated with ponding losses, which were determined from a measurement-based water balance for the floodplain, as described in the following section.
Model development
Selection of models
In the Nyl River floodplain, the movement of water is control-led by a complex natural topography, modified by numerous impoundments, dykes, levees, channels and roads. Over large portions of the floodplain there is no well-defined channel, and water spreads over the landscape two-dimensionally. These characteristics suggest that two-dimensional hydraulic model-ling is appropriate, and this was therefore initially pursued in this study. The two-dimensional Surface Water Modelling Sys-tem (SMS) was successfully applied to develop a steady-state
model for a portion of the Reserve area, but was unable to deal with unsteady simulations involving the wetting and drying of boundary elements. The system was consequently analysed one-dimensionally, and a suite of four modelling tools was used, including, QuickSurf; RiverCAD; HEC-RAS and HEC-DSS-Vue (refer to Birkhead et al. (2004) for detailed descriptions of the use of these models). QuickSurf is a general purpose surface modelling system (based on FelixCAD) that converts surface mapping data such as point data (as obtained from the LIDAR survey) into contours, grids and triangulated irregular networks. A suite of model-ling tools allows the manipulation of surfaces into high-quality maps. Figure 11 is an example of a high-resolution (100 mm) contour map of the Nylsvley Reserve area used for accurately demarcating features in the floodplain. Rectangular grids of 20 or 25 m were used to develop contour maps, with the excep-tion of floodplain areas containing artificial features (e.g. dykes, levees and dams), where the high-density random LIDAR data were used (Fig. 6). Because LIDAR does not penetrate water surfaces, the depth of the river channel was not defined by the survey, and it was necessary to superimpose a low-flow channel on the modelled floodplain surface modelled using the LIDAR data (Fig. 5). The centre-line of the Nyl River was digitised using high-definition contour maps (Fig. 11) and digital images to accurately locate its planform position. Figure 12 is a 200 mm interval contour map of a portion of the Nylsvley Nature Reserve superimposed on the geo-referenced digital orthopho-tograph. RiverCAD is an advanced graphical modelling environ-ment, providing support for the US Army Corps of Engineers’ one-dimensional unsteady flow analysis software, HEC-RAS. RiverCAD provides the tools necessary for positioning and extracting cross-sections (Fig. 12), measuring longitudinal distances between adjacent cross-sections (channel and flood-plain), and mapping floodplain inundation. Resistance coeffi-cients for the channel and floodplain (Manning’s n was used in this study) were adjusted using the unsteady flow calibration, described in the following section. Boundary conditions are required at the most upstream and downstream cross-sections, in the form of discharge hydrographs (Fig. 9), and rating curves (Fig. 8), respectively. Tributary inflows and rainfall contribu-tion are also specified as time-series of daily discharge values.
Figure 11Contour map at 100 mm intervals for the upper portion of the Nylsv-ley Nature Reserve between GP2 (Deelkraal Road) and GP4 (refer to Figs. 2 and 3), produced from the LIDAR data in Fig. 6 (colour
sequence is blue-pink-red-orange-yellow-green-blue with increasing
elevation)

16 Available on website http://www.wrc.org.zaISSN 0378-4738 = Water SA Vol. 33 No. 1 January 2007
ISSN 1816-7950 = Water SA (on-line)
Modelling instabilities prevented losses from being accounted for in this way, and were rather specified using an artificial pump extraction facility, where pump operation and rate of extraction are linked to stage levels. Efficiency curves were developed by correlation of daily losses with stage levels. To avoid further numerical instabilities occurring at very low discharges, the minimum flow rate used in the simulations was 0.1 m3/s; flows below this are generally confined to the river channel.
Predicting the surface area of inundation
Inflow contributions from rainfall and losses by evapotranspira-tion both require estimates of inundated floodplain area. The use of cross-section surface widths produced by HEC-RAS to calculate inundated areas would involve an iterative solution procedure. To avoid this, inundated areas were determined during modelling from relationships between inundated sur-face area and the inflow known as input at each simulation step. These relationships were obtained for the three sub-areas by correlating modelled inundated areas with inflows for the 1999/2000 year. Floodplain water balance
Water balances for each of the floodplain sub-areas (Fig. 3) have been determined to quantify the relative contributions of inflows and outflows, and also to develop empirical relationships for the difficult-to-measure losses arising from infiltration and ponding (Table 2). The Nylsvley Nature Reserve provides the longest and most intensive measured records (since 1996) and a single tributary, the Blindefontein, contributes flow to this sub-area in addition to the flow of the main Nyl River. Tributary inflows were determined from the hydrological analysis (Havenga et al., 2007). The use of flow records that are patched and extrapolated from gauges located in their upper catchments reduces the accu-racy of water balance calculations, and a more accurate water balance for the Nylsvley Nature Reserve was therefore used to develop an empirical estimate of infiltration and ponding losses. Annual losses (derived from cumulative daily values) were cor-related with cumulative inundated areas for the extent of the record (1997/98 to 2000/01), for application to other regions of
the floodplain. For the study area, losses (evapotranspiration, infiltration and ponding) are estimated to account for 39% and 85% of the total inflows for the hydrological years 1999/2000 and 1998/99, respectively. During these years, the volumetric inflows of the Nyl River at Middelfontein were 70.4 and 13.4 Mm3, respectively. Losses due to infiltration and ponding are significantly higher (2 to 7 times) than those arising from eva-potranspiration. Model calibration and verification using floodplain data
Calibration is the process of adjusting model parameter values to give results that correlate, as closely as possible, with meas-ured values, whereas verification is the process of comparing (calibrated) model predictions with measured data that have not been used in the calibration process. This allows an objective assessment of the predictive accuracy of the model. The wettest season (1999/2000) in the six-year record was used for model calibration, and the remaining data used for verification. A total of 151 cross-sections were extracted from the digital surface contour maps (Fig. 12) for the floodplain study area, and interpolated, where necessary in HEC-RAS to give a maximum spacing between cross-sections of approximately 100 m. River stations (cross-sections) were positioned to coincide with moni-toring gauges, tributaries and other hydraulic controls (such as the Deelkraal Dam, illustrated in Fig. 13). The calibrated flow resistances and time steps used are given in Table 3. The high flow resistance values are not ascribed to vegetation resist-ance alone - the channel was superimposed on the floodplain DTM (see Fig. 5) since LIDAR cannot penetrate water surfaces, and artificially high flow resistances are therefore required to account for hydraulic controls in the topography that are not included in the assumed channel shape and slope. HEC-RAS allows for variable time-stepping, which assists in the develop-ment of a stable solution using computation intervals that are not unreasonably small for the entire simulation period. Figures 14a to 14c are plots of modelled stage and discharge hydrographs and periodically measured values at Middelfontein (the upstream boundary of the Nylsvley Nature Reserve) and Vogelfontein (Figs. 2 and 3), with the calibration (1999/2000)
Figure 12Position of cross-sections (yellow transects) down-stream of Gauge
Plate (GP) 4 in the Nylsvley Nature
Reserve, superim-posed on a back-ground image of
the floodplain and 200 mm contour map. The Nyl
River flows from the bottom to the top of the figure.

Available on website http://www.wrc.org.zaISSN 0378-4738 = Water SA Vol. 33 No. 1 January 2007ISSN 1816-7950 = Water SA (on-line)
17
and verification periods plotted as a continuous record. The discharge hydrographs are based on measured data (stage hydrographs and periodic discharge gauging) and represent the upstream boundary conditions for each of the three sub-areas. Modelled and measured stage fluctuations compare well at all monitoring locations, with simulated behaviour generally within 100 mm of observed values. Model application using gauged hydrographs from upper catchments
In this application of the floodplain model, discharge hydrographs derived from gauged records for the Nyl River and its tributar-ies (stations A6H006, A6H011, A6H018, A6H012 and A6H019 -
TABLE 2Water balance for the study area of the Nyl River floodplain
Year Inflows (Mm3) Outflows (Mm3) Losses (% In-flows)
Nyl Tributaries Rainfall ET Infiltration & ponding
Nyl RiverMeasured Modelled
Sub-area 1: Middelfontein – Nylsvley Nature Reserve1998/99 13.4 4.3 0.7 1.0 5.5 18.7 11.9 351999/00 70.4 17.7 3.0 2.9 11.3 98.0 76.9 16Sub-area 2: Nylsvley Nature Reserve1995/96 49.4 19.5 1.5 1.8 7.8 81.4 60.8 141996/97 29.8 2.6 0.7 1.1 7.4 45.3 24.6 261997/98 9.4 1.1 0.4 0.8 4.6 6.7 5.5 501998/99 18.7 5.6 0.8 1.2 5.6 14.7 18.3 271999/00 98.0 4.5 2.6 2.8 10.9 91.6 91.4 132000/01 17.4 0.3 0.1 0.9 5.6 13.6 11.3 37Sub-area 3: Vogelfontein to Mosdene1995/96 81.4 7.3 8.1 10.5 19.4 60.4 66.9 311996/97 45.3 2.1 5.0 7.6 18.3 15.8 26.5 491997/98 6.7 0.3 1.5 2.3 8.3 0.1 0.0 1001998/99 14.7 0.8 3.2 4.8 10.9 4.4 3.0 841999/00 91.6 11.8 9.4 10.0 19.7 122.9 83.1 262000/01 13.6 1.4 0.4 2.8 10.4 16.0 2.2 86
Figure 13Deelkraal Dam located 1.8 km upstream of the
Nylsvley Nature Reserve (Photo: K Rogers, WITS
University)
TABLE 3Resistance coefficients and computation intervalsSub-area
Manning’s n Time-step (mins)Channel Floodplain Maximum Minimum
1 0.1-12 0.05-0.5 30 0.52 4-6.5 0.25-0.65 30 0.53 2-10 0.3-0.5 30 0.5
refer to Figs. 2 and 3) were used as input. These records include patched missing flow data and extrapolated values from gauge stations to the floodplain study area (Havenga et al., 2007). The hydraulic models are run successively for the three sub-areas, with the modelled outflow from the upper floodplain region pro-

18 Available on website http://www.wrc.org.zaISSN 0378-4738 = Water SA Vol. 33 No. 1 January 2007
ISSN 1816-7950 = Water SA (on-line)
viding the inflow to Nature Reserve, and so on. A loss of accu-racy when compared with the verification can be expected due to errors inherent in predicting daily discharge, but also related to changes in vegetation growth with time and the associated floodplain resistance. In addition to these factors, modifica-tions to the floodplain topography (construction of impound-ments, dykes, levees, artificial channels and roads) will further have influenced hydraulic behaviour over time. It is difficult to assess the accuracy of the hydraulic model for the application period prior to 1996 (first measured data), since no discharge
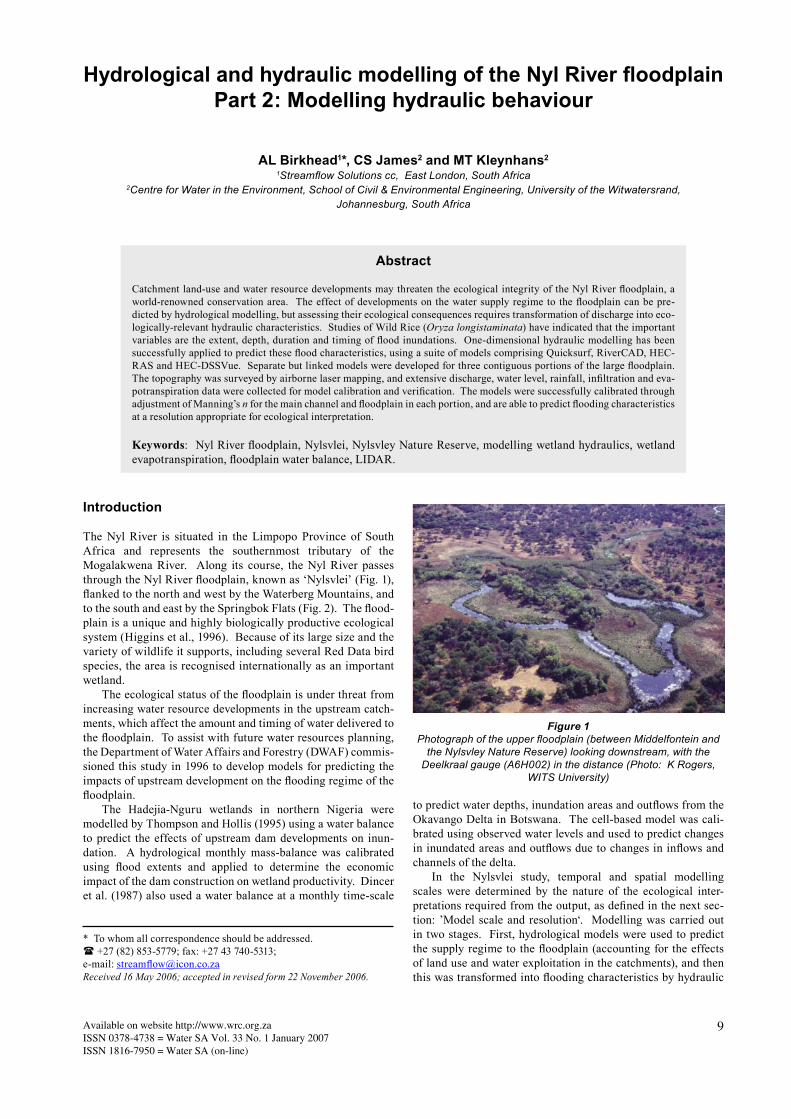
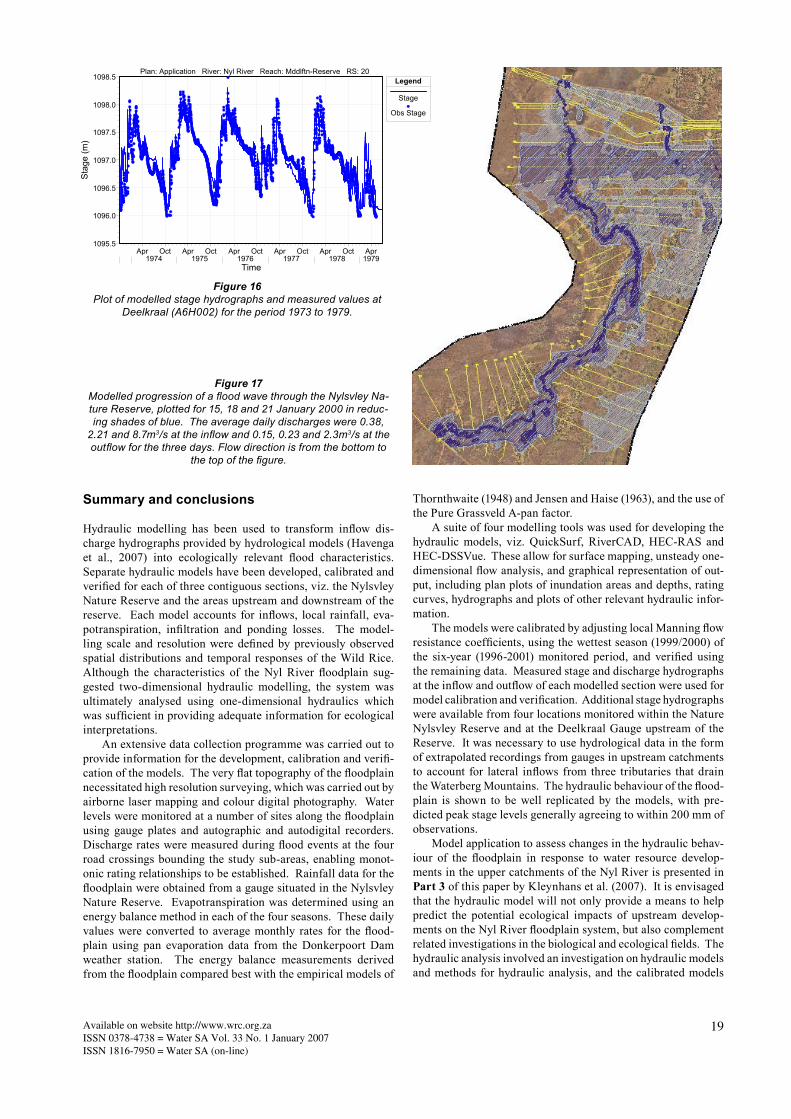
data and meagre water level data exist prior to this date. Exam-ples of the results are plotted for the stations at Middelfontein and Vogelfontein in Figs. 15a and 15b, respectively. At the inflow section (Middelfontein), simulated and measured data compare well (within 200 mm), although modelled water lev-els overestimate observations for the winter seasons. The stage hydrographs display significant fluctuations, which were shown to have dampened on reaching the Nylsvley Nature Reserve 19.4 km downstream. At Vogelfontein (Fig. 15b), measured stage data, particularly peak values, are well replicated by the model. The largest discrepancies occur as over-estimates of wet season recessions by up to 150 mm. Water level records at the Deelkraal station (Fig. 1) date back to 1922, but the elevation used to convert recordings to a com-mon datum (in m a.m.s.l.) is from a survey of the existing gauge plate. The accuracy of this datum is uncertain and the reliabil-ity of these historical data cannot therefore be assumed. Nev-ertheless, for the period 1973-1979 (Fig. 16), the simulated and observed stages compare exceptionally well. Discrepancies have been shown, however, to exist for other periods of comparison, particularly the late 1980s to early 1990s (Birkhead et al., 2004). Figure 17 is a hatched rendering showing the progression of flooding in the Nylsvley Nature Reserve for the first 6d of the first flow event in 2000, superimposed on a background ortho-photograph of the floodplain with cross-sections indicated. Fig-ure 17 shows that the lateral extent of flooding at Vogelfontein is greater than the upper Reserve area, which is consistent with observations.
May Aug Nov Feb May Aug Nov Feb May Aug Nov Feb May1998 1999 2000 2001
1109.5
1109.6
1109.7
1109.8
1109.9
1110.0
1110.1
1110.2
0
5
10
15
20
25Plan: Verification River: Nyl River Reach: Mddlftn-Reserve RS: 51
Time
Sta
ge (m
)
Flow
(m3/
s)
Legend
Stage
Obs Stage
Obs Flow
Flow
Jul Jan Jul Jan Jul Jan Jul Jan Jul Jan1996 1997 1998 1999 2000 2001
1089.5
1090.0
1090.5
1091.0
1091.5
1092.0
1092.5
0
10
20
30
40
50Plan: Verification River: Nyl River Reach: Nylsvley Reserve RS: 600
Time
Sta
ge (m
)
Flow
(m3/
s)Legend
Stage
Obs Stage
Obs Flow
Flow
Jul Jan Jul Jan Jul Jan Jul Jan Jul Jan1996 1997 1998 1999 2000 2001
1085.8
1086.0
1086.2
1086.4
1086.6
1086.8
0
5
10
15
20
25
30
35Plan: Verification River: Nyl River Reach: Mosdene-Vogelftn RS: 700
Time
Sta
ge (m
)
Flow
(m3/
s)
Legend
Stage
Obs Stage
Obs Flow
Flow
Figure 14cPlot of modelled stage and discharge hydrographs, and measured values at Vogelfontein (GP7/A6H037) for the
period 02/01/1996 to 27/06/2001
Figure 14aPlot of modelled stage and discharge hydrographs, and
measured values at Middelfontein (A6H039) for the period 26/02/1998 to 09/05/2001
Figure 14bPlot of modelled stage and discharge hydrographs, at the
upper boundary of the Nylsvley Nature Reserve for the period 02/01/1996 to 27/06/2001
Mar Sep Mar Sep Mar Sep Mar Sep Mar1997 1998 1999 2000 2001
1109.4
1109.6
1109.8
1110.0
1110.2
0
10
20
30
40
50Plan: Application River: Nyl River Reach: Mddlftn-Reserve RS: 51
Time
Sta
ge (m
)
Flow
(m3/
s)
Legend
Stage
Obs Stage
Obs Flow
Flow
Jul Jan Jul Jan Jul Jan Jul Jan Jul Jan1996 1997 1998 1999 2000
1085.8
1086.0
1086.2
1086.4
1086.6
1086.8
1087.0
0
20
40
60
80
100Plan: Application River: Nyl River Reach: Mosdene-Vogelftn RS: 700
Time
Sta
ge (m
)
Flow
(m3/
s)
Legend
Stage
Obs Stage
Obs Flow
Flow
Figure 15bPlot of modelled stage and discharge hydrographs,
and measured stage at Vogelfontein (GP7/A6H037) for the period 02/01/1996 to 30/04/2001.
Figure 15aPlot of modelled stage and discharge hydrographs, and
measured values at Middelfontein (A6H039) for the period 26/02/1997 to 09/05/2001
Available on website http://www.wrc.org.zaISSN 0378-4738 = Water SA Vol. 33 No. 1 January 2007ISSN 1816-7950 = Water SA (on-line)
19
Summary and conclusions
Hydraulic modelling has been used to transform inflow dis-charge hydrographs provided by hydrological models (Havenga et al., 2007) into ecologically relevant flood characteristics. Separate hydraulic models have been developed, calibrated and verified for each of three contiguous sections, viz. the Nylsvley Nature Reserve and the areas upstream and downstream of the reserve. Each model accounts for inflows, local rainfall, eva-potranspiration, infiltration and ponding losses. The model-ling scale and resolution were defined by previously observed spatial distributions and temporal responses of the Wild Rice. Although the characteristics of the Nyl River floodplain sug-gested two-dimensional hydraulic modelling, the system was ultimately analysed using one-dimensional hydraulics which was sufficient in providing adequate information for ecological interpretations. An extensive data collection programme was carried out to provide information for the development, calibration and verifi-cation of the models. The very flat topography of the floodplain necessitated high resolution surveying, which was carried out by airborne laser mapping and colour digital photography. Water levels were monitored at a number of sites along the floodplain using gauge plates and autographic and autodigital recorders. Discharge rates were measured during flood events at the four road crossings bounding the study sub-areas, enabling monot-onic rating relationships to be established. Rainfall data for the floodplain were obtained from a gauge situated in the Nylsvley Nature Reserve. Evapotranspiration was determined using an energy balance method in each of the four seasons. These daily values were converted to average monthly rates for the flood-plain using pan evaporation data from the Donkerpoort Dam weather station. The energy balance measurements derived from the floodplain compared best with the empirical models of
Thornthwaite (1948) and Jensen and Haise (1963), and the use of the Pure Grassveld A-pan factor. A suite of four modelling tools was used for developing the hydraulic models, viz. QuickSurf, RiverCAD, HEC-RAS and HEC-DSSVue. These allow for surface mapping, unsteady one-dimensional flow analysis, and graphical representation of out-put, including plan plots of inundation areas and depths, rating curves, hydrographs and plots of other relevant hydraulic infor-mation. The models were calibrated by adjusting local Manning flow resistance coefficients, using the wettest season (1999/2000) of the six-year (1996-2001) monitored period, and verified using the remaining data. Measured stage and discharge hydrographs at the inflow and outflow of each modelled section were used for model calibration and verification. Additional stage hydrographs were available from four locations monitored within the Nature Nylsvley Reserve and at the Deelkraal Gauge upstream of the Reserve. It was necessary to use hydrological data in the form of extrapolated recordings from gauges in upstream catchments to account for lateral inflows from three tributaries that drain the Waterberg Mountains. The hydraulic behaviour of the flood-plain is shown to be well replicated by the models, with pre-dicted peak stage levels generally agreeing to within 200 mm of observations. Model application to assess changes in the hydraulic behav-iour of the floodplain in response to water resource develop-ments in the upper catchments of the Nyl River is presented in Part 3 of this paper by Kleynhans et al. (2007). It is envisaged that the hydraulic model will not only provide a means to help predict the potential ecological impacts of upstream develop-ments on the Nyl River floodplain system, but also complement related investigations in the biological and ecological fields. The hydraulic analysis involved an investigation on hydraulic models and methods for hydraulic analysis, and the calibrated models
Apr Oct Apr Oct Apr Oct Apr Oct Apr Oct Apr1974 1975 1976 1977 1978 1979
1095.5
1096.0
1096.5
1097.0
1097.5
1098.0
1098.5Plan: Application River: Nyl River Reach: Mddlftn-Reserve RS: 20
Time
Sta
ge (m
)Legend
Stage
Obs Stage
Figure 17Modelled progression of a flood wave through the Nylsvley Na-ture Reserve, plotted for 15, 18 and 21 January 2000 in reduc-ing shades of blue. The average daily discharges were 0.38,
2.21 and 8.7m3/s at the inflow and 0.15, 0.23 and 2.3m3/s at the outflow for the three days. Flow direction is from the bottom to
the top of the figure.
Figure 16 Plot of modelled stage hydrographs and measured values at
Deelkraal (A6H002) for the period 1973 to 1979.

20 Available on website http://www.wrc.org.zaISSN 0378-4738 = Water SA Vol. 33 No. 1 January 2007
ISSN 1816-7950 = Water SA (on-line)
and experience gained will be of benefit in analyses of other wet-land and floodplain systems in South Africa.
Acknowledgements
A number of organisations and individuals were responsible for data collection between 1996 and 2001 and contributed to this project. The topographical data were surveyed by Airborne Laser Solutions (ALS) under contract to DWAF. Norman Banks (ALS) was particularly helpful with provid-ing point survey and image data in various formats. Fanie van Staden’s (Surveys, DWAF) contribution to this study by means of overseeing and providing survey control for the laser topographical survey and for fixing gauge plate data to the LO coordinate system, is appreciated. Print-outs of the digi-tised orthographical maps of the study area were supplied by Eduarda Teixeira (Aerial Surveys, DWAF). Stage levels were periodically observed and manually recorded by Fanie Baloyi as part of ongoing monitoring under the auspices of the Centre for Water in the Environment (CWE), Wits University, from January 1996, and more recently as part of this study. Stage level data were supplied in electronic format from the DWAF database by Theresa Colyn and Francinah Sibanyoni (Hydrol-ogy, DWAF). Periodic measurements of discharge at moni-tored locations along the floodplain were undertaken by the CWE, and in particular John Odiyo, Mark Leroy and Angelina Jordanova. Geoff Blight and Andy Fourie (School of Civil and Environmental Engineering, University of the Witwatersrand) were involved with evapotranspiration data collection and modelling, and infiltration measurements, respectively. Kevin Rogers (CWE) assisted with the delineation of the Nylsvlei wetland, and provided information on vegetation characteris-tics for determining appropriate temporal and spatial scales for hydraulic modelling. Wendy Midgley (CWE) assisted with the administration of the project. Software used in this study was purchased from Boss International, and the advice and technical support provided by Chris Maeder and Nathan Gehring was invaluable. The management of this study by Beyers Havenga, assisted by Witek Jezewski and Gregory Paszczyk (National Water Resources Planning Directorate, DWAF) is acknowledged. Finally, for the support provided by Mandy Uys. References
AIRBORNELASERMAPPING.COM (2007) Overview to an emerg-ing survey technology. Online at www.airbornelasermapping.com (Accessed on 10 January 2007).
BIRKHEAD AL, JAMES CS and KLEYNHANS M (2004) The Hydrologic and Hydraulic Study of the Behaviour of the Nyl River Floodplain: Hydraulic Modelling. DWAF Report No. P WMA 01/A61/00/0503. Department of Water Affairs and Forestry, Pretoria, South Africa.
BIRKHEAD AL and JAMES CS (1998) Synthesis of rating curves from local stage and remote discharge monitoring using nonlinear Musk-ingum routing. J. Hydrol. 205 52-65.
BLIGHT GE (2002a) Measuring evaporation from soil surfaces for envi-ronmental and geotechnical purposes. Water SA 28 (4) 381-394.
BLIGHT GE (2002b) Water Balances for Soil Systems. Centre for Water in the Environment Report, School of Civil and Environmental Engineering, University of the Witwatersrand, Johannesburg.
BRITISH STANDARDS (BS) 3680 (1980) & (1983) British Standard for the Measurement of Liquid Flow in Open Channels. Part 3A: Velocity-Area Methods.
COETZEE MS and ROGERS KH (1991) Environmental correlates of plant species distribution on the Nyl River floodplain, South Africa. S. Afr. Jour. Aquat. Sci. 17 44-50.
DINCER T, CHILD S and KHUPE B (1987) A simple mathematical model of a complex hydrological system – Okavango Swamp, Bot-swana, J. Hydrol. 93 41-65.
DUEVER MJ (1988) Hydrologic processes for models of freshwater wetlands. In: Mitsch WJ, Straškraba, M and Jørgensen, SE (eds.) Wetland Modelling, Developments in Environmental Modelling 12. Elsevier. 9-39.
HAMMER DE and KADLEC RH (1986) A model for wetland water dynamics. Water Resour. Res. 22 (13) 1951–1958.
HARGREAVES GH (1994) Defining and using reference evapotranspi-ration. J. Irrig. Drain. Eng. ASCE 120 (6) 1132-1139.
HAVENGA CFB, PITMAN WV and BAILEY AK (2007) Hydrological and hydraulic modelling of the Nyl River floodplain. Part 1: Back-ground and hydrological modelling. Water SA 33 (1) 1-8.
HIGGINS SI, COETZEE MAS, MARNEWECK CG and ROGERS KH (1996) The Nyl River floodplain, South Africa, as a functional unit of the landscape: A review of current information. Afr. Jour. Ecol. 34 131-145.
HIGGINS SI, ROGERS, KH and KEMPER J (1997) A functional description of the landscape vegetation patterns of a semi-arid floodplain, South Africa, Plant Ecol. 129 (1) 95-101.
JENSEN ME and HAISE HR (1963) Estimating evapotranspiration from solar radiation. Proc. Am. Soc. Civ. Eng. in J. Irrig. Drain. Div. 89 (IR4) 15-41.
KLEYNHANS MT (2005) Hydraulic and Hydrological Modelling of the Nyl River Floodplain for Environmental Impact Assessment. Unpublished M.Sc. (Eng) Dissertation, University of the Witwa-tersrand, Johannesburg, South Africa.
KLEYNHANS MT, JAMES CS and BIRKHEAD AL (2007) Hydro-logical and hydraulic modelling of the Nyl River floodplain. Part 3: Applications to assess ecological impact. Water SA 33 (1) 21-26.
LINACRE ET (1977) A simple formula for estimating evaporation rates in various climates using temperature data alone. Agric. Meteorol. 18 409-424.
MARNEWECK CG (1988) Personal communication. Centre for Water in the Environment, Wits University.
MOORE A (1980) Waterbalans Studies in Geselekteerde Subhabitatte van ‘n Burkea-Savanna. Unpublished M.Sc. Thesis, University of the Orange Free State, Bloemfontein, South Africa.
PITMAN WV and BAILEY AK (2004) The Hydrologic and Hydraulic Study of the Behaviour of the Nyl River Floodplain - Hydrologi-cal Model Calibration.DWAF Report No. P WMA 01/A61/00/0403, Department of Water Affairs and Forestry, Pretoria, South Africa.
POFF NL, ALLAN JD, BAIN, MB, KARR JR, PRESTEGAARD, KL, RICHTER, BD, SPARKS RE and STROMBERG JC (1997) The natural flow regime – a paradigm for river conservation and restora-tion. BioScience 47 (11) 769-784.
SCHOLES RJ and WALKER BH (1993) An African Savannah: Synthe-sis of the Nylsvley Study. Cambridge University Press, Cambridge, United Kingdom.
THOMPSON JR and HOLLIS GE (1995) Hydrological modelling and the sustainable development of the Hadejia-Nguru Wetlands, Nigeria. Hydrol. Sci. J. 40 (1) 97-116.
THORNTHWAITE CW (1948) An approach toward a rational classifi-cation of climate. Geog. Rev. 38 55-94.