Hydrologic Measurements in the Sierra Nevada:...
52
Sarah Martin Graduate Student Researcher University of California, Merced Hydrologic Measurements in the Sierra Nevada: SNAMP and Beyond
Transcript of Hydrologic Measurements in the Sierra Nevada:...

Sarah MartinGraduate Student ResearcherUniversity of California, Merced
Hydrologic Measurements in the Sierra Nevada: SNAMP and Beyond

Sierra Nevada Adaptive Management Projecthttp://snamp.cnr.berkeley.edu/
Overview
Science directions and questionsWhat do we expect to see?
Infrastructure and data collectionWhat are we collecting and how are we collecting it?
Research HighlightsWhat is the data showing?What can we learn from it?
Future plansWhat are our next steps?
Expanded viewHow does SNAMP fit into the broader picture?What similar studies are being conducted?

Sierra Nevada Adaptive Management Projecthttp://snamp.cnr.berkeley.edu/
Research Questions
Where and when is water stored and how is it routed through the catchments?
What effects do forest treatments have on water quality, quantity, storage and routing through the catchments?
What is the transferability of 1 km2 watersheds to fireshed response?

Sierra Nevada Adaptive Management Projecthttp://snamp.cnr.berkeley.edu/
Hypothesis 1
Fuels treatments will reduce LAI
As Leaf Area Index (LAI) decreases, snow accumulation on the ground will increase, while evapotranspiration (ET) and snow retention in late spring will decrease.
Sierra Nevada Adaptive Management Projecthttp://snamp.cnr.berkeley.edu/
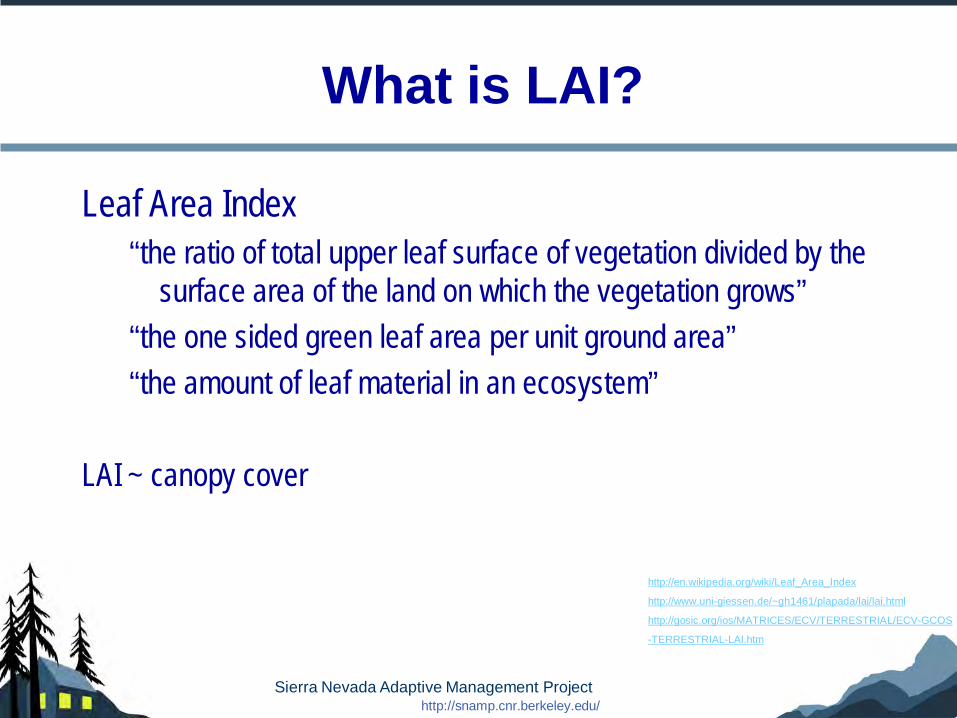
What is LAI?
Leaf Area Index“the ratio of total upper leaf surface of vegetation divided by the
surface area of the land on which the vegetation grows”“the one sided green leaf area per unit ground area”“the amount of leaf material in an ecosystem”
LAI ~ canopy cover
http://en.wikipedia.org/wiki/Leaf_Area_Index
http://www.uni-giessen.de/~gh1461/plapada/lai/lai.html
http://gosic.org/ios/MATRICES/ECV/TERRESTRIAL/ECV-GCOS
-TERRESTRIAL-LAI.htm

How do we measure LAI?An Introduction to Lidar
Lidar = Light Detection and RangingWe contracted with the National Center for Airborne Laser Mapping (NCALM)We have acquired lidar data for both study areas.The type of Lidar we used picks up multiple returns giving us canopy structure data
Image modified from Lefsky et al. 2004 with tree graphic from globalforestscience.org.


Sierra Nevada Adaptive Management Projecthttp://snamp.cnr.berkeley.edu/
Hypothesis 1
Fuels treatments will reduce LAI
As Leaf Area Index (LAI) decreases, snow accumulation on the ground will increase, while evapotranspiration (ET) and snow retention in late spring will decrease.

Fuels treatments lower LAI less interception and more solar radiation
Size and spacing of gaps will also control snow accumulation and melt timing

Hypotheses 2A change in snow
accumulation will be seen in the magnitude of peak stream flow.
Changes in snow retention, will be observed in the recession limb of the hydrograph and the soil moisture curves.
Changes in ET will affect both the timing and the magnitude of late season base stream flow.

Sierra Nevada Adaptive Management Projecthttp://snamp.cnr.berkeley.edu/
Hypothesis 3
Changes in water chemistry will be a function of changes in discharge.
Increased turbidity will be a function of stream discharge as opposed to hillslope erosion.

Data from King’s River Experimental Watershed
In-stream sources appear to be most significant contribution to sediment budget
Headcut Erosion vs. Bank Erosion
0
5
10
15
20
25
P301 P303 P304 D102
Watershed
Erod
ed V
olum
e (c
u. m
)
Headcut ErosionBank Erosion
Current Sediment Work

Hypothesis 4Using hydrologic models,
physiographic and hydroclimatic thresholds can be defined linking area treated with aquatic effects and impacts on forest water cycle.
Hydrologic models will allow us to scale up responses to the larger watershed and fireshed levels.

What’s important?
– Inputs (precipitation)– Outputs (stream flow,
evaporation/sublimation, ET)
– Storage (snowpack, soil moisture)
– Energy (temp, solar radiation, wind)
– Physical parameters (slope, aspect, elevation, vegetation)
If we want to understand the water cycle, what do we need to measure?
http://www.solcomhouse.com/hydrologiccycle.htm

Sierra Nevada
boundary
Sugar Pine
Last Chance
Meteorological StationMonitored WatershedStudy Area
Last Chance
Sugar Pine

Sierra Nevada Adaptive Management Projecthttp://snamp.cnr.berkeley.edu/
Sampling Design
BACI designFinal Criteria:
• ~1 km2 headwater catchments • perennial stream reach• nested within fireshed of 40-200 km2
• Similar vegetation, slope, stream length, aspect • Near rain-snow transition

Sierra Nevada Adaptive Management Projecthttp://snamp.cnr.berkeley.edu/
Challenges to measurements
Continuous measurementsRemote locations
• Access• Power
Complex terrainLots of variability

Sierra Nevada Adaptive Management Projecthttp://snamp.cnr.berkeley.edu/
Meteorological Stations
4 Stations• northern and southern
sites• lower and higher
elevationOpen areas on ridge topsWeather measurements

Meteorological Data
Wind speed and direction
Air temperatureRelative humiditySolar radiationPrecipitation
Barometric pressure
For hydrologic modeling
For stream flow calculations
http://www.campbellsci.com/documents/manuals/nr-lite.pdf
http://www.licor.com/env/Products/Sensors/200/li200_description.jsp
Incoming and net radiation affects how fast snow melts and soil dries
http://www.juddcom.com/ds2manual.pdf http://www.derm.qld.gov.au/
Ultrasonic depth sensors and tipping bucket gages measure warm and cold season precipitation
Sierra Nevada Adaptive Management Projecthttp://snamp.cnr.berkeley.edu/
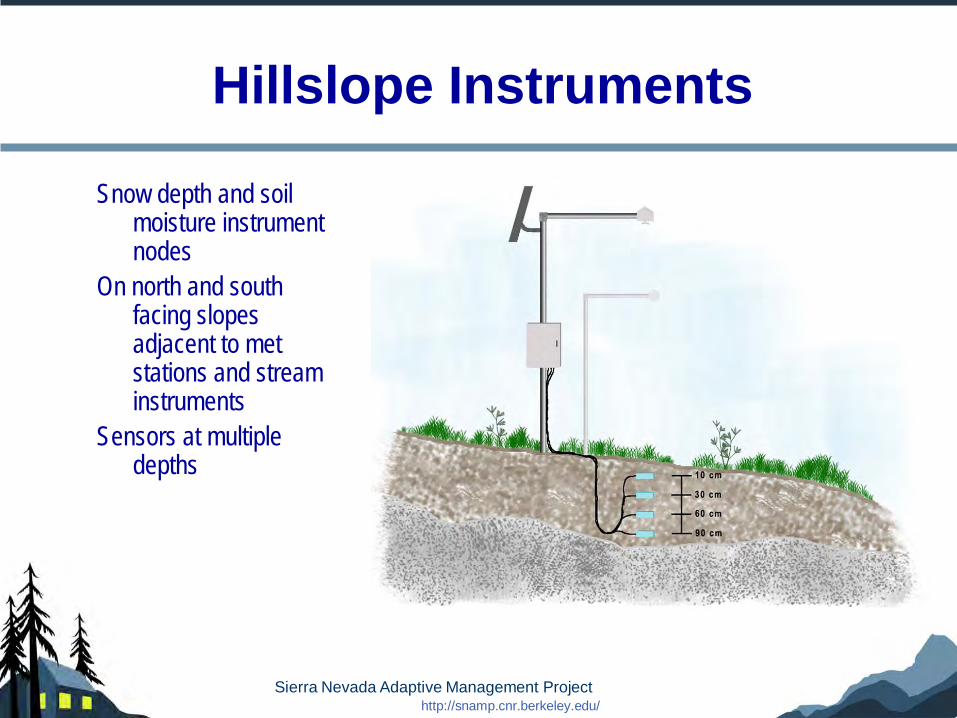
Hillslope Instruments
Snow depth and soil moisture instrument nodes
On north and south facing slopes adjacent to met stations and stream instruments
Sensors at multiple depths
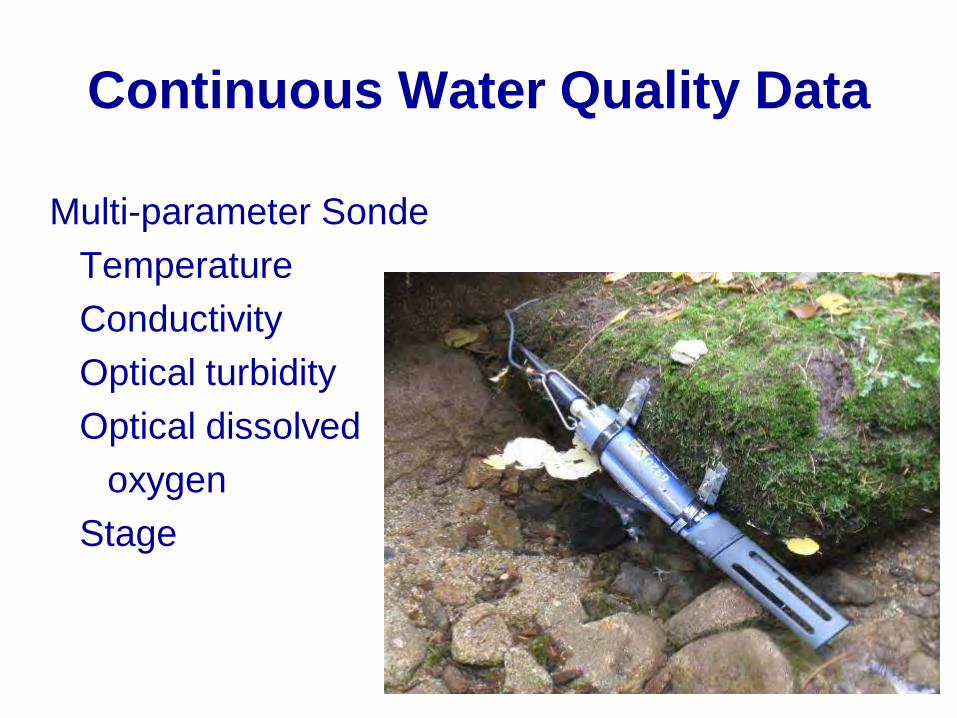
Continuous Water Quality Data
Multi-parameter SondeTemperatureConductivityOptical turbidityOptical dissolved
oxygenStage
Sierra Nevada Adaptive Management Projecthttp://snamp.cnr.berkeley.edu/
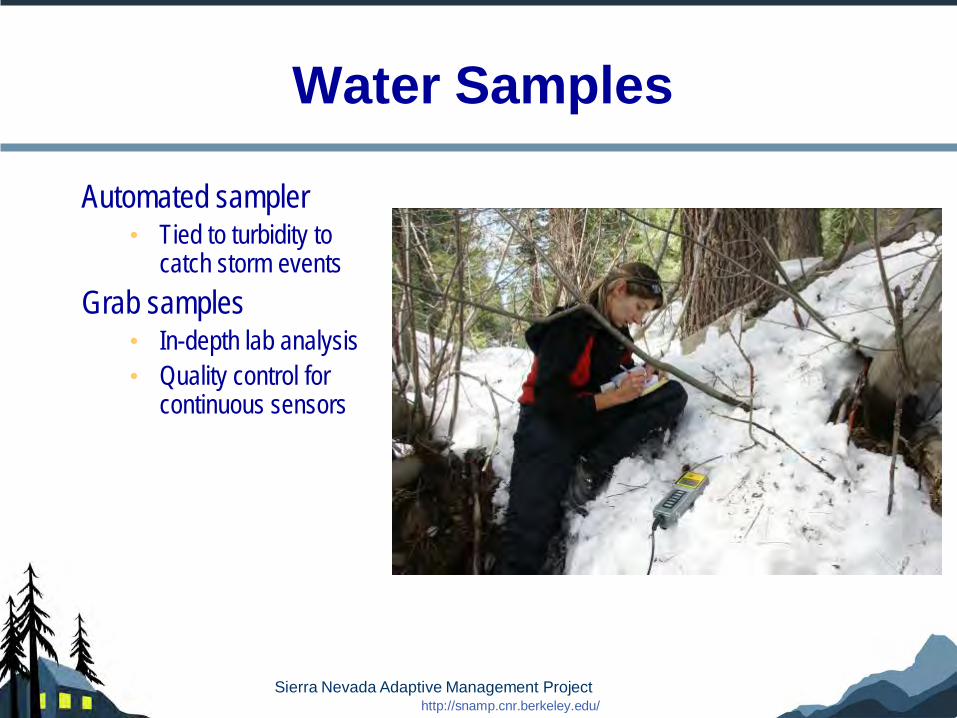
Water Samples
Automated sampler• Tied to turbidity to
catch storm eventsGrab samples
• In-depth lab analysis• Quality control for
continuous sensors

Sediment
Erosion PinsTurbidity Suspended sedimentScour Pans

Discharge
Pressure transducers + rating curves
Weir/Stilling wells
The challenge is to measure both peak and base flows in streams with a wide range of discharges and a significant subsurface component

Sierra Nevada Adaptive Management Projecthttp://snamp.cnr.berkeley.edu/
Measurements
Met stationsWind speed/directionAir temperatureRelative humidityIncoming solar radiationNet solar radiationPrecipitation (rain)Snow depth
Hill slopesSnow depthSoil moisture
Stream stationsStage dischargeWater temperatureConductivityDissolved oxygenTurbidityAutomated and manual grab samples
• Sediment (suspended)• Stable isotopes• Major cations and anions
pHAlkalinitySediment (bedload)
A total of ~270 instruments…..

Stream Rating Curves
Data through WY 2010 (from YSI sondes)
y=2762x2.67
r2=0.952
y=1033x2.19
r2=0.948
y=373.8x6.23
r2=0.733
y=8298x4.15
r2=0.991

Sierra Nevada Adaptive Management Projecthttp://snamp.cnr.berkeley.edu/
Discharge Data – WY 2010

Speckerman Stream Chemistry WY 2010

WY 2009 Snow Data
0
5
10
15
20
25
3/1/2009 3/8/2009 3/15/2009 3/22/2009 3/29/2009 4/5/2009 4/12/2009 4/19/2009 4/26/2009 5/3/2009 5/10/2009 5/17/2009 5/24/2009
Time (hourly)
Sno
w D
epth
(m
eter
)
-20
-10
0
10
20
30
Tem
pera
ture
(d
eg C
)
WY 2008 Snow Data
0
5
10
15
20
25
3/1/2008 3/8/2008 3/15/2008 3/22/2008 3/29/2008 4/5/2008 4/12/2008 4/19/2008 4/26/2008 5/3/2008 5/10/2008 5/17/2008 5/24/2008
Time (hourly)
Sno
w D
epth
(met
er)
-20
-10
0
10
20
30
Tem
pera
ture
(d
eg C
)
Snow Storms Cold Front
Snow Storms
Spring Snowmelt Data – Big Sandy Met
WY 2008
WY 2009

Storm-Melt Sequence
Increase in Depth
Turbidity Spike?
Fronts
Snow Storm Rain
StormSnow?
Sierra Nevada Adaptive Management Projecthttp://snamp.cnr.berkeley.edu/
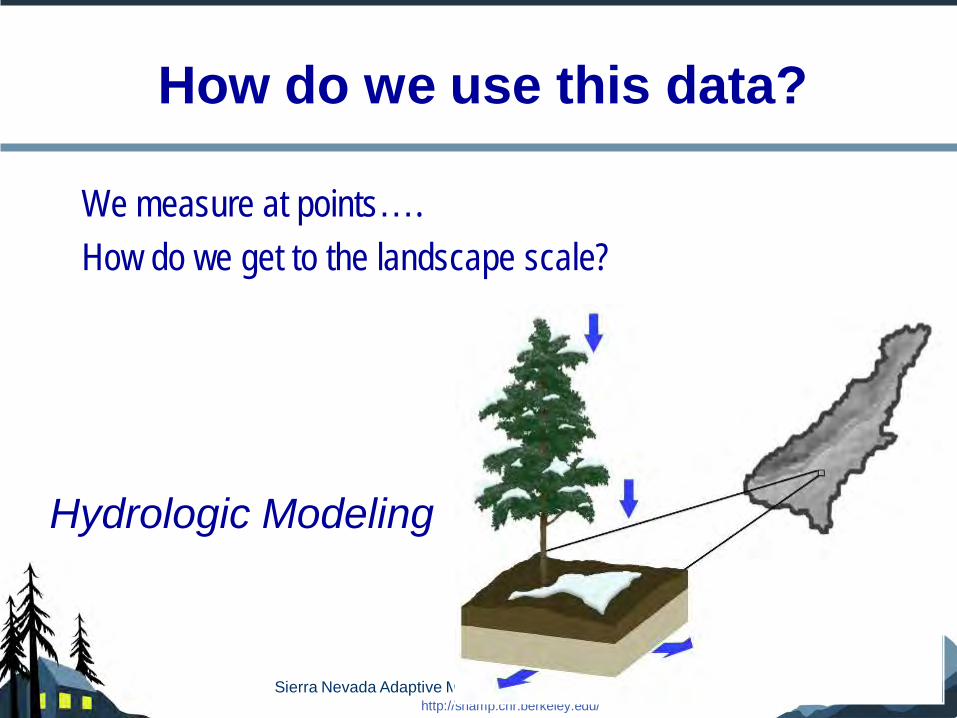
How do we use this data?
We measure at points…. How do we get to the landscape scale?
Hydrologic Modeling
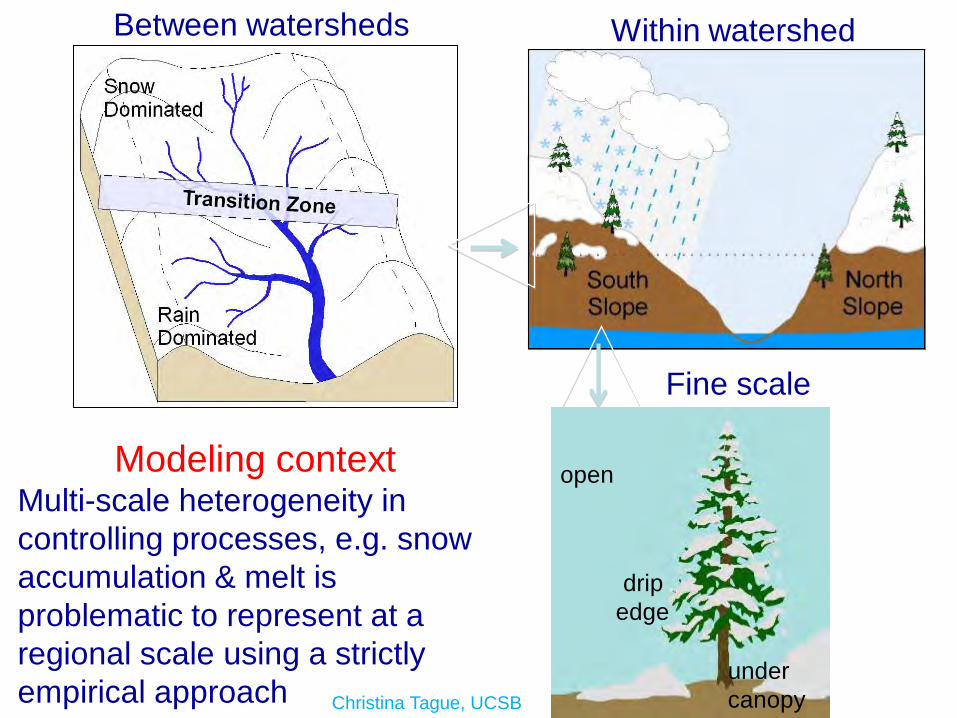
Between watersheds Within watershed
Fine scale
Modeling contextMulti-scale heterogeneity in controlling processes, e.g. snow accumulation & melt is problematic to represent at a regional scale using a strictly empirical approach Christina Tague, UCSB
open
under canopy
drip edge

Scaling up and modeling change
Computer models allow us to better represent heterogeneity across a broad area
Also to change parameters and see effects
drought vs. wet years
increase in temperature
Slope Aspect

Next stepsFinal installations
Big Sandy wierCulvert weirsScour pansAutomatic water samplers
Continued data analysis
ModelingResultsCalibration
Large scale version of drop-box weir at Reynolds Creek Experimental Watershed
Bonita and Pierson, 2003
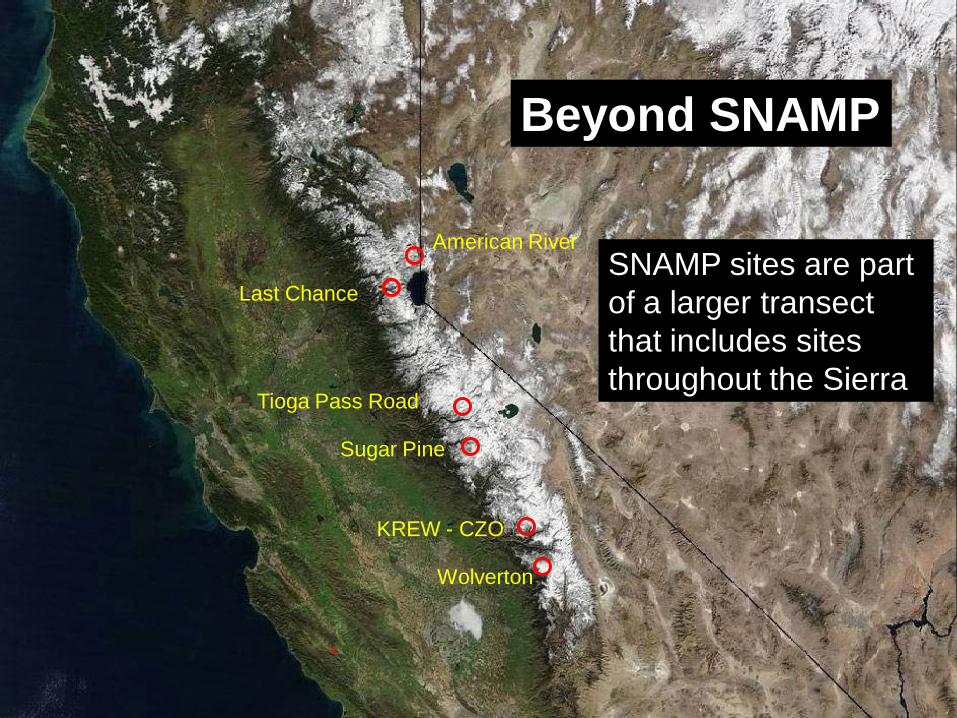
SNAMP sites are part of a larger transect that includes sites throughout the Sierra
Beyond SNAMP
Last Chance
American River
Tioga Pass Road
Sugar Pine
KREW - CZO
Wolverton

Snowpack loss & water storage: 30-yr horizon
Likely loss of ~3.5 MAF of snowpack storage in next 1-3 decades
Sacramento Valley storage San Joaquin Valley storage
snowpack annual storage
MAF: million acre feet Data from DWR

Influence of +3ºC on Snow vs Rain
Bales et al., 2006
Historical, 0 to -3oC
More rain, less snow Earlier snowmelt More winter floods
The water cycle in California’s mountains is undergoing long-term shifts.

California has a need for a modern, integrated
water information system
SNRI researchers are building prototype systems

lidar
A new generation of integrated measurements
eddy correlation
satellite snowcover
embedded sensor
networks
sap flow
isotopes & ions
low-cost sensors
sediment
discharge
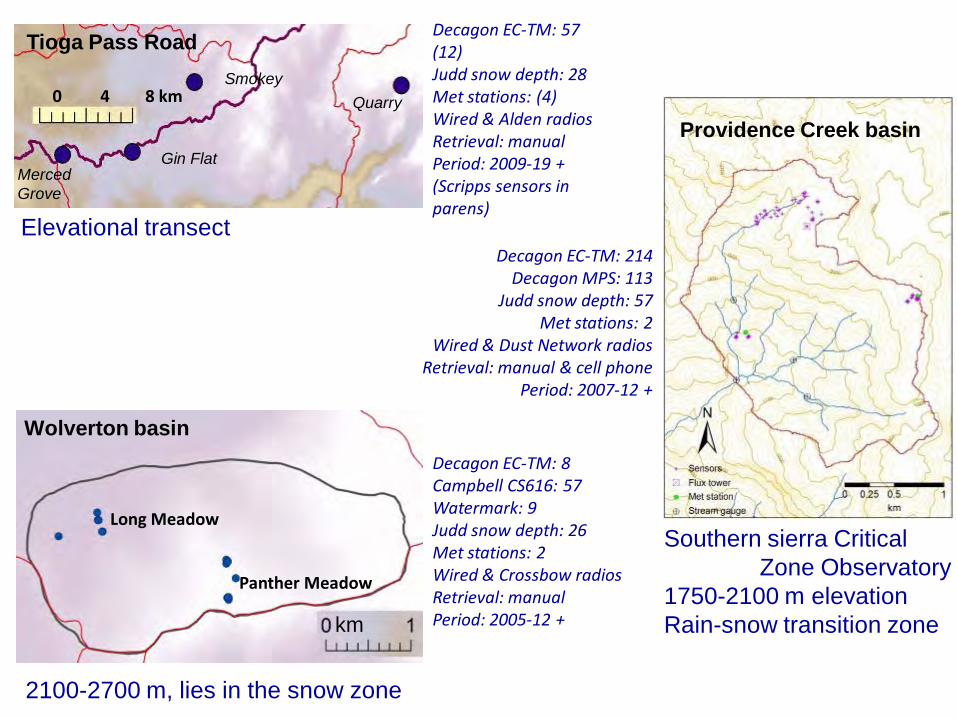
Decagon EC-TM: 8Campbell CS616: 57Watermark: 9Judd snow depth: 26Met stations: 2Wired & Crossbow radiosRetrieval: manualPeriod: 2005-12 +
Decagon EC-TM: 214Decagon MPS: 113
Judd snow depth: 57Met stations: 2
Wired & Dust Network radiosRetrieval: manual & cell phone
Period: 2007-12 +
Decagon EC-TM: 57 (12)Judd snow depth: 28Met stations: (4)Wired & Alden radiosRetrieval: manualPeriod: 2009-19 +(Scripps sensors in parens)
Southern sierra Critical Zone Observatory
1750-2100 m elevationRain-snow transition zone
Tioga Pass Road
0 4 8 km
Gin FlatMerced Grove
SmokeyQuarry
Providence Creek basin
Wolverton basin
Long Meadow
Panther Meadow
km
2100-2700 m, lies in the snow zone
Elevational transect
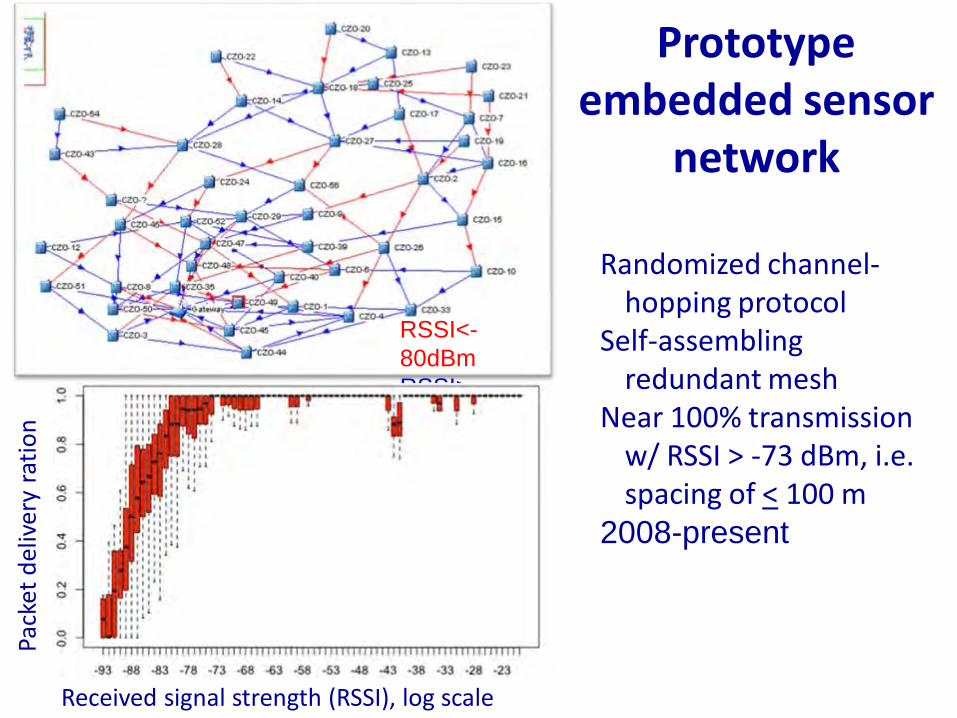
Prototype embedded sensor
network
RSSI<-80dBmRSSI>-80dBm
Randomized channel-hopping protocol
Self-assembling redundant mesh
Near 100% transmission w/ RSSI > -73 dBm, i.e. spacing of < 100 m
2008-present
Received signal strength (RSSI), log scale
Pack
et d
eliv
ery
ratio
n

Kings R.
San Joaquin R.
Kaweah R.
Fresno

Flux towers along an elevation gradient, 400-2700 m, extend the core CZO instrument cluster from water-limited to temperature-limited ecosystems
4 towers in place now, 3 more planned under NEON (2 co-located)

Water flux based on soil moisture vs. sap flow
Jan Hopmans, UCD
ET decreasing from 1 to 0.5 mm/d
ET decreasing towards 0.1 mm/d
Soil moisture & sap flux track each other

Decreasing temperatureIncreasing snow fractionDecreasing LAICoarser soils
Mean elevations for 8 catchments across the rain-snow transition
Climatic, physiographic & vegetation controls on water yield
Modeling in progress
Increase in water yield w/ elevation, from rain to snow dominated
C. Hunsaker et al., in preparation
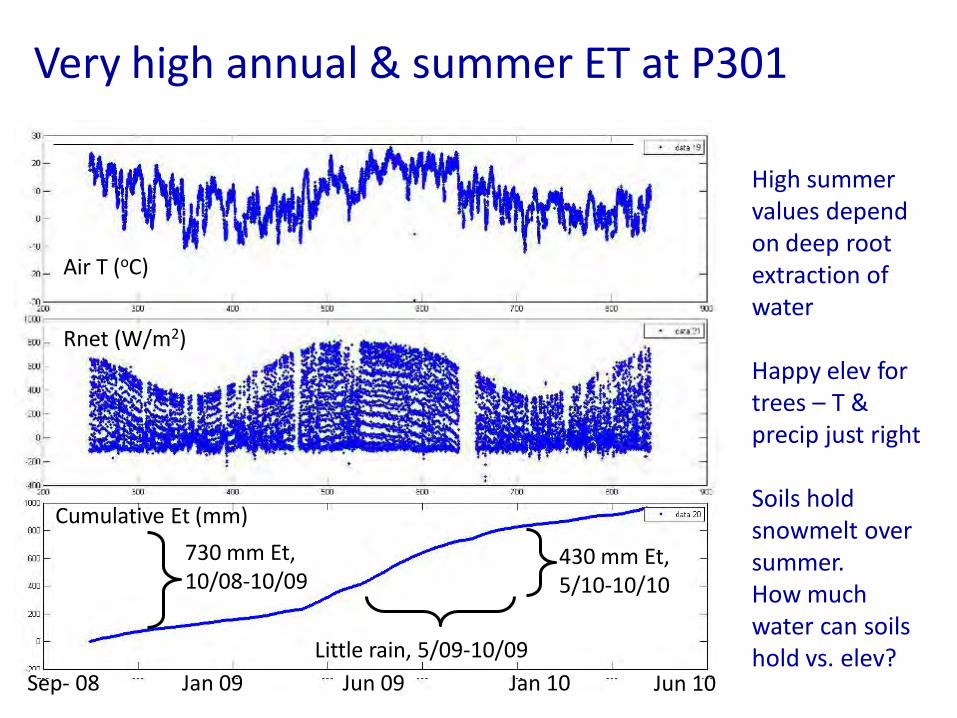
Cumulative Et (mm)
Rnet (W/m2)
Air T (oC)
Little rain, 5/09-10/09
430 mm Et, 5/10-10/10
730 mm Et, 10/08-10/09
Very high annual & summer ET at P301
High summer values depend on deep root extraction of water
Happy elev for trees – T & precip just right
Soils hold snowmelt over summer.How much water can soils hold vs. elev?
Jun 10Sep- 08 Jun 09 Jan 10Jan 09
Sierra Nevada Adaptive Management Projecthttp://snamp.cnr.berkeley.edu/
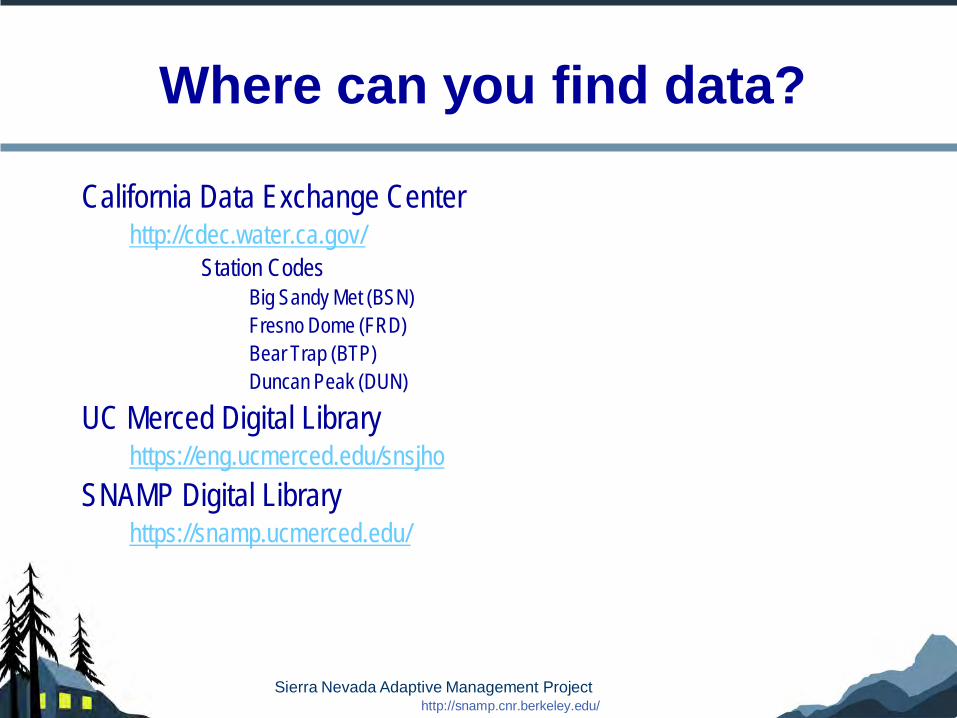
Where can you find data?
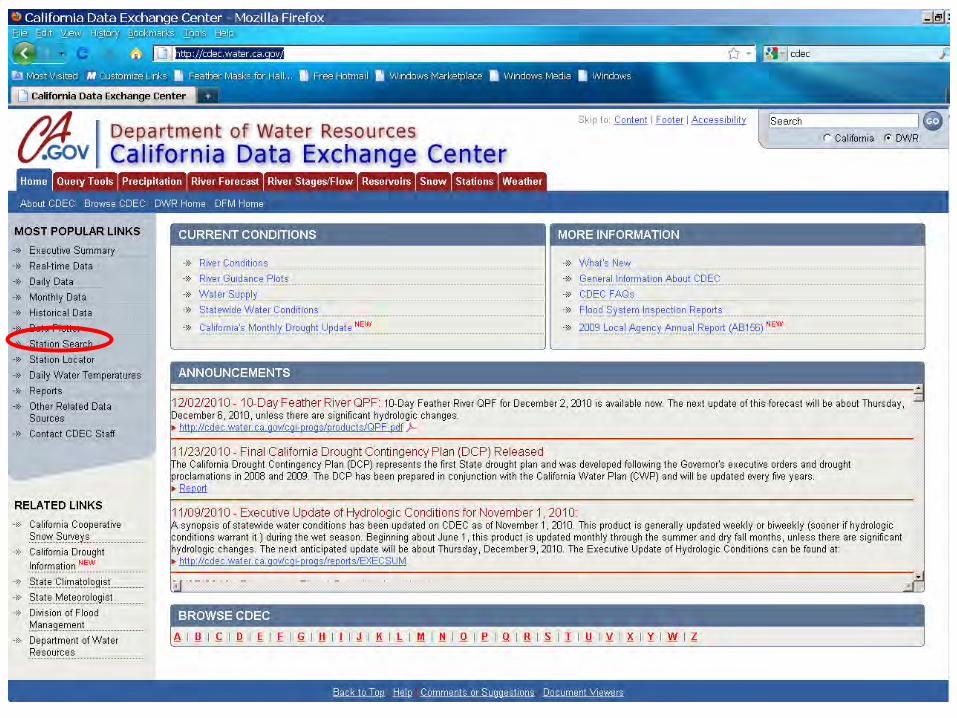
California Data Exchange Center http://cdec.water.ca.gov/
Station CodesBig Sandy Met (BSN)Fresno Dome (FRD)Bear Trap (BTP)Duncan Peak (DUN)
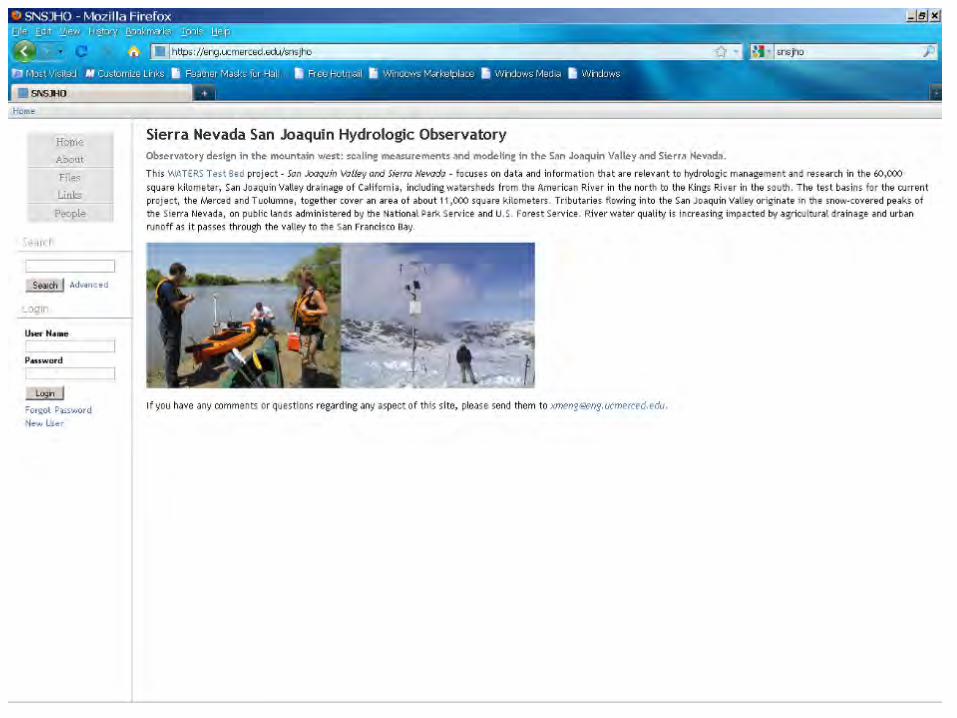
UC Merced Digital Libraryhttps://eng.ucmerced.edu/snsjho
SNAMP Digital Libraryhttps://snamp.ucmerced.edu/


Sierra Nevada Adaptive Management Projecthttp://snamp.cnr.berkeley.edu/
Data availability through digital library
Level 2 data from core field measurements made available by water year: snow, soil moisture, temperatures
Level 1 data available by request

Sierra Nevada Adaptive Management Projecthttp://snamp.cnr.berkeley.edu/
Contacts Roger Bales
[email protected](209) 228-4348
Martha [email protected](209) 228-4349
Patrick [email protected]
Sarah [email protected](559) 359-6252
Phil [email protected]