Hydrologic detection and finite element modeling of a slow ...fialko/papers/Labonte_JGR09.pdf ·...
13
Hydrologic detection and finite element modeling of a slow slip event in the Costa Rica prism toe Alison L. LaBonte, 1,2 Kevin M. Brown, 1 and Yuri Fialko 1 Received 16 May 2008; revised 11 December 2008; accepted 22 January 2009; published 9 April 2009. [1] We investigate transient fluid flux through the seafloor recorded near the Costa Rica trench during the 2000 Costa Rica Seismogenic Zone Experiment using a 2-D fully coupled poroelastic finite element model. We demonstrate that the observed hydrologic anomalies are consistent with a model of propagating slow slip at the subduction interface between the frontal prism and downgoing plate. There are two sources of volumetric strain that drive fluid flux at the seafloor in response to fault slip at depth: (1) compression and dilation in the vicinity of the tips of a slipping patch and (2) extension and compression due to flexure of the seafloor. The superposition of these two effects results in distinctive spatial and temporal patterns of fluid flow through the seafloor. In a forward modeling approach, time series from shear ruptures with a range of fault length-to-depth ratios in a heterogeneous crust are generated and compared with flow rate observations. Assuming a constant propagation rate and an elliptical profile for the distribution of slip along the decollement, the set of model predictions enables us to infer the probable rupture location, extent, propagation velocity, and duration from a single flow rate time series. The best fit model suggests that the slow slip event initiated within the toe at a depth of less than 4 km and propagated bilaterally at an average rate of 0.5 km d 1 . This interpretation implies that stress in the shallow subduction zone is relieved episodically. Furthermore, the Costa Rica data suggest that episodic slow slip events may initiate in the prism toe without being triggered by a seismic event further downdip. Citation: LaBonte, A. L., K. M. Brown, and Y. Fialko (2009), Hydrologic detection and finite element modeling of a slow slip event in the Costa Rica prism toe, J. Geophys. Res., 114, B00A02, doi:10.1029/2008JB005806. 1. Introduction [2] The subduction interface can generally be divided into zones of stable sliding updip and downdip of a seismogenic zone. During the interseismic phase of the earthquake cycle the seismogenic zone is usually locked but downdip and updip zones may experience steady or episodic creep. Recent land-based geodetic and seismic observations of episodic tremor and slip events downdip of the seismogenic zone [Dragert et al., 2001; Obara, 2002; Rogers and Dragert, 2003; Dragert et al., 2004] reveal the mechanical complexity of the ‘‘stable sliding’’ parts of the subduction fault. From the few offshore hydrologic obser- vations to date, there is evidence that transient deformation also occurs in the stable sliding updip subduction zone plate interface. Accurate characterization of transient events dur- ing the interseismic period, in particular these scarcely observed offshore events, is the focus of this study. With each deformation event stress is redistributed to neighboring sections of the plate interface. Knowledge of transients both updip and downdip of the seismogenic zone may help to understand the kinematics and mechanics of the seismo- genic zone. Inversions of GPS observations have indicated that the ‘‘stick-slip’’ (velocity weakening) zone is also not converging at the full plate velocity during the interseismic period [Norabuena et al., 2004; Schwartz and DeShon, 2007]. This partial geodetic locking suggests that some portion of strain from plate convergence must be accom- modated through aseismic slip during the interseismic period [e.g., Nishimura et al., 2000; Norabuena et al., 2004; Hasegawa et al., 2007; Schwartz and DeShon, 2007]. These uncertainties in the behavior of the different parts of the subduction zone, as well as interactions between the locked and creeping sections of the subduction interface clearly need to be addressed in order to assess earthquake and tsunami hazards [Wang and Hu, 2006; Wang and He, 2008]. [3] In the absence of offshore geodetic measurements to resolve deformation in the shallow subduction zone updip of the seismogenic section, hydrologic observations (e.g., measurements of pore pressure and fluid flow) provide unique means for characterizing and quantifying interseis- mic deformation. The volumetric strain that results from a deformation event, either seismogenic or aseismic, causes a change in pore pressure. Seafloor borehole observatories monitoring pore pressure in the Nankai prism off Japan recorded two anomalous pressure events coincident with very low frequency earthquakes in the shallow subduction JOURNAL OF GEOPHYSICAL RESEARCH, VOL. 114, B00A02, doi:10.1029/2008JB005806, 2009 Click Here for Full Articl e 1 Scripps Institution of Oceanography, La Jolla, California, USA. 2 Now at NEPTUNE Canada, University of Victoria, Victoria, British Columbia, Canada. Copyright 2009 by the American Geophysical Union. 0148-0227/09/2008JB005806$09.00 B00A02 1 of 13
Transcript of Hydrologic detection and finite element modeling of a slow ...fialko/papers/Labonte_JGR09.pdf ·...
Hydrologic detection and finite element modeling of a slow slip event
in the Costa Rica prism toe
Alison L. LaBonte,1,2 Kevin M. Brown,1 and Yuri Fialko1
Received 16 May 2008; revised 11 December 2008; accepted 22 January 2009; published 9 April 2009.
[1] We investigate transient fluid flux through the seafloor recorded near the Costa Ricatrench during the 2000 Costa Rica Seismogenic Zone Experiment using a 2-D fullycoupled poroelastic finite element model. We demonstrate that the observed hydrologicanomalies are consistent with a model of propagating slow slip at the subduction interfacebetween the frontal prism and downgoing plate. There are two sources of volumetricstrain that drive fluid flux at the seafloor in response to fault slip at depth: (1) compressionand dilation in the vicinity of the tips of a slipping patch and (2) extension and compressiondue to flexure of the seafloor. The superposition of these two effects results in distinctivespatial and temporal patterns of fluid flow through the seafloor. In a forward modelingapproach, time series from shear ruptures with a range of fault length-to-depth ratios in aheterogeneous crust are generated and compared with flow rate observations. Assuming aconstant propagation rate and an elliptical profile for the distribution of slip along thedecollement, the set of model predictions enables us to infer the probable rupture location,extent, propagation velocity, and duration from a single flow rate time series. The bestfit model suggests that the slow slip event initiated within the toe at a depth of less than4 km and propagated bilaterally at an average rate of 0.5 km d�1. This interpretationimplies that stress in the shallow subduction zone is relieved episodically. Furthermore,the Costa Rica data suggest that episodic slow slip events may initiate in the prism toewithout being triggered by a seismic event further downdip.
Citation: LaBonte, A. L., K. M. Brown, and Y. Fialko (2009), Hydrologic detection and finite element modeling of a slow slip event
in the Costa Rica prism toe, J. Geophys. Res., 114, B00A02, doi:10.1029/2008JB005806.
1. Introduction
[2] The subduction interface can generally be dividedinto zones of stable sliding updip and downdip of aseismogenic zone. During the interseismic phase of theearthquake cycle the seismogenic zone is usually lockedbut downdip and updip zones may experience steady orepisodic creep. Recent land-based geodetic and seismicobservations of episodic tremor and slip events downdipof the seismogenic zone [Dragert et al., 2001; Obara, 2002;Rogers and Dragert, 2003; Dragert et al., 2004] reveal themechanical complexity of the ‘‘stable sliding’’ parts of thesubduction fault. From the few offshore hydrologic obser-vations to date, there is evidence that transient deformationalso occurs in the stable sliding updip subduction zone plateinterface. Accurate characterization of transient events dur-ing the interseismic period, in particular these scarcelyobserved offshore events, is the focus of this study. Witheach deformation event stress is redistributed to neighboringsections of the plate interface. Knowledge of transients bothupdip and downdip of the seismogenic zone may help to
understand the kinematics and mechanics of the seismo-genic zone. Inversions of GPS observations have indicatedthat the ‘‘stick-slip’’ (velocity weakening) zone is also notconverging at the full plate velocity during the interseismicperiod [Norabuena et al., 2004; Schwartz and DeShon,2007]. This partial geodetic locking suggests that someportion of strain from plate convergence must be accom-modated through aseismic slip during the interseismicperiod [e.g., Nishimura et al., 2000; Norabuena et al.,2004; Hasegawa et al., 2007; Schwartz and DeShon,2007]. These uncertainties in the behavior of the differentparts of the subduction zone, as well as interactions betweenthe locked and creeping sections of the subduction interfaceclearly need to be addressed in order to assess earthquakeand tsunami hazards [Wang and Hu, 2006; Wang and He,2008].[3] In the absence of offshore geodetic measurements to
resolve deformation in the shallow subduction zone updipof the seismogenic section, hydrologic observations (e.g.,measurements of pore pressure and fluid flow) provideunique means for characterizing and quantifying interseis-mic deformation. The volumetric strain that results from adeformation event, either seismogenic or aseismic, causes achange in pore pressure. Seafloor borehole observatoriesmonitoring pore pressure in the Nankai prism off Japanrecorded two anomalous pressure events coincident withvery low frequency earthquakes in the shallow subduction
JOURNAL OF GEOPHYSICAL RESEARCH, VOL. 114, B00A02, doi:10.1029/2008JB005806, 2009ClickHere
for
FullArticle
1Scripps Institution of Oceanography, La Jolla, California, USA.2Now at NEPTUNE Canada, University of Victoria, Victoria, British
Columbia, Canada.
Copyright 2009 by the American Geophysical Union.0148-0227/09/2008JB005806$09.00
B00A02 1 of 13
zone off Cape Muroto (2003 event) and the Kii Peninsula(2004 event) [Obara and Ito, 2005; Davis et al., 2006;Ito and Obara, 2006; Davis et al., 2009]. These events,indicative of transient deformation updip of the seismogeniczone, were not preceded or accompanied by any ‘‘normal’’seismic activity, suggesting a mechanism exists that allows
for initiation of shallow slip transience without triggering bya deeper seismic event.[4] In 2003, borehole formation pressure gauges in Costa
Rica also recorded two transient events in the toe of theprism, �60 km offshore [Davis and Villinger, 2006]. Thelatter pressure transient occurred about 3 weeks after GPSinstruments at the Nicoya Peninsula detected initiation of adowndip propagating slow slip event [Protti et al., 2004].Davis and Villinger [2006] suggest the pressure transientmay have been a result of a slow slip event that propagatedupdip to the trench, mirroring the onshore propagation, andimply that the slip was bilaterally propagating. Screaton andGe [2007] modeled a propagating slow slip event to predictpore pressures at various borehole depths above and belowthe rupture plane and at different cross-strike distances.Their model prediction is consistent with fluid pressureobservations from a single site during the Costa Rica2003 transient event [Davis and Villinger, 2006], but atleast one additional measurement at a different cross-strikelocation above the fault is required to associate the observedsignals with a slow slip event, and to determine the directionof propagation.[5] Pore pressure gradients resulting from deformation
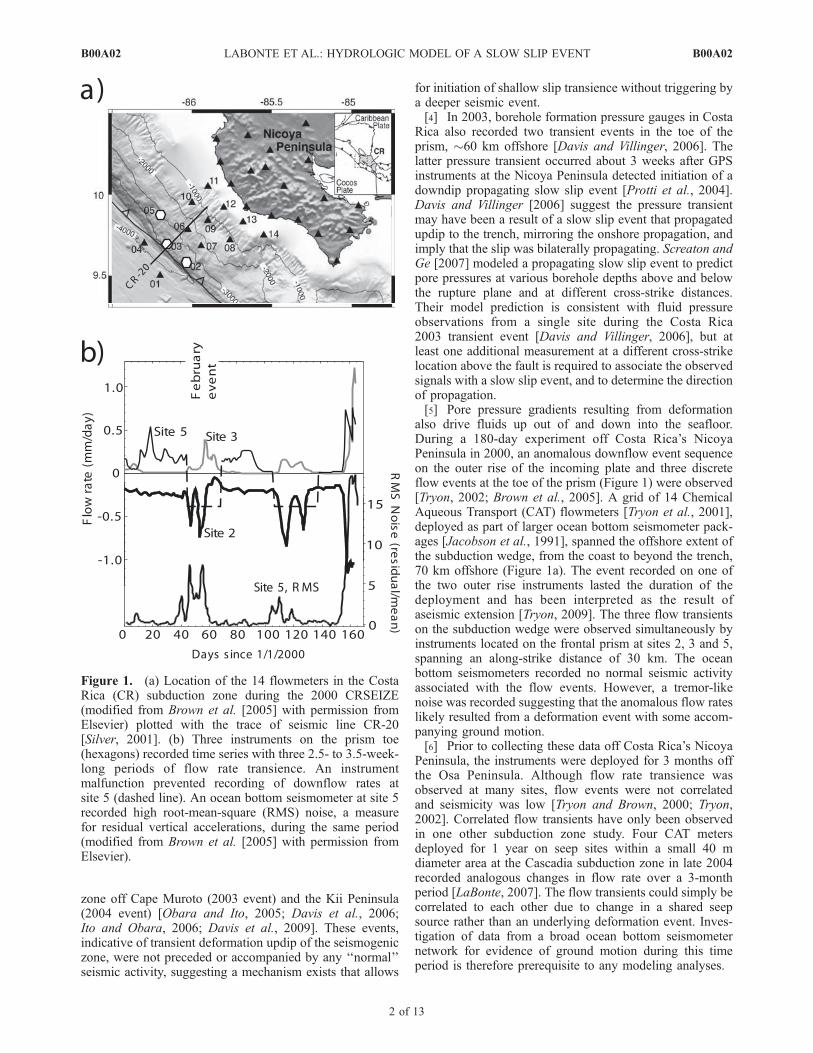
also drive fluids up out of and down into the seafloor.During a 180-day experiment off Costa Rica’s NicoyaPeninsula in 2000, an anomalous downflow event sequenceon the outer rise of the incoming plate and three discreteflow events at the toe of the prism (Figure 1) were observed[Tryon, 2002; Brown et al., 2005]. A grid of 14 ChemicalAqueous Transport (CAT) flowmeters [Tryon et al., 2001],deployed as part of larger ocean bottom seismometer pack-ages [Jacobson et al., 1991], spanned the offshore extent ofthe subduction wedge, from the coast to beyond the trench,70 km offshore (Figure 1a). The event recorded on one ofthe two outer rise instruments lasted the duration of thedeployment and has been interpreted as the result ofaseismic extension [Tryon, 2009]. The three flow transientson the subduction wedge were observed simultaneously byinstruments located on the frontal prism at sites 2, 3 and 5,spanning an along-strike distance of 30 km. The oceanbottom seismometers recorded no normal seismic activityassociated with the flow events. However, a tremor-likenoise was recorded suggesting that the anomalous flow rateslikely resulted from a deformation event with some accom-panying ground motion.[6] Prior to collecting these data off Costa Rica’s Nicoya
Peninsula, the instruments were deployed for 3 months offthe Osa Peninsula. Although flow rate transience wasobserved at many sites, flow events were not correlatedand seismicity was low [Tryon and Brown, 2000; Tryon,2002]. Correlated flow transients have only been observedin one other subduction zone study. Four CAT metersdeployed for 1 year on seep sites within a small 40 mdiameter area at the Cascadia subduction zone in late 2004recorded analogous changes in flow rate over a 3-monthperiod [LaBonte, 2007]. The flow transients could simply becorrelated to each other due to change in a shared seepsource rather than an underlying deformation event. Inves-tigation of data from a broad ocean bottom seismometernetwork for evidence of ground motion during this timeperiod is therefore prerequisite to any modeling analyses.
Figure 1. (a) Location of the 14 flowmeters in the CostaRica (CR) subduction zone during the 2000 CRSEIZE(modified from Brown et al. [2005] with permission fromElsevier) plotted with the trace of seismic line CR-20[Silver, 2001]. (b) Three instruments on the prism toe(hexagons) recorded time series with three 2.5- to 3.5-week-long periods of flow rate transience. An instrumentmalfunction prevented recording of downflow rates atsite 5 (dashed line). An ocean bottom seismometer at site 5recorded high root-mean-square (RMS) noise, a measurefor residual vertical accelerations, during the same period(modified from Brown et al. [2005] with permission fromElsevier).
B00A02 LABONTE ET AL.: HYDROLOGIC MODEL OF A SLOW SLIP EVENT
2 of 13
B00A02

[7] In this paper we perform a quantitative investigationof the deformation event that resulted in the February flowevent observed on the prism toe off Costa Rica’s NicoyaPeninsula (Figure 1). Interpretation of hydrologic or geo-detic records typically involves comparing the observationsto predictions of theoretical or numerical models [Roeloffs,1996; Jonsson et al., 2003; Fialko, 2004a; Screaton and Ge,2007]. In a similar approach, we develop a poroelasticmodel to simulate numerically the hydrologic response toinstantaneous (seismic) and slow (aseismic) slip on a fault,and predict pore pressure and flow rate at the seafloor. Wefirst gain a qualitative understanding of the interaction ofphysical mechanisms driving fluid flow through the seafloorboundary that renders unique seafloor flux patterns in bothspace and time; and then demonstrate that a single seafloorobservation in the cross-strike direction may be sufficient toidentify fault slip and infer its characteristics. In our casestudy, the poroelastic model predictions are used to quantifya probable set of slow slip parameters (e.g., location, extent,propagation velocity and duration) that best reproduces theflow rate time series recorded at the toe of the Costa Ricafore-arc prism.
2. The Poroelastic Model
[8] To predict seafloor flow rates in response to instanta-neous and slow slip deformation we used a commercialfinite element software package Abaqus. The use of a finiteelement model (FEM) allowed us to perform fully coupledporoelastic simulations using realistic fault and seafloorgeometries and spatially variable material properties. Thesubduction zone and the plate interface are assumed to beinfinite in the along-strike direction, z (Figure 2), and thegoverning equations with plane strain conditions were usedto relate strain and fluid mass content per unit volume tostress and pore pressure. These equations require a set offive independent poroelastic constants: two drained frame-work elastic moduli (the Poisson’s ratio, v, and the frame
bulk modulus, K), the fluid bulk modulus, Kf, the solid grainbulk modulus, Ks, and the porosity, n. The force equilibriumequations and a pressure diffusion equation derived fromthe laws of Darcy and fluid-mass conservation complete theset of governing equations [Biot, 1941; Rice and Cleary,1976; Roeloffs, 1996; Wang, 2000]. The FEM simulationsproduce displacement and pore pressure fields from whichflow rate through the seafloor boundary is calculated usingDarcy’s law:
q ¼ � k
m@p
@y; ð1Þ
where k is the permeability of the porous medium, m is theviscosity of the fluid, and @p/@y is the vertical pressuregradient driving the fluid flow (the background hydrostaticcomponent has been removed).
2.1. Model Geometry, Material Properties,and Boundary Conditions
[9] The model geometry of the Costa Rica subductionzone was based on seafloor bathymetry, the thickness of theslope sediments, and depth and dip of the decollement asinterpreted from seismic sections of the margin [Shipley etal., 1992; Christeson et al., 1999; Silver, 2001]. Theseafloor surface dips 5� toward the trench landward of thetrench, and 3� seaward of the trench (Figure 2). The wallsand bottom of the computational domain were placed�150 km from the fault surface to minimize any edgeeffects. A 0.5-km-thick sediment layer overlies the oceanicand fore-arc basement layer and linearly thickens landwardto over 2 km at the continental margin.[10] The poroelastic constants used in our simulations for
the basement rock and the sediment apron are summarizedin Table 1. The values for sediment and basement layersare mainly derived from in situ borehole measurements offormation pressure response to tidal loading and representformation properties over a scale of tens of meters. Weassigned both the subducting Cocos basement and theNicoya ophiolite complex that constitutes the prism thesame ‘‘basement’’ material properties because surface flowrates are primarily dependent on properties of the much lesspermeable overlying sediment layer. A sensitivity analysisconfirmed that surface flow rates are largely insensitive todifferences in the basement material properties. Instead, theamplitude of flow rate through the seafloor is only sensitiveto the material properties of the upper several meters ofsediment that are able to drain over the duration of the slipevent. Since the very near surface (<1 m depth) sedimentpermeability and elastic moduli are not well constrained, theprimary intent of this study is to explore the cause for theunique temporal pattern in flow rate which is insensitiveto the surface material properties.[11] The surface along which the presumed slip events
occur dips 10� landward, an average of the steepening dipangle of the decollement between the toe and the coastline.Use of a constant dip angle to represent the fault planeensures self-similarity of model predictions at any spatialscale so the model results can be scaled to represent thegeometry of a specific site. The fault is modeled as a highlysheared elastic band, i.e., displacement of the hanging wallrelative to the footwall is accommodated within a 10 m
Figure 2. Cross section of the Costa Rica subduction zonelayered model geometry. Displacement occurs on themodeled rupture plane, a simplified representation of thesteepening decollement. The largest modeled rupture lengthillustrated here extends from near the trench axis to thedowndip limit of the seismogenic zone [Schwartz andDeShon, 2007] and has an average depth, d, and horizontalrupture length, Lx.
B00A02 LABONTE ET AL.: HYDROLOGIC MODEL OF A SLOW SLIP EVENT
3 of 13
B00A02

thick fault zone. This representation of fault slip was chosento ensure mesh continuity and allow fluid flow across theslip interface. A set of FEM geometries was generated inorder to characterize surface fluid velocities for a range offaults with different fault length-to-depth ratios, Lx/d, whereLx is the horizontal component of fault length and d is theaverage depth of the fault beneath the seafloor (Figure 2).[12] The modeled fault has the same permeability as the
host material. Analytical models of edge dislocations onpermeable (p = 0) and impermeable (@p/@y = 0) dislocationplanes demonstrate that the pore pressure fields for thesetwo end-member cases are essentially identical at twodiffusion lengths above the fault [Rudnicki, 1986]. Diffu-sion length, 2
ffiffiffiffict
p, is the characteristic length the pressure
wavefront will travel in a specified time, t, through a mediawith hydraulic diffusivity, c:
c ¼ k
mS; ð2Þ
where S is the one-dimensional storage compressibility.Therefore, the permeability of the fault in our models isinsignificant as long as the depth of the fault is greater than4
ffiffiffiffict
p. This equates to a minimum fault depth of 135 m in
sediment for the February Costa Rica event with an esti-mated maximum duration of 3.5 weeks (Figure 1b).[13] The pore pressure (relative to hydrostatic) is initially
set to zero throughout the computational domain. The wallsand bottom of the finite element mesh are assumed to havezero displacements and be impermeable to flow. The top ofthe mesh (representing the seafloor) is a stress-free bound-ary with a null pore pressure boundary condition (p = 0),and is permeable to flow.
2.2. FEM Analysis
[14] The fully coupled poroelastic FEM simulations con-sist of a deformation step in which displacement is appliedand the resulting anomalous fluid pressure begins to drivefluid diffusion, and a relaxation step in which pore fluidscontinue to diffuse as the pressure field equilibrates. We usean adaptive time stepping scheme that ensures numericalconvergence for both the deformation and fluid flow partsof the problem. Displacement, pore pressure, and fluid
velocity fields are calculated at each iteration in time. Ofprimary relevance in this study is the vertical component offluid velocity at the seafloor through time and space.[15] In instantaneous slip simulations, the initial defor-
mation step is 10�6 s in duration. Flow rate predictions aremade in the relaxation step after a sufficient time in order toexclude any dynamic processes and avoid numerical errors.Numerical oscillations can occur at early times at theseafloor boundary because the imposed null pore pressureboundary condition creates an infinitely steep pore pressuregradient immediately after deformation initiates. By using aseafloor surface element size of 0.01 m and graduallyincreasing the element size away from the surface, flowrates can be resolved at very early times.[16] In propagating slow slip simulations the displace-
ment boundary condition, which varies in time as the lengthof the slipping patch increases, is linearly applied over theduration of the deformation step. Surface flow rate iscalculated at each of 100 evenly spaced iterations resultingin a flow rate time series for each surface element. This isnecessary in order to resolve variations in surface flow rateas a result of temporally and spatially variable fault slip. Therelaxation step is several years long and iterations are moreclosely spaced at the beginning of the step when porepressures are changing more rapidly.
2.3. Methods
[17] The boundary condition applied in the deformationstep is the along-fault displacement distribution, D, thatmimics the constant stress drop on a fault in an unboundedhomogeneous elastic medium [Lawn, 1993; Fialko, 2004b,2007],
D ¼b
ffiffiffiffiffiffiffiffiffiffiffiffiffiffiffiffiffiffiLx2
� �2�x2q
Lx2
; ð3Þ
for
xj j � Lx
2; ð4Þ
where b is the maximum displacement, taken to be positivefor thrust motion, and x is the coordinate of the middle of
Table 1. Poroelastic Material Parameters for Costa Ricaa
Material Properties Parameter Sediment Basement
Poisson’s ratio v 0.10 (WD; DV) 0.30 (DV)Frame bulk modulus (Pa) K 2.5 108 (DV) 7.7 109 (DV)Grain bulk modulus (Pa) Ks 5.0 1010 (DV) 5.0 1010 (DV)Fluid bulk modulus (Pa) Kf 2.4 109 (DV) 2.4 109 (DV)Permeability (m2) k 10�15 (BD, S, DV) 10�13 (D, DV)Porosity n 0.6 (K, B, DV) 0.1 (DV)Shear modulus (Pa) G 2.7 108 3.6 109
1-D loading efficiency g 0.86 (DV) 0.58 (DV)1-D hydraulic diffusivity (m2 s�1) c 5.2 10�4 0.851-D storage compressibility (Pa�1) S 1.9 10�9 1.1 10�10
Dynamic viscosity (Pa s) m 10�3 10�3
aDV, Davis and Villinger [2006]; WD, Wang and Davis [1996]; BD, Becker and Davis [2004]; S, Spinelli et al. [2004];D, Davis et al. [2000]; K, Kimura et al. [1997]; B, Bolton et al. [2001]. Parameters (v, K, Ks, Kf , k, n, and m) comprise acomplete set of poroelastic constants from which others can be derived.
B00A02 LABONTE ET AL.: HYDROLOGIC MODEL OF A SLOW SLIP EVENT
4 of 13
B00A02

the slipping patch. Given that the origin x = 0 is assumed atthe trench axis (Figure 2), the following relationship holds:
For instantaneous slip x ¼ x� xu �Lx
2;
For propagating slip x ¼ j x� xið Þ � Lx
2;
For downdip propagation j ¼ 1;For updip propagation j ¼ �1;
ð5Þ
where xu is the updip limit of the slipping patch in theinstantaneous slip case and xi is the slip nucleation site inthe propagating slip cases (Figure 3). In the presence of astress-free seafloor boundary or heterogeneities in the oceancrust [e.g., Masterlark, 2003] the stress drop correspondingto slip distribution (3) is nonconstant. However, the resul-tant differences in the predicted flow rate patterns at theseafloor are of second order. Lacking constraints on theactual stress drop or slip distribution, we use equation (3) inall simulations.[18] For slow slip simulations, the horizontal length of the
rupture, L, and the maximum slip, b, vary as a function oftime (Figure 3) for dimensionless propagation time tp < 1,i.e., times, t, less than the duration of the slow slip event, tf:
Lx tð Þ ¼ Vxt; ð6Þ
b tð Þ ¼ bf tp; ð7Þ
tp ¼t
tf¼ Vxt
Lfx; ð8Þ
where Vx is the horizontal component of the velocity of thepropagating rupture tip; bf is the final slip magnitude; and
Lfx is the horizontal component of the rupture length at thetermination of the slow slip propagation, tp = 1.[19] Simulations were performed for four instantaneous
slip and four slow slip scenarios with a range of fault length-to-depth ratios, 0.5 > Lx/d > 6 and 3 > Lfx/d > 6, respec-tively. Depth, d, in the slow slip models is the average depthof the entire fault length at the termination of the event. Thefault in all model geometries was centered at a horizontaldistance of 37 km from the toe, which corresponds to anaverage depth, d, of 10 km. The maximum rupture length(cross-strike) of 60 km was chosen to be consistent with thedowndip limit of seismogenic rupture (Figure 2).
3. Results
[20] Volumetric strain from flexure of the free boundarysurface and compression and dilation at the tips of a buriedshear rupture cause distinct spatial and temporal variationsof pore pressure and flow rate at the surface. We firstpresent the results from the instantaneous slip FEM simu-lations and illustrate how the spatial variation in seafloorflux is highly sensitive to the rupture location and extent.Simulated time series from propagating slow slip rupturesare then shown to be highly sensitive to the velocity andduration of propagation as well as location and extent. Inour case study, we find the propagating slow slip modelparameters that best reproduce the flow rate records ob-served at two different along-strike locations near the CostaRica trench axis.
3.1. Instantaneous Slip Model Predictions
[21] Figure 4 shows model predictions of the cross-strikevariation in flow rate for faults with different Lx/d, inlayered models and a homogeneous sediment model. Post-seismic flow rate predictions were made at t = 10 s. Thedecay in surface fluid flux following a sudden change inpore pressure is analogous to the decay in heat flux throughthe surface of a half-space following an instantaneouschange in temperature throughout the half-space [Carslawand Jaeger, 1959; Turcotte and Schubert, 2002]:
q / 1ffiffiffiffict
p : ð9Þ
This relationship holds for times prior to the arrival of thepressure source originating at depth (e.g., at the rupture tip)to the model surface, or the early postseismic period. There-fore, predictions made at a single timewithin this period (e.g.,t = 10 s) are representative of the cross-strike flow ratevariation throughout the early postseismic period.[22] In addition to time, vertical flow rates, q, can be
nondimensionalized for slip magnitude, fault depth, andsurface ‘‘sediment’’ layer material parameters using naturalscales to yield the dimensionless flow rate, q:
q ¼ qmd
ffiffiffiffict
p
kgGb: ð10Þ
Loading efficiency, g, and shear modulus, G, are materialparameters (Table 1) relate the change in stress in the poroelastic
Figure 3. Schematic of displacement distribution, D(x,t),for the duration (dimensionless propagation time of 0 < tp <1) of a slow slip event propagating downdip (j = 1) or updip(j = �1) at velocity Vx. The term b(t) is the maximum slipdisplacement over the horizontal rupture length, Lx(t). Theparameters bf and Lfx are the final slip displacement andrupture length values, respectively, once propagation hasceased (tp = 1). The x axis is shifted so rupture initiationlocation, xi, plots at the origin. The x coordinate labels,indicating position relative to the center of the slipped patch,are shown for tp = 0.2.
B00A02 LABONTE ET AL.: HYDROLOGIC MODEL OF A SLOW SLIP EVENT
5 of 13
B00A02

material to strain and pore pressure [Rice and Cleary, 1976;Rudnicki, 1987; Wang, 2000]. For example, a greater load-ing efficiency means that pressure from loading the porousmatrix is transferredmore effectively to interstitial porewaters,which drives the pore pressure up higher and results in agreater flow rate than is generated through loading a matrixwith smaller loading efficiency. The minimal sensitivity todifferences in basement layer material properties is evidencedin the comparison of the layered model to an extreme, homo-geneous sediment model (Figure 4, Lx/d = 6).[23] The coseismic pore pressure field and seafloor flow
rates are a result of local volumetric strain from (1) lobes ofcompression and dilation that result from fault slip and (2)flexure of the stress-free seafloor boundary. These twocontributors to volumetric strain result in a unique cross-strike flow rate pattern for each fault length-to-depth ratioLx/d (Figure 4) in the modeled Costa Rica geometry. Ifdisplacement at the seafloor were prohibited, the flow ratepattern at the seafloor in response to slip on a buried faultwould be a single peak in upflow velocity above thecompressional lobe (labeled CL in the pore pressure field,p(x,y), shown in Figure 5), and a peak in downflow velocityabove the dilational lobe (DL). In the near field (e.g., Lx/d =6 in Figure 5b), compressional and dilational lobes aredirectly above the updip and downdip rupture tips, respec-tively, whereas in the far field (e.g., Lx/d = 0.5 in Figure 5a),the respective lobes are further apart and outward from therupture tips.[24] Because the seafloor is a deformable stress-free
boundary, a more complicated flow rate pattern results fromthe additional contribution of seafloor flexure to volumetricstrain. The effect of seafloor flexure is illustrated in Figure 5with a vertically exaggerated deformed seafloor along withvectors that represent vertical flow rate through the seafloor.In both near-field and far-field cases, extensional flexure
(EF) drives downward fluid flow above the updip rupturetip and compressional flexure (CF) drives upward fluid flowabove the downdip rupture tip. For ‘‘near-field’’ thrust faults(Lx/d � 3), extensional flexure and the compressional lobedirectly line up above the updip rupture tip. The superpo-sition of these two opposing effects results in a ‘‘dimpled’’or ‘‘double’’ upflow peak above the updip rupture tip. Abroader, but similar, double downflow peak occurs wherecompressional flexure and the dilatational lobe line upabove the downdip rupture tip (Figure 5b). For ‘‘far-field’’ruptures (Lx/d < 3), the compressional and dilatational lobesare located sufficiently outward from the rupture tips.Therefore, only a single peak in flow rate, with a directioncontrolled by the flexure effect, occurs over the rupture tips(Figure 5a).
3.2. Transient Slow Slip Model Predictions
[25] Figure 6 shows snapshots in time of the cross-strikevariation of vertical flow rates through the seafloor inFigure 4. Instantaneous slip FEM predictions for layered
(basement and sediment) and homogeneous sediment (thingreen line) simulations. Colored bars indicate rupture extentfor each fault Lx/d, where Lx is horizontal fault length and dis average depth to the fault. Dimensionless flow rate, q, isplotted on the primary y axis. The parameter qCAT, plottedon the secondary y axis, is an average the first 16 h of thepostseismic flow rate through Costa Rica sediment (Table 1).
Figure 5. Response to an instantaneous slip thrust eventcentered at 37 km from the trench axis and 10 km depthwith displacement b = 1.1 m in Costa Rica layered materialgeometry (Figure 2 and Table 1) evaluated at t = 10 s.Extensional and compressional flexure (EF and CF) ofthe seafloor (plotted with vertical exaggeration) effect thevertical flow rate, q (vertical red vectors), through theseafloor. Lobes of compression and dilation (CL and DL)extending out from the rupture as seen in the pore pres-sure field, p(x,y), also effect q. Superposition of these twoeffects result in characteristic differences of cross-strike flowrate patterns for (a) far-field (Lx/d = 0.5) and (b) near-field(Lx /d = 6) ruptures.
B00A02 LABONTE ET AL.: HYDROLOGIC MODEL OF A SLOW SLIP EVENT
6 of 13
B00A02
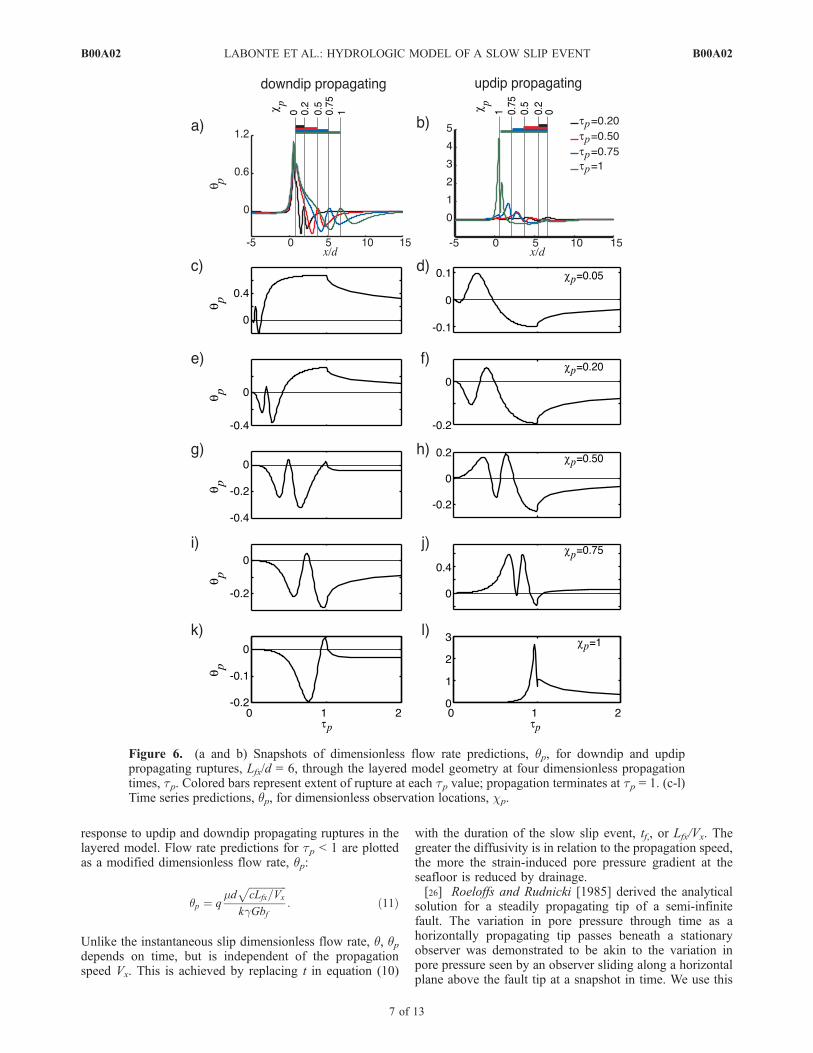
response to updip and downdip propagating ruptures in thelayered model. Flow rate predictions for tp < 1 are plottedas a modified dimensionless flow rate, qp:
qp ¼ qmd
ffiffiffiffiffiffiffiffiffiffiffiffiffiffifficLfx=Vx
pkgGbf
: ð11Þ
Unlike the instantaneous slip dimensionless flow rate, q, qpdepends on time, but is independent of the propagationspeed Vx. This is achieved by replacing t in equation (10)
with the duration of the slow slip event, tf,, or Lfx/Vx. Thegreater the diffusivity is in relation to the propagation speed,the more the strain-induced pore pressure gradient at theseafloor is reduced by drainage.[26] Roeloffs and Rudnicki [1985] derived the analytical
solution for a steadily propagating tip of a semi-infinitefault. The variation in pore pressure through time as ahorizontally propagating tip passes beneath a stationaryobserver was demonstrated to be akin to the variation inpore pressure seen by an observer sliding along a horizontalplane above the fault tip at a snapshot in time. We use this
Figure 6. (a and b) Snapshots of dimensionless flow rate predictions, qp, for downdip and updippropagating ruptures, Lfx/d = 6, through the layered model geometry at four dimensionless propagationtimes, tp. Colored bars represent extent of rupture at each tp value; propagation terminates at tp = 1. (c-l)Time series predictions, qp, for dimensionless observation locations, cp.
B00A02 LABONTE ET AL.: HYDROLOGIC MODEL OF A SLOW SLIP EVENT
7 of 13
B00A02
same convolution concept for a finite rupture to illustratethat a time series will depend on the observation location,xobs, with respect to the location of initiation, xi, andtermination, xt, of the propagating rupture, in particular,on the dimensionless observation location, cp:
cp ¼xobs � xi
xt � xi: ð12Þ
[27] The time series recorded at an observation pointlocated anywhere above the final fault length (0 < cp < 1)is similar to the variation in flow rate recorded by anobserver that moves along the seafloor from a finite distancebefore xt, passes over the rupture tip, and stops over the faultthe same distance before xi. As the observer never passesover the slip initiation location, the time series is primarilythe signature of extensional flexure and the compressionallobe for an updip propagating slip, and compressionalflexure and the dilational lobe for a downdip propagatingslip. Hence, like the spatial plots (Figures 6a and 6b), timeseries plots (Figures 6c–6l) display the characteristic doublepeak (or a fraction of the double peak for cp values close to0 and 1): double downflow peaks for downdip propagatingruptures and double upflow peaks for updip propagatingruptures. Just like instantaneous slip predictions are depen-dent on Lx/d (Figure 4), snapshots in time during the slowslip simulation (Figures 6a and 6b) are dependent on thefault Lfx/d. Modeled slow slip time series are thereforesensitive to both the observation location cp , and the faultgeometry Lfx/d.
3.3. Constraining Location and Timingof Costa Rica Event
[28] In the following case study, we constrain ruptureparameters for a suspected slow slip event that occurred inFebruary 2000 on the Costa Rica prism toe (Figure 1b).
During this period, three CAT meters spanning a 30-kmalong-strike distance simultaneously recorded anomalousflow rates. We assume that the rupture occurred on themodeled decollement. Since our numerical models corre-spond to 2-D plane strain conditions, we independentlyquantify characteristics of the propagating slow slip ruptureat along-strike observation sites 2 and 3 (15 km apart). Thisallows us to investigate possible along-strike variations inthe rupture process. The incomplete record due to instru-ment malfunction at site 5 prevented characterization of therupture at this third along-strike location.[29] The flow rate time series observed at site 2 and the
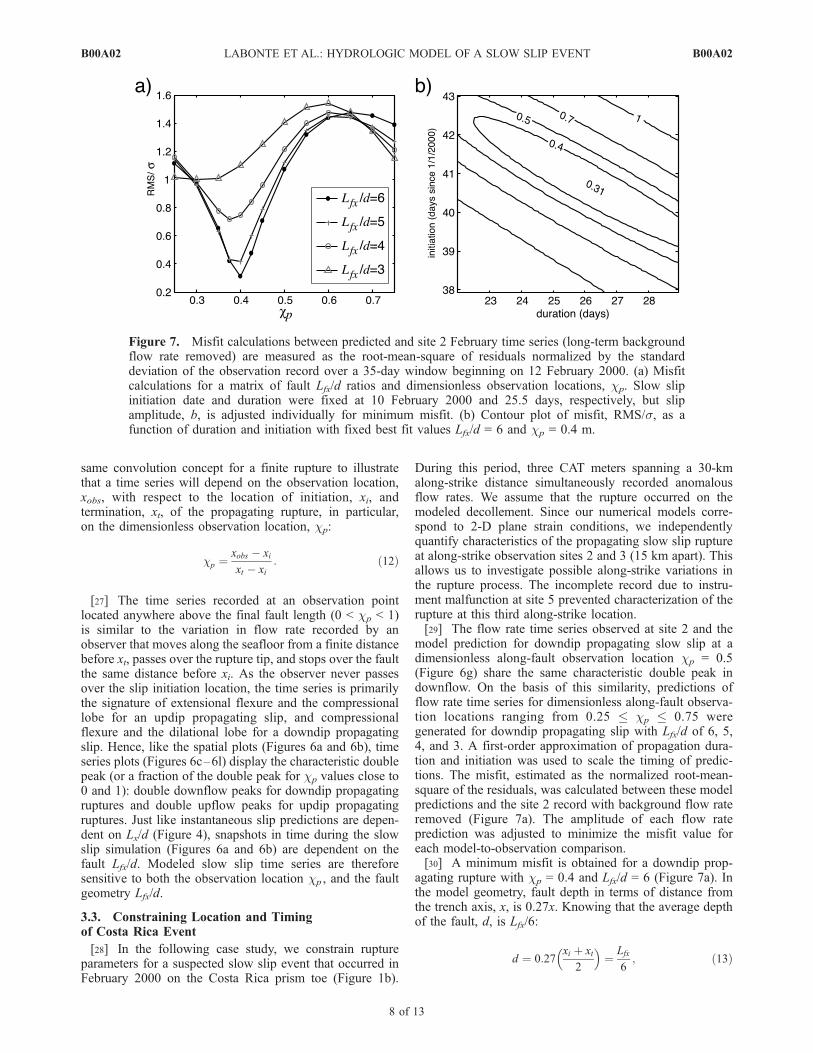
model prediction for downdip propagating slow slip at adimensionless along-fault observation location cp = 0.5(Figure 6g) share the same characteristic double peak indownflow. On the basis of this similarity, predictions offlow rate time series for dimensionless along-fault observa-tion locations ranging from 0.25 � cp � 0.75 weregenerated for downdip propagating slip with Lfx/d of 6, 5,4, and 3. A first-order approximation of propagation dura-tion and initiation was used to scale the timing of predic-tions. The misfit, estimated as the normalized root-mean-square of the residuals, was calculated between these modelpredictions and the site 2 record with background flow rateremoved (Figure 7a). The amplitude of each flow rateprediction was adjusted to minimize the misfit value foreach model-to-observation comparison.[30] A minimum misfit is obtained for a downdip prop-
agating rupture with cp = 0.4 and Lfx/d = 6 (Figure 7a). Inthe model geometry, fault depth in terms of distance fromthe trench axis, x, is 0.27x. Knowing that the average depthof the fault, d, is Lfx/6:
d ¼ 0:27xi þ xt
2
� �¼ Lfx
6; ð13Þ
Figure 7. Misfit calculations between predicted and site 2 February time series (long-term backgroundflow rate removed) are measured as the root-mean-square of residuals normalized by the standarddeviation of the observation record over a 35-day window beginning on 12 February 2000. (a) Misfitcalculations for a matrix of fault Lfx/d ratios and dimensionless observation locations, cp. Slow slipinitiation date and duration were fixed at 10 February 2000 and 25.5 days, respectively, but slipamplitude, b, is adjusted individually for minimum misfit. (b) Contour plot of misfit, RMS/s, as afunction of duration and initiation with fixed best fit values Lfx/d = 6 and cp = 0.4 m.
B00A02 LABONTE ET AL.: HYDROLOGIC MODEL OF A SLOW SLIP EVENT
8 of 13
B00A02
we find the relationship of xi to Lfx through substitution of xt(for downdip propagation) and reduction:
xt ¼ xi þ Lfx;
xi ¼1
0:27
Lfx
6� Lfx
2¼ 0:12Lfx:
ð14Þ
We can now solve for horizontal fault length, Lfx, andinitiation location, xi, knowing that site 2, located 6.3 kmlandward from the trench, corresponds to a cp of 0.40:
cp ¼6:3 km� xi
Lfx¼ 0:40;
0:40Lfx þ 0:12Lfx ¼ 6:3 km;Lfx ¼ 12:2 km; xi ¼ 1:4 km
ð15Þ
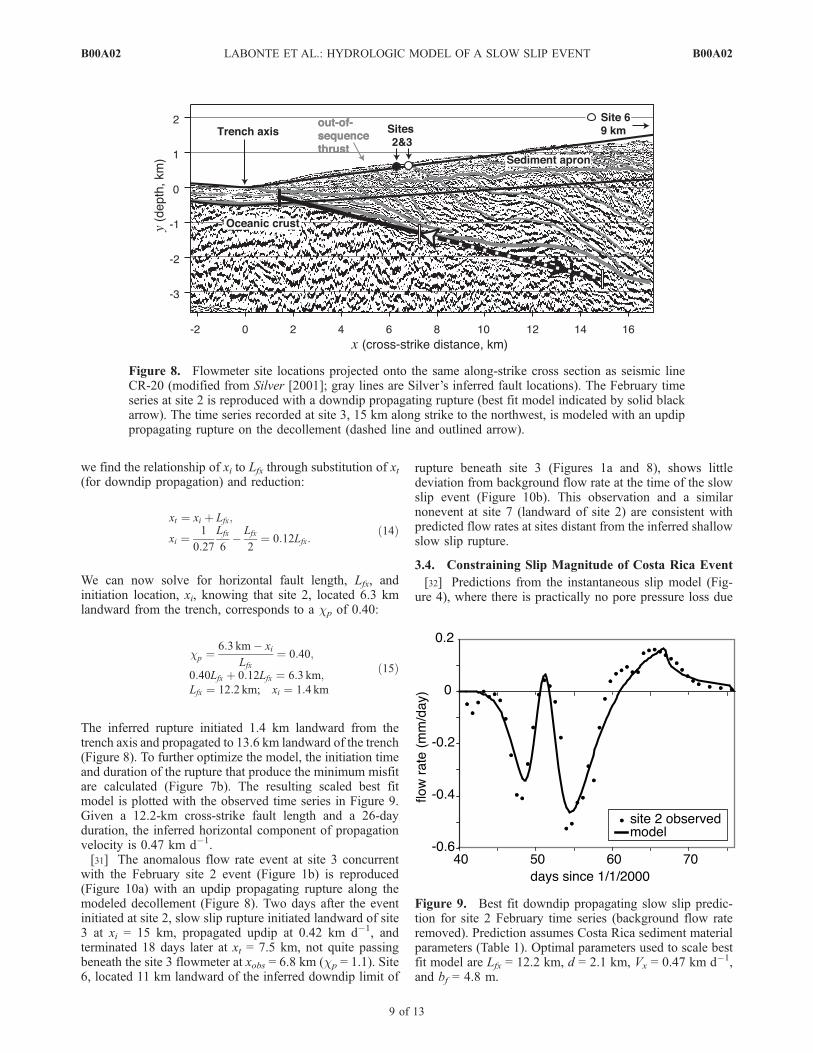
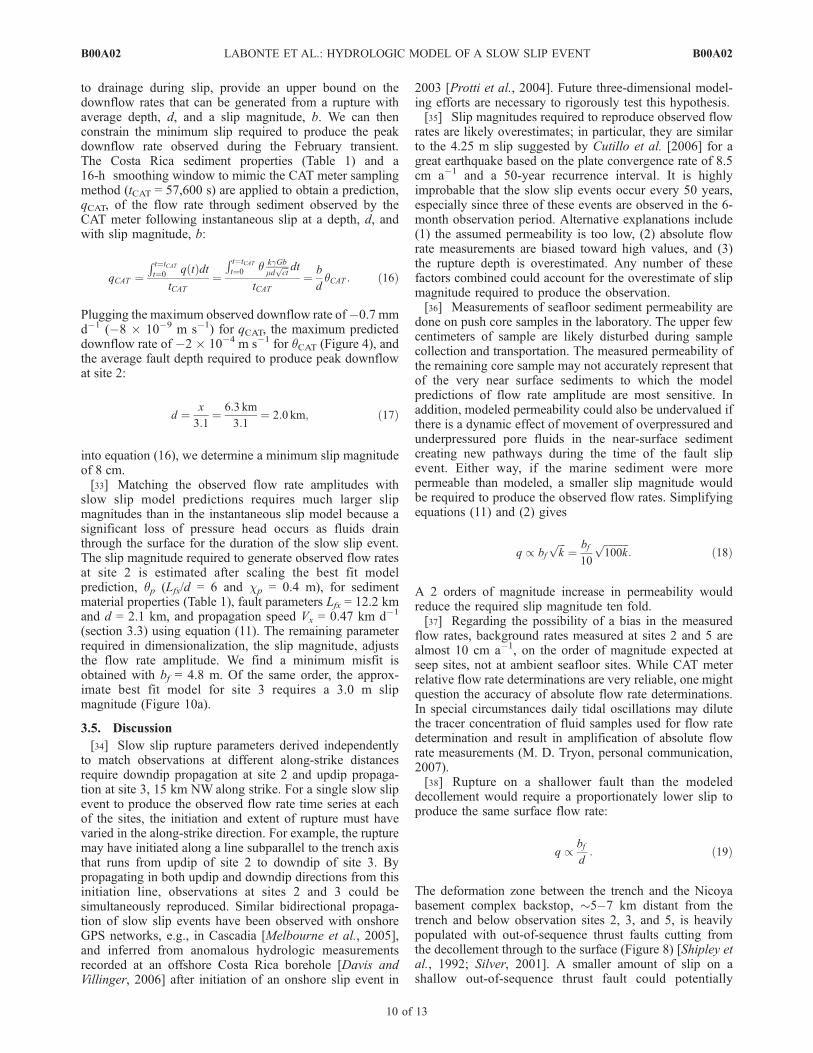
The inferred rupture initiated 1.4 km landward from thetrench axis and propagated to 13.6 km landward of the trench(Figure 8). To further optimize the model, the initiation timeand duration of the rupture that produce the minimum misfitare calculated (Figure 7b). The resulting scaled best fitmodel is plotted with the observed time series in Figure 9.Given a 12.2-km cross-strike fault length and a 26-dayduration, the inferred horizontal component of propagationvelocity is 0.47 km d�1.[31] The anomalous flow rate event at site 3 concurrent
with the February site 2 event (Figure 1b) is reproduced(Figure 10a) with an updip propagating rupture along themodeled decollement (Figure 8). Two days after the eventinitiated at site 2, slow slip rupture initiated landward of site3 at xi = 15 km, propagated updip at 0.42 km d�1, andterminated 18 days later at xt = 7.5 km, not quite passingbeneath the site 3 flowmeter at xobs = 6.8 km (cp = 1.1). Site6, located 11 km landward of the inferred downdip limit of
rupture beneath site 3 (Figures 1a and 8), shows littledeviation from background flow rate at the time of the slowslip event (Figure 10b). This observation and a similarnonevent at site 7 (landward of site 2) are consistent withpredicted flow rates at sites distant from the inferred shallowslow slip rupture.
3.4. Constraining Slip Magnitude of Costa Rica Event
[32] Predictions from the instantaneous slip model (Fig-ure 4), where there is practically no pore pressure loss due
Figure 8. Flowmeter site locations projected onto the same along-strike cross section as seismic lineCR-20 (modified from Silver [2001]; gray lines are Silver’s inferred fault locations). The February timeseries at site 2 is reproduced with a downdip propagating rupture (best fit model indicated by solid blackarrow). The time series recorded at site 3, 15 km along strike to the northwest, is modeled with an updippropagating rupture on the decollement (dashed line and outlined arrow).
Figure 9. Best fit downdip propagating slow slip predic-tion for site 2 February time series (background flow rateremoved). Prediction assumes Costa Rica sediment materialparameters (Table 1). Optimal parameters used to scale bestfit model are Lfx = 12.2 km, d = 2.1 km, Vx = 0.47 km d�1,and bf = 4.8 m.
B00A02 LABONTE ET AL.: HYDROLOGIC MODEL OF A SLOW SLIP EVENT
9 of 13
B00A02
to drainage during slip, provide an upper bound on thedownflow rates that can be generated from a rupture withaverage depth, d, and a slip magnitude, b. We can thenconstrain the minimum slip required to produce the peakdownflow rate observed during the February transient.The Costa Rica sediment properties (Table 1) and a16-h smoothing window to mimic the CAT meter samplingmethod (tCAT = 57,600 s) are applied to obtain a prediction,qCAT, of the flow rate through sediment observed by theCAT meter following instantaneous slip at a depth, d, andwith slip magnitude, b:
qCAT ¼R t¼tCATt¼0
q tð ÞdttCAT
¼
R t¼tCATt¼0
q kgGbmd
ffiffiffict
p dt
tCAT¼ b
dqCAT : ð16Þ
Plugging the maximum observed downflow rate of�0.7 mmd�1 (�8 10�9 m s�1) for qCAT, the maximum predicteddownflow rate of �2 10�4 m s�1 for qCAT (Figure 4), andthe average fault depth required to produce peak downflowat site 2:
d ¼ x
3:1¼ 6:3 km
3:1¼ 2:0 km; ð17Þ
into equation (16), we determine a minimum slip magnitudeof 8 cm.[33] Matching the observed flow rate amplitudes with
slow slip model predictions requires much larger slipmagnitudes than in the instantaneous slip model because asignificant loss of pressure head occurs as fluids drainthrough the surface for the duration of the slow slip event.The slip magnitude required to generate observed flow ratesat site 2 is estimated after scaling the best fit modelprediction, qp (Lfx/d = 6 and cp = 0.4 m), for sedimentmaterial properties (Table 1), fault parameters Lfx = 12.2 kmand d = 2.1 km, and propagation speed Vx = 0.47 km d�1
(section 3.3) using equation (11). The remaining parameterrequired in dimensionalization, the slip magnitude, adjuststhe flow rate amplitude. We find a minimum misfit isobtained with bf = 4.8 m. Of the same order, the approx-imate best fit model for site 3 requires a 3.0 m slipmagnitude (Figure 10a).
3.5. Discussion
[34] Slow slip rupture parameters derived independentlyto match observations at different along-strike distancesrequire downdip propagation at site 2 and updip propaga-tion at site 3, 15 km NW along strike. For a single slow slipevent to produce the observed flow rate time series at eachof the sites, the initiation and extent of rupture must havevaried in the along-strike direction. For example, the rupturemay have initiated along a line subparallel to the trench axisthat runs from updip of site 2 to downdip of site 3. Bypropagating in both updip and downdip directions from thisinitiation line, observations at sites 2 and 3 could besimultaneously reproduced. Similar bidirectional propaga-tion of slow slip events have been observed with onshoreGPS networks, e.g., in Cascadia [Melbourne et al., 2005],and inferred from anomalous hydrologic measurementsrecorded at an offshore Costa Rica borehole [Davis andVillinger, 2006] after initiation of an onshore slip event in
2003 [Protti et al., 2004]. Future three-dimensional model-ing efforts are necessary to rigorously test this hypothesis.[35] Slip magnitudes required to reproduce observed flow
rates are likely overestimates; in particular, they are similarto the 4.25 m slip suggested by Cutillo et al. [2006] for agreat earthquake based on the plate convergence rate of 8.5cm a�1 and a 50-year recurrence interval. It is highlyimprobable that the slow slip events occur every 50 years,especially since three of these events are observed in the 6-month observation period. Alternative explanations include(1) the assumed permeability is too low, (2) absolute flowrate measurements are biased toward high values, and (3)the rupture depth is overestimated. Any number of thesefactors combined could account for the overestimate of slipmagnitude required to produce the observation.[36] Measurements of seafloor sediment permeability are
done on push core samples in the laboratory. The upper fewcentimeters of sample are likely disturbed during samplecollection and transportation. The measured permeability ofthe remaining core sample may not accurately represent thatof the very near surface sediments to which the modelpredictions of flow rate amplitude are most sensitive. Inaddition, modeled permeability could also be undervalued ifthere is a dynamic effect of movement of overpressured andunderpressured pore fluids in the near-surface sedimentcreating new pathways during the time of the fault slipevent. Either way, if the marine sediment were morepermeable than modeled, a smaller slip magnitude wouldbe required to produce the observed flow rates. Simplifyingequations (11) and (2) gives
q / bfffiffiffik
p¼ bf
10
ffiffiffiffiffiffiffiffiffiffi100k
p: ð18Þ
A 2 orders of magnitude increase in permeability wouldreduce the required slip magnitude ten fold.[37] Regarding the possibility of a bias in the measured
flow rates, background rates measured at sites 2 and 5 arealmost 10 cm a�1, on the order of magnitude expected atseep sites, not at ambient seafloor sites. While CAT meterrelative flow rate determinations are very reliable, one mightquestion the accuracy of absolute flow rate determinations.In special circumstances daily tidal oscillations may dilutethe tracer concentration of fluid samples used for flow ratedetermination and result in amplification of absolute flowrate measurements (M. D. Tryon, personal communication,2007).[38] Rupture on a shallower fault than the modeled
decollement would require a proportionately lower slip toproduce the same surface flow rate:
q / bf
d: ð19Þ
The deformation zone between the trench and the Nicoyabasement complex backstop, �5–7 km distant from thetrench and below observation sites 2, 3, and 5, is heavilypopulated with out-of-sequence thrust faults cutting fromthe decollement through to the surface (Figure 8) [Shipley etal., 1992; Silver, 2001]. A smaller amount of slip on ashallow out-of-sequence thrust fault could potentially
B00A02 LABONTE ET AL.: HYDROLOGIC MODEL OF A SLOW SLIP EVENT
10 of 13
B00A02

reproduce the observed flow rate time series although it isimprobable that such a shallow and narrow rupture wouldextend the 15 km along-strike distance between sites 2 and3. Advances in processing techniques of very low frequency(VLF) earthquake and tremor signals [Ito and Obara, 2006;Ito et al., 2007] recorded on ocean bottom seismometersmay provide a constraint on the average depth of slow slippropagation in future studies.[39] It is conceivable that a rupture with a skewed slip
distribution and change in propagation rate, which mayoccur if the rupture passes through a change in material orstress properties, could generate the observed flow rate timeseries. In the absence of GPS monitoring capability atoffshore subduction zones, future studies that capture asecond flow rate time series observation from above the
slow slip event at the same along-strike location wouldallow for investigation of alternative slip histories. Despitethese alternatives the distinctive flow rate patterns generatedby updip and downdip propagating ruptures allow for (1) afirst-order approximation of the location of a slip eventproducing the hydrologic anomaly, (2) a characterization ofthe event as an instantaneous or propagating slow sliprupture, and (3) if the event is slowly slipping, determina-tion the propagation direction as updip or downdip.
4. Conclusions
[40] Finite element simulations of strain induced duringslow slip events demonstrate that spatial and temporalrecords of seafloor pore pressure and fluid flux can be usedto detect and quantify the rupture parameters. Hydrologicobservations at the seafloor are particularly well suited forconstraining the location and timing of offshore eventsduring the interseismic period. In a case study, we con-strained the characteristics of an offshore slow slip eventthrough forward modeling to reproduce two seafloor flowrate time series recorded on the Costa Rica prism toe in2000. Without additional observations, assumptions of themost probable fault plane location and slip history had to bemade. The best fit model requires that the rupture initiatedwithin the prism toe, i.e., at depth of less than 4 km, andpropagated at 0.5 km d�1 over a period of approximately 3weeks. The absence of anomalous flow signals at sitesfurther landward supports the conclusion that the slow slipevent initiated in the shallow part of the subduction zonewithout any triggering from a nearby seismic or aseismicevent such as in the seismogenic zone further downdip. Likethe hypothesized 2003 slow slip event on the shallowdecollement off Nankai’s Cape Muroto that produced pres-sure anomalies and caused VLF events [Davis et al., 2006]and a similar event off the nearby Kii Peninsula in 2004[Obara and Ito, 2005, Davis et al., 2009], this Costa Ricaslow slip event cannot be explained using a simple subduc-tion fault model with zones that are strictly stable sliding orstick slip. Instead, the inferred transient slow slip event duringthe interseismic period suggests complex dynamic behaviorin the frontal prism.[41] The initiation of the shallow slip event appears to be
independent of any triggering event further downdip. Thisraises questions of the mechanism and timing of stressaccumulation in the shallow section. Was the event adelayed release of stress in the updip section left over frommovement of the seismogenic zone during the last greatearthquake? Or, with locking at the seismogenic zone, doesthis event represent shortening or flexing in the incomingplate with respect to the overlying prism? It is also possiblethat the downdip ‘‘seismogenic’’ zone may have slippedaseismically, at a depth too great for our instruments todetect, and triggered slip in the frontal prism. Regardless ofthe cause for episodic slow slip in the shallow subductionzone, quantification of these events is important for futureefforts to assess the tsunamogenic potential of the nextCosta Rica subduction zone earthquake in the vicinity of theNicoya Peninsula.[42] New hydrologic instruments in development will
assist in this effort to constrain interseismic transient slip.Flowmeters that can detect ultraslow flow rates, like the
Figure 10. Updip propagating slow slip (Lfx = 7.5 km, d =3 km, Vx = �0.42 km d�1, bf = 3.0 m) predictions forobservations (background flow rates removed) at (a) site 3,6.8 km from trench (cp = 1.1), and (b) site 6, 26 km fromtrench (cp = �1.5).
B00A02 LABONTE ET AL.: HYDROLOGIC MODEL OF A SLOW SLIP EVENT
11 of 13
B00A02

CAT meter, but have a high-temporal resolution and accu-racy, like the electronic flowmeter [LaBonte et al., 2007],will allow for precise comparison of the timing of transientevents recorded on different instruments. Piezometer probesand borehole hydrologic observatories for directly measur-ing pore pressures in the near seafloor sediment may allowfor more accurate slip magnitude estimates as they are notsubject to potential errors in permeability estimates orabsolute flow rate determinations. With future long-termrecords from these surface instruments, and the forwardmodeling approach for quantitatively interpreting hydrolog-ic data as presented in this study, significant progress can bemade to characterize strain accumulation and release inoffshore subduction zone environments during the earth-quake cycle’s interseismic stage.
[43] Acknowledgments. We would like to thank colleagues EarlDavis and Kelin Wang at the Pacific Geoscience Centre and reviewersTimothy Masterlark and Susan Ellis for their valuable critiques of thismanuscript. Neil Driscoll and Vistasp Karbhari also deserve gratitude foruse of computer facilities and an Abaqus license, respectively. Thanks toLeroy Dorman and Michael Tryon for engaging in scientific and technicaldiscussions and collecting the field data. The National Science Foundation(OCE02-41998) and the Achievement Rewards for College ScientistsFoundation, San Diego Chapter, have generously provided funding forthe bulk of this work, and Alison LaBonte is grateful for her postdoctoralfunding from University of Victoria’s NEPTUNE program.
ReferencesBecker, K., and E. E. Davis (2004), In situ determinations of the perme-ability of the igneous oceanic crust, in Hydrogeology of the OceanicLithosphere, edited by E. E. Davis and H. Elderfield, pp. 189–224,Cambridge Univ. Press, Cambridge, U. K.
Biot, M. A. (1941), General theory of three-dimensional consolidation,J. Appl. Phys., 12, 155–164, doi:10.1063/1.1712886.
Bolton, A. J., P. Vannucchi, M. B. Clennell, and A. Maltman (2001),Microstructural and geomechanical constraints on fluid flow at the CostaRica convergent margin, Ocean Drilling Program Leg 170, Proc. OceanDrill. Program Sci. Results, 170, 32 pp.
Brown, K. M., M. D. Tryon, H. R. DeShon, L. M. Dorman, and S. Y.Schwartz (2005), Correlated transient fluid pulsing and seismic tremorin the Costa Rica subduction zone, Earth Planet. Sci. Lett., 238, 189–203, doi:10.1016/j.epsl.2005.06.055.
Carslaw, H. S., and J. C. Jaeger (1959), Conduction of Heat in Solids, 510pp., Oxford Univ. Press, New York.
Christeson, G. L., K. D. McIntosh, T. H. Shipley, E. R. Flueh, andH. Goedde (1999), Structure of the Costa Rica convergent margin,offshore Nicoya Peninsula, J. Geophys. Res., 104, 25,443–25,468,doi:10.1029/1999JB900251.
Cutillo, P. A., S. Ge, and E. Screaton (2006), Hydrodynamic response ofsubduction zones to seismic activity: A case study for the Costa RicaMargin, Tectonophysics, 426, 167–187, doi:10.1016/j.tecto.2006.02.017.
Davis, E. E., and H. W. Villinger (2006), Transient formation fluid pres-sures and temperatures in the Costa Rica forearc prism and subductingoceanic basement: CORK monitoring at ODP sites 1253 and 1255, EarthPlanet. Sci. Lett., 245, 232–244, doi:10.1016/j.epsl.2006.02.042.
Davis, E. E., K. Wang, K. Becker, and R. E. Thomson (2000), Formation-scale hydraulic and mechanical properties of oceanic crust inferred frompore pressure response to periodic seafloor loading, J. Geophys. Res.,105, 13,423–13,435, doi:10.1029/2000JB900084.
Davis, E. E., K. Becker, K. Wang, K. Obara, Y. Ito, and M. Kinoshita(2006), A discrete episode of seismic and aseismic deformation of theNankai trough subduction zone accretionary prism and incoming Philip-pine Sea plate, Earth Planet. Sci. Lett., 242, 73 – 84, doi:10.1016/j.epsl.2005.11.054.
Davis, E. E., K. Becker, K. Wang, and M. Kinoshita (2009), Co-seismic andpost-seismic pore-fluid pressure changes in the Philippine Sea plate andNankai decollement in response to a seismogenic strain event off Kii
Peninsula, Japan, Earth Planets Space, in press.Dragert, H., K. L. Wang, and T. S. James (2001), A silent slip event on thedeeper Cascadia subduction interface, Science, 292, 1525 – 1528,doi:10.1126/science.1060152.
Dragert, H., K. Wang, and G. Rogers (2004), Geodetic and seismic signa-tures of episodic tremor and slip in the northern Cascadia subductionzone, Earth Planets Space, 56, 1143–1150.
Fialko, Y. (2004a), Evidence of fluid-filled upper crust from observations ofpostseismic deformation due to the 1992 Mw7.3 Landers earthquake,J. Geophys. Res., 109, B08401, doi:10.1029/2004JB002985.
Fialko, Y. (2004b), Temperature fields generated by the elastodynamicpropagation of shear cracks in the Earth, J. Geophys. Res., 109,B01303, doi:10.1029/2003JB002497.
Fialko, Y. (2007), Fracture and Frictional Mechanics—Theory, in Treatiseon Geophysics, vol. 4, edited by G. Schubert, pp. 83–106, Elsevier,Oxford, U. K.
Hasegawa, A., N. Uchida, T. Igarashi, T. Matsuzawa, T. Okada, S. Miura,and Y. Suwa (2007), Asperities and quasi-static slips on the subductingplate boundary east of Tohoku, northeast Japan, in The Seismogenic Zoneof Subduction Thrust Faults, edited by T. Dixon and J. C. Moore, pp.451–475, Columbia Univ. Press, New York.
Ito, Y., and K. Obara (2006), Dynamic deformation of the accretionaryprism excites very low frequency earthquakes, Geophys. Res. Lett., 33,L02311, doi:10.1029/2005GL025270.
Ito, Y., K. Obara, K. Shiomi, S. Sekine, and H. Hirose (2007), Slow earth-quakes coincident with episodic tremors and slow slip events, Science,315, 503–506, doi:10.1126/science.1134454.
Jacobson, R. S., L. M. Dorman, G. M. Purdy, A. Schultz, and S. C. Solomon(1991), Ocean bottom seismometer facilities available, Eos Trans. AGU,72, 506, doi:10.1029/90EO00366.
Jonsson, S., P. Segall, R. Pedersen, and G. Bjornsson (2003), Post-earthquake ground movements correlated to pore-pressure transients,Nature, 424, 179–183, doi:10.1038/nature01776.
Kimura, G., E. Silver, and P. Blum (1997), Proceedings of the OceanDrilling Program, Initial Reports, vol. 170, 458 pp., Ocean Drill. Pro-gram, College Station, Tex.
LaBonte, A. L. (2007), An investigation of deformation and fluid flow atsubduction zones using newly developed instrumentation and finite ele-ment modeling, Ph.D. thesis, 226 pp., Univ. of Calif., San Diego, LaJolla.
LaBonte, A. L., K. M. Brown, and M. D. Tryon (2007), Monitoring per-iodic and episodic flow events at Monterey Bay seeps using a new opticalflow meter, J. Geophys. Res., 112, B02105, doi:10.1029/2006JB004410.
Lawn, B. (1993), Fracture of Brittle Solids, 378 pp., Cambridge Univ.Press, New York.
Masterlark, T. (2003), Finite element model predictions of static deforma-tion from dislocation sources in a subduction zone: Sensitivities to homo-geneous, isotropic, Poisson-solid, and half-space assumptions,J. Geophys. Res., 108(B11), 2540, doi:10.1029/2002JB002296.
Melbourne, T. I., W. M. Szeliga, M. M. Miller, and V. M. Santillan (2005),Extent and duration of the 2003 Cascadia slow earthquake, Geophys. Res.Lett., 32, L04301, doi:10.1029/2004GL021790.
Nishimura, T., et al. (2000), Distribution of seismic coupling on the sub-ducting plate boundary in northeastern Japan inferred from GPS observa-tions, Tectonophysics, 323, 217 – 238, doi:10.1016/S0040-1951(00)00108-6.
Norabuena, E., et al. (2004), Geodetic and seismic constraints on someseismogenic zone processes in Costa Rica, J. Geophys. Res., 109,B11403, doi:10.1029/2003JB002931.
Obara, K. (2002), Nonvolcanic deep tremor associated with subduction insouthwest Japan, Science, 296, 1679 – 1681, doi:10.1126/science.1070378.
Obara, K., and Y. Ito (2005), Very low frequency earthquakes excited by the2004 off the Kii peninsula earthquakes: A dynamic deformation processin the large accretionary prism, Earth Planets Space, 57, 321–326.
Protti, M., V. Gonzalez, T. Kato, T. Iinuma, S. Miyazaki, K. Obana,Y. Kaneda, P. La Femina, T. Dixon, and S. Y. Schwartz (2004), Acreep event on the shallow interface of the Nicoya Peninsula, CostaRica seismogenic zone, Eos Trans. AGU, 85(47), Fall Meet. Suppl.,Abstract S41D-07.
Rice, J. R., and M. P. Cleary (1976), Some basic stress diffusion solutionsfor fluid-saturated elastic porous-media with compressible constituents,Rev. Geophys., 14, 227–241, doi:10.1029/RG014i002p00227.
Roeloffs, E. (1996), Poroelastic techniques in the study of earthquake-related hydrologic phenomena, Adv. Geophys., 37, 135–195.
Roeloffs, E., and J. W. Rudnicki (1985), Coupled deformation-diffusioneffects on water-level changes due to propagating creep events, PureAppl. Geophys., 122, 560–582, doi:10.1007/BF00874617.
Rogers, G., and H. Dragert (2003), Episodic tremor and slip on the Casca-dia subduction zone: The chatter of silent slip, Science, 300, 1942–1943,doi:10.1126/science.1084783.
Rudnicki, J. W. (1986), Slip on an impermeable fault in a fluid-saturatedrock mass, in Earthquake Source Mechanics, Geophys. Monogr. Ser.,vol. 37, edited by S. Das, J. Boatwright, and C. H. Scholz, pp. 81–89,AGU, Washington, D. C.
Rudnicki, J. W. (1987), Plane-strain dislocations in linear elastic diffusivesolids, J. Appl. Mech., 54, 545–552.
B00A02 LABONTE ET AL.: HYDROLOGIC MODEL OF A SLOW SLIP EVENT
12 of 13
B00A02

Schwartz, S. Y., and H. R. DeShon (2007), Distinct up-dip limits to geo-detic locking and microseismicity at the northern Costa Rica seismogeniczone: Evidence for two mechanical transitions, in The Seismogenic Zoneof Subduction Thrust Faults, edited by T. Dixon and J. C. Moore,pp. 576–599, Columbia Univ. Press, New York.
Screaton, E. J., and S. Ge (2007), Modeling of the effects of propagatingthrust slip on pore pressures and implications for monitoring, Earth Pla-net. Sci. Lett., 258, 454–464, doi:10.1016/j.epsl.2007.04.004.
Shipley, T. H., K. D. McIntosh, E. A. Silver, and P. L. Stoffa (1992),3-dimensional seismic imaging of the Costa Rica Accretionary Prism:Structural diversity in a small volume of the lower slope, J. Geophys.Res., 97, 4439–4459, doi:10.1029/91JB02999.
Silver, E. A. (2001), Leg 170: Synthesis of fluid-structural relationships ofthe Pacific margin of Costa Rica, Proc. Ocean Drill. Program Sci.Results, 170, 11 pp.
Spinelli, G. A., E. R. Giambalvo, and A. T. Fisher (2004), Sediment perme-ability, distribution, and influence on fluxes in oceanic basement, inHydrogeology of the Oceanic Lithosphere, edited by E. E. Davis andH. Elderfield, pp. 151–188, Cambridge Univ. Press, Cambridge, U. K.
Tryon, M. D. (2002), The development and application of a new benthicaqueous flux meter for very low to moderate discharge rates, Ph.D. thesis,135 pp., Univ. of Calif., San Diego, La Jolla.
Tryon, M. D. (2009), Monitoring aseismic tectonic processes via hydrolo-gic responses: An analysis of log-periodic fluid flow events at the CostaRica outer rise, Geology, 37, 163–166.
Tryon, M. D., and K. M. Brown (2000), Results from long-term aqueousflux measurements on the Costa Rican convergent margin, Eos Trans.AGU, 81(48), 1161.
Tryon, M., K. Brown, L. R. Dorman, and A. Sauter (2001), A new benthicaqueous flux meter for very low to moderate discharge rates, Deep SeaRes., Part I, 48, 2121–2146, doi:10.1016/S0967-0637(01)00002-4.
Turcotte, D. L., and G. Schubert (2002), Geodynamics, 456 pp., CambridgeUniv. Press, Cambridge, U. K.
Wang, H. F. (2000), Theory of Linear Poroelasticity With Applications toGeomechanics and Hydrogeology, 287 pp., Princeton Univ. Press, Prin-ceton, N. J.
Wang, K., and E. E. Davis (1996), Theory for the propagation of tidallyinduced pore pressure variations in layered subseafloor formations,J. Geophys. Res., 101, 11,483–11,495, doi:10.1029/96JB00641.
Wang, K., and J. He (2008), Effects of frictional behaviour and geometry ofsubduction fault on coseismic seafloor deformation, Bull. Seismol. Soc.Am., 98, 571–579, doi:10.1785/0120070097.
Wang, K., and Y. Hu (2006), Accretionary prisms in subduction earthquakecycles: The theory of dynamic Coulomb wedge, J. Geophys. Res., 111,B06410, doi:10.1029/2005JB004094.
�����������������������K. M. Brown and Y. Fialko, Scripps Institution of Oceanography, 9500
Gilman Drive, La Jolla, CA 92093, USA.A. L. LaBonte, NEPTUNE Canada, University of Victoria, P.O. Box
1700 STN CSC, Victoria, BC V8W 2Y2, Canada. ([email protected])
B00A02 LABONTE ET AL.: HYDROLOGIC MODEL OF A SLOW SLIP EVENT
13 of 13
B00A02