
Hydrologic Cycle - USDA Cycle Thomas Pagano and Soroosh Sorooshian Volume 1, The Earth system:...
16
Hydrologic Cycle Thomas Pagano and Soroosh Sorooshian Volume 1, The Earth system: physical and chemical dimensions of global environmental change, pp 450–464 Edited by Dr Michael C MacCracken and Dr John S Perry in Encyclopedia of Global Environmental Change (ISBN 0-471-97796-9) Editor-in-Chief Ted Munn John Wiley & Sons, Ltd, Chichester, 2002
Transcript of Hydrologic Cycle - USDA Cycle Thomas Pagano and Soroosh Sorooshian Volume 1, The Earth system:...
Hydrologic Cycle
Thomas Pagano and Soroosh Sorooshian
Volume 1, The Earth system: physical and chemical dimensions of global environmental change,pp 450–464
Edited by
Dr Michael C MacCracken and Dr John S Perry
in
Encyclopedia of Global Environmental Change(ISBN 0-471-97796-9)
Editor-in-Chief
Ted Munn
John Wiley & Sons, Ltd, Chichester, 2002

Hydrologic Cycle
Thomas Pagano and Soroosh SorooshianUniversity of Arizona, Tucson, AZ, USA
The importance of water on Earth cannot be underesti-mated. Water is transported endlessly throughout the var-ious components of the Earth’s climate system, affectingevery component along the way. Clouds and water vapor inthe atmosphere influence the energy balance of the Earth,and snow and ice-covered surfaces reflect a significantamount of the Sun’s radiation back to space. Water atand under the land’s surface, in the form of streamflow orgroundwater, plays an important role in the maintenanceof living organisms and human societies. However, whilewater is a benefit, if it arrives at the wrong time, in thewrong quantity, or is of poor quality, it can be a severe haz-ard. To mitigate these hardships, humans have significantlyaltered the hydrologic cycle with construction of dams, culti-vation of farmland, urbanization, draining of swamplands,etc. The local consequences of these changes can be dra-matic, leading to environmental changes and, in some cases,local degradation. The global impacts are difficult to ascer-tain, however. With the increasing demand for freshwaterresources and increased societal vulnerability to climateextremes, the effects on humans by water-related globalenvironmental change remain an interesting but as of yetunresolved question.
INTRODUCTION
The hydrologic cycle is the perpetual movement of waterthroughout the various components of the Earth’s climatesystem. Water is stored in the oceans, in the atmosphere,as well as on and under the land surface. The transport ofwater between these reservoirs in various phases plays acentral role in the Earth’s climate. Water evaporates fromthe oceans and the land surface into the atmosphere, whereit is advected across the face of the Earth in the formof water vapor. Eventually, this water vapor condenseswithin clouds and precipitates in the forms of rain, snow,sleet, or hail back to the Earth’s surface. This precipita-tion can fall on open bodies of water, be intercepted andtranspired by vegetation, and become surface runoff and/orrecharge groundwater. Water that infiltrates into the groundsurface can percolate into deeper zones to become a partof groundwater storage to eventually reappear as stream-flow or become mixed with saline groundwater in coastalzones. In this final step, water re-enters the ocean fromwhich it will eventually evaporate again, completing thehydrologic cycle. The hydrologic cycle qualitatively, quan-titatively, and conceptually is depicted in Figures 1–3.
The important reservoirs within the hydrologic cycleinclude:
Ocean
This vast body of salt water covers 70% of the Earth’s sur-face; it stores and circulates enormous amounts of waterand energy. In addition, patterns of ocean surface tempera-tures can exert a strong influence on circulation patterns inthe atmosphere. Frequently, the ocean is divided into twoparts, an upper and lower zone. The upper zone is consid-erably warmer and less saline than the lower zone, and thetwo are separated by a relatively sharp thermocline. Thedepth from the ocean surface to the thermocline can be asmuch as 400 m, but is generally less than 150 m.
Atmosphere
Water can be stored in the atmosphere as liquid in cloudsor as water vapor. Water vapor content of the atmosphere isdescribed by its humidity. Specific humidity is a measureof the water content per unit of dry atmosphere (typicalvalues are 1–20 g kg�1); relative humidity is the amount ofwater vapor present relative to the amount of water vaporthat would saturate the air at a particular temperature. Thepresence of water in the atmosphere alters the radiationbudget of the atmosphere, directly through latent heat andindirectly as both a reflector and absorber of radiation.Water in the atmosphere is the most significant contributorto the natural greenhouse effect.
Cryosphere
The largest stores of fresh water on the Earth are containedin glaciers and icecaps, primarily at high latitudes. Thecryosphere has a significant impact on the climate of theEarth because snow and ice-covered surfaces have a veryhigh albedo (comparable to that of clouds). The largevolume of runoff from northern high-latitude rivers alsoinfluences the Arctic and Atlantic Ocean circulation, whichimpacts the climate in those regions. Despite the importanceof the cryosphere to the hydrologic cycle, relatively little isunderstood about this part of the climate system, partiallybecause of the lack of adequate data in these often remoteand difficult to access areas.
Groundwater
Water beneath the land surface can be classified in a vari-ety of ways. Water closest to the surface (within a fewmeters) is considered soil moisture, and this water influ-ences the evapotranspiration rate of water from the surface.Soil moisture that is frozen year-round is called permafrost.Deeper below the surface is the aquifer, where the water

2 THE EARTH SYSTEM: PHYSICAL AND CHEMICAL DIMENSIONS OF GLOBAL ENVIRONMENTAL CHANGE
Surfacerunoff
Evaporation
Precipitation
Groundwater flow
Sublimation
Snow accumulation
Mountainfront
rechargeSnowmelt
runoff
Precipitation
Infiltration
Evapotranspiration
Groundwaterwithdrawals
Surfacerunoff
Impermeable zoneRecharge
Discharge to ocean
Figure 1 A schematic diagram of various fluxes within the hydrologic cycle. (Figure prepared by B Imam)
Water vaporover land
3
Water vaporover sea
10Net watervapor flux
transport 40Evapotranspiration 75
Precipitation 115Glaciers andsnow
24 064 Biologicalwater
1Lakes176
Marshes11 Rivers
2
Evaporation 431
Precipitation 391
Runoff 40
Sea1 338 000
Permafrost300
Soil moisture17
Groundwater23 400
Flux in 1015
kg year−1State variable
in 1015 kg
Figure 2 A diagram of the various fluxes and reservoirs within the hydrologic cycle with their yearly average magnitudes(after Oki, 1999) (reprinted with permission of Cambridge University Press). The magnitudes given are approximate, anddiffer from other authors. For example, see Chahine (1992); Figure 1 for comparison
concentration in the rock and soil is sufficient for with-drawal by pumping. Groundwater for human activitiesis contained primarily in the aquifer. In this saturatedzone, all available spaces within the rock and soil arefilled with water. Between the aquifer and soil moisturelays an unsaturated intermediate (vadose) zone that hasa lesser influence on the atmosphere than soil moisture.Despite the great societal importance of groundwater sup-plies, quality spatially distributed subsurface data are elu-sive.
Land Surface
Water on land can be contained in lakes and marshes as wellas rivers and within living organisms (biological water).
The volume of water stored on land is relatively small,but the flux of water throughout these systems is relativelyhigh. The relevance of this water to human activities isparamount.
In the broadest sense, the major fluxes between reservoirsare:
Precipitation
Precipitation is the fall of solid or liquid water over landand oceans, and is the major driver of the hydrologiccycle over land. Hydrologists have traditionally recognizedprecipitation as the start of the hydrologic cycle becauseall other hydrologic phenomena (e.g., evaporation, runoff,

HYDROLOGIC CYCLE 3
Evaporation from soil
Evapotranspiration from vegetation
Ground water flow to ocean
Su
rfacerunoff
Evaporation from riversan
dla
kes
Dew and frost
Sleet
Mist
Rain
Hail
Snow
Evaporation of surface detentio
nand interception storage
Run-off Ocean storage
Evapo
ratio
nfro
moc
ean
Atmosphere
(vapor storage)Surface detention
and interception storageInfiltration
Groundw
ateraccretion
Ground
water flow
tostreams
Ground
water
storage
Soil
moisture
storage
Cha
nnel
stor
age
Figure 3 A conceptual diagram of the hydrologic cycle (after Wisler and Brater, 1959). (Reproduced by permission ofJohn Wiley & Sons)
recharge) result from it. The importance of precipitation tothe hydrologic cycle cannot be overstated.
Evapotranspiration
Evaporation is the return of water from bare soil oropen bodies of water (mainly the ocean surface) to theatmosphere. Transpiration is the transfer of water to theatmosphere through the stomata of vegetation. Collectively,they are considered evapotranspiration.
Runoff
Runoff is the transport of liquid water across the surface ofthe Earth. Excess water in saturated soils flows into riversto the ocean, to terminal lakes or swamps. Groundwater caninteract with streamflow in rivers if the water table is nearthe surface.
Water Vapor Transport
Atmospheric water vapor transport is the redistribution ofatmospheric water vapor. Globally, there is a net transferfrom over ocean to over land. This process is known as
advection, and this flux is the major source of water vaporfor precipitation over land, aside from recycling.
DESCRIPTIONS OF THE HYDROLOGIC CYCLE
Mathematical Models
Mathematically, the movement of water throughout thehydrologic cycle can be described using the hydrologiccontinuity equation:
I � O D S
t�1�
where input (I) and output (O) depend on the reservoir inquestion (e.g., evapotranspiration is an input to the atmo-sphere, whereas precipitation is an output). The change instorage (S) in time describes the removal from or additionto present supplies to make up for the imbalance betweeninput and output (in the case of the atmosphere, change instorage would signify a change in specific humidity).

4 THE EARTH SYSTEM: PHYSICAL AND CHEMICAL DIMENSIONS OF GLOBAL ENVIRONMENTAL CHANGE
EvapotranspirationPrecipitation(b)
Precipitablewater
Vapor flux
Evapotranspiration
Precipitation
Runoff
Groundwatermovement
(a)
Basinstorage
(c)
Vapor flux
Runoff
Groundwatermovement
Precipitablewater
Basinstorage
Figure 4 Mathematical schematic of a water balance for: (a) the land surface; (b) the atmosphere; and (c) the combinedatmosphere and surface (from Oki, 1999). (Reprinted with permission of Cambridge University Press)
In contrast to the atmosphere, the water balance of asurface portion of a river basin is considerably more com-plex. Water is input into this system through precipitation,surface runoff, and groundwater inflow from other parts ofthe basin. Water is lost through surface runoff, groundwateroutflow, and evapotranspiration. The change in storage isreflected in changes in soil moisture content. A graphicaldepiction of a water balance for a portion of the atmosphereand land surface is shown in Figure 4.
On a global basis, the Earth is effectively a closed system,and the amount of water present remains relatively constant(i.e., S/t ³ 0). However, input and output rates of thehydrologic cycle vary regionally and on a wide range oftime scales. Describing, quantifying, and predicting thesevariations are, in essence, major tasks in contemporaryhydrology.
To describe and predict variations within the hydrologiccycle, considerable effort has been invested in developingcomputer-based numerical models of hydrology and cli-mate. Every component of the climate system has its ownmodels (from groundwater to oceanography and the atmo-sphere to the land surface) and, within disciplines, there aretoo many different models to be completely described here.For example, surface hydrologic models range from sim-ple statistics, to regression models (such as the antecedentprecipitation index and the soil conservation service curvenumber model) to more complex conceptual rainfall-runoffmodels (like the Sacramento model) and finally to thephysically based distributed models such as HEC-1 andKINEROS. The spatial and temporal scales of their appli-cations vary from model to model, but ranges from tens tothousands of square kilometers and from minutes and hours
to days and years, respectively (Sorooshian et al., 1996).The most complex models available are general circulationmodels (GCMs; see General Circulation Models (GCMs),Volume 1), which have full global representations of theocean, atmosphere, cryosphere, and land surface. Most of theearly work on GCMs related to refining the treatment of theocean–atmosphere interface. Recently, increasing emphasishas been put upon the land surface–atmosphere interface,improving such models as the Biosphere Atmosphere Trans-fer Scheme and the Simple Biosphere model (see LandSurface, Volume 1). Lau et al. (1995) compared the abil-ity of 29 GCMs in simulating various aspects of regionalhydrologic processes and found them insufficient for use inclimate studies related to continental scale water balance.Regardless, this is an area of very active research and ascomputing power rapidly increases in the near future, onecan expect these models to improve.
Data
To date, there are several definitive works providingquantitative descriptions of the global hydrologic cycle(for example, Korzun, 1978; Piexoto and Oort, 1992;Oki, 1999). The most comprehensive review of freshwa-ter resources (supply and use) can be found in Shiklo-manov (1999) http://espejo.unesco.org.uy/ and Shikloma-nov (1997) http://pangea.upc.es/orgs/unesco/webpc/worldwater resources.html. Earlier works quantifying the com-plete water cycle have attempted analysis using sparsemeasurements; the creation of re-analyzed data sets bythe European Center for Medium-Range Weather Fore-casts and the National Center for Atmospheric Research
HYDROLOGIC CYCLE 5
(NCAR)/National Center for Environmental Prediction(NCEP) represents a significant advance to these kinds ofstudies. These data sets blend measurements from raw-insondes, satellite temperatures and moisture, cloud trackwinds, surface observations by ships, ocean buoys, landstations, aircraft reports, and GCM analysis of atmosphericdynamics. At present, reanalyzed data sets represent the bestavailable global atmospheric water balance measurements.
Quality measurements of individual components of thehydrologic cycle also exist (see Earth Observing Systems,Volume 1). In particular, global records of precipitationand streamflow are maintained by the Global PrecipitationClimatology Center (GPCC; http://www.dwd.de/research/gpcc/) and the Global Runoff Data Center (GRDC http://www.bafg.de/grdc.htm), respectively. Within the US, pre-cipitation records are available from the National Cli-matic Data Center (NCDC; http://www.ncdc.noaa.gov/),and runoff is available from the US Geologic Survey(USGS; http://www.water.usgs.gov). Of all surfacehydrologic variables, precipitation and runoff are the bestmeasured, whereas data quality is considerably lowerfor other variables, such as snow, soil moisture, and
evapotranspiration (Sorooshian et al., 1996). One of thegreatest barriers to adequately measuring the hydrologiccycle is the lack of spatially distributed data. Radar andsatellite measurements (e.g., the Precipitation Estimationfrom Remotely Sensed Information using Artificial NeuralNetworks (PERSIANN) system, Sorooshian et al., 2000)hold great promise in overcoming this barrier, but many oftheir benefits have yet to be fully realized.
OBSERVED CLIMATOLOGY
The quantities of water contained within the differentcomponents of the Earth’s system are listed in Table 1.The vast majority of the Earth’s total water is containedin the oceans (96.5%, 1.34 billion km3). The atmospherecontains a relatively small amount of the Earth’s totalwater (0.001%, 12 900 km3). Of the water not in the ocean(3.5%, 52 million km3) and if the amount of water containedin polar ice caps and saline waters is excluded, only15 million km3 (31% of fresh, 0.8% of total) remain. Ifthe water on the Earth fitted proportionately within a 200-liter (45 imperial gallon) barrel, the water contained in theatmosphere would fill just under half a liter, and freshwater
Table 1 Distribution of water on Eartha
Share of world Share of worldArea covered Volume reserves of total reserves of
Form of water (1000 km2) (1000 km3) water (%) fresh water (%)
World ocean 361 300 1 338 000 96.5 –
Total groundwaterb
(saturated and vadose)134 800 23 400 1.7 –
Predominantly freshgroundwater
134 800 10 530 0.76 30.1
Soil moisture 82 000c 16.5 0.001 0.05Glaciers and permanent
snow cover16 000 24 000 1.74 68.7
Antarctica 14 000 22 000 1.56 61.7Greenland 1800 2300 0.17 6.68Arctic islands 230 83.5 0.006 0.24Mountainous areas 220 40.6 0.003 0.12
Ground ice in zones ofpermafrost strata
21 000 300 0.022 0.86
Water reserves in:Lakes 2000 180 0.013 –
Fresh water 1240 91 0.007 0.26Salt water 820 85 0.006 –
Marsh water 2700 11.5 0.0008 0.03
Water in rivers 148 800d 2.12 0.0002 0.006Biological water 510 000 1.12 0.0001 0.003Atmospheric water 510 000 12.9 0.001 0.04
Total water reserves 510 000 1 390 000 100 –Fresh water 148 800 35 000 2.35 100
a The individual number and column totals may not exactly agree due to rounding. Table modified from Korzun (1978)(reproduced by permission of the United Nations Educational, Scientific and Cultural Organization).
b Not including groundwater reserves in Antarctica, broadly estimated at 2 million km3.c Soil moisture is the water contained within the top 2 m of soil. This does not include ice and snow covered land areas,
permafrost regions and arid and semi-arid areas (which collectively cover approximately 65.5 million km2).d The area of rivers here is the entire land surface. The true area of rivers, in the sense of channels with flowing surface
water, is extremely small (<1 million km2).
6 THE EARTH SYSTEM: PHYSICAL AND CHEMICAL DIMENSIONS OF GLOBAL ENVIRONMENTAL CHANGE
60 °N
30 °N
EQ
30 °S
60 °S
0° 60 °E
250 500 1000 1500 2000 2500 3000
120 °E 180° 120 °W 60 °W 0°
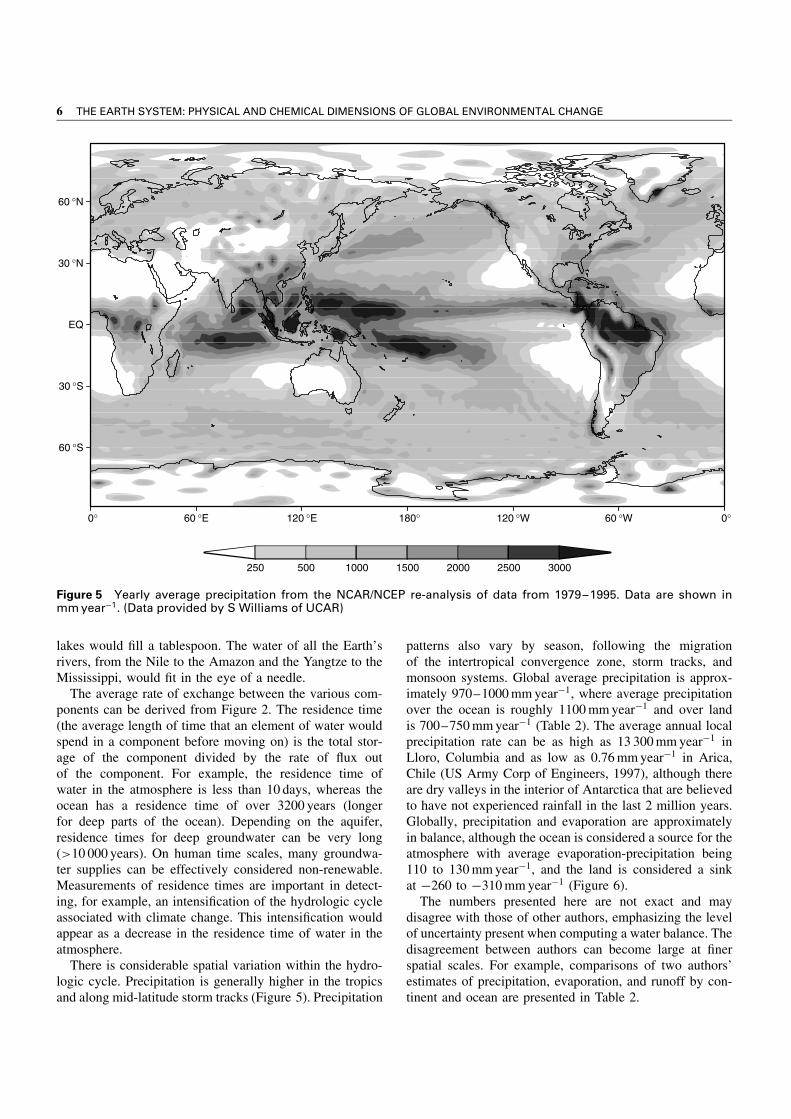
Figure 5 Yearly average precipitation from the NCAR/NCEP re-analysis of data from 1979–1995. Data are shown inmm year�1. (Data provided by S Williams of UCAR)
lakes would fill a tablespoon. The water of all the Earth’srivers, from the Nile to the Amazon and the Yangtze to theMississippi, would fit in the eye of a needle.
The average rate of exchange between the various com-ponents can be derived from Figure 2. The residence time(the average length of time that an element of water wouldspend in a component before moving on) is the total stor-age of the component divided by the rate of flux outof the component. For example, the residence time ofwater in the atmosphere is less than 10 days, whereas theocean has a residence time of over 3200 years (longerfor deep parts of the ocean). Depending on the aquifer,residence times for deep groundwater can be very long(>10 000 years). On human time scales, many groundwa-ter supplies can be effectively considered non-renewable.Measurements of residence times are important in detect-ing, for example, an intensification of the hydrologic cycleassociated with climate change. This intensification wouldappear as a decrease in the residence time of water in theatmosphere.
There is considerable spatial variation within the hydro-logic cycle. Precipitation is generally higher in the tropicsand along mid-latitude storm tracks (Figure 5). Precipitation
patterns also vary by season, following the migrationof the intertropical convergence zone, storm tracks, andmonsoon systems. Global average precipitation is approx-imately 970–1000 mm year�1, where average precipitationover the ocean is roughly 1100 mm year�1 and over landis 700–750 mm year�1 (Table 2). The average annual localprecipitation rate can be as high as 13 300 mm year�1 inLloro, Columbia and as low as 0.76 mm year�1 in Arica,Chile (US Army Corp of Engineers, 1997), although thereare dry valleys in the interior of Antarctica that are believedto have not experienced rainfall in the last 2 million years.Globally, precipitation and evaporation are approximatelyin balance, although the ocean is considered a source for theatmosphere with average evaporation-precipitation being110 to 130 mm year�1, and the land is considered a sinkat �260 to �310 mm year�1 (Figure 6).
The numbers presented here are not exact and maydisagree with those of other authors, emphasizing the levelof uncertainty present when computing a water balance. Thedisagreement between authors can become large at finerspatial scales. For example, comparisons of two authors’estimates of precipitation, evaporation, and runoff by con-tinent and ocean are presented in Table 2.

HYDROLOGIC CYCLE 7
Table 2 Estimates of average annual precipitation (P), evaporation (E), runoff rate (P � E), river runoff rate (R0) fromcontinents to oceans, and runoff ratio ((P � E)/P). For comparison, the estimates of Sellers (1965) have been added inparenthesesa
Surface area P � E R0
Region (106 km2) P (mm year�1) E (mm year�1) (mm year�1) (mm year�1) (P � E)/P
Europe 10.0 657 (600) 375 (360) 282 (240) 0.43Asia 44.1 696 (610) 420 (390) 276 (220) 0.40Africa 29.8 696 (670) 582 (510) 114 (160) 0.16Australia 8.9 803 534 269 0.33North America 24.1 645 (670) 403 (400) 242 (270) 0.38South America 17.9 1564 (1350) 946 (860) 618 (490) 0.40Antarctica 14.1 169 (30) 28 (0) 141 (30) 0.83All Land Areas 148.9 746 (720) 480 (410) 266 (310) 0.36
Arctic Ocean 8.5 97 (240) 53 (120) 44 (120) 307 0.45Atlantic Ocean 98.0 761 (780) 1133 (1040) �372 (�260) 197 �0.49Indian Ocean 77.7 1043 (1010) 1294 (1380) �251 (�370) 72 �0.24Pacific Ocean 176.9 1292 (1210) 1202 (1140) 90 (70) 69 0.07All Oceans 361.1 1066 (1120) 1176 (1250) −110 (−130) 110 −0.10
Globe 510.0 973 (1004) 973 (1004) 0 (0) 0
a Over land, the runoff ratio represents the fraction of precipitation that contributes to runoff. A balance is achieved between P � E andR0 for various ocean basins via currents between the oceans. Table modified from Piexoto and Oort (1992). (Reproduced by permissionof Springer-Verlag).
60 °N
30 °N
EQ
30 °S
60 °S
0° 60 °E 120 °E 180°
−3000 −2000 −1000 0 1000 2000 3000
120 °W 60 °W 0°
Figure 6 Yearly average precipitation-evaporation from NCAR/NCEP re-analysis data in millimeters year�1. See alsoFigure 5

8 THE EARTH SYSTEM: PHYSICAL AND CHEMICAL DIMENSIONS OF GLOBAL ENVIRONMENTAL CHANGE
VARIATIONS IN THE HYDROLOGIC CYCLE
Although general descriptions of the hydrologic cycle (suchas those presented at the beginning of this article) makeit seem relatively simple, once one starts to consider thesmaller-scale aspects of the hydrologic cycle, it is, in reality,quite complex. Variations within the hydrologic cycle spana wide range of spatial and temporal scales. There aredistinct seasonal variations to precipitation and evaporation,and fluxes within the hydrologic cycle vary with latitudeand by continent, as stated earlier. However, precipitationalso varies with altitude and orientation to local mountains,creating an enormous diversity of microclimates across theglobe. Likewise, local weather conditions can change in amatter of minutes, leading to punctual events such as flashfloods and microbursts, or they can evolve very slowly,such as long-term drought. Several studies have detailedthe static aspects of the global hydrologic cycle, and theinteresting new questions in hydrology and meteorologyconcern the hydrologic cycle as a dynamic system operatingand interacting at a variety of scales. What causes drought?What makes one winter wetter or drier than any other?What are the implications of climate change for extremeevents? All of these are questions facing researchers today.
One of the areas of increasingly more active researchconcerns variations within the Earth’s climate on inter-annual, interdecadal, and longer time scales. Prior to the1970s, solar variations were the most common naturalexplanation for year to year variations in climate and thehydrologic cycle. Streamflow of certain rivers could be cor-related with various sunspot cycles, such as the 11-yearcycle. Coincidentally, the earliest attempts at climate fore-casting at the turn of the century were born out of attemptsto link sunspot cycles with the periodicities found in climatetime series, such as Indian monsoon rainfall (the variabil-ity of which is now known to be influenced by El Nino(see El Nino, Volume 1). However, the predictive skill ofsunspot–climate relationships is low, and the relationshipsare unstable in space and time (Korzun, 1978; Allan et al.,1996).
In recent decades, scientists have developed an appre-ciation for the relationship between the ocean and theatmosphere, in particular how seasonal patterns of localclimate can be affected by ocean temperatures in remoteareas (also known as teleconnections following Bjerknes,1969). The El Nino/Southern Oscillation (ENSO, see ElNino/Southern Oscillation (ENSO), Volume 1) cycle isthe most widely studied of this type of phenomenon. Recentlarge events have occurred in 1982–1983 and 1997–1998.The ENSO cycle is a coupled variation of the ocean andatmosphere in the tropical Pacific that impacts precipi-tation in many locations across the globe, from Peru toAfrica, Australia and the US, among others (Ropelewskiand Halpert, 1987). During warm ENSO events, ocean tem-peratures become warmer than usual in a region about the
size of the US, extending from the coast of Peru to acrossthe international dateline. This warming causes shifts in thepatterns of convection in the tropics and, in turn, impactsthe global atmospheric circulation. This favors seasonal pre-cipitation anomalies in specific regions, such as floods anddroughts. During cold ENSO events (La Nina), the sameregion of the ocean becomes colder than usual, and theglobal impacts are generally but not exactly opposite tothose of warm ENSO events. These events occur irregu-larly every two to eight years and can last from one toseveral years. The breadth and magnitude of variations inthe Earth’s climate due to ENSO are second only to thechanging of the seasons (Allan et al., 1996). Predictions ofENSO have contributed successfully to seasonal forecastsof precipitation, which, in turn, can be very useful for watermanagement (for example, Changnon and Vonnhame, 1986;Stern and Easterling, 1999; Changnon and Bell, 2000).
Variations and teleconnections on longer time scalesalso have major impacts on the hydrologic cycle. Twophenomena that have received considerable attention andresearch are the North Atlantic Oscillation (NAO, seeNorth Atlantic Oscillation, Volume 1) and the PacificDecadal Oscillation (PDO, see Pacific–Decadal Oscilla-tion, Volume 1). The PDO concerns ocean temperaturevariations in the northern Pacific, whereas NAO concernsthe northern Atlantic Ocean and atmosphere. The PDOoperates on a time scale of 20–30 years, with observedshifts in the 1890s, 1920s, 1940s, 1970s and possibly themid-1990s. The various phases of the PDO have been asso-ciated with wet and dry periods in North America and canserve to enhance or cancel the effects of ENSO, dependingon their states. The NAO exerts a considerable influence onthe hydroclimatology of Europe, Northern Africa, and theMiddle East, among other regions. There is some evidencesupporting the idea that variations in the North Pacific andNorth Atlantic are coupled and should be thought of as twomanifestations of a single underlying phenomenon. Devel-oping predictors of both of these oscillations remains anarea for active research.
On centennial scales and longer, the hydrologic cycle haschanged in both subtle and dramatic ways. Changes in theorbital parameters of the Earth with respect to the Sun havebeen responsible for glacial periods in the Earth’s history.During glacial periods, the extent of glaciers increases tomuch more than that of today. For example, during the mostrecent glacial maximum 20 000 years before the presentinterglacial, Chicago lay beneath more than 1 km of ice.Changes in the Earth’s temperature and the volume of watertrapped in glaciers caused the sea level to be about 100 mlower than today, drying up the English Channel. Clearly,large-scale weather patterns were altered, changing patternsof precipitation and the partitioning of precipitation into rainand snow. Likewise, continental streamflow would haveincreased as the glaciers melted. Changes in streamflow
HYDROLOGIC CYCLE 9
can impact ocean circulation. As the glaciers retreated fromthe most recent glacial maximum, and their waters releasedinto the North Atlantic, the density of ocean surface waterwas reduced, and the formation of deep ocean water in thisregion was halted. As a result, Europe’s temperature andhydrology was much different than today. On climate timescales, this switching was extraordinarily rapid, on the orderof decades (see Thermohaline Circulation, Volume 1;Younger Dryas, Volume 1).
Aside from ocean and atmospheric variability, the landsurface itself can impact precipitation in local and remoteareas. Variations in soil moisture influence precipitationdue to the amount of moisture that is recycled over land.Chahine (1992) estimated that a full 65% of land-fallingprecipitation comes from evaporation over the land, mostof it advected in from other locations (see Trenberth,1999a for further discussion on evaporation and moisturerecycling). The amount of moisture available, as well as itsspatial distribution, is important, even at fine scales; sharpsoil–moisture gradients have been known to influence thedevelopment of tornadoes, for example. Discontinuities insoil moisture, such as those found at the interface betweenirrigated agriculture and native vegetation, tend to enhanceshallow convective precipitation.
Vegetation also regulates the availability of soil moistureto the atmosphere through the opening and closing of plantstomata. Changes in surface vegetation can induce changesin local meteorology and climate. In particular, decreasesin precipitation are believed to be associated with changesin land cover in south–east Asia and the Amazon (and inAfrica; see Land Cover and Climate, Volume 1). Char-ney (1975) found that the absence of significant moisturesources might help to maintain deserts. In other words, thelack of local moisture for recycling purposes makes a deserta stable system and that, once an area has been made intoa desert, it is difficult to change without external forcing(see Deserts, Volume 1).
HUMANS AND THE HYDROLOGIC CYCLE
One component of the hydrologic cycle that is frequentlynot directly included in its descriptions is human activity.The hydrologic cycle would continue, irrespective of humanactivities, but humans do have a significant impact on theterrestrial component of the hydrologic cycle. Likewise,changes in the hydrologic cycle can dramatically impacthuman activities, for better or for worse. Under growingpopulation pressures, decreasing availability of freshwaterper person, and potential global climate change, how thisfeedback will develop in coming years remains an interest-ing yet unresolved question.
Are humans affected by the hydrologic cycle? Certainly.Water is essential to life on Earth. The availability of waterhas shaped where civilizations have developed and thrived,
just as lack of water has caused great hardships. Water isboth a necessity and a resource for financial gains. Yet,while it is a benefit, it is also a hazard. On average, over$8 billion damages per year have resulted from flooding andhurricanes in the US alone (Kunkel et al., 1999). Indeed,this does not include pandemic health hazards created bypoor water quality.
Will humans affect the hydrologic cycle in the future?Undoubtedly. There is considerable evidence that humanshave affected the hydrologic cycle in the past (Figure 7).Large dams, reservoirs, and extensive canal systems areperhaps the most visible testimony to this. In several basinsacross the globe, surface water resources have been sointensively developed that major rivers periodically ceaseflowing to the ocean (such as the Colorado River in theUS and the Yellow River in China). Inter- and intra-basin transfers have significantly interfered with the naturaldistribution of water.
The most pervasive change to the hydrologic cycle due tohuman activities is associated with land-use change. Thesechanges are very important to consider as, according tovan Dam (1999, xiii), “the effects of climate variabilityand change on the hydrological cycle will be coincidentwith those of changes in land use, which could be of thesame order of magnitude.” The various types of land-usechanges range from deforestation to agriculture, urbaniza-tion to draining swamplands. The impact of these landuses on streamflow is presented in Table 3. The impactsarise from changes in surface albedo, surface roughness,surface permeability (the ability of water to pass througha surface, such as concrete), and the ability of the sur-face to intercept and evaporate moisture. These impactsare inherently scale-dependent, and most local land-usechange will not have a major impact on the continentaland global hydrologic cycle. However, the extent of land-use change in total is considerable; Flohn (1973) suggestedthat, over the last 8000 years, approximately 11% of theland surface has been converted to arable land, and 31%of forests have been modified from their original condition.Additionally, certain regions are poised to have a dispropor-tionately strong impact on global circulation. For example,there is debate as to whether Amazon deforestation willhave an impact on tropical and extratropical climate outof the region. Although this is an area of active research,the expected long-range impacts from Amazon deforesta-tion outside the region remain unclear (Gash and Nobre,1996).
While global fluxes or distributions of water may not beinfluenced by water quality, humans significantly impactwater quality at every step of the hydrologic cycle. Sincethe 1970s, the primary atmospheric water quality concernhas been acid rain. Acid rain damages trees, particularlyat high elevations, and contributes to the acidification oflakes and streams. Regions already affected include North

10 THE EARTH SYSTEM: PHYSICAL AND CHEMICAL DIMENSIONS OF GLOBAL ENVIRONMENTAL CHANGE
Rainmakingatmosphericmodification
Modifiedchannel
precipitation
Dom
estic
/indu
stria
lw
ithdr
awal
s
Channelmodifications,
improvingdams, etc.
Crop andvegetation
modifications
Cultivation,urbanization,
communicationsetc.
Modifiedprecipitation
Surface runoffFloods
Irrigation
DrainageAgriculturalpractices
Groundwaterdevelopment
Inducedflow
Modified evapo-transpiration
Groundwaterabstraction/discharge
Flow regulation,use and
withdrawal
Interbasin transfers
Incr
ease
d ev
apot
rans
pira
tion
Tran
spira
tion
supp
ress
ants
Eva
pora
tion
supp
ress
ants
Input
Vegetation
Surface
Soil
Output Evapo-transpirationleakagerunoff
Groundwater
Precipitationinterception
Throughfallstemflow
Infiltration
Percolation
Figure 7 Systems diagram of the impacts of human activities on streamflow (from Ward, 1990). (Reproduced with thepermission of McGraw-Hill Publishing Company)
America and Northern Europe. Contamination of water atand below the land surface poses a significant threat topotable water supplies (see Fetter, 1998 and Bedient et al.,1999 for further reading on groundwater contamination).Water quality can be affected by human activities in a mul-titude of ways, including effluent, leeching from landfills,industrial and mining activities, and agricultural fertilizerand pesticide runoff. In particular, the long-term isolationof hazardous radiological byproducts from water suppliesposes a special challenge.
GLOBAL CLIMATE CHANGE AND THEHYDROLOGIC CYCLE
As mentioned previously, the magnitude of the impactof human activities on the hydrologic cycle is highlyscale-dependent, and few activities manifest themselveson a global scale. However, the extra release of car-bon dioxide (CO2) into the atmosphere and the resultingpossible changes in the hydrologic cycle are the subjectof a considerable amount of research effort and politi-cal attention. A summary of these changes is provided
in Table 4. While there is some uncertainty and debateconcerning global warming, the theory as to why thehydrologic cycle may be affected is relatively straight-forward.
Greenhouse gases in the atmosphere reflect and re-radiateoutbound long-wave radiation back to the Earth’s surface,increasing the surface temperature. CO2 is one such gas,while water vapor, methane, and nitrous oxide are amongsome of the others. The relationship between the concen-tration of CO2 in the atmosphere and the temperature ofthe Earth has been thoroughly documented on geologictime scales. For instance, during the last glacial periodwhen the atmospheric CO2 concentration was closer to 200parts per million by volume (ppmv), the Earth was 6–8 °Ccooler than during pre-industrial conditions of 280 ppmv.The current atmospheric concentration of CO2 is about370 ppmv, and predictions of future concentrations rangefrom 450–1000 ppmv in the year 2100. The anticipatedincrease in global surface temperatures over this period isfrom 1.4 to 5.8 °C (IPCC, 2001).
If the amount of long-wave radiation reflected back to theEarth’s surface is increased, the potential evaporation from

HYDROLOGIC CYCLE 11
Table 3 Summary of impacts of land-use changesa
Component Principal hydrologic process Geographic scale and likelyLand use change affected involved magnitude of effect
Afforestation(deforestation hasconverse effect, exceptwhere disturbancecaused by forestclearance may be ofoverriding importance)
Annual flow Increased interception in wetperiods; delay in spring runoff;Increased transpiration in dryperiods through increasedwater availability to deep rootsystems
Basin scale; magnitudeproportional to forestcover. On average,conversion of 10% ofwatershed area to forestcover results in 34 mmyear�1 reduction inannual flow per unit area
Seasonal flow Increased interception andincreased dry periodtranspiration will increasesoil-moisture deficits andreduce dry season flow
Basin scale; can be ofsufficient magnitude tostop dry season flows
Drainage activities associatedwith planting may increase dryseason flows through initialdewatering and also throughlong term-effects of thedrainage system
Basin scale; drainageactivities will increase dryseason flows
Cloud water (mist or fog)deposition will augment dryseason flows
High-altitude basins only;increased cloud waterdeposition may have asignificant effect on dryseason flows
Climate Increased evaporation andreduced sensible heat fluxesfrom forests affect climate
Micro, meso, and globalscale; forests generallycool and humidify theatmosphere
Agriculturalintensification
Waterquantity
Altering of transpiration ratesaffects runoff
Basin scale; effect ismarginal
Timing of storm runoff alteredthrough land drainage
Basin scale; significanteffect
Draining wetlands Annual flow Initial dewatering followingdrainage will increase annualflow
Basin scale; effect may lastfrom one to two years todecades
Afforestation following drainagewill reduce annual flow
Basin scale; effects as forafforestation
Seasonal flow Upland peat bogs, groundwaterfends, and African damboshave little effect in maintainingdry season flows
Basin scale: drainage orremoval of wetland willnot reduce and mayincrease dry season flows
Lowering of the water table mayinduce soil–moisture stress,reduce transpiration, andincrease dry season flows
Basin scale; a reduction ofwater-table depth to aminimum of 30 cm belowsurface is required
Initial dewatering followingdrainage will increase dryseason flows
Basin scale; effect may lastfrom one to two years todecades
The deeper flow outlet of thedrainage system will lead toincreased dry season flows
Basin scale; effects will belong-term
Urbanization Runoffvolume
Impervious surfaces such aspaved roads, roofs, and parkinglots increase surface runoffduring storm events anddecrease groundwater recharge
Basin scale; magnitude ofeffect depends on extentof urbanization
a Table modified from Calder (1993) with additional data from Urbonas and Roesner (1993). (Reproduced by permission of McGraw-HillPublishing Company).

12 THE EARTH SYSTEM: PHYSICAL AND CHEMICAL DIMENSIONS OF GLOBAL ENVIRONMENTAL CHANGE
Table 4 Best estimates of climate change projections over the next 50–100 years
AnnualDistribution of changes Confidence of projection
average Regional Change in Interannual Significant Global RegionalIndicators change average seasonality variability transients average average
Temperature C1 to C3.5 °C �3 to C10 °C Yes Down? Yes High MediumSea level C15 to C95 cm – No ? Unlikely High MediumPrecipitation C7 to C15% �20 to C20% Yes Up Yes High LowDirect solar
radiation�10 to C10% �30 to C30% Yes ? Possible Low Low
Evapotrans-piration
C5 to C10% �10 to C10% Yes ? Possible High Low
Soil moisture ? �50 to C50% Yes ? Yes ? MediumRunoff Increase �50 to C50% Yes ? Yes Medium LowSevere
storms? ? ? ? Yes ? ?
Source: Schneider et al. (1992) (reproduced by permission of John Wiley & Sons) and S Schneider (personal communication, July 27,2000).
the ocean and the land surface may also increase. Like-wise, because warmer air can potentially hold more water(the amount of water that it would take to saturate a parcelof air increases exponentially with temperature), humiditymay increase. If the increase in water vapor storage in theatmosphere does not balance the increased evaporation, pre-cipitation rates should change, on the average (see WaterVapor: Distribution and Trends, Volume 1). Due to com-plex feedbacks within the Earth’s climate system, the antic-ipated impacts of global warming on the hydrologic cyclebecome considerably more difficult to predict beyond thesefirst few conceptual steps. For example, a more vigorousatmospheric water cycle may involve increased low cloudsthat might reduce the amount of incoming radiation to theEarth’s surface, leading to negative feedback and cooling.However, an increase in high clouds, which are efficient atreflecting long-wave radiation back to the Earth’s surfacewhile letting short-wave radiation pass through, would leadto positive feedback of further warming.
If understanding the impact of climate change on allaspects of the hydrologic cycle is difficult, translating theseimpacts into their effects on human activities is an evengreater challenge. Humans are most sensitive to hydrologicvariations, extremes, and certain sequences of events. Suchquestions as how climate change will affect the occurrenceof drought in a particular region remain open to debate(although considerable effort has been devoted towards try-ing to answer these questions, see National AssessmentSynthesis Team, 2000). Some scientists believe that theclearest changes associated with global warming will bein the occurrences of extreme events. Assuming that a cli-matological variable (e.g., precipitation, temperature) has anormal distribution, changes in the mean will bring pro-portionally greater shifts in intensity and frequency at thetails of the distribution (Trenberth, 1999b; see also Easter-ling, 2000a for an excellent discussion of the observed and
anticipated changes in extreme events induced by climatechange).
The atmosphere is not the only component of the hydro-logic cycle that may be affected by global climate change;the ocean and cryosphere may also be impacted. Simu-lations of climate change have predicted that the greatestwarming will occur at high latitudes. Locally, this poses athreat to regions with permafrost, where melting can causeland-surface subsidence and damage to structures. How-ever, if temperatures are warm enough, glacial melt andthermal expansion of the oceans also may cause sea levelchanges over the next 100 years. This is of concern becausea 1% decrease in glacial water content translates to approxi-mately a 30 cm increase in sea level. To help put this in per-spective, a 2-m rise in sea level could entirely inundate theRepublic of the Maldives. Changes in surface albedo asso-ciated in the change from ice to bare ground or open oceanis a positive feedback, associated with increased absorp-tion, higher temperatures, and possibly increased melting.The predictions of sea level increase range from 13–94 cmby the year 2100 (IPCC, 1995). Such a change could havedire consequences for coastal ecosystems.
The response of the hydrologic cycle to climate forc-ing can also be nonlinear. Large temperature rises at highlatitudes, increases in precipitation, and glacial melt mayalter the vertical density profile of the North Atlantic Ocean,causing a slowing or collapse of the deep-water forma-tion, greatly impacting the climate of Europe, as was seenduring the younger Dryas period. Model simulations ofdoubling CO2 concentrations predict a decrease in deep-water formation, with eventual recovery after concentrationstabilization, whereas quadrupling concentrations leads tothermohaline collapse and very slow recovery. These sim-ulations are highly model-dependent, but they do emphasizethe presence of thresholds and triggers within the climatesystem (see Climate Change, Abrupt, Volume 1).

HYDROLOGIC CYCLE 13
The expected impacts of climate change on surface runoffand groundwater recharge remain unknown, in part dueto the fine spatial scale being considered, and unknownchanges in seasonality and timing of precipitation. How-ever, the possible ramifications of these changes should notbe underestimated. In regions where water resources arefully committed or over-committed, declines in supply canlead to regional disputes and international conflict. A com-prehensive database of articles related to water resourcesand climate change in the US has been compiled and isavailable at http://www.pacinst.org/CCBib.html.
20TH CENTURY OBSERVED CHANGES INTHE HYDROLOGIC CYCLE
One of the most difficult challenges in detecting changesin the hydrologic cycle is the lack of globally complete,high-quality long-term measurements. In particular, existingobservations of soil moisture and evaporation are unsuitablefor studies of long-term changes. Likewise, it is difficultto estimate the underlying climatological frequency of rareevents (e.g., floods) from existing data sets, much less detectchanges in the frequency or magnitude of these events.Attributing the observed changes to human activities ornatural variability represents a special challenge in andof itself. Nonetheless, there are some detectable trendsin the modern instrumental precipitation data, primarilytowards drier conditions in the tropics and wetter conditionsin the extra-tropics. Fewer trends have been detected instreamflow. A summary of recent hydrologic trends ispresented in Table 5.
A thorough review of the observed global changes inprecipitation is provided by IPCC (1995). A review ofchanges in the US was done by the National AssessmentSynthesis Team (2000). Annual precipitation in the UShas increased by 5%, primarily in autumn and in theeastern two–thirds of the country. These increases havebeen associated with modest increases in heavy rainfallevents (i.e., >5 cm day�1, Karl et al., 1995). Streamflowtrends are consistent with these increases; geographicallywidespread regions of the US have experienced increases inthe annual median and minimum daily flows. This suggeststhat, overall, there is more water, in general, in US riverstoday and that droughts have not been as extreme as theywere in the 1950s–1970s (Lins and Slack, 1999). Easterlinget al. (2000b) found that precipitation extremes are on therise in many locations across the globe, but reminded us ofthe danger of drawing firm conclusions based on analysisof relatively short data records. Likewise, recent changesin the frequency of warm ENSO events and the state ofthe PDO (since the 1970s) have made sole attribution ofthe observed climate changes to anthropogenic activitiesdifficult.
Table 5 Observed trends in the hydrologic cycle
Variable Observed trend Confidence
OceanHigh clouds Increase
1951–1981Low
Mid-level clouds Increase inNorthernHemisphere,mid-latitude1951–1981
Low
Convectiveclouds
Increase1951–1981
Low
Fair weathercumulusclouds
Decrease1951–1981
Low
Water vapor Increase1973–1988
Low
Evaporation intropics
Increase1949–1989
Medium
LandMid- to
high-latitudeclouds
Increasing1900–1980s
Medium
Mid- tohigh-latitudeprecipitation
Increasing since1900
Medium
NorthernHemispheresubtropicalprecipitation
10% decrease since1970
Medium
Evaporation inUS and FSUa
Decreasing since1950
Low
Soil moisture inFSUa
Increasing1970s–1990s
Low
Runoff Pattern consistentwith precipitationchanges
Medium
Source: IPCC, 1995. (Reproduced by permission of the IPCC).a Former Soviet Union.
TOWARDS IMPROVED UNDERSTANDING OFTHE HYDROLOGIC CYCLE
Although the hydrologic cycle has been studied for wellover a century, with considerable work being done inrecent decades, many unresolved questions and expandingfrontiers in water cycle research remain. In particular,understanding the impacts of human activities on the hydro-logic cycle is an area of active research. Considerableeffort is also being devoted to understanding the linkagesbetween the ocean and atmosphere in the tropics (such asENSO), as well as at mid-latitudes (through PDO, NAO,and through changes in ocean thermohaline circulation).Increased attention has been devoted to land surface andhydrologic representation in large-scale computer models,the intent of which is to improve predictions of variationsin the hydrologic cycle on interannual and longer timescales. Medium-range weather predictions can also improve

14 THE EARTH SYSTEM: PHYSICAL AND CHEMICAL DIMENSIONS OF GLOBAL ENVIRONMENTAL CHANGE
through having a better understanding and model represen-tation of soil–moisture processes (Chahine, 1992). Finally,groundwater and surface interactions, ranging from theamount of water recharged into an aquifer from snowmeltto the hydrology of natural springs, are some of the leastunderstood components of basin-scale water balances.
Improved understanding of the hydrologic cycle is notlimited to the understanding contained within the scien-tific research community. It is also that of the operationalwater management community, the general public, andother water resources stakeholders. Concepts such as cli-mate stationarity (the belief that the underlying statisticsof the climate of a particular region are constant in time)are key assumptions for most water management plan-ning and design, although the research community haslong recognized the flaws in this assumption. For example,for structural design purposes, relatively brief historicalrecords are used to estimate the magnitude of the flood thatwould happen once in a 100 years. If the historical periodbeing considered contains unusually wet or dry spells, thisapproach will not give a representative estimate of whatmay happen in the future. Likewise, most regions lack legalrecognition of the connection between the groundwaterand surface-water components of the hydrologic cycle. Theimpacts of excessive groundwater withdrawals on stream-flow are fairly well understood by the scientific researchcommunity, although few, if any, regions have laws thatreflect this understanding.
There are several major research programs designed todevelop a more sophisticated understanding of the hydro-logic cycle. One such program, the Global Energy andWater cycle EXperiment (GEWEX, see GEWEX (GlobalEnergy and Water Cycle Experiment), Volume 1), wasinitiated in 1988 by the World Climate Research Pro-gramme (WCRP, 1990; Chahine, 1992). Part of GEWEXis designed to observe and model the hydrologic cycle,with the ultimate goal of predicting global and regionalclimate change. The program includes large-scale fieldactivities and intensive measurements, as well as modelingand research. GEWEX has contributed to the developmentof improved numerical models and the creation of state ofthe art climate data sets, and it is also helping to achieve itsgoals of improving resource management through scientificoutreach to the engineering and other user communities.
See also: Hydrology, Volume 2; Water Use: FutureTrends, and Environmental and Social Impacts, Vol-ume 3; Circulating Freshwater: Crucial Link betweenClimate, Land, Ecosystems, and Humanity, Volume 5.
ACKNOWLEDGMENTS
We gratefully acknowledge assistance of S Williams andB Imam in data and graphical assistance and C Theisand C Sprout in proofreading and editing the manu-script. Financial support was provided by NASA/EOS
Grant #OSSA-A/88, by CLIMAS (Southwest Climate Asse-ssment Program) under NOAA Office of Global ProgramsGrant #NA86GP0061 and by SAHRA (Sustainability ofsemi-Arid Hydrology and Riparian Areas) under the STCprogram of the National Science Foundation, agreementNo. EAR-9876800.
REFERENCES
Allan, R, Lindesay, J, and Parker, D (1996) El Nino SouthernOscillation and Climatic Variability, CSIRO, Collingwood,VIC, Australia.
Bedient, P B, Rifai, H S, and Newell, C J (1999) Ground WaterContamination: Transport and Remediation, Prentice-Hall, En-glewood Cliffs, NJ.
Bjerknes, J (1969) Atmospheric Teleconnections from the Equa-torial Pacific, Mon. Weather Rev., 97, 163–172.
Calder, I R (1993) Hydrologic Effects of Land Use Change, inHandbook of Hydrology, ed D R Maidment, McGraw-Hill,New York, 13.1–13.50.
Chahine, M T (1992) The Hydrological Cycle and Its Influenceon Climate, Nature, 359, 373–380.
Changnon, S A and Bell, G D, eds (2000) El Nino, 1997–1998:the Climate Event of the Century, Oxford University Press,New York.
Changnon, S A and Vonnhame, D R (1986) Use of Climate Pre-dictions to Decide a Water Management Problem, WaterResour. Bull., 22, 649–652.
Charney, J (1975) Dynamics of the Deserts and Drought in theSahel, Q. J. R. Meteorol. Soc., 101, 193–202.
Easterling, D R, Meehl, G A, Parmesan, C, Changnon, S A, Karl,T R, and Mearns, L O (2000a) Climate Extremes: Observa-tions, Modeling, and Impacts, Science, 289, 2068–2074.
Easterling, D R, Evans, J L, Groisman, P Y, Karl, T R, Kunkel,K E, and Ambenje, P (2000b) Observed Variability and Trendsin Extreme Climate Events: a Brief Review, Bull. Am. Meteo-rol. Soc., 81, 417–425.
Fetter, C W (1998) Contaminant Hydrogeology, Prentice-Hall,Upper Saddle River, NJ.
Flohn, H (1973) Globale Energiebilanz und Klimaschwankungen,in Bonner Meteorologische Abhandlungen, Westdeutscher Ver-log, 75–117.
Gash, J H C and Nobre, C A, eds (1996) Amazonian Deforesta-tion and Climate, John Wiley & Sons Ltd, New York.
IPCC (1995) Climate Change 1995: The Science of ClimateChange, Intergovernmental Panel on Climate Change, Cam-bridge University Press, Cambridge.
IPCC (2001) Climate Change 2001: The Scientific Basis, edsJ T Houghton et al., Cambridge University Press, Cambridge,1–881.
Karl, T R, Knight, R W, and Plummer, N (1995) Trends in High-frequency Climate Variability in the Twentieth Century, Nature,377, 217–220.
Korzun, V I (1978) World Water Balance and Water Resources ofthe Earth, UNESCO.
Kunkel, K E, Pielke, R A J, and Changnon, S A (1999) TemporalFluctuations in Weather and Climate Extremes that CauseEconomic and Human Health Impacts: A Review, Bull. Am.Meteorol. Soc., 80, 1077–1098.
HYDROLOGIC CYCLE 15
Lau, W K M, Sud, Y C, and Kim, J H (1995) Intercomparisonof Hydrologic Processes in Global Climate Models, TechnicalMemorandum 104617, NASA, Washington, DC.
Lins, H F and Slack, J R (1999) Streamflow Trends in the UnitedStates, Geophys. Res. Lett., 26, 227–230.
National Assessment Synthesis Team (2000) Climate ChangeImpacts on the United States: The Potential Consequences ofClimate Variability and Change, US Global Change ResearchProgram, Cambridge University Press, New York.
Oki, T (1999) The Global Water Cycle, in Global Energy andWater Cycles, eds K A Browning and R J Gurney, CambridgeUniversity Press, Cambridge, 10–29.
Piexoto, J P and Oort, A H (1992) Physics of Climate, AmericanInstitute of Physics, New York.
Ropelewski, C F and Halpert, M S (1987) Global and RegionalScale Precipitation Patterns Associated with the El Nino/Sout-hern Oscillation, Mon. Weather Rev., 115, 1606–1626.
Schneider, S H, Mearns, L O, and Gleick, P H (1992) Climate-Change Scenarios for Impact Assessment, in Global Warmingand Biological Diversity, eds R Peters and T Lovejoy, YaleUniversity Press, New Haven, CT, 38–55.
Sellers, W D (1965) Physical Climatology, University of Chicago,Chicago, IL.
Shiklomanov, I (1999) World Water Resources and their Use,St Petersburg, Russian Federation, State Hydrological Insti-tute/UNESCO [CD-ROM].
Shiklomanov, I A (1997) Comprehensive Assessment of the Fresh-water Resources of the World: Assessment of Water Resourcesand Water Availability in the World, Report 556.18 SHI, WorldMeteorological Organization, Geneva, Switzerland.
Sorooshian, S, Gupta, H V, and Rodda, J C, eds (1996)Land Surface Processes in Hydrology, Springer-Verlag, NewYork.
Sorooshian, S, Hsu, K, Gao, X, Gupta, H V, Imam, B, and Braith-waite, D (2000) Evaluation of PERSIANN System Satellite-Based Estimates of Tropical Rainfall, Bull. Am. Meteorol. Soc.,81(9), 2035–2046.
Stern, P C and Easterling, W E, eds (1999) Making Climate Fore-casts Matter, National Academy Press, Washington, DC.
Trenberth, K E (1999a) Atmospheric Moisture Recycling: Role ofAdvection and Local Evaporation, J. Clim., 12, 1368–1381.
Trenberth, K E (1999b) Conceptual Framework for Changes ofExtremes of the Hydrological Cycle with Climate Change,Clim. Change, 42, 327–339.
Urbonas, B R and Roesner, L A (1993) Hydrologic Design forUrban Drainage and Flood Control, in Handbook of Hydrology,ed D R Maidment, McGraw-Hill, New York, 28.1–28.52.
US Army Corps of Engineers (1997) Weather and ClimateExtremes, TEC-0099, National Technical Information Service,Springfield, VA.
van Dam, J C, ed (1999) Impacts of Climate Change and ClimateVariability on Hydrological Regimes, Cambridge UniversityPress, Cambridge.
Ward, R C (1990) Principles of Hydrology, McGraw-Hill,London.
WCRP (1990) Scientific Plan for the Global Energy and WaterCycle Experiment, WCRP-40, World Climate Research Pro-gramme, Geneva.
Wisler, C O and Brater, E F (1959) Hydrology, John Wiley &Sons, New York.


