HYDROLOGIC CHARACTERISTICS OF LAGOONS AT SAN JUAN… · LAGOONS AT SAN JUAN, ... Cano de Martin...
41
HYDROLOGIC CHARACTERISTICS OF LAGOONS AT SAN JUAN, PUERTO RICO, DURING AN OCTOBER 1974 TIDAL CYCLE U.S. GEOLOGICAL SURVEY WATER-RESOURCES INVESTIGATIONS OPEN-FILE REPORT 82-349 Prepared in cooperation with: PUERTO RICO ENVIRONMENTAL QUALITY BOARD AND PUERTO RICO DEPARTMENT OF NATURAL RESOURCES
Transcript of HYDROLOGIC CHARACTERISTICS OF LAGOONS AT SAN JUAN… · LAGOONS AT SAN JUAN, ... Cano de Martin...

HYDROLOGIC CHARACTERISTICS OF LAGOONS AT SAN JUAN, PUERTO RICO, DURING AN OCTOBER 1974 TIDAL CYCLE
U.S. GEOLOGICAL SURVEY WATER-RESOURCES INVESTIGATIONS OPEN-FILE REPORT 82-349
Prepared in cooperation with:PUERTO RICO ENVIRONMENTAL QUALITY BOARD ANDPUERTO RICO DEPARTMENT OF NATURAL RESOURCES

HYDROLOGIC CHARACTERISTICS OF LAGOONS AT SAN JUAN, PUERTO RICO, DURING AN OCTOBER 1974 TIDAL CYCLEBy Fernando Gomez-Go'mez, Ferdinand Quinones. and Sherman R. Ellis
U.S. GEOLOGIAL SURVEY WATER-RESOURCES INVESTIGATIONS OPEN-FILE REPORT 82-349
Prepared in cooperation with: PUERTO RICO ENVIRONMENTAL QUALITY BOARD AND PUERTO RICO DEPARTMENT OF NATURAL RESOURCES
1983
UNITED STATES DEPARTMENT OF THE INTERIOR
JAMES G. WATT, Secretary
GEOLOGICAL SURVEY
Dallas L. Peck, Director
For additional information write to:
Chief, Caribbean District, WRDU.S. Geological SurveyGPO Box 4424San Juan, Puerto Rico 00936(Telephone: (809) 753-4414)
Copies of this report can be purchased from:
Open-File Services Section Western Distribution Branch U.S. Geological Survey Box 25425, Federal Center Denver.Colorado 80225 (Telephone: (303) 234-5888)

CONTENTS
PageAbstract......................................................... 1Introduction..................................................... 2
Purpose and scope........................................... 2Methods and procedures...................................... 4
Physical Characteristics of the San Juan Lagoons System.......... 4The San Juan Lagoons system................................. 4
Laguna San Jose........................................ 5Laguna La Torrecilla................................... 7Laguna de Pinones...................................... 9
Storm characteristics............................................ 10Precipitation............................................... 10Stage changes............................................... 10
Flow characteristics and magnitude............................... 12Boca de Cangrejos Outlet.................................... 12Canal Pinones............................................... 13Canal Suarez at Highway 26 Bridge........................... 14Cano de Martin Pena at Avenida Barbosa...................... 16Storm runoff contributions to the lagoons................... 16
Water quality characteristics.................................... 19Water quality in the San Juan Lagoons....................... 19Chemical Loads during-the October 22 to 23, 1974 Storm...... 21
Boca de Cangrej os...................................... 21Canal Pinones.......................................... 21Canal Suarez at Highway 26 Bridge...................... 25Cano de Martin Pena at Avenida Barbosa................. 27Net Loads in the lagoon system......................... 27
Conclusions...................................................... 33Selected References.............................................. 34
ILLUSTRATIONS
Figure 1-5 Maps showing:1. General features of San Juan Lagoons System..... 32. Drainage basin of San Juan Lagoons.............. 53. General features of Laguna San Jose............. 64. General features of Laguna La Torecilla......... 85. General features of Laguna de Pinones........... 96. Graph showing water-surface fluctuations at
Laguna del Condado, Boca de Cangrejos, Laguna San Jose, Laguna La Torrecilla, and Laguna de Pinones.................... 11
ill

ILLUSTRATtONS-ContinuedPage
7-11. Graphs showing:7. Flow pattern at Boca de Cangrejos............. 128. Flow pattern at Canal Pifiones................. 139. Water-surface fluctuations at both sides of
Highway 26 bridge at Canal Suarez...... 1410. Flow pattern through Canal Suarez at High
way 26 bridge........................... 1511. Flow pattern through Carlo de Mart£n Pefia at
Avenida Barbosa bridge................. 1712. Diagram of net-water flow and gain in storage
(IS) at:Laguna San Jose, Laguna La Torrecilla, Laguna de Pifiones during the October 22 to 23, 1974 storm...................... 18
13. Graphs showing flow pattern of chemicalconstituents and suspended-sedimentthrough Boca de Cangrejos.............. 22
14. Graph showing suspended-sediment concentrations as related to mean-flow velocity at Boca de Cangrej os...................... 23
15-16. Graphs showing flow patter of chemical constituentsand suspended sediment through:
15. Canal Pifiones................................. 2416. Canal Suarez at Highway 26 bridge............. 2617. Graph showing flow pattern of chemical consti
tuents through Cafio de Martin Pefia at Avenida Barbosa bridge................. 28
18. Diagram of net-water flows, nutrients andsuspended-sediment loads in the San JuanLagoons during the storm-affected tidalcycle of October 22 to 23, 1974........ 29
19. Net-water flows, nutrients and suspended-sedi ment loads at the San Juan Lagoons system during a January 22 to 23, 1974 tidal cycle............................ 30
TABLESPage
Table 1. Water quality of surface-water flows into lagoonsduring low-flow conditions, October 22, 1974.. 20
2. Comparison of net loads of nutrients at San Juan Lagoons system between a dry-weather tide cycle, adjusted to zero-storage gain.......... 21
IV

FACTORS FOR CONVERTING INCH-POUND UNITS TO
INTERNATIONAL SYSTEM OF UNITS (SI)
The metric System of measurements (SI or International System) is used in this report. The following factors may be applied for conversion of metric values to inch-pound units:
Multiply SI units
millimeter (mm) meter (m) kilometer (km)
By_
0.039373.2810.621
To obtain inch-pound units
inch (in.)foot (ft)mile (mi)
square meter (m ) ~ square kilometer (km ) hectare (ha)
Area
10.760.3862.47
square foot (ft«) square mile (mi ) acre
cubic centimeter (cm ) liter (L)cubic meter (m ) « cubic hectometer (hm )
Volume
0.0611.06
35.32810.7
cubic inch (in ) quart (qt) - cubic foot (ft ) acre foot (acre-ft)
gram (g) kilogram (kg)
Weight
0.0352.203
ounce, ovoirdupois (02 avdp) pound, avoirdupois (la avdp)
degree Celsius (°C)
Temperature
((1.8x°C)+32) degree Fahrenheit (°F)
Specific Combinations
cubic meter per second 35.3 (mJ /s)
cubic foot per second (ft /s)

HYDROLOGIC CHARACTERISTICS OF LAGOONS AT SAN JUAN,
PUERTO RICO, DURING AN OCTOBER 1974 TIDAL CYCLE
x X
By Fernando Gomez-Gomez, Ferdinand Quinones, and Sherman R. Ellis
ABSTRACT
Flow and water-quality changes were studied during a period of intense rainfall in the San Juan Lagoon system. The study covered a 25- hour period beginning 0900 hours 22 October, 1974. Precipitation during the study period averaged 70 millimeters. Sampling stations were located at Boca de Cangrejos, the main ocean outlet; Canal Pinones between Laguna de Pinones and Laguna La Torrecilla; Canal Suarez between Laguna San Jose connects to Laguna La Torrecilla; and Carlo de Martin Pena between Laguna San Jose and Bahla de San Juan. In addition water- elevation recording gages were installed at each lagoon.
Water samples from the canal stations were analyze^ for organic carbon, nitrogen and phosphorus species, and suspended sediment. Specific-conductance measurements were used with the chemical data to estimate the runoff contributions of nutrients.
Runoff into the lagoons system during the study period was about 2.8 million cubic meters, or about 70 percent of the average precipita tion. The runoff contributed chemical loadings to the lagoons of 95,000 kilograms total-organic carbon; 2,700 kilograms of total phosphorus; and 10,000 kilograms of total Khjeldhal nitrogen. A comparison with a prior study during which there was no significant rain, show that dry-period loadings are less than 10 percent of the wet-period loadings. At the end of the study period the system had not reached equilibrium, and the lagoons retained 80 percent of the water inflows from 50 to 90 percent of the chemical loads. Nearly 95 percent of the water outflows occurred at the Boca de Cangrejos sea outlet. The three lagoons and interconnect ing canals form a very complex hydraulic system that is difficult to study using traditional techniques. A model of the system will facilitate management to improve the quality of water in the lagoons.
INTRODUCTION
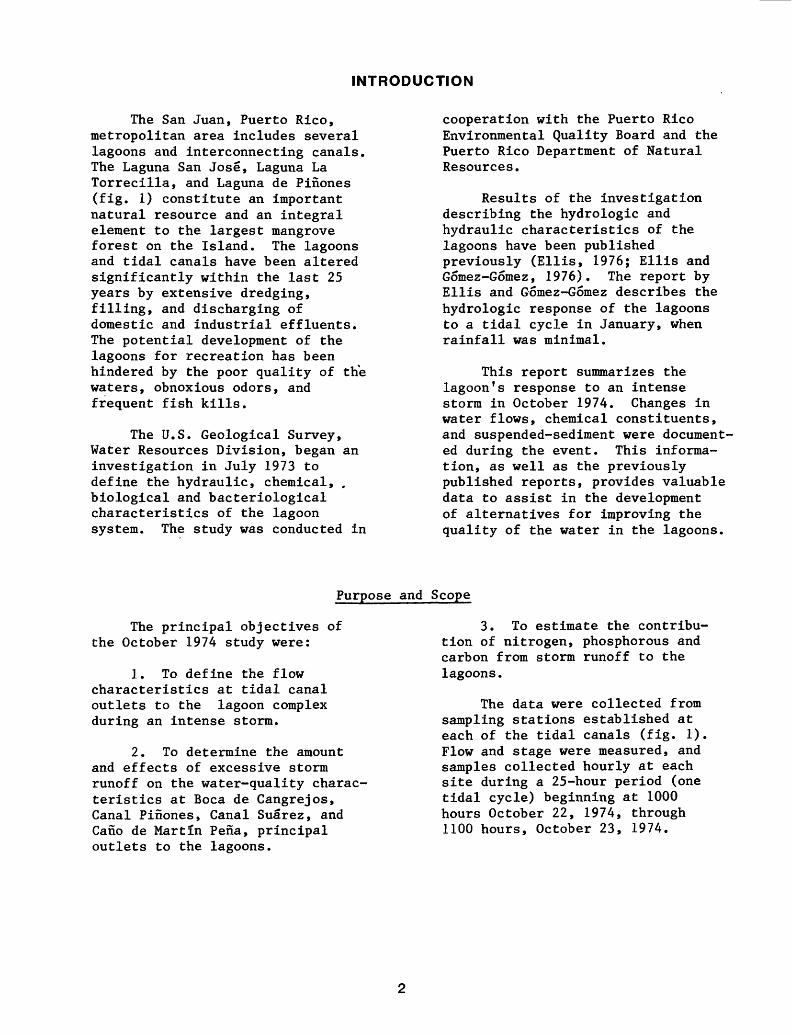
The San Juan, Puerto Rico, metropolitan area includes several lagoons and interconnecting canals. The Laguna San Jose, Laguna La Torrecilla, and Laguna de Pinones (fig. 1) constitute an important natural resource and an integral element to the largest mangrove forest on the Island. The lagoons and tidal canals have been altered significantly within the last 25 years by extensive dredging, filling, and discharging of domestic and industrial effluents. The potential development of the lagoons for recreation has been hindered by the poor quality of the waters, obnoxious odors, and frequent fish kills.
The U.S. Geological Survey, Water Resources Division, began an investigation in July 1973 to define the hydraulic, chemical, . biological and bacteriological characteristics of the lagoon system. The study was conducted in
cooperation with the Puerto Rico Environmental Quality Board and the Puerto Rico Department of Natural Resources.
Results of the investigation describing the hydrologic and hydraulic characteristics of the lagoons have been published previously (Ellis, 1976; Ellis and Gomez-Gomez, 1976). The report by Ellis and Gomez-Gomez describes the hydrologic response of the lagoons to a tidal cycle in January, when rainfall was minimal.
This report summarizes the lagoon's response to an intense storm in October 1974. Changes in water flows, chemical constituents, and suspended-sediment were document ed during the event. This informa tion, as well as the previously published reports, provides valuable data to assist in the development of alternatives for improving the quality of the water in the lagoons.
Purpose and Scope
The principal objectives of the October 1974 study were:
1. To define the flow characteristics at tidal canal outlets to the lagoon complex during an intense storm.
2. To determine the amount and effects of excessive storm runoff on the water-quality charac teristics at Boca de Cangrejos, Canal Pinones, Canal Suarez, and Cano de Martin Pefia, principal outlets to the lagoons.
3. To estimate the contribu tion of nitrogen, phosphorous and carbon from storm runoff to the lagoons.
The data were collected from sampling stations established at each of the tidal canals (fig. 1), Flow and stage were measured, and samples collected hourly at each site during a 25-hour period (one tidal cycle) beginning at 1000 hours October 22, 1974, through 1100 hours, October 23, 1974.

66007'30'
I
5'
18°35'
32'30'
OCEANO ATLANTICO
30'
27'30'
18°25'
Study Area ZZh-^
San Juan
PUERTO RICO
MAR CARIBE
02'30" 66°
EXPLANATION
A FLOW, CHEMICAL, AND SEDIMENT
65°57'30'
MEASUREMENT SITE
NATIONAL WEATHER SERVICE STATION
AVENIDA BALDORIOTY DE CASTRO PUMPING STATION
^ RAINFALL STATION
A- TIDE GAGE
SEWAGE TREATMENT PLANT
D
LOCATION MAP
OCEANO ATLANTICO
Boca de Cangre/os
LagtinaLa Torrecilla
Laguna de Pinones
Cano de San Antonio
Bahla deSan Juan
INTERNATIONAL
AIRPORTLaguna del Condado
Canal/nones
ft/o Puerto Nuevo
Avenida Barbosa^
Bridge
Laguna San
Jose Hwy. 26 Bridge
Quebrada San Anton
Agricultural Experiment Station
Vistamar Sewage
?KILOMETERSTreatment Plant
Avenida Monserrate
Bridge
CanalHwy. 3\\ Blasina Bridge/ Quebrada
BlasinaCarolina Sewage Treatment Plant_____I
Figure 1. General features of San Juan Lagoons project area.

Methods and Procedures
Flow measurements were made at each site hourly during the tidal cycle. Procedures described by Buchanan and Sommers (1969) were used. Stages were recorded from staff gages installed at each site and referenced to local daturas.
Water samples for chemical and suspended-sediment analyses were collected with point samplers in accordance with procedures described by Brown and others (1970) and Guy (1969). Samples were integrated vertically and horizontally.
Analyses of the water samples included field determinations of specific conductance and temperature, Laboratory analyses were performed at the U.S. Geological Survey Central Laboratory in Doraville, Georgia, and included determinations of total and dissolved species of phosphorus, nitrogen, and organic carbon. Suspended-sediment samples were collected only at Boca de Cangrejos, Canal Pinones, and Canal Suarez, and analyzed at the U.S. Geological Survey field laboratory in Puerto Rico.
The storm-runoff contributions to each lagoon were computed from changes in water-surface elevations and the flow measurements at each canal or outlet. Loads of total organic carbon, total phosphorus, and total Kjeldahl nitrogen (nitro gen available in organic matter and as ammonia) were computed similarly.
Precipitation data were obtained from a network of stations operated by the National Weather Service and supplemented by data from the U.S. Geological Survey. Runoff and direct contribution of rainfall to the lagoons were computed from average precipitation loads and surface areas of the lagoons or drainage basins.
The techniques used to compute the flow of water at the outlet sites and to compute the chemical loads are described by Ellis and Gomez-Gomez (1976). The data collected during this study are published in "Water Quality and 4Iydraulic Data San Juan Lagoons System, Puerto Rico, by S.R. Ellis and Fernando Gomez-Gomez, 1975".
PHYSICAL CHARACTERISTICS OF THE SAN JUAN LAGOONS SYSTEM
The San Juan Lagoons SystemThe San Juan Lagoons system
includes Laguna San Jose, Laguna La Torrecilla, and Laguna de Pinones (fig. 1). The lagoons are hydraulically connected by a system of natural and man-made canals. Laguna San Jose, the largest of the three, is connected to Bahia de San Juan by way of Cano de Martin Pena. Two main creeks (Quebrada Juan Mendez and Quebrada San Anton) flow directly into Laguna San Jose. Canal Suarez connects Laguna San Jose to Laguna la Torrecilla which is located east of the Isla Verde International Airport. Laguna la Torrecilla is perhaps the most complex of the three lagoons, since it is also connected to the Oceano Atlantic© at the Boca de Cangrejos outlet and to Laguna de Pinones through Canal Pinones. It also receives the flow of Quebrada Blasina, a creek flawing from the
southeast end of the study area. The creek has been dredged and becomes Canal Blasina north of Highway 3. Canal Blasina provides the actual connection of Laguna de Pinones with Laguna la Torrecilla by way of Canal Pinones. Laguna de Pinones, the smallest of the three, is surrounded by Bosque Estatal de Pinones, the largest mangrove forest in Puerto Rico. Canal Pinones is the lagoon's only outlet.
The tidal and hydraulic characteristics of the San Juan lagoons have been described by Ellis and Gomez-Gomez (1976). Tide records during periods unaffected by runoff were as follows: at Laguna San Jose a maximum daily amplitude of 0.15 meter (m); at

PHYSICAL CHARACTERISTICS OF THE SAN JUAN LAGOONS SYSTEM-Continued
Laguna La Torrecilla, much closer to the system's principal ocean outlet, Boca de Cangrejos, maximum daily tidal amplitude of 0.6 m; at Laguna de Pinones a maximum daily amplitude of 0.26 m. Approximate boundaries of the basins draining into the San Juan Lagoons are shown in figure 2.
Laguna San Jose
Laguna San Jose, the largest lagoon, has a surface area of 547 ha (fig. 3). It has an average volume of 13.2 hm and an average depth of 2.4 m. About 90 percent of the watershed area of the lagoon is urbanized. Mangrove stands border the north and east perimeters
Laguna San Jose has been dredged locally to depths ranging from 5 to 11 m. About 17 percent of the entire lagoon area has been
66° 05' 66°00'
dredged below the natural maximum depth of 2.5 m (Ellis, 1976).
Most of the freshwater that flows into Laguna San Jose is urban runoff. Quebrada San Anton and Quebrada Juan Mendez (fig. 3) with a combined drainage area of 22 km , provide most of the runoff to the lagoon. Additional runoff from an area of about 2 km flows into the lagoon from a combined sewage- storm-drain system at the Baldorioty de Castro Avenue pump station. Several unnammed tributaries and culverts add about 15 km to the drainage area. The limestone aquifer which underlies the San Juan area may be discharging up to 18,000 m per linear kilometer per day along a fresh- salt-water zone (Anderson, 1975). This source may contribute as much as 50,000 m /d of freshwater to the lagoon.
65°55'
18°30'
18°25' -
18°20' -
Figure 2. Drainage basins of San Juan Lagoons.
5

6603'
18°27'30"
2*30 660Q'30'
27'
26*30" -
26*
25'30"
18»25'
Martin
Barbosa Brige
Figure 3. General features of Laguna San JoseT

PHYSICAL CHARACTERISTICS OF THE SAN JUAN LAGOONS SYSTEM-Conlinued
Brackish water flows into Laguna San Jose through Canal Suarez and Cano de Martin Pena. Canal Suarez connects Laguna San Jose to Laguna La Torrecilla, where brackish water results from the inflow of sea water at the Boca de Cangrejos outlet. The canal, about 3.3 km long, 2 to 7 m deep, and 5 to 50 m wide, is an unimproved man-made channel bordered by man groves. Carlo de Martin Pena, which connects Laguna San Jose to Bahia de San Juan, meanders through several densely populated areas, receiving significant amounts of domestic-waste discharges and urban runoff. The Cano has an average depth of 1 m, is 10 to 30 m in width, and is 5.1 km in length. At many places it is clogged with debris.
Ellis and Gomez-Gomez (1975) report that the annual average specific conductance at Laguna San Jose is about 20,000 micromhos per centimeter (umhos/cm) in areas less than 2.5 m deep. In areas dredged below 2.5 m depth, the specific conductance averages 40,000 umhos/cm.
Laguna La Torrecilla
Laguna La Torrecilla has a surface area of about 246 ha and an average depth of about 2.4 m. The lagoon is connected on the north to the ocean by way of Boca de Cangrejos, a natural opening to the sea (fig. 4).
The lagoon's principal fresh
water source is Canal Blasina (Quebrada Blasina). The canal, which drains a mostly urban area of about 22 km , is affected by tides as far inland as Avenida Monserrate Bridge (fig. 1). Canal Blasina is heavily polluted with sewage dis charges from the Carolina and Vistamar sewage-treatment plants.
The combined discharges from these plants into the canal average about 10,000 m /d. Additional sewage flows are discharged into the headwaters of the stream upstream from the study area. Flow from the headwaters, during low flow condi tions, is about 10,000 m /d thus average discharge to the lagoon is about 20,000 m /d. Ground-water flow into the lagoon is negligible since the lagoon is seaward of sthe underlying aquifer's fresh-salt water interface.
Dredging in Laguna La Torrecilla has been more extensive than at any of the other two lagoons. Ellis (1976) estimated that the volume of the lagoon has been increased about 2.8 times by dredging. Seawater flowing through Boca de Cangrejos accumulates in the dredged areas. The salinity of the water in Laguna La Torrecilla can be as much as 90 percent that of seawater, with extreme variations in the water column and with time. The annual average specific conductance for depths less than 1 m is about 45,000 umhos/cm. At depths greater than 3 m the specific conductance is equal to that of sea water 50,000 umhos/cm.

66°59'30"
1
65°58'
18°27'30"
27' ~
26'30" -
18°26' -
Boca de Cangrejos
BridgeEXPLANATION
FLOW, CHEMICAL, AND SEDIMENT MEASUREMENT SITE _
TIDAL GAGE
MANGROVES
INTERNATIONAL
__ AIRPORT
Urbanized Area
1 KILOMETER
Vistamar Sewage Treatment Plant
Figure 4. General features of Laguna La Torrecilla.
8

PHYSICAL CHARACTERISTICS OF THE SAN JUAN LAGOONS SYSTEM-Continued
Laguna de Pifiones
Laguna de Pinones, the small est of the lagoons, has a surface area of 105 ha, an average volume of 0.87 hm , and an average depth of 0.8 m (fig. 5). The lagoon is surrounded by the Bosque Estatal de Pinones, a mangrove forest. The forest is bisected by a network of man-made drainage canals (fig. 2). The lagoon is connected to Canal Blasina and Laguna La Torrecilla by Canal Pinones. During extreme floods the lagoon, mangrove swamp and canal receive flow from the Rio Grande de Loiza (Haire, 1975). The total area draining to the lagoon
is indeterminate as a result of the complex canal system in the mangrove forest.
Brackish-water flows into Laguna de Pinones from the eastern end of Laguna La Torrecilla through Canal Pinones. Ellis (1976), docu mented the density, tidal, and canal configuration features that induce the flow of brackish water into the lagoon. Prior to the start of the present study, Laguna de Pinones had a stable specific conductance of about 43,000 umhos/cm.
65058* 57'30" 57' 65°56'30"18°27'
26'30" -
18°8"
EXPLANATION
FLOW, CHEMICAL, AND SEDIMENT MEASUREMENT
ATIDAL GAGE
Mangroves
T;
1 KILOMETER
Vistamar Sewage
(Treatment Plant
Figure 5. General features of Laguna de Pinones.
STORM CHARACTERISTICS
Precipitation
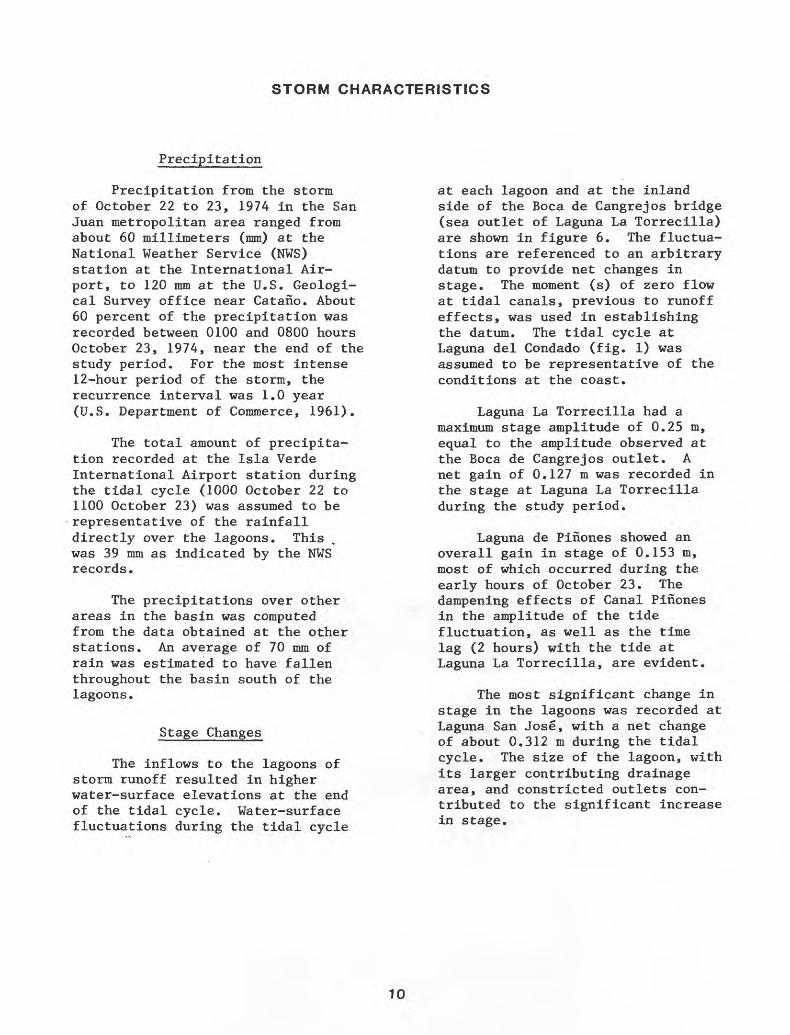
Precipitation from the storm of October 22 to 23, 1974 in the San Juan metropolitan area ranged from about 60 millimeters (mm) at the National Weather Service (NWS) station at the International Air port, to 120 mm at the U.S. Geologi cal Survey office near Catano. About 60 percent of the precipitation was recorded between 0100 and 0800 hours October 23, 1974, near the end of the study period. For the most intense 12-hour period of the storm, the recurrence interval was 1.0 year (U.S. Department of Commerce, 1961).
The total amount of precipita tion recorded at the Isla Verde International Airport station during the tidal cycle (1000 October 22 to 1100 October 23) was assumed to be representative of the rainfall directly over the lagoons. This was 39 mm as indicated by the NWS records.
The precipitations over other areas in the basin was computed from the data obtained at the other stations. An average of 70 mm of rain was estimated to have fallen throughout the basin south of the lagoons.
Stage Changes
The inflows to the lagoons of storm runoff resulted in higher water-surface elevations at the end of the tidal cycle. Water-surface fluctuations during the tidal cycle
at each lagoon and at the inland side of the Boca de Cangrejos bridge (sea outlet of Laguna La Torrecilla) are shown in figure 6. The fluctua tions are referenced to an arbitrary datum to provide net changes in stage. The moment (s) of zero flow at tidal canals, previous to runoff effects, was used in establishing the datum. The tidal cycle at Laguna del Condado (fig. 1) was assumed to be representative of the conditions at the coast.
Laguna La Torrecilla had a maximum stage amplitude of 0.25 m, equal to the amplitude observed at the Boca de Cangrejos outlet. A net gain of 0.127 m was recorded in the stage at Laguna La Torrecilla during the study period.
Laguna de Pinones showed an overall gain in stage of 0.153 m, most of which occurred during the early hours of October 23. The dampening effects of Canal Pinones in the amplitude of the tide fluctuation, as well as the time lag (2 hours) with the tide at Laguna La Torrecilla, are evident.
The most significant change in stage in the lagoons was recorded at Laguna San Jose, with a net change of about 0.312 m during the tidal cycle. The size of the lagoon, with its larger contributing drainage area, and constricted outlets con tributed to the significant increase in stage.
10

co
oc UJ i- UJ UJ _j UJ
UJ o < u. oc D
CO cc UJ 1
0.6
0.5
0.4
0.3
0.2
0.1
Note
: Laguna
del
Condado
gage re
fere
nce
d
tom
ea
n
sea
leve
l d
atu
m.O
scilla
tio
n
of
Laguna
del
Condado
was
assum
ed
to re
pre
se
nt
off
sh
ore
sta
ge
near
co
ast.
M
om
ent
of
zero
flo
w
at
dis
ch
arg
e
measure
ment
site
s
was
use
d
in
esta
blish
ing
lo
ca
l sta
ge
datu
m fo
r o
the
r lo
ca
tio
ns
show
n.
Boca
de
C
angre
jos
site
is
lo
ca
ted
o
n
inla
nd
sid
e
of
Hw
y 1
87
b
rid
ge
.
Laguna
del
Condado
Laguna
La
T
orr
ecilla
Laguna
de
P
ifio
nes
y-
I08
10
12
14
16
18
October 22
20
22
24
TIM
E,
HO
UR
S
02
04
06
08
October 23,1974-
10
12
Fig
ure
6. W
ate
r-surf
ace fluctu
ations a
t Laguna d
el
Co
nd
ad
o,
Boca
de
C
angre
jos,
Laguna S
an J
oseT
La
gu
na
La
Torr
ecill
a,
and
La
gu
na
de
Pin
ones.

FLOW CHARACTERISTICS AND MAGNITUDE
The effects of storm runoff on the lagoon system during periods of either normal or intense precipita tion can be determined only by si multaneous flow and stage measure ments at the inlets and outlets that feed or drain the lagoons. Flow and stage determinations at the selected stations (fig. 1), are complicated by changes in direction of flow with changes in tide or out flow from a particular lagoon.
The termination of the study at the end of the tidal cycle prevented an assessment of the overall effects of the storm in the flow characteristics at the measured sites. At the end of the study, stages and flows were still actively changing, and most of the accumula ted runoff was still stored in the lagoons. However, the data collec-
100
ted can be used to estimate or model the hydrologic behavior of the lagoon system over the entire storm- response cycle.
Boca de Cangrejos Outlet
The flow direction at Boca de Cangrejos outlet followed the tidal fluctuations (fig. 7). The proxim ity of the ocean was reflected in the domination of flow direction by the tide. A significant increase in the flow toward the ocean occurred during the second ebbtide. Integra tion of the hourly measurements indicate that 1.5 hm entered Laguna La Torrecilla from the floodtides and 2.9 hm left the lagoon by way of Boca de Cangrejos from the combined effects of the ebbtide and storm runoff.
I I I I I0800 1000 1200 1400 1600 1800 2000 2200 2400 0200 0400 0600 0800 1000 1200
TIME, HOURS October 22, 1974 October 23, 1974
Figure 7. Flow pattern at Boca de Cangrejos.
12

FLOW CHARACTERISTrCS AND MAGNITUDE-Continued
Canal Pinones
The flow measurements at Canal Pinones showed that the water move ment also followed the tide patterns (fig. 8). During the tidal cycle, about 0.21 hm of water flowed into Laguna de Pinones, while 0.15 hm discharged through Canal Pinones. The water flowing into Laguna de Pinones in addition to rainfall runoff, may have been from either Canal Blasina or Laguna La Torre- cilia. The combination of the
amount of runoff in Canal Blasina, and the head of water in Laguna La Torrecilla, determines the source of the inflows to Laguna de Pinones. Differences in the chemical charac teristics in the waters from the two sources may be used to determine which was the main flow contributor to Laguna de Pinones. This is explained in the section on water- quality characteristics.
No flow during this period.
1600 1800 2000 2200 2400 0200 0400 0600 0800
TIME, HOURS
1000 1200
October 22, 1974 October 23,1974-
Figure 8. Flow pattern at Canal Pinones.
13

FLOW CHARACTERISTICS AND MAGNITUDE-Continued
Canal Suafez at Highway 26 Bridge
The measuring site at Canal Suarez was located at the Highway 26 (old) bridge. Staff gages were placed on both abutments of the bridge and stage readings were made concurrent with each flow measure ment as the flow at the site is constricted by the bridge. This is
evident from water-surface eleva tions that drop in the direction of the flow (fig. 9). The site is tidal affected with fluctuations during dry weather conditions from about 0.05 m on the Laguna San Jose side to 0.16 m on the Laguna La Torrecilla side.
0.5
0.4
O0.3
ill_i UJUJ ^ _ O 0.2< a. ccD CO
CCUJ 0.1H
I I I I I
0408 10 12 14 16 18 20 22 24 02
TIME, HOURS I October 22, 1974 I October 23, 1974
06 08 10 12
Figure 9. Water-surface fluctuations at upstream and downstream sides of Hwy. 26 bridge at Canal Suafez. (Arbitrary datum, same as that of figure 6.)
14

FLOW CHARACTERISTICS AND MAGNITUDE-ConUruied
Integration of the flow-rate curve at the Canal Suarez site (fig. 10) showed that 0.27 hm entered Laguna San Jose from Canal
Suarez during the floodtides, while 0.43 hm were discharged from the combined ebbtide and storm runoff effects.
0800 1000 1200 1400 1600 1800 2000 2200 2400 0200 0400 0600 0800
TIME, HOURS I October 22,1974 I October 23,1974-
1000 1200
Figure 10. Flow pattern thru Canal Sua'rez at Hwy. 26 bridge.
15

FLOW CHARACTERISTICS AND MAGNITUDE-Continued
Cafio de Martin Pena at Avenida Barbosa
The Cafio de Martin Pena site was located at the Avenida Barbosa bridge (fig. 1). The flows in the Cafio, which connects Laguna San Jose to Bahia de San Juan followed the predicted tidal pattern until about 2200 hours on October 22, (fig. 11). At that time the ebbtide was interrupted and the flow reversed toward Laguna San Jose. The flow direction in Cafio de Martin Pefia was in phase with the flow at Canal Suarez until storm runoff reached the canals. This canal is unique in that it is the only one which receives directly a significant amount of the total basin runoff (fig. 2). The areas in the Hato Key and Santurce districts (fig. 1), which drain about 9.5 km of urban developments, drain directly into Cafio de Martin Pefia. The relatively small surface area of Cafio de Martin Pefia in comparison to its immediate drainage basin and the limited conveyance of the canal are responsible for rapid rises of its water surface during intensive rainstorms. Flow into Laguna San Jose from Cafio Martin Pefia lasted about one hour longer than that from Canal Suarez.
Water inflow to Laguna San Jose through Cafio de Martin Pefia^during the tidal cycle was 0.17 hm . Discharges from the lagoon to Bahia de San Juan totalled 0.15 hm during the same period.
Storm Runoff Contributions to the Lagoons
One of the main objectives of the study was to determine the storm runoff contributions to the San Juan Lagoons system. This was achieved by flow measurements at the principal outlets and inlets to the three lagoons and by a water balance of
all the other inflow-outflows.
The water balance at each lagoon may be represented by the equation:
IS = SR + DR + TC + BF where IS = increase in storage;
SR = storm runoff con tribution;
DR = direct rainfall; TC = net flow measured
at the tidal canals; and
BF = base-streamflowcontributions from 1000 hrs to 2400 hrs, Oct. 22.
The increase in storage at each lagoon was computed from changes in water levels during the study period. The net water-level changes were obtained from the recording gages at each lagoon. The net change in water level was multiplied by the surface area of the lagoon to compute the change in volume. The general assumption was made that the surface area of the lagoons did not increase signifi cantly due to the increase in volume because the banks of the lagoons are nearly vertical. These computations showed an increase in storage of 1.7 hm for Laguna San Jose, 0.30 hm for Laguna La Torrecilla, and 0.16 hm for Laguna de Pinones.
The contributions from rainfall were computed by multiplying the surface area of each lagoon by the amount of precipitation. As previously indicated, an average of 39 mm of rainfall was assumed to represent the direct rainfall over the lagoons. The precipitation contribution to laguna^San Jose was 0.21 hm , with 0.10 hm computed ^or Laguna La Torrecilla, and 0.04 hm for Laguna de Pinones.
16

DISCHARGE, IN CUBIC METERS PER SECOND
Flow to Bahfa de San Juan | Flow to Laguna San Jose
(DC ^ CD
II
31 o
CD
3 -* 3- ^ C
O
Q. CD
13 CD 31
CD3_5! OJ
DO
Q. (Q CD

FLOW CHARACTERISTICS AND MAGNITUDE-Continued
Base-flow contributions are summarized as follows:
a) Quebrada San Anton and., Quebrada Juan Mendez = 0.02 hm
b) Quebrada Blasina, Carolina and Vistamar STP's =0.01 hm
c) Avenida Baldorioty de _ Castro pump station = 0.01 hm
The contribution from the pump station to Laguna San Jose was obtained from daily pumpage records, A total of 0.05 hm was pumped during the storm period.
The computations and water balances for each lagoon are summarized in figure 12. The direction of the arrows indicate the direction of flow. There were no adjustments for evapotranspira- tion losses, which probably were negligible during the study period.
The data in figure 12 show that the storm runoff during the period of study received by the lagoons totalled about 3.2 hm , of which about 50 percent flowed into Laguna San Jose, 48 percent into Laguna La Torrecilla and 2 percent into Laguna De Pifiones. At the end of the study period, Laguna San Jose retained in storage about 75 percent of the total water input. In comparison, Laguna La Torrecilla had discharged through the Boca de Cangrejos outlet nearly 85 percent of the inflows it received. Flows out of Laguna San Jose were restric ted at Cano de Martin Pena by the increase in head in this canal from direct storm runoff flowing into it, The discharges from Laguna San Jose are also restricted by the limited conveyance in Canal Suarez.
0.21
BALDORIOTY DE CASTRO AVENUE PUMP HOUSE 0.06
CANO MARTIN PENA 0.02
Quebrada San Anton
(Base flow) 10.02
STORM RUNOFF
NOTE: ALL VOLUMES IN CUBIC HECTOMETERS (HM3) AREA IN HECTARES (HA)
AS MEANS CHANGE IN STORAGE
Figure 12. Net water flows and gain in storage at Laguna San Jose, Laguna La Torrecilla, and Laguna de Pinones, during the 22-23 October, 1974 storm.
18

FLOW CHARACTERISTICS AND MAGNITUDE-Continued
Water from Canal Blasina flows with a minimum of resistance into Laguna La Torrecilia, water in the Lagoon also flows toward the ocean at the open outlet of Boca de Cangrejos; only extreme floodtides may create enough backwater to limit the flows. Laguna de Pinones, in the meantime, did not undergo any net outflow, but increased its storage until backwater from Laguna La Torrecilla was no longer effective.
WATER QUALITY CHARACTERISTICS
Water Quality in the San Juan Lagoons
Ellis and Gomez (1975) described the general water-quality characteristics of Laguna San Jose, Laguna La Torrecilla and Laguna de Pinones lagoons. Their findings indicate that very poor water- quality conditions prevail in the lagoons system. The key water- quality indicators are represen tative of heavily polluted systems. Dissolved-oxygen concentrations range from supersaturation caused by massive algal blooms to anaerobic conditions that result in widespread fish kills. Nitrogen and phosphorus concentrations are characteristic of hypereutrophic systems, and organic carbon-concentrations reflect the organic loads discharged into the lagoons from domestic sewage. The extensive dredging in Laguna La Torrecilla and Laguna San Jose, which has created deep pockets of stagnant saline water devoid of oxygen, compounds the problem (Ellis, 1976). Overall, Laguna San Jose is the most heavily polluted of the three lagoons.
During periods of low flows the principal tributaries to the lagoons contribute relatively large concentrations of organic matter and nutrients. Chemical analyses of samples collected at the prin cipal surface-water inflows to the
lagoons during low flows are summarized in table 1. All the samples except the one at the Baldorioty Avenue Pump Station, were collected on October 22, 1974, prior to the storm. The sample from the Pump Station was collected in February 1975. The results of the Pump Station sample are considered valid, since there had been no significant changes in the area drained by the Pump Station.
The data in table 1 show that the quality of the water in the tributaries varies considerably during any day. Daily fluctuations in the quality of the effluent from sewage treatment plants have been documented by Metcalf and Eddy (1972). Regardless of the daily variations, the analyses show that these sources contribute significant loads of carbon and nutrients to the lagoons. The low-flow effects of these loads are described by Ellis and Gomez (1976); however, as shown in the following section, the low- flow contributions to the lagoon system are relatively minor when compared to those of storm runoff.
The study objective to deter mine the contribution from storm runoff to the water-quality condi tions in the lagoons directed the nature and scope of the sampling during the October 22 to 23 storm. The parameters sampled are associated with the most critical problems in the lagoons. Organic carbon provides a measure of domes tic loads and biological activity.
The dissolved and suspended species of nitrogen and phosphorus, and their different oxidation states (that is organic, ammonia, nitrite, and nitrate-nitrogen), provides evidence of degree of eutrophica- tion, and biological activity. Specific conductance determinations were used to estimate brackish water contributions and extent.
19

WATER QUALITY CHARACTERISTICS-Continued
TABLE 1. Water quality of surface-water flows into lagoons duringlow-flow conditions, October 22, 1974 (all values are in
milligrams per liter, except SC which is in micromhos percentimeter at 25°C)
Site Time SC TOC TP ToPO,-P TKN 4
1 0925 492 10 1.7 1
1 1640 519 23 2.6 1
2 0850 376 8.0 .84
2 1625 309 12 .60
3 0730 517 14 1.1
3 1600 328 20 .76
4 1040 678 29 7.6 6
5 0900* 19,000 15 1.3
Site number
1 Quebrada
2 Quebrada
3 Quebrada
4 Carolina
5 Avenida
.5
.8
.79
.48
.92
.63
.5
.98
6.
2.
2.
4.
1.
22
5.
0
26
6
1
1
4
4
TON
1.1
.26
.50
.70
1.1
1.0
.00
1.3
TNH4-N NO
4.9 0
.00
2.1
1.4
3.0
.38
22
4.1
2,3-N
.06
.01
.24
.34
.27
.60
.01
.03
Source
Blasina at Highway 3
San Ant on at
Juan Mendez
Avenida
at Calle
Campo Rico
Belmonte
Sewage Treatment Plant Outfall
Baldc>rioty de Castro I*ump Station
at sump
*Sample taken on February 25, 1975, when low-flow conditions prevailed at
at this site similar to flow rate prior to the lagoon study.
20

WATER QUALITY CHARACTERISTICS-Contfnued
Chemical Loads During the October 22-23, 1974 Storm
The loads of selected com ponents through each of the principal inlets-outlets of the lagoon system were computed on the basis of the instantaneous samples and flow determinations at each site. The computations include loads of total organic carbon (TOC), total phosphorus (TP), total orthophosphate (TPO,-P), total organic nitrogen (TON), total ammonia nitrogen (TNH.-N), nitrate (N03-N), nitrite (NO -N), and suspended sediment (SED).
Boca de Cangrejos
Load data for the Boca de Cangrejos outlet show that all of the components measured followed the prevailing tidal pattern (fig. 13). Discharges to the ocean increased with the ebbtide, receding for several hours during the early hours of October 23, and increasing again toward the ocean as the storm runoff reached Laguna La Torrecilla. From 80 to 100 percent of the individual components were in solu tion. Most of the phosphorus was in the more soluble orthophosphate state, readily accessible for assimilation by algae.
The suspended-sediment curve in figure 13 shows almost a balance between the inflows and outflows. Strong winds and wave actions during the floodtide may have caused the suspension and inflow into Laguna La Torrecilla of sand particles. On the first floodtide (before storm effects) mean velocities into the lagoon at the outlet were as high as 0.69 meter per second (m/s), with maximum suspended-sediment concentrations of 25 milligrams per liter (mg/L). On the second flood- tide, (during the storm) the mean velocity into the lagoon peaked at
0.41 m/s while the suspended-sediment concentration was about 35 mg/L, reflecting the increased sediment load in the coastal water (fig. 14).
Canal Pinones
The load and flow-rate curves at the Canal Pinones station followed the prevailing tidal cycle (fig. 15). Between 0520 and 0600 hours, October 23, flow at the canal was stagnant, probably due to storm runoff into Canal Blasina over-coming the flood tide in its early stage.
Overall, the integration of the transport curves show that the net inflow to Laguna De Pinones of each of the measured components exceeded the outflow. This could indicate that Laguna de Pinones is a sink in the lagoon system for organic carbon, nitrogen, and phos phorus. However, since the system had not reached equilibrium from the storm effects at the time the study was terminated, additional exports probably occurred during the next ebbtide.
Chemical analyses of filtered samples show that a significant part of the carbon, phosphorus and nitrogen flowing through Canal Pinones was in solution. Soluble phosphorus varied from 45 to 90 percent, with the higher percentages occurring during the period of heavy runoff (early hours October 23). Ammonia nitrogen followed a trend similar to phosphorus with the soluble fraction varying from 35 to 90 percent of the total. An average of \30 percent of the organic nitrogen was in solution throughout most of the period.
21

2000
1000
Oce'ano Atla'nticoOce'ano Atlantico
Laguna La Torrecilla Laguna La Torrecilla
TOTAL PHOSPHATE AS PHOSPHORUSTOTAL ORGANIC CARBON
Oce'ano Atla'ntico Oceano Atlantico
Laguna La Torrecilla Laguna La Torrecilla
CO
5
cc0
100
TOTAL PHOSPHORUS
Laguna La Torrecilla
0800 12001600 2000 2400 04000800 1200
Octubre 22,1974 TIME, HOURS Octubre 23,1974I I I
SUSPENDED SEDIMENT
EXPLANATION
FLOW
0800 1200 160020002400 0400O800 1200
October 22, 1974 TIME, HOURS Octubre 23,1974
SEDIMENT OR CHEMICAL CONSTITUENT TRANSPORT
Curves above zero line are flow and transport to Oce'ano Atlantico*, below are to Laguna La Torrecilla.
TOTAL ORGANIC NITROGEN
Figure 13. Flow pattern of chemical constituents and suspended sediments thru Boca de Cangrejos.
22

1 .O
O
ffl
O
z£ 1 -°§1UjUl
-Ju.co<"
lillll
O.O
1 1 1 1 1 1 1 1
O Flood tide data
El Ebb tide data
| Solid symbols repre- ? sent data during
B M storm." §
~ ° 0 A "00
00
^0 0 A
1 1 1 1 1 1 1 1
0 5 10 15 20 25 30 35 40 45 SUSPENDED SEDIMENT, IN MILLIGRAMS PER SECOND LITER
Figure 14: Suspended sediment concentration as related to mean flow velocity at Boca de Cangrejos during October 22-23,1974 study.
Figure 14. Suspended sediment concentration as related to mean flow velocity at Boca de Cangrejos during the 22-23 October, 1974 study.
23

400
300200
100
0
100200
300400
1 ' 1 ' 'Lagunafde Pinones
Qz o oLU CO
CC LUQ.
CO
CCo
16
128
4
0
4
8
1216
40
3020
10
0
1020
3040
Laguna La jTorrecilla i i i . 1 . i . i
TOTAL ORGANIC CARBON
LagunaIde Pinones
Laguna La Torrecillai i i . i i i i
TOTAL PHOSPHORUS
iLaguna LaJTorrecillai . i . i i I i i
0800 1200 1600 20002400 04000800 1200I I \
October 22,1974 October 23,1974 TIME, HOURS
400300
200
100
0
100
200
300400
~ f
Laguna La|Torrecilla I . i . i . i . i i i
TOTAL AMMONIUM AS NITROGEN
LagunaIde Pinones
Laguna La Torrecilla i i i i i I i I
TOTAL PHOSPHATE AS PHOSPHORUS
r | r^ r -r y-
Lagunalde Pifiones
Laguna La jTorrecilla wi i i . i . i . i .
08001200160020002400040008001200I I I
October 22,1974 October 23,1974 TrME, HOURS
TOTAL ORGANIC NITROGEN EXPLANATION
Flow
SUSPENDED SEDIMENT
Sediment or constituent transport
Curves above zero line are flow and transport to Laguna de Pinones ; below are to Laguna La Torrecilla
Figure 15. Flow pattern of chemical constituents and suspended sediment thru Canal Pinones.
oz o oLU CO
CC III CL
CO CCLUI- LU
OmD O
24

WATER QUALITY CHARACTERISTICS-Continued
The average ratio of TPO.-P to TP at Canal Pifiones was 0.18 during the ebbtides and 0.42 during the floodtides. Sewage inputs into Cana'l Blasina, rich in inorganic orthophosphates, contribute to increase the flow of TPO.-P into Laguna de Pifiones. A sample collected at the Carolina sewage treatment plant discharge into Canal Blasina showed that about 85 percent of the phosphorus was in the orthophosphate form. Similarly, there was essentially no ammonia nitrogen flowing out of Laguna de Pifiones during the ebbtide, while about 30 percent of the total nitrogen during the floodtides was in the form of ammonia. In the sewage treatment plant effluent, all of the available nitrogen was ammonia nitrogen.
The suspended-sediment concen tration at Canal Pifiones was about 21 mg/L during both the ebb and flood-tides prior to the storm. At the peak of the storm-runoff, the suspended-sediment concentration flowing out of Laguna de Pifiones was about 83 mg/L. Runoff from the man grove forest contributed to the increased sediment concentration.
Canal Suarez at Highway 26 Bridge
The transport and flow curves at the Canal Suarez station indicate a net outflow from Laguna San Jose to Laguna La Torrecilla of each of the chemical constitutents determin ed (fig. 16). The flushing of Laguna San Jose into Laguna La Torrecilla during periods of high storm runoff is evident.
Similar to the other tidal stations in the lagoon system, most of the organic carbon, nitrogen,
and phosphorus were in solution. About 95 percent of the organic carbon was in soluble form, while soluble phosphorus varied from 75 to 90 percent of the total. The available nitrogen, 96 percent of which was organic, included about 85 percent in solution.
The suspended-sediment concentration at Canal Suarez varied from 20 to 43 mg/L. The maximum occurred during the flood- tide prior to the storm. High- suspended sediment in the discharge from culverts near the station may have influenced the maximum measured concentration.
Perhaps the most significant feature of the transport curves in figure 16 is the magnitude of the increase in the concentration of the chemical constituents with the increase in flow. In an unsteady system, one would expect that after the initial slug of water with high chemical concentrations, additional slugs would tend to have lower con centrations. However, except for ammonia and suspended sediment, which peaked around 0900 hours on October 23, all of the components followed the rise in flow until the termination of the study. Normally, a limited amount of carbon and nutrients is available in the basin to be flushed by storm runoff. It is possible that this point was not reached in the study 9 and the basin was still yielding large loads of carbon and nutrients. A second possibility is that lagoons, in particular Laguna San Jose, act as temporary sinks of chemicals. These are removed and transported during storms. Continuation of the study could have yielded additional data to answer, these questions.
25

TOTAL ORGANIC CARBON
TOTAL PHOSPHORUS
Laguna LalTorrecilla
1608001200 16002000 240004000800 1200
TIME, HOURSOctober 22,1974 October 23,1974
TOTAL ORGANIC NITROGEN
Laguna LalTorrecilla
TOTAL AMMONIUM AS NITROGEN
TOTAL PHOSPHATE AS PHOSPHORUS
Laguna La Torrecilla
40008001200 1600 200024000400 0800 1200
TIME, HOURSOctober 22,1974 October 23,1974
SUSPENDED SEDIMENTEXPLANATION
Flow Sediment or chemical constituent transport
Curves above zero line are flow and transport to Laguna La Torrecilla; below are to Lfeguna San Jose.
Figure 16. Flow pattern of chemical constituents thru Canal Suarez at Hwy. 26 bridge.
o o iuCO
oc1U Q.
CO OCUJH UJ^
OmID O
o_1 u.
26

WATER QUALITY CHARACTERISTICS-Contiriued
Cano de Martin Pena at Avenida Barbosa
The net contributions of organic carbon and nutrients from Cano de Martin Pena to the lagoons system was minimal during the storm period. The transport and flow curves at the Avenida Barbosa Sta tion show that after the ebbtide of October 22 a near flat response occurred in the flow and transport of each chemical component (fig. 17). As previously stated, storm runoff into Cano de Martin Pena may cause rapid surges in the canal. However, the increases in head at Laguna San Jose reversed the flow in the Cano toward Bahla de San Juan ahead of the ebbtide.
The percentages of organic carbon and nutrients in solution at Cano de Martin Pena changed after the effects of the storm reached the sampling station. Dissolved organic carbon decreased from 70 to 50 per cent of the total, while phosphorus remained nearly unchanged at 70 per cent in solution. However, the percentages of organic nitrogen in solution increased from 28 to 46 percent, while dissolved ammonia also increased from 41 to 80 percent, of the total. These changes indicate that organic carbon in particulate form, and nitrogen species with a low oxidation state (typical of sewage) were washed into the canal from the urban areas of Hato Key and Santurce.
A comparison between the transport curves at Canal Suarez (fig. 16) and Cano de Martin Pena (fig. 17) shows a significant difference in the quality of the water between the two sites. Laguna San Jose is the dominating feature in the lagoons' hydraulic system. Once a near steady-stage equilibrium is reached in the system during a storm, water flows
from Laguna San Jose at both Canal Suarez and Cano de Martin Pena. If the quality of the water in Laguna San Jose were homogeneous, once equilibrium was reached, the quality of the water at the other two tidal sites should have been similar. The differences in the quality of the water between the two sites show that either Laguna San Jose did not reach a homogenous state, or other contributions to Cano Martin Pena are more significant than the flow from Laguna San Jose.
Net Loads in the Lagoon System
Net flows (loads) of organic carbon, nutrients, and suspended sediment at the tidal canals and the Boca de Cangrejos outlet to the ocean are summarized in figure 18. Storm runoff contributions of some of the parameters also are shown. The contributions of storm runoff were estimated from a mass balance analysis. Estimates were made only for TOC, TP, and total Kjeldahl nitrogen (TKN-equivalent to the sum of TON and TNH,-N). The computa tions of the loads in storm runoff appear reasonable on the basis of comparisons with measured loads at the tidal canals. The most signifi cant departures between measured loads budget for the tidal cycle, the contributions in and out of Laguna de Pinones are minimal. An error in the flows in and out of Laguna de Pinones is not as significant as for the other two lagoons.
Estimates of the nitrogen in rainfall are based on studies by Reid (1961). Similar data were obtained by Jordan and Fisher (1977) in a study of chemical quality of rainfall in St. Thomas, U.S. Virgin Islands.
27

250
200
150
100
50
0
50
100
150200
250QZ OoIU CO
ccUJ 0.
CO
10
8
6
4
2
0
2
4
6
8
10
CC 25 O
20
15
10
5
5
10
15
20
25
I I I 'I ' I 'I ^ Laguna'San Jose'
I i I
Bahia de'San Juan
. i . I . I .
TOTAL ORGANIC CARBON
i i
Bahia del San JuanI
I.I.I. I , |
TOTAL PHOSPHORUS
.~». Laguna'San Jose
Bahia del San Juan
i I i 1 i I i
15
12
9
63
0
36
912
15
15
12
9
6
3
0
3
6
9
12
15
15
12
9
6
3
0
3
6
9
12
15
0800 1200 1600 2000 2400 0400 0800 1200
TIME, HOURS
October 22,1974 October 23,1974
Bahia del San Juan liliiilii.i
TOTAL AMMONIUM AS NITROGEN
0800 1200 1600 2000 2400 0400 0800 1200
TIME, HOURS
October 22,1974 October 23,1974I j ,
TOTAL PHOSPHATE AS PHOSPHORUS
EXPLANATION
. _ Flow
Sediment or chemical constituent transport
Curves above zero line are flow and transport to Laguna San Jose'; below are to Bahia de San Juan.
-ITOTAL ORGANIC NITROGEN
Figure 17. Flow pattern of chemical constituents thru Cano de Martin Peha at Avenida Barbosa bridge.
UJ2 O OQ
O
STo
28

DIR
EC
T
PR
EC
IPIT
AT
ION
fO
CD
pT
KN
-,0
8
TK
N-.
04
1
^
TP
-.2
1
TP
-.10
Q-.
21
Q
-.1
0
i r .
w w
TK
N-.
32
Q-.
06
^
BA
LD
OR
IOT
Y
PU
MP
S
TA
TIO
N
CA
flO
D
E
MA
RT
IN
PE
NA
TO
C-1
.1T
P-.
06
tLA
GU
NA
S
AN
JO
SE
AR
EA
=
547
ha
VO
LU
ME
= 1
3.2
hm
3
AS
=
1.7
hm3
1
TO
C 4
1
TP
0
.74
TO
N 1
.4T
NH
4-N
-0
1 T
KN
-.0
2
TP
-.04
Q-.
04
TP
O4
-P-.
29
SS
3
.0f\
-\
A ̂. L
lZ W
O
fiF
AN
BO
CA
1 A
LA
GU
NA
i_
« T
OR
RE
CIL
LA
AR
EA
= 2
46 h
a
CA
NA
L
SU
AR
EZ
V
OLU
ME
= 5
.9 h
m3
^
TO
C -3
.8
As=
0,3
0h
m3
TP
-.0
7
TO
N-.
14
T K
l LJ A
K
t f\ C
TO
N-.
18
A T
OC
46
TP
O4-P
-!o6
i T
OC
46
TN
H4
-N-.
05
'
TP
1.2
S
S-1
.5
TF»
1.4
TP
04-P
-.03
TK
N
4.9
Q
- . 1
6
TK
N
4.6
SS
- X
Q
1.6
Q
Q-.
02
EX
PLA
NA
TIO
N
| __
__
_
_
|
1.5
DE
C
AN
GR
EJO
SO
UT
LE
T
CA
NA
L
PIN
ON
ES
A
TO
C-0
.8
VO
TP
-.05
TO
N-.
02
l
YLA
GU
NA
DE
P
INO
NE
S
RE
A=
105 h
a
LU
ME
=0.8
7
hm3
^S
r:+
o.1
6
hm3
TP
O4
-P-.
05
T
OC
2
.6|
SS
-(.7
0)X
X
TP
Q-.
06
T
KI*
Q
..08
M
AN
GR
OV
1 '2
2
FO
RE
ST
06
DR
AIN
AG
_ _
_ |
TO
C-
TO
TA
L
OR
GA
NIC
C
AR
BO
N
-^
IT
KN
- T
OT
AL
KJE
LD
AH
L
NIT
RO
GE
N
A
TO
N-
TO
TA
L
OR
GA
NIC
N
ITR
OG
EN
\
TH
OU
SA
ND
S
IT
NH
4-N
- T
OT
AL
AM
MO
NIA
N
ITR
OG
EN
\
OF
S
TO
RM
R
UN
OF
F
TP
- T
OT
AL
P
HO
SP
HO
RU
S
/KIL
OG
RA
MS
TP
O4-P
- T
OT
AL
O
RT
HO
PH
OS
PH
AT
EA
S
PH
OS
PH
OR
US
S
S-
SU
SP
EN
DE
D
SE
DIM
EN
T
Q-
FL
OW
IN
C
UB
IC
HE
CT
OM
ET
ER
S
AS
- C
HA
NG
E
IN
ST
OR
AG
E
IN
CU
BIC
HE
CT
OM
ET
ER
S
P-
PR
EC
IPIT
AT
ION
IN
CU
BIC
HE
CT
OM
ET
ER
SX
- L
OA
D N
OT
DE
TE
RM
INE
D D
UE
TO
S
CA
TE
R
OF
D
AT
A
PO
INT
S
XX
- N
ET
F
LO
W F
RO
M
LA
GU
NA
D
E
PIN
ON
ES
T
O
LA
GU
NA
L
A
TO
RR
EC
ILL
A
VO
LU
ME
O
F
LA
GO
ON
S
AR
E
AT
M
EA
N
SE
A
LE
VE
L
(EL
LIS
.1976)
Fig
ure
18. N
et
wate
r flo
ws,
n
utr
ien
ts,
and
susp
ended-s
edim
ent
loa
ds,
in
the
San
Ju
an
L
ag
oo
ns
du
rin
g
the
sto
rm-a
ffe
cte
d tidal
cycle
of
22
-23
O
cto
be
r,
1974.

WATER QUALITY CHARACTERlSTICS-Continued
The data in figure 18 show that during the study period, both Laguna San Jose and Laguna La Torre- cilla received more organic carbon, nitrogen and phosphorus than was exported. A mass balance on Laguna San Jose shows that of about 45.4 x 10 kilograms (kg) of organic carbon, only about 8 percent was exported. Nitrogen and phosphorus show similar trends. In Laguna La Torrecilla, of a total organic carbon loading of about 51.8 x 10 kg, almost 84 percent was expor ted to the ocean and Laguna de Pinones.
The retention of organic matter and nutrients by both Laguna San Jose and Laguna La Torrecilla is a key factor in the water-quality conditions in the lagoon system. The organic loading exerts inordi nate biochemical oxidation demands on the lagoons, particularly in
Laguna San Jose. The nutrients that accumulate, either in solution or in bottom deposits, enhance high biological activity which creates extremes in oxygen levels. Dis- solved-oxygen concentrations may be driven to zero or near zero values as a result of the organic loading, or to supersaturation levels due to biological activity. Both extremes (0-9.7 mg/L at 1 m, Ellis and Gomez-Gomez, 1975) probably are the main reasons for the frequent fish kills in the lagoons.
A summary of the flow and chemical loads in the lagoon system during a normal tidal cycle (dry weather conditions) is shown in figure 19. The data are presented to provide a comparison of flows and chemical loadings between the normal tidal cycle, without intense precipitation, and those of the
Q .02 TOO Q0.3) TP [.03J TPO4-P [.02]
BOCA DE CANGREJOS
Q .* TOC . TP .»4 TPO4-P .24 SB (-1B.B)
BALDORIOTY AVE. PUMP STATION
CANO MARTIN PENA
Q .03 TOC .66 TP (-.01)
LAGUNA BAN JOsi
AS=O.O*CANAL BUAREZ
Q .0* TOC 3.9 TP .13 TPO4-P .1* BB (-.10)
LAGUNA
LA TORRECILLA
AS=0.12
STREAM FLOW AND AQUIFER DISCHARGE
Q .02TOC [T30)
TP(708]
TPO4 [7oi]
CANAL PlfiONEB-*-
Q .01 TOC (-.71) TP .03 TPO4-P .OB BB (-1.BB)
LAGUNA
DE PINONES
AB=-.01
EXPLANATION
rQ- FLOW, IN CUBIC HECTOMETERS.THOUBANDB IN DIRECTION OF ARROW
CANAL BLABINA Qf TOC- TOTAL ORGANIC CARBONKILOGRAM* TP~ TOTAL PHOSPHORUS
LTPO4-TOTAL ORTHOPHOBPHATEAS PHOSPHORUS
S3- SUSPENDED-SEDIMENT AS- CHANGE IN STORAGE. IN CUBIC
HECTOMETERS
Note: (Negative leads art In the opposite direction ef flew as shewn by arrows) Brackets show leads estimated from low-flow ssmples Unac counted flews are considered within accuracy ef measurements.
Q .03TOC (7s»)TP fci)
TPO4 (7l2J
Figure 19. Net water flows, nutrients, and suspended-sediment loads at the San Juan Lagoons system during a 22-23 January, 1974 tidal cycle. (Modified from Ellis and Gomez-Gomez, 1976.)
30

WATER QUALITY CHARACTERISTICS-Continued
present study. Since the study by Ellis and Gomez-Gomez (1976) did not include determinations of the chemical loads at the Avenida Baldorioty de Castro pump house, streamflow into Laguna San Jose, and Canal Blasina discharges to Laguna La Torrecilla, these were estimated. The estimates were based on samples collected during low flows representative of the
low-flow tidal cycle.
A further analysis of the data in figures 18 and 19 provides additional evidence that during storm events a significant amount of nutrients is stored in the lagoons. During dry conditions the lagoons export these to the ocean. The difference during both studies can be seen in table 2.
Table 2. Net loads of major nutrients and total-organic carbon during wet and dry periods at Laguna San Jose and Laguna La
Torrecilla (values in 1000 kilograms).
COM
PONENTSWET PERIOD
IN OUT RETAINED INDRY PERIOD
OUT RETAINED
Laguna San Jose
TOGTPTKN
471.65.5
440.82.2
30.83.3
0.60.1
7.1.2
NO DATA
-6.5-0.1
Laguna La Torrecilla
TOCTPTKN
862.26.8
1041.93.6
-180.33.2
7.9 15.50.4 1.0
NO DATA
-7.6-0.6
Note: Negative sign indicates no retention. Amount indicated leached from bottom sediments, contributed by detritus or autotrophic production.
31

WATER QUALITY CHARACTERISTICS-Continued
These loads were computed by adjusting values to zero storage change. Canal Suarez, which conveys in excess of 80 percent of the water out of Laguna San Jose was assumed to carry its entire flow. The ratio of nutrient load (TOC, TP or TKN) to flow (Q) from figures 18 and 19 was assumed to remain equal until the excess water volume in the lagoon was flushed. The same was assumed at Laguna La Torrecilla for Boca de Cangrejos outlet, but the net outflow from Laguna San Jose to Laguna La Torrecilla was included in the latter's inflow loads.
Comparisons between this study and that conducted during dry weather conditions show that low-flow contributions of TOC and nutrients to the lagoons are small when compared to inputs during a significant storm. The frequency of such storms in the metropolitan San Juan area clearly indicates the importance of storm runoff in the lagoons system.
The termination of the study after 25 hours of measuring and sampling was premature. The data in figure 18 shows that the lagoon system had not achieved equilibrium in terms of water flows and trans port of chemical loads. It is
probable that the export of TOC and nutrients from Laguna San Jose to Laguna La Torrecilla, and thereafter to the ocean outlet, would have continued above base levels. Many questions relative to the balance in the system remain unanswered. What is the sediment load (particu larly the sand fraction) of the major streams? What would have been the Canal Suarez flow and chemical transport characteristics as storm runoff receded? Would Laguna San Jose begin to export TOC and nutrients by way of Cano de Martin Pena on the next receding ebbtide in the absence of runoff from the urban areas?
These and many other questions that relate to the hydraulic and chemical characteristics of the San Juan Lagoon system cannot be answered within the scope of this study. The system is too complex, with too many interactions involving tides, volumes, flow constraints in the canals, fresh-salt water mixing, ground-water inputs, and so forth. A solution to systems as complex as the San Juan Lagoons usually in volves development and calibration of a mathematical model. Such models are available and the data collected during the investigations in the San Juan Lagoons can be used to calibrate a model.
32

CONCLUSIONS
Storm runoff to the San Juan lagoon system on 22 to 23 October, 1974 was about 70 percent of the storm precipitation in the basin. The mostly urbanized area probably prevents infiltration and reduces the travel time of the storm runoff into the lagoons. The hydraulic system of the lagoons, which normally follows the prevailing tides, is significantly effected by storm runoff. As storm runoff accumulates in Laguna San Jose, the increasing head reverses tidal flows in Canal Suarez and Carlo de Martin Pena. The combination of flows from Laguna San Jose and Canal Blasina forces Laguna La Torrecilla to discharge to the ocean as much as 95 percent of the total inflows to the lagoons.
The transport of carbon, nutrients, and suspended-sediment in the lagoon system appears to be affected principally by inputs from storm runoff. Low-flow contribu tions, in terms of loads, are a fraction of those during intense storms. Although several point sources along Canal Blasina contri bute significant organic and nutrient loads, a storm as intense as the one during the study contri butes many times those loads. This indicates that the water- quality problems in the lagoon system cannot be solved by elimina ting only the point sources. The
control of non-point sources in the urbanized basin is essential.
Nutrients and organic matter are released from the lagoons during dry-weather conditions at a rate greater than what can be accounted for from inputs. This is more evident in Laguna San Jose and Laguna La Torrecilla. In the dredged areas of both lagoons, anaerobic conditions prevail most of the time. This suggests that the dredged areas may be an important storage pool of the organic matter and nutrients discharged to the lagoons. These storage areas will continue to yield nutrients and organic matter to the lagoons even after point and non-point sources of these components are controlled. This will prevent a quick improve ment of the water-quality conditions in both lagoons.
The San Juan Lagoons constitute a very complex system that cannot be properly defined by conventional techniques. The data from this and other studies can be used to model the response of the lagoons to variable hydraulic and chemical-load conditions. Models are available and could be calibra ted to provide management with alternatives to study and improve the quality of the water in the San Juan Lagoons system.
33

SELECTED REFERENCES
Anderson, H.R., 1974, Ground water in the San Juan metropolitan area, Puerto Rico: U.S. Geological Survey Water-Resources Investiga tions 41-75, 34 p.
Brown, Eugene, Skougstad, M.W., and Fuhman, M.S., 1970, Methods for collection and analysis of water samples for dissolved minerals and gages": U.S. Geological Survey, Tech of Water-Resources Investigations, Chapter Al, 160 p.
Buchanan, T.J., and Sommers, W.P. 1969, Discharge measurements atgaging stations: Techniques in Water-Resources Investigations, Book 3, Chapter A8, U.S. Geological Survey, 64 p.
Ellis, S.R., 1976, History of dredging and filling of lagoons in the San Juan area, Puerto Rico: U.S. Geological Survey Water- Resources Investigations 76-38, 25 p.
Ellis, S.R. and Gomez-Gomez, Fernando, 1975, Water quality and hydrau lic data, San Juan Lagoon system, Puerto Rico: U.S. Geological Survey Open-file Report 75-2, 142 p.
, 1976, Hydrologic characteristics of lagoons at San Juan, Puerto Rico, during a January tidal cycle: U.S. Geological Survey Water-Resources Investigations 38-75, 45 p.
Jordan, D.G. and Fisher, D.W., 1977, Relation of bulk precipitation and evapotranspiration to water quality and water resources of St. Thomas, Virgin Islands: U.S. Geological Survey, Water Supply Paper 1663-1, 30 p.
Guy, H.P., and Norman, V.W., 1970, Field methods for measurement of fluvial sediment: U.S. Geological Survey Techniques of Water- Resources Investigations, Book 3, Chapter C2, 59 p.
Haire, W.J., 1975, Floods in the Carolina-Rio Grande .area,northeastern Puerto Rico: U.S. Geological Survey Hydrologic Investigations Atlas HA-533.
Metcalf and Eddy, Inc., 1972, Wastewater engineering: New York, McGraw-Hill, 782 p.
Reid, G.D., 1961, Ecology of inland waters and estuaries: New York, D. Van Nostrand, 340 p.
Riley, J.P., and Chester, R., 1971, Introduction to marine chemistry: New York, Academic Press, 420 p.
U.S. Department of Commerce, Weather Bureau, 1961, Generalizedestimate of probable maximum precipitation and rainfall-frequency data for Puerto Rico and Virgin Islands: Washington, D.C. U.S. Government Printing Office, 88 p.
34

POSTAGE AND FEES PAIDU.S. DEPARTMENT OF THE INTERIORINT 413
U.S. DEPARTMENT Geological Survey GPO Box 4424 San Juan, PR 00936
OF THE INTERIOR
OFFICIAL BUSINESSPENALTY FOR PRIVATE USE $300SPECIAL 4TH CLASS BOOK RATE