Hydroinformatics in multi-colours—part red: urban flood...
15
Hydroinformatics in multi-colours—part red: urban flood and disaster management Arthur E. Mynett and Zoran Vojinovic ABSTRACT Arthur E. Mynett (corresponding author) UNESCO-IHE Institute for Water Education, PO Box 3015, 2601 DA, Delft, The Netherlands E-mail: [email protected] Delft University of Technology, Faculty CiTG, PO Box 5048, 2600 GA, Delft, The Netherlands Deltares, Delft Hydraulics, PO Box 177, 2600 MH, Delft, The Netherlands Zoran Vojinovic UNESCO-IHE Institute for Water Education, PO Box 3015, 2601 DA, Delft, The Netherlands Hydroinformatics found its origin in the advancement of computational hydraulics in the early 1990s but has expanded considerably, both in scope and in application areas. It is now not only being applied in the fields of hydraulics and hydrology (often indicated by the colour blue), but also in environmental science and technology (green) as well as in knowledge systems and knowledge management (yellow). This paper focuses on urban (red) applications of hydroinformatics, taking urban flood and disaster management as an example. It is part of a sequence of papers, each focusing on a particular field (colour) of hydroinformatics, which together constitute a multi-coloured rainbow of application areas that hydroinformatics has expanded into over the past two decades or so. The combined papers on “Hydroinformatics in multi-colours” were presented as the opening keynote of the Workshop on Advances in Hydroinformatics held in Niagara Falls, in June 2007. In this paper—part red of the sequence—the role of urban hydroinformatics in assessing effects of climate change on urban flooding and health risk is addressed in relation to the UN Millennium Development Goals and illustrated on a case study of Dhaka, Bangladesh. Key words | disaster management, flood damage assessment, urban hydroinformatics INTRODUCTION Urban flooding is a prominent issue, not only at a local scale but even more so at the global level. As of 2008, more than half the world’s population is living in urban conglomera- tions, many of which are situated at locations where large river systems meet the ocean. Hence these megacities in delta areas are quite naturally exposed to flood events coming from either direction: inland or ocean (Talukdar 2006). Due to the effects of climate change, these delta cities around the world become even more vulnerable to disasters, especially in developing countries. Since the possibility of the occurrence of floods cannot be ignored or denied, the primary focus should be on identifying probable measures to develop disaster management plans and programmes, as outlined in the United Nations Millennium Development Goals (MDGs). However, there is a continuous need to conduct in-depth research on all issues involved in disaster management, in order to deal with these problems effectively. It is necessary not only to analyze and apply the latest scientific tools such as data acquisition and management, simulation modelling, data assimilation and improved fore- casting capabilities, but also to look into these issues in an integrated manner and to develop disaster management scenarios that can cope with extreme situations. Clearly, effects of climate change and their implications for the MDGs deserve adequate attention both in scientific research and in developing appropriate technologies for early warning and disaster prevention. This is where urban and environmental hydroinformatics can greatly contribute. The application of hydroinformatics technologies in urban water systems (a.k.a. urban hydroinformatics) has emerged as an important concept for several reasons. First, there is a growing need to manage urban water cycle on a doi: 10.2166/hydro.2009.027 166 Q IWA Publishing 2009 Journal of Hydroinformatics | 11.3–4 | 2009
Transcript of Hydroinformatics in multi-colours—part red: urban flood...
Hydroinformatics in multi-colours—part red: urban flood
and disaster management
Arthur E. Mynett and Zoran Vojinovic
ABSTRACT
Arthur E. Mynett (corresponding author)
UNESCO-IHE Institute for Water Education,
PO Box 3015, 2601 DA, Delft,
The Netherlands
E-mail: [email protected]
Delft University of Technology, Faculty CiTG,
PO Box 5048, 2600 GA, Delft,
The Netherlands
Deltares, Delft Hydraulics,
PO Box 177, 2600 MH, Delft,
The Netherlands
Zoran Vojinovic
UNESCO-IHE Institute for Water Education,
PO Box 3015, 2601 DA, Delft,
The Netherlands
Hydroinformatics found its origin in the advancement of computational hydraulics in the early
1990s but has expanded considerably, both in scope and in application areas. It is now not only
being applied in the fields of hydraulics and hydrology (often indicated by the colour blue), but
also in environmental science and technology (green) as well as in knowledge systems and
knowledge management (yellow). This paper focuses on urban (red) applications of
hydroinformatics, taking urban flood and disaster management as an example. It is part of a
sequence of papers, each focusing on a particular field (colour) of hydroinformatics, which
together constitute a multi-coloured rainbow of application areas that hydroinformatics has
expanded into over the past two decades or so. The combined papers on “Hydroinformatics in
multi-colours” were presented as the opening keynote of the Workshop on Advances in
Hydroinformatics held in Niagara Falls, in June 2007. In this paper—part red of the sequence—the
role of urban hydroinformatics in assessing effects of climate change on urban flooding and
health risk is addressed in relation to the UN Millennium Development Goals and illustrated on a
case study of Dhaka, Bangladesh.
Key words | disaster management, flood damage assessment, urban hydroinformatics
INTRODUCTION
Urban flooding is a prominent issue, not only at a local scale
but even more so at the global level. As of 2008, more than
half the world’s population is living in urban conglomera-
tions, many of which are situated at locations where large
river systemsmeet the ocean.Hence thesemegacities in delta
areas are quite naturally exposed to flood events coming from
either direction: inland or ocean (Talukdar 2006). Due to the
effects of climate change, these delta cities around the world
become even more vulnerable to disasters, especially in
developing countries. Since the possibility of the occurrence
of floods cannot be ignored or denied, the primary focus
should be on identifying probable measures to develop
disaster management plans and programmes, as outlined in
the United Nations Millennium Development Goals
(MDGs). However, there is a continuous need to conduct
in-depth research on all issues involved in disaster
management, in order to deal with these problems effectively.
It is necessary not only to analyze and apply the latest
scientific tools such as data acquisition and management,
simulation modelling, data assimilation and improved fore-
casting capabilities, but also to look into these issues in an
integrated manner and to develop disaster management
scenarios that can cope with extreme situations. Clearly,
effects of climate change and their implications for theMDGs
deserve adequate attention both in scientific research and in
developing appropriate technologies for early warning and
disaster prevention. This is where urban and environmental
hydroinformatics can greatly contribute.
The application of hydroinformatics technologies in
urban water systems (a.k.a. urban hydroinformatics) has
emerged as an important concept for several reasons. First,
there is a growing need to manage urban water cycle on a
doi: 10.2166/hydro.2009.027
166 Q IWA Publishing 2009 Journal of Hydroinformatics | 11.3–4 | 2009
global basis. Second, a range of alternative technologies to
process different aspects of the urban water cycle are
becoming available. Third, advances in hydroinformatics
have enabled to model different phases of the entire cycle
locally and globally and to optimise their functioning. In
particular, advances in urban hydroinformatics have made
significant impacts on the development of new strategies for
urban flood management. Since the safe and reliable models
of urban drainage systems for operation and management
are of increasing importance in both developed and
developing countries, and since the systems are becoming
more and more complex, there is a growing need to treat
them in an integrated manner for which the support of
hydroinformatics tools is invaluable.
The effects of urban flooding can be enormous and
create not only physical damage, but also affect water
quality and the environment and hence have a major impact
on health and hygiene (Butler & Davies 2004). Flooding in
urban areas often causes huge economic damage as most of
the structural developments and activities take place in
cities. It is common knowledge that the poor tend to suffer
most from floods. In addition to human and structural
damage, flooding often creates non-point source pollution
when toxic substances, sediment, nutrients, pathogens and
garbage are washed away into the water bodies, deteriorat-
ing the water quality (USEPA 1994). Inappropriately
maintained septic tanks can overflow in the case of flooding
and contaminate the receiving water bodies as well as the
water supply systems. Drinking water often becomes
unsuitable for drinking and other uses and poses huge
health risks. Stagnant water provides fertile conditions for
water-borne diseases as well as for insect-borne diseases
such as malaria and dengue fever. In a case study on the
effect of urban flooding for the city of Dhaka, Ahmed (2008)
carried out an analysis to identify risks, damages and
impacts on the interrelated physical, social and environ-
mental factors. Some aspects are presented here.
EFFECTS OF CLIMATE CHANGE ON FLOODING AND
HEALTH RISK
The report from the Intergovernmental Panel on Climate
Change IPCC (Cruz et al. 2007) summarizes that, by the end
of the 21st century, the projected probability of extreme
warm seasons may rise above 90% in many tropical areas.
Recent studies with improved global models, ranging in
resolution from about 100 to 20km, suggest future changes
in both frequency and intensity of future tropical cyclones
(typhoons and hurricanes). The report on climate change
shows that precipitation generally increases in the tropics
and decreases in the subtropics. Moreover, there is likely to
be an increase in rainfall intensity, even if the wind
velocities in storms do not change. In particular, over
the Northern Hemisphere, an increase in the likelihood
of very wet winters is projected. Similar results apply
for summer precipitation, with implications for more
pronounced flooding in the Asian monsoon region and
other tropical areas. Projected changes in surface air
temperature and precipitation for sub-regions of Asia
under highest and lowest future emission trajectory for the
2020s, 2050s and 2080s are provided in the report by Cruz
et al. (2007).
The increased risk of floods in a number of major river
basins in a warmer future climate will lead to an increase in
river discharge with an increased risk of future intense
storm-related precipitation events and—most likely—flood-
ing. Some of these changes seem to be extensions of trends
already underway. The climate change scenarios predicted
by the IPCC identify tropical regions as the most vulnerable
areas due to increased probabilities of the occurrence of
disasters. The IPCC expects an increase in frequency of
infectious disease epidemics following floods and storms.
Flood-induced health hazards require detailed studies on
how to reduce the impacts on vulnerable areas and take
proper measures.
Global warming would cause an abrupt rise in water
quantity as a result of snow or glacier melting that could
lead to increased flooding. Increased rainfall intensity,
particularly during the summer monsoon, is likely to affect
flood-prone areas in temperate and tropical regions.
Countries in temperate and tropical Asia will be subject to
increased exposure to extreme events, including forest
deterioration and increased fire risk, as well as severe
vector-borne diseases. The frequency of the occurrence of
intense rainfall events has already occurred in many parts of
Asia, causing severe floods and landslides that often make
the news.
167 A. E. Mynett and Z. Vojinovic | Hydroinformatics in multi-colours: part red Journal of Hydroinformatics | 11.3–4 | 2009
DISASTER MANAGEMENT AND THE MILLENNIUM
DEVELOPMENT GOALS
Natural disasters exert enormous toll on the development of
a country. In doing so, they pose a significant threat to
prospects for achieving the Millennium Development Goals
which contribute to a reduction of human vulnerability to
natural hazards. According to UN reports, about 196
million people in more than 90 countries were found to
be exposed on average every year to catastrophic flooding.
Some 170,010 deaths were associated with floods world-
wide between 1980–2000. The Millennium Development
Goals (MDGs) are set out as a response to the world’s main
development challenges in the Millennium Declaration
which was adopted by 189 nations and signed by 147
heads of state and governments during the UN Millennium
Summit in September 2000. The goals set forth to be
achieved by 2015 include a number of aspects, among
which are (i) eradication of extreme poverty and hunger;
(ii) combating HIV/AIDS, malaria and other diseases;
(iii) ensuring environmental sustainability; and more. The
“Road map towards the implementation of the United
Nations Millennium Declaration” (UN-GA 2001) outlines
potential strategies for action that are designed to meet
these goals. These strategies are linked to the International
Strategy for Disaster Reduction (ISDR) plan with the aim
“to intensify collective efforts to reduce the number and
effects of natural notably and man-made disasters”.
Today, disaster reduction is a key component of United
Nations Development Programme efforts in crisis preven-
tion and recovery. The main emphasis is on capacity
building in reducing disaster risk in those countries where
such disasters are taking the largest toll. Damages and
deaths caused by recent flooding in many parts of the
world drive the need for better stormwater management
approaches directed to minimising hazard risks due to
urban flooding, even while addressing different climatic
conditions. These considerations apply as much to major
conurbations in developing countries as they do in devel-
oped countries. In this respect, disaster management in
urban areas is of major concern in helping to meet the
Millennium Development Goals (MDGs), especially in
providing an improved urban environment affecting Goal 1:
Eradicating extreme poverty and hunger, Goal 3: Promote
gender equality and empower women, Goal 4: Reducing
child mortality, Goal 6: Combat HIV/AIDS, malaria and
other diseases, Goal 7: Ensure environmental sustainability
(especially targets 9, 10 and 11) and Goal 8: Develop a
global partnership for development. The interaction of
economic development with disaster risk has direct con-
sequences for the meeting of Goals 1, 6 and 7. The
interaction of social development and disaster risk has
direct consequences for the meeting of Goals 3 and 8. In
addition to the loss of physical assets during flood-related
disasters, there are many examples of such disaster events
destroying the gains of health, sanitation, drinking water,
housing and education sectors that underpin social
development. The exclusion of women from local decision-
making circles in some countries has led to women and girls
being unwilling to use hurricane and flood protection
shelters. The importance of extending educational oppor-
tunities to girls and women is noted in the MDGs and has
been shown to improve the delivery of disaster risk
reduction. Such an educated population also responds
better to warnings and it can partner with experts to design
ways of protecting urban neighborhoods. The most far-
reaching opportunities for disaster risk reduction within
MDGs relate to Goal 8: Developing a global partnership for
development. In meeting this goal there is a need for two-
way relationship between disaster risk and development.
Furthermore, the MDGs contain cross-cutting themes in
development and disaster risk policy, each tied to specific
targets and indicators for progress. They require inter-
national collaboration to be met. The risk to development
stemming from natural disaster is recognized also in
Millennium Declaration in Section IV, entitled: “Protecting
Our Common Future”. Within this section is stated the
objective: “to intensify our collective efforts to reduce
number and effects of natural and mad-made disasters”.
The field of hydroinformatics is contributing to this
strategy in a number ofways, e.g. by (i) vulnerabilitymapping,
(ii) developing early warning systems, (iii) providing tech-
nology transfer and training, (iv) supporting interdisciplinary
scientific research on the causes of natural disasters and
(v) encouraging governments to incorporate disaster risk
reduction into their national planning processes.
The World Conference on Disaster Reduction, held
in early 2005, adopted the Hyogo Framework for Action
168 A. E. Mynett and Z. Vojinovic | Hydroinformatics in multi-colours: part red Journal of Hydroinformatics | 11.3–4 | 2009

2005–2015, which identifies strategic objectives and
priority areas to reduce disaster risk over the next 10 years.
The strategic goals include incorporation of risk reduction
approaches into the design and implementation of emer-
gency preparedness, response and recovery programmes for
affected communities. The overall objective is to promote
“an effective integration of disaster risk considerations into
sustainable development policies, planning and program-
ming at all levels” (UN-ISDR 2002;WHO 2003). Clearly, the
fields of urban and environmental hydroinformatics have a
lot to contribute to achieving these goals.
COMPUTATIONAL MODELS FOR URBAN
DRAINAGE, FLASH FLOOD SIMULATION AND
WATER QUALITY ASSESSMENT
Where flood flows are confined to well-defined conduits, a
robust 1D model can usually be instantiated, and used to
generate results safe for decision-making. However, the
flows generated in urban flood disasters are normally highly
complex because the morphology of the urban surface is
eminently artificial, with its highly irregular geometry, and is
often contrary to natural flow paths. Modelling flows in
such complex geometrical situations is difficult. Small
geometric ‘discontinuities’ such as road or pavement curbs
can play a significant role in diverting the shallow flows that
are generated along roads, through fences and around
buildings. Head losses due to flow over or round such
structures are difficult to accommodate. Frequently the
urban flows are super-critical whereas many of the available
modelling products, although they simulate flows that are
in reality super-critical, in practice they use modified sub-
critical flow algorithms. The use of finite difference methods
in conjunction with the reduced momentum equation
together with the boundary condition structure inherent
to subcritical flow conditions is a standard approach used
for numerical simulation of all flow regimes (i.e., subcritical,
supercritical and transcritical) in most of the commercial
packages. Due to incomplete equations and inadequate
boundary conditions used to model supercritical and
transcritical flows, such an approach may introduce
unrealistic backwater effects, non-amplifying oscillations
and other computational instabilities (see, for example,
Djordjevic et al. 2004). There is also the issue of treating the
transition from channel flows to over-ground shallow depth
flows. This necessitates the coupling of simulations using
1D and 2D modelling systems; see, for example, Hsu et al.
(2000), Chen et al. (2006), Djordjevic et al. (2005), Vojinovic
et al. (2006) and Vojinovic & Tutulic (2009).
Following the floods of 2002 in Germany and the Czech
Republic, a case study for the Elbe River (Abazi 2005)
looked at different modelling approaches used in flood
simulation. Two different approaches were considered using
the Delft Software Systems. A coupled Sobek1D2D
approach was compared with the full Delft2D model. In
the first approach the flow in a river is modelled as a one-
dimensional flow and the flow in the floodplain is modelled
as a two-dimensional horizontal flow. In the second
approach the river and floodplain flows are both modelled
as two-dimensional horizontal flows using a boundary-
fitted 2D computational grid.
Bashar (2005) developed a coupled 1D2D hydraulic
model in SOBEK linking the main branch of the Kushiyara
River in Bangladesh to its tributaries Manu and Dhalai. The
central role in this model’s development is its application to
flood flows on the Manu–Dhalai basin and its floodplains.
A number of model simulations were evaluated which
showed the applicability of the coupled 1D2D model
including features such as dike breach simulation, flood
mapping, etc. Kaushik (2006) carried out a comparative
study for 1D and 2D urban flood modelling.
The urban flooding problem of Dhaka has been studied
by, for example, Kamal & Rabbi (1998), Apirumanekul
(2001) and Alam (2003). The Institute of Water Modelling
(IWM), previously known as the Surface Water Modelling
Centre (SWMC), conducted a pilot study on storm water
drainage modelling for Dhaka city in 1996. They developed
a model using MOUSE to test the applicability of urban
drainage modelling for analyzing the condition of Dhaka
city. Due to the lack of detailed data to calibrate the model
the simulation results were considered only indicative and
further research to improve the model was suggested.
For the central part of Dhaka, the capital of Bangladesh,
severe water logging problems are recurring every time due
to even moderate rainstorms. By combining the urban
drainage modelling software MOUSE (DHI) with a Geo-
graphic Information System (GIS), model-based water
169 A. E. Mynett and Z. Vojinovic | Hydroinformatics in multi-colours: part red Journal of Hydroinformatics | 11.3–4 | 2009
logging maps (flooding depth and inundation extent maps)
were produced that showed close matches to the real
situation for September and October 1996 rainfall events.
The study results suggest that a meaningful solution for
urban drainage problems can be obtained by coupling an
urban drainage model to flood depth mapping. Also, by
coupling the hydrodynamic inundation model to a water
quality module for pollutant transport, a risk assessment
can be carried out on the epidemic spreading of diseases, as
outlined hereafter.
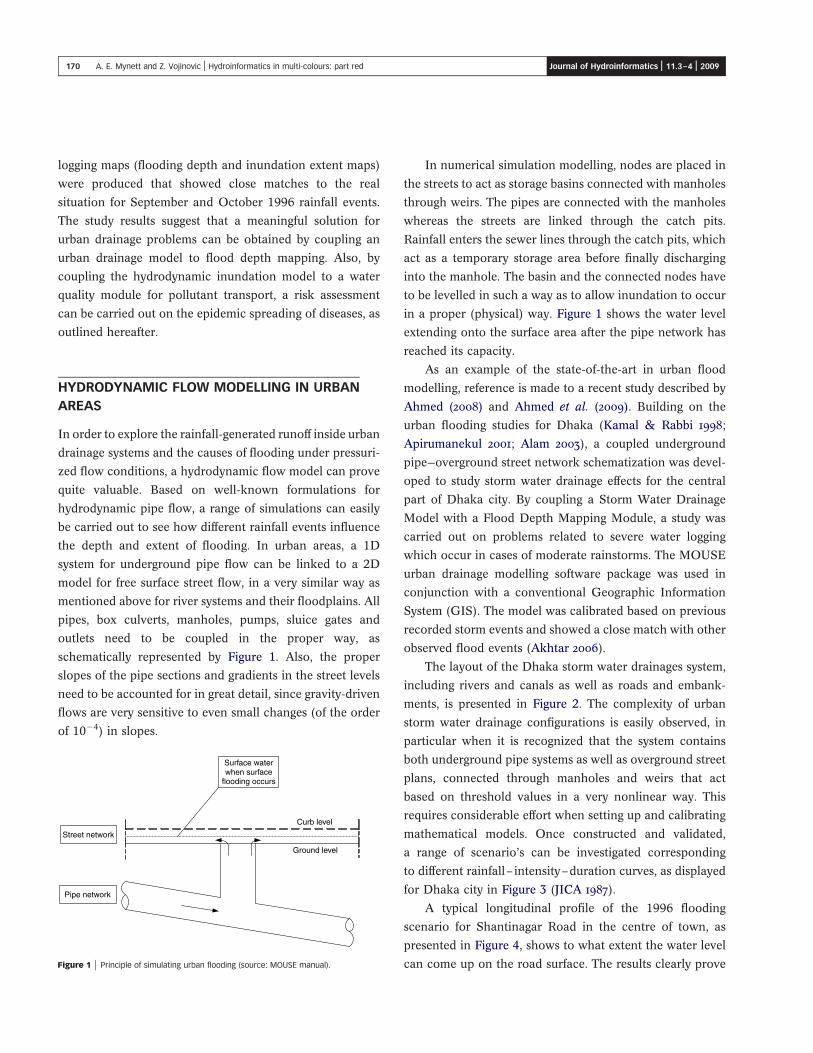
HYDRODYNAMIC FLOW MODELLING IN URBAN
AREAS
In order to explore the rainfall-generated runoff inside urban
drainage systems and the causes of flooding under pressuri-
zed flow conditions, a hydrodynamic flow model can prove
quite valuable. Based on well-known formulations for
hydrodynamic pipe flow, a range of simulations can easily
be carried out to see how different rainfall events influence
the depth and extent of flooding. In urban areas, a 1D
system for underground pipe flow can be linked to a 2D
model for free surface street flow, in a very similar way as
mentioned above for river systems and their floodplains. All
pipes, box culverts, manholes, pumps, sluice gates and
outlets need to be coupled in the proper way, as
schematically represented by Figure 1. Also, the proper
slopes of the pipe sections and gradients in the street levels
need to be accounted for in great detail, since gravity-driven
flows are very sensitive to even small changes (of the order
of 1024) in slopes.
In numerical simulation modelling, nodes are placed in
the streets to act as storage basins connected with manholes
through weirs. The pipes are connected with the manholes
whereas the streets are linked through the catch pits.
Rainfall enters the sewer lines through the catch pits, which
act as a temporary storage area before finally discharging
into the manhole. The basin and the connected nodes have
to be levelled in such a way as to allow inundation to occur
in a proper (physical) way. Figure 1 shows the water level
extending onto the surface area after the pipe network has
reached its capacity.
As an example of the state-of-the-art in urban flood
modelling, reference is made to a recent study described by
Ahmed (2008) and Ahmed et al. (2009). Building on the
urban flooding studies for Dhaka (Kamal & Rabbi 1998;
Apirumanekul 2001; Alam 2003), a coupled underground
pipe—overground street network schematization was devel-
oped to study storm water drainage effects for the central
part of Dhaka city. By coupling a Storm Water Drainage
Model with a Flood Depth Mapping Module, a study was
carried out on problems related to severe water logging
which occur in cases of moderate rainstorms. The MOUSE
urban drainage modelling software package was used in
conjunction with a conventional Geographic Information
System (GIS). The model was calibrated based on previous
recorded storm events and showed a close match with other
observed flood events (Akhtar 2006).
The layout of the Dhaka storm water drainages system,
including rivers and canals as well as roads and embank-
ments, is presented in Figure 2. The complexity of urban
storm water drainage configurations is easily observed, in
particular when it is recognized that the system contains
both underground pipe systems as well as overground street
plans, connected through manholes and weirs that act
based on threshold values in a very nonlinear way. This
requires considerable effort when setting up and calibrating
mathematical models. Once constructed and validated,
a range of scenario’s can be investigated corresponding
to different rainfall–intensity–duration curves, as displayed
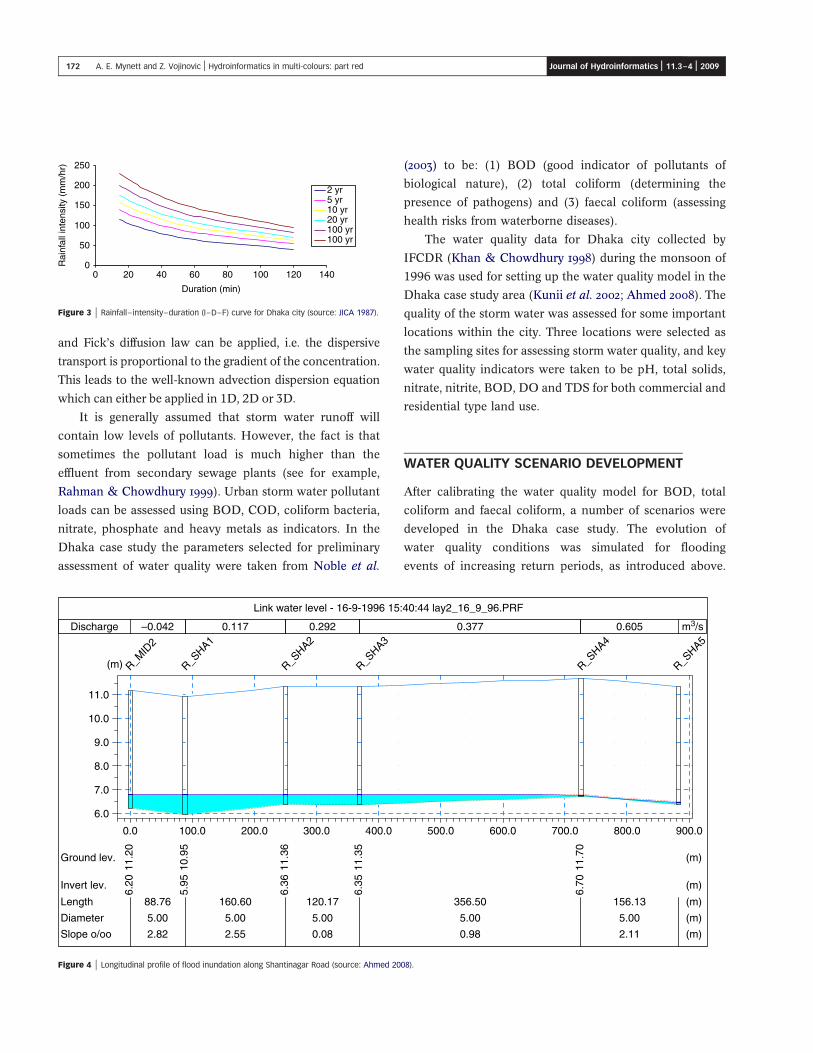
for Dhaka city in Figure 3 (JICA 1987).
A typical longitudinal profile of the 1996 flooding
scenario for Shantinagar Road in the centre of town, as
presented in Figure 4, shows to what extent the water level
can come up on the road surface. The results clearly proveFigure 1 | Principle of simulating urban flooding (source: MOUSE manual).
170 A. E. Mynett and Z. Vojinovic | Hydroinformatics in multi-colours: part red Journal of Hydroinformatics | 11.3–4 | 2009

that a meaningful solution for urban drainage problems can
be obtained with better confidence by using the combined
urban drainage model and flood depth mapping.
TRANSPORT OF POLLUTANTS IN URBAN SYSTEMS
Water quality modelling involves the prediction of spread-
ing of pollutants using mathematical simulation techniques.
A typical water quality model consists of a computational
kernel representing physical mechanisms that determine
fate and transport of pollutants in a water body. The
purpose for water quality modelling in the Dhaka case study
was to analyze the water quality conditions during flooding.
The model showed how pollutant concentrations propagate
with increasing flood runoff from within the catchment
area, thereby affecting the water quality during different
flooding events.
Water quality processes in sewer systems are convention-
ally modelled following a 1Dpipe flowmodule connected to a
1D or 2D street flow module. Some systems have several
modules for the simulation of sediment transport processes
and water quality in sewer systems. Conventionally, the
transport of pollutants within the sewer network is based on
the advection–dispersion equation where the substance is
considered to be conservative or subject to a first-order decay
Figure 2 | Layout of Dhaka storm water drainage and river/canal system (source: Ahmed 2008).
171 A. E. Mynett and Z. Vojinovic | Hydroinformatics in multi-colours: part red Journal of Hydroinformatics | 11.3–4 | 2009
and Fick’s diffusion law can be applied, i.e. the dispersive
transport is proportional to the gradient of the concentration.
This leads to the well-known advection dispersion equation
which can either be applied in 1D, 2D or 3D.
It is generally assumed that storm water runoff will
contain low levels of pollutants. However, the fact is that
sometimes the pollutant load is much higher than the
effluent from secondary sewage plants (see for example,
Rahman & Chowdhury 1999). Urban storm water pollutant
loads can be assessed using BOD, COD, coliform bacteria,
nitrate, phosphate and heavy metals as indicators. In the
Dhaka case study the parameters selected for preliminary
assessment of water quality were taken from Noble et al.
(2003) to be: (1) BOD (good indicator of pollutants of
biological nature), (2) total coliform (determining the
presence of pathogens) and (3) faecal coliform (assessing
health risks from waterborne diseases).
The water quality data for Dhaka city collected by
IFCDR (Khan & Chowdhury 1998) during the monsoon of
1996 was used for setting up the water quality model in the
Dhaka case study area (Kunii et al. 2002; Ahmed 2008). The
quality of the storm water was assessed for some important
locations within the city. Three locations were selected as
the sampling sites for assessing storm water quality, and key
water quality indicators were taken to be pH, total solids,
nitrate, nitrite, BOD, DO and TDS for both commercial and
residential type land use.
WATER QUALITY SCENARIO DEVELOPMENT
After calibrating the water quality model for BOD, total
coliform and faecal coliform, a number of scenarios were
developed in the Dhaka case study. The evolution of
water quality conditions was simulated for flooding
events of increasing return periods, as introduced above.
Figure 4 | Longitudinal profile of flood inundation along Shantinagar Road (source: Ahmed 2008).
Figure 3 | Rainfall– intensity–duration (I–D–F) curve for Dhaka city (source: JICA 1987).
172 A. E. Mynett and Z. Vojinovic | Hydroinformatics in multi-colours: part red Journal of Hydroinformatics | 11.3–4 | 2009
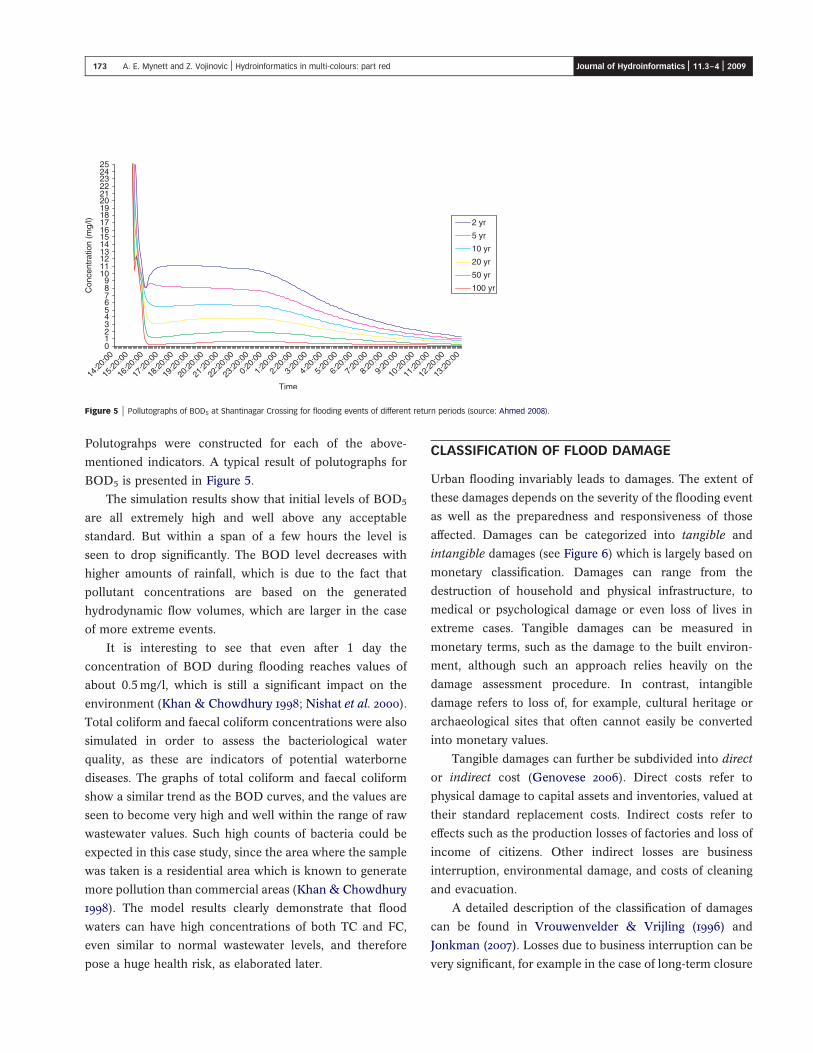
Polutograhps were constructed for each of the above-
mentioned indicators. A typical result of polutographs for
BOD5 is presented in Figure 5.
The simulation results show that initial levels of BOD5
are all extremely high and well above any acceptable
standard. But within a span of a few hours the level is
seen to drop significantly. The BOD level decreases with
higher amounts of rainfall, which is due to the fact that
pollutant concentrations are based on the generated
hydrodynamic flow volumes, which are larger in the case
of more extreme events.
It is interesting to see that even after 1 day the
concentration of BOD during flooding reaches values of
about 0.5mg/l, which is still a significant impact on the
environment (Khan & Chowdhury 1998; Nishat et al. 2000).
Total coliform and faecal coliform concentrations were also
simulated in order to assess the bacteriological water
quality, as these are indicators of potential waterborne
diseases. The graphs of total coliform and faecal coliform
show a similar trend as the BOD curves, and the values are
seen to become very high and well within the range of raw
wastewater values. Such high counts of bacteria could be
expected in this case study, since the area where the sample
was taken is a residential area which is known to generate
more pollution than commercial areas (Khan & Chowdhury
1998). The model results clearly demonstrate that flood
waters can have high concentrations of both TC and FC,
even similar to normal wastewater levels, and therefore
pose a huge health risk, as elaborated later.
CLASSIFICATION OF FLOOD DAMAGE
Urban flooding invariably leads to damages. The extent of
these damages depends on the severity of the flooding event
as well as the preparedness and responsiveness of those
affected. Damages can be categorized into tangible and
intangible damages (see Figure 6) which is largely based on
monetary classification. Damages can range from the
destruction of household and physical infrastructure, to
medical or psychological damage or even loss of lives in
extreme cases. Tangible damages can be measured in
monetary terms, such as the damage to the built environ-
ment, although such an approach relies heavily on the
damage assessment procedure. In contrast, intangible
damage refers to loss of, for example, cultural heritage or
archaeological sites that often cannot easily be converted
into monetary values.
Tangible damages can further be subdivided into direct
or indirect cost (Genovese 2006). Direct costs refer to
physical damage to capital assets and inventories, valued at
their standard replacement costs. Indirect costs refer to
effects such as the production losses of factories and loss of
income of citizens. Other indirect losses are business
interruption, environmental damage, and costs of cleaning
and evacuation.
A detailed description of the classification of damages
can be found in Vrouwenvelder & Vrijling (1996) and
Jonkman (2007). Losses due to business interruption can be
very significant, for example in the case of long-term closure
Figure 5 | Pollutographs of BOD5 at Shantinagar Crossing for flooding events of different return periods (source: Ahmed 2008).
173 A. E. Mynett and Z. Vojinovic | Hydroinformatics in multi-colours: part red Journal of Hydroinformatics | 11.3–4 | 2009

of a national airport. Van der Veen et al. (2003) proposed a
method for the assessment of indirect economic damage.
The methods for the estimation of intangible damage are
less well developed. Recent research has focused on
different types of intangible flood damage in the Nether-
lands, such as environmental damage (Stuyt et al. 2007).
Prior to that, Penning-Rowsell & Chatterton (1977) intro-
duced a method for flood loss assessment as a nationally
applicable standard dataset for various depth and damages
for the residential sector in the UK, while Parker et al. (1987)
constructed depth-damage curves for industrial enterprises.
Vojinovic et al. (2008) presented the hydroinformatics
framework for estimation of urban flood damages where
the use of hydrodynamic models, GIS and remotely sensed
data is combined within a single platform.
APPLICATION OF GIS FOR DAMAGE ASSESSMENT
Geographical Information Systems (GIS) are widely used
in urban hydroinformatics and prove to be a very effective
tool in flood risk damage assessment. GIS-based flood
damage assessment is relatively new but has shown to be
much more powerful than conventional methods for
estimating damages, due to its capability of dealing with
spatial heterogeneity—provided detailed data are available.
Ediriweera (2007) developed a GIS-based framework
to produce hazard maps visualizing both tangible and
intangible flood damages. GIS can easily demonstrate
the implications of flood mitigation measures on traffic
planning and developing evacuation strategies. A damage
assessment methodology as proposed by Genovese
(2006) to evaluate the damage costs of direct losses in
residential areas was applied to the study area around
the city of Prague, following the dramatic flooding in
August 2002.
In the Dhaka case study the estimation of tangible
damages was carried out within a GIS environment where
locally developed depth-damage curves were applied to
each and every property across the floodplain. In this way,
damage assessment is greatly facilitated while the resulting
flood damage maps prove extremely useful for visualizing
potential effects of flooding and communicating scenario
development with all stakeholders involved. The flood maps
realised through GIS technology provide a clear view of the
extent of the flood. In fact, hydroinformatics tools like GIS—
in combination with dynamic visualization tools—are able
to convey a very strong message to the policymakers about
the extent and severity of different flood impacts and the
effectiveness of possible countermeasures.
Indirect economic damage refers to the disruption of
business and infrastructure, expenditure for temporary
arrangements and market losses suffered, as well as social
disruptions. Indirect flood damage costs may well exceed
direct damages (EMA 2002), depending on the intensity and
duration of the flood. Flooding events can negatively affect
employment and income levels, especially for the poor. One
way of assessing indirect losses is to multiply the number of
working hours lost due to flood with the productivity rate,
as an estimate of the total indirect loss (QNRM 2002).
Indirect damages can be presented in similar GIS maps as
for direct damage costs. In particular, for extreme events,
the indirect damage costs may be considerable.
Damages to the environment and to human health
(both physical and psychological) are often referred to as
“intangible”. There is no commonly agreed method for
assessing intangible damages because of the difficulty to
properly identify, quantify and evaluate the losses incurred.
It can be said that for intangible losses the best approach
would be to apply either a direct survey method or follow
a synthetic approach as outlined in EMA (2002). In the
Dhaka case study a synthetic approach was followed to
assess the intangible losses.
Figure 6 | Classification of damages (source: QNRM 2002).
174 A. E. Mynett and Z. Vojinovic | Hydroinformatics in multi-colours: part red Journal of Hydroinformatics | 11.3–4 | 2009

HUMAN HEALTH ISSUES AND THE SPREADING OF
DISEASES
Flooding often creates water pollution, affecting the
inundated environment, thus leading to sanitation and
health problems. So, the effect of flooding on the environ-
ment and, more specifically, on the water quality has to
be addressed together with the consequential impact on
human health. Water quality modelling can be used here to
assess flood consequences for the natural environment and
human health.
Often during extreme rainfall events, organic sub-
stances, solids, metals, chemical wastes from industries,
clinical waste and pesticides are carried via runoff over the
land surfaces, streets, parks, etc., thereby causing the water
to become polluted. In the Dhaka case study, the findings
from water quality modelling show that there is a high level
of BOD, as well as total and faecal coliform within the first
few hours of rainfall. Studies by Kay & Falconer (2008) and
Yang et al. (2008) and others have revealed extreme peaks
in pathogen levels immediately after severe rainfall, with
levels well exceeding allowable standards.
High concentrations of BOD indicate accumulation of
organic pollutants from different sources such as submerged
sewerage system, direct discharge of human excreta and
other household solid wastes (Rahman & Hossain 2002).
Solid wastes get mixed with flood water as the waste
disposal system during flooding becomes inactive. Several
studies found that the BOD, coliform, DO and turbidity
level is relatively high in the lakes within Dhaka city due to
discharge of wastewater.
Especially in stagnant water, flooded septic tanks and
leach pits are breeding grounds for mosquitoes while faecal
contaminated wet soils helps the growth of intestinal
worms. Water quality modelling results in the Dhaka case
study showed the extent of areas within the city that are
highly susceptible to diseases. During the latest flooding
event of 2007 in Bangladesh, 42% of all patients admitted to
Dhaka’s major hospital were reportedly from the urban
population areas. The distribution of some of the diseases
that affected the population in the Sabujbag thana area
during the flooding of 1998 is presented in Figure 7 as an
example of the extent of diseases that can occur in a flood-
affected area.
The graph shows very clearly that most people were
affected by diarrhoea followed by fever and helminthiasis.
People also developed skin problems when they come in
contact with sewage-mixed floodwater. There is clear
evidence that morbidity is higher during and after flooding,
compared with the non-flooding periods. Dengue is one of
the fastest increasing and life-threatening vector borne
diseases spread by mosquitoes during floods. Results for
the Dhaka case study show that more than 10,000 people
were infected and 144 died due to dengue in the month
of August 2002.
ASSESSMENT OF COMBINED DAMAGES
Floods deteriorate the quality of life of people by causing
disruptions. Quality of life refers to the degree of well-being
felt by an individual or group of people. Unlike standard of
living, quality of life is not a tangible concept and therefore
cannot be measured directly. Quality of life can be split into
two components: (i) physical well-being and (ii) psycho-
logical well-being due to, for example, stress and anxiety.
It was found from surveys that there is a nonlinear
relationship between anxiety and flood depth. The anxiety
level builds up as the flood depth increases. In Dhaka,
people are used to flooding. Therefore, floods of smaller
depth do not create too much anxiety. People get stressed
and start to worry when the flood level goes beyond half a
metre depth. However, even at 1.5m flood depth, anxiety
Figure 7 | Disease profile for Sabujbagh thana during the flood of 1998 (source: BRAC
Center, Dhaka).
175 A. E. Mynett and Z. Vojinovic | Hydroinformatics in multi-colours: part red Journal of Hydroinformatics | 11.3–4 | 2009

levels do not reach the tolerance limit of 80%. Based on the
anxiety level the productivity values can be determined.
Productivity decreases as people get tense because of a
flood. Consequently, productivity loss leads to loss of
income as well.
In the Dhaka case study, the depth of flooding and flood-
affected areas were determined by applying hydrodynamic
modelling in a GIS environment. In addition to the physical
processes, a social survey of the people residing in the study
area was carried out to assess how intangible losses in the
form of anxiety and decreasing productivity and income
levels could be evaluated. Intangible losses were not
calculated in monetary terms as data about the number of
the affected population residing in that region was unavail-
able. However, indirect intangible damages can be obtained
following the procedure as presented in Figure 8.
DISASTER MANAGEMENT AND EMERGENCY
PLANNING
Emergency or disaster management is the preparation,
support and reconstruction of society when natural or
man-made disasters occur. This is not intended to be an
intermittent sequence of events but an ongoing process by
which individuals, groups and communities manage hazards
in an effort to avoid or ameliorate the impact of disasters
resulting from the hazards (Price & Vojinovic 2008). The
traditional approach of disaster management follows a cyclic
approach of activities prior, during and after disaster events
as outlined byMesser (2003). In the pre-emergency phase, the
main emphasis is on reducing the vulnerability of commu-
nities to possible impacts of natural phenomena. Measures
include risk-mapping, application of building codes and land
zoning aswell as structuralmeasures suchas the construction
of dams against flooding. This phase comprises prevention,
mitigation and preparedness. During a disaster event, the
responsemechanisms are activated andmeasures carried out
in accordance with the prepared plans. This phase is usually
relatively short, lasting of the order of days or weeks.
Response measures taken immediately before and during
the initial stages of the event can greatly minimize the effects
of hazards created by any disaster. Such measures deal with
saving life and protecting property and include search and
rescue, provision of emergency food, shelter and medical
assistance. The effectiveness of responding todisasters largely
depends on the level of preparedness.
In the post-emergency phase recovery activities are
carried out, assisting communities to return to a proper level
of functioning. A recovery process usually takes much
more time, in some cases up to (many) years. Typical
activities in this phase include: restoration of essential
services and installations, as well as long-term measures of
Figure 8 | Curves to estimate intangible indirect damages (source: Ahmed 2008).
176 A. E. Mynett and Z. Vojinovic | Hydroinformatics in multi-colours: part red Journal of Hydroinformatics | 11.3–4 | 2009
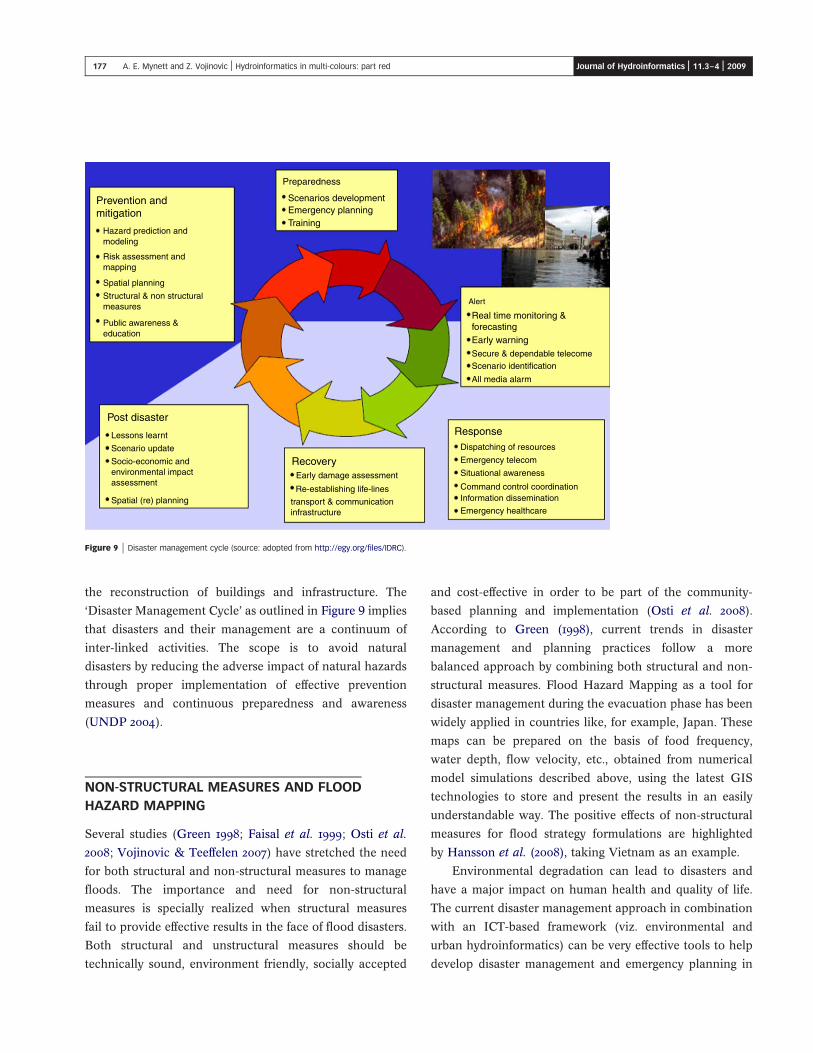
the reconstruction of buildings and infrastructure. The
‘Disaster Management Cycle’ as outlined in Figure 9 implies
that disasters and their management are a continuum of
inter-linked activities. The scope is to avoid natural
disasters by reducing the adverse impact of natural hazards
through proper implementation of effective prevention
measures and continuous preparedness and awareness
(UNDP 2004).
NON-STRUCTURAL MEASURES AND FLOOD
HAZARD MAPPING
Several studies (Green 1998; Faisal et al. 1999; Osti et al.
2008; Vojinovic & Teeffelen 2007) have stretched the need
for both structural and non-structural measures to manage
floods. The importance and need for non-structural
measures is specially realized when structural measures
fail to provide effective results in the face of flood disasters.
Both structural and unstructural measures should be
technically sound, environment friendly, socially accepted
and cost-effective in order to be part of the community-
based planning and implementation (Osti et al. 2008).
According to Green (1998), current trends in disaster
management and planning practices follow a more
balanced approach by combining both structural and non-
structural measures. Flood Hazard Mapping as a tool for
disaster management during the evacuation phase has been
widely applied in countries like, for example, Japan. These
maps can be prepared on the basis of food frequency,
water depth, flow velocity, etc., obtained from numerical
model simulations described above, using the latest GIS
technologies to store and present the results in an easily
understandable way. The positive effects of non-structural
measures for flood strategy formulations are highlighted
by Hansson et al. (2008), taking Vietnam as an example.
Environmental degradation can lead to disasters and
have a major impact on human health and quality of life.
The current disaster management approach in combination
with an ICT-based framework (viz. environmental and
urban hydroinformatics) can be very effective tools to help
develop disaster management and emergency planning in
Figure 9 | Disaster management cycle (source: adopted from http://egy.org/files/IDRC).
177 A. E. Mynett and Z. Vojinovic | Hydroinformatics in multi-colours: part red Journal of Hydroinformatics | 11.3–4 | 2009

order to reduce risk. The Disaster Management Cycle used
by the EU in hazard prevention policy research is presented
in Figure 9.
In view of the recent trend in climate change, urban and
spatial planning should consider adaptive management
strategies, e.g. flood zones should be delineated based on
the peak flood depth instead of the average flood depth.
Modern-day flood risk management requires the use of
latest technologies, notably GIS, remote sensing and web-
based application. The emphasis nowadays is on accounting
for uncertainty in decision-making. “Integrated flood risk
management” and sharing knowledge across nations and
communities will enhance the understanding and aid in
achieving a common strategy in flood risk management
(Begum et al. 2007).
PUBLIC AWARENESS AND AGENCIES
COORDINATION
Public awareness and participation in disaster prevention
and management are crucial and should cover all phases of
any disaster event. Lack of public awareness about their
role and absence of public involvement in preparation and
maintenance often create problems in disaster management.
An awareness-building programme to educate all people
about the purpose and function of flood protection and
drainage infrastructure is worth the investment. The
capacity of communities should be developed so that they
can learn to take first-hand measures before, during and
after flood events. Apart from implementation of a master
plan, successful flood mitigation and storm water manage-
ment requires proper coordination of all governmental
organizations. A clear distinction of the tasks of each
government agency and proper communication with the
general public at large are urgently needed for flood disaster
management. It should be apparent from the above that,
precisely in this field, urban hydroinformatics has a lot to
offer in master planning and flood mitigation management.
CONCLUSIONS
The effects of urban flooding are manifold, including
physical and structural damage, health issues, hygiene,
water quality and environment. Flooding in urban areas
can create huge economic losses since most of the structural
developments and human activities are located there.
Sewage water gets mixed with flood water and contami-
nates receiving water bodies and water supply systems.
Urban hydroinformatics is capable of making a valuable
contribution to urban flood and disaster management by
combining science, technologies and social considerations
into a holistic coherent framework.
Present-day hydrodynamic modelling packages can
simulate flows in urban drainage systems in conjunction
with free surface street flows. Water quality modelling is
capable of assessing pollutant transport in floods. Climate
change scenarios are used to explore future trends. Both
tangible and intangible damages due to flooding can be
identified, and direct as well as indirect costs assessed using
different approaches. Results are easily evaluated in a GIS
environment. Human health issues are expressed in terms
of Disability Adjusted Life Years (DALY) estimates indi-
cating the extent of epidemic diseases caused by floods. An
Anxiety–Productivity–Income relationship relates personal
anxiety to the level of productivity and income loss in the
case of flooding.
In order to demonstrate the issues involved in urban
flood and disaster management, a case study carried out for
the city of Dhaka in Bangladesh was used here, following
Ahmed (2008) who identified potential flood damages and
their impact on physical, social and environmental factors,
leading to disaster management scenarios and planning
options. Dhaka was selected as the case study since it is one
of the fastest growing megacities in the world with a long
history of flooding problems which continue to threaten
residents’ life and livelihood.
Flood mitigation measures for cities like Dhaka can best
be developed following an integrated approach to storm
water drainage and pollution control. A synergy between
structural and non-structural measures is required to obtain
sustainable solutions that can effectively deal with flood
events. Effective flood disaster management in megacities
heavily relies on coordinated efforts of government organi-
zations—including public participation—in the planning and
implementation of disaster management policies and
guidelines. In all these areas urban hydroinformatics can
greatly contribute.
178 A. E. Mynett and Z. Vojinovic | Hydroinformatics in multi-colours: part red Journal of Hydroinformatics | 11.3–4 | 2009

REFERENCES
Abazi, E. 2005 Modelling Floods in Wide Rivers using Sobek 1D2D:
A Case Study for the Elbe River. MSc Thesis HI 05.02,
UNESCO-IHE, Institute for Water Education, Delft,
The Netherlands.
Ahmed, F. 2008 Urban Flood, Its Effects and Management
Options: A Case Study of Dhaka City. MSc Thesis ES 08.01,
UNESCO-IHE, Institute for Water Education, Delft,
The Netherlands.
Ahmed, F., Vojinovic, Z. & Mynett, A. E. 2009 Urban flood
management for Dhaka city, Bangladesh. In: Proceedings
of the 2nd Int. Conf on Flood Management, Dhaka,
Bangladesh, March, (ICWFM-2009), BUET, 15–17 March,
2009, Vol. 2.
Akhtar, M. K. 2006 Flood Forecasting for Bangladesh with Satellite
Data. MSc Thesis HI 06.01, UNESCO-IHE, Institute for
Water Education, Delft, The Netherlands.
Alam, M. J. 2003 Two-Dimensional Urban Flood Modelling for Real
Time Flood Forecasting for Dhaka City. MSc Thesis, Asian
Institute of Technology, Thailand.
Apirumanekul, C. 2001 Modelling of Urban Flooding in Dhaka City.
MSc Thesis, Asian Institute of Technology, Thailand.
Bashar, K. E. 2005 Floodplain modelling in the Manu-Dhalai basin
of Bangladesh. MSc Thesis, UNESCO-IHE, Institute for Water
Education, Delft, The Netherlands.
Begum, S., Stive, J. F. M. & Hall, J. W. 2007 Flood Risk
Management in Europe. Advances in Natural and
Technological Hazards Research. Springer, Berlin.
Butler, D. & Davies, J. W. 2004 Urban Drainage. Spon Press,
London.
Chen, A. S., Hsu, M. H., Teng, W. H., Huang, C. J., Yeh, S. H. &
Lien, W. Y. 2006 Establishing the Database of Inundation
Potential in Taiwan. Natural Hazards 37 (1–2), 107–132.
Cruz, R. V., Harasawa, H., Lal, M., Wu, S., Anokhin, Y.,
Punsalmaa, B., Honda, Y., Jafari, M., Li, C. & Ninh, N. H.
2007 Asia Climate Change 2007: Impacts, Adaptation and
Vulnerability. Contribution of Working Group II to the Fourth
Assessment Report of the Intergovernmental Panel on Climate
Change (ed. M. L. Parry, O. F. Canziani, J. P. Palutikof, P. J.
van der Linden & C. E. Hanson), pp. 469–506. Cambridge
University Press, Cambridge.
Djordjevic, S., Prodanovic, D. & Walters, G. 2004 Simulation of
transcritical flow in pipe/channel networks. J. Hydraul. Eng.
130 (12), 1167–1178.
Djordjevic, S., Prodanovic, D., Maksimovic, C., Ivetic, M. & Savic,
D. 2005 SIPSON—Simulation of Interaction between Pipe
Flow and Surface Flow in Networks. Wat. Sci. Technol. 52 (5),
275–283.
Ediriweera, J. C. W. 2007 A GIS-based Framework for Urban
Flood Modelling and Disaster Management. MSc Thesis,
UNESCO-IHE, Institute for Water Education, Delft, The
Netherlands.
EMA 2002 Australian Emergency Manuals Series. Part III
Emergency Management Practice. Volume 2—Guidelines.
Guide 11. Disaster loss assessment Guidelines. Qld-
Department of Emergency Services and Emergency
Management Australia (Written by Handmer, J. Read, C. &
Percovich, O.).
Faisal, I. M., Kabir, M. R. & Nishat, A. 1999 Non-structural flood
mitigation measures for Dhaka City. Urban Water J. 1 (2),
145–153.
Genovese, E. 2006 A Methodological Approach to Land Use-based
Flood Damage Assessment in Urban Areas: Prague Case
Study. Institute for Environment and Sustainability, European
Commission, Directorate-General Joint Research Centre, ISSN
1018-5593, Printed in Italy.
Green, C. 1998 Encyclopaedia of Hydrology and Lakes. Springer,
Berlin.
Hansson, K., Danielson, M. & Ekenberg, L. 2008 A framework for
evaluation of flood management strategies. J. Environ. Manage.
86 (3), 465–480.
Hsu, M. H., Chen, S. H. & Chang, T. J. 2000 Inundation simulation
for urban drainage basin with storm sewer system. J. Hydrol.
234, 21–37.
JICA 1987 Study on Storm Water Drainage System Improvement
Project in Dhaka City, Supporting Report. Department of
Public Health Engineering, Dhaka.
Jonkman, S. N. 2007 Loss of Life Estimation in Flood Risk
Assessment: Theory and Applications. Technical University,
Delft, The Netherlands.
Kamal, M. M. & Rabbi, M. F. 1998 Storm water drainage model
coupled with flood dept mapping: a new approach towards
solution of urban drainage problems. In: Fourth International
Conference on Developments in Urban Drainage Modelling,
London, UK.
Kaushik, C. 2006 Urban Flood Modelling: A Comparative Study for
1D and 2D Models. MSc Thesis, UNESCO-IHE Institute for
Water Education, Delft, The Netherlands.
Kay, D. & Falconer, R. A. 2008 Hydro-epidemiology: the
emergence of a research agenda. Environ. Fluid Mech. 8
(5–6), 451–459.
Khan, M. S. A. & Chowdhury, J. U. 1998 Dhaka City Storm Water
Quality Assessment. Technical Report-1. IFCDR, BUET,
Dhaka, Bangladesh.
Kunii, O., Nakamura, S., Abdur, R. & Wakai, S. 2002 The
impact on health and risk factors of the diarrhoea
epidemics in the 1998 Bangladesh floods. Public Health
116 (2), 68–74.
Messer, N. 2003 The Role of Local Institutions in Disaster Risk
Mitigation: a Literature Review. FAO/SDAR, Rome.
Nishat, A., Reazuddin, M., Amin, R. & Khan, A. R. 2000 The
1998 Flood: Impact on Environment of Dhaka City.
Department of Environment and IUCN Bangladesh, Dhaka,
Bangladesh.
Noble, R. T., Moore, D. F., Leecaster, M. K., Mcgee, C. D. &
Weisberg, S. B. 2003 Comparison of total coliform, faecal
coliform, and enterococcus bacterial indicator response for
ocean recreational water quality testing. Water Res. 37,
1637–1643.
179 A. E. Mynett and Z. Vojinovic | Hydroinformatics in multi-colours: part red Journal of Hydroinformatics | 11.3–4 | 2009
Osti, R., Tanaka, S. & Tokioka, T. 2008 Flood hazard mapping in
developing countries: problems & prospects. Disaster Prev.
Manage. 17 (1), 104–113.
Parker, D. J., Green, C. H. & Thompson, P. M. 1987 Urban Flood
Protection Benefits—A Project Appraisal Guide. Gower
Technical Press, Aldershot, UK.
Penning-Rowsell, E. C. & Chatterton, J. B. 1977 The Benefits of
Flood Alleviation: A Manual of Assessment Techniques.
Gower Publishing Company, Aldershot, UK.
Price, R. K. & Vojinovic, Z. 2008 Urban flood disaster management.
Urban Water J. 5 (3), 259–276.
QNRM 2002 Guidance on the Assessment of Tangible Flood
Damages. Department of Natural Resources and Mines,
Government of Queensland, Queensland.
Rahman, M. M. & Hossain, M. D. 2002 Assessment of Water
Quality in Flood Affected Areas of Dhaka City, Engineering
Concerns Of Flood (ed. M. Ashraf Ali, S. M. Seraj &
S. Ahmad), pp. 35–48. Bangladesh University Of Engineering
And Technology, Dhaka, Bangladesh, August 2002.
Rahman, M. R. & Chowdhury, J. U. 1999 Dhaka City Storm Water
Quality Assessment. Technical Report-2. IFCDR, BUET,
Dhaka, Bangladesh.
Stuyt, L. C. P. M., Reinders, J. E. A., Van Der Hoek, E. E.,
Hermans, M., De Muinck, K. & Icke, J. 2007 The
Environmental Impact of Flooding of The Dutch ‘Delta-
Metropole’. In: Flood Risk Management in Europe: Advances
in Natural and Technological Hazards Research, Flood Risk
Management in Europe. Vol. 25. Begum, S., Stive, M. J. F. &
Hall, J. W. (Eds), pp. 107–129. Springer: The Netherlands.
Talukdar, S. H. 2006 Managing Mega Cities: A Case Study of
Metropolitan Regional Governance for Dhaka. PhD Thesis,
Murdoch University, Australia.
UNDP 2004 Reducing Disaster Risk: A Challenge for Development.
UNDP, Bureau for Crisis Prevention and Recovery, New York,
US.
UN-GA 2001 Road Map Towards the Implementation of the United
Nations Millennium Declaration. GA A/56/326. UN,
New York.
UN-ISDR 2002 Disaster risk and sustainable development:
understanding the links between development, environment
and natural hazards leading to disasters. World Summit on
Sustainable Development, Johannesburg, August–September,
p 1. UN, New York.
USEPA 1994 Urbanization and Water Quality: A Guide to
Protecting the Urban Environment. Terrene Institute,
Washington, DC.
Van der Veen, A., Vetere Arellano, A. L. & Nordvik, J.-P. 2003
Joint NEDIES and University of Twente Workshop In search
of a common methodology on damage estimation,
EUR Report 20997 EN. Office for Official Publications
of the European Communities, European Commission,
Bruxelles.
Vojinovic, Z. & Teeffelen, J. V. 2007 An integrated storm water
management approach for small islands in tropical climates.
Urban Water J. 4 (3), 211–231.
Vojinovic, Z. & Tutulic, D. 2009 On the use of 1D and coupled 1D-
2D modelling approaches for assessment of flood damages in
urban areas. Urban Water J. (In press).
Vojinovic, Z., Bonillo, B., Chitranjan, K. & Price, R. 2006 Modelling
flow transitions at street junctions with 1D and 2D models.
Seventh International Conference on Hydroinformatics,
Acropolis—Nice, France, September, 2006.
Vojinovic, Z., Ediriweera, J. C. W. & Fikri, A. A. 2008 An Approach
to the Model-based Spatial Assessment of Damages Caused
by Flash Floods. Eleventh International Conference on
Urban Drainage, Edinburgh, Scotland, 31st August–5th
September.
Vrouwenvelder, A. C. W. M. & Vrijling, J. K. 1996 Collegedictaat
Probabilistisch Ontwerpen b3. TU Delft, The Netherlands.
WHO 2003 Climate Change and Human Health-Risks and
Responses. WHO, Geneva, Switzerland.
Yang, L. Lin, B. & Falconer, R. A. 2008 Modelling Enteric
Bacteria Levels in Coastal and Estuarine Waters.
Proc. Inst. of Civil Eng. Eng. and Comput. Mech. 161 (4),
179–186.
First received 15 April 2009; accepted in revised form 1 May 2009
180 A. E. Mynett and Z. Vojinovic | Hydroinformatics in multi-colours: part red Journal of Hydroinformatics | 11.3–4 | 2009