Hydrogeology Study - City of Guelph · 2019-01-24 · SCOPED HYDROGEOLOGY STUDY, HYLAND ROAD,...
88
Dunnink Homes Ltd. Scoped Hydrogeology Study Hyland Road Guelph, Ontario Hydrogeology Study Date: March 28, 2018 Ref. N°: 160-P-0011569-0-01-300-HD-R-0001-02
Transcript of Hydrogeology Study - City of Guelph · 2019-01-24 · SCOPED HYDROGEOLOGY STUDY, HYLAND ROAD,...

Dunnink Homes Ltd.
Scoped Hydrogeology Study Hyland Road Guelph, Ontario
Hydrogeology Study
Date: March 28, 2018 Ref. N°: 160-P-0011569-0-01-300-HD-R-0001-02


TABLE OF CONTENTS
353 Bridge Street East, Kitchener (Ontario) Canada N2K 2Y5 – T 519.741.1313 | F 519.741.5422 – [email protected]
INTRODUCTION ................................................................................................................................ 1
1 STUDY PROCEDURE .................................................................................................................. 2
1.1 Review of Previous Study ................................................................................................... 2 1.2 Field Program ...................................................................................................................... 3 1.3 Monitoring Well Installations ............................................................................................... 3 1.4 Laboratory Soil Testing ....................................................................................................... 4 1.5 Hydraulic Conductivity Testing ............................................................................................ 4 1.5.1 Grain Size Analyses ............................................................................................................ 5 1.5.2 Slug Testing ........................................................................................................................ 5 1.6 Groundwater Chemistry Testing ......................................................................................... 6
2 SUMMARIZED CONDITIONS ...................................................................................................... 6
2.1 Site Description ................................................................................................................... 6 2.2 Physiography and Area Geology ........................................................................................ 8 2.3 Subsoil Conditions .............................................................................................................. 8 2.4 Hydraulic Conductivity......................................................................................................... 8 2.5 Groundwater Elevations and Flow Direction ....................................................................... 9 2.6 Groundwater Chemistry Analysis Results........................................................................... 9 2.6.1 PWQO Criteria .................................................................................................................... 9 2.7 Climate .............................................................................................................................. 10
3 PRE-DEVELOPMENT WATER BALANCE ................................................................................ 10
3.1.1 Precipitation and Evapotranspiration ................................................................................ 11 3.1.2 Infiltration and Runoff ........................................................................................................ 11 3.2 Infiltration of Precipitation .................................................................................................. 12 3.3 Post-Development Water Balance Considerations ........................................................... 13
4 POTENTIAL IMPACTS OF LAND DEVELOPMENT ................................................................. 14
4.1 Water Users ...................................................................................................................... 14 4.1.1 Helmar Municipal Well ...................................................................................................... 15 4.1.2 Park # 1 and Park # 2 Municipal Wells ............................................................................. 16 4.1.3 Emma Municipal Well........................................................................................................ 16

TABLE OF CONTENTS
353 Bridge Street East, Kitchener (Ontario) Canada N2K 2Y5 – T 519.741.1313 | F 519.741.5422 – [email protected]
4.2 Sensitive Areas ................................................................................................................. 16 4.2.1 Well Head Protection Areas (WHPAs) .............................................................................. 16 4.2.2 WHPA Vulnerability ........................................................................................................... 17 4.2.3 Aquifer Intrinsic Vulnerability ............................................................................................. 17 4.2.4 Groundwater Recharge Vulnerability ................................................................................ 17 4.2.5 Wetlands ........................................................................................................................... 17 4.2.6 Streams ............................................................................................................................. 18 4.3 Connectivity Between Groundwater and Surface Water .................................................. 18 4.4 Potential Sources of Contamination .................................................................................. 19
5 CONCLUSIONS AND RECOMMENDATIONS .......................................................................... 19
5.1 Conclusions ....................................................................................................................... 19 5.2 Recommendations ............................................................................................................ 20
6 STATEMENT OF LIMITATIONS ................................................................................................ 22
REFERENCES ................................................................................................................................. 23
Tables Table 1: Borehole with Provincial Site Cluster Tag Identification Number ................................................................ 4 Table 2: Range of Hydraulic Conductivity Values .................................................................................................... 9 Table 3: Monthly Climate Summary data1 .............................................................................................................. 10 Table 4: Annual Pre-Development for the Study Area (SA) ................................................................................... 12 Table 5: Calculated Separation Between Underside of Footing and Measured Groundwater Elevations .............. 13 Appendices Appendix 1 Drawings Appendix 2 Borehole Logs Appendix 3 Tables Appendix 4 Sokkia GRX 2 GNSS Data Appendix 5 Figures Appendix 6 Slug Test Analysis Appendix 7 MOECC Water Well Records Appendix 8 Laboratory Certificate of Analysis
160-P-0011569-0-01-300-HD-R-0001-02
SCOPED HYDROGEOLOGY STUDY, HYLAN D ROAD, GUELPH
iv
Property and Confidentiality
"This engineering document is the property of Englobe Corp. and, as such, is protected under Copyright Law. It can only be used for the purposes mentioned herein. Any reproduction or adaptation, whether partial or total, is strictly prohibited without having obtained Englobe Corp’s and its client's prior written authorization to do so.
Test results mentioned herein are only valid for the sample(s) stated in this report.
Englobe Corp's subcontractors who may have accomplished work either on site or in laboratory are duly qualified as stated in our Quality Manual's procurement procedure. Should you require any further information, please contact your Project Manager."
Client: Dunnink Homes Ltd. 4988 Jones Baseline Road, R.R. #2 Guelph, Ontario N0B 2J0 Attention: Mr. John Dunnink
REVISION AND PUBLICATION REGISTER
Revision N° Date Modification And/Or Publication Details
0A 2016/12/08 Draft Report Issued
00 2017/01/27 Final Report Issued
01 2017/03/15 Revised Report Issued
02 2018/03/28 Revised Report Issued
DISTRIBUTION
1 electronic copy, 3 hard copies Mr. John Dunnink, Dunnink Homes Ltd.
1 electronic copy Mr. Ryan Archer, NRSI
1 electronic copy File
alc/jw

160-P-0011569-0-01-300-HD-R-0001-02
SCOPED HYDROGEOLOGY STUDY, HYLAN D ROAD, GUELPH
1
INTRODUCTION
Englobe Corp. (Englobe) was retained to carry out a scoped hydrogeology study for the proposed residential subdivision development at the properties located at 46, 47 and 87 Hyland Road in Guelph, Ontario as shown on the Location Plan, Drawing 1 in Appendix 1. This work was authorized by Mr. John Dunnink, of Dunnink Homes following submission of a fee proposal.
The scope of work for this scoped hydrogeology study included a review of available topographic, geological and hydrogeological information for the Study Area and adjacent lands, and a subsurface investigation within the Study Area. The subsurface investigation was performed to identify the subsoil stratigraphy and hydrogeological properties, groundwater conditions and hydraulic gradients, and the relationship between groundwater and surface water features.
The objectives of this report are:
To assess the geological and hydrogeological conditions beneath the Study Area; To describe the soil physical properties; To investigate water users, sensitive areas, and potential contaminant sources within the
Study Area; and, To identify potential impacts and provide suggested mitigation measures.
160-P-0011569-0-01-300-HD-R-0001-02
SCOPED HYDROGEOLOGY STUDY, HYLAN D ROAD, GUELPH
2
1 STUDY PROCEDURE
The study methodology involved:
Review of previous studies for information concerning hydrogeological and geological conditions in the study area;
Compilation of water users by searching the Ontario Ministry of the Environment and Climate Change (MOECC) Water Well Record database for wells within a 600 m radius of the property;
Advancement of three (3) boreholes in specified locations, each completed as a 50 mm diameter monitoring well;
Surveying of locations and elevations of the on-site monitoring wells; Measurement of groundwater levels, and the elevation of groundwater beneath the subject
property; Particle size distribution analysis of three (3) soil samples, and in-situ single-response
hydraulic (slug) testing of three (3) on-site monitoring wells; Collection and analysis of three (3) groundwater samples, with comparison to the Provincial
Water Quality Objective (PWQO) criteria; Assessment of the connectivity between groundwater and surface water features, if present; Investigation of other water users, sensitive areas, and potential contaminant sources within
the vicinity of the Study Area; Evaluation of potential impacts and mitigation measures.
1.1 REVIEW OF PREVIOUS STUDY
Reports consulted as part of this study include:
Functional Servicing and Stormwater Management Report, Hyland Road and Glenburnie Drive Extensions, City of Guelph, Ontario (Van Harten Surveying Inc. Report No. 21203-13 December 21, 2015).
46, 47 and 87 Hyland Road, Guelph Environmental Impact Study (Natural Resource Solutions Inc. Project No. 1400, December, 2015).
46, 47 & 87 Hyland Road – Proposed residential subdivision Terms of Reference for an Environmental Impact Study (City of Guelph Environmental Advisory Committee, February 12, 2014).
Environmental Impact Study - Hyland Road, Guelph, Ontario Terms of Reference (Natural Resource Solutions Inc. Project No. 1400, January 3, 2014).
Proposed Development 66, 78 and 82 Eastview Road, Guelph, Ontario (LVM Report No. 160-P-0000865-0-01-300-HD-R-0001-0A, July 23, 2012).

160-P-0011569-0-01-300-HD-R-0001-02
SCOPED HYDROGEOLOGY STUDY, HYLAN D ROAD, GUELPH
3
2006 Annual Report – Eastview Road Landfill Site – City of Guelph (Gartner Lee Limited GLL-70-131, April, 2007).
Ground Water Resources Study, City of Guelph, Northeast Quadrant, Volume 1. (Jaggar Hims Limited, 1995).
1.2 FIELD PROGRAM The present field program involved the advancement of three (3) boreholes (BH-01-16, BH-02-16 and BH-04-16) to depths ranging from 3.81 to 14.17 m to identify the subsurface soil and groundwater conditions at the locations shown on the appended Drawing 2 Site Plan. The boreholes were advanced on September 28, 2016 by Geo-Environmental Drilling Inc. under the full-time observation of a senior technician from Englobe using a CME-75 track-mounted drillrig equipped with continuous flight hollow stem augers.
Soil samples were recovered from the boreholes at regular 0.75 and 1.50 m depth intervals using a 50 mm diameter split-spoon sampler in accordance with the Standard Penetration Test (SPT) procedure (ASTM D1586). Soil samples obtained from the boreholes were submitted for moisture content analysis and three (3) particle size distribution analyses. The laboratory results for moisture content are included on the borehole logs in Appendix 2. The laboratory results for the particle size distribution analyses are included in Appendix 5.
Based on the surficial geology in the area and the depth at which groundwater was encountered during borehole advancement, it was determined that the installation of mini piezometers would not be conducive to the study.
The borehole locations and ground surface elevations were surveyed by Englobe using a Sokkia Model GRX 2 Global Navigation Satellite System (GNSS) Rover. The borehole locations were referenced to Universal Trans Mercator North American Datum of 1983 (UTM NAD83) coordinates; the zone reference (17T) has been excluded for presentation purposes. The ground surface elevations are geodetic based on GNSS and local base station telemetry with a vertical root mean squared error of less than 20 mm. Table 101 in Appendix 3 outlines the coordinates obtained for borehole, monitoring well and surface water features located on site. Raw data obtained from the Sokkia unit in September 2016 is attached in Appendix 4.
1.3 MONITORING WELL INSTALLATIONS During the borehole drilling program, monitoring wells were installed in three (3) boreholes BH-01-16, BH-02-16, and BH-04-16 for measurement of groundwater levels and saturated soil hydrogeological parameters. Initially five (5) monitoring wells were proposed assuming a shallow groundwater table. However, due to the depth of groundwater the decision to proceed with three (3) deep monitoring wells rather than five (5) shallow ones was made in order to intersect and screen a section of the saturated soils.

160-P-0011569-0-01-300-HD-R-0001-02
SCOPED HYDROGEOLOGY STUDY, HYLAN D ROAD, GUELPH
4
The 50 mm diameter monitoring wells were constructed by inserting slotted, Schedule 40 PVC well screen and riser pipe into the open auger holes. Sand was added in order to place a filter pack around the screen, until the level of the sand was approximately 300 mm above the top of the screen. Bentonite seals were then placed above the sand pack to prevent the infiltration of surface water. The tops of all the well riser pipes were vented to allow accurate measurement of stabilized groundwater levels, and the flush mount wells were concreted in place to house each of the monitoring wells. Details of the monitoring well installations and soil and groundwater conditions encountered are provided on the borehole logs included in Appendix 2.
All of the monitoring wells were constructed in accordance with Ontario Regulation 903 (as amended) as administered by the Ontario Ministry of the Environment and Climate Change (MOECC). Well records were submitted to the MOECC based on the cluster system whereby one well record can be submitted on behalf of an entire property. Provincial Site Cluster Tag Identification Numbers were placed on the boreholes listed in Table 1. A licensed well technician must properly decommission the monitoring wells prior to construction.
Table 1: Borehole with Provincial Site Cluster Tag Identification Number
BOREHOLE PROVINCIAL SITE CLUSTER TAG
IDENTIFICATION NUMBER
BH-04-16 A202673
Dedicated Waterra™ LPDE tubing and a turbine pump were used to develop each well through pumping. The wells were then allowed to equilibrate prior to collecting the groundwater level measurements and groundwater chemistry samples. Measurements of stabilized groundwater levels in the monitoring wells were obtained on October 24 and 31, 2016 and again on February 12, 2018 with measurements summarized in Table 102 in Appendix 3.
1.4 LABORATORY SOIL TESTING All soil samples obtained during borehole drilling were returned to Englobe laboratory facilities for visual examination, with selected samples undergoing physical testing. The soil moisture content test results obtained from borehole samples are plotted on the borehole logs in Appendix 2, and the particle size distribution analyses are described in Section 1.5.1 below.
1.5 HYDRAULIC CONDUCTIVITY TESTING Hydraulic conductivity estimates for the site soils were determined using two methods. The first method involves a calculated estimation of hydraulic conductivity based on grain size analysis of soil samples using the Kaubisch and Beyer formulae where applicable. The second method is applicable to saturated soils at depth, and involves single response insitu hydraulic (slug) tests of monitoring wells. The two methods used for this study are described in the following subsections.

160-P-0011569-0-01-300-HD-R-0001-02
SCOPED HYDROGEOLOGY STUDY, HYLAN D ROAD, GUELPH
5
1.5.1 Grain Size Analyses Hydraulic conductivity values of near-surface soil samples were evaluated empirically using the particle size distribution test and the Kaubisch and Beyer formulae where the grain size analyses fell within the formulae criteria and limits. The calculated values correlate well with published hydraulic conductivity ranges (Freeze and Cherry, 1979) for the soil types encountered.
The particle size distribution analysis graphs are shown on Figure 1 in Appendix 5, and the calculated hydraulic conductivity values for the samples from the boreholes are included in the appended Table 103.
1.5.2 Slug Testing Hydraulic conductivity estimates were determined for the saturated soils at depth using single response slug tests for all monitoring wells. Groundwater conditions were unconfined or phreatic.
Each monitoring well was developed prior to slug testing. Well purging was implemented to remove silt and sand introduced into the well during construction, and to remove fine soils from the coarse sand pack placed around the outside of the well screen.
The slug test procedure employs the hydrostatic time-lag method for groundwater recovery following the introduction of a slug of known volume into a monitoring well, and makes use of the theory of Hvorslev (1951), as described in Freeze and Cherry (1979).
Hvorslev's method is expressed by the following equation:
where:
K = hydraulic conductivity of the tested material (m/sec) r = inner radius of the well riser pipe (m) R = outer radius of the well riser pipe (m) L = length of screen and sand pack (m) To = time lag (sec), where (H-h)/(H-Ho) = 0.37 h = water level at each time of measurement (m) Ho = initial water level at start of test (m) H = stabilized water level prior to introducing slug (m)
( )oLTR
LrK
2
ln2
=

160-P-0011569-0-01-300-HD-R-0001-02
SCOPED HYDROGEOLOGY STUDY, HYLAN D ROAD, GUELPH
6
The time lag, T0, is defined as the time required for the water level to recover to 63% of the stabilized level if the initial flow rate into the well is maintained. T0 is determined graphically as the time for which (H-h) divided by (H-H0) is equal to 0.37.
Slug test data was analyzed using the above formulae with MS-Excel spreadsheets. Graphed results of the slug tests completed for the monitoring wells are included in Appendix 6. A summary of the hydraulic conductivity estimates is provided in the appended Table 103, Appendix 3.
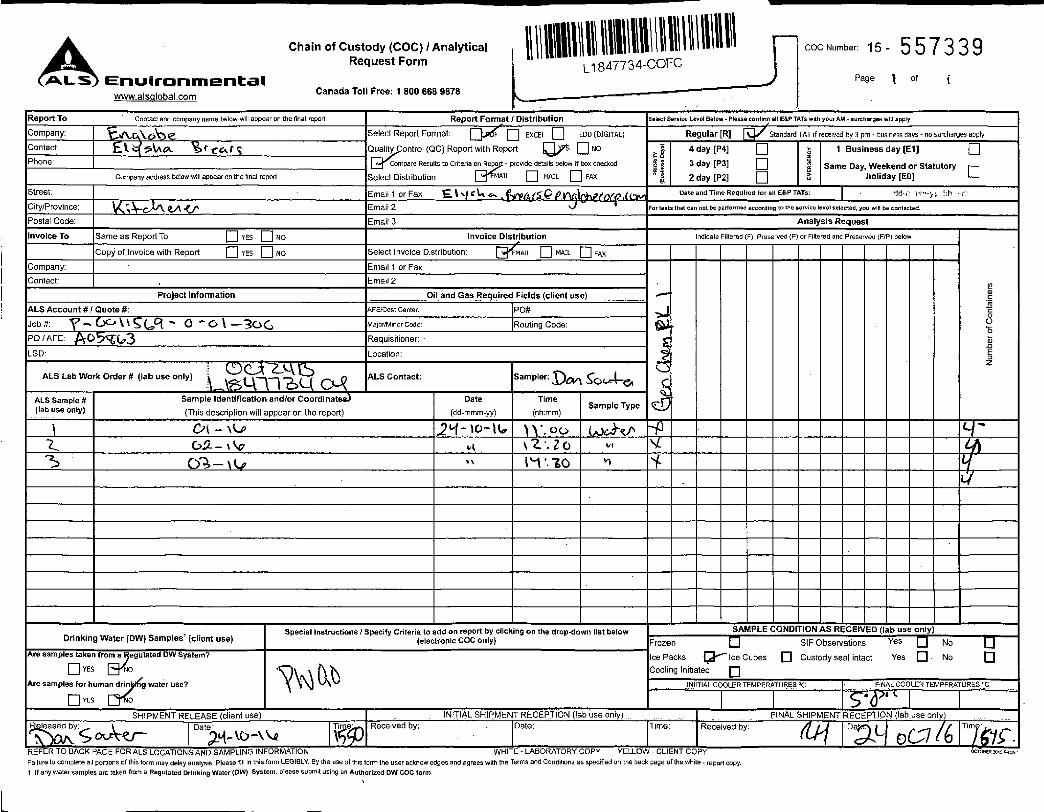
1.6 GROUNDWATER CHEMISTRY TESTING Three groundwater samples were collected on October 24, 2016 from BH-01-16, BH-02-16 and BH-04-16 using low flow sampling techniques. A Geotech GeoPump2 peristaltic pump was used to sample the monitoring wells. A water quality meter was used to monitor the groundwater quality parameters to ensure water quality parameters had stabilized prior sampling. The groundwater samples were packed in coolers with ice and delivered to ALS Laboratory Services in Waterloo, Ontario. The samples were submitted for analysis of PWQO criteria. Analysis results are summarized in the appended Table 104 with comparison to PWQO criteria. The laboratory Certificates of Analysis are included in Appendix 8 for reference.
2 SUMMARIZED CONDITIONS
2.1 SITE DESCRIPTION The site is located north and south of Hyland Road on lots 46, 47, and 87 in Guelph, Ontario. The site is 6.82 ha (City of Guelph Environmental Advisory Committee, 2014). Although the entire site is 6.82 ha, only 1.49 ha will be developed for the proposed sixteen (16) single family dwellings (Van Harten Surveying Inc., 2015). The majority of site is currently not developed and consists of thicket, mowed lawn and a portion of the Guelph Northeast Provincially Significant Wetland Complex (City of Guelph Environmental Advisory Committee, 2014). An existing garage located at 46 Hyland Road and an existing single family residence located at 47 Hyland Road will be demolished as part of the development (Van Harten Surveying Inc., 2015).The site is within the Hadati Creek subwatershed. The proposed development includes the construction of nine (9) fully serviced single family dwellings at the extension of Hyland Road, and seven (7) fully serviced single family dwellings at the extension of Glenburnie Drive (Van Harten Surveying Inc., 2015).

160-P-0011569-0-01-300-HD-R-0001-02
SCOPED HYDROGEOLOGY STUDY, HYLAN D ROAD, GUELPH
7
The Guelph Northeast Provincially Significant Wetland Complex is located on site, however based on the Functional Servicing and Stormwater Management Report produced by Van Harten Surveying Inc. (Report No. 21203-13, December 21, 2015) and the Natural Resource Solutions Inc. Environmental Impact Study (No. 1400, December 2015) it is excluded that any buildings will be located on the wetland. Post Development Drainage Catchment Areas for Proposed Hyland Road Cul-de-Sac and Proposed Glenburnie Drive Extension (Van Harten Surveying Inc., 2015) have been included as Figures 2 and 3 in Appendix 5. Based on lot parcels from GRCA mapping (2016) and these figures it is not anticipated that any of the single family dwellings will be constructed on top of the wetlands.
The closed Eastview Road Landfill Site is located approximately 865 m northwest of the Site. It has now been naturalized and is formally known as Pollinators Park. This site will be further discussed in Section 4.4 Potential Sources of Contamination.
An unnamed tributary flows adjacent to the Eastview Road Landfill Site is located approximately 756 m northeast of the site. The tributary enters a culvert at the southern end of the landfill property where it emerges and discharges to Hadati Creek. Hadati Creek is located approximately 1.6 km east of the site and discharges into Clythe Creek. Clythe Creek is located approximately 2.8 km southeast of the site.
Guelph Lake located within Guelph Lake Conservation Authority, owned by the Grand River Conservation Authority (GRCA) is located approximately 2.1 km north of the site. The Speed River drains out of Guelph Lake approximately 3.1 km north of the site and meanders south. The closest expression of the Speed River to the site is approximately 2.1 km east of the site between Speedvale Avenue West and Eramosa Road. The Eramosa River is located approximately 3.1 km southeast of the site.
Three City of Guelph municipal well fields (Helmar, Emma and Park #1 / Park #2) are located within the vicinity of the Site. The Helmar well field (WWR No. 6701133) is approximately 1.3 km north from the site. The Park #1 and Park #2 well field (WWR Nos. 6700855 and 6700858) is approximately 1.6 km south from the site, and lastly; the Emma Well (WWR No. 6704194) is approximately 1.7 km south of the site. These wells will be discussed further in Section 4.1 Water Users.
Ground surface elevations across the Study Area are found to be between 348 to 360 mASL. Topographic highs are experienced at the proposed Glenburnie extension where it slopes northeast toward the Guelph Northeast Provincially Significant Wetland Complex at an inferred elevation of roughly 343 mASL.

160-P-0011569-0-01-300-HD-R-0001-02
SCOPED HYDROGEOLOGY STUDY, HYLAN D ROAD, GUELPH
8
2.2 PHYSIOGRAPHY AND AREA GEOLOGY The Surficial Geology Map of the Guelph Area (GRCA, 2016) and the Quaternary (Pleistocene) Geology Map of the Guelph Area (Karrow, 1963) indicates that the sediments within the Study Area are sandy till deposits of the Erie-Ontario ice lobe, interpreted as Wentworth Till. According to a Jaggar Hims Limited report produced for the City of Guelph in 1995 (Ground Water Resources Study, City of Guelph, Northeast Quadrant, 1995), there has been discrepancies in the naming of the till unit located within the Study Area. In Karrow’s 1968 mapping, the till unit is identified as the Wentworth Till, however in 1974 Karrow revised the definition of both the Port Stanley Till and Wentworth Till to show regional relationships identified during field studies of the Guelph area. To reflect the changes in till definitions, till units located west of the Paris Moraine are now identified as the Port Stanley Till and not Wentworth Till. The Port Stanley till is encountered across the Study Area and is depicted on the appended Drawing 3 (Jaggar Hims Limited, 1992). The Ariss Esker is intermittently expressed surficially north of the site and is identified on the appended Drawing 3.
The Study Area is situated within the Guelph drumlin field physiographic region of Southern Ontario (Chapman and Putnam, 1984) and more specifically located within the drumlinized till plains and drumlins physiographic landforms as described by Chapman and Putnam (2007) and depicted on the appended Drawing 4.
Bedrock was encountered at roughly 24.4 mBGS (323.6 mASL) within the vicinity of the Study Area according to MOECC WWR No. 6701122. According to the Bedrock Topography of the Guelph Area (Karrow et al. 1979) and MOECC WWRs within a 600 m radius of the site, depth to bedrock in the Study Area is between 19.5 and 39.9 mBGS (64 – 131 fBGS), corresponding to approximate elevations between 326.6 and 306.2 mASL.
2.3 SUBSOIL CONDITIONS The appended borehole logs from this investigation show varying soil conditions across the Study Area. The appended borehole logs describe the soil types, stratigraphies, results of SPT testing, moisture content profiles, pocket penetrometer test results, details of monitoring well construction, and groundwater measurements and observations.
The subsurface stratigraphy is illustrated in the cross section on the appended Drawing 5, and generally consists of fill overlying sand till and silts till. In few locations, the fill overlies sand, sand and gravel.
2.4 HYDRAULIC CONDUCTIVITY Hydraulic conductivity estimates determined by the various testing methods are summarized in the appended Table 103. Three particle size distribution graphs are plotted on the appended Figure 1, and the graphical analyses of three slug tests are included in Appendix 6.

160-P-0011569-0-01-300-HD-R-0001-02
SCOPED HYDROGEOLOGY STUDY, HYLAN D ROAD, GUELPH
9
The analyzed soil samples varied from silt with some clay and trace sand and gravel to gravelly sandy silt with trace clay.
Table 2: Range of Hydraulic Conductivity Values
SOIL TYPE HYDRAULIC CONDUCTIVITY (m/sec)
RANGE GEOMETRIC MEAN NUMBER OF SAMPLES
Silt with some clay and trace sand and gravel < 1.0 x 10⁻⁹ to 3.2 x 10⁻⁷ 1.7 x 10⁻⁸ 4
Gravelly sandy silt with trace clay 7.8 x 10⁻⁷ to 9.8 x 10⁻⁷ 8.7 x 10⁻⁷ 2
2.5 GROUNDWATER ELEVATIONS AND FLOW DIRECTION Groundwater is typically found within the granular deposits beneath the Study Area. The granular deposits occurring at varying depths across the Study Area are interpreted to be hydraulically connected and build an unconfined shallow overburden aquifer.
Across the Study Area, groundwater in the shallow overburden aquifer flows towards the Guelph Northeast Provincially Significant Wetland Complex in a northeasterly direction. The observed depth to water table in the boreholes varies across the site from approximately 2.4 to 4.4 mbgs. Shallow groundwater contours are shown on the appended Drawing 6. The depicted groundwater levels were measured on October 31, 2016.
2.6 GROUNDWATER CHEMISTRY ANALYSIS RESULTS Groundwater samples were obtained from the three monitoring wells on October 24, 2016, placed in the appropriate containers in a cooler, and submitted to ALS Laboratories in Waterloo, Ontario for analysis of PWQO criteria. Analysis results are summarized in the appended Table 104 with comparison to PWQO criteria. The Laboratory Certificate of Analysis is included in Appendix 8 for reference.
2.6.1 PWQO Criteria As presented in the appended Table 104, Monitoring Wells BH-01-16, BH-02-16 and BH-04-16 all had measured exceedances of total aluminum. Monitoring Well BH-02-16 exhibited additional exceedances for total copper, total iron, total lead, and total zinc. Monitoring Well BH-04-16 exhibited an additional exceedance for total arsenic. It is important to consider that, while the monitoring wells were developed and purged prior to sampling, the samples contained significant amounts of sediment as they were not filtered in the field. The parameters in exceedance concentrations are very likely related to particulate in the water samples as a result of the sampling methodology. Lastly, total phosphorus detection limits are higher than the PWQO limit therefore the potential exists that all three monitoring wells may be in exceedance of total phosphorus.

160-P-0011569-0-01-300-HD-R-0001-02
SCOPED HYDROGEOLOGY STUDY, HYLAN D ROAD, GUELPH
10
2.7 CLIMATE Guelph’s climate is characterized by variable annual temperatures and less variable total monthly precipitation. The average annual temperature was approximately 7.0°C and the inferred average total precipitation is 916.5 mm/yr1. Precipitation is typically lower in the fall and winter months, and late spring months experience higher amounts of runoff due to the effect of winter snow melt. Table 1 below lists monthly average precipitation and temperature data; from the Kitchener/Waterloo station located at the Region of Waterloo International Airport in Breslau (Latitude: 43°46'00" N Longitude: 80°38'00" W; Elevation: 321.60 m). This location was used as there are no Canadian Climate Normals from 1981-2010 available for stations within Guelph.
Table 3: Monthly Climate Summary data1
MONTH PRECIPITATION mm/month
TEMPERATURE deg. Celsius
Jan 65.2 -6.5
Feb 54.9 -5.5
Mar 61.0 -1.0
Apr 74.5 6.2
May 82.3 12.5
Jun 82.4 17.6
Jul 98.6 20.0
Aug 83.9 18.9
Sep 87.8 14.5
Oct 67.4 8.2
Nov 87.1 2.5
Dec 71.2 -3.3
Total 916.5 --
Average -- 7.0
3 PRE-DEVELOPMENT WATER BALANCE The water balance accounts for all water in- and out-flows in the hydrologic cycle. Precipitation (P) falls as rain and snow. Precipitation can run off towards wetlands, ponds, lakes, and streams (R), infiltrate to the groundwater table (I), or evaporate from surface water and vegetation (ET). When long-term average values of P, R, I, and ET are used then minimal or no net change to groundwater storage (ΔS) is assumed.
1 Canadian Climate Centre, 1981-2010, for Region of Waterloo International Airport
160-P-0011569-0-01-300-HD-R-0001-02
SCOPED HYDROGEOLOGY STUDY, HYLAN D ROAD, GUELPH
11
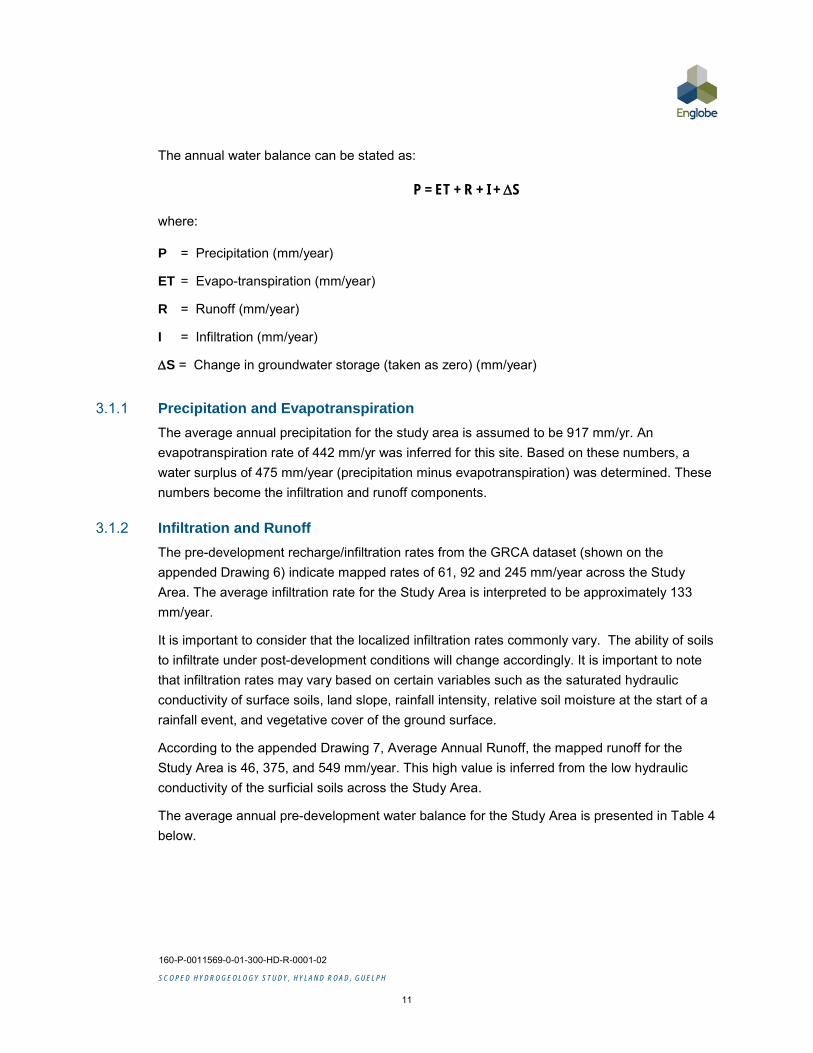
The annual water balance can be stated as:
P = ET + R + I + ∆S
where:
P = Precipitation (mm/year)
ET = Evapo-transpiration (mm/year)
R = Runoff (mm/year)
I = Infiltration (mm/year)
∆S = Change in groundwater storage (taken as zero) (mm/year)
3.1.1 Precipitation and Evapotranspiration The average annual precipitation for the study area is assumed to be 917 mm/yr. An evapotranspiration rate of 442 mm/yr was inferred for this site. Based on these numbers, a water surplus of 475 mm/year (precipitation minus evapotranspiration) was determined. These numbers become the infiltration and runoff components.
3.1.2 Infiltration and Runoff The pre-development recharge/infiltration rates from the GRCA dataset (shown on the appended Drawing 6) indicate mapped rates of 61, 92 and 245 mm/year across the Study Area. The average infiltration rate for the Study Area is interpreted to be approximately 133 mm/year.
It is important to consider that the localized infiltration rates commonly vary. The ability of soils to infiltrate under post-development conditions will change accordingly. It is important to note that infiltration rates may vary based on certain variables such as the saturated hydraulic conductivity of surface soils, land slope, rainfall intensity, relative soil moisture at the start of a rainfall event, and vegetative cover of the ground surface.
According to the appended Drawing 7, Average Annual Runoff, the mapped runoff for the Study Area is 46, 375, and 549 mm/year. This high value is inferred from the low hydraulic conductivity of the surficial soils across the Study Area.
The average annual pre-development water balance for the Study Area is presented in Table 4 below.

160-P-0011569-0-01-300-HD-R-0001-02
SCOPED HYDROGEOLOGY STUDY, HYLAN D ROAD, GUELPH
12
Table 4: Annual Pre-Development for the Study Area (SA)
HYDROLOGICAL COMPONENT
STUDY AREA mm/year
%
Total Precipitation 917 100.0
Evapotranspiration 442 48.2
Infiltration 133 14.5
Runoff 342 37.3
Based on these mapped values across the site, it is noted that the overall runoff component of the Study Area is relatively high, and the infiltration rate is relatively low. These runoff and infiltration values are a result of the poorly draining soils contributing to low infiltration rates.
3.2 INFILTRATION OF PRECIPITATION Hydraulic conductivity values of sub-surface soils within the study area were calculated using a variety of methods. Based on the borehole lithological stratigraphy, near-surface soils are typically silt with some clay and trace sand and gravel to gravelly sandy silt resulting in a relatively low permeability. It is important to consider that the site infiltration rate calculated previously represents an average of the soil types encountered across the study area.
At-source infiltration of precipitation from rooftops and other impervious surfaces, or infiltration under roadways, will be dependent on the native soil types exposed by grading and/or the physical characteristics of fill placed; along with the thickness of unsaturated soils above the shallow groundwater table.
As the pre-development (current) infiltration rate across the site is low, and the wetland areas are supported in part by groundwater, measures to maintain infiltration volumes will be important to maintain the function of the wetlands. Depression-focused infiltration within the wetland areas will be maintained by maintaining groundwater flow to the wetlands.
It is noted that the rates presented in Table 4 above take into account the area included within the Study Area only, and do not account for additional infiltration resulting from runoff from the Study Area infiltrating within adjacent wetlands located outside the Study Area.
Under post-development conditions, maintenance of infiltration rates within the Study Area and runoff contributions from the Study Area to adjacent areas will be necessary to ensure the overall water balance within and outside of the Study Area is maintained. During a site reconnaissance completed in September 2016 it was noted that areas identified as a wetlands on GRCA mapping on the site were dry, and a woodlot was observed. Based on this information, it is noted that the delineated wetland area on site is not saturated year round.
160-P-0011569-0-01-300-HD-R-0001-02
SCOPED HYDROGEOLOGY STUDY, HYLAN D ROAD, GUELPH
13
By developing the Study Area in such a way that infiltration rates and spatial distribution of infiltration are maintained, and that seasonal runoff volumes to wetlands are maintained, changes in meteorological conditions will likely not adversely impact recharge/runoff rates across the study any differently than if the land remained undeveloped.
It is noted that the estimated water balance reflects past meteorological conditions and cannot take into consideration possible changes to these conditions in the future. However, by developing the Study Area in such a way that infiltration rates and spatial distribution of infiltration are maintained, and that seasonal runoff volumes to the wetlands are maintained, changes in the meteorological conditions will likely not adversely impact recharge/runoff rates across the study area any differently than if the land remained undeveloped.
3.3 POST-DEVELOPMENT WATER BALANCE CONSIDERATIONS It is important to consider that cutting and filling during grading operations may result in different soil types being exposed at the ground surface, which would be expected to result in changes to soil infiltration rates.
Design of grading must consider shallow groundwater elevations as well as subsurface soil types to avoid the potential of localized groundwater mounding from at-source infiltration impacting footings and foundations.
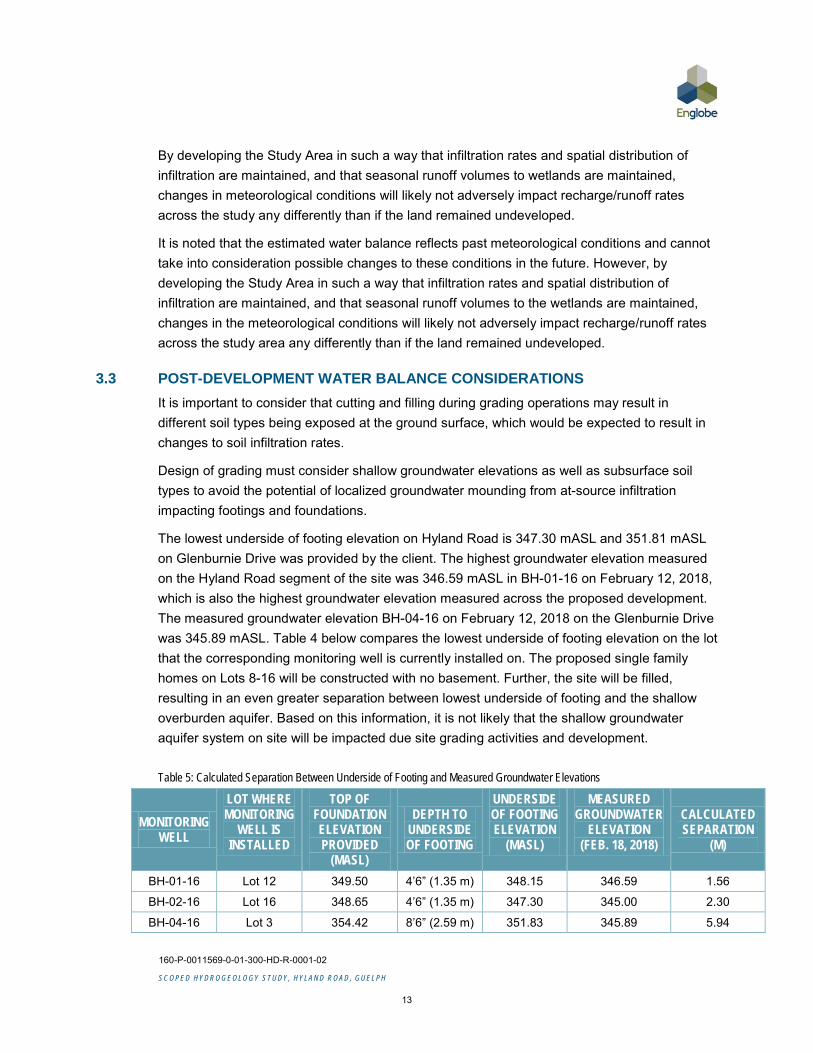
The lowest underside of footing elevation on Hyland Road is 347.30 mASL and 351.81 mASL on Glenburnie Drive was provided by the client. The highest groundwater elevation measured on the Hyland Road segment of the site was 346.59 mASL in BH-01-16 on February 12, 2018, which is also the highest groundwater elevation measured across the proposed development. The measured groundwater elevation BH-04-16 on February 12, 2018 on the Glenburnie Drive was 345.89 mASL. Table 4 below compares the lowest underside of footing elevation on the lot that the corresponding monitoring well is currently installed on. The proposed single family homes on Lots 8-16 will be constructed with no basement. Further, the site will be filled, resulting in an even greater separation between lowest underside of footing and the shallow overburden aquifer. Based on this information, it is not likely that the shallow groundwater aquifer system on site will be impacted due site grading activities and development.
Table 5: Calculated Separation Between Underside of Footing and Measured Groundwater Elevations
MONITORING WELL
LOT WHERE MONITORING
WELL IS INSTALLED
TOP OF FOUNDATION ELEVATION PROVIDED
(MASL)
DEPTH TO UNDERSIDE OF FOOTING
UNDERSIDE OF FOOTING ELEVATION
(MASL)
MEASURED GROUNDWATER
ELEVATION (FEB. 18, 2018)
CALCULATED SEPARATION
(M)
BH-01-16 Lot 12 349.50 4’6” (1.35 m) 348.15 346.59 1.56
BH-02-16 Lot 16 348.65 4’6” (1.35 m) 347.30 345.00 2.30
BH-04-16 Lot 3 354.42 8’6” (2.59 m) 351.83 345.89 5.94

160-P-0011569-0-01-300-HD-R-0001-02
SCOPED HYDROGEOLOGY STUDY, HYLAN D ROAD, GUELPH
14
As the Guelph Northeast Provincially Significant Wetland complex is inferred to be a recharge and discharge area, levels of salt and other contaminants in the water being infiltrated must be considered; and appropriate mitigation measures are recommended.
Post-development site infiltration should be designed to attempt to match pre-development rates within the Study Area through methods such as at-source infiltration from rooftops connected to soakaway pits, where feasible. Under post-development conditions, runoff contributions from the Study Area to the closest wetland should also match pre-development rates.
Based on post development drainage design for storm water management outlined in the Functional Servicing and Stormwater Management Report completed by Van Harten Surveying Inc., the post development drainage design will have storm water from the Hyland Road segment flowing to the wetland via a 450 mm culvert. It must be noted that this is alike to the current storm water management system and therefore it is likely that post development contributions to the wetland will differ marginally from pre development contributions. To address storm water at the Glenburnie Drive segment, it is proposed that the existing 300 mm diameter storm sewer on Glenburnie Drive will be extended into the newly developed cul-de-sac. The existing storm sewer discharges to the storm water management pond located on Fletcher Court which overflows into the wetland. Therefore it appears to be unlikely that contributions to the wetland will be affected (Van Harten Surveying Inc., 2015).
4 POTENTIAL IMPACTS OF LAND DEVELOPMENT Ministry of Natural Resources (MNR) Water Resources Information Mapping (2004) indicates that the site is located within a low-use watershed under average annual flow conditions, and a medium-use watershed under summer low-flow conditions. These designations do not pose restrictions on water usage for the site.
4.1 WATER USERS Well Records from the Ministry of the Environment and Climate Change (MOECC) Water Well Record (WWR) Database were reviewed to determine the number of private supply wells present within a 0.6 km radius of the Study Area. A total of thirty-six (36) wells were report by the MOECC; however, one (1) of these wells has no completion details and twenty-three (23) of these wells are identified as either monitoring wells, test holes, not in use, abandoned, or as wells with diameters of less than 50 mm (indicating they are small diameter monitoring wells rather than supply wells). These twenty-four (24) wells have been excluded from further consideration.

160-P-0011569-0-01-300-HD-R-0001-02
SCOPED HYDROGEOLOGY STUDY, HYLAN D ROAD, GUELPH
15
The remaining twelve (12) wells are plotted on the appended Drawing 9. According to the MOECC WWR database, all wells are completed in bedrock to depths between 29.0 mBGS (WWR No. 6701131) and 61.0 mBGS (WWR No. 6714999). A summary of the water well records is included in Appendix 7.
It is noted that the wells on Drawing 9 are plotted in urban residential and commercial/industrial areas. The urban areas are fully serviced, and the actual existence of a residential supply well is unlikely; however, the MOECC WWR coordinate data has been used in the absence of more reliable information. Further, it must be noted that the MOECC WWR number 6701122 has been placed on the map based on the sketch and field notes provided on the WWR. The coordinates provided on the water well record print out in Appendix 7 were disregarded as the record places the well erroneously within the Study Area.
Six (6) additional wells have been added to Drawing 9 in order to reflect the location of the municipal supply and observation wells in the vicinity of the site. Three municipal well fields are located within a 1.7 km radius of the site. These wells will be discussed in Sections 4.1.1 to 4.1.3 below. One (1) monitoring well was added to Drawing 9 as it was included on Cross Section A-A’ (Drawing 5) to further illustrate sub surface soil conditions within the vicinity of the study area.
Maintaining the distribution of pre-development infiltration rates across the Study Area will help to preserve recharge to the shallow overburden aquifer; therefore, no impacts to shallow overburden water supply wells would be expected. Wells screened in deeper overburden and bedrock aquifers are principally supplied by precipitation that infiltrates over a much broader area, and are unlikely reliant upon infiltration within the Study Area.
As discussed in Section 3.3, the subdivision will be designed with the intention that the post-development water balance matches pre-development conditions.
4.1.1 Helmar Municipal Well The Helmar Municipal Well Field is located at 637 Woodlawn Road East in the City of Guelph (Jaggar Hims Limited, 1995). It is approximately 1.3 km north of the Study Area. Based on available MOECC water well records there is one supply well (MOECC WWR No. 6701132) and one observation well (MOECC WWR No. 6701133). The municipal supply well is completed in bedrock to a depth of 79.2 mBGS (260 fBGS). Observation well No. 6701133 is completed into bedrock to a depth of 59.4 mBGS (195 fBGS). Based on the MOECC water well records, it appears the supply well (No. 6701132) was decommissioned on March 30, 1999 and the existing observation well (No. 6701133) was used as the municipal supply well henceforth. As these wells were completed in bedrock, open holes exist at the end of the casing in No. 6701133 is 12.2 mBGS (40 fBGS). According to a Jaggar Hims Limited report (1995), the Helmar municipal well was used infrequently. Further, it is reported that this area is prone to flooding during intense precipitation events and spring melt. Based on the

160-P-0011569-0-01-300-HD-R-0001-02
SCOPED HYDROGEOLOGY STUDY, HYLAN D ROAD, GUELPH
16
potentiometric surface in the bedrock, it is assumed that groundwater in the vicinity of the Helmar well flows northwest (Jaggar Hims Limited, 1995). Due to the depth and distance of this well from the Study Area, it is not expected that development of the Study Area will impact this municipal water supply.
4.1.2 Park # 1 and Park # 2 Municipal Wells The Park Municipal Well Field is located at 183 Metcalfe Street in the City of Guelph (Jaggar Hims Limited, 1995). It is approximately 1.6 km south of the Study Area. Based on available MOECC water well records there are two production wells (MOECC WWR No. 6700855 and 6700858). Park # 1 Well (No. 6700855) is completed into dolostone bedrock at a depth of 57.0 mBGS (187 fBGS). Park # 2 Well (No. 6700858) is completed into dolostone to a depth of 47.5 mBGS (156 fBGS). As these wells were completed in bedrock, an open hole exists; the end of the casing in Park #2 (No. 6700858) is 7.9 mBGS (26 fBGS) according to the water well record. The water well record for the Park #1 Well (6700855) does not indicate where the open hole exists, however; it is assumed that it occurs below 8.5 mBGS (28 fBGS) where bedrock was encountered. Due to the depth and distance of this well from the Study Area, it is not expected that development of the Study Area will impact this municipal water supply.
4.1.3 Emma Municipal Well The Emma Municipal Well is located at 93 Emma Street in the City of Guelph (Jaggar Hims Limited, 1995). It is approximately 1.7 km southeast of the Study Area. The Emma well is located approximately 400 m northeast of the Speed River (Jaggar Hims Limited, 1995). The MOECC water well record for this well is No. 6704194. This municipal supply well is completed into dolostone to a depth of 46.3 mBGS (152 fBGS). Open hole conditions exist at the contact between overburden and bedrock at a depth of 11.3 mBGS (37 fBGS). According to information from Jaggar Hims Limited (1995) report, groundwater flow within the area of the Emma well is assumed to be in a southwest direction toward the Speed River. Due to the depth, distance of this well from the Study Area and the assumed groundwater flow direction in the area of this well, it is not expected that development of the Study Area will impact this municipal water supply.
4.2 SENSITIVE AREAS
4.2.1 Well Head Protection Areas (WHPAs) The Grand River Source Protection Area (GRSPA) Approved Assessment Report (2012) defines Wellhead Protection Areas (WHPAs) for the studied wellfields. WHPAs correspond to the travel time of groundwater flowing through an aquifer to a municipal well. The GRSPA identifies WHPA classes as follows:
WHPA-A: 100 m radius from a municipal supply well; WHPA-B: between 100 m and the 2 year travel time;

160-P-0011569-0-01-300-HD-R-0001-02
SCOPED HYDROGEOLOGY STUDY, HYLAN D ROAD, GUELPH
17
WHPA-C: Between the 2 year and 5 year travel time; WHPA-D: Between the 5 year and 25 year travel time;
As shown on the appended Drawing 10, the Study Area lies within WHPA-B of the Helmar, Emma, Park #1 and Park # 2 Wells. As mentioned in Sections 4.1.1 to 4.1.3 it is not anticipated that development of the Study Area will impact these wells.
4.2.2 WHPA Vulnerability Wellhead Protection Area adjusted vulnerability scoring mapping combines the WHPA and the intrinsic vulnerability to provide vulnerability scoring inside the WHPA. The adjusted vulnerability score for a WHPA accounts for both the rate of vertical and horizontal movement of water to the well and range from 2 to 10, with 10 being the highest score. Generally, vulnerability scores increase in proximity to a supply well. The appended Drawing 11 shows the Study Area has a vulnerability score of 6.
4.2.3 Aquifer Intrinsic Vulnerability Mapping of the intrinsic vulnerability within WHPAs is based on the Intrinsic Susceptibility Index (ISI). The ISI is intended to reflect the intrinsic degree of protection of an aquifer based on the thickness and properties of the materials overlying the aquifer, which is analogous to the vertical travel time of a contaminant to the given aquifer.
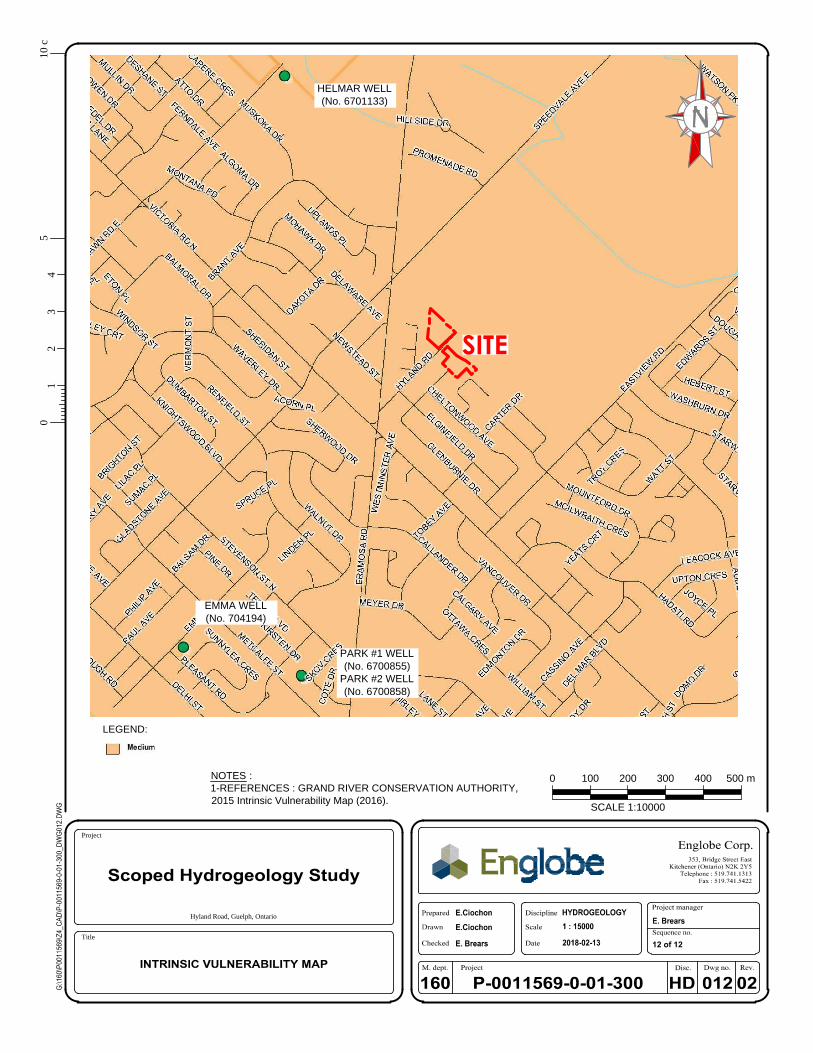
The appended Drawing 12 depicts the intrinsic vulnerability mapping (GRCA, 2015) of the bedrock aquifer, indicating that the Study Area is in an area of medium intrinsic vulnerability.
4.2.4 Groundwater Recharge Vulnerability Significant Groundwater Recharge Areas (SGRAs) correspond to areas where recharge is greater than or equal to 115% of the average recharge rate within a watershed. According to GRCA mapping the Study Area is not located within an SGRA.
4.2.5 Wetlands Wetlands are sensitive to changes in seasonal runoff volumes, and changes in shallow groundwater elevations. Runoff, coupled with groundwater inflows from the Shallow Overburden Aquifer, increases the footprint area of the wetlands.
Based on the general shallow groundwater flow direction and elevation, and the groundwater contours converging towards the Guelph Northeast Provincially Significant Wetland Complex, it is concluded that this Wetland Complex is partially dependent on groundwater flowing (and discharging) from the Study Area. The groundwater contours on the appended Drawing 6 suggests that a portion of groundwater discharges into the Guelph Northeast Provincially Significant Wetland Complex.

160-P-0011569-0-01-300-HD-R-0001-02
SCOPED HYDROGEOLOGY STUDY, HYLAN D ROAD, GUELPH
18
Pre-development surface water drainage along the northern section of the Study Area (off Hyland Road) is to the southeast with an existing 450 mm diameter outlet crossing Hyland Road and emptying into the Guelph Northeast Provincially Significant Wetland Complex. The pre- development surface water drainage along the southern portion of the Study Area (proposed Glenburnie extension) drains to the east into the on-site wetlands. Post-development runoff from the northern portion of the Study Area is expected to remain the same, however; post-development runoff from the southern portion of the Study area will be divided into two drainage areas. One section will drain to the extended 300 mm storm sewer located on Glenburnie Drive; the other section will drain toward the wetlands (Van Harten Surveying Inc., 2015).
As a result, any detrimental changes to the pre-development water balance, causing a reduction of the infiltration rates or lowering of groundwater levels in the shallow overburden aquifer, would adversely impact the wetland ecosystem by shrinking the size of this habitat. As discussed in Section 3.3 Post Development Water Balance Considerations, based on storm water management designs proposed for the site and measured groundwater elevations across the Study Area, it is unlikely that the pre-development water balance will be noticeably affected.
4.2.6 Streams As shown on the appended Drawing 1, there are no streams within the vicinity of the Study Area. An unnamed tributary assumed to be associated with the Eastview Road Landfill Site is approximately 756 m northeast of the Study Area. It is not anticipated that surface water from the Study Area drains to this tributary. It is not likely that development of the Study Area will impact this tributary.
Hadati Creek, Clythe Creek, Speed River and the Eramosa River are not expected to be impacted by the development of the Study Area due to the distance to the referred streams and groundwater flow direction of water beneath the Study Area.
4.3 CONNECTIVITY BETWEEN GROUNDWATER AND SURFACE WATER It is unlikely that development of the Study area will impact Hadati Creek, Clythe Creek, the Speed River or the Eramosa River. The Guelph Northeast Provincially Significant Wetland located on site could potentially be impacted due to development should the post development water balance not be maintained, such as a decrease in infiltration rates or a lowering of groundwater levels within the shallow overburden aquifer.
160-P-0011569-0-01-300-HD-R-0001-02
SCOPED HYDROGEOLOGY STUDY, HYLAN D ROAD, GUELPH
19
4.4 POTENTIAL SOURCES OF CONTAMINATION All three groundwater samples from the shallow aquifer exhibited exceedances against the PWQO criteria for Total Aluminum. An additional exceedance of Total Arsenic was exhibited in BH-04-16 against PWQO criteria. Lastly, BH-02-16 exhibited exceedances against Total Copper, Total Iron and Total Lead against PWQO criteria.
Approximately 785 m northwest of the site is the closed City of Guelph’s Eastview Road Sanitary Landfill Site. This landfill which is approximately 81 ha (45 of which has been landfilled) was in operation from 1963 until October 2003 after which it was closed (Jaggar Hims Limited, 1995; Gartner Lee Limited, 2007).
The Eastview Road Sanitary Landfill Site is underlain by a clay liner preventing infiltration of landfill leachate into the shallow groundwater aquifer system. The landfill was equipped with a leachate collection system and associated pumping stations which collect and transfer the landfill leachate to the city sanitary sewers for treatment at local waste water treatment plants (Jaggar Hims Limited, 1995).
The Study Area is outside the Issue Contributing Area for TCE according to the Grand River Source Protection Plan Volume II – Approved (GRSPR, 2015).
By ensuring the water balance is maintained and that the water chemistry of infiltrated water is not significantly degraded, the potential impacts to the overburden aquifer and on-site Guelph Northeast Provincially Significant Wetland Complex will be mitigated.
5 CONCLUSIONS AND RECOMMENDATIONS
5.1 CONCLUSIONS The hydrogeological studies conducted by Englobe have provided information about the subsurface stratigraphy across the proposed residential development, which comprises two segments, Hyland Road and Glenburnie Drive. The subsurface stratigraphy across the site is mainly sand and gravel or sand till overlying silt or silt till. MOECC WWR in the vicinity of the Study Area indicates that bedrock exists roughly 24.4 mBGS or around 323.6 mASL. The nature of the soils across the site allow up to about 100 mm/year infiltration of water.
Groundwater was encountered in the near surface granular soils between 1.1 to 2.9 mBGS on February 12, 2018. Separation between measured groundwater elevations and underside of footings for the proposed lots on Hyland Road are 1.56 m (Lot 12) and 2.30 m (Lot 16). The calculated separation between measured groundwater elevations and the underside of footings for the proposed lots on Glenburnie Drive are 5.94 m (Lot 3). The proposed single family homes on Lots 8-16 will be constructed with no basement. Further, the site will be filled, resulting in an even greater separation between lowest underside of footing and the shallow

160-P-0011569-0-01-300-HD-R-0001-02
SCOPED HYDROGEOLOGY STUDY, HYLAN D ROAD, GUELPH
20
overburden aquifer. Based on this information, it is not likely that the shallow groundwater aquifer system on site will be impacted due site grading activities and development.
Surface water features within the vicinity of the site include an unnamed tributary running adjacent to the now closed Eastview Road Sanitary Landfill as well as the Guelph Northeast Provincially Significant Wetland Complex. The proposed residential development was found to be within the WHPA B delineation for the City of Guelph’s Helmar, Park #1 and Park #2, and Emma Wells. The municipal wells are located about 1.3 km north, 1.6 km and 1.7 km south of the site respectively. The Study Area has scored a 6 on the WHPA vulnerability, and has a medium level of intrinsic vulnerability.
At the Glenburnie Drive segment it is planned to extend the existing storm sewer on Glenburnie Drive into the proposed cul-de-sac. The existing storm sewer discharges to a storm water management pond which overflows into the wetland. As a result, it appears to be unlikely that flow contributions to the wetland will be compromised.
In the past (and currently) runoff from Hyland Road was (is) discharged to the wetland without treatment. During and after construction of the proposed residential development no polluting substances will be used; hence no contaminants into groundwater are expected. Onsite monitoring of groundwater quality and treatment of post-development runoff is considered of no imminent concern at the Hyland Road segment.
Runoff water chemistry can generally be addressed by SWM facilities through treatment of runoff from the proposed residential development prior to discharge to the Guelph Northeast Provincially Significant Wetland Complex. This is expected occur at the projected Glenburnie Drive segment.
5.2 RECOMMENDATIONS The post development water balance should endeavour to match the pre development water balance, by maintaining spatial distribution of infiltration across the Study Area. In order to maintain the form and function of wetlands, the proposed residential development will need to conserve pre-development groundwater levels, and maintain runoff volumes with adequate water quality.
Englobe suggests matching, the pre-development infiltration rates within the granular soils through the use of LID measures. Infiltration of rainwater from rooftops should be considered for maintaining groundwater flow and levels balanced. A combination of spatially distributed at-source and other infiltration methods may be applied where subsurface soils are adequately permeable and there is sufficient separation between groundwater surface and footing elevations. During the design phase of the proposed residential development, grading and footing information should be compared to groundwater monitoring data to achieve adequate separation between the seasonally high groundwater table elevation and house footings.

160-P-0011569-0-01-300-HD-R-0001-02
SCOPED HYDROGEOLOGY STUDY, HYLAN D ROAD, GUELPH
21
By ensuring that the water balance is maintained and that the infiltrating water is kept unpolluted, potential negative impacts to the shallow overburden aquifer and on-site Guelph Northeast Provincially Significant Wetland Complex will be prevented.

160-P-0011569-0-01-300-HD-R-0001-02
SCOPED HYDROGEOLOGY STUDY, HYLAN D ROAD, GUELPH
22
6 STATEMENT OF LIMITATIONS The hydrogeology recommendations provided in this report are applicable only to the project described in the text and then only if constructed substantially in accordance with the details stated in this report. Since all details of the design may not be known at the time of report preparation, we recommend that we be retained during the final design stage to verify that the hydrogeology recommendations have been correctly interpreted in the design. Also, if any further clarification and/or elaboration are needed concerning the hydrogeology aspects of the project, Englobe should be contacted.
The hydrogeology recommendations provided in this report are intended for the use of the owner and its retained designer. They are not intended as specifications or instructions to contractors. Any use which a contractor makes of this report, or decisions made based on it, are the responsibility of the contractor. The contractor must also accept the responsibility for means and methods of construction, seek additional information if required, and draw their own conclusions as to how the subsurface conditions may affect their work. Englobe accepts no responsibility and denies any liability whatsoever for any damages arising from improper or unauthorized use of the report or parts thereof.
It is important to note that the hydrogeology investigation involves a limited sampling of the site gathered at specific test hole locations and the conclusions in this report are based on this information gathered. The subsurface geotechnical, hydrogeology, environmental and geologic conditions between and beyond the test holes will differ from those encountered at the test holes. Also such conditions are not uniform and can vary over time. Should subsurface conditions be encountered which differ materially from those indicated at the test holes, we request that we be notified in order to assess the additional information and determine whether or not changes should be made as a result of the conditions.
The professional services provided for this project include only the hydrogeology aspects of the subsurface conditions at the site, unless otherwise stated specifically in the report. The recommendations and opinions given in this report are based on our professional judgement and are for the guidance of the Client and Consultant in the design of the specific project. No other warranties or guarantees, expressed or implied, are made.
160-P-0011569-0-01-300-HD-R-0001-02
SCOPED HYDROGEOLOGY STUDY, HYLAN D ROAD, GUELPH
23
REFERENCES City of Guelph Environmental Advisory Committee. February 12, 2014. 46, 47 and 87 Hyland Road – Proposed residential subdivision Terms of Reference for an Environmental Impact Study.
Chapman, L.J. and D.F. Putnam. 1984. The Physiography of Southern Ontario. 3rd ed. Ontario Geological Survey Special Volume 2, Ontario Ministry of Natural Resources, Ontario, Canada.
Chapman, L.J. and Putnam, D.F. 2007. The Physiography of Southern Ontario; Ontario Geological Survey, Miscellaneous Release – Data 228.
Freeze, R.A. and J.A. Cherry. 1979. Groundwater. Englewood Cliffs, New Jersey: Prentice-Hall. 614pp.
Gartner Lee Limited. April 2007. 2006 Annual Report – Closed Eastview Road Landfill Site. Report Reference No. GLL 70-131
Grand River Conservation Authority. 2016. Average Annual Recharge. Produced using information under Licence with the Grand River Conservation Authority, 2016.
Grand River Conservation Authority. 2016. Average Annual Runoff. Produced using information under Licence with the Grand River Conservation Authority, 2016.
Grand River Conservation Authority. 2016. Intrinsic Vulnerabiltiy. Produced using information under Licence with the Grand River Conservation Authority, 2016.
Grand River Conservation Authority. 2016. Physiography. Produced using information under Licence with the Grand River Conservation Authority, 2016.
Grand River Conservation Authority. 2016. Surficial Geology. Produced using information under Licence with the Grand River Conservation Authority, 2016.
Grand River Conservation Authority. 2016. Wellhead Protection Area. Produced using information under Licence with the Grand River Conservation Authority, 2016.
Grand River Conservation Authority. 2016. Wellhead Protection Area Vulnerability. Produced using information under Licence with the Grand River Conservation Authority, 2016.
Karrow, P.F. 1963. Pleistocene Geology of the Guelph Area, Southern Ontario; Ontario Geological Survey, Map 2153, 1:63,360.
Karrow, P.F., Miller, R.F. and Farrell, L. 1979. Bedrock Topography of the Guelph Area, Southern Ontario. Ontario Geological Survey, Preliminary Map P 2224, scale 1:50 000.
Kaubisch, M. 1986. The Indirect Determination of Hydrogeological Parameters Illustrated by Dump Materials of Lignite Mines. Ph.D. Thesis, Technical University of Freiberg, Germany.
Lake Erie Region Source Protection Committee. 2015. Grand River Source Protection Area, Approved Assessment Report.
Lake Erie Region Source Protection Committee. 2012. Grand River Source Protection Area, City of Guelph Approved Source Protection Plan.
MOE. March 2003. Stormwater Management Planning and Design Manual.

160-P-0011569-0-01-300-HD-R-0001-02
SCOPED HYDROGEOLOGY STUDY, HYLAN D ROAD, GUELPH
24
Natural Resource Solutions Inc. 46, 47 and 87 Hyland Road, Guelph Environmental Impact Study. December 2015. (Natural Resource Solutions Inc. Project No. 1400).
Van Harten Surveying Inc. December 21, 2015. Functional Servicing and Stormwater Management Report, Hyland Road and Glenburnie Drive Extensions, City of Guelph, Ontario (Van Harten Surveying Inc. Report No. 21203-13).

Appendix 1 Drawings
Drawing 1: Location Plan Drawing 2: Site Plan
Drawing 3: Surficial Geology Drawing 4: Physiography
Drawing 5: Cross Section A-A’ Drawing 6: Shallow Groundwater Contours
Drawing 7: Average Annual Recharge Drawing 8: Average Annual Runoff
Drawing 9: MOECC Water Well Records Drawing 10: Wellhead Protection Areas Map
Drawing 11: Wellhead Protection Area Vulnerability Drawing 12: Intrinsic Vulnerability

10 c
m5
04
32
1
Title
Project
01 of 12
Hyland Road, Guelph, Ontario
SITE
NOTES :
1-REFERENCES: GRAND RIVER CONSERVATION AUTHORITY, (2016).
GUELPH NORTHEAST
PROVINCIALLY SIGNIFICANT
WETLAND COMPLEX
SCALE 1:15000
0 100 200 300 400 500 m
EASTVIEW ROAD
LANDFILL SITE (CLOSED)
POLLINATORS PARK
HADATI CREEK

10 c
m5
04
32
1
Title
ProjectLEGEND :
02 of 12
Hyland Road, Guelph, OntarioEL. 348.81
BOREHOLE LOCATION
SITE OUTLINE
CROSS-SECTION
A'
MOECC WATER WELL LOCATION - Overburden
NOTES :
1-REFERENCE:
VAN HARTEN SURVEYING LTD., DRAWING DATED DECEMBER
2015.
GRAND RIVER CONSERVATION AUTHORITY, 2015 Aerial
Photograph (2017).
2-WATER LEVEL MEASUREMENTS TAKEN OCTOBER 31, 2016.
GROUND SURFACE ELEVATION (m)
MOECC WATER WELL LOCATION - Bedrock
0 25 50
SCALE 1:2500
75 100 m
A
WETLAND (GRCA)

03 of 12
NOTES :
1-REFERENCES : GRAND RIVER CONSERVATION
AUTHORITY, 2015 SURFICIAL GEOLOGY MAP (2016).
10 c
m5
04
32
1
Title
Project
LEGEND:
Hyland Road, Guelph, Ontario
SITE
SCALE 1:15000
0 100 200 300 400 500 m
DIAMICTON
GRAVEL
ORGANIC DEPOSITS
SAND
ARISS ESKER
ARISS ESKER

04 of 12
NOTES :
1-REFERENCES : GRAND RIVER CONSERVATION
AUTHORITY, 2015 PHYSIOGRAPHY MAP (2016).
10 c
m5
04
32
1
Title
Project
LEGEND:
Hyland Road, Guelph, Ontario
SITE
SCALE 1:15000
0 100 200 300 400 500 mTILL PLAINS (DRUMLINIZED)
SPILLWAYS
DRUMLINS

ELE
VA
TIO
N (m
A
SL)
DISTANCE (m)
0 50 100 150 200 250 300 350 400 450 500 550 600 650 700
355
350
345
340
335
330
325
320
315
310
750 800 800 850 900
ELE
VA
TIO
N (m
A
SL)
355
350
345
340
335
330
340.33 m ASL
Sept 08, 1958
325
320
315
310
6701121
BH-02-16/MW
343.67 m ASL
Oct 31, 2016
BH-01-16/MW
344.25 m ASL
Oct 31, 2016
7040783
BH-04-16/MW
344.40 m ASL
Oct 31, 2016
6701122
(Projected)
HYLAND ROAD
PROPERTY
GLENBURNIE DRIVE
PROPERTY
329.71 m ASL
July 26, 1963
HY
LA
ND
R
OA
D
GLE
NB
UR
NIE
DR
IV
E
346.59 m ASL
Feb 12, 2018
345.00 m ASL
Feb 12, 2018
345.89 m ASL
Feb 12, 2018
4-Groundwater measurements taken on February 2018. Seasonal
fluctuations in groundwater levels would be expected.
The inferred stratigraphy shown on this cross-section is based on
the subsurface stratigraphy contacted at the Boreholes. The
subsurface conditions between the Boreholes will vary.
NOTES :
1-Borehole coordinates and elevations based on Sokkia network data.
2-Drawing scale may be distorted due to file conversion and/or copying.
Measurements taken from the drawing must be verified in the field.
3-MW refers to monitoring well installed at borehole location.
10 c
m5
04
32
1
Title
ProjectLEGEND :
NORTH WEST
GROUND SURFACE
SOUTH EAST
FILL
TOPSOIL
SAND
SAND AND GRAVEL
SILT
SILT TILL
CLAY
GRAVEL AND CLAY
BEDROCK
05 of 12
Hyland Road, Guelph, Ontario
UNDERSIDE
OF FOOTING
UNDERSIDE
OF FOOTING
INFERRED WATER TABLE
WATER LEVEL
SCREEN INTERVAL
STORMWATER POND
WETLAND

10 cm504321
Title
Project
LEGEND :
06 of 12
Hyland Road, Guelph, Ontario
EL. 348.81
BOREHOLE / MONITORING
WELL LOCATION
SITE OUTLINE
NOTES :
1-REFERENCE: VAN HARTEN SURVEYING LTD., Drawing dated December 2015.
2-Water level measurements taken February 12, 2018.
0 20 40
SCALE 1:2000
60 80 100 m
GROUND SURFACE ELEVATION (m)
SHALLOW GROUNDWATER
CONTOUR
3
4
4
.
2
5
GROUNDWATER ELEVATION (m ASL)
3
4
6
.
5
9
3
4
5
.
0
0
3
4
5
.
8
9
CROSS-SECTION
A'A
3
4
5
.
2
3
4
5
.
5
3
4
6
.
0
3
4
6
.5

07 of 12
Hyland Road, Guelph, Ontario
10 c
m5
04
32
1
Title
Project
LEGEND:
NOTES :
1-REFERENCES : GRAND RIVER CONSERVATION AUTHORITY,
2015 Average Annual Recharge (2016).
SITE
SCALE 1:15000
0 100 200 300 400 500 m

08 of 12
Hyland Road, Guelph, Ontario
10 c
m5
04
32
1
Title
Project
LEGEND:
NOTES :
1-REFERENCES : GRAND RIVER CONSERVATION AUTHORITY,
2015 Runoff (2016).
SCALE 1:15000
0 100 200 300 400 500 m
SITE

09 of 12
Hyland Road, Guelph, Ontario
NOTES :
1-REFERENCES : GRAND RIVER CONSERVATION AUTHORITY,
2015 Aerial Photograph (2017).
10 c
m5
04
32
1
Title
Project
LEGEND:
MOECC WATER WELL LOCATION - Bedrock
S
P
E
E
D
V
A
L
E
A
V
E
N
U
E
E
A
S
T
SITE
SCALE 1:15000
0 100 200 300 400 500 m
MOECC WATER WELL LOCATION - Overburden
GUELPH NORTHEAST
PROVINCIALLY SIGNIFICANT
WETLAND COMPLEX
EASTVIEW ROAD
LANDFILL SITE (CLOSED)
EMMA WELL
PARK #1
PARK #2
WELLS
HELMAR WELL

10 of 12
10 c
m5
04
32
1
Title
Project
LEGEND: NOTES :
1-REFERENCES : GRAND RIVER CONSERVATION AUTHORITY,
2015 Well Head Protection Area (2016).
MUNICIPAL WELL
Hyland Road, Guelph, Ontario
SITE
HELMAR WELL
(No. 6701133)
SCALE 1:15000
0 100 200 300 400 500 m
EMMA WELL
(No. 704194)
PARK #1 WELL
(No. 6700855)
PARK #2 WELL
(No. 6700858)

11 of 12
10 c
m5
04
32
1
Title
Project
LEGEND: NOTES :
1-REFERENCES : GRAND RIVER CONSERVATION AUTHORITY,
2015 WELL HEAD PROTECTION VULNERABILITY (2016).
MUNICIPAL WELL
Hyland Road, Guelph, Ontario
SITE
SCALE 1:15000
0 100 200 300 400 500 m
HELMAR WELL
(No. 6701133)
EMMA WELL
(No. 704194)
PARK #1 WELL
(No. 6700855)
PARK #2 WELL
(No. 6700858)
12 of 12
10 c
m5
04
32
1
Title
Project
0 100 200
SCALE 1:10000
300 400 500 m
LEGEND:
NOTES :
1-REFERENCES : GRAND RIVER CONSERVATION AUTHORITY,
2015 Intrinsic Vulnerability Map (2016).
Hyland Road, Guelph, Ontario
SITE
HELMAR WELL
(No. 6701133)
EMMA WELL
(No. 704194)
PARK #1 WELL
(No. 6700855)
PARK #2 WELL
(No. 6700858)

Appendix 2 Borehole Logs
List of Abbreviations Boreholes BH-01-16, BH-02-16 and BH-04-16

LIST OF ABBREVIATIONS
The abbreviations commonly employed on the borehole logs, on the figures, and in the text of the report, are as follows:
Sample Types Soil Tests and Properties
AS Auger Sample CS Core Sample RC Rock Core SS Split Spoon TW Thinwall, Open WS Wash Sample BS Bulk Sample GS Grab Sample WC Water Content Sample TP Thinwall, Piston
SPT UC FV ø γ
wp w wL IL
Ip
PP
Standard Penetration Test Unconfined Compression Field Vane Test Angle of internal friction Unit weight Plastic limit Water content Liquid limit Liquidity index Plasticity index Pocket penetrometer
Penetration Resistances
Dynamic Penetration Resistance
The number of blows by a 63.5 kg (140 lb.) hammer dropped 760 mm (30 in.) required to drive a 50 mm (2 in.) diameter 60º cone a distance 300 mm (12 in.).
The cone is attached to 'A' size drill rods and casing is not used.
Standard Penetration Resistance, N (ASTM D1586)
The number of blows by a 63.5 kg (140 lb.) hammer dropped 760 mm (30 in.) required to drive a standard split spoon sampler 300 mm (12 in.)
WH sampler advanced by static weight of hammer
PH sampler advanced by hydraulic pressure
PM sampler advanced by manual pressure
Soil Description
Cohesionless Soils Compactness Condition Very Loose Loose Compact Dense Very Dense
SPT N-Value (blows per 0.3 m) 0 to 4 4 to 10 10 to 30 30 to 50 over 50
Relative Density (Dr) (%) 0 to 20 20 to 40 40 to 60 60 to 80 80 to 100
Cohesive Soils Consistency Very Soft Soft Firm Stiff Very Stiff Hard
Undrained Shear Strength (Cu) kPa less than 12 12 to 25 25 to 50 50 to 100 100 to 200 over 200
psf less than 250 250 to 500 500 to 1000 1000 to 2000 2000 to 4000 over 4000
DTPL Drier than plastic limit APL About plastic limit WTPL Wetter than plastic limit
Low Plasticity, WL <30 Medium Plasticity, 30 < WL < 50 High Plasticity, WL > 50

1
2
3
4
5
6
7
8
9
10
11
12
13
14
15
1
2
3
4
5
6
7
8
9
10
11
12
13
14
15
Dep
th (m
)
348.370.00
347.610.76
347.151.22
346.851.52
345.323.05
343.804.57
342.276.10
340.757.62
339.239.14
337.7010.67
337.2511.13
Elev
atio
n (m
)D
epth
(m)
Ground ElevationFILL:dark brown topsoil, silt, some sand,moistcompact brown silty sand, sometopsoil, trace gravel, occasionalcobblesboulders 4' to 5'SAND TILL:compact brown silty sand, somegravel, occasional cobbles, moist
dense
SILT TILL:dense grey/brown fine sandy silt,some gravel, moist
very dense grey trace gravel
SILT:very dense grey silt, some clay,trace sand, very moist
trace gravel, wet with saturatedsand seams
dense fine sandy silt, wet
Borehole terminated at 11.13 m.
Description
Sym
bol
Sym
bol Groundwater Observations and
Standpipe Details
el. 3
44.2
5 m
201
6-10
-31
protective cover and concrete
bentonite seal
50 mm pipe1.52 m slotted screen
filter sand
native cave
SS-1
SS-2
SS-3
SS-4
SS-5
SS-6
SS-7
SS-9
SS-10
Type
and
Num
ber
7-89
4-88
9-119
12-1618
25-2023
28-50 /150mm
15-2528
21-2425
16-2018
"Blo
ws"
/150
mm
17
16
20
34
43
53
49
38
SPT
'N' V
alue
10 20 30
WP WL
Water Content(%)
10 20 30
WP WL
Water Content(%)
20 40 60 80
Dynamic Cone
20 40 60 80
Dynamic Cone
50 100 150 200
Shear Strength (PP) kPa
50 100 150 200
Shear Strength (PP) kPa
20 40 60 80
Std Penetration
20 40 60 80
Std Penetration
50 100 150 200
Shear Strength (FV) kPa
50 100 150 200
Shear Strength (FV) kPa
Drill Date:
Sheet:
2016-09-28
Scoped Hydrogeology Study
Auger samples AS-8 taken from 7.62 to 9.14 m, AS-11 taken from 9.75 to 10.67 m.
P-0011569-0-01-300
of1 1
EQ-0
9-G
e-72
R.1
18.
02.2
011
Z:\S
tyle
_LV
M_O
ntar
io\L
og B
oreh
ole_
Log_
LVM
_Ont
ario
.sty
- P
rint
ed :
2016
-11-
23 0
8 h
Ver
tical
Sca
le =
1 :
90.0
Location:
Job N°:
Project:
Drafted by: D. Kunac Reviewed by: E. Brears
Borehole Number:
Notes:
Ground Elevation:
560982.7 m
Northing:
348.37 m BH-01-16
Easting:
Field Tech:
4824674.8 m
D. Souter
Drill Method:Hyland Road, Guelph, Ontario
SOIL PROFILE SAMPLE
InitialRemold
Hollow Stem Auger

1
2
3
4
5
6
7
8
9
10
11
12
13
14
15
1
2
3
4
5
6
7
8
9
10
11
12
13
14
15
Dep
th (m
)
346.120.00
345.710.41
344.601.52
343.832.29
343.073.05
342.313.81
Elev
atio
n (m
)D
epth
(m)
Ground ElevationFILL:dark brown topsoil, silt, trace sandand gravel, moistcompact brown/grey/dark brownsilty sand, some gravel and topsoil,occasional cobblesSAND:compact brown sand, some silt,trace gravel, very moistsilty sand, some gravel, wet tosaturated
SILT:compact gravelly sandy silt, traceclayBorehole terminated at 3.81 m.
Description
Sym
bol
Sym
bol Groundwater Observations and
Standpipe Details
el. 3
43.6
7 m
201
6-10
-31
protective cover and concrete
bentonite seal
50 mm pipe1.52 m slotted screen
filter sand
SS-1
SS-2
SS-3
SS-4
Type
and
Num
ber
10-106
8-910
5-610
9-77
"Blo
ws"
/150
mm
16
19
16
14
SPT
'N' V
alue
10 20 30
WP WL
Water Content(%)
10 20 30
WP WL
Water Content(%)
20 40 60 80
Dynamic Cone
20 40 60 80
Dynamic Cone
50 100 150 200
Shear Strength (PP) kPa
50 100 150 200
Shear Strength (PP) kPa
20 40 60 80
Std Penetration
20 40 60 80
Std Penetration
50 100 150 200
Shear Strength (FV) kPa
50 100 150 200
Shear Strength (FV) kPa
Drill Date:
Sheet:
2016-09-28
Scoped Hydrogeology Study
Auger sample AS-5 taken from 3.05 to 3.81 m.
P-0011569-0-01-300
of1 1
EQ-0
9-G
e-72
R.1
18.
02.2
011
Z:\S
tyle
_LV
M_O
ntar
io\L
og B
oreh
ole_
Log_
LVM
_Ont
ario
.sty
- P
rint
ed :
2016
-11-
23 0
8 h
Ver
tical
Sca
le =
1 :
90.0
Location:
Job N°:
Project:
Drafted by: D. Kunac Reviewed by: E. Brears
Borehole Number:
Notes:
Ground Elevation:
561055.41 m
Northing:
346.12 m BH-02-16
Easting:
Field Tech:
4824663.61 m
D. Souter
Drill Method:Hyland Road, Guelph, Ontario
SOIL PROFILE SAMPLE
InitialRemold
Hollow Stem Auger

1
2
3
4
5
6
7
8
9
10
11
12
13
14
15
1
2
3
4
5
6
7
8
9
10
11
12
13
14
15
Dep
th (m
)
348.810.00
348.200.61
347.291.52
346.522.29
345.763.05
344.244.57
338.1410.67
336.6212.19
334.6414.17
Elev
atio
n (m
)D
epth
(m)
Ground ElevationFILL:dark brown topsoil, silt, trace sandand gravel, occasional cobblesSAND AND GRAVEL:dense brown sand and gravel, somesilt, numerous cobbles, moistSILT:some clay, trace sand and gravel
silty sand, moist to very moist
dense
very dense grey silty fine sand,trace gravel, moist
very moist to wet, saturated layers10.67 to 12.19 m
very dense grey silt, some fine sandand clay, trace gravel, moist to wet,rods very wet 10.67 to 13.72 m
Borehole terminated at 14.17 m.
Description
Sym
bol
Sym
bol Groundwater Observations and
Standpipe Details
el. 3
44.4
0 m
201
6-10
-31
protective cover and concrete
bentonite seal
50 mm pipe3.05 m slotted screen
filter sand
native cave
SS-1
SS-2
SS-3
SS-4
SS-5
SS-6
SS-7
SS-8
SS-9
SS-11
SS-12
Type
and
Num
ber
14-2415
8-88
7-910
13-2125
21-4657
38-50 /125mm
26-50 /100mm
26 /100 mm
28 /125 mm
16-50 /125mm
18-2424
"Blo
ws"
/150
mm
39
16
19
46
103
48
SPT
'N' V
alue
10 20 30
WP WL
Water Content(%)
10 20 30
WP WL
Water Content(%)
20 40 60 80
Dynamic Cone
20 40 60 80
Dynamic Cone
50 100 150 200
Shear Strength (PP) kPa
50 100 150 200
Shear Strength (PP) kPa
20 40 60 80
Std Penetration
20 40 60 80
Std Penetration
50 100 150 200
Shear Strength (FV) kPa
50 100 150 200
Shear Strength (FV) kPa
Drill Date:
Sheet:
2016-09-28
Scoped Hydrogeology Study
MOECC Well No. A202673. Auger sample AS-10 taken from 12.2 to 12.5 m.
P-0011569-0-01-300
of1 1
EQ-0
9-G
e-72
R.1
18.
02.2
011
Z:\S
tyle
_LV
M_O
ntar
io\L
og B
oreh
ole_
Log_
LVM
_Ont
ario
.sty
- P
rint
ed :
2016
-11-
23 0
8 h
Ver
tical
Sca
le =
1 :
90.0
Location:
Job N°:
Project:
Drafted by: D. Kunac Reviewed by: E. Brears
Borehole Number:
Notes:
Ground Elevation:
561076.1 m
Northing:
348.81 m BH-04-16
Easting:
Field Tech:
4824564.7 m
D. Souter
Drill Method:Hyland Road, Guelph, Ontario
SOIL PROFILE SAMPLE
InitialRemold
Hollow Stem Auger

Appendix 3 Tables
Table 101: Measured Coordinates Table 102: Measured Groundwater Elevations
Table 103: Hydraulic Conductivity Estimates Table 104: Water Chemistry Analysis Results

TABLE 101
MEASURED COORDINATES
Hydrogeology Study ReportHyland Road Subdivision
46, 47 and 87 Hyland RoadGuelph, Ontario
160-P-0011569-0-01-300-HD-R-0001-02 Table 101
WELL NAME
GROUND SURFACE
ELEVATION (mASL)
NORTHING EASTING DATE ACQUIRED
BH-01-16 348.37 4824674.8 560982.7 17-Sep-16BH-02-16 346.11 4824663.6 561055.4 17-Sep-16BH-04-16 348.81 4824564.7 561076.1 17-Sep-16
LOCATION
GROUND SURFACE
ELEVATION (mASL)
NORTHING EASTING DATE ACQUIRED REFERENCE NAME
1 345.09 4824666.3 561066.4 17-Sep-16 gue rush edge of dry wetland2 345.18 4824665.1 561076.5 17-Sep-16 gue rush edge of dry wetland13 345.48 4824648.6 561060.5 17-Sep-16 gue rush edge of dry wetland24 345.30 4824588.9 561132.8 17-Sep-16 gue rush bedge of dry wetland35 344.48 4825252.8 561162.1 17-Sep-16 gue rush bedge of dry wetland46 344.13 4825190.9 561078.9 17-Sep-16 gue rush bedge of dry wetland57 343.88 4825192.6 561079.7 17-Sep-16 gue rush base clvrt8 343.66 4825231.7 561117.4 17-Sep-16 gue rush base clvrt19 344.03 4825229.0 561141.8 17-Sep-16 gue rush base clvrt210 345.96 4824840.9 561807.9 17-Sep-16 gue rush swm wl11 346.21 4824841.3 561808.2 17-Sep-16 gue rush top of scum
Notes:
2. Elevations obtained using Sokkia Model GRX 2 Global Navigation Satellite System (GNSS) Rover1. mASL – metres above sea level.

TABLE 102
MEASURED GROUNDWATER ELEVATIONS
Hydrogeology Study ReportHyland Road Subdivision
46, 47 87 Hyland RoadGuelph, Ontario
160-P-0011569-0-01-300-HD-R-0001-02 Table 102
WELL NAME
GROUND SURFACE
ELEVATION (mASL)
STICK UP (m) DEPTH TO WL (mbTOP)
DEPTH TO WL (mBGS)
WL ELEVATION
(mASL)
DEPTH TO WL (mbTOP)
DEPTH TO WL (mBGS)
WL ELEVATION
(mASL)
DEPTH TO WL
(mbTOP)
DEPTH TO WL (mBGS)
WL ELEVATI
ON (mASL)
BH-01-16 348.37 0.88 5.05 4.17 344.20 5.00 4.12 344.25 2.66 1.78 346.59BH-02-16 346.11 0.86 3.36 2.50 343.61 3.30 2.44 343.67 1.97 1.11 345.00BH-04-16 348.81 0.79 5.25 4.46 344.35 5.20 4.41 344.40 3.71 2.92 345.89
Notes:
February-12-18October-24-16 October-31-16
3. WL – water level.
1. mBGS – metres below ground surface.2. mASL – metres above sea level.

160-P-0011569-0-01-300-HD-R-0001-02 Table 103
TABLE 103
HYDRAULIC CONDUCTIVITY ESTIMATES
Scoped Hydrogeology Study Report 46, 47 & 87 Hyland Road
Guelph, Ontario
Borehole Name /
Location
Ground Surface
Elevation (mASL)
Grain Size Analyses
Soil Description
Sample Depth
(mBGS)
Hydraulic Conductivity
(m/sec) Method
BH-01-16 348.37 Silt with some clay and trace
sand
AS-8, 7.6-9.1 < 1.0 x 10⁻⁹ Kaubisch, % P = 66
BH-02-16 346.11 Gravelly sandy silt with trace
clay
AS-5 3.1-3.8 7.8 x 10⁻⁷
Beyer Cu = 15
D10= 0.01 D60= 0.16
BH-04-16 348.81 Silt with some clay and trace
sand and gravel
AS-10 10.7-12.2 1.6 x 10⁻⁹ Kaubisch, % P = 57
Borehole Name /
Location
Ground Surface
Elevation (mASL)
Slug Tests
Soil Description Screened Interval (mBGS)
Hydraulic Conductivity
(m/sec) Method
BH-01-16 348.37 Silt with some clay and trace gravel 9.2 - 10.7 3.2 x 10⁻⁷ Slug out
(rising head)
BH-02-16 346.11 Gravelly sandy silt with trace clay 2.2 – 3.8 9.8 x 10⁻⁷ Water in
(falling head)
BH-04-16 348.81 Silt with some clay and trace sand and gravel 10.7 – 13.7 2.6 x 10⁻⁷ Slug in
(falling head) Notes: 1. mASL – metres Above Sea Level< 2. Cu = coefficient of uniformity value 3. P = percent of soil smaller than 0.02 mm

TABLE 104
GROUNDWATER CHEMISTRY ANALYSIS RESULTS
Hyland Road Subdivision46, 47 87 Hyland Road
Guelph, Ontario
BH-01-16 BH-02-16 BH-04-16Colour, Apparent TCU - 5.9 14.6 19.7Conductivity umhos/cm - 672 1050 464Hardness (as CaCO3) mg/L - 334 526 223pH pH units 6.5-8.5 7.63 7.16 7.8Total Dissolved Solids mg/L - 409 * 599 * 247 *Turbidity NTU - 11.3 18.2 17.5Alkalinity, Total (as CaCO3) mg/L - 227 448 * 235Ammonia, Total (as N) mg/L - 0.075 0.183 0.186Chloride (Cl) mg/L - 27.1 68.4 3.90Fluoride (F) mg/L - 0.104 0.105 0.109Nitrate (as N) mg/L - 0.066 0.173 <0.020Nitrite (as N) mg/L - <0.10 0.043 <0.010Orthophosphate - Dissolved (as P) mg/L - 0.0106 <0.0030 <0.0030Sulfate (SO4) mg/L - 94.3 26.6 24.4Aluminum (Al)-Total mg/L 0.015 0.072 0.123 0.143Antimony (Sb)-Total mg/L 0.02 0.00024 0.00017 0.00018Arsenic (As)-Total mg/L 0.005 0.00197 0.00115 0.00964Barium (Ba)-Total mg/L - 0.120 0.116 0.0778Beryllium (Be)-Total mg/L 0.011 <0.00010 <0.00010 <0.00010Bismuth (Bi)-Total mg/L - <0.000050 <0.000050 <0.000050Boron (B)-Total mg/L 0.20 0.035 0.086 0.03Cadmium (Cd)-Total mg/L 0.0001 <0.000010 0.000036 <0.000010Calcium (Ca)-Total mg/L - 72.3 114 38.4Cesium (Cs)-Total mg/L - <0.000010 0.000013 0.000016Chromium (Cr)-Total mg/L - <0.00050 <0.00050 0.00076Cobalt (Co)-Total mg/L 0.0009 0.00020 0.00026 0.00016Copper (Cu)-Total mg/L 0.001 <0.0010 0.0016 0.0010Iron (Fe)-Total mg/L 0.3 0.098 0.319 0.221Lead (Pb)-Total mg/L 0.001 0.00023 0.00114 0.00025Magnesium (Mg)-Total mg/L - 37.2 58.7 30.7Manganese (Mn)-Total mg/L - 0.0600 0.116 0.0293Molybdenum (Mo)-Total mg/L 0.04 0.00830 0.00292 0.00500Nickel (Ni)-Total mg/L 0.025 0.00070 0.00148 <0.00050Phosphorus (P)-Total mg/L 0.01 <0.050 <0.050 <0.050Potassium (K)-Total mg/L - 4.47 3.44 1.75Rubidium (Rb)-Total mg/L - 0.00125 0.00173 0.00075Selenium (Se)-Total mg/L 0.1 0.000271 0.000148 0.000057Silicon (Si)-Total mg/L - 6.66 8.66 9.53Silver (Ag)-Total mg/L 0.0001 <0.000050 <0.000050 <0.000050Sodium (Na)-Total mg/L - 11.6 23.9 14.3Strontium (Sr)-Total mg/L - 0.191 0.269 0.283Sulfur (S)-Total mg/L - 32.6 9.68 8.14Tellurium (Te)-Total mg/L - <0.00020 <0.00020 <0.00020Thallium (Tl)-Total mg/L 0.0003 <0.000010 0.000020 <0.000010Thorium (Th)-Total mg/L - <0.00010 <0.00010 <0.00010Tin (Sn)-Total mg/L 0.00061 0.00144 0.00070Titanium (Ti)-Total mg/L 0.00320 0.00482 0.00642Tungsten (W)-Total mg/L 0.03 <0.00010 <0.00010 <0.00010Uranium (U)-Total mg/L 0.005 0.00169 0.000568 0.000360Vanadium (V)-Total mg/L 0.006 0.00121 0.00084 0.00063Zinc (Zn)-Total mg/L 0.02 0.0147 0.0335 0.0113Zirconium (Zr)-Total mg/L 0.004 <0.00030 <0.00030 <0.00030
Notes:
MAC - Maximum Acceptable Concentration (health related)IMAC - Interim Maximum Acceptable Concentration (health related)OG - Operational Guideline (parameters which must be controlled for effective treatment)AO - Aesthetic ObjectiveTCU - True Colour UnitsNTU - Nephelometric Turbidity Units
3. Analytical analysis performed by ALS Laboratories, Waterloo, Ontario
SAMPLE ID UNITS
October 24, 2016
PWQO LIMIT
6. The AO for sodium is 200 mg/L however; if this was drinking water the Medical Officer of Health would be notified to pass the information on to physicians working with patients with sodium reduced diets (applies to ODWS).
4. Measurements in bold and highlighted text exceed Surface Water PWQO criteria limits5. Detection limit for result exceeds the Surface Water PWQO Guideline Limit
1. Criteria from Ontario Drinking Water Standards (MOECC, January 2016). 2. Criteria from Surface Water PWQO
160-P-0011569-0-01-300-HD-R-0001-02 Table 104

Appendix 4 Sokkia GRX 2 GNSS Data
September 2016

Sokkia GRX 2 GNSS DataSeptember 2016
gue rush bh2 4824664 561055.4 346.108
gue rush bh1 4824675 560982.7 348.374
gue rush edge of dry wetland 4824666 561066.4 345.088
gue rush edge of dry wetland1 4824665 561076.5 345.177
gue rush edge of dry wetland2 4824649 561060.5 345.476
gue rush bh 3 4824531 561058.9 352.893
gue rush bh 4 4824565 561076.1 348.806
gue rush bh 5 4824529 561110.8 350.728
gue rush bedge of dry wetland3 4824589 561132.8 345.298
gue rush bedge of dry wetland4 4825253 561162.1 344.479
gue rush bedge of dry wetland5 4825191 561078.9 344.129
gue rush base clvrt 4825193 561079.7 343.884
gue rush base clvrt1 4825232 561117.4 343.664
gue rush base clvrt2 4825229 561141.8 344.03
gue rush swm wl 4824841 561807.9 345.958
gue rush top of scum 4824841 561808.2 346.211

Appendix 5 Figures
Figure 1: Particle Size Distribution Curve Figure 2: Post Development Drainage Catchment Area Hyland Road
Figure 3: Post Development Drainage Catchment Area Glenburnie Drive

0.0010.010.1110100PARTICLE SIZE (mm)
0
10
20
30
40
50
60
70
80
90
100
PASS
ING
BY W
EIGH
T (%
)
0.0010.010.1110100PARTICLE SIZE (mm)
0
10
20
30
40
50
60
70
80
90
100
PASS
ING
BY W
EIGH
T (%
)
#200#100#50#30#16#8#43/85/87/81.530
10
20
30
40
50
60
70
80
90
100
RETA
INED
BY
WEI
GHT
(%)
0
10
20
30
40
50
60
70
80
90
100
RETA
INED
BY
WEI
GHT
(%)
SILT OR CLAYSANDGRAVELCOBBLES
FINEMEDIUMCOARSEFINECOARSE
UNIFIED SOIL CLASSIFICATION
Symbol Borehole n° Sample n° Depth (ft) Description
BH-01-16 SS-10 10.67 - 11.13 SILT, some Clay, trace Sand
BH-02-16 SS-4 3.05 - 3.51 Gravelly Sandy SILT, trace Clay
BH-04-16 SS-9 10.67 - 10.97 SILT, some Clay, trace Sand and Gravel
PARTICLE SIZE ANALYSIS
Location: Hyland Road, Guelph, Ontario
Z:\S
tyle
_LV
M_O
ntar
io\L
ab\L
ab_G
eote
c_80
Lab
_Par
ticle
_Siz
e_LV
M_O
ntar
io_I
MP
.ST
Y -
Pri
nted
: 201
6-11
-23
08:3
1:20
Project:
EQ-0
9-G
e-74
A R
.1 0
2.03
.201
1
File No : P-0011569-0-01-300
Figure No : 1Scoped Hydrogeology Study
COBBLES SILT OR CLAY
U.S. SIEVE SIZE IN INCHES U.S. STANDARD SIEVE No. HYDROMETER
higgan
Text Box
12.19


Appendix 6 Slug Test Analysis
Boreholes BH-01-16, BH-02-16 and BH-04-16
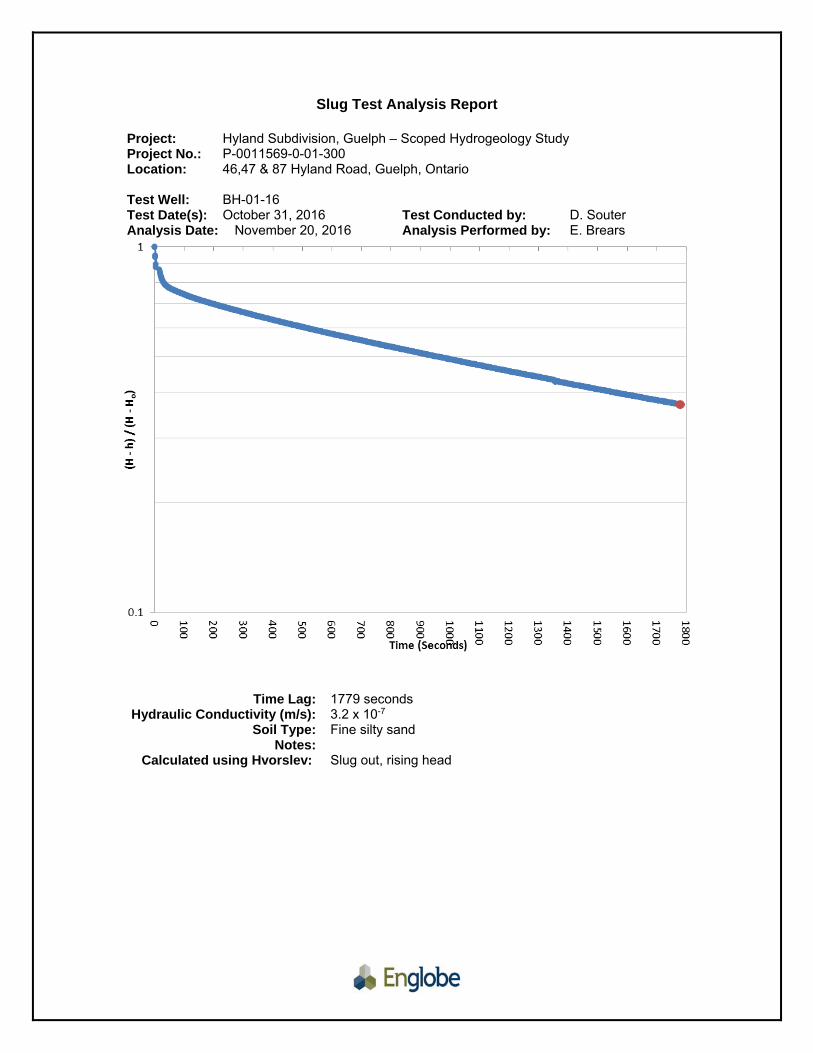
Slug Test Analysis Report Project: Hyland Subdivision, Guelph – Scoped Hydrogeology Study Project No.: P-0011569-0-01-300 Location: 46,47 & 87 Hyland Road, Guelph, Ontario Test Well: BH-01-16 Test Date(s): October 31, 2016 Test Conducted by: D. Souter Analysis Date: November 20, 2016 Analysis Performed by: E. Brears
Time Lag: 1779 seconds Hydraulic Conductivity (m/s): 3.2 x 10⁻⁷
Soil Type: Fine silty sand Notes:
Calculated using Hvorslev: Slug out, rising head

Slug Test Analysis Report Project: Hyland Subdivision, Guelph – Scoped Hydrogeology Study Project No.: P-0011569-0-01-300 Location: 46,47 & 87 Hyland Road, Guelph, Ontario Test Well: BH-02-16 Test Date(s): October 31, 2016 Test Conducted by: D. Souter Analysis Date: November 20, 2016 Analysis Performed by: E. Brears
Time Lag: 579 seconds Hydraulic Conductivity (m/s): 9.8 x 10⁻⁷
Soil Type: Silty sand and gravel Notes:
Calculated using Hvorslev: Water in, falling head

Slug Test Analysis Report Project: Hyland Subdivision, Guelph – Scoped Hydrogeology Study Project No.: P-0011569-0-01-300 Location: 46,47 & 87 Hyland Road, Guelph, Ontario Test Well: BH-04-16 Test Date(s): October 31, 2016 Test Conducted by: D. Souter Analysis Date: November 20, 2016 Analysis Performed by: E. Brears
Time Lag: 1356 seconds Hydraulic Conductivity (m/s): 2.6 x 10⁻⁷
Soil Type: Silty fine sand to silt with some fine sand and clay Notes:
Calculated using Hvorslev: Slug in, falling head
Appendix 7 MOECC Water Well Records
As of September 27, 2016

Well Computer Print Out Data as of September 27 2016 Page: 1 / 5 TOWNSHIP
CONCESSION (LOT) UTM1 DATE 2
CNTR 3
CASING
DIA 4
WATER5,6 DETAIL
STAT LVL/PUMP LVL7
RATE8/TIME HR:MIN
WATER
USE9
SCREEN
INFO10 WELL # (AUDIT#) WELL TAG # STATE12
DEPTHS TO WHICH FORMATIONS EXTEND5,11
WOOLWICH TOWNSHIP (E 17 561099 2004/07 FR 0100 059 / 070 DO 6509742 (Z07288) A007215 () 4825133 W 2663 06 004 / 1:0 BLCK LOAM 0002 GREY CLAY STNS 0098 GRVL 0100 GUELPH TOWNSHIP 17 561100 2004/07 FR 0623 057 / 057 DO 6714999 (Z07287) A007122 DIV C 05(003) 4825135 W 2663 06 FR 0197 012 / 1:0 FILL 0016 GREY SAND 0115 GREY CLAY SAND 0131 BRWN LMSN 0144 BRWN LMSN 0295 BRWN LMSN 0525 GREY LMSN 0656 GUELPH TOWNSHIP 17 561618 2012/06 7188875 (C17971) A115177 P () 4824392 W 6607 GUELPH TOWNSHIP 17 561588 2012/03 MT 7182711 (Z147755) A119972 () 4824651 W 6809 02 96.5 15 BRWN GRNT SAND SILT 0035 BRWN SAND WBRG 0068 GREY SILT TILL SAND 0092 GREY LMSN ROCK 0112 GUELPH TOWNSHIP 17 561614 2014/09 7234987 (Z189459) A () 4824177 W 6875 02 GUELPH TOWNSHIP 17 560802 2012/01 0009 MO 7177418 (Z130553) A126273 () 4824235 W 6607 02 5 10 BRWN SAND SILT CLAY 0013 BRWN SILT SAND CLAY 0015 GUELPH TOWNSHIP 17 560921 2012/11 DO 7192060 (Z159330) A () 4824986 W 7221 04 GUELPH TOWNSHIP 17 561586 2014/09 7234988 (Z189474) A () 4824064 W 6875 02 GUELPH TOWNSHIP 17 560967 2012/09 MO 7189815 (Z157875) A133260 A () 4824971 W 7320 02 GUELPH TOWNSHIP 17 560946 2012/08 TH 7186634 (Z152395) A133262 () 4824970 W 7320 02 5 10 BRWN SAND GRVL LOOS 0005 BRWN SILT CLAY SOFT 0014 GREY SILT CLAY DNSE 0015 GUELPH TOWNSHIP 17 560476 2013/05 7212259 (C20885) A141541 P () 4824432 W 6607 GUELPH TOWNSHIP 17 560964 2012/08 TH 7186635 (Z152396) A133260 () 4824972 W 7320 02 10 10 BRWN SAND GRVL PCKD 0005 BRWN SAND GRVL SILT 0015 BRWN SAND GRVL LOOS 0020

Well Computer Print Out Data as of September 27 2016 Page: 2 / 5 TOWNSHIP
CONCESSION (LOT) UTM1 DATE 2
CNTR 3
CASING
DIA 4
WATER5,6 DETAIL
STAT LVL/PUMP LVL7
RATE8/TIME HR:MIN
WATER
USE9
SCREEN
INFO10 WELL # (AUDIT#) WELL TAG # STATE12
DEPTHS TO WHICH FORMATIONS EXTEND5,11
GUELPH TOWNSHIP 17 560458 2015/03 MO 7241315 (Z200020) A175413 A () 4824439 W 6607 02 57 3 BRWN SAND GRVL 0025 BRWN SILT SAND DNSE 0060 GUELPH TOWNSHIP 17 560949 2012/09 MO 7189816 (Z157874) A133262 A () 4824951 W 7320 02 GUELPH CITY 17 560465 2011/05 7168150 (M10336) A110291 P () 4824458 W 6607 GUELPH CITY 17 560887 2015/02 7258427 (C28194) A180030 P () 4824897 W 7324 GUELPH CITY 17 560459 2009/11 MO 7136478 (M06215) A092191 () 4824186 W 6607 02 BRWN SAND GRVL HARD 0012 BRWN SILT SAND GRVL 0020 GUELPH CITY 17 560697 2000/08 6713459 (220621) A () 4824076 W 2663 GUELPH CITY 17 560929 2006/11 FR 0014 7040783 (Z54265) A047971 () 4824835 W 7190 06 02 8 12 BRWN FILL SAND GRVL 0010 BRWN SAND SILT GRVL 0014 GREY SAND GRVL WBRG 0020 GUELPH CITY 17 560484 2009/10 MO 7134351 (M04681) A090733 () 4824408 W 7238 02 BRWN SAND GRVL 0020 GUELPH CITY 17 560475 2015/05 7254195 (C25947) A179878 P () 4824406 W 6607 GUELPH CITY 17 560446 2014/09 7262614 (C24030) A157149 P () 4824402 W 6607 GUELPH CITY 17 560466 2013/09 0015 MO 7208846 (Z166103) A151212 () 4824394 W 7383 02 10 10 LOAM 0001 FSND SILT 0015 MSND GRVL 0020 GUELPH CITY 17 560471 2015/03 MO 7241316 (Z200019) A175339 () 4824402 W 6607 02 57 3 BRWN SAND GRVL 0030 BRWN SILT SAND DNSE 0060 GUELPH CITY (GUELPH 17 561250 1961/09 FR 0135 075 / 100 DO 6700894 () DIV C 05(001) 4824185 W 2521 04 04 008 / 5:0 CLAY 0040 GRVL 0050 CLAY 0085 GRVL MSND 0101 GREY LMSN 0135 GUELPH CITY (GUELPH 17 561283 1952/09 FR 0125 070 / 090 6701115 () DIV C 05(001) 4824030 W 2521 04 04 010 / 0:30 DO CLAY 0050 GRVL 0110 LMSN 0125

Well Computer Print Out Data as of September 27 2016 Page: 3 / 5 TOWNSHIP
CONCESSION (LOT) UTM1 DATE 2
CNTR 3
CASING
DIA 4
WATER5,6 DETAIL
STAT LVL/PUMP LVL7
RATE8/TIME HR:MIN
WATER
USE9
SCREEN
INFO10 WELL # (AUDIT#) WELL TAG # STATE12
DEPTHS TO WHICH FORMATIONS EXTEND5,11
GUELPH CITY (GUELPH 17 560865 1956/09 FR 0140 018 / 030 6701117 () DIV C 05(002) 4825057 W 2414 04 04 004 / 2:0 CO GRVL STNS 0017 CLAY MSND 0060 MSND 0070 MSND CLAY 0075 BRWN LMSN 0120 BLCK LMSN 0140 GREY LMSN 0147 GUELPH CITY (GUELPH 17 560807 1955/12 FR 0090 030 / 035 CO 6701116 () DIV C 05(002) 4824911 W 2414 05 05 012 / 1:0 GRVL CLAY 0010 GRVL MSND 0020 CLAY GRVL 0025 GREY CLAY 0076 CLAY GRVL 0080 CLAY MSND 0083 BRWN LMSN 0110 BLCK LMSN 0117 GUELPH CITY (GUELPH 17 561579 1958/09 FR 0128 035 / 070 DO 6701121 () DIV C 05(002) 4824321 W 2521 04 04 010 / 1:0 CLAY 0008 QSND 0081 BRWN LMSN 0128 GUELPH CITY (GUELPH 17 561022 1963/07 FR 0100 060 / 085 DO 6701122 () DIV C 05(002) 4824658 W 2521 04 04 006 / 2:0 GRVL CLAY 0020 QSND 0040 CLAY 0080 BRWN LMSN 0100 GUELPH CITY (GUELPH 17 561317 1957/08 FR 0125 032 / 060 DO 6701119 () DIV C 05(002) 4824111 W 2521 04 04 010 / 1:0 CLAY 0030 FSND 0060 CLAY 0071 GREY LMSN 0125 GUELPH CITY (GUELPH 17 561436 1958/08 FR 0116 035 / 080 DO 6701120 () DIV C 05(002) 4824153 W 2521 04 04 010 / 1:0 CLAY 0064 BRWN LMSN 0116 GUELPH CITY (GUELPH 17 560439 1947/09 FR 0080 024 / 032 DO 6701131 () DIV C 06(001) 4824648 W 2414 06 06 005 / 4:0 BRWN CLAY 0013 GRVL 0016 BRWN CLAY 0037 GRVL 0041 HPAN 0056 BRWN CLAY 0069 GRVL 0073 HPAN 0079 BRWN LMSN 0088 WHIT LMSN 0095 GUELPH CITY (GUELPH 17 560802 1959/04 FR 0086 023 / 027 6700889 () DIV C 06(001) 4824881 W 2414 04 04 010 / 2:0 CO LOAM 0002 BLCK CLAY GRVL 0012 MSND GRVL 0021 GREY CLAY 0064 GREY CLAY GRVL 0078 BRWN LMSN 0107 GUELPH CITY (GUELPH 17 560844 1955/03 FR 0088 028 / 030 IN 6701134 () DIV C 06(002) 4825107 W 2414 05 05 005 / 3:0 STNS CLAY 0010 GRVL CLAY 0025 CLAY 0065 MSND CLAY 0076 MSND 0082 BRWN LMSN 0112 BLCK LMSN 0116

Well Computer Print Out Data as of September 27 2016 Page: 4 / 5 TOWNSHIP
CONCESSION (LOT) UTM1 DATE 2
CNTR 3
CASING
DIA 4
WATER5,6 DETAIL
STAT LVL/PUMP LVL7
RATE8/TIME HR:MIN
WATER
USE9
SCREEN
INFO10 WELL # (AUDIT#) WELL TAG # STATE12
DEPTHS TO WHICH FORMATIONS EXTEND5,11
GUELPH CITY (GUELPH 17 560623 1952/12 FR 0100 040 / 153 NU 6701421 () DIV F (D) 4824663 W 2414 10 10 136 / 8:0 LOAM 0002 CLAY MSND 0008 GRVL CLAY 0035 CLAY 0044 MSND 0063 CLAY 0074 BRWN LMSN 0101 BLCK LMSN 0125 GREY LMSN 0129 BRWN LMSN 0175 BLUE LMSN 0210 GREY LMSN 0251 BLUE LMSN 0285 BLUE SHLE 0293 RED SHLE 0295

Well Computer Print Out Data as of September 27 2016 Page: 5 / 5
Notes: 1. UTM in Zone, Easting, Northing and Datum is NAD83; L: UTM estimated from
Centroid of Lot; W: UTM not from Lot Centroid 2. Date Work Completed 3. Well Contractor Licence Number 4. Casing diameter in inches 5. Unit of Depth in Feet 6. See Table 4 for Meaning of Code
7. STAT LVL: Static Water Level in Feet ; PUMP LVL: Water Level After Pumping in Feet
8. Pump Test Rate in GPM, Pump Test Duration in Hour : Minutes 9. See Table 3 for Meaning of Code 10. Screen Depth and Length in feet 11. See Table 1 and 2 for Meaning of Code 12. A: Abandonment; P: Partial Data Entry Only
1. Core Material and Descriptive terms
Code Description … Code Description … Code Description … Code Description … Code Description
BLDR BOULDERS FCRD FRACTURED IRFM IRON
FORMATION PORS POROUS SOFT SOFT
BSLT BASALT FGRD FINE-GRAINED LIMY LIMY PRDG PREVIOUSLY
DUG SPST SOAPSTONE
CGRD COARSE-GRAINED
FGVL FINE GRAVEL LMSN LIMESTONE PRDR PREV. DRILLED
STKY STICKY
CGVL COARSE GRAVEL
FILL FILL LOAM TOPSOIL QRTZ QUARTZITE STNS STONES
CHRT CHERT FLDS FELDSPAR LOOS LOOSE QSND QUICKSAND STNY STONEY
CLAY CLAY FLNT FLINT LTCL LIGHT-COLOURED
QTZ QUARTZ THIK THICK
CLN CLEAN FOSS FOSILIFEROUS LYRD LAYERED ROCK ROCK THIN THIN
CLYY CLAYEY FSND FINE SAND MARL MARL SAND SAND TILL TILL
CMTD CEMENTED GNIS GNEISS MGRD MEDIUM-GRAINED
SHLE SHALE UNKN UNKNOWN TYPE
CONG CONGLOMERATE GRNT GRANITE MGVL MEDIUM GRAVEL
SHLY SHALY VERY VERY
CRYS CRYSTALLINE GRSN GREENSTONE MRBL MARBLE SHRP SHARP WBRG WATER-BEARING
CSND COARSE SAND GRVL GRAVEL MSND MEDIUM SAND SHST SCHIST WDFR WOOD
FRAGMENTS
DKCL DARK-
COLOURED GRWK GREYWACKE MUCK MUCK SILT SILT WTHD WEATHERED
DLMT DOLOMITE GVLY GRAVELLY OBDN OVERBURDEN SLTE SLATE
DNSE DENSE GYPS GYPSUM PCKD PACKED SLTY SILTY
DRTY DIRTY HARD HARD PEAT PEAT SNDS SANDSTONE
DRY DRY HPAN HARDPAN PGVL PEA GRAVEL SNDY SANDY
2. Core Color
Code Description
WHIT WHITE
GREY GREY
BLUE BLUE
GREN GREEN
YLLW YELLOW
BRWN BROWN
RED RED
BLCK BLACK
BLGY BLUE-GREY
3. Water Use
Code Description Code Description
DO Domestic OT Other
ST Livestock TH Test Hole
IR Irrigation DE Dewatering
IN Industrial MO Monitoring
CO Commercial MT Monitoring & Test Hole
MN Municipal
PS Public
AC Cooling And A/C
NU Not Used
4. Water Detail
Code Description Code Description
FR Fresh GS Gas
SA Salty IR Iron
SU Sulphur
MN Mineral
UK Unknown

Appendix 8 Laboratory Certificate of Analysis
ALS Environmental, Laboratory Work Order No. L1847734

[This report shall not be reproduced except in full without the written authority of the Laboratory.]
24-OCT-16
Lab Work Order #: L1847734
Date Received:EnGlobe Corp.
353 BRIDGE ST. E.KITCHENER ON N2K 2Y5
ATTN: ELYSHA BREARSFINAL 31-OCT-16 12:17 (MT)Report Date:
Version:
Certificate of Analysis
ALS CANADA LTD Part of the ALS Group A Campbell Brothers Limited Company
____________________________________________
Mary-Lynn PiresClient Services Supervisor
ADDRESS: 60 Northland Road, Unit 1, Waterloo, ON N2V 2B8 Canada | Phone: +1 519 886 6910 | Fax: +1 519 886 9047
Client Phone: 519-741-1313
P-0011569-0-01-300Job Reference: A05863Project P.O. #:
15-557339C of C Numbers:Legal Site Desc:

Result
31-OCT-16 12:17 (MT)Sample DetailsGrouping Analyte D.L. UnitsQualifier Analyzed
Surface Water PWQO
L1847734 CONTD....2Page of
P-0011569-0-01-300ANALYTICAL GUIDELINE REPORT
Analytical result for this parameter exceeds Guideline Limit listed on this report. Guideline Limits applied:
Guideline Limits
#1: Surface Water PWQO
* ** Detection Limit for result exceeds Guideline Limit. Assessment against Guideline Limit cannot be made.
7
L1847734-1 BH 01-16D. SOUTER on 24-OCT-16 @ 11:0Sampled By:WATERMatrix: #1
Physical Tests
Anions and Nutrients
Total Metals
Colour, ApparentConductivityHardness (as CaCO3)pHTotal Dissolved SolidsTurbidity
Alkalinity, Total (as CaCO3)Ammonia, Total (as N)Chloride (Cl)Fluoride (F)Nitrate (as N)Nitrite (as N)Orthophosphate-Dissolved (as P)Sulfate (SO4)
Aluminum (Al)-TotalAntimony (Sb)-TotalArsenic (As)-TotalBarium (Ba)-TotalBeryllium (Be)-TotalBismuth (Bi)-TotalBoron (B)-TotalCadmium (Cd)-TotalCalcium (Ca)-TotalCesium (Cs)-TotalChromium (Cr)-TotalCobalt (Co)-TotalCopper (Cu)-TotalIron (Fe)-TotalLead (Pb)-TotalMagnesium (Mg)-TotalManganese (Mn)-TotalMolybdenum (Mo)-TotalNickel (Ni)-TotalPhosphorus (P)-TotalPotassium (K)-TotalRubidium (Rb)-TotalSelenium (Se)-TotalSilicon (Si)-TotalSilver (Ag)-TotalSodium (Na)-TotalStrontium (Sr)-TotalSulfur (S)-TotalTellurium (Te)-TotalThallium (Tl)-TotalThorium (Th)-Total
5.96723347.6340911.3
2270.07527.10.1040.066
<0.0100.010694.3
0.0720.000240.001970.120
<0.00010<0.000050
0.035<0.000010
72.3<0.000010<0.000500.00020<0.00100.098
0.0002337.2
0.06000.008300.00070<0.0504.47
0.001250.000271
6.66<0.000050
11.60.19132.6
<0.00020<0.000010<0.00010
HTC
DLDS
2.03.010
0.1020
0.10
100.0200.500.0200.0200.0100.00300.30
0.0100.000100.000100.000200.000100.000050
0.0100.000010
0.500.0000100.000500.000100.00100.050
0.000100.050
0.000500.0000500.000500.0500.050
0.000200.000050
0.0500.000050
0.500.00100.50
0.000200.0000100.00010
CUumhos/cm
mg/LpH units
mg/LNTU
mg/Lmg/Lmg/Lmg/Lmg/Lmg/Lmg/Lmg/L
mg/Lmg/Lmg/Lmg/Lmg/Lmg/Lmg/Lmg/Lmg/Lmg/Lmg/Lmg/Lmg/Lmg/Lmg/Lmg/Lmg/Lmg/Lmg/Lmg/Lmg/Lmg/Lmg/Lmg/Lmg/Lmg/Lmg/Lmg/Lmg/Lmg/Lmg/L
25-OCT-1625-OCT-1626-OCT-1625-OCT-1626-OCT-1625-OCT-16
25-OCT-1625-OCT-1628-OCT-1628-OCT-1628-OCT-1628-OCT-1625-OCT-1628-OCT-16
26-OCT-1626-OCT-1626-OCT-1626-OCT-1626-OCT-1626-OCT-1626-OCT-1626-OCT-1626-OCT-1626-OCT-1626-OCT-1626-OCT-1626-OCT-1626-OCT-1626-OCT-1626-OCT-1626-OCT-1626-OCT-1626-OCT-1626-OCT-1626-OCT-1626-OCT-1626-OCT-1626-OCT-1626-OCT-1626-OCT-1626-OCT-1626-OCT-1626-OCT-1626-OCT-1626-OCT-16
6.5-8.5
*0.0150.020.005
0.011
0.20.0001
0.00090.0010.3
0.001
0.040.025**0.01
0.1
0.0001
0.0003

Result
31-OCT-16 12:17 (MT)Sample DetailsGrouping Analyte D.L. UnitsQualifier Analyzed
Surface Water PWQO
L1847734 CONTD....3Page of
P-0011569-0-01-300ANALYTICAL GUIDELINE REPORT
Analytical result for this parameter exceeds Guideline Limit listed on this report. Guideline Limits applied:
Guideline Limits
#1: Surface Water PWQO
* ** Detection Limit for result exceeds Guideline Limit. Assessment against Guideline Limit cannot be made.
7
L1847734-1
L1847734-2
BH 01-16
BH 02-16
D. SOUTER on 24-OCT-16 @ 11:0
D. SOUTER on 24-OCT-16 @ 12:2
Sampled By:
Sampled By:
WATER
WATER
Matrix:
Matrix:
#1
#1
Total Metals
Physical Tests
Anions and Nutrients
Total Metals
Tin (Sn)-TotalTitanium (Ti)-TotalTungsten (W)-TotalUranium (U)-TotalVanadium (V)-TotalZinc (Zn)-TotalZirconium (Zr)-Total
Colour, ApparentConductivityHardness (as CaCO3)pHTotal Dissolved SolidsTurbidity
Alkalinity, Total (as CaCO3)Ammonia, Total (as N)Chloride (Cl)Fluoride (F)Nitrate (as N)Nitrite (as N)Orthophosphate-Dissolved (as P)Sulfate (SO4)
Aluminum (Al)-TotalAntimony (Sb)-TotalArsenic (As)-TotalBarium (Ba)-TotalBeryllium (Be)-TotalBismuth (Bi)-TotalBoron (B)-TotalCadmium (Cd)-TotalCalcium (Ca)-TotalCesium (Cs)-TotalChromium (Cr)-TotalCobalt (Co)-TotalCopper (Cu)-TotalIron (Fe)-TotalLead (Pb)-TotalMagnesium (Mg)-TotalManganese (Mn)-TotalMolybdenum (Mo)-Total
0.000610.00320
<0.000100.001690.001210.0147
<0.00030
14.610505267.1659918.2
4480.18368.40.1050.1730.043
<0.003026.6
0.1230.000170.001150.116
<0.00010<0.000050
0.0860.000036
1140.000013<0.000500.000260.00160.319
0.0011458.70.116
0.00292
HTC
DLDS
DLHC
0.000100.000300.000100.0000100.000500.00300.00030
2.03.010
0.1020
0.10
200.0200.500.0200.0200.0100.00300.30
0.0100.000100.000100.000200.000100.000050
0.0100.000010
0.500.0000100.000500.000100.00100.050
0.000100.050
0.000500.000050
mg/Lmg/Lmg/Lmg/Lmg/Lmg/Lmg/L
CUumhos/cm
mg/LpH units
mg/LNTU
mg/Lmg/Lmg/Lmg/Lmg/Lmg/Lmg/Lmg/L
mg/Lmg/Lmg/Lmg/Lmg/Lmg/Lmg/Lmg/Lmg/Lmg/Lmg/Lmg/Lmg/Lmg/Lmg/Lmg/Lmg/Lmg/L
26-OCT-1626-OCT-1626-OCT-1626-OCT-1626-OCT-1626-OCT-1626-OCT-16
25-OCT-1625-OCT-1626-OCT-1625-OCT-1626-OCT-1625-OCT-16
25-OCT-1625-OCT-1628-OCT-1628-OCT-1628-OCT-1628-OCT-1625-OCT-1628-OCT-16
26-OCT-1626-OCT-1626-OCT-1626-OCT-1626-OCT-1626-OCT-1626-OCT-1626-OCT-1626-OCT-1626-OCT-1626-OCT-1626-OCT-1626-OCT-1626-OCT-1626-OCT-1626-OCT-1626-OCT-1626-OCT-16
0.030.0050.0060.020.004
6.5-8.5
*0.0150.020.005
0.011
0.20.0001
0.0009*0.001*0.3
*0.001
0.04

Result
31-OCT-16 12:17 (MT)Sample DetailsGrouping Analyte D.L. UnitsQualifier Analyzed
Surface Water PWQO
L1847734 CONTD....4Page of
P-0011569-0-01-300ANALYTICAL GUIDELINE REPORT
Analytical result for this parameter exceeds Guideline Limit listed on this report. Guideline Limits applied:
Guideline Limits
#1: Surface Water PWQO
* ** Detection Limit for result exceeds Guideline Limit. Assessment against Guideline Limit cannot be made.
7
L1847734-2
L1847734-3
BH 02-16
BH 04-16
D. SOUTER on 24-OCT-16 @ 12:2
D. SOUTER on 24-OCT-16 @ 14:3
Sampled By:
Sampled By:
WATER
WATER
Matrix:
Matrix:
#1
#1
Total Metals
Physical Tests
Anions and Nutrients
Total Metals
Nickel (Ni)-TotalPhosphorus (P)-TotalPotassium (K)-TotalRubidium (Rb)-TotalSelenium (Se)-TotalSilicon (Si)-TotalSilver (Ag)-TotalSodium (Na)-TotalStrontium (Sr)-TotalSulfur (S)-TotalTellurium (Te)-TotalThallium (Tl)-TotalThorium (Th)-TotalTin (Sn)-TotalTitanium (Ti)-TotalTungsten (W)-TotalUranium (U)-TotalVanadium (V)-TotalZinc (Zn)-TotalZirconium (Zr)-Total
Colour, ApparentConductivityHardness (as CaCO3)pHTotal Dissolved SolidsTurbidity
Alkalinity, Total (as CaCO3)Ammonia, Total (as N)Chloride (Cl)Fluoride (F)Nitrate (as N)Nitrite (as N)Orthophosphate-Dissolved (as P)Sulfate (SO4)
Aluminum (Al)-TotalAntimony (Sb)-TotalArsenic (As)-TotalBarium (Ba)-TotalBeryllium (Be)-Total
0.00148<0.0503.44
0.001730.000148
8.66<0.000050
23.90.2699.68
<0.000200.000020<0.000100.001440.00482
<0.000100.0005680.000840.0335
<0.00030
19.74642237.8024717.5
2350.1863.900.109
<0.020<0.010<0.0030
24.4
0.1430.000180.009640.0778
<0.00010
HTC
DLDS
0.000500.0500.050
0.000200.000050
0.0500.000050
0.500.00100.50
0.000200.0000100.000100.000100.000300.000100.0000100.000500.00300.00030
2.03.010
0.1020
0.10
100.0200.500.0200.0200.0100.00300.30
0.0100.000100.000100.000200.00010
mg/Lmg/Lmg/Lmg/Lmg/Lmg/Lmg/Lmg/Lmg/Lmg/Lmg/Lmg/Lmg/Lmg/Lmg/Lmg/Lmg/Lmg/Lmg/Lmg/L
CUumhos/cm
mg/LpH units
mg/LNTU
mg/Lmg/Lmg/Lmg/Lmg/Lmg/Lmg/Lmg/L
mg/Lmg/Lmg/Lmg/Lmg/L
26-OCT-1626-OCT-1626-OCT-1626-OCT-1626-OCT-1626-OCT-1626-OCT-1626-OCT-1626-OCT-1626-OCT-1626-OCT-1626-OCT-1626-OCT-1626-OCT-1626-OCT-1626-OCT-1626-OCT-1626-OCT-1626-OCT-1626-OCT-16
25-OCT-1625-OCT-1626-OCT-1625-OCT-1626-OCT-1625-OCT-16
25-OCT-1625-OCT-1628-OCT-1628-OCT-1628-OCT-1628-OCT-1625-OCT-1628-OCT-16
26-OCT-1626-OCT-1626-OCT-1626-OCT-1626-OCT-16
0.025**0.01
0.1
0.0001
0.0003
0.030.0050.006*0.020.004
6.5-8.5
*0.0150.02
*0.005
0.011
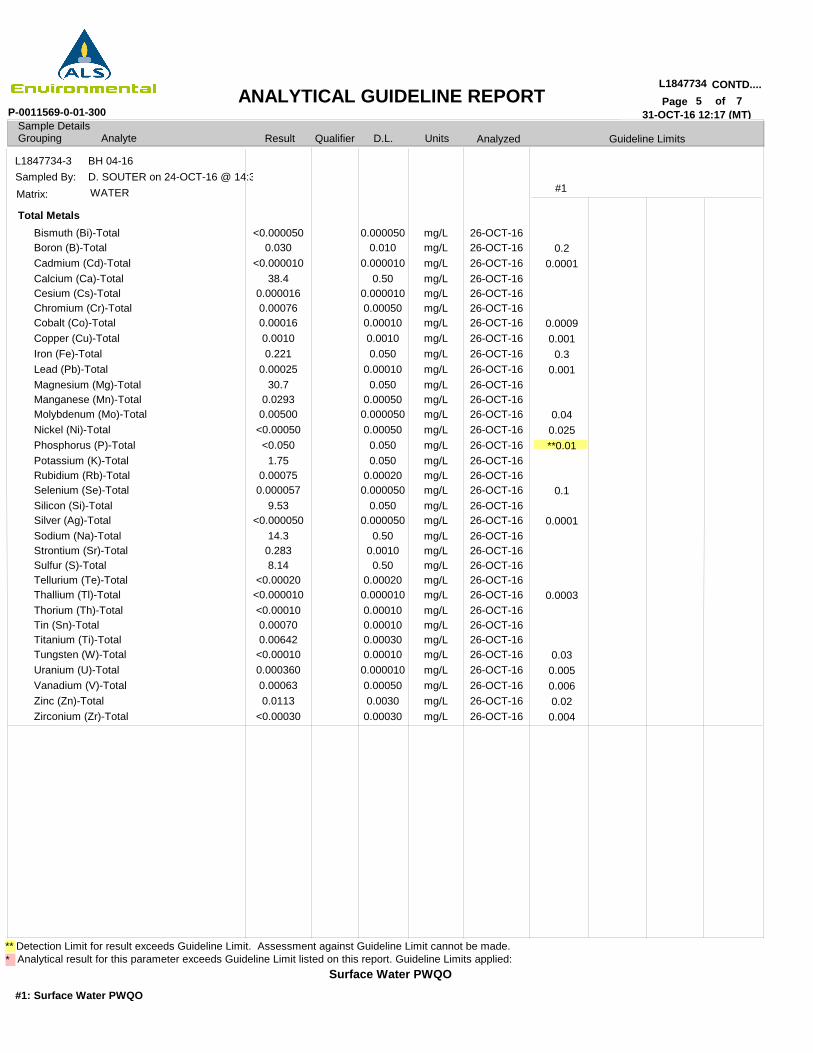
Result
31-OCT-16 12:17 (MT)Sample DetailsGrouping Analyte D.L. UnitsQualifier Analyzed
Surface Water PWQO
L1847734 CONTD....5Page of
P-0011569-0-01-300ANALYTICAL GUIDELINE REPORT
Analytical result for this parameter exceeds Guideline Limit listed on this report. Guideline Limits applied:
Guideline Limits
#1: Surface Water PWQO
* ** Detection Limit for result exceeds Guideline Limit. Assessment against Guideline Limit cannot be made.
7
L1847734-3 BH 04-16D. SOUTER on 24-OCT-16 @ 14:3Sampled By:WATERMatrix: #1
Total Metals
Bismuth (Bi)-TotalBoron (B)-TotalCadmium (Cd)-TotalCalcium (Ca)-TotalCesium (Cs)-TotalChromium (Cr)-TotalCobalt (Co)-TotalCopper (Cu)-TotalIron (Fe)-TotalLead (Pb)-TotalMagnesium (Mg)-TotalManganese (Mn)-TotalMolybdenum (Mo)-TotalNickel (Ni)-TotalPhosphorus (P)-TotalPotassium (K)-TotalRubidium (Rb)-TotalSelenium (Se)-TotalSilicon (Si)-TotalSilver (Ag)-TotalSodium (Na)-TotalStrontium (Sr)-TotalSulfur (S)-TotalTellurium (Te)-TotalThallium (Tl)-TotalThorium (Th)-TotalTin (Sn)-TotalTitanium (Ti)-TotalTungsten (W)-TotalUranium (U)-TotalVanadium (V)-TotalZinc (Zn)-TotalZirconium (Zr)-Total
<0.0000500.030
<0.00001038.4
0.0000160.000760.000160.00100.221
0.0002530.7
0.02930.00500
<0.00050<0.0501.75
0.000750.000057
9.53<0.000050
14.30.2838.14
<0.00020<0.000010<0.000100.000700.00642
<0.000100.0003600.000630.0113
<0.00030
0.0000500.010
0.0000100.50
0.0000100.000500.000100.00100.050
0.000100.050
0.000500.0000500.000500.0500.050
0.000200.000050
0.0500.000050
0.500.00100.50
0.000200.0000100.000100.000100.000300.000100.0000100.000500.00300.00030
mg/Lmg/Lmg/Lmg/Lmg/Lmg/Lmg/Lmg/Lmg/Lmg/Lmg/Lmg/Lmg/Lmg/Lmg/Lmg/Lmg/Lmg/Lmg/Lmg/Lmg/Lmg/Lmg/Lmg/Lmg/Lmg/Lmg/Lmg/Lmg/Lmg/Lmg/Lmg/Lmg/L
26-OCT-1626-OCT-1626-OCT-1626-OCT-1626-OCT-1626-OCT-1626-OCT-1626-OCT-1626-OCT-1626-OCT-1626-OCT-1626-OCT-1626-OCT-1626-OCT-1626-OCT-1626-OCT-1626-OCT-1626-OCT-1626-OCT-1626-OCT-1626-OCT-1626-OCT-1626-OCT-1626-OCT-1626-OCT-1626-OCT-1626-OCT-1626-OCT-1626-OCT-1626-OCT-1626-OCT-1626-OCT-1626-OCT-16
0.20.0001
0.00090.0010.3
0.001
0.040.025**0.01
0.1
0.0001
0.0003
0.030.0050.0060.020.004

Reference Information
P-0011569-0-01-300 L1847734 CONTD....6Page of
31-OCT-16 12:17 (MT)
ALK-WTCL-IC-WT
COLOUR-WT
EC-WT
F-IC-N-WT
HARDNESS-CALC-WT
MET-T-CCMS-WT
NH3-WT
NO2-IC-WT
NO3-IC-WT
PH-WT
PH-WT
PO4-DO-COL-WT
SO4-IC-N-WT
SOLIDS-TDS-WT
Alkalinity, Total (as CaCO3)Chloride by IC
Colour
Conductivity
Fluoride in Water by IC
Hardness
Total Metals by CRC ICPMS
Ammonia, Total as N
Nitrite in Water by IC
Nitrate in Water by IC
pH
pH
Diss. Orthophosphate in Water by Colour
Sulfate in Water by IC
Total Dissolved Solids
Inorganic anions are analyzed by Ion Chromatography with conductivity and/or UV detection.
Analysis conducted in accordance with the Protocol for Analytical Methods Used in the Assessment of Properties under Part XV.1 of the Environmental Protection Act (July 1, 2011).
Apparent Colour is measured spectrophotometrically by comparison to platinum-cobalt standards using the single wavelength method after sample decanting. Colour measurements can be highly pH dependent, and apply to the pH of the sample as received (at time of testing), without pH adjustment. Concurrent measurement of sample pH is recommended.
Water samples can be measured directly by immersing the conductivity cell into the sample.
Inorganic anions are analyzed by Ion Chromatography with conductivity and/or UV detection.
Hardness (also known as Total Hardness) is calculated from the sum of Calcium and Magnesium concentrations, expressed in CaCO3 equivalents. Dissolved Calcium and Magnesium concentrations are preferentially used for the hardness calculation.
Water samples are digested with nitric and hydrochloric acids, and analyzed by CRC ICPMS.
Method Limitation (re: Sulfur): Sulfide and volatile sulfur species may not be recovered by this method.
Analysis conducted in accordance with the Protocol for Analytical Methods Used in the Assessment of Properties under Part XV.1 of the Environmental Protection Act (July 1, 2011).
Sample is measured colorimetrically. When sample is turbid a distillation step is required, sample is distilled into a solution of boric acid and measured colorimetrically.
Inorganic anions are analyzed by Ion Chromatography with conductivity and/or UV detection.
Inorganic anions are analyzed by Ion Chromatography with conductivity and/or UV detection.
Water samples are analyzed directly by a calibrated pH meter.
Analysis conducted in accordance with the Protocol for Analytical Methods Used in the Assessment of Properties under Part XV.1 of the Environmental Protection Act (July 1, 2011).
Water samples are analyzed directly by a calibrated pH meter.
Analysis conducted in accordance with the Protocol for Analytical Methods Used in the Assessment of Properties under Part XV.1 of the Environmental Protection Act (July 1, 2011).
This analysis is carried out using procedures adapted from APHA Method 4500-P "Phosphorus". Dissolved Orthophosphate is determined colourimetrically on a sample that has been lab or field filtered through a 0.45 micron membrane filter.
Inorganic anions are analyzed by Ion Chromatography with conductivity and/or UV detection.
A well-mixed sample is filtered though glass fibres filter. A known volume of the filtrate is evaporated and dried at 105–5°C overnight and then 180–10°C for 1hr.
Methods Listed (if applicable):
ALS Test Code Test Description
WaterWater
Water
Water
Water
Water
Water
Water
Water
Water
Water
Water
Water
Water
Water
DLDS
HTC
DLHC
Detection Limit Raised: Dilution required due to high Dissolved Solids / Electrical Conductivity.
Hardness was calculated from Total Ca and/or Mg concentrations and may be biased high (dissolved Ca/Mg results unavailable).
Detection Limit Raised: Dilution required due to high concentration of test analyte(s).
Sample Parameter Qualifier key listed:
EPA 310.2EPA 300.1 (mod)
APHA 2120
APHA 2510 B
EPA 300.1 (mod)
APHA 2340 B
EPA 200.2/6020A (mod)
EPA 350.1
EPA 300.1 (mod)
EPA 300.1 (mod)
APHA 4500 H-Electrode
MOEE E3137A-R511
APHA 4500-P PHOSPHORUS
EPA 300.1 (mod)
APHA 2540C
Method Reference***
Description Qualifier
Matrix
7

Reference Information
P-0011569-0-01-300 L1847734 CONTD....7Page of
31-OCT-16 12:17 (MT)
TURBIDITY-WT Turbidity
Sample result is based on a comparison of the intensity of the light scattered by the sample under defined conditions with the intensity of light scattered by a standard reference suspension under the same conditions. Sample readings are obtained from a Nephelometer.
Water APHA 2130 B
*** ALS test methods may incorporate modifications from specified reference methods to improve performance.
GLOSSARY OF REPORT TERMS
Surrogates are compounds that are similar in behaviour to target analyte(s), but that do not normally occur in environmental samples. For applicable tests, surrogates are added to samples prior to analysis as a check on recovery. In reports that display the D.L. column, laboratory objectives for surrogates are listed there.mg/kg - milligrams per kilogram based on dry weight of samplemg/kg wwt - milligrams per kilogram based on wet weight of samplemg/kg lwt - milligrams per kilogram based on lipid-adjusted weight mg/L - unit of concentration based on volume, parts per million.< - Less than.D.L. - The reporting limit.N/A - Result not available. Refer to qualifier code and definition for explanation.
Test results reported relate only to the samples as received by the laboratory.UNLESS OTHERWISE STATED, ALL SAMPLES WERE RECEIVED IN ACCEPTABLE CONDITION.Analytical results in unsigned test reports with the DRAFT watermark are subject to change, pending final QC review.
Application of guidelines is provided "as is" without warranty of any kind, either expressed or implied, including, but not limited to fitness for a particular purpose, or non-infringement. ALS assumes no responsibility for errors or omissions in the information.
The last two letters of the above test code(s) indicate the laboratory that performed analytical analysis for that test. Refer to the list below:
Chain of Custody numbers:
15-557339
Laboratory Definition Code Laboratory Location Laboratory Definition Code Laboratory Location
WT ALS ENVIRONMENTAL - WATERLOO, ONTARIO, CANADA
7

Quality Control ReportPage 1 of
Client:
Contact:
EnGlobe Corp. 353 BRIDGE ST. E. KITCHENER ON N2K 2Y5ELYSHA BREARS
Report Date: 31-OCT-16Workorder: L1847734
Test Matrix Reference Result Qualifier Units RPD Limit Analyzed
ALK-WT
CL-IC-WT
COLOUR-WT
EC-WT
F-IC-N-WT
Water
Water
Water
Water
Water
R3579604
R3583332
R3580487
R3578976
Batch
Batch
Batch
Batch
CRM
DUP
LCS
MB
DUP
LCS
MB
MS
CRM
DUP
LCS
MB
DUP
LCS
MB
WG2418772-7
WG2418772-8
WG2418772-6
WG2418772-5
WG2421813-4
WG2421813-2
WG2421813-1
WG2421813-5
WG2419701-3
WG2419701-4
WG2419701-2
WG2419701-1
WG2417960-4
WG2417960-2
WG2417960-1
WT-ALK-CRM
L1848195-2
WG2421813-3
WG2421813-3
WT-COLOUR-CRM
L1847566-1
WG2417960-3
Alkalinity, Total (as CaCO3)
Alkalinity, Total (as CaCO3)
Alkalinity, Total (as CaCO3)
Alkalinity, Total (as CaCO3)
Chloride (Cl)
Chloride (Cl)
Chloride (Cl)
Chloride (Cl)
Colour, Apparent
Colour, Apparent
Colour, Apparent
Colour, Apparent
Conductivity
Conductivity
Conductivity
101.5
25
100.3
<10
3.87
100.4
<0.50
100.5
93.2
<2.0
99.8
<2.0
394
98.9
<3.0
25-OCT-16
25-OCT-16
25-OCT-16
25-OCT-16
28-OCT-16
28-OCT-16
28-OCT-16
28-OCT-16
25-OCT-16
25-OCT-16
25-OCT-16
25-OCT-16
25-OCT-16
25-OCT-16
25-OCT-16
1.1
0.2
N/A
0.0
20
25
20
10
80-120
85-115
70-130
70-130
80-120
80-120
90-110
%
mg/L
%
mg/L
mg/L
%
mg/L
%
%
CU
%
CU
umhos/cm
%
umhos/cm
25
3.87
<2.0
394
10
0.5
2
3
RPD-NA
10

Quality Control ReportPage 2 of
Client:
Contact:
EnGlobe Corp. 353 BRIDGE ST. E. KITCHENER ON N2K 2Y5ELYSHA BREARS
Report Date: 31-OCT-16Workorder: L1847734
Test Matrix Reference Result Qualifier Units RPD Limit Analyzed
F-IC-N-WT
MET-T-CCMS-WT
Water
Water
R3583332
R3579798
Batch
Batch
DUP
LCS
MB
MS
DUP
WG2421813-4
WG2421813-2
WG2421813-1
WG2421813-5
WG2417873-9
WG2421813-3
WG2421813-3
WG2417873-8
Fluoride (F)
Fluoride (F)
Fluoride (F)
Fluoride (F)
Aluminum (Al)-Total
Antimony (Sb)-Total
Arsenic (As)-Total
Barium (Ba)-Total
Beryllium (Be)-Total
Bismuth (Bi)-Total
Boron (B)-Total
Cadmium (Cd)-Total
Calcium (Ca)-Total
Chromium (Cr)-Total
Cesium (Cs)-Total
Cobalt (Co)-Total
Copper (Cu)-Total
Iron (Fe)-Total
Lead (Pb)-Total
Magnesium (Mg)-Total
Manganese (Mn)-Total
Molybdenum (Mo)-Total
Nickel (Ni)-Total
Phosphorus (P)-Total
Potassium (K)-Total
Rubidium (Rb)-Total
Selenium (Se)-Total
Silicon (Si)-Total
0.107
101.0
<0.020
97.0
<0.010
<0.00010
0.00013
0.0435
<0.00010
<0.000050
<0.010
<0.000010
73.1
0.00090
<0.000010
<0.00010
<0.0010
<0.050
<0.00010
29.1
<0.00050
0.000267
0.00059
<0.050
1.29
0.00071
0.000199
3.41
28-OCT-16
28-OCT-16
28-OCT-16
28-OCT-16
25-OCT-16
25-OCT-16
25-OCT-16
25-OCT-16
25-OCT-16
25-OCT-16
25-OCT-16
25-OCT-16
25-OCT-16
25-OCT-16
25-OCT-16
25-OCT-16
25-OCT-16
25-OCT-16
25-OCT-16
25-OCT-16
25-OCT-16
25-OCT-16
25-OCT-16
25-OCT-16
25-OCT-16
25-OCT-16
25-OCT-16
25-OCT-16
3.4
N/A
N/A
2.0
1.2
N/A
N/A
N/A
N/A
0.4
0.3
N/A
N/A
N/A
N/A
N/A
0.3
N/A
7.8
7.5
N/A
0.6
3.3
2.4
0.3
20
20
20
20
20
20
20
20
20
20
20
20
20
20
20
20
20
20
20
20
20
20
20
20
20
90-110
75-125
mg/L
%
mg/L
%
mg/L
mg/L
mg/L
mg/L
mg/L
mg/L
mg/L
mg/L
mg/L
mg/L
mg/L
mg/L
mg/L
mg/L
mg/L
mg/L
mg/L
mg/L
mg/L
mg/L
mg/L
mg/L
mg/L
mg/L
0.110
<0.010
<0.00010
0.00012
0.0430
<0.00010
<0.000050
<0.010
<0.000010
72.8
0.00090
<0.000010
<0.00010
<0.0010
<0.050
<0.00010
29.2
<0.00050
0.000289
0.00055
<0.050
1.30
0.00068
0.000204
3.40
0.02
RPD-NA
RPD-NA
RPD-NA
RPD-NA
RPD-NA
RPD-NA
RPD-NA
RPD-NA
RPD-NA
RPD-NA
RPD-NA
RPD-NA
RPD-NA
10
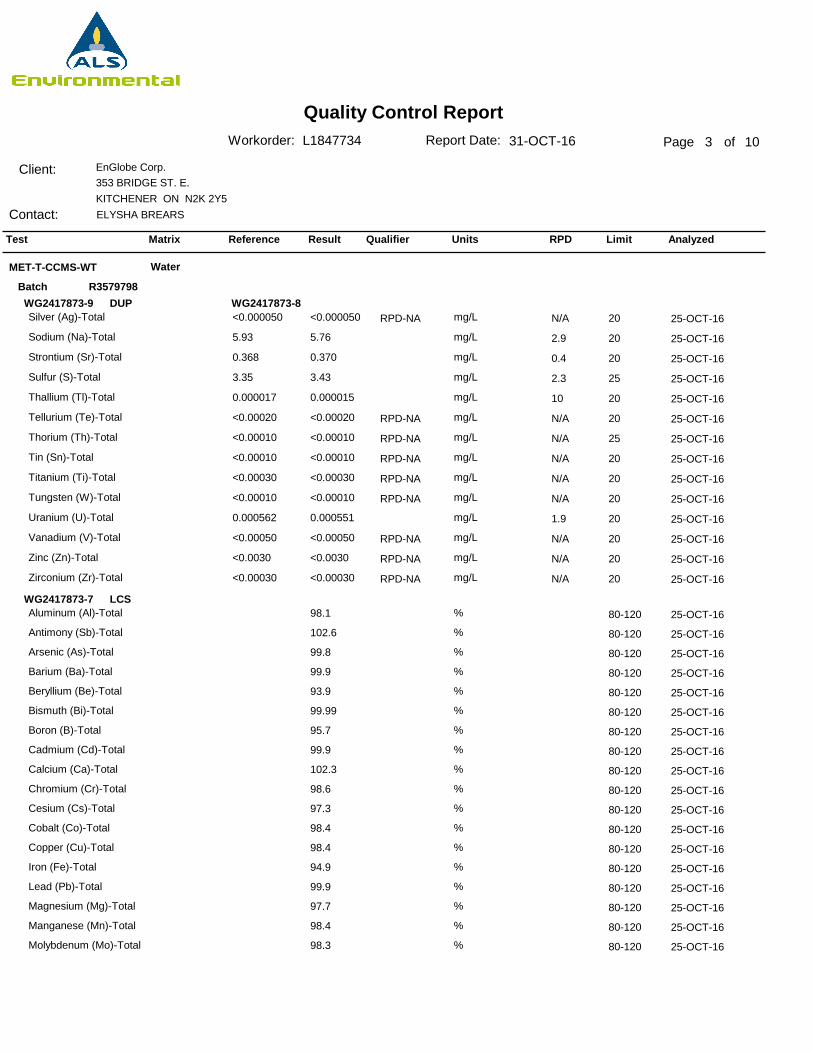
Quality Control ReportPage 3 of
Client:
Contact:
EnGlobe Corp. 353 BRIDGE ST. E. KITCHENER ON N2K 2Y5ELYSHA BREARS
Report Date: 31-OCT-16Workorder: L1847734
Test Matrix Reference Result Qualifier Units RPD Limit Analyzed
MET-T-CCMS-WT Water
R3579798BatchDUP
LCS
WG2417873-9
WG2417873-7
WG2417873-8Silver (Ag)-Total
Sodium (Na)-Total
Strontium (Sr)-Total
Sulfur (S)-Total
Thallium (Tl)-Total
Tellurium (Te)-Total
Thorium (Th)-Total
Tin (Sn)-Total
Titanium (Ti)-Total
Tungsten (W)-Total
Uranium (U)-Total
Vanadium (V)-Total
Zinc (Zn)-Total
Zirconium (Zr)-Total
Aluminum (Al)-Total
Antimony (Sb)-Total
Arsenic (As)-Total
Barium (Ba)-Total
Beryllium (Be)-Total
Bismuth (Bi)-Total
Boron (B)-Total
Cadmium (Cd)-Total
Calcium (Ca)-Total
Chromium (Cr)-Total
Cesium (Cs)-Total
Cobalt (Co)-Total
Copper (Cu)-Total
Iron (Fe)-Total
Lead (Pb)-Total
Magnesium (Mg)-Total
Manganese (Mn)-Total
Molybdenum (Mo)-Total
<0.000050
5.76
0.370
3.43
0.000015
<0.00020
<0.00010
<0.00010
<0.00030
<0.00010
0.000551
<0.00050
<0.0030
<0.00030
98.1
102.6
99.8
99.9
93.9
99.99
95.7
99.9
102.3
98.6
97.3
98.4
98.4
94.9
99.9
97.7
98.4
98.3
25-OCT-16
25-OCT-16
25-OCT-16
25-OCT-16
25-OCT-16
25-OCT-16
25-OCT-16
25-OCT-16
25-OCT-16
25-OCT-16
25-OCT-16
25-OCT-16
25-OCT-16
25-OCT-16
25-OCT-16
25-OCT-16
25-OCT-16
25-OCT-16
25-OCT-16
25-OCT-16
25-OCT-16
25-OCT-16
25-OCT-16
25-OCT-16
25-OCT-16
25-OCT-16
25-OCT-16
25-OCT-16
25-OCT-16
25-OCT-16
25-OCT-16
25-OCT-16
N/A
2.9
0.4
2.3
10
N/A
N/A
N/A
N/A
N/A
1.9
N/A
N/A
N/A
20
20
20
25
20
20
25
20
20
20
20
20
20
20
80-120
80-120
80-120
80-120
80-120
80-120
80-120
80-120
80-120
80-120
80-120
80-120
80-120
80-120
80-120
80-120
80-120
80-120
mg/L
mg/L
mg/L
mg/L
mg/L
mg/L
mg/L
mg/L
mg/L
mg/L
mg/L
mg/L
mg/L
mg/L
%
%
%
%
%
%
%
%
%
%
%
%
%
%
%
%
%
%
<0.000050
5.93
0.368
3.35
0.000017
<0.00020
<0.00010
<0.00010
<0.00030
<0.00010
0.000562
<0.00050
<0.0030
<0.00030
RPD-NA
RPD-NA
RPD-NA
RPD-NA
RPD-NA
RPD-NA
RPD-NA
RPD-NA
RPD-NA
10

Quality Control ReportPage 4 of
Client:
Contact:
EnGlobe Corp. 353 BRIDGE ST. E. KITCHENER ON N2K 2Y5ELYSHA BREARS
Report Date: 31-OCT-16Workorder: L1847734
Test Matrix Reference Result Qualifier Units RPD Limit Analyzed
MET-T-CCMS-WT Water
R3579798BatchLCS
MB
WG2417873-7
WG2417873-6
Nickel (Ni)-Total
Phosphorus (P)-Total
Potassium (K)-Total
Rubidium (Rb)-Total
Selenium (Se)-Total
Silicon (Si)-Total
Silver (Ag)-Total
Sodium (Na)-Total
Strontium (Sr)-Total
Sulfur (S)-Total
Thallium (Tl)-Total
Tellurium (Te)-Total
Thorium (Th)-Total
Tin (Sn)-Total
Titanium (Ti)-Total
Tungsten (W)-Total
Uranium (U)-Total
Vanadium (V)-Total
Zinc (Zn)-Total
Zirconium (Zr)-Total
Aluminum (Al)-Total
Antimony (Sb)-Total
Arsenic (As)-Total
Barium (Ba)-Total
Beryllium (Be)-Total
Bismuth (Bi)-Total
Boron (B)-Total
Cadmium (Cd)-Total
Calcium (Ca)-Total
Chromium (Cr)-Total
Cesium (Cs)-Total
Cobalt (Co)-Total
Copper (Cu)-Total
98.5
86.7
94.2
100.9
99.98
102.6
99.7
98.6
98.2
96.8
96.4
96.8
96.2
99.3
98.7
98.3
100.6
100.1
95.0
94.0
<0.010
<0.00010
<0.00010
<0.00020
<0.00010
<0.000050
<0.010
<0.000010
<0.50
<0.00050
<0.000010
<0.00010
<0.0010
25-OCT-16
25-OCT-16
25-OCT-16
25-OCT-16
25-OCT-16
25-OCT-16
25-OCT-16
25-OCT-16
25-OCT-16
25-OCT-16
25-OCT-16
25-OCT-16
25-OCT-16
25-OCT-16
25-OCT-16
25-OCT-16
25-OCT-16
25-OCT-16
25-OCT-16
25-OCT-16
25-OCT-16
25-OCT-16
25-OCT-16
25-OCT-16
25-OCT-16
25-OCT-16
25-OCT-16
25-OCT-16
25-OCT-16
25-OCT-16
25-OCT-16
25-OCT-16
25-OCT-16
80-120
80-120
80-120
80-120
80-120
80-120
80-120
80-120
80-120
70-130
80-120
80-120
70-130
80-120
80-120
80-120
80-120
80-120
80-120
80-120
%
%
%
%
%
%
%
%
%
%
%
%
%
%
%
%
%
%
%
%
mg/L
mg/L
mg/L
mg/L
mg/L
mg/L
mg/L
mg/L
mg/L
mg/L
mg/L
mg/L
mg/L
0.01
0.0001
0.0001
0.0002
0.0001
0.00005
0.01
0.00001
0.5
0.0005
0.00001
0.0001
0.001
10

Quality Control ReportPage 5 of
Client:
Contact:
EnGlobe Corp. 353 BRIDGE ST. E. KITCHENER ON N2K 2Y5ELYSHA BREARS
Report Date: 31-OCT-16Workorder: L1847734
Test Matrix Reference Result Qualifier Units RPD Limit Analyzed
MET-T-CCMS-WT Water
R3579798BatchMB
MS
WG2417873-6
WG2417873-10 WG2417873-8
Iron (Fe)-Total
Lead (Pb)-Total
Magnesium (Mg)-Total
Manganese (Mn)-Total
Molybdenum (Mo)-Total
Nickel (Ni)-Total
Phosphorus (P)-Total
Potassium (K)-Total
Rubidium (Rb)-Total
Selenium (Se)-Total
Silicon (Si)-Total
Silver (Ag)-Total
Sodium (Na)-Total
Strontium (Sr)-Total
Sulfur (S)-Total
Thallium (Tl)-Total
Tellurium (Te)-Total
Thorium (Th)-Total
Tin (Sn)-Total
Titanium (Ti)-Total
Tungsten (W)-Total
Uranium (U)-Total
Vanadium (V)-Total
Zinc (Zn)-Total
Zirconium (Zr)-Total
Aluminum (Al)-Total
Antimony (Sb)-Total
Arsenic (As)-Total
Barium (Ba)-Total
Beryllium (Be)-Total
Bismuth (Bi)-Total
Boron (B)-Total
Cadmium (Cd)-Total
<0.050
<0.00010
<0.050
<0.00050
<0.000050
<0.00050
<0.050
<0.050
<0.00020
<0.000050
<0.050
<0.000050
<0.50
<0.0010
<0.50
<0.000010
<0.00020
<0.00010
<0.00010
<0.00030
<0.00010
<0.000010
<0.00050
<0.0030
<0.00030
97.1
104.4
95.9
N/A
94.2
90.1
113.0
97.5
25-OCT-16
25-OCT-16
25-OCT-16
25-OCT-16
25-OCT-16
25-OCT-16
25-OCT-16
25-OCT-16
25-OCT-16
25-OCT-16
25-OCT-16
25-OCT-16
25-OCT-16
25-OCT-16
25-OCT-16
25-OCT-16
25-OCT-16
25-OCT-16
25-OCT-16
25-OCT-16
25-OCT-16
25-OCT-16
25-OCT-16
25-OCT-16
25-OCT-16
25-OCT-16
25-OCT-16
25-OCT-16
25-OCT-16
25-OCT-16
25-OCT-16
25-OCT-16
25-OCT-16
70-130
70-130
70-130
-
70-130
70-130
70-130
70-130
mg/L
mg/L
mg/L
mg/L
mg/L
mg/L
mg/L
mg/L
mg/L
mg/L
mg/L
mg/L
mg/L
mg/L
mg/L
mg/L
mg/L
mg/L
mg/L
mg/L
mg/L
mg/L
mg/L
mg/L
mg/L
%
%
%
%
%
%
%
%
MS-B
0.05
0.0001
0.05
0.0005
0.00005
0.0005
0.05
0.05
0.0002
0.00005
0.05
0.00005
0.5
0.001
0.5
0.00001
0.0002
0.0001
0.0001
0.0003
0.0001
0.00001
0.0005
0.003
0.0003
10

Quality Control ReportPage 6 of
Client:
Contact:
EnGlobe Corp. 353 BRIDGE ST. E. KITCHENER ON N2K 2Y5ELYSHA BREARS
Report Date: 31-OCT-16Workorder: L1847734
Test Matrix Reference Result Qualifier Units RPD Limit Analyzed
MET-T-CCMS-WT
NH3-WT
Water
Water
R3579798BatchMSWG2417873-10 WG2417873-8
Calcium (Ca)-Total
Chromium (Cr)-Total
Cesium (Cs)-Total
Cobalt (Co)-Total
Copper (Cu)-Total
Iron (Fe)-Total
Lead (Pb)-Total
Magnesium (Mg)-Total
Manganese (Mn)-Total
Molybdenum (Mo)-Total
Nickel (Ni)-Total
Phosphorus (P)-Total
Potassium (K)-Total
Rubidium (Rb)-Total
Selenium (Se)-Total
Silicon (Si)-Total
Silver (Ag)-Total
Sodium (Na)-Total
Strontium (Sr)-Total
Sulfur (S)-Total
Thallium (Tl)-Total
Tellurium (Te)-Total
Thorium (Th)-Total
Tin (Sn)-Total
Titanium (Ti)-Total
Tungsten (W)-Total
Uranium (U)-Total
Vanadium (V)-Total
Zinc (Zn)-Total
Zirconium (Zr)-Total
N/A
96.0
97.7
94.8
95.3
92.2
90.9
N/A
97.1
96.2
92.8
113.9
99.0
99.97
97.2
N/A
98.1
N/A
N/A
N/A
88.9
95.8
91.4
99.5
95.4
92.7
N/A
99.8
100.7
92.6
25-OCT-16
25-OCT-16
25-OCT-16
25-OCT-16
25-OCT-16
25-OCT-16
25-OCT-16
25-OCT-16
25-OCT-16
25-OCT-16
25-OCT-16
25-OCT-16
25-OCT-16
25-OCT-16
25-OCT-16
25-OCT-16
25-OCT-16
25-OCT-16
25-OCT-16
25-OCT-16
25-OCT-16
25-OCT-16
25-OCT-16
25-OCT-16
25-OCT-16
25-OCT-16
25-OCT-16
25-OCT-16
25-OCT-16
25-OCT-16
-
70-130
70-130
70-130
70-130
70-130
70-130
-
70-130
70-130
70-130
70-130
70-130
70-130
70-130
-
70-130
-
-
-
70-130
70-130
70-130
70-130
70-130
70-130
-
70-130
70-130
70-130
%
%
%
%
%
%
%
%
%
%
%
%
%
%
%
%
%
%
%
%
%
%
%
%
%
%
%
%
%
%
MS-B
MS-B
MS-B
MS-B
MS-B
MS-B
MS-B
10

Quality Control ReportPage 7 of
Client:
Contact:
EnGlobe Corp. 353 BRIDGE ST. E. KITCHENER ON N2K 2Y5ELYSHA BREARS
Report Date: 31-OCT-16Workorder: L1847734
Test Matrix Reference Result Qualifier Units RPD Limit Analyzed
NH3-WT
NO2-IC-WT
NO3-IC-WT
PH-WT
Water
Water
Water
Water
R3579332
R3583332
R3583332
R3578972
Batch
Batch
Batch
Batch
DUP
LCS
MB
MS
DUP
LCS
MB
MS
DUP
LCS
MB
MS
DUP
DUP
LCS
LCS
WG2418112-11
WG2418112-10
WG2418112-9
WG2418112-12
WG2421813-4
WG2421813-2
WG2421813-1
WG2421813-5
WG2421813-4
WG2421813-2
WG2421813-1
WG2421813-5
WG2417957-3
WG2417957-6
WG2417957-1
WG2417957-4
L1847736-1
L1847736-1
WG2421813-3
WG2421813-3
WG2421813-3
WG2421813-3
WG2417957-2
WG2417957-5
Ammonia, Total (as N)
Ammonia, Total (as N)
Ammonia, Total (as N)
Ammonia, Total (as N)
Nitrite (as N)
Nitrite (as N)
Nitrite (as N)
Nitrite (as N)
Nitrate (as N)
Nitrate (as N)
Nitrate (as N)
Nitrate (as N)
pH
pH
pH
0.569
99.2
<0.020
N/A
<0.010
101.0
<0.010
100.9
<0.020
100.6
<0.020
99.3
8.44
7.17
6.99
25-OCT-16
25-OCT-16
25-OCT-16
25-OCT-16
28-OCT-16
28-OCT-16
28-OCT-16
28-OCT-16
28-OCT-16
28-OCT-16
28-OCT-16
28-OCT-16
25-OCT-16
25-OCT-16
25-OCT-16
1.5
N/A
N/A
0.01
0.01
20
25
25
0.2
0.2
85-115
-
70-130
70-130
70-130
70-130
6.9-7.1
mg/L
%
mg/L
%
mg/L
%
mg/L
%
mg/L
%
mg/L
%
pH units
pH units
pH units
MS-B
0.578
<0.010
<0.020
8.43
7.16
0.02
0.01
0.02
RPD-NA
RPD-NA
J
J
10

Quality Control ReportPage 8 of
Client:
Contact:
EnGlobe Corp. 353 BRIDGE ST. E. KITCHENER ON N2K 2Y5ELYSHA BREARS
Report Date: 31-OCT-16Workorder: L1847734
Test Matrix Reference Result Qualifier Units RPD Limit Analyzed
PH-WT
PO4-DO-COL-WT
SO4-IC-N-WT
SOLIDS-TDS-WT
TURBIDITY-WT
Water
Water
Water
Water
Water
R3578972
R3579261
R3583332
R3583255
R3579253
Batch
Batch
Batch
Batch
Batch
LCS
DUP
LCS
MB
MS
DUP
LCS
MB
MS
DUP
LCS
MB
DUP
LCS
WG2417957-4
WG2418332-7
WG2418332-6
WG2418332-5
WG2418332-8
WG2421813-4
WG2421813-2
WG2421813-1
WG2421813-5
WG2419604-3
WG2419604-2
WG2419604-1
WG2418202-3
WG2418202-2
L1847471-3
L1847471-3
WG2421813-3
WG2421813-3
L1847734-1
L1847734-2
pH
Orthophosphate-Dissolved (as P)
Orthophosphate-Dissolved (as P)
Orthophosphate-Dissolved (as P)
Orthophosphate-Dissolved (as P)
Sulfate (SO4)
Sulfate (SO4)
Sulfate (SO4)
Sulfate (SO4)
Total Dissolved Solids
Total Dissolved Solids
Total Dissolved Solids
Turbidity
Turbidity
7.03
0.0056
99.4
<0.0030
93.2
24.3
100.7
<0.30
96.7
399
96.4
<10
17.6
97.3
25-OCT-16
25-OCT-16
25-OCT-16
25-OCT-16
25-OCT-16
28-OCT-16
28-OCT-16
28-OCT-16
28-OCT-16
26-OCT-16
26-OCT-16
26-OCT-16
25-OCT-16
25-OCT-16
9.4
0.3
2.5
3.4
30
20
20
15
6.9-7.1
70-130
70-130
90-110
75-125
85-115
85-115
pH units
mg/L
%
mg/L
%
mg/L
%
mg/L
%
mg/L
%
mg/L
NTU
%
0.0062
24.4
409
18.2
0.003
0.3
10
10

Quality Control ReportPage 9 of
Client:
Contact:
EnGlobe Corp. 353 BRIDGE ST. E. KITCHENER ON N2K 2Y5ELYSHA BREARS
Report Date: 31-OCT-16Workorder: L1847734
Test Matrix Reference Result Qualifier Units RPD Limit Analyzed
TURBIDITY-WT Water
R3579253BatchMBWG2418202-1
Turbidity <0.10 25-OCT-16NTU 0.1
10

Quality Control Report
Page 10 of
Report Date: 31-OCT-16Workorder: L1847734
Sample Parameter Qualifier Definitions:
Description Qualifier
J
MS-B
RPD-NA
Duplicate results and limits are expressed in terms of absolute difference.
Matrix Spike recovery could not be accurately calculated due to high analyte background in sample.
Relative Percent Difference Not Available due to result(s) being less than detection limit.
Limit ALS Control Limit (Data Quality Objectives)DUP DuplicateRPD Relative Percent DifferenceN/A Not AvailableLCS Laboratory Control SampleSRM Standard Reference MaterialMS Matrix SpikeMSD Matrix Spike DuplicateADE Average Desorption EfficiencyMB Method BlankIRM Internal Reference MaterialCRM Certified Reference MaterialCCV Continuing Calibration VerificationCVS Calibration Verification StandardLCSD Laboratory Control Sample Duplicate
Legend:
The ALS Quality Control Report is provided to ALS clients upon request. ALS includes comprehensive QC checks with every analysis to ensure our high standards of quality are met. Each QC result has a known or expected target value, which is compared against pre-determined data quality objectives to provide confidence in the accuracy of associated test results.
Please note that this report may contain QC results from anonymous Sample Duplicates and Matrix Spikes that do not originate from this Work Order.
Hold Time Exceedances:
All test results reported with this submission were conducted within ALS recommended hold times.
ALS recommended hold times may vary by province. They are assigned to meet known provincial and/or federal government requirements. In the absence of regulatory hold times, ALS establishes recommendations based on guidelines published by the US EPA, APHA Standard Methods, or Environment Canada (where available). For more information, please contact ALS.
Client:
Contact:
EnGlobe Corp. 353 BRIDGE ST. E. KITCHENER ON N2K 2Y5ELYSHA BREARS
10