HYDROGEOLOGY AND GROUND-WATER CHEMISTRY OF THE …San Andres Limestone is composed mainly of...
313
HYDROGEOLOGY AND GROUND-WATER CHEMISTRY OF THE SAN ANDRES-GLORIETA AQUIFER IN THEACOMA EMBAYMENTAND EASTERN ZUNI UPLIFT, WEST-CENTRAL NEW MEXICO By Joe A. Baldwin and Scott K. Anderholm U.S. GEOLOGICAL SURVEY Water-Resources Investigations Report 91-4033 Prepared in cooperation with the NEW MEXICO STATE ENGINEER OFFICE, PUEBLO OF ACOMA, PUEBLO OF LAGUNA, and the U.S. BUREAU OF INDIAN AFFAIRS Albuquerque, New Mexico 1992
Transcript of HYDROGEOLOGY AND GROUND-WATER CHEMISTRY OF THE …San Andres Limestone is composed mainly of...

HYDROGEOLOGY AND GROUND-WATERCHEMISTRY OF THE SAN ANDRES-GLORIETAAQUIFER IN THEACOMA EMBAYMENTAND
EASTERN ZUNI UPLIFT, WEST-CENTRAL NEW MEXICO
By Joe A. Baldwin and Scott K. Anderholm
U.S. GEOLOGICAL SURVEY Water-Resources Investigations Report 91-4033
Prepared in cooperation with the
NEW MEXICO STATE ENGINEER OFFICE,
PUEBLO OF ACOMA,
PUEBLO OF LAGUNA,
and theU.S. BUREAU OF INDIAN AFFAIRS
Albuquerque, New Mexico
1992

U.S. DEPARTMENT OF THE INTERIOR
MANUEL LUJAN, JR., Secretary
U.S. GEOLOGICAL SURVEY
Dallas L. Peck, Director
For additional information write to:
District ChiefU.S. Geological SurveyWater Resources DivisionPinetree Corporate, Centre4501 Indian School Rd. NE, Suite 200Albuquerque, New Mexico 87110
Copies of this report can be purchased from:
U.S. Geological SurveyBooks and Open-File ReportsFederal CenterBox 25425Denver, Colorado 80225

CONTENTS
Page
Abstract................................................................. 1
Introduction............................................................. 3
Purpose and scope ................................................... 3Location and climate ................................................ 4Previous investigations............................................. 8Well-numbering system............................................... 8Acknowledgments..................................................... 9
Geology.................................................................. 10
Geologic history.................................................... 10Structure........................................................... 12Stratigraphy........................................................ 14
Precambrian rocks.............................................. 16Pennsylvanian rocks............................................ 16Permian rocks.................................................. 16
Abo Formation............................................. 16Yeso Formation............................................ 18Glorieta Sandstone........................................ 18San Andres Limestone ...................................... 18
Triassic rocks................................................. 22Rocks younger than Triassic and older than the Quaternary
valley-fill deposits......................................... 24Quaternary valley-fill deposits ................................ 24
Hydrogeology............................................................. 26
Valley-fill deposits................................................ 26
Hydraulic properties........................................... 26Ground-water movement.......................................... 26
Chinle Formation.................................................... 30
Hydraulic properties........................................... 30Ground-water movement.......................................... 30
San Andres-Glorieta aquifer......................................... 30
Hydraulic properties........................................... 31Ground-water movement.......................................... 37Water-level changes due to changes in precipitation andground-water withdrawals..................................... 44
111

CONTENTS--Concluded
Page
Hydrogeology - Concluded
Yeso and Abo Formations............................................. 46
Hydraulic properties........................................... 46Ground-water movement.......................................... 48
Pennsylvanian rocks................................................. 49
Hydraulic properties........................................... 49Ground-water movement.......................................... 49
Ground-water chemistry................................................... 51
Thoreau area........................................................ 53Grants-Bluewater area............................................... 57Acoma embayment area................................................ 67Horace Springs...................................................... 78
Summary.................................................................. 83
Selected references...................................................... 86
Supplemental information................................................. 92
PLATES
[In back pocket]
Plate 1. Geologic sections of the Acoma embayment and Zuni uplift, west-central New Mexico
2. Map showing surficial geology and concentrations of selected dissolved constituents and properties of water from wells in the Grants-Bluewater area
IV

FIGURES
Page
Figure 1. Map showing location of the study area and precipitation stations...................
2. Graphs showing annual precipitation for selectedstations within and adjacent to the study area......... 6
3. Diagram showing system of numbering wells and springsin New Mexico ......................................... 9
4-14. Maps showing:
4. General geology of the study area................... 11
5. Regional structural features of northwestern NewMexico............................................ 13
6. Location of major faults in the study area.......... 15
7. Thickness of undivided Pennsylvanian rocks in thestudy area........................................ 17
8. Thickness of undivided San Andres Limestone andGlorieta Sandstone in the study area.............. 20
9. Generalized structure contours on the top of theSan Andres Limestone surface...................... 21
10. Thickness of the Chinle Formation in the studyarea.............................................. 23
11. Water-level contours for Quaternary valley-filldeposits in the Grants-Bluewater area............. 27
12. Generalized transmissivity zones for the SanAndres-Glorieta aquifer........................... 32
13. Potentiometric-surface contours for the SanAndres-Glorieta aquifer, drawn on the basis ofthe highest hydraulic-head values on record....... 33
14. Potentiometric-surface contours for the San Andres-Glorieta aquifer in the Grants- Bluewater area.................................... 39
v

FIGURES--Continued
Page
Figure 15. Graphs showing cumulative departure from meanprecipitation for the period of record at stationswithin the study area.................................. 42
16. Water-level hydrographs for wells in the Grants-Bluewater area......................................... 45
17. Graphs showing comparison of water levels, ground- water withdrawals, and cumulative departure from mean precipitation for the Grants-Bluewater area....... 47
18. Map showing ground-water-chemistry discussion areas, potentiometric surface, and specific conductance of water from the San Andres-Glorieta aquifer............. 52
19. Map showing selected chemical analyses of water from wells completed in the San Andres-Glorieta aquifer in the Thoreau area.................................... 54
20. Piper diagram of selected chemical analyses of water from wells completed in the San Andres-Glorieta aquifer in the Thoreau area............................ 56
21. Map showing molar ratio of bicarbonate concentration to sulfate concentration in water from selected wells completed in the San Andres-Glorieta aquifer in the Thoreau area.................................... 58
22. Piper diagram of selected chemical analyses of water from wells completed in the San Andres-Glorieta aquifer in the Grants-Bluewater area................... 59
23. Map showing dissolved-nitrate, chloride, and sulfate concentrations in water from wells completed in the San Andres-Glorieta aquifer in the Grants-Bluewater area, 1944-48.......................................... 62
24. Map showing dissolved-nitrate, chloride, and sulfate concentrations in water from wells completed in the San Andres-Glorieta aquifer in the Grants-Bluewater area, 1956-57.......................................... 63
VI

FIGURES--Continued
PageFigure 25. Map showing dissolved-nitrate, chloride, and sulfate
concentrations in water from wells completed in the San Andres-Glorieta aquifer in the Grants-Bluewater area, 1962-63.............................................. 64
26. Map showing dissolved-nitrate, chloride, and sulfate concentrations in water from wells completed in the San Andres-Glorieta aquifer in the Grants-Bluewater area, 1980-81.............................................. 65
27. Graph showing chloride concentration in water fromOjo de Gallo and San Rafael municipal wells, 1947-86....... 66
28. Map showing selected chemical analyses of water from wells completed in the San Andres-Glorieta aquifer in the Acoma embayment area....................................... 69
29. Piper diagram of selected chemical analyses of water fromwells completed in the San Andres-Glorieta aquifer in theAcoma embayment area....................................... 70
30. Hydrogeologic section through the Acoma embayment area....... 75
31. Generalized geologic map and dissolved-chlorideconcentration in water from selected wells and springsin the eastern part of the Acoma embayment area............ 77
32. Piper diagram of selected chemical analyses of water from wells and springs in the eastern part of the Acoma embayment area............................................. 79
33. Map showing selected water-chemistry values in water fromwells in the vicinity of Horace Springs.................... 81
34-36. Graphs showing:
34. Concentration of chloride in water from Horace Springsand the Rio San Jose near Grants, 1961-86............. 82
35. Results of Jacob straight-line method of analysis used to calculate transmissivity of Laguna Casa Blanca 86-1 well...................................... 94
36. Results of recovery method of analysis used tocalculate transmissivity of Laguna Casa Blanca86-1 well............................................. 95
vii

FIGURES--Concluded
Page
Figures 37-40. Graphs showing:
37. Results of Jacob straight-line method of analysis used to calculate transraissivity of Laguna Sand Canyon 86-1 well.................................. 97
38. Results of recovery method of analysis used tocalculate transmissivity of Laguna Sand Canyon86-1 well......................................... 98
39. Recovery at Acoma 1 observation well (9.9.28.1344)from flow test at Anzac 86-1 (10.9.25.3241)....... 103
40. Water-level trends at Acoma 1 observation well(9.9.28.1344)..................................... 104
TABLES
Table 1. Records of wells and springs in the Acoma embayment andeastern Zuni uplift.......................................... 105
2. Temperature, geothermal gradient, and specific conductancefor hydrologic-test wells in the Acoma embayment............. 249
3. Transmissivity values of the San Andres-Glorieta aquifer inthe study area............................................... 250
4. Storage coefficients calculated from four aquifer tests........ 252
5. Ground-water withdrawals for 1945-57 and 1979-82 in theGrants-Bluewater area........................................ 253
6. Lithology percentages for Pennsylvanian rocks and the Yesoand Abo Formations in the study area......................... 253
7. Selected water analyses from wells in the Thoreau area......... 254
8. Selected water analyses from wells and springs in theGrants-Bluewater area........................................ 261
9. Selected water analyses from wells and springs in the Acomaembayment area............................................... 280
viii

CONVERSION FACTORS AND VERTICAL DATUM
Multiply
inchfootmileper footacresquare milecubic footacre-footgallonfoot per mileinch per yearfoot per daygallon per minute per footcubic foot per secondgallon per minutefoot squared per daypound per square inchton
25.400.30481.6093.2810.40472.5900.028320.0012330.0037850.1894
25.400.30480.20700.028320.063090.092906.8950.9072
To obtain
millimetermeterkilometerper meterhectaresquare kilometercubic metercubic hectometercubic metermeter per kilometermillimeter per yearmeter per dayliter per second per metercubic meter per secondliter per secondmeter squared per daykilopascalmegagram
Temperature in degrees Celsius Fahrenheit (°F) by the equation:
( °C) can be converted to degrees
'F = 9/5 (°C) + 32
Sea level: In this report "sea level" refers to the National Geodetic Vertical Datum of 1929--a geodetic datum derived from a general adjustment of the first-order level nets of the United States and Canada, formerly called Sea Level Datum of 1929.
IX

HYDROGEOLOGY AND GROUND-WATER CHEMISTRY OF THE
SAN ANDRES-GLORIETA AQUIFER IN THE ACOMA EMBAYMENT
AND EASTERN ZUNI UPLIFT, WEST-CENTRAL NEW MEXICO
By Joe A. Baldwin and Scott K. Anderholm
ABSTRACT
The San Andres Limestone and the underlying Glorieta Sandstone of Permian age comprise the San Andres-Glorieta aquifer in west-central New Mexico. The San Andres Limestone is composed mainly of limestone and some sandstone and is unconformably overlain by the Chinle Formation. The Glorieta Sandstone conformably overlies the Yeso Formation and is composed of well-sorted, well- cemented, fine- to medium-grained sandstone.
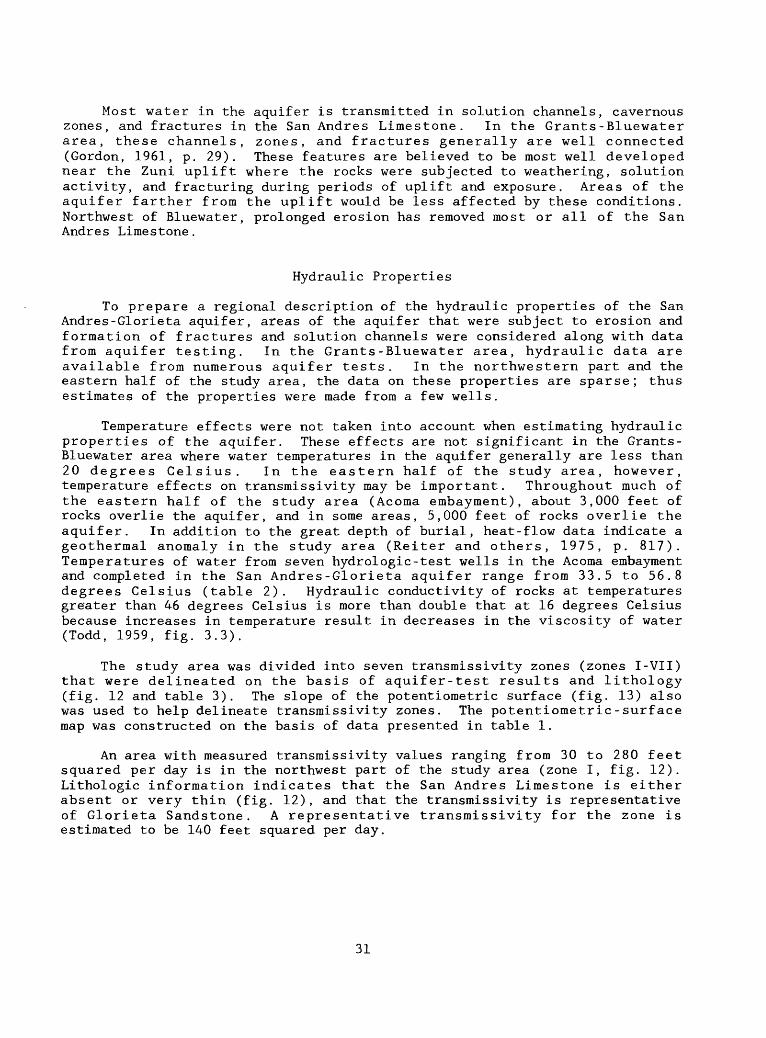
Most of the water in the San Andres-Glorieta aquifer is transmitted in solution channels, cavernous zones, and fractures in the San Andres Limestone. Seven transmissivity zones were identified in the study area on the basis of aquifer-test results and the lithology of the aquifer. Values of transmissivity of the zones range from 10 to 50,000 feet squared per day. Zones with values of transmissivity of 50,000 feet squared per day are located in the Grants area and in an area east and south of the Zuni uplift. The zone with the smallest transmissivity, 10 feet squared per day, is located at the eastern margin of the study area.
Recharge to the San Andres-Glorieta aquifer occurs on outcrops along the Zuni uplift and Lucero uplift by infiltration of precipitation and surface water. The quantity of recharge is related to the areal extent of outcrops of the aquifer. Recharge to the San Andres-Glorieta aquifer also occurs south of the Zuni uplift where the aquifer subcrops beneath The Malpais. Recharge to the aquifer also is the result of leakage from Bluewater Lake and Bluewater Creek. Surface water and ground water used for irrigation also may infiltrate and recharge the aquifer in the Grants-Bluewater area.
Ground-water movement in the San Andres-Glorieta aquifer generally is outward from the Zuni uplift (recharge area). In the northwestern part of the study area, ground water moves toward the northeast. The direction of movement changes to the east at distance from the Zuni uplift. Ground water moves east away from the Zuni uplift and toward the Rio Grande rift in the eastern part of the study area.

Discharge of ground water from the San Andres-Glorieta aquifer is by spring discharge, withdrawal from wells, underflow out of the study area, and leakage to adjacent rocks. Prior to development of the ground-water resources in the Grants area, Ojo del Gallo probably was a major discharge point in the part of the aquifer northwest of Grants. Discharge did not take place at Ojo del Gallo during 1953 to 1982. This cessation in discharge at Ojo del Gallo probably was due to the large volume of ground-water withdrawal in the Grants- Bluewater area and to changes in the quantity of precipitation, which affects recharge.
Discharge from the San Andres-Glorieta aquifer at Horace Springs also has been postulated. Evaluation of hydrologic, geologic, and water-chemistry data, however, indicates that water discharging from Horace Springs is derived from the alluvial aquifer.
Discharge from the San Andres-Glorieta aquifer in the Grants-Bluewater area increased substantially in the mid-1940's when wells were first used as a source of irrigation water. Withdrawals peaked in 1956, when 14,210 acre-feet of water was pumped from the aquifer. The large volume and changes in location of pumpage with time probably resulted in changes in the direction of ground-water movement in the aquifer. Water-chemistry data indicate changes in ground-water chemistry in the area during this time.
The mechanism for discharge of water from the San Andres-Glorieta aquifer east of the Zuni uplift is not known, but several possibilities exist. Underflow of ground water into the Rio Grande rift sediments is one possibility; however, in the area north of the Lucero uplift where this underflow could possibly occur, the San Andres-Glorieta aquifer is in fault contact with fine-grained sediments and leakage into these sediments probably is very small. Discharge from Pennsylvanian rocks east of the San Andres- Glorieta aquifer does occur in the Lucero uplift area. The source of this water may be downward leakage from the San Andres-Glorieta aquifer (discharge) through the Yeso and Abo Formations.
The specific conductance of ground water derived from the San Andres- Glorieta aquifer in the Thoreau area ranges from 470 to 1,390 microsiemens per centimeter at 25 degrees Celsius. Calcium and magnesium are the dominant cations and bicarbonate and sulfate are the dominant anions in ground water in this area. In the Grants-Bluewater area, calcium generally is the dominant cation and bicarbonate and sulfate generally are the dominant anions in ground water. Changes in concentrations of dissolved sulfate, chloride, and nitrate in ground water in the Grants-Bluewater area indicate variations in overall water chemistry over time. These changes probably are in part due to human activities. Ground water from west to east in the Acoma embayment area increases in specific conductance from approximately 1,000 to greater than 14,000 microsiemens. As in the Grants-Bluewater area, calcium is the dominant cation and bicarbonate and sulfate are the dominant anions in ground water near the recharge area on the western side of the Acoma embayment area. As ground water moves eastward in the Acoma embayment area, dissolved-sodium, sulfate, and chloride concentrations increase substantially.

INTRODUCTION
The San Andres Limestone and the Glorieta Sandstone of Permian age underlie a large area of west-central New Mexico and adjacent east-central Arizona. The San Andres-Glorieta aquifer is comprised of these formations in the study area. The San Andres Limestone and, to a lesser extent, the Glorieta Sandstone yield relatively large quantities of good-quality water (dissolved-solids concentration less than 1,500 mg/L (milligrams per liter) to wells completed at depths of 1,000 feet or less in the Grants-Bluewater area. The San Andres-Glorieta aquifer has been extensively developed for irrigation, industrial, and domestic use in the Grants-Bluewater area.
Southeast of Grants, lands belonging to the Acoma and Laguna Indians also are underlain by the San Andres-Glorieta aquifer, but the hydrologic potential of the aquifer in this area is largely unknown because of the paucity of hydrologic data. A test well drilled on the western part of the Acoma Indian Reservation penetrated a cavernous zone at the top of the San Andres-Glorieta aquifer (San Andres Limestone). Aquifer testing indicated that large well yields are possible in this area and that water quality is good (dissolved- solids concentration less than 1,500 mg/L). However, the areal extent of the aquifer having large well yields and good-quality water and potential for supply is undetermined. On the eastern part of Laguna Indian Reservation, wells completed in the San Andres-Glorieta aquifer generally have small discharge rates and the water has dissolved-solids concentrations as large as 10,000 mg/L.
The investigation of the San Andres-Glorieta aquifer was begun by the U.S. Geological Survey in 1983 in cooperation with the New Mexico State Engineer Office, the Pueblos of Acoma and Laguna, and the U.S. Bureau of Indian Affairs. The purpose of the study was to define the geohydrology and ground-water chemistry of the San Andres-Glorieta aquifer, to assess the effects of historical ground-water withdrawals from the San Andres-Glorieta aquifer, and to estimate the effects of any future ground-water withdrawals from the aquifer.
Purpose and Scope
This report describes the geohydrology and ground-water chemistry of the San Andres-Glorieta aquifer. Specifically, it defines hydrologic properties of the flow system and uses ground-water chemistry to better define the ground-water flow system.
Information for the study was acquired from literature review of the hydrology and geology of the area, collection of ground-water and surface- water data, ground-water sampling for chemical analysis, surface and subsurface geophysical investigations, analysis of stratigraphic and drill- stem test data from oil-test holes, field examination of rock units in the study area, and compilation of historical water-use data in the area. Several test wells were drilled in the eastern part of the study area where little or no data about the San Andres-Glorieta aquifer existed.

Location and Climate
The study area, in west-central New Mexico, covers parts of Cibola, Catron, Socorro, Valencia, Bernalillo, Sandoval, and McKinley Counties (fig. 1). Major topographic features in the study area include Mount Taylor, the Continental Divide, and the Zuni Mountains.
At 11,301 feet in altitude in the northern part of the study area, Mount Taylor is the highest point in the study area. Mount Taylor is surrounded by basalt-covered mesas that are at altitudes of 8,000 to 9,000 feet.
The Continental Divide extends roughly north-south across the western part of the study area. Numerous cinder cones and shield volcanoes are along the Continental Divide.
In the west-central part of the study area are the Zuni Mountains, which formed as a result of the Zuni uplift. The highest point in these mountains is Mount Sedgwick, which has an altitude of 9,256 feet.
Other features include the North Plains, a basalt-covered plateau that has an altitude of about 7,000 feet. This plateau, south of the Zuni Mountains, is crossed by the Continental Divide. East of the North Plains on Acoma and Laguna Indian Reservations, basalt- and sandstone-capped mesas predominate. In some areas of the reservations, headward erosion has produced sheer-walled valleys having 300 to 400 feet of relief. North of Grants, La Jara Mesa and Mesa Montanosa are formed by northeastward-dipping sedimentary rocks. Basalt flows can be found northwest and south of Grants.
Surface-water drainage is toward the Little Colorado River in adjacent Arizona west of the Continental Divide. Surface-water drainage is toward the Rio Grande east of the Continental Divide. The Rio San Jose, which begins at the confluence of Mitchell Draw and Bluewater Creek (fig. 1), is the main drainage in the study area. The course of the Rio San Jose is southeastward across Cibola County to its confluence with the Rio Puerco. The Rio San Jose occupies a broad valley in the Grants-Bluewater area. Southeast of Grants, however, near the junction of Interstate 40 and Highway 117, is a constriction in this valley where the Rio San Jose crosses eastward-dipping sedimentary strata. East of this area, the valley again widens.
Cottonwood Creek and Bluewater Creek, which have headwaters into the Zuni Mountains west of Mount Sedgwick, are the major tributaries of the Rio San Jose. Both creeks flow into Bluewater Lake. Bluewater Dam was constructed in 1927 to provide a storage reservoir for irrigation in the Grants-Bluewater area.
The climate of most of the study area is semiarid to arid, and the average annual temperature is approximately 10 degrees Celsius (Gordon, 1961, p. 9). Mean annual precipitation at Grants from 1947 to 1984 was 10.1 inches (fig. 2). Mean annual precipitation at McGaffey from 1911 to 1981 was 17.7 inches (fig. 2). Differences in mean annual precipitation are due in part to differences in altitude of the precipitation stations. Generally precipitation increases with altitude in the study area. In general, precipitation was above normal from the mid-1920's to the late 1930's (fig. 2). Precipitation was below normal from about 1950 to the mid-1960's.

108°
30'
108
107°
30'
cn
35°3
0'
LAJA
RA
M
ESA
+
Mt
Tayl
or
^/
I I
/ ^-V
-^0'
&£
J $
IN
D.A
N\^
^X
/O
J
AC
OM
A
c£
/ F
^ A
/\
Acom
aV
T
RE
SE
RV
AT
ION
j
._--
IN
DIA
N
'/
RE
SE
RV
AT
ION
I
/
_. ^LA
GU
NA
^"
JCE
BO
LLIT
A
I ^\
'ND
IAN
/ A/r
nc.
; PR
ESER
VATI
ONi
MES
A
| ^;
^
EX
PL
AN
AT
ION
PR
EC
IPIT
AT
ION
ST
AT
ION
10
15
20 M
ILE
S
I I
i
0 5
10
15
20 K
ILO
ME
TE
RS
Fig
ure
1
.--L
ocati
on of
the
study are
a
and pre
cip
itati
on sta
tions.

£U
15
10
5
n
I I I I I I I I I
GRANTSMean = 10.1 inches
- r
-
i i i i i
n
1
||
-, ^[^yi i
__
r\r^~-
I
<L\J
15
10
5
n
I
hi
ni
/Yi I
I
111I
^"J1 1 1 1
BLUEWATER
-if
I I
J
1
^" Mean = 10.0 inches
i i i
c/>LU I O
£.\J
15
10
n
I I I I I I I I
HICKMAN Means 12.4 inches
i i i i i ft Ir-| [^fin,j^
I I
I
^\n
1
-
Q. OLU EC
iy
10
5
n
I I I I I I I I
SAN MATEOMean = 8.3 inches
-
l l I I l I l
L/in-nI
I
fll_
-
<:U
15
10
5
n
l l I lEL MORROMean = 13.4 inches
I
-
I l I I
rH i i i i p,
piJ
l
,nnllir r MnJU U
v--
-
l l l i
20
15
10
5
I LAGUNA
vufl
\ _I Mean = 10.1 inches
1900 1910 1920 1930 1940 1950 1960 1970 1980
Figure 2.--Annual precipitation for selected stations within and adjacent to the study area.

20
15
10
5
0
30
25
20
15
10
I I
|- GALLUP
I I l Mean= 11.2 inches
J1'
UJI oz
o
Q.
OUJcc
z z <
- MCGAFFEY
i
1 I I I Mean= 17.7 inches
JlU
^
25
20
10
5
I I
BLACK ROCK
Jl
I I I I Mean = 12.0 inches
N rou
25
20
15
10
5
n
I I I I
SAN FIDEL
-
-
-
i i
""-
M
-
A'-'
I l
I I I I I
Mean « 9.7 inches -
n J
uu
-
-
J |U Lr
I 1 I I I1900 1910 1920 1930 1940 1950 1960 1970 1980
Figure 2.--Annual precipitation for selected stations within and adjacent to the study area--Concluded.

Previous Investigations
Numerous reports describing the geology and hydrology of parts of the study area have been published. Some of the significant reports describing geology, stratigraphy, and structure include those by McKee (1933), Foster (1957), Tonking (1957), Jicha (1958), Fitzsimmons (1959), Baars (1962), Maxwell (1976), and O'Sullivan (1977). Geological mapping is described in reports by Kelley and Wood (1946), Thaden and Ostling (1967), Thaden and others (1967a), Thaden and others (1967b and c), Green and Pierson (1971), Maxwell (1981), and Thaden and Zech (1984).
Significant hydrologic reports include Hodges (1938), Morgan (1938), Murray (1945), U.S. Geological Survey (1946-55), Gordon (1961), Titus (1963), Cooper and John (1968), Shomaker (1968, 1969, 1971), West (1972), Hydro- Search, Inc. (1977, 1978a and b, 1981), Lyford (1979), Lyford and others (1980), Geohydrology Associates, Inc. (1981, 1984), Aqua Science, Inc. (1982), Frenzel and Lyford (1982), Risser (1982), Ward and others (1982), Risser and Lyford (1983), Stone and others (1983), U.S. Bureau of Indian Affairs (1984), and Dames and Moore (1986).
Well-Numbering System
The system of numbering wells and springs in this report is based on the common subdivision of public lands into sections (fig. 3). The well number, in addition to designating the well, locates its position to the nearest 10-acre tract in the land network. The first number denotes the township north or south of the New Mexico Base Line, the second denotes the range east or west of the New Mexico Principal Meridian, and the third denotes the section in which the well is located. The fourth number locates the well within the section to the nearest 10 acres by the system of quartering shown in figure 3. If two or more wells or springs occur in the same 10-acre tract, the wells are distinguished by letters (a, b, etc.) following the location number. The use of zeros in the fourth segment of the location number indicates that the well or spring could not be located accurately: well number ION.9W.25.400, for example, indicates that the well could not be located more accurately than the southeast quarter of section 25. Parts of Cibola County have not been subdivided by township, range, and section. Location numbers for such areas were determined by extending section lines from adjacent areas.
Some wells are tabulated by the New Mexico State Engineer Office well number and also by latitude and longitude. Latitudes and longitudes were obtained from 7 1/2-minute quadrangle sheets. All well locations were verified by onsite visits. The latitude and longitude accuracy is plus or minus 1 second. Latitudes and longitudes were converted to x-y coordinates for the purpose of plotting well locations. Some of the wells in table 1 (tables are in the back of the report) were used to construct potentiometric- surface and water-level contour maps. Oil-test holes used in the report are not included in table 1.

Sections within a township
R.9W.
1 mile
Figure 3.--System of numbering wells and springs in New Mexico
Acknowledgments
The authors gratefully acknowledge the residents of the Acoma and Laguna Indian Reservations and the many other property owners who granted access to well sites and provided well and spring data. The study could not have been completed without their cooperation. Charles A. Wohlenberg, New Mexico State Engineer Office, provided much valuable geologic and hydrologic data. W.P. Balleau, formerly with the U.S. Bureau of Indian Affairs, provided insight about the geology and hydrology of parts of the study area. Personnel at the Bureau of Indian Affairs assisted in well site access and archeological clearance at test-well sites and provided well records and water-quality data.

GEOLOGY
The geology section contains discussions of the geologic history, structure, and stratigraphy of the study area. Structural features and geologic units that influence the hydrology of the San Andres-Glorieta aquifer are discussed in detail.
Geologic History
Rocks ranging in age from Precambrian to Quaternary are present in the study area (fig. 4). Precambrian rocks mostly are granite with some schist, metarhyolite, gneiss, and quartzite (Gordon, 1961, p. 18). These rocks are exposed in the center of the Zuni uplift (fig. 4). Rocks from late Precambrian to Middle Pennsylvanian age are absent in the study area, suggesting that the region was a stable paleohighland where sediments either were not deposited or were subsequently eroded. The first rocks preserved after the Precambrian age were limestones and conglomerates of Late Pennsylvanian age, which were deposited in a basin formed in the southeastern part of the study area (Kelley and Wood, 1946). Deposition continued throughout Late Pennsylvanian and Early Permian time without interruption. The depositional environment from Pennsylvanian to Early Permian time changed from marine to continental and restricted marine. The Abo and Yeso Formations of Early Permian age are composed of sediments eroded from highlands northeast of the study area (Baars, 1962, p. 211). A final advance of Early Permian seas resulted in deposition of the Glorieta Sandstone and San Andres Limestone. A period of erosion at the Permian-Triassic boundary exposed the San Andres Limestone to extensive solution action and erosion in the Grants- Bluewater area. This resulted in the development of karst topography.
During Triassic time the study area was a low plain. Sediments from the south spread over the partly eroded San Andres Limestone. In some areas caverns and sinkholes in the San Andres Limestone are filled with Triassic sediments. During Jurassic and Cretaceous time the depositional environment was continental and shallow marine, producing thick deposits of sandstone, siltstone, and shale. During Late Cretaceous time, seas advanced and retreated several times across the area, creating a transgressive-regressive sequence of sediments. The seas retreated from the area for the final time near the end of Cretaceous time.
During the last part of the Cretaceous Period, deformation associated with the Laramide Orogeny formed most of the existing structural features. The broad domes of the Zuni and Lucero uplifts began to form. Erosion began removing sediments that previously had accumulated during Early and middle Cretaceous time. Approximately 5,000 feet of sediments eventually were removed from the eastern part of the study area (Moench and Schlee, 1967, p. 2).
10

108°30 107°30' 107°
35°30'
35° h
34°30'
QUATERNARY
QUATERNARY AND TERTIARY
TERTIARYCRETACEOUS
JURASSIC
TRIASSIC
PERMIAN
PENNSYLVANIAN PRECAMBRIAN
EXPLANATION 0 1Q
ALLUVIUM AND BASALT
BASALT, UNDIVIDED
[_ QUATERNARY AND TERTIARY SEDIMENTARY ROCKS, UNDIVIDED
Q^ TERTIARY ROCKS, UNDIVIDED
[3D CRETACEOUS ROCKS, UNDIVIDED
Q^ JURASSIC ROCKS, UNDIVIDED
[~H CHINLE FORMATION (locally includes Wingate Sandstone) UNCONFORMITY
SAN ANDRES LIMESTONE
GLORIETA SANDSTONE
ABO AND YESO FORMATIONS, UNDIVIDED
PENNSYLVANIAN ROCKS, UNDIVIDEDPRECAMBRIAN ROCKS, UNDIVIDED
GEOLOGIC CONTACT
30 MILES
30 KILOMETERS
Figure 4.--General geology of the study area (modified from Dane and Bachman, 1965).
11

About 2 million years ago, the central part of the study area became the site of extensive volcanisra (formation of Mount Taylor). This volcanism continued intermittently until as recently as 400 years ago . Abundant volcanic maars in the Mount Taylor region formed 3.2 to 1.5 million years ago, indicating that a wet climate may have existed during this period (Grumpier, 1982, p. 294). Basalt-capped mesas such as Cebollita and Horace (fig. 1) are remnants of what was once a large basalt-covered plateau that extended over many hundreds of square miles in the central and eastern parts of the study area.
Moench and Schlee (1967, p. 54) indicated that the ancestral Rio San Jose drainage was developed before the extrusion of the basalts capping Mesa Chivato. They estimated that the level of the ancestral drainage was 650 to 700 feet above the level of the present Rio San Jose. Since the extrusion of the basalts capping Mesa Chivato, the base level of the Rio San Jose drainage has dropped and resulted in the removal of large amounts of material . Grumpier (1982, p. 293) indicated that this erosional downcutting must have been extreme in the interval 2.5 million to 500,000 years ago.
Structure
Major structural features in the study area include the Zuni uplift, Chaco slope, Acoma embayraent, Lucero uplift, Rio Puerco fault zone, and the northern part of the Mogollon slope (fig. 5). These structural features affect the ground-water conditions in the San Andres-Glorieta aquifer.
The Zuni uplift is an elongate dome about 75 miles long and about 30 miles wide. The structure is oriented northwest-southeast with exposures of Precambrian granitic and metamorphic rocks in the central part of the uplift. Sedimentary rocks dip away from the uplift. Dips on the southwestern flank range from 5 to 20 degrees, and dips on the northeastern flank range from 3 to 10 degrees. Normal faults trending northeast are common in the southeastern part of the uplift.
A series of alternating cuestas and valleys has been formed by the tilted sedimentary rocks. The steep faces of the cuestas are facing toward the center of the uplifted area; long dip slopes facing outward have developed on the more resistant rocks. Long valleys running parallel to the axis of the uplift have been created by erosion of the less resistant rocks. Much of the Grants-Bluewater area lies in such a valley that has been eroded into the less resistant strata of the Chinle Formation. Dips of the sedimentary rocks surrounding the dome are somewhat steeper than the surface slopes.
Gently dipping rocks on the northeast flank of the Zuni uplift form the Chaco slope (Woodward and Callender, 1977, p. 209). A few small-scale domes interrupt the otherwise uniform dip of this structural area (pi. 1, section B-B').
12

H- 5
S
H-
O
Oa 3
H-
(D
W
P.
rt
i-<
OO
rt
5
£
rt N
Hi
W
0>
O
H.3
0>
en
en
ui
3vO
O
rt
5?
CM
0)
W
rtt-»
0> SS
(D S
0> H
- O
O
Ol
Ol
O O m
DD 0)
ro
01 01
o m 0)

The Acoma embayment is a broad synclinal area oriented roughly north- south that lies between the Zuni and Lucero uplifts. This embayment connects the San Juan Basin to the north and the Mogollon slope to the south. The Acoma embayment is marked by volcanic features such as Mount Taylor, smaller volcanic necks and plugs in its northern part, and volcanic dikes and sills in its southern part.
Structural features east of the Acoma embayment include the Lucero uplift and the Rio Puerco fault zone (fig. 5). The Lucero uplift borders the southeastern part of the Acoma embayment, separating it from the Rio Grande rift to the east. The uplift is about 40 miles long, as much as 10 miles wide, and forms the western flank of a north-plunging arch (Kelley and Wood, 1946). Structural relief between the uplift and the adjacent Rio Grande rift may be as much as 20,000 feet (Fitzsimmons, 1959, p. 114). Altitudes in the uplift range from 7,000 to 7,500 feet above sea level. Paleozoic and Mesozoic sedimentary rocks in the uplift dip to the west.
The Rio Puerco fault zone is a transitional zone between the Colorado Plateau to the west and the Rio Grande rift to the east. Slack and Campbell (1976, p. 51) indicated that the majority of faults in the Rio Puerco fault zone are the result of divergent wrenching during Laramide time (Late Cretaceous-early Tertiary). The zone is marked by north-trending normal faults. Displacement along the faults generally is small, but can be as much as 2,000 feet.
South of the Zuni uplift and Acoma embayment lies the Mogollon slope. Sedimentary rocks in this area dip gently to the south and are covered by volcanic rocks.
Major faults in the study area are mostly along the Zuni and the Lucero uplifts (fig. 6). Faults in the Zuni uplift generally are normal faults oriented northwest to southeast. The fault bordering The Malpais Valley on the east is downthrown on the west and the fault bordering the valley on the west is downthrown on the east. This probably has resulted in formation of a graben in the southern part of The Malpais Valley, although the area is covered by extensive basalt flows and the existence of this structure is not confirmed. Other small horst and graben structures are in the Rio San Jose valley between Bluewater Lake and Grants (fig. 6). Many of the surface-water drainages and arroyos on the northeast and southwest sides of the Zuni uplift follow fault traces.
Strati graphy
The general surficial geology of the study area is shown in figure 4, and the thickness and stratigraphic relations of the various geologic units along selected geologic sections are shown on plate 1. Stratigraphic control was not available in many areas; therefore some thicknesses shown on the geologic sections are estimated. In areas where stratigraphic control was not available, altitudes of formation tops were estimated by subtracting estimated formation thicknesses from the altitude of the base of the Dakota Sandstone (Thaden and Zech, 1984).
14

108°15' 108°00' 107°45' 107°30' 107°15' 107°00'
35°30'
35°15'
35°00(
34045'
34°30'
I I j ; SANDOVAL COUNTY
yBERNALILLO \CQUNTY
\
/./ /
/ 1/! I
"" " CTBOLA NCOUNY
R.15W. R.14W. R.13W. R12W. R11W. R.10W. R.9W. R.8W. R.7W. R.6W. R.5W. R.4W. R.3W. R.2W.
T.15N.
T.14N.
T.13 N.
T.12N.
T.11 N.
T.10N.
T.9N.
T.8N.
T.7N.
T.6N.
T.5N.
T.4N.
T.3N.
Base from U.S. Geological Survey, 1:100,000, Acoma Pueblo, 1978; Grants, 1978; Fence Lake, 1981; Zuni, 1981Geology modified from Gordon (1961), Dane and Bachman (1965), and Maxwell (1981)
10I
20 MILES
i 10 20 KILOMETERS
EXPLANATION
AREA WHERE SAN ANDRES LIMESTONE AND GLORIETA SANDSTONE ARE ABSENT
FAULT -- Dashed where approximately located
Figure 6.--Location of major faults in the study area.
15

Precambrian Rocks
The oldest rocks, igneous and metamorphic rocks of Precambrian age, are exposed in the Zuni Mountains (fig. 4). These rocks consist of granite, gneiss, metarhyolite, schist, and greenstone. The depth to Precambrian rocks increases away from the Zuni uplift. As much as 6,000 feet of younger rocks overlie Precambrian rocks in the northern and eastern parts of the study area (pi. 1), although the total thickness of overlying rocks may exceed 10,000 feet locally in the Mount Taylor area.
Pennsylvanian Rocks
Pennsylvanian rocks include the Sandia Formation and the overlying Madera Limestone. The following summary of these rocks is taken from Kelley and Wood (1946). The Sandia Formation consists of a thin, lower limestone member and an overlying clastic member. About 100 feet of sandstone of this clastic member is exposed in the area of the Lucero uplift. The Sandia Formation has a maximum thickness of about 400 feet, thinning toward the north and west.
The Madera Limestone is composed of three members. In ascending order, they are the Gray Mesa, Atrasado, and Red Tanks Members. The Gray Mesa Member consists of limestone with minor amounts of shale and sandstone. The Atrasado Member consists of limestone, shale, and conglomeratic sandstone. The Red Tanks Member consists of limestone, sandstone, and siltstone. The Madera Limestone is 1,600 to 1,900 feet thick in the area of the Lucero uplift, thinning toward the west (fig. 7). The unit pinches out along a northwest trend in the central part of the area (fig. 7).
Permian Rocks
Permian rocks are, in ascending order, the Abo and Yeso Formations, the Glorieta Sandstone, and the San Andres Limestone. Exposures of these rocks are present in the Zuni Mountains and along the Lucero uplift. Permian rocks are absent in the central part of the Zuni uplift where they have been removed by erosion (fig. 4).
Abo Formation
The Abo Formation is composed of reddish-brown, fine- to coarse-grained sandstone, siltstone, and shale. Conglomerate beds are found in the lower part of the unit. Mud cracks, current ripples, and plant impressions indicate that the Abo Formation was deposited under continental conditions. The Abo Formation conformably overlies Pennsylvanian rocks in the eastern one-half of the study area and unconformably overlies Precambrian rocks west of the zero- thickness line (pinch-out) of Pennsylvanian rocks (fig. 7). A measured thickness of 780 feet is present in the Zuni Mountains (Gordon, 1961, p. 20). Oil-test holes have penetrated about 1,200 feet of Abo Formation in the eastern part of the study area.
16

109 107e
35° -
34° ~
STUDY AREA
BOUNDARY
25 50 MILES_J
I 0 25
EXPLANATION
50 KILOMETERS
500- - - LINE OF EQUAL THICKNESS OF PENNSYLVANIAN ROCKS-Dashed where inferred. Contour interval 500 feet
175? OIL-TEST HOLE-Number indicates thickness of
Pennsylvanian rocks, in feet; ? indicates rocks thought to be Pennsylvanian but not confirmed
57?* LOCATION OF PENNSYLVANIAN ROCK OUTCROP--
Number indicates thickness of Pennsylvanian rocks, in feet; ? indicates rocks thought to be Pennsylvanian but not confirmed
Figure 7.--Thickness of undivided Pennsylvanian rocks in the study area (modified from Foster, 1957).
17
Yeso Formation
The Yeso Formation underlies all of the study area with the exception of an area in the Zuni Mountains and an area in the southeastern part of the Lucero uplift where these rocks have been removed by erosion. The formation conformably overlies the Abo Formation and ranges in thickness from about 800 feet in the Grants-Bluewater area to about 1,400 feet in the eastern part of the study area.
The Yeso Formation is composed of, in ascending order, the Meseta Blanca Sandstone Member and the San Ysidro Member, both marine in origin. The Meseta Blanca Sandstone Member is a crossbedded, fine-grained sandstone with some siltstone in the basal part. In the eastern part of the study area along the Lucero uplift, the sandstone is very friable. The Meseta Blanca Sandstone Member ranges in thickness from 300 to 600 feet in the study area (Baars, 1962, fig. 15). The San Ysidro Member is an evenly bedded clayey sandstone and siltstone. In the eastern part of the study area, the upper one-half of the San Ysidro Member is predominantly gypsum or gypsiferous shale. The thickness of the San Ysidro ranges from 100 to 600 feet (Baars, 1962, fig. 16).
Glorieta Sandstone
The Glorieta Sandstone is present in most of the study area except along the Lucero uplift and in the Zuni Mountains where it has been removed by erosion (fig. 4 and pi. 1). The unit conformably overlies the Yeso Formation. The contact between the two formations is gradational and difficult to determine. In the Grants-Bluewater area, the Glorieta Sandstone consists of 86 to 300 feet of massive, well-sorted and well-cemented, fine- to medium- grained sandstone (Gordon, 1961, p. 24). In the Acoma embayment, samples of the Glorieta Sandstone from test wells drilled from 1984 to 1986 are composed of well-sorted, very fine to medium-grained quartzose sandstone that may contain gypsum. At well 9N.6W.16.Ill, gypsum accounted for 80 of the 120 feet of Glorieta Sandstone drilled. This well probably did not penetrate the entire thickness of the Glorieta Sandstone. The sandstone is commonly pyritic and appears to be massive. At a test well at 8N.6W.20.333, 167 feet of Glorieta Sandstone was penetrated. Along the Lucero uplift, in T. 4 N. , R. 4 W., sec. 10, Jicha (1958, p. 14) reported a thickness of 134 feet of Glorieta Sandstone. Baars (1962, p. 200, fig. 17) showed the Glorieta Sandstone thinning gradually to the northeast to a thickness of about 100 feet in the northeastern part of the study area.
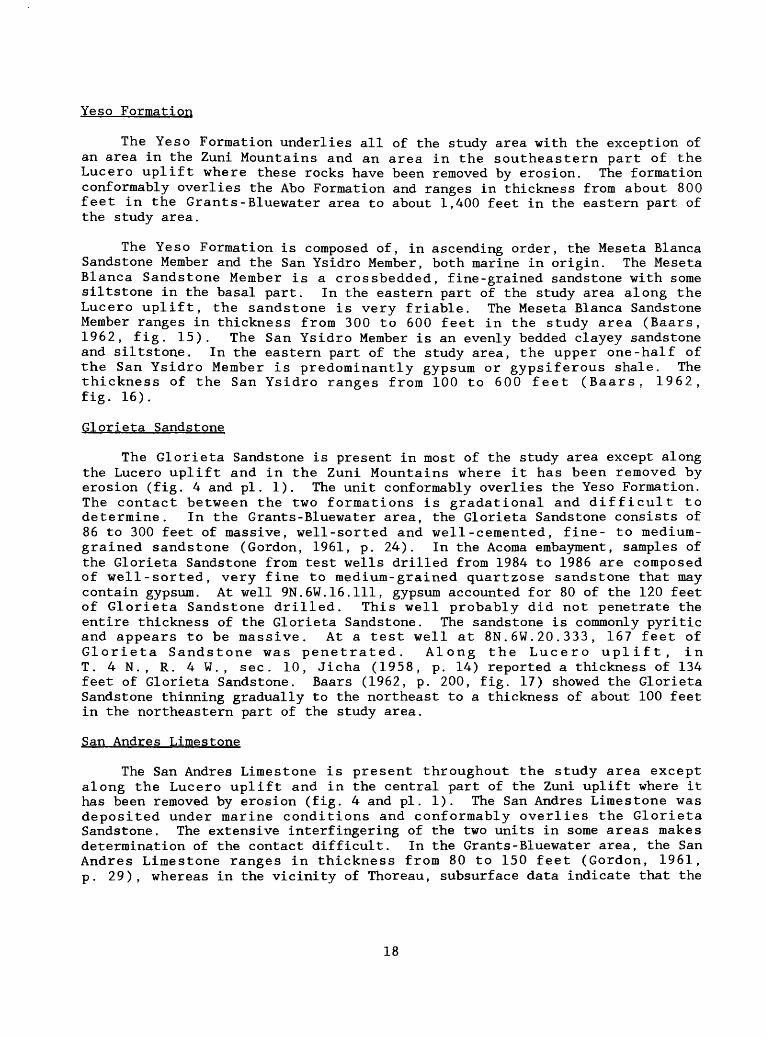
San Andres Limestone
The San Andres Limestone is present throughout the study area except along the Lucero uplift and in the central part of the Zuni uplift where it has been removed by erosion (fig. 4 and pi. 1). The San Andres Limestone was deposited under marine conditions and conformably overlies the Glorieta Sandstone. The extensive interfingering of the two units in some areas makes determination of the contact difficult. In the Grants-Bluewater area, the San Andres Limestone ranges in thickness from 80 to 150 feet (Gordon, 1961, p. 29), whereas in the vicinity of Thoreau, subsurface data indicate that the
18

unit is at most 40 to 50 feet thick and often is absent. The combined thickness of the San Andres Limestone and Glorieta Sandstone is shown in figure 8.
In the Grants-Bluewater area, the San Andres Limestone consists of an upper and lower massive, fossiliferous limestone separated by a middle sandstone unit (Gordon, 1961, p. 27). To the northwest, the upper part of the formation was removed by erosion that occurred during Late Permian and Early Triassic time, and only part of the lower massive limestone remains (Baars, 1962, p. 209). The depositional environment in these areas is believed to have been a shallow shelf carbonate sequence, much like the present-day south Florida coastal area (Baars and Stevenson, 1977, p. 136).
East of the Zuni uplift, the depositional environment (evaporite basin) resulted in a gypsiferous series (Baars, 1962, p. 208), and the thickness increases from about 150 feet in the Grants-Bluewater area to as much as 450 feet in the Lucero uplift. The increased thickness mainly is due to gypsum or anhydrite deposits in the lower part of the San Andres Limestone. Along the Lucero uplift, at T. 6 N., R. 4 W., sec. 35, the San Andres Limestone contains about 55 percent gypsum, 35 percent limestone, and about 10 percent sandstone. The total thickness was estimated to be about 600 to 700 feet. In some areas of the Acoma embayment, intrusive sills occur in the San Andres Limestone. An oil-test hole, 7N.7W.2.414, penetrated about 70 feet of intrusive material in one sill, and test well 8N. 6W. 20.3334 penetrated numerous thin sills in the San Andres Limestone.
The contact between the San Andres Limestone and the overlying Chinle Formation is marked by an erosional unconformity. The erosional period represented by the unconformity lasted from Early Permian to Middle or Late Triassic time (Baars, 1962, p. 209). Erosion appears to have been greater around the Zuni Mountains. This area possibly was uplifted shortly after deposition of the marine deposits of the San Andres Limestone and was at or near land surface for some time. In the Grants-Bluewater area, solution channels and cavernous zones generally are well connected (Gordon, 1961, p. 29). In some areas near Grants, caverns and sinkholes near the top of the San Andres Limestone are filled with Triassic sediments. South and southeast of Grants, cavernous zones in the San Andres Limestone also have been penetrated in oil- and hydrologic-test wells (fig. 8). These cavernous zones indicate that a south-trending structural high existed during this erosional period.
The depth to the top and the altitude of the top of the San Andres Limestone vary throughout the study area, as shown on plate 1 and in figure 9. The formation crops out along the northeast and southwest flanks of the Zuni uplift and along the Lucero uplift. In areas where stratigraphic control was not available, the altitude of the top of the San Andres Limestone was estimated by subtracting estimated formation thicknesses from the altitude of the base of the Dakota Sandstone (Thaden and Zech, 1984). The depth to the top of the San Andres Limestone ranges from zero in the Zuni Mountains to as much as 8,300 feet below land surface in the Mount Taylor area. In the eastern part of the study area, the top of the formation generally is 2,000 to 3,000 feet below land surface. Areas where faulting has created varying amounts of offset in the San Andres Limestone are shown in figure 9.
19

108°15* 108°00' 107°45'
35°30'
35°15'
35°00'
34°45'
34°30'
107°30'
n107° 15' 107°00'
1 T124!
SANDOVAL COUNTY
R.15W. R.14W. R.13W. R.12W. R11W. R.10W. R.9W. R.8W. R7W. R.6W. R.5W. R.4W. R.3W. R.2W.
T.15 N.
T.14N.
T.13 N.
T.12N.
T.11 N.
T.10N.
T.9N.
T.8N.
T.7N.
T.6N.
T.5N.
T.4N.
T.3N.
Base from U.S. Geological Survey, 1:100,000, Acoma Pueblo, 1978; Grants, 1978; Fence Lake, 1981; Zuni, 1981
Geology modified from Gordon (1961), Dane and Bachman (1965), and Maxwell (1981)
10I
20 MILES
10 20 KILOMETERSEXPLANATION
AREA WHERE SAN ANDRES LIMESTONE AND GLORIETA SANDSTONE ARE ABSENT
- FAULT -- Dashed where approximately located
249+
660
3017 LINE OF EQUAL THICKNESS OF THE SAN ANDRES LIMESTONE AND GLORIETA SANDSTONE -- Approximately located. Interval 100 feet
WELL-- Number is thickness of San Andres Limestone and Glorieta Sandstone penetrated by well, in feet. + indicates well did not penetrate entire thickness of both formations
OIL-TEST HOLE OR WELL WHERE CAVERNOUS OR HIGHLY FRACTURED ZONE WAS PENETRATED IN THE SAN ANDRES LIMESTONE AND GLORIETA SANDSTONE- Number is thickness of San Andres Limestone and Glorieta Sandstone penetrated by well, in feet. + indicates well did not penetrate entire thickness of both formations
OUTCROP-- Number is thickness of measured section of San Andres Limestone and Glorieta Sandstone. + indicates entire thickness of both formations was not measured
Figure 8 . --Thickness of undivided San Andres Limestone and Glorieta Sandstone in the study area.
20
,340

108°15' 108°00' 107°45' 107°30' 107°15' 107°00*
35°30' -
35°15
T.15 N.
T.14 N.
T.13 N.
_ T.12N.
T.11 N.
T.10N.
35°00'
34°45'
34°30'
2,142
SANDOVAL COUNTY2500
CATPON COUNTY ?4.76B*4b SOCORRO COU
T.9N.
R.15W. R14W. R.13W. R.12W. R11W. R.1 OW. R.9W. R.8W. R.7W. R.6W. R.5W. R.4W. R.3W. R.2W.
Base from U.S. Geological Survey, 1:100,000, Acoma Pueblo, 1978; Grants, 1978; Fence Lake, 1981; Zuni, 1981Geology modified from Gordon (1961), Dane and Bachman (1965), and Maxwell (1981)
10I
20 MILESI
10 20 KILOMETERS
EXPLANATION
AREA WHERE SAN ANDRES LIMESTONE AND GLORIETA SANDSTONE ARE ABSENT
FAULT - Dashed where approximately located
5000-- STRUCTURE CONTOUR-- Shows approximate altitude of the top of the San Andres Limestone. Dashed where inferred. Contour interval 500 feet. Datum is sea level
6,223WELL- Number is altitude of the San Andres Limestone
surface, in feet above sea level
Figure 9.--Generalized structure contours on the top of the San Andres Limestone surface.
21

Triassic Rocks
Triassic rocks in the study area are represented by the Chinle Formation. The Chinle Formation as described in this report includes the overlying Wingate Sandstone, where present. The Chinle Formation is composed of reddish-brown siltstone and mudstone and grayish-pur pie mudstone. Sandstone beds may be as much as 30 feet thick in the middle part of the Chinle Formation, but these beds vary in thickness over short distances. Lithologic and borehole-geophysical data from seven hydrologic-test wells drilled in the Acoma embayment during this study indicate that the sandstone is clayey or silty or possibly interbedded with clay and silt.
The thickness of the Chinle Formation varies considerably across the study area (fig. 10). The formation is absent in the Zuni uplift and along the Lucero uplift where it has been removed by erosion. The formation thickens toward the north across the Grants-Bluewater valley where the overlying Jurassic and Cretaceous rocks occur and the unit has not been eroded.
South of the Zuni uplift, exposures of the Chinle Formation have been covered by extensive basalt flows on the North Plains, and the zero-thickness and full- (uneroded) thickness lines in figure 10 are based on projections of dip slopes. In The Malpais Valley, south of Grants (fig. 4), exposures of the Chinle Formation also have been covered by extensive basalt flows. Geologic mapping by Maxwell (1981) and Thaden and Zech (1984) indicates that this area is a graben-type structure with bounding faults extending southwest from the vicinity of the Rio San Jose for 30 to 40 miles. Chinle exposures on the west side of The Malpais Valley and test-hole data on the east side of the area indicate that the thickness of the Chinle Formation is partly or completely preserved within the graben feature. Elsewhere in the study area, the thickness of the Chinle Formation ranges from about 1,000 to more than 1,800 feet.
22

108°15' 108°00' 107°45' 107°30' 107°15' 107°00'
35°30'
35°15'
35°00'
34°45'
34°30'-+ -i -+---J-T/-+-
R.15W. R14W. R.13W. R.12W. R.11W. R.10W. R.9W. R.8W. R.7W. R.6W. R.5W. R.4W. R.3W. R2W.
Base from U.S. Geotogica, Survey, ? 1 .° 2.° M ' LES 1:100,000, Acoma Pueblo, 1978; Grants, 1978; I | I Fence Lake, 1981; Zuni, 1981 Q -\Q 20 KILOMETERS Geology modified from Gordon (1961), Dane
T.15N.
T.14 N.
T.13 N.
T.12N.
T.11N.
T.10N.
T.9N.
T.8N.
T.7N.
T.6N.
T.5N.
T.4N.
T.3 N.
and Bachman (1965), and Maxwell (1981)EXPLANATION
AREA WHERE SAN ANDRES LIMESTONE AND GLORIETA SANDSTONE ARE ABSENT
- FAULT -- Dashed where approximately located 500
1,800+
LINE OF EQUAL THICKNESS OF CHINLE FORMATION Dashed where inferred. Contour interval 500 feet, supplemental 250-foot contour
WELL-- Number shows thickness of Chinle Formation. + indicates eroded top of formation
Figure 10.--Thickness of the Chinle Formation in the study area. Water levels are for 1980-86.
23

Rocks Younger Than Triassic and Older Than the Quaternary Valley-Fill Deposits
Rocks that are younger than Triassic and older than the Quaternary valley-fill deposits include sedimentary rocks of Jurassic, Cretaceous, and Tertiary age, and volcanic rocks of Tertiary and Quaternary age (fig. 4). Erosion has removed Jurassic rocks from a large area of the Zuni and Lucero uplifts. Following deposition of Jurassic rocks, the region was tilted toward the north. A long erosional period created a beveled surface on Jurassic rocks from the vicinity of Interstate 40 to the south. Jurassic rocks thin to a feather edge near the southern boundary of Cibola County. The thickest section occurs in the northeastern part of the study area, where about 1,100 feet of Jurassic rocks remain. About one-half of the total thickness is shale and siltstone and one-half is well-cemented sandstone.
Following the erosional period, an estimated 5,000 feet of Cretaceous rocks was deposited (Moench and Schlee, 1967, p. 2). During the last part of the Cretaceous Period, erosion removed a large amount of the original thickness of the rocks from the eastern part of the study area (fig. 4). Cretaceous rocks are about 1,000 feet thick in some parts of the study area; about one-half of this thickness is sandstone and one-half is shale.
Deposits mainly consisting of Tertiary volcanic rocks occur along the southern part of the study area. These deposits are composed of volcanic material interbedded with claystone (Guilinger, 1982, p. 52). The thickness is about 200 to 300 feet. Other Tertiary rocks include basalt flows capping mesas in the southeastern part of the study area and mesas north of Grants (fig. 4). The basalts on mesas in the Grants region probably formed a continuous sheet at the time of deposition, but erosion has since removed much of this material. Tertiary volcanic material forms the Mount Taylor composite volcano.
Quaternary Valley-Fill Deposits
Quaternary valley-fill deposits of significance include alluvium and basalt flows in the Grants-Bluewater area, The Malpais Valley, and the North Plains area (fig. 4). Valley-fill deposits in the Rio San Jose valley downstream from Horace Springs (ION . 9W. 23 . 423 ) are not considered in this discussion because they are separated from the San Andres-Glorieta aquifer by a large thickness of Chinle Formation.
24

A prolonged erosional period followed late Tertiary volcanism that had formed Mount Taylor and the adjacent basalt sheets. Regional drainage at this time was east toward the Rio Grande. In The Malpais Valley and the Rio San Jose valley northwest of Grants, erosion removed all Cretaceous and Jurassic rocks, and streams eroded into the underlying Chinle Formation and older rocks. Gordon (1961, p. 37) estimated that these streams eroded valleys from 150 to 200 feet below the altitude of the present land surface. Factors such as reduced stream gradients or a decrease in the quantity of precipitation caused the incised valleys to begin filling with alluvial deposits of sand, silt, and gravel that reached thicknesses of about 30 feet. Basaltic lava flows began to fill parts of the valleys (Gordon, 1961, p. 37), and deposition of both alluvium and basalt continued. Some interbedded basalt-alluvium sequences have been penetrated during drilling. In most areas, however, the alluvium probably was deposited adjacent to the basalt rather than on its top because of the higher topographic relief of the basalt flows.
In the Grant s-Bluewater area, the alluvium consists of sand, silt, and gravel-sized material. Near the Zuni uplift, the alluvium is composed of limestone, sandstone, and chert fragments, whereas northeast of Milan, the alluvium is composed of fine-grained clay, silt, and sand material derived from Jurassic and Cretaceous rocks to the north (Hydro-Search, Inc., 1981, p. 12). Core-test holes 9N.10W.2.000 and 12N. 11W. 14 . 213 indicate that the basalt is composed of alternating dense and vesicular layers, in some places with lava tubes.
The nature of the valley-fill deposits in The Malpais Valley is less well known. Streamflow from the south toward the Rio San Jose likely formed an ancestral valley. This valley filled with alluvium and basalt that flowed down the surface-water drainages from south to north, in much the same manner as the Rio San Jose valley in the Grants-Bluewater area. Wells have been drilled only along the sides of the valley because of the extremely rough nature of the basalt flows, and no geologic information is available regarding the location, depth, or type of material in the buried valley. The gradient of the ancestral valley probably is similar to that of the ancestral Rio San Jose valley, and the depth near the mouth of the valley would be the same as the ancestral Rio San Jose valley at the confluence. Drilling records from oil-test hole ION. 9W. 21.222 indicate that the valley-fill material is about 200 feet thick at this location.
An examination of topographic maps of the North Plains area indicates that the Continental Divide may have been as much as 20 to 25 miles east of its present position in prevolcanic times. The current location of the divide may be a result of the accumulation of extensive basalt flows and cinder cones extruded along a northeast-trending fault zone beneath the divide (Maxwell, 1981). If so, the drainage area for the ancestral stream draining the North Plains area would have been much smaller than the present drainage area and the ancestral valley may not contain significant thicknesses of alluvium.
25

HYDROGEOLOGY
A conceptual model of the San Andres-Glorieta aquifer was developed by considering all structural, lithologic, and hydrologic data that describe how water enters, moves through, and leaves the aquifer and that describe rocks hydraulically connected to the aquifer. Rock units that are important in this discussion include Quaternary valley-fill deposits, Triassic Chinle Formation, Glorieta Sandstone and San Andres Limestone (San Andres-Glorieta aquifer), the Permian Yeso and Abo Formations, and undifferentiated Pennsylvanian rocks. Rocks of Tertiary, Cretaceous, and Jurassic age are not hydraulically connected to the San Andres-Glorieta aquifer and the hydrogeology of these rocks is not considered.
Valley-Fill Deposits
Quaternary valley-fill deposits, which consist of alluvium and basalt, form an aquifer (alluvial aquifer) of local significance in the Grants- Bluewater area (fig. 11). Saturated alluvium probably also occurs in The Malpais Valley, but little is known about its thickness and extent. In the Grants-Bluewater area, saturated alluvium may rest on the Chinle Formation or on the San Andres-Glorieta aquifer. Northwest of Bluewater, a wedge of Chinle rocks extends up the flanks of the Zuni Mountains, and the alluvial aquifer rests on the Chinle Formation (pi. 1, section A-A'). In this area, the alluvial aquifer is not in direct hydraulic connection with the San Andres- Glorieta aquifer. From Bluewater to Grants, Chinle rocks may be absent, depending on the location of and displacement on faults (pi. 1, section D-D'). Where the alluvial aquifer rests directly on the San Andres-Glorieta aquifer, the two are hydraulically connected. North of Grants and in The Malpais Valley, the alluvial aquifer is separated from the San Andres-Glorieta aquifer by the Chinle Formation and Jurassic and Cretaceous rocks.
Hydraulic Properties
Aquifer-test data from wells in the Bluewater area indicate that hydraulic conductivity of the alluvial aquifer can range from 40 to about 60 feet per day (Dames and Moore, 1981, table 1). East of Horace Springs, hydraulic conductivity of the alluvial aquifer in the Rio San Jose valley ranges from about 2 to 300 feet per day (Risser and Lyford, 1983, table 4). Values of storage coefficient for the alluvial aquifer in the Grants-Bluewater area are not available.
Ground-Water Movement
Recharge to the alluvial aquifer under natural conditions is derived from direct precipitation, surface runoff, leakage of water from streams, spring discharge, and upward leakage from the San Andres-Glorieta aquifer. With development of ground-water resources in the study area, new sources of recharge to the alluvial aquifer have been created by leakage of water from irrigation canals and water applied to irrigated areas, leakage from mill- tailings piles, and recharge from injection wells.
26

108°00' 107°45'
35°15'
35°00'
T.13N.
T.12N.
T.11N.
T.10N.
T.9N.
R.12W.Base from U.S. Geological Survey 1:500,000 State map
R.8W.
10 MILES
0 6 8 10 KILOMETERS
EXPLANATION
V 6.412
WATER-LEVEL CONTOUR-Shows altitude of water level, in feet. Contour interval is 10 feet. Dashed where approximate. Datum is sea level
APPROXIMATE LIMIT OF SATURATED VALLEY-FILL DEPOSITS
FAULT-Bar and ball on downthrown side
WELL USED TO CONSTRUCT WATER-LEVEL CONTOUR- Number is altitude of water level in well, in feet. Datum is sea level
SPRING-Number is altitude of the spring, in feet. Datum is sea level
Figure 11.--Water-level contours for Quaternary valley-fill deposits in the Grants-Bluewater area.
27

The first known human-induced change in recharge to the alluvial aquifer occurred in 1870 when the flow from Ojo del Gallo was diverted for irrigation of 600 acres south of San Rafael (Hodges, 1938, p. 373). During the winter months, the spring was allowed to flow along the original channel. The spring previously had discharged to a marsh and then to a channel that flowed east to the Rio San Jose (Hodges, 1938, p. 340). The effects of this diversion on the alluvial aquifer are not well known. Recharge to the alluvium along the original drainage path probably continued, but evapotranspiration probably also occurred, especially in the marsh area. Leakage from the diversion ditch to the alluvium most likely took place, as did recharge from excess irrigation water, but evapotranspiration from the irrigation process may have been less than evapotranspiration from the marsh.
Irrigation south of San Rafael continued until the early 1950's when discharge from Ojo del Gallo ceased. Recharge to the alluvial aquifer east of Ojo del Gallo decreased, starting in the early 1950's when the discharge from the spring no longer flowed east toward the Rio San Jose. Water levels are not available from wells completed in alluvium immediately east of Ojo del Gallo, but wells ION. 9W.17 .113, ION. 9W. 29 .132 , and ION . 9W. 31. 324 , which are from 3.6 to 5.6 miles southeast of Ojo del Gallo, had water-level declines of about 6 feet from the early 1950's to 1984. These water-level declines may be partially due to a decrease in recharge to the alluvium from Ojo del Gallo.
In the Bluewater area, human-related recharge to the alluvial aquifer began with surface-water diversions for irrigation from Bluewater Creek. Hodges (1938, p. 373) noted that "prior to 1895, 200 acres was watered by an old ditch." Presumably this ditch diverted water directly from Bluewater Creek. An earthen dam was built on Bluewater Creek at the present site of Bluewater Dam in 1894. During 1895, storage from this reservoir was used to irrigate 1,600 acres northwest of Bluewater (Hodges, 1938, p. 373). Irrigation from reservoir releases continued until 1905 when the dam washed out. A second earthen dam was constructed at the same location but washed out in September 1909. From 1909 to 1927, some 2,000 to 2,500 acres in the Bluewater area was irrigated by diversions from Bluewater Creek (Gordon, 1961, p. 13). The present Bluewater Dam, constructed in 1927, was built to create a reservoir capable of supplying water to 10,627 acres, but runoff has been sufficient to irrigate only a small part of the original acreage. Gordon (1961, p. 14) noted that from 1944 to 1961, surface water was available only in 1948, 1949, and 1952 to irrigate 1,500 to 2,000 acres.
Additional recharge to the alluvial aquifer in the Grants-Bluewater area began in 1945 when ground water withdrawn from the San Andres-Glorieta aquifer was used for irrigation. This recharge was a result of leakage from canals and infiltration of water from this applied irrigation. Because of the lack of surface-water runoff, ground water primarily was used for irrigation from 1945 through the early 1970's. Acreage irrigated by ground water began to decline in 1955 as ground water used for agriculture was converted to industrial use (Gordon, 1961, p. 103). Conversations with irrigation district personnel indicate that this decline continued until the early 1970's, when little or no ground water was used for irrigation. Recharge to the alluvial aquifer from this source would have decreased in a like manner.
28

Leakage from ponds within tailings piles northeast of Bluewater, north of Grants, and north of Milan also has resulted in recharge to the alluvial aquifer. Water-level changes in a well at 12N.11W.14.213 indicate that recharge from a pond in a nearby tailings pile reached the well during 1956. Studies indicate that recharge from the tailings pond was as large as 1,025 gallons per minute in 1958, but decreased to a few gallons per minute from 1967 through late 1972 (Dames and Moore, 1986, p. 11). Recharge from the tailings pile ponds to the alluvial aquifer may have increased from 1973 to 1977 (Dames and Moore, 1986, p. 11).
Another source of recharge to the alluvial aquifer is a system of injection wells installed around a tailings pile north of Grants. Water for these wells is withdrawn from the San Andres-Glorieta aquifer and injected into the alluvial aquifer to create a ground-water mound downgradient of the tailings pile, thus preventing contaminated recharge from the mill tailings ponds from migrating off the site.
The direction of ground-water movement through the alluvial aquifer generally is the same as the direction of surface-water movement. The direction and rate of movement are controlled by the thickness and hydraulic conductivity of the aquifer and the volume and location of recharge. Water moves through the aquifer toward the southeast in the Rio San Jose valley (fig. 11). Some water moves from the north through alluvium in the San Mateo Creek drainage. Ground water probably moves northward toward the Rio San Jose in The Malpais Valley. The potentiometric surfaces of the alluvial aquifer and the San Andres-Glorieta aquifer intersect in the northwestern part of T. 11 N. , R. 10 W. (Gordon, 1961, pi. 2). Northwest of this area, hydraulic heads in the alluvial aquifer are higher than those in the San Andres-Glorieta aquifer. Southwest of this area, potentiometric levels in the alluvial aquifer are lower than those in the San Andres-Glorieta aquifer.
Discharge from the alluvial aquifer is by downward leakage to the San Andres-Glorieta aquifer, evapotranspiration, discharge to streams, and withdrawals by wells. Evapotranspiration from the alluvial aquifer occurs from Grants southeast to Horace Springs in the Rio San Jose valley. Southeast of the fault at Grants (fig. 6), the water table is at or near land surface, as evidenced by standing water or light-colored deposits of salt on the ground. Water in this area may represent water from the San Andres-Glorieta aquifer that leaks up along the fault and enters the alluvium. The alluvium apparently is not transmissive enough to conduct the volume of leakage from the fault. Another area of evapotranspiration is east of Ojo del Gallo. Under natural conditions, evapotranspiration from the marsh east of the spring must have been large in the summer months. Evapotranspiration from this area probably decreased from the mid-1950's through the early 1980's when Ojo del Gallo was dry. Evapotranspiration probably has begun to increase in this area with the resumption of spring flow.
29

Chinle Formation
The Chinle Formation acts as a confining unit for the underlying San Andres-Glorieta aquifer. The effectiveness of this confining unit depends on the thickness and lithology of the formation. Fracturing and faulting probably have little effect on the confining nature of the rocks because the large clay content probably enables the rocks to deform and squeeze close in fault or fracture zones. During the drilling of test holes east of the Zuni uplift, clay zones in the Chinle Formation were penetrated that squeezed in and tended to seal the drill holes.
Hydraulic Properties
Hydraulic properties of the Chinle Formation are based on reported values. Laboratory tests performed on shale samples indicate that hydraulic- conductivity values can range from 10-1 to 10- 8 feet per day (Wolff, 1981, table 4.5). Heath (1983, p. 13) noted that hydraulic-conductivity values for unfractured shales can range from 10- 5 to 10- 8 feet per day.
Ground-Water Movement
The Chinle Formation probably does not contain regional ground-water flow systems in the study area. Precipitation and surface runoff recharge either the overlying alluvium or the underlying San Andres-Glorieta aquifer. Recharge to and discharge from Chinle rocks are mostly by upward and downward leakage of water through the formation. In the area around the Zuni uplift near Grants and Bluewater, some vertical leakage through Chinle rocks to the San Andres-Glorieta aquifer may occur, but hydraulic-head differences between the overlying alluvium and the underlying aquifer usually are small, thus leakage probably is small.
In areas near the Zuni uplift where hydraulic head in the San Andres- Glorieta aquifer is higher than that in the alluvium, the difference also usually is small. East of San Rafael, the potentiometric surface in the alluvial material slopes toward the east, whereas the potentiometric surface of the San Andres-Glorieta aquifer is relatively flat from San Rafael east. This results in an increasing head differential toward the east, but the thickness of the Chinle Formation also increases toward the east (fig. 10), which results in more resistance to leakage. The result probably is very little upward leakage through the Chinle Formation in this area.
San Andres-Glorieta Aquifer
The San Andres-Glorieta aquifer is the major regional aquifer in west- central New Mexico and east-central Arizona. The San Andres Limestone and the Glorieta Sandstone are considered to form one aquifer because of the gradational contact and good hydraulic connection between the units.
30
Most water in the aquifer is transmitted in solution channels, cavernous zones, and fractures in the San Andres Limestone. In the Grants-Bluewater area, these channels, zones, and fractures generally are well connected (Gordon, 1961, p. 29). These features are believed to be most well developed near the Zuni uplift where the rocks were subjected to weathering, solution activity, and fracturing during periods of uplift and exposure. Areas of the aquifer farther from the uplift would be less affected by these conditions. Northwest of Bluewater, prolonged erosion has removed most or all of the San Andres Limestone.
Hydraulic Properties
To prepare a regional description of the hydraulic properties of the San Andres-Glorieta aquifer, areas of the aquifer that were subject to erosion and formation of fractures and solution channels were considered along with data from aquifer testing. In the Grants-Bluewater area, hydraulic data are available from numerous aquifer tests. In the northwestern part and the eastern half of the study area, the data on these properties are sparse; thus estimates of the properties were made from a few wells.
Temperature effects were not taken into account when estimating hydraulic properties of the aquifer. These effects are not significant in the Grants- Bluewater area where water temperatures in the aquifer generally are less than 20 degrees Celsius. In the eastern half of the study area, however, temperature effects on transmissivity may be important. Throughout much of the eastern half of the study area (Acoma embayment), about 3,000 feet of rocks overlie the aquifer, and in some areas, 5,000 feet of rocks overlie the aquifer. In addition to the great depth of burial, heat-flow data indicate a geothermal anomaly in the study area (Reiter and others, 1975, p. 817). Temperatures of water from seven hydrologic-test wells in the Acoma embayment and completed in the San Andres-Glorieta aquifer range from 33.5 to 56.8 degrees Celsius (table 2). Hydraulic conductivity of rocks at temperatures greater than 46 degrees Celsius is more than double that at 16 degrees Celsius because increases in temperature result in decreases in the viscosity of water (Todd, 1959, fig. 3.3).
The study area was divided into seven transmissivity zones (zones I-VII) that were delineated on the basis of aquifer-test results and lithology (fig. 12 and table 3). The slope of the potentiometric surface (fig. 13) also was used to help delineate transmissivity zones. The potentiometric-surf ace map was constructed on the basis of data presented in table 1.
An area with measured transmissivity values ranging from 30 to 280 feet squared per day is in the northwest part of the study area (zone I, fig. 12). Lithologic information indicates that the San Andres Limestone is either absent or very thin (fig. 12), and that the transmissivity is representative of Glorieta Sandstone. A representative transmissivity for the zone is estimated to be 140 feet squared per day.
31

108°15' 108°00' 107°45* 107°30' 107°15' 107°00'
35°30'
35°15' -
T.15N.
T.14N.
T.13 N.
_ T.12N.
T.11N.
T.10N.
35°00' -
34°45' -
34°30'
T.9N.
R.15W. R.14W. R13W. R.12W. R11W. R.10W. R.9W. R.8W.
Base from U.S. Geological Survey,1:100,000, Acoma Pueblo, 1978; Grants, 1978;Fence Lake. 1981; Zuni, 1981Geology modified from Gordon (1961), Daneand Bachman (1965), and Maxwell (1981)
R.7W. R6W. R.5W. R.4W. R.3W. R.2W. 0 10 20 MILESh I
10 20 KILOMETERS
EXPLANATION
AREA WHERE SAN ANDRES LIMESTONE AND GLORIETA SANDSTONE ARE ABSENT
- FAULT -- Dashed where approximately located
1 -f J40 TRANSMISSIVITY ZONE BOUNDARY-Numberis estimated transmissivity, in feet squared per day
IE] LITHOLOGIC COMPOSITION OF SAN ANDRES- ,BJ GLORIETA AQUIFER, IN PERCENT OF ROCK
TYPE, FROM TOP TO BOTTOM-Carbonates, sandstone, evaporites, and shale
° OIL-TEST HOLE OR WELL WHERE CAVERNOUS OR HIGHLY FRACTURED ZONE WAS PENETRATED IN THE SAN ANDRES-GLORIETA AQUIFER
25WELL WITH TRANSMISSIVITY DATA-Number is transmissivity, in feet squared per day
Figure 12.--Generalized transmissivity zones for the San Andres-Glorieta aquifer.
32

108°15' 108°00' 107°45' 107°30' 107°15' 107°00'
35°30'
35°15'
35°00'
34°45'
34°30*
\l/ T SANDOVAL COUNTY
! ' , l-\r -TpT'T\ :/ j '
SOCORfcO COUNTY {j|£Ip#\CATJRON COUNTY" 'i"~ ~t"
R.15W. R.14W. R.13W. R.12W. R.11W. R.10W. R.9W. R.8W. R.7W. R.6W. R.5W. R.4W. R.3W. R.2W.
Base from U.S. Geological Survey, I_________i_________i1:100,000, Acoma Pueblo, 1978; Grants, 1978; I
Fence Lake, 1981; Zunl, 1981 QGeology modified from Gordon (1961), Daneand Bachman (1965), and Maxwell (1981) FYPI AMATIHM
T.15 N.
T.14 N.
T.13N.
T.12N.
T.11N.
T.10N.
T.9N.
T.8N.
T.7N.
T.6N.
T.5N.
T.4N.
T.3 N.
10 20 KILOMETERS
AREA WHERE SAN ANDRES LIMESTONE AND GLORIETA SANDSTONE ARE ABSENT
6800 POTENTIOMETRIC CONTOUR-- Shows altitude at which water level would have stood in tightly cased wells. Dashed where approximate. Contour interval 100 feet, supplemental 50-foot contour. Datum is sea level
APPROXI MATE LIMIT OF SATURATED SAN ANDRES-GLORIETA AQUIFER
- FAULT-- Heavy line indicates fault zone where offset is believed to impede ground-water flow in San Andres-Glorieta aquifer
WELL USED TO CONSTRUCT POTENTIOMETRIC- SURFACE CONTOURS
^ SPRING
Figure 13.--Potentiometric-surface contours for the San Andres- Glorieta aquifer, drawn on the basis of the highest hydraulic-head values on record.
33

In the next zone to the east, zone II, lithologic and aquifer-test data are available for only one well (13N.11W.33.332). The San Andres Limestone is absent at this well, but aquifer-test data indicate a transmissivity of 24,000 feet squared per day. This well is adjacent to the Big Draw fault (of Green and Pierson, 1971) and probably is completed in fractured Glorieta Sandstone. This would account for the large transmissivity at this well. The transmissivity of this zone is estimated to be 10,000 feet squared per day.
Zone III includes the Grants-Bluewater area and has measured values of transmissivity that range from 100 to 450,000 feet squared per day (table 3). Well yields of as much as 2,830 gallons per minute have been recorded (Gordon, 1961, p. 105). Cavernous zones, faults, and fractures are common throughout this area, and the large range in transmissivity reflects well completions in various configurations of the faulted, fractured, and cavernous carbonate terrain.
The potentiometric surface of the San Andres-Glorieta aquifer in zone III slopes very gently to the east (fig. 13): gradients range from about 8 feet per mile in the western part to less than 1 foot per mile east toward Grants (Hydro-Search, Inc., 1981, p. 20). This gently sloping surface indicates that the aquifer is highly transmissive and that water moves through the aquifer with little loss of hydraulic head.
Areas of less transmissive aquifer material, such as dense, unweathered limestone or well - cemented, nonfractured sandstone, or both, and the proportion of this small-transmissivity area to the large-transmissivity area need to be taken into account when estimating the areawide transmissivity of zone III. The relative proportions are unknown, but the small-transmissivity area probably is a significant part of the total aquifer framework. An estimated transmissivity of 50,000 feet squared per day was assigned to this zone .
Freeze and Cherry (1979, p. 29) and Heath (1983, p. 13) noted that hydraulic conductivity for cavernous limestone can range from 1 to 1 x 10 4 feet per day. Assuming an average limestone thickness of 110 feet in the Grants -Bluewater area (Gordon, 1961, p. 29), this would result in a transmissivity range of 110 to 1.1 x 10 6 feet squared per day for the San Andres Limestone. Although the estimated transmissivity is small in comparison to this range, much of the aquifer in the northeastern part of zone III is believed to consist of small-transmissivity material, which effectively reduces the overall transmissivity of the zone.
The boundaries of transmissivity zone IV, north of the Grant s-Bluewater area (fig. 12), were drawn on the basis of aquifer-test results from well 14N. 10W. 22.414 (Jacob, 1956, p. A-30). Those test results indicate that the transmissivity in the vicinity of the well is about 850 feet squared per day. In this zone, the aquifer thins toward the north (fig. 8) and probably does not have major fractured or cavernous zones. The transmissivity of this zone is estimated to be 800 feet squared per day.
34

A transmissivity of 50,000 feet squared per day has been estimated for zone V, using lithologic and hydrologic data from eight hydrologic- and oil- test wells. Zone V is east and south of the Zuni uplift (fig. 12). Within this zone, calculated transmissivity values range from 70 to greater than 200,000 feet squared per day.
Cavernous or highly fractured rock zones have been penetrated in six wells in the area (fig. 12). Caverns as much as 15 feet deep were penetrated while drilling hydrologic-test wells from 1984 to 1986. The existence of cavernous zones indicates that these areas were near land surface following deposition of the San Andres Limestone because large cavernous zones are generally formed when limestones are close to land surface or the area of limestone dissolution is in close proximity to the saturated-unsaturated zone interface. This area probably was a southeastern continuation of the Zuni uplift.
The cavernous and fractured rock zones in transmissivity zone V probably account for only part of the total aquifer framework, as in transmissivity zone III. Data from hydrologic-test well 6N. 10W. 7 .1413 (fig. 12) indicate that the San Andres Limestone is dense and noncavernous and that it contains evaporites. Similar small-transmissivity areas probably exist throughout this zone. It is possible that large- and small-transmissivity areas are aligned in response to structural or erosional patterns within the zone and that the large -transmissivity areas are interconnected. The virtually flat potentiometric surface in zone V (fig. 13) suggests a good hydraulic connection throughout the zone. The existence of a good hydraulic connection between wells at ION. 9W. 25 . 324 (Anzac 86-1) and 9N . 9W. 28 .1344 (Acoma 1) was confirmed during aquifer testing conducted in July 1986. These wells are about 35,000 feet apart, and aquifer testing at Anzac 86-1 resulted in measurable drawdown and recovery at Acoma 1.
Zones VI and VII, which are southeast of Grants (fig. 12), have smaller transmissivity values than areas to the west. On the basis of lithologic and hydrologic data from seven wells, the transmissivity for zones VI and VII is estimated to be 150 feet and 10 feet squared per day, respectively. These two zones are partly within the evaporite basin (Baars, 1962, p. 208). The northern parts of these two zones may represent an offshore depositional environment where carbonates were not deposited. An oil-test well, 13N.4W.2.000, penetrated shale rather than the carbonate-sandstone sequence of the San Andres-Glorieta aquifer (fig. 12).
35

When hydraulic heads decline in a confined aquifer such as the San Andres-Glorieta aquifer, water released from storage comes from compression of the aquifer framework and expansion of water. The nature of the storage coefficient gives an indication of the compressibility of the aquifer framework when those head declines occur. Dividing the storage coefficient by the aquifer thickness yields specific storage, defined as the volume of water released from storage from a unit volume of aquifer under a unit decline in hydraulic head. The part of specific storage that is due to expansion of water has been shown to be about 3 x 10- 7 per foot, using a porosity of 0.2 (Heath, 1983, p. 28). The difference between this number and the total specific storage is due to compression of the aquifer. In unconfined aquifers, the storage term is referred to as specific yield. Specific yields are generally much larger than storage coefficients in confined aquifers because specific yield includes the dewatering of the aquifer in addition to the expansion of water and aquifer compaction.
Eighteen published values of storage coefficient for the San Andres- Glorieta aquifer and the Glorieta Sandstone range from 1.2 x 10- 2 to 5.3 x 10- 5 (table 4) (Gordon, 1961, table 8; Dames and Moore, 1981, table 1). These values were calculated using data collected from four aquifer tests that used one to three observation wells. Several methods of analysis were used to calculate the storage coefficients using drawdown and recovery data from the aquifer tests. The largest storage coefficient measured, 1.2 x 10- 2 , is large for a confined aquifer storage coefficient (Freeze and Cherry, 1979, p. 60-61) and probably represents unconfined conditions in the aquifer (specific yield). The smallest storage coefficient, 5.3 x 10- 5 , was calculated for a well completed in the Glorieta Sandstone (12N.10W.18.312) where the sandstone thickness is 278 feet. This gives a specific storage of about 2 x 10- 7 per foot, which is about the same as the specific storage resulting from the expansion of water as discussed earlier. This indicates that the Glorieta Sandstone is incompressible.
Joints, fractures, and faults in the San Andres-Glorieta aquifer can create anisotropy (variations in hydraulic conductivity with direction of measurement). In areas where the amount of offset of faults is slight, hydraulic conductivity in a particular direction may be enhanced by development of solution channels along fault zones in the San Andres Limestone and by fracturing in the Glorieta Sandstone. Joint sets in the aquifer framework also may result in anisotropy. Kelley and Clinton (1960, p. 45) noted that joints in the Glorieta Sandstone occur regularly with respect to the strike and dip of the beds, as opposed to the San Andres Limestone, where joint-set orientations display little regularity. In the northwestern part of the study area where only the Glorieta Sandstone is present, a regular joint set may produce fewer anisotropy effects than where both the San Andres Limestone and Glorieta Sandstone are present.
36

Ground-Water Movement
Recharge to the San Andres-Glorieta aquifer occurs on outcrops along the Zuni uplift by direct precipitation or by infiltration of surface flow. The quantity of recharge from infiltration of precipitation is related to the outcrop area of the aquifer. Along the east side of the Zuni uplift, the outcrop area of the San Andres-Glorieta aquifer is narrow, whereas along the north side of the Zuni uplift, the outcrop area is more extensive (fig. 4). There probably is significantly more recharge to the San Andres-Glorieta aquifer from infiltration of precipitation along the north side of the Zuni uplift compared to the east side of the Zuni uplift. Along the southwestern side of the Zuni uplift, springs along the outcrop of the aquifer are believed to represent areas where the aquifer is unable to transmit all the available recharge (Orr, 1982, p. 42). Springs have not been observed on the aquifer outcrop in the study area, indicating that the aquifer is able to transmit all available recharge.
On the southern end of the Zuni uplift, recharge to the San Andres- Glorieta aquifer may occur where the aquifer subcrops beneath the volcanic rocks in The Malpais Valley. This area does not have an obvious surface-water drainage system. In the spring of 1985, a surface flow estimated to be about 5 cubic feet per second was observed emerging from a drainage on the south side of the Zuni uplift (T. 9 N., R. 12 W., sec. 12). This water flowed south into The Malpais Valley where presumably most of it recharged the aquifer.
Another source of recharge to the San Andres-Glorieta aquifer is leakage of water from Bluewater Lake. The San Andres-Glorieta aquifer crops out under part of Bluewater Lake. There was recharge from Bluewater Lake from 1894 to 1909, when an earthen dam was in place on Bluewater Creek, and from 1927 to the present (1988) because the present concrete dam was built in 1927. The amount of leakage to the aquifer probably varies as a function of pool altitude in the reservoir. Some of the leakage from Bluewater Lake flows back into Bluewater Creek just downstream from the dam. After it leaves the dam, the creek turns sharply to the north and closely parallels the east shore of the reservoir for about a mile. At one point in this reach, only about 800 feet of rock separate the creek from the reservoir. Some water that leaks into rocks along the eastern side of the reservoir moves eastward and discharges to the northward-flowing segment of Bluewater Creek. Discharge measurements made on April 4, 1986, indicate that the discharge in the creek increased from about 50 to 150 gallons per minute at the dam to about 1,700 gallons per minute at a gaging site about 1 mile northeast of the dam. The creek turns toward the east near this gaging site, and little additional discharge is gained by the creek downstream from this gaging site. A discharge measurement of about 1,800 gallons per minute was made at a site about 5 miles east of the dam on the same day (near the diversion at T. 12 N., R. 11 W., sec. 8).
37

Ground water that discharges to Bluewater Creek flows east and continues down the Rio San Jose. East of Big Draw fault, the course of the Rio San Jose parallels the contact between the Chinle Formation and the San Andres Limestone and the stream loses water (fig. 10). In this reach, the creek flows over alluvium underlain by the San Andres Limestone or flows directly on the San Andres Limestone. Leakage from the Rio San Jose and from canals and ditches of the Bluewater-Toltec Irrigation District moves downward to recharge the alluvium and the San Andres-Glorieta aquifer. Strearaflow decreases with downstream distance from the mouth of Bluewater Canyon. The Rio San Jose flows into a borrow pit (T. 12 N. , R. 11 W., NW 1/4 of sec. 25) and, under low-flow conditions, no surface water flows out of this pit, indicating that recharge occurs in the area of the borrow pit or that all of the water in the borrow pit is evaporated. Some recharge also may occur from downward leakage of irrigation water applied to fields in the Grants-Bluewater area.
Recharge to the aquifer from rocks above and below can occur when hydraulic heads in the adjacent rocks are higher than those in the aquifer. Few data are available to determine areas where leakage of water from adjacent rocks enters the San Andres-Glorieta aquifer, but in general, ground water near the Zuni uplift leaks downward to the aquifer from overlying rocks. Farther from the uplift, the aquifer is under a greater confining pressure, and leakage into the aquifer probably is not significant.
Ground water moves outward from the Zuni uplift, as shown by potentioraetric-surf ace contours for the San Andres-Glorieta aquifer prepared using water-level data from stock, irrigation, and domestic wells and from hydrologic-test wells drilled in the eastern part of the study area (figs. 13 and 14 and table 1). In the northwestern part of the study area, ground water moves toward the northeast. The direction of movement turns to the east at distance from the Zuni uplift. A northeast-trending fault east of Grants with as much as 2,900 feet of displacement completely offsets the aquifer, creating a barrier to ground-water flow.
South of the Zuni uplift, ground water moves south, away from the uplift, and the direction of movement is roughly parallel to the Continental Divide. The two faults south of the Zuni uplift appear to act as a barrier to prevent ground water moving to the east (fig. 13). The aquifer is completely offset along the west fault from the southeastern end of the Zuni uplift to about the middle of T. 6 N. , R. 12 W. (fig. 9). The hydraulic-head difference between wells located on the east and west sides of the two faults (6N.10W. 7.141 and 7N.12W.13.244) is about 100 feet (water level on the west side of the fault is higher), whereas the head difference between two wells immediately east of the faults is less than 10 feet (fig. 13). The head difference across the fault indicates that the faults are a barrier to ground-water flow.
38

108°15' 108° 7* 30" 108°00' 107°52'30"
35°22'30"
35°15'
35° T 30" -
T.14N.
T.13N.
T.12N.
T.11N.
T.10N.
R. 13 W.Base from U.S. Geological Survey 1 .'500.000 Stale map
6440
R. 12 W.
EXPLANATION
R. 11 W. R. 10 W. R.9W.
10 MILESl
8 10 KILOMETERS
POTENTIOMETRIC CONTOUR-Shows altitude at which water level would have stood in tightly cased wells, 1980-86. Dashed where approximately located. Contour interval 100 feet, supplemental 20-foot contours. Datum is sea level
APPROXIMATE LIMIT OF SATURATED SAN ANDRES- GLORIETA AQUIFER
FAULT-Dashed where approximately located. Bar and ball on downthrown side
WELL USED TO CONSTRUCT POTENTIOMETRIC CONTOURS-Well pumped for domestic use
WELL PUMPED FOR MUNICIPAL OR INDUSTRIAL USE-- Water levels for the period 1980- 86 generally not available for these wells, thus these wells were not used to construct potentiometric contours. Number in parentheses indicates number of wells at that location
°^ SPRINGFigure 14.--Potentiometric-surface contours for the San Andres-
Glorieta aquifer in the Grants-Bluewater area.
(4)
39

In the southeastern part of the study area, geochemical data (Goff and others, 1983) and sparse water-level data indicate that water moves west through the aquifer from recharge areas along the western flanks of the Lucero uplift (fig. 13). Recharge probably is small in this area because of the small amount of precipitation, large evapotranspiration rates, limited outcrop areas, and the extremely small transmissivity of the aquifer in this area. The ground water in this area probably moves west a short distance and then moves northward or leaks downward into the Pennsylvanian rocks. This is discussed in more detail later in the geochemistry section of the report.
The slope of the potentiometric surface ranges from about 130 feet per mile northeast of Bluewater Lake to essentially a flat surface for an area east of the Zuni uplift (fig. 13). Hydro-Search, Inc. (1981, p. 20) reported a slope on the potentiometric surface of 1 foot per mile or less south and east of the Anaconda Mill near Bluewater. The method used to establish land- surface altitudes at wells was not reported. Land-surface altitudes for wells used in the construction of the potentiometric map (fig. 13) were determined from Geological Survey 7 1/2-minute quadrangles. The land-surf ace altitudes may be in error by as much as plus or minus 10 feet (one-half of the contour interval).
Density-related effects were not considered in the discussion of ground- water movement through the aquifer. If ground-water flow is strictly horizontal (dip of aquifer less than 3 degrees), density-related gravity effects are not significant; also, variations in fluid density may be expressed as equivalent freshwater head (Davies, 1987, p. 889). Density effects may be significant in areas where a combination of dipping aquifer, flat potentiometric surface, and large concentrations of dissolved solids in the water exists. One area where the above factors exist is east of Grants, where the aquifer dips into the Acoma embayment (fig. 9). The dissolved- solids concentration in water from well 10.9.25.3241 is 7,000 mg/L, and the potentiometric surface in a large area north and south of this well has a small hydraulic gradient (fig. 13). Density-related gravity effects may be a significant component of ground-water flow in this area.
Discharge from the San Andres-Glorieta aquifer includes spring discharge, withdrawal by wells, evapotranspiration, leakage to adjacent rocks, and underflow out of the study area. Prior to development of the San Andres- Glorieta aquifer near Grants, Ojo del Gallo (rooster spring) probably was a major discharge point for that part of the aquifer lying northwest of Grants. The earliest recorded discharge of the spring was recorded by Hodges (1938, p. 339); the discharge during August and November 1937 was 7 cubic feet per second. On January 19, 1938, the discharge was estimated to be 5.2 to 5.7 cubic feet per second (Hodges, 1938, p. 339-340).
These discharges may not represent natural discharge conditions at the spring. Bluewater Dam was constructed in 1927, and surface water has been applied to fields in the Grants-Bluewater area since that time. Morgan (1938, p. 11-12) noted that reservoir leakage and irrigation infiltration to the aquifer might be greater than natural streamflow leakage, which would result in larger discharges at Ojo del Gallo. Water levels in the aquifer in the Bluewater area were reported to have risen during 1931-37, preceding the 1937 measurement and 1938 estimate of discharge at the spring (Morgan, 1938, p. 13).
40

Discharge at Ojo del Gallo may be affected by long-term precipitation trends in the study area. Above- or below-average precipitation can result in more or less recharge to the ground-water system, which in turn affects the amount of water discharging from the aquifer. Long-term trends in precipitation are shown in graphs of cumulative departure from mean precipitation (fig. 15). Steeply rising or declining parts of the curves indicate where, for several years, the recorded precipitation differed from the mean (Risser, 1982, p. 8). From the mid-1920's to the late 1930's, precipitation was greater than the mean, as seen in the cumulative departure curves for five stations in the study area (fig. 15). This could result in greater-than-average recharge to the aquifer, which may have been in part responsible for the rise in water levels noted in wells in the Bluewater area during the 1930's (Morgan, 1938, p. 13).
Discharge from the San Andres-Glorieta aquifer in the Grants-Bluewater area increased substantially in the mid-1940's when wells began to withdraw water for irrigation. Prior to this time, domestic and stock wells withdrew water from the aquifer, but the total volume was small. In 1945, seven irrigation wells withdrew water from the aquifer. By 1955, the number had increased to 22 (Gordon, 1961, table 7). About 85 percent of the 13,600 acre- feet of water withdrawn from the aquifer in 1955 was used for irrigation, and the rest was used for industrial and municipal use (table 5). During 1945-53, discharge at Ojo del Gallo, decreased from 4.63 cubic feet per second on October 3, 1946 (C.V. Theis, U.S. Geological Survey, written commun., 1949), to a quantity insufficient for irrigation of gardens in 1953 (Gordon, 1961, p. 47). This decrease in discharge from Ojo del Gallo probably was partially due to the large amount of ground-water withdrawal from the San Andres- Glorieta aquifer in the Grants-Bluewater area.
The discovery of uranium ore north of Grants in 1955, a population increase in the Grants-Bluewater area, and a decline in the amount of land irrigated by ground water led to major changes in ground-water use in the area. Changes in the use of ground water resulted in changes in the location of ground-water withdrawals and in the volumes of ground water pumped from a specific location. A change from irrigation use to industrial or municipal use resulted in the drilling of new wells and a large volume of water pumped from several specific wells rather than smaller volumes pumped from many wells. By 1956 industrial use accounted for about 32 percent of the 14,210 acre-feet withdrawn, and irrigation use decreased to about 65 percent (table 5). The remainder was for municipal use. Several of the irrigation wells were converted to industrial use after 1956, and withdrawals from the aquifer decreased from the peak withdrawal in 1956. Of the approximately 6,700 acre-feet pumped in 1979 (table 5), industrial use accounted for 56 percent and municipal use accounted for 44 percent (C.A. Wohlenberg, New Mexico State Engineer Office, written commun., 1983). By 1982, ground water for industrial use had decreased substantially to about 38 percent of the 3,900 acre-feet pumped (table 5) (C.A. Wohlenberg, written commun., 1983).
41
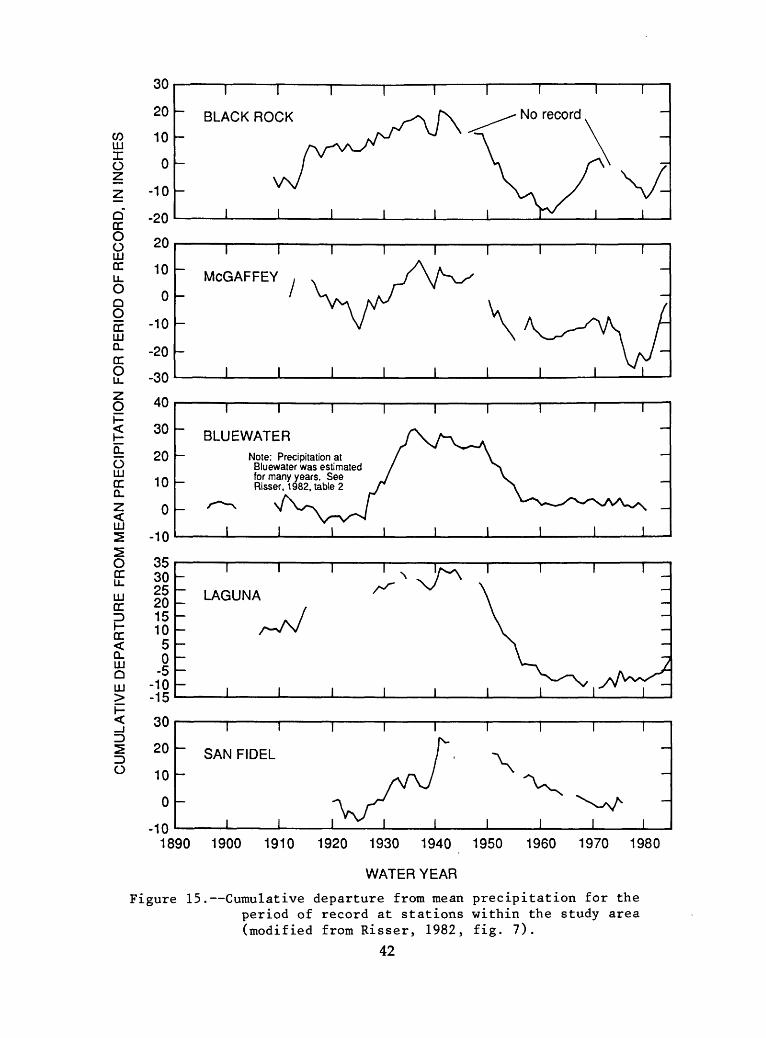
111Xoz
o rr O O LLJ rrUL OOOrrHI Q.rr OUL
O
IQ. OHI CC Q.Z<HI 2
Orr u_HI rr
CC<Q. HI QHI
O
30
20
10
0
-10
-20
20
10
0
-10
-20
-30
40
30
20
10
0
-10
353025201510
50-5
-10-15
30
20
10
0
-10
I I
BLACK ROCK
McGAFFEY
I I I
BLUEWATER
Note: Precipitation at Bluewater was estimated for many years. See Risser, 1982, table 2
I I
LAGUNA
SAN FIDEL
1890 1900 1910 1920 1930 1940 1950 1960 1970 1980
WATER YEAR
Figure 15. Cumulative departure from mean precipitation for the period of record at stations within the study area (modified from Risser, 1982, fig. 7).
42

Discharge at Ojo del Gallo was absent from 1953 to 1982, although a small pool was observed at the spring site in the fall of 1979 and on May 14, 1980 (U.S. Bureau of Indian Affairs, 1984, p. 22). On February 18, 1983, a discharge of 0.03 cubic foot per second was measured at the spring, which increased to 1.72 cubic feet per second by February 1986 (U.S. Geological Survey measurements). Since 1979, precipitation at most stations has been several inches greater than the mean (fig. 15). This precipitation trend and the decreases in ground-water withdrawals in the Grants-Bluewater area since 1956 may be factors in the increase in discharge at Ojo del Gallo.
Horace Springs (10.9.23.423) is another possible source of discharge from the San Andres-Glorieta aquifer. Water discharges at Horace Springs where the Rio San Jose valley becomes constricted as it cuts through eastward-dipping bedrock. Discharge at Horace Springs may have at least three sources: (1) water that discharges along the fault at Grants and moves east through the alluvium along the Rio San Jose valley, (2) discharge from Ojo del Gallo Spring that moves east toward the Rio San Jose, and (3) water that moves north in the alluvium of The Malpais Valley. Water in the alluvium of The Malpais Valley probably comes from recharge from precipitation. Little or no upward leakage of water probably occurs from the San Andres-Glorieta aquifer to alluvium in the vicinity of Horace Springs. The Chinle Formation underlies the Rio San Jose valley, having a minimum thickness of 100 to 200 feet near the Zuni uplift and increasing to a thickness of about 1,000 feet in the vicinity of oil-test hole 10.9.21.222 (pi. 1, section C-C'). Hydraulic-head differences between the San Andres-Glorieta aquifer and the overlying alluvium range from zero along the western side of the valley west of Grants to about 150 feet higher in the San Andres-Glorieta aquifer compared to the alluvial aquifer near Horace Springs. Water discharging from Horace Springs probably is ground water flowing eastward in the alluvium that is forced to the surface because of a reduction in the cross-sectional area of the permeable alluvial deposits in "the Rio San Jose valley. Discharge from Horace Springs and the source of this discharge are discussed in more detail in the water-chemistry section of this report.
The discharge at Horace Springs contributes most of the flow of the Rio San Jose downstream from Horace Springs excluding storm runoff (Risser, 1982, p. 29). The discharge has been estimated to be about 4.9 cubic feet per second, exclusive of storm runoff and wastewater from Grants (Risser, 1982, p. 31).
Upward leakage of water to the Chinle Formation or downward leakage through the Yeso and Abo Formations to Pennsylvanian rocks may be sources of discharge from the San Andres-Glorieta aquifer east of the Zuni uplift. Springs discharging from Pennsylvanian rocks along the Lucero uplift may represent leakage from the San Andres-Glorieta aquifer. In either case, the large thickness and small hydraulic conductivity of the units above and below the San Andres-Glorieta aquifer probably limit the amount of leakage. Given the limited outcrop of the aquifer east of the Zuni uplift, recharge to the system may be small, and therefore the volume of water moving through and discharging from the aquifer may be correspondingly small.
43

Underflow from the aquifer out of the study area is another source of discharge. Although quantifying underflow from the aquifer is not possible, knowledge of the lithologic and geologic conditions aids in making conceptual scenarios. The regional discharge area for ground water from the study area, on the basis of the potentiometric-surface map, is the Rio Grande rift (figs. 5 and 13). The San Andres-Glorieta aquifer is absent over much of the Lucero uplift, and recharge to the San Andres-Glorieta aquifer occurs in parts of the Lucero uplift. , Ground water flows northwest from this recharge area, thus ground water can flow east into the Rio Grande rift only through the area of the Rio Puerco fault zone (fig. 5). The large number of large offsets of some of the faults in the Rio Puerco fault zone probably have displaced the San Andres-Glorieta aquifer against fine-grained sediments in some areas. Potentiometric levels in the aquifer in the rift are 600 to 1,250 feet lower than those in the San Andres-Glorieta aquifer in the eastern part of the study area (fig. 13; Kernodle and Scott, 1986, fig. 8); thus the quantity of leakage from the aquifer into rift sediments probably is very small because of the limited area in which discharge can occur, the complex nature of the Rio Puerco fault zone, and the large difference in potentiometric levels in the Rio Grande rift sediments and the San Andres-Glorieta aquifer adjacent to the rift.
Potentiometric contours indicate that water moves toward the southeast in the southeastern part of the study area except adjacent to the Lucero uplift, where recharge occurs and ground water moves west (fig. 13). No discharge points from the San Andres-Glorieta aquifer are known to exist in this area. Spiegel (1955, p. 67) noted that a spring flowing from the Madera Limestone discharges about 500 gallons per minute into the Rio Salado just south of the study area. Water from this spring may represent discharge from the San Andres-Glorieta aquifer that has leaked downward from the aquifer through Yeso and Abo strata to Pennsylvanian rocks; however, because of the limited amount of data in this area, this hypothesis cannot be proven. This hypothesis is discussed in more detail later in the report in the water chemistry section.
Water-Level Changes due to Changes in Precipitation and Ground-Water Withdrawals
Water levels in the San Andres-Glorieta aquifer correlate with the quantity of precipitation and the quantity of ground-water withdrawals. Long- term water-level trends in the San Andres-Glorieta aquifer have been monitored in the Grants-Bluewater area since the early 1940's (fig. 16). Monitoring began at approximately the same time as irrigation pumpage from the aquifer. The hydrographs from wells completed in the San Andres-Glorieta aquifer are similar, indicating declines in water levels from the time monitoring began through about 1962. Water levels declined more than 70 feet in well 12N.11W.9.221 from 1946 to 1957 (fig. 16). Ground-water withdrawals also increased significantly during this time (table 5). From 1962 to 1979, water levels generally recovered and declined twice. From 1979 to the present (1988), water levels have recovered throughout the Grants-Bluewater area, and from 1980 to the present ground-water withdrawals have decreased (fig. 16 and table 5).
44

20
25
30
35
40
45
50
55
60
10N.10W.26.331 350346107521201
11N.10W.9.221 351211107532901
15
20
25
30
35
40
95
100
105
110
115
120
I ISan Andres- Glorieta aquifer
12N.10W.20.333A 351452107552301
125
I ISan Andres- Glorieta aquifer
6,430
6,425
6,420
6,415
6,410
6,405
6,400
6,395
6,390
12N.10W.23.233 351519107513901
11N.10W.27.241 350923107522701
6,460
6,455 ccUJ
1940 1950 1960 1970 1980
6,450
6,445
6,440
6,475
6,470
6,465
6,460
6,455
6,450
6,445
120
130
140
150
160
170
105
115125
135
145
155
165
175185
195
9095
100105110115120
125130135
140
80
85
90
95
100
105
1 TSan Andres- Glorieta aquifer
12N.11W.9.221 351719107594901
12N.11W.9.424 351651107594501
12N.11W.14.213 351630107572801
San Andres-Glorieta aquifer and Yeso For mation
1940 1950 1960 1970 1980
6,472
6,462
6,452
6,442
6,432
6,422
6,544
6,534
6,524
6,514
6,504 uJ 6,494 UJ
6,484 <
6,474 »
6,464 > 6,454 m
tuui
6,550 "-6,545 -_ 6,540 QJ"
6,535 u!i 6,530 ^ 6,525 £ 6,520 | 6,515 6,510 6,505 6,500
6,525
6,520
6,515
6,510
6,505
6,500
Figure 16.--Water-level hydrographs for wells in the Grants-Bluewater area.
45

A comparison of cumulative departure from mean precipitation at McGaffey, ground-water withdrawals, and water levels from well 12N. 11W. 9.424 shows a close correlation (fig. 17). Prior to 1956, most ground-water withdrawals were used for irrigation purposes. Withdrawals were probably related to the amount of precipitation because during years of less-than-normal precipitation more ground water was needed for irrigation purposes to compensate for the decreases in the amount of soil moisture. After 1956, many irrigation wells were taken out of production and a larger part of total ground-water withdrawals was for municipal and industrial use. The volume of ground-water withdrawals for municipal and industrial use would not be related to the amount of precipitation to the extent of ground-water withdrawal for irrigation purposes. The large decline in water levels in well 12N.11W.9.424 from 1946 to 1957 was probably due to a combination of large increases in ground-water withdrawals and less-than-normal precipitation (fig. 17). The increase in water levels in well 12N.11W.9.424 from 1957 to 1960 was probably due to greater-than-normal precipitation and to decreases in ground-water withdrawals. Although ground-water withdrawal data do not exist from 1958 to 1978, the existing data indicate that ground-water withdrawals generally decreased during this time. Comparison of the cumulative departure from mean precipitation and water levels in well 12N. 11W. 9.424 indicates that water levels increased during periods of greater-than-normal precipitation and decreased during periods of less-than-normal precipitation from 1958 to 1978 (fig. 17). The decrease in ground-water withdrawals and greater-than-normal precipitation during 1979 to 1985 resulted in significant increases in water levels (fig. 17).
Yeso and Abo Formations
The Yeso and Abo Formations are believed to function as a leaky confining unit, separating the overlying San Andres-Glorieta aquifer from the underlying Pennsylvanian rocks. The Yeso Formation was deposited under restricted marine conditions and the Abo Formation was deposited under subcontinental and continental conditions (Kelley and Wood, 1946). As a result, these rocks contain a smaller percentage of carbonates and a larger percentage of siltstone, shale, and sandstone than Pennsylvanian rocks (table 6).
Hydraulic Properties
Hydraulic conductivity for the Yeso and Abo Formations was measured from core samples from well 12N.10W.8.314 (West, 1972). Values of horizontal hydraulic conductivity for tested intervals from 613 to 1,818 feet below land surface ranged from 3 x 10- 4 to 0.6 foot per day; the largest horizontal hydraulic conductivity was for the Meseta Blanca Sandstone Member of the Yeso Formation. With the exception of the Meseta Blanca Sandstone, values of horizontal hydraulic conductivity for the Yeso and Abo Formations ranged from 3 x 10- 4 to 1 x 10- 2 foot per day. A weighted average horizontal hydraulic conductivity of 2.5 x 10- 2 foot per day was calculated for the tested interval. Horizontal hydraulic conductivity for the Yeso Formation in the eastern part of the study area may be smaller than in the Grants-Bluewater area because of a larger percentage of evaporites in the eastern part of the study area. Transmissivity for a 2,000-foot-thick section of the Yeso and Abo Formations may be about 50 feet squared per day, assuming a horizontal hydraulic conductivity of 2.5 x 10- 2 foot per day.
46

5,000
10,000
CC CCOQ15,000
Zz- 20
<cc<Q.O
>ZQ
OCCO
10
0
-10
-20
-30
|- UJ UJO UJ <u. u.
_jcoUJ Q> zUJ <-J _JCC ^£oguj ^ m
9095
100105110115120125130135140
12N.11W.9.424 351651107594501
No record
6,550 6,545 H 6,540 ffl 6,535 z 6,530 _j 6,525 > 6,520 6,515 6,510 6,505 6,500
1910 1920 1930 1940 1950 1960 1970 1980
Figure 17.--Comparison of water levels, ground-water withdrawals, and cumulative departure from mean precipitation for the Grants-Bluewater area.
47

Vertical hydraulic conductivity also was measured from core samples from the Yeso and Abo Formations at well 12N.10W.8.314 (West, 1972, table 4 3). Measured values of vertical hydraulic conductivity ranged from 2.2 x 10 to 0.4 foot per day. The horizontal to vertical anisotropy ratio ranged from 0.4 to 5.0 for tested intervals from 613 to 1,490 feet below land surface. A weighted average anisotropy ratio of 2.0 was calculated for the same interval. In the eastern part of the study area, this ratio may be larger due to interbedded evaporite deposits in the Yeso Formation.
Ground-Water Movement
Some ground water may enter the Yeso and Abo Formations around the margins of the Zuni uplift. However, horizontal movement of ground water in the fine-grained Yeso and Abo Formations is believed to be so small that regional ground-water flow patterns would not exist in these rocks.
Most ground water probably enters the Yeso and Abo Formations as downward leakage from the overlying San Andres-Glorieta aquifer. The quantity of downward leakage probably is small near the Zuni uplift, increasing toward the east as confining pressures in the San Andres-Glorieta aquifer increase. The quantity of downward leakage through the Yeso Formation probably is less in areas that have deposits of evaporite materials. Downward leakage of water through Yeso and Abo rocks north of the Zuni uplift also may increase with distance from the uplift as confining pressure in the San Andres-Glorieta aquifer increases. In 1960, the water level in a monitoring well completed in the San Andres-Glorieta aquifer was within a foot of the water level in a disposal well (12N.10W.8.314) completed in the Yeso and Abo Formations approximately 300 feet away (West, 1972, p. 17). In 1960, large withdrawals from the San Andres-Glorieta aquifer had resulted in water-level declines of several tens of feet in the San Andres-Glorieta aquifer in this area. If the 1960 water level in the Yeso and Abo Formations at this monitoring well was not affected by withdrawals from the San Andres-Glorieta aquifer in this area, water levels under predevelopment conditions in the San Andres-Glorieta aquifer would have been higher than the water levels in the Yeso and Abo Formations. These conditions would result in the possibility of downward leakage of water from the San Andres-Glorieta aquifer into the Yeso and Abo Formations.
Discharge of water from the Yeso and Abo Formations occurs by leakage into overlying and underlying rocks, depending on the water-level relations between the Yeso and Abo Formations and the overlying and underlying rocks. In general, discharge from the Yeso and Abo Formations probably occurs by downward leakage into underlying rocks. Several springs in the Lucero uplift area discharge from the Yeso and Abo Formations; however, the source of water could come from the Pennsylvanian rocks because of the large number of faults and dikes in the area.
48

Pennsylvanian Rocks
Limestone, dolomite, sandstone, and shale of Pennsylvanian age occur throughout most of the eastern part of the study area (fig. 7). Direct measurements of aquifer properties and potentiometric head are not available for Pennsylvanian rocks because no water wells have been completed in these rocks.
Hydraulic Properties
Hydraulic conductivity was estimated by comparing lithologies from seven oil-test holes with hydraulic-conductivity values for similar rocks. The oil- test holes are in the area of the Lucero uplift, where Pennsylvanian rocks are from 1,000 to 1,500 feet thick (fig. 7). Lithologic data indicate that carbonates account for about one-half of the total thickness of Pennsylvanian rocks in this area (table 6). The carbonates generally are limestone that commonly is fossiliferous. No fractures or cavernous zones were noted in drilling reports. Siltstone and shale account for about 42 percent of the total Pennsylvanian thickness (table 6); most of this percentage is reported to be shale. Freeze and Cherry (1979, table 2.2) indicated that values of hydraulic conductivity for limestone and dolomite (carbonates) can range from about 5 x 10- 4 to 1 foot per day; values of hydraulic conductivity for shale are several orders of magnitude less than limestone. Because of this contrast in hydraulic conductivity, carbonates probably transmit most of the water in Pennsylvanian rocks, and the horizontal hydraulic conductivity of these rocks can range from 5 x 10- 4 to 1 foot per day. Transmissivity for a 1,000-foot- thick section could range from 0.5 to 1,000 feet squared per day.
Lithologic logs of Pennsylvanian rocks in the study area indicate that the carbonates commonly are interbedded with shale and, to a lesser extent, siltstone. This stratigraphic sequence probably imparts a regional anisotropy to ground-water flow in Pennsylvanian rocks. Freeze and Cherry (1979, p. 34) noted that regional anisotropy ratios of 100:1 are common in layered systems. A ratio of this magnitude would make horizontal ground-water movement more predominant than vertical movement.
Ground-Water Movement
The source of recharge to the Pennsylvanian rocks is not well known. No significant recharge can enter Pennsylvanian rocks in the Zuni uplift because these rocks generally do not crop out in the uplift; these rocks generally pinch out east of the uplift (fig. 7). Ground water may leak downward through the Yeso and Abo Formations into Pennsylvanian rocks east of the Zuni uplift where the San Andres-Glorieta aquifer is under larger confining pressure than it is nearer to the outcrop. Faults and dikes may act as conduits for leakage in this area. East of the Zuni uplift, Pennsylvanian rocks become progressively thicker and could transmit more ground water than they could closer to the uplift (fig. 7).
49

The potentiometric surface for Pennsylvanian rocks has not been determined because no wells have been completed in these rocks. However, the general direction of ground-water movement probably is from west to east toward the Rio Grande rift because numerous springs issue from the Pennsylvanian rocks near the Lucero uplift, indicating that this is a discharge area for the ground-water flow system.
Discharge of water from Pennsylvanian rocks occurs at springs along the east side of the Lucero uplift. Spring deposits are present along the eastern side of the Lucero uplift (fig. 4), which have been inventoried by Wright (1946), Goff and others (1983), and Risser and Lyford (1983). Discharge of most of these springs is difficult to measure accurately because it commonly occurs as seeps or as small spring pools along arroyos. Wright (1946, table 6) pointed out this problem when he measured a cumulative discharge of about 3 gallons per minute from 14 individual springs in a small area. A discharge of about 33 gallons per minute was measured in a channel draining the area of the same springs (Wright, 1946). In addition, these discharge measurements do not account for the amount of discharge that is lost to evaporation, which probably is substantial. As an example, an area of several springs at T. 6 N., R. 3 W., sec. 5 was visited during summer 1986. Discharge from this spring area creates wet areas and pools for about one-half mile downstream, and the wetted area is about 100 feet wide. The evaporation rate in the Lucero uplift area is about 60 inches per year (U.S. Department of Agriculture, 1972). Discharge by evaporation could amount to about 20 gallons per minute from the wetted area. Wright (1946, table 6) listed the discharge downstream from this spring area as about 5 gallons per minute. No information is available regarding discharge by evaporation for other springs in the Lucero uplift; therefore, spring discharge from Pennsylvanian rocks cannot be estimated.
Discharge of water from the Madera Limestone into the Rio Salado southeast of the study area has been estimated to be about 500 gallons per minute (Spiegel, 1955, p. 67). Additional subsurface discharge from Pennsylvanian rocks into Quaternary and Tertiary rocks in the Rio Grande rift and subsurface discharge from Pennsylvanian rocks toward the north and northeast out of the study area also may occur.
50

GROUND-WATER CHEMISTRY
Because an understanding of ground-water chemistry can help define the flow system, the chemistry of ground water in the Thoreau, Grants-Bluewater, and Acoma embayment areas is described (fig. 18). Water chemistry in other parts of the study area is not discussed because of a lack of data. The division between areas is somewhat arbitrary but generally is based on differences in water chemistry, characteristics of the ground-water flow system, and the availability of data. The water chemistry of the area south and west of the Zuni Mountains was not examined.
Most of the water-chemistry data used in this study are U.S. Geological Survey-collected data that are stored in the Survey's water-quality data base. Additional data were obtained from consulting reports, the New Mexico Environmental Improvement Division, and the U.S. Bureau of Indian Affairs. In general, only water-chemistry data from the San Andres-Glorieta aquifer are included in this report. In the eastern part of the Acoma embayment area, however, water-chemistry data from other aquifers have been included because these data are useful in understanding the flow system of the San Andres- Glorieta aquifer. Piper diagrams are used in the discussion of water chemistry. For a complete discussion of Piper diagrams and their use, the reader is referred to Piper (1944) and to Freeze and Cherry (1979, p. 249-254).
The two types of permeability in the San Andres-Glorieta aquifer are: primary permeability (that of the rock matrix) and secondary permeability (that due to fractures or cavernous zones). Thus, ground water flows in the rock matrix and also through fractures or cavernous zones. Flow generally is more rapid in cavernous zones and fractures than flow through the rock matrix.
The chemical composition of water in the San Andres-Glorieta aquifer is a function of the composition of the water that recharges the aquifer, mineralogy of the aquifer, length of time water has been in the aquifer (residence time), and the concentration of individual dissolved constituents. Different minerals in the aquifer have different solubilities or resistances to withstand dissolution. The chemical composition of ground water is dependent on the residence time because the longer the water is in the aquifer, the greater the probability that the water has come in contact with and has dissolved soluble minerals. Cavernous zones in the aquifer indicate that water in the unsaturated zone or ground water has dissolved aquifer material and transported it in solution downgradient (down a flow path) . As mentioned earlier, some or most of the cavernous zones probably were formed during Late Permian-Early Triassic time; however, in general, dissolution of aquifer material is occurring continuously.
51

108°15' 108°00' 107°45' 107°30' 107°15' 107°00'
35°30'
35°15'
T.15N.
T.14N.
T.13N.
_ T.12N.
T.11 N.
T.10N.
35°00'
34°45'
34°30'
THORJEAU AK'EA \ ' ' ' , SANDOVAL COUNTY
/-
EMBAYMENT
CATION COUNTY
T.9N.
R.15W. R.14W. R.13W. R.12W. R.11W. R.1 OW. R.9W. R.8W. R.7W. R.6W. R.5W. R.4W. R.3W. R.2W.0 10 20 MILES
Base from U.S. Geological Survey, 1:100,000, Acoma Pueblo, 1978; Grants, 1978; Fence Lake. 1981; Zuni, 1981Geology modified from Gordon (1961), Dane and Bachman (1965), and Maxwell (1981)
10
I10 20 KILOMETERS
EXPLANATION
AREA WHERE SAN ANDRES LIMESTONE AND GLORIETA SANDSTONE ARE ABSENT
FAULT -- Dashed where approximately located
BOUNDARY OF AREAS REFERRED TO IN DISCUSSION OF GROUND-WATER CHEMISTRY
6400 POTENTIOMETRIC CONTOUR- Shpws altitude at which water level would have stood in tightly cased wells. Dashed where approximately located. Contour interval 100 feet. Datum is sea level
8,000WELL-Numberis specific conductance, in microsiemens
per centimeter at 25 degrees Celsius
Figure 18.--Ground-water-chemistry discussion area, potentiometric surface, and specific conductance of water from the San Andres-Glorieta aquifer.
52

As ground water moves from recharge areas down a flow path, the concentration of dissolved ions in the water generally increases. Ground water in recharge areas is precipitation and surface water that infiltrates through the unsaturated zone or soil zone and into the aquifer. Most recharge to the aquifer occurs in outcrop areas. Very little or no recharge can occur if the aquifer is covered by relatively small permeability, fine-grained material, such as that in the Chinle Formation. Recharge water generally contains gases such as carbon dioxide and small concentrations of dissolved ions. Because the dissolution of limestone (composed mainly of the mineral calcite, which is a calcium carbonate), a major component of the San Andres- Glorieta aquifer, is affected by the concentration of carbon dioxide in water in contact with the limestone, carbon dioxide-rich ground water near recharge areas can readily dissolve limestone. The amount of readily soluble material in the aquifer at any point is a function of the amount of water that has come in contact with or flowed by a particular mineral grain and in part of the concentration of dissolved ions in the water. For example, gypsum (calcium sulfate), a soluble mineral found in the San Andres-Glorieta aquifer, may be completely dissolved and removed from the aquifer in recharge areas. Ground water near this recharge area would not contain significant quantities of dissolved sulfate because the source of soluble sulfate already has been dissolved and flushed from this part of the aquifer.
Thoreau Area
The Thoreau area is in the northwestern part of the study area near Townships 12-15 and Ranges 11-15 (fig. 18). The eastern boundary of this area is somewhat arbitrary but generally is based on a difference in specific conductance of ground water and a change in potentiometric gradient. The specific conductance of ground water in the Thoreau area generally is less than that in the Grants-Bluewater area to the east. The potentiometric gradient is steep in the Thoreau area, whereas it is virtually flat in the Grants-Bluewater area. The southern boundary is the southern extent of the outcrop area of the San Andres-Glorieta aquifer. The western boundary is also that of the area of investigation. The northern boundary is based solely on the northern extent of available water-chemistry data.
Ground-water chemistry is variable in the Thoreau area. Specific conductance ranges from 470 to 1,390 microsiemens (microsiemens per centimeter at 25 degrees Celsius) (fig. 19 and table 7).
53

108°30' 108°15' 108°00'
35°30'
35°15' -
14 400180 6MJ1,100
~27 5 410180 " 7
38 1.190
1982
analysis15 84 SO 3 18 470
R.16W. R.15W. R.14W. R.13W.
8 10 MILESI___I
R.12W. R.11W.
i i r i i I02468 10 KILOMETERS
Sodium plus potassium Calcium
- 14 180
Magnesium 55
EXPLANATION
490-Sulfate 6 Chloride 1,190 Specific
conductance
WELL--lncludes water-chemistry constituent values. All values in milligrams per liter except specific conductance, in microsiemens per centimeter at 25 degrees Celsius; -, no value
Figure 19.--Selected chemical analyses of water from wells completed in the San Andres-Glofieta aquifer in the Thoreau area.
54

Calcium and magnesium are the dominant cations in most ground water in the Thoreau area (fig. 20). Water from wells 15N. 12W. 17. Ill (1977 analysis) and 14N.13W.19.100 (1964 analysis) has sodium as the dominant cation (table 7 and fig. 20). Water from these two wells also has large chloride concentrations (130 and 44 mg/L) relative to other water in the area. Water from wells 15N . 12W. 17 . Ill and 14N. 13W. 19 .100 has large changes in chemistry with respect to time (table 7): in a sample collected in December 1975 from well 15N. 12W. 17 . Ill, the calcium concentration was 54 mg/L and the chloride concentration was 1.8 mg/L, whereas in a sample collected in February 1977 the calcium concentration was 6 mg/L and the chloride concentration was 130 mg/L (table 7). In a sample collected in March 1964 from well 14N.13W.19 .100, the calcium concentration was 10 mg/L and the chloride concentration was 44 mg/L, whereas in a sample collected in July 1970 the calcium concentration was 31 mg/L and the chloride concentration was 150 mg/L (table 7). The reason for the large change in the water chemistry from these wells is unknown. A possible explanation for the relatively large sodium and chloride concentrations in water from these wells may be that the wells are completed in other aquifers in addition to the San Andres-Glorieta aquifer.
Chloride concentrations in ground water in the Thoreau area generally are less than 13 mg/L (fig. 19) and generally are less than chloride concentrations elsewhere in the study area. The small concentrations of chloride could be due to several reasons. Precipitation generally has chloride concentrations less than 4 mg/L. If a large percentage of precipitation infiltrates and recharges the ground-water system relative to the amount of precipitation that evaporates, chloride concentrations in the ground water would be expected to be small. Smaller amounts of disseminated halite (sodium chloride) in the aquifer in the Thoreau area relative to other areas also would explain the relatively small chloride concentrations in ground water in this area because there are few or no sources of chloride in the aquifer.
Water from wells 13N.13W.22.1333 (1985 analysis) and 14N.13W.20 . 4322 has sodium concentrations of 77 and 43 mg/L, respectively, which generally are larger than the sodium concentrations in most ground water in the Thoreau area (table 6). The percentage of sodium relative to other cations is approximately 42 in water from these wells, which also is large compared with other ground water in the area (fig. 20). Well-completion information indicates that these wells are completed in the Glorieta Sandstone (table 7). The relatively large sodium concentrations in water from these wells may indicate that ion exchange, whereby calcium in solution replaces sodium ions on clays, is an important process affecting the chemistry of this water. However, water from other wells completed in the Glorieta Sandstone does not have these relatively large sodium concentrations (table 7).
55

Calcium Chloride
CATIONS ANIONS
PERCENTAGE OF TOTAL IONS, IN MILLIEQUIVALENTS PER LITER
EXPLANATION
+ 15N.12W.17.111 1977 ANALYSIS
x 14N.13W.19.100 1964 ANALYSIS
O 13N.13W.22.133 1985 ANALYSIS
14N.13W.20.432 1975 ANALYSIS
* WATER FROM OTHER WELLS IN AREA
Figure 20.--Piper diagram of selected chemical analyses of water from wells completed in the San Andres-Glorieta aquifer in the Thoreau area.
56

The percentage of bicarbonate and sulfate in water from the San Andres- Glorieta aquifer falls into two general groups (fig. 20). One group has 20 to 50 percent bicarbonate (50 to 80 percent sulfate), and the other group has 60 to 85 percent bicarbonate (10 to 40 percent sulfate). An areal plot of the molar ratio of bicarbonate to sulfate (fig. 21) (bicarbonate concentration/61.0/sulfate concentration/96.0) indicates that water from wells in T. 12 N., R. 12 W. and in T. 14 N., R. 15 W. generally has the smallest molar ratios, thus relatively more dissolved sulfate than bicarbonate compared with other wells in the area. Water from these wells also has larger concentrations of sulfate than water from other wells (fig. 19). The larger quantity of dissolved sulfate in water from these wells indicates that the dissolution of gypsum (calcium sulfate) is a relatively more significant process in the evolution of this water compared with other water in the Thoreau area. This also indicates more gypsum in the aquifer in this area (T. 12 N., R. 12 W., and T. 14 N., R. 15 W.) than in other areas or more fractures and thus more flow of ground water in fractures in the area having smaller sulfate concentrations (larger bicarbonate to sulfate molar ratios) (fig. 21).
Grants-Bluewater Area
The Grants-Bluewater area is in Townships 9-14 and Ranges 10 and 11 (fig. 18). The eastern boundary, which is somewhat arbitrary, is based primarily on the location of available ground-water-chemistry data and on the inclusion of ground water that is representative of recharge to the ground- water system from the eastern side of the Zuni uplift. The southern boundary is the southern extent of the outcrop area of the San Andres-Glorieta aquifer. The western boundary was chosen on the basis of a change in specific conductance and potentiometric gradient. The northern boundary is based on the availability of water-chemistry data.
Ground-water chemistry in the Grants-Bluewater area is variable with large differences in concentrations of dissolved constituents in water from adjacent wells (pi. 2 and table 8). The concentration of dissolved constituents in ground water in the Grants-Bluewater area generally is much greater than that in ground water in the Thoreau area (pi. 2 and fig. 19). The proportion of individual dissolved constituents, however, is relatively consistent (fig. 22). Most ground water in the Grants-Bluewater area has cations that are 30 to 60 percent calcium (15 to 47 percent sodium) and anions that are 40 to 60 percent sulfate (30 to 55 percent bicarbonate) (fig. 22). This relatively consistent proportion of dissolved constituents is unusual considering the large variation in the concentration of dissolved constituents.
57

108°30' 108°15' 108°00'
35°30f P
35°15'h
R.16W. R.15W. R.14W. R.13W. R.12W. R.11W.
2 4I I
8 10 MILESI I I 1 ~l"~l
02468 10 KILOMETERS
EXPLANATION8.6 WELL-- Number is molar ratio of bicarbonate concentration
to sulfate concentration
Figure 21.--Molar ratio of bicarbonate concentration to sulfate concentrationin water from selected wells completed in the San Andres-Glorieta aquifer in the Thoreau area.
58

Calcium Chloride
CATIONS ANIONS
PERCENTAGE OF TOTAL IONS, IN MILLIEQUIVALENTS PER LITER
Figure 22.--Piper diagram of selected chemical analyses of water from wells completed in the San Andres-Glorieta aquifer in the Grants-Bluewater area.
59

The variability of dissolved constituents in water from adjacent wells indicates that ground water has dissolved different quantities of aquifer material. This could be due to variation in the composition of the aquifer or could be the result of some ground water flowing in fractures or cavernous zones, where flow rates are faster and there is less soluble material than for ground water flowing through the rock matrix for the same distance of travel . In reality, water at a particular point in the aquifer probably has flowed through fractures or cavernous zones and through the rock matrix, and the water chemistry at any point is in part a function of the distance the water has traveled through these two different types of voids in the aquifer. The fact that there is no large variation in the proportions of individual dissolved constituents indicates that the mineralogy of the aquifer is relatively homogeneous and thus the same chemical processes affect the ground- water chemistry throughout the Grants-Bluewater area.
Water from wells 9N . 10W. 10 . 414 and 9N. 10W. 15 . 212 near the southeastern outcrop area (recharge area) of the San Andres-Glorieta aquifer generally has less dissolved ions (smaller specific conductance) and a larger proportion of bicarbonate relative to sulfate than water from other wells in the Grants- Bluewater area. Water from these wells contains greater than 70 percent bicarbonate (fig. 22). Ground water in this area has smaller sulfate concentrations than elsewhere possibly because (1) there is less gypsum in the aquifer in this area, or (2) the ground water in this area may not have been in the aquifer long enough to come in contact with and dissolve much gypsum.
There have been large ground-water withdrawals from the San Andres- Glorieta aquifer in the Grants-Bluewater area. The use of ground water for irrigation purposes started in 1944; by 1946, 16 wells were used for irrigation, and by 1954, 28 wells were used for irrigation (Gordon, 1961, p. 51). From 1946 to 1955, 4,000 to 6,000 acres were irrigated with ground water (Gordon, 1961, p. 103). Large-scale industrial use of ground water started in 1951. By 1955, ground-water withdrawals for agricultural use began to decline, whereas ground-water withdrawals for industrial use increased (Gordon, 1961, p. 103). This change in ground-water use was accompanied by changes in the location of ground-water withdrawals and thus changes in the location of water-level declines.
Lowering of the water levels in the San Andres-Glorieta aquifer as the result of withdrawals could result in induced leakage of water from adjacent aquifers such as alluvium, the Chinle Formation, and the Yeso Formation. If induced leakage did occur and the chemistry of the induced leakage were different than the water chemistry of the aquifer, mixing of the two waters would result in changes in the water chemistry of the San Andres-Glorieta aquifer.
60

In general, the concentration of nitrate is small (less than 1 rag/L) in ground water not affected by human activities, thus nitrate is a good indicator of changes in water chemistry that may be due in part to human influence. Possible sources of nitrate are the leaching of fertilizers by recharge water, leakage of industrial wastewater containing nitrogen compounds, or leakage of water containing human or animal waste. In general, nitrate is not conservative in ground water, but is removed from the water and converted to nitrogen gas by bacteria. In flow systems containing fractures or cavernous zones, ground-water flow can be relatively rapid and large nitrate concentrations can be a significant distance from outcrop or recharge areas.
The chemistry of ground water from the San Andres-Glorieta aquifer in the Grants-Bluewater area has changed since the early 1940's (table 8). An areal plot of di ssol ved-ni t rat e , di s sol ved-chloride , and dissolved-sulf ate concentrations for 1944 to 1948 shows dissolved-nitrate concentrations as large as 7.2 mg/L in water from wells in T. 12 N., R. 10 W. (fig. 23). On the basis of available data, dissolved-nitrate concentrations seem to be greatest in the vicinity of T. 12 N., R. 10 W., sec. 30. Dissolved-chloride concentrations range from 12 to 98 mg/L, and dissolved-sulfate concentrations range from 160 to 800 mg/L (fig. 23). An areal plot of the dissolved-nitrate, dissolved-chloride, and dissolved-sulfate concentrations for water from wells 12N.10W.30.421, 12N.10W.32.111, and 11N. 10W.16.121 (fig. 24) shows smaller nitrate concentrations for 1956 to 1957 than for 1944 to 1948. Dissolved- chloride and dissolved-sulfate concentrations in these wells generally increased during this time period. In this case, the nitrate concentrations, which are affected by biological processes, decrease, whereas the dissolved- chloride concentrations, which generally are not affected by biological processes, increase. The largest nitrate concentrations for 1956 to 1957 were measured in water from wells in the vicinity of T. 12 N. , R. 11 W. , sec. 24 (fig. 24).
Concentrations of dissolved nitrate, chloride, and sulf ate were greater in water from well 12N.11W.25.213 in 1962 than in 1946 and 1957 (figs. 23-25). Water samples collected in 1962 from wells UN. 10W. 9 . 221 and UN. 10W. 16 .121 had larger dissolved-nitrate concentrations than samples collected in 1956-57, although there was little or no change in dissolved-chloride and dissolved- sulfate concentrations (figs. 24 and 25). In 1980-81, dissolved-nitrate concentrations were largest in water from wells 12N.10W.18.312 and 12N.10W.19.224 (fig. 26). The dissolved-chloride and dissolved-sulfate concentrations in water from these wells and well 12N. 10W. 17.424 are much greater than concentrations measured in water from other wells in the area (fig. 26). The large nitrate concentrations in association with relatively large chloride and sulfate concentrations could indicate an impact of human activities on ground-water chemistry. Chloride and sulfate concentrations in water from well 12N. 11W. 23.231 have increased since 1947, although nitrate concentrations decreased from 17 mg/L in 1956 to 7.3 mg/L in 1980 (figs. 23, 24, and 26). Chloride concentrations decreased from 160 mg/L in 1957 to 91 mg/L in 1980 in water from well 12N.11W.15.211, although the sulfate and nitrate concentrations did not change significantly. Nitrate concentrations decreased in water from wells UN.10W.9.221 and UN.10W.4.333 between 1962 and 1980 (figs. 25 and 26). Chloride and sulfate concentrations also decreased in water from well UN. 10W.4.333 between 1962 and 1980, but increased in water from well UN. 10W. 9 . 221.
61

108°00' 56'15" 107052'30"
35°15'
35°iri5H -
Nitrate as nitrogenChloride
Sulfate
R. 11 W.
EXPLANATION4.10
ga WELL-lncludes water-chemistry 460 constituent values. All
values in milligrams per liter; -, no value
1
R. 10 W.
2I
4 MILES
4 KILOMETERS
Figure 23.--Dissolved-nitrate, chloride, and sulfate concentrationsin water from wells completed in the San Andres-Glorieta aquifer in the Grants-Bluewater area, 1944-48.
62

108°00' 56'15" 107°52'30M
35°15'
35°11'15M -
EXPLANATION 4 MILES
Nitrate as nitrogenChloride
Sulfate
1.5 160* 670
WELL--lncludes water-chemistry constituent values. All values in milligrams per liter; -, no value
4 KILOMETERS
Figure 24.--Dissolved-nltrate, chloride, and sulfate concentrations in water from wells completed in the San Andres-Glorieta aquifer in the Grants-Bluewater area, 1956-57.
63

108°00' 107°52'3Cr
35°15'
35011'15"-
Nitrate as nitrogenChloride
Sulfate
R. 11 W.
EXPLANATION14
100 WELL-lncludes water-chemistry 460 constituent values. All
values in milligrams per liter; -, no value
1
R. 10 W.
2I
4 MILES I
I I I I4 KILOMETERS
Figure 25.--Dissolved-nitrate, chloride, and sulfate concentrationsin water from wells completed in the San Andres-Glorieta aquifer in the Grants-Bluewater area, 1962-63.
64

108°00' 107°52'30"
35°15'
35°11'15M - - T.
11
R. 11 W.
EXPLANATIONNitrate as nitrogen
ChlorideSulfate
1.6 48*
162
4 MILES I
WELL--lncludes water-chemistry constituent values. All values in milligrams per liter; -, no value
T4 KILOMETERS
Figure 26.--Dissolved-nitrate, chloride, and sulfate concentrationsin water from wells completed in the San Andres-Glorieta aquifer in the Grants-Bluewater area, 1980-81.
65

These data indicate that human activity has affected ground-water chemistry in the area. Changes in the locations of areas where ground -water chemistry has been affected and differences in the chemical constituents that have changed with time in different areas probably are the result of changes in land use in the particular areas .
Ground-water flow and ground-water chemistry in the vicinity of Ojo del Gallo (10.10.3.423) and San Rafael (pi. 2) also have changed since the 1940' s. Hodges (1938) estimated the discharge of Ojo del Gallo to be about 3,100 gallons per minute. Discharge from the spring began to decrease in the mid- 1940's, and by 1953 the spring was dry (Gordon, 1961, p. 51). Gordon (1961, p. 47) stated that the effects of ground-water withdrawals for irrigation, industrial, and municipal use probably were the reason for the cessation of spring flow. The spring started to flow again in the early 1980's, and by 1986 the discharge had increased to approximately 772 gallons per minute. The municipal water supply for San Rafael comes from wells penetrating the San Andres-Glorieta aquifer less than 1 mile from Ojo del Gallo.
Chloride concentrations in water samples from Ojo del Gallo ranged from 44 mg/L in 1946 to 110 mg/L in 1984; an intermediate concentration of 80 mg/L was measured in a sample collected in 1985 (fig. 27). Chloride concentrations in water samples from the San Rafael municipal well ranged from 40 mg/L in 1962 to 94 mg/L in 1976, decreasing to 80 mg/L in 1986 (fig. 27). The concentrations of other ions also have changed in water from Ojo del Gallo and the San Rafael municipal wells (table 7); the maximum chloride concentration is not known but probably was greater than the maximum concentrations measured because data show that chloride concentrations have been decreasing. Chloride concentrations decreased from 1984 to 1985 in water from Ojo del Gallo and began to level off in approximately 1980 in water from San Rafael municipal wells. gj
ID Q. W
O
120
100
d 80
O
I
OIDQ oc3O
60
40
20
1944 1948 1952 1956 I960 1964 1968 1972 1976 1980 1964 1988
EXPLANATION
o CHEMICAL ANALYSIS FROM OJO DEL GALLO
CHEMICAL ANALYSIS FROM SAN RAFAEL MUNICIPAL WELL
Figure 27.--Chloride concentration in water from Ojo de Gallo and San Rafael municipal wells, 1947-86.
66

One possible explanation for this change in water chemistry is that lower potentiometric heads in the San Andres-Glorieta aquifer caused by ground-water withdrawals resulted in induced leakage of ground water having a chemistry different than that of water in the aquifer. Although potentiometric heads declined in the vicinity of Ojo del Gallo as evidenced by the cessation of flow from the spring, the head declines in the Grants area and west of Grants were much larger than those in the vicinity of Ojo del Gallo. In areas where the San Andres-Glorieta is under artesian conditions, large potentiometric- head declines could induce downward leakage from the alluvium or Chinle Formation or upward leakage from the Yeso Formation. The amount of leakage at a particular point would be a function of the potentiometric-head declines, the potentiometric head in the rocks adjacent to the San Andres-Glorieta aquifer, and the permeability of these adjacent rocks. The potentiometric- surface map indicates that ground water in the San Andres-Glorieta aquifer flows eastward from the Grants area (area of the largest head declines) toward the Ojo del Gallo area (fig. 13). Chemical analysis of water from the San Rafael municipal wells indicates a change in water chemistry between 1963 and 1976 (fig. 27). This water-chemistry change could be caused by downward leakage from the alluvium or Chinle Formation of water that has larger chloride concentrations than water in the aquifer prior to 1963 or by upward leakage from the Yeso Formation in the areas of the largest head declines. The decrease in chloride concentrations in water from Ojo del Gallo between 1984 and 1985 and in water from the San Rafael municipal well between 1976 and 1986 may indicate that the amount of leakage from adjacent units is decreasing or that ground water that leaked into the San Andres-Glorieta aquifer previously is moving past the Ojo del Gallo and San Rafael area and being flushed through the aquifer. If flow at Ojo del Gallo increases to the quantity estimated by Hodges (1938), chloride concentrations in water from the San Andres-Glorieta aquifer in this area probably will continue to decrease to approximately the same concentrations measured prior to 1964, assuming the water chemistry upgradient from Ojo del Gallo has not changed since 1964.
Acoma Embayment Area
The eastern boundary of the Acoma embayment area is coincident with a group of faults that separate the Mesozoic and Paleozoic rocks on the west from the Tertiary alluvial-basin deposits of the Rio Grande rift (fig. 18). Because the geology, ground-water flow system, and water chemistry are complex in this part of the study area, a brief discussion of water chemistry in other aquifers has been included. The arbitrary southern boundary was chosen to be the latitude 34° 30' (fig. 18). The western and northern boundaries also are somewhat arbitrary but generally are based on the availability of data. The San Andres-Glorieta aquifer dips to the north in the Acoma embayment area, thus there are few data north of T. 10 N. because of the large depth to the aquifer and the utilization of shallower aquifers. Water-chemistry data from the San Andres-Glorieta aquifer are sparse for the Acoma embayment area.
The direction of ground-water flow in the Acoma embayment area generally is from the west to the east as indicated by water levels in wells. However, little is known about the direction of ground-water flow at the eastern, southern, and northern margins of the Acoma embayment area (fig. 18).
67

The chemistry of water from the San Andres-Glorieta aquifer in the Acoma embayment area is complex, varying significantly in concentrations of dissolved ions and in the relative proportions of specific dissolved ions (figs. 28 and 29). The concentrations of dissolved ions in ground water from the aquifer would be expected to increase from the recharge area (western side of the Acoma embayment area) to the discharge area (eastern side of the Acoma embayment area). This is observed in the water-chemistry data in the northern part of the Acoma embayment area (Townships 8 and 9). In the southern part of the area (Townships 4-7), however, ground water does not have this general increase in concentration of dissolved ions from west to east (fig. 28), indicating that the general flow from west to east may not hold true throughout the area.
On the basis of the location of the outcrop area of the San Andres- Glorieta aquifer and the potentiome tri c - surf ace map, water from well 9N. 9W. 28.1344 represents ground water that has traveled the shortest distance from the recharge area on the east side of the Zuni Mountains. Specific conductance of water from this well is the smallest detected in samples from the Acoma embayment area (fig. 28). Calcium is the dominant cation, and the proportion of bicarbonate with respect to the other anions is greater than in other water in the Acoma embayment area (fig. 29). The concentration of dissolved sulfate in water from this well is 300 mg/L, which is the smallest sulfate concentration in the Acoma embayment area. The large proportion of calcium relative to the other cations and the large proportion of chloride relative to the other anions indicate that dissolution of limestone has been a significant process in the chemical evolution of this water. The relatively small sulfate concentration indicates less gypsum dissolution between the recharge area and this well compared with other wells in the area.
If some assumptions are made, changes in water chemistry as water moves eastward (downgradient) can be investigated by comparing the chemistry of water from well 9N. 9W. 28.1344 with water from the next well downgradient. These assumptions are that (1) water from well 9N.9W.28.1344 in 1986 is representative of ground water that has flowed by this point in the past; (2) the ground-water chemistry is homogeneous along a potentiometric contour in T. 8 N. and T. 9 N. ; and (3) the water moves downgradient (west to east) . The chemical processes that affect the chemistry of ground water from well to well downgradient in T. 8 N. and T. 9 N. also can be postulated. However, because they have not been tested or confirmed, the processes discussed are speculative.
68

35°15'107°30' 107°15' 107°00'
35°00' -
T. 12 N.
T.11 N.
T. 10 N.
T.9N.
T.8N.
34°45' -
34°30
\ BERNALILLO COUNfTY
|VALENCIAL_ 140 1.200! COUNTY*/390 140. 160x3,0101
SAN ANDRES LIMESTONEAND GlpRIETA SANDSTONE ABSENT
1 21 1 430 2,6bo 600 1HO 150 190 4,630
OUTCROP AREA
I... __....__!,__.___. _ 1 CIBOLA i COUNTY
SOCORRO COUNTYCATRON COUNTY
;^^j^^JI-.
T.7N.
R. 10 W. R.9W. R.8W. R.7W. R.6W. R.5W. R.4W.
0 2 4 6 8 10l_ i _i I i i
R.3W. R.2W.
20 MILES I
I I I I I I 0246810 20 KILOMETERS
EXPLANATION
FAULT-Dashed where approximately located.Geology modified from Dane and Bachman, 1965
sodium 610 2,400 -Suifate WELL--lncludes water-chemistry constituent values. ^m * Jio -sjed£ A" v̂ es in milligrams per liter except specific
conductance conductance, in microsiemens per centimeter at 25 degrees Celsius
Figure 28.--Selected chemical analyses of water from wellscompleted in the San Andres-Glorieta aquifer in the Acoma embayment area.
69

Chloride
ANIONS
PERCENTAGE OF TOTAL IONS, IN MILLIEQUIVALENTS PER LITER
EXPLANATION
Numberon Local
figure identifier
1 9N.9W.28.13442 8N.8W.25.42313 8N.6W.20.3334« 9N.6W.16.111s 9N.5W.12.442e 8N.3W.15.324
Numberon Local
figure IdentifierJ 10N.9W.25.324 6N.10W.7.1413» 5N.8W.35.123
10 4N.6W.27.431411 5N.4W.5.14212 6N.5W.26.13213 7N.4W.25.111
Figure 29.--Piper diagram of selected chemical analyses of water from wells completed in the San Andres-Glorieta aquifer in the Acoma embayment area.
70

The mineralogy of the San Andres Limestone and Glorieta Sandstone can be used to limit the possible chemical processes that result in the changes in water chemistry. As pointed out in the geology section of the report, the San Andres Limestone and Glorieta Sandstone contain significant amounts of gypsum and anhydrite in the eastern part of the Acoma embayment. Baars (1962, p. 208) indicated that the San Andres Limestone and Glorieta Sandstone were deposited in an evaporite basin in this area. Small amounts of halite and other evaporite minerals also may have been deposited in conjunction with the gypsum and anhydrite, although these minerals have not been observed in the San Andres Limestone and Glorieta Sandstone. Small amounts of seawater would also be trapped in the gypsum and anhydrite during precipitation. This fluid would contain relatively large concentrations of sodium, magnesium, potassium, and chloride. Kaolinite and illite are the most predominant clays found in the San Andres Limestone and Glorieta Sandstone (L.N. Plummer, U.S. Geological Survey, written commun. , 1988). The presence of these clays indicates that cation-exchange reactions are possible in the San Andres-Glorieta aquifer.
Water from well 8N.8W.25.4231, the next well downgradient from well 9N. 9W. 28 .1344, has significantly larger concentrations of dissolved calcium and sulfate than water from well 9N.9W.28.1344 (fig. 28), indicating the dissolution of gypsum as water moves eastward. Water from well 8N.6W.20.3334, the next well downgradient, has less dissolved calcium, significantly more dissolved sodium, and more dissolved sulfate than water from well 8N. 8W.25.4231 (fig. 28). The decrease in dissolved calcium and increase in sodium could indicate cation exchange, where two sodium ions fixed on a clay particle are exchanged for a calcium ion. This is indicated on the Piper diagram by the increase in the proportion of sodium (fig. 29). The increase in dissolved sulfate indicates that gypsum continues to dissolve as the ground water moves east. Water from well 9N. 6W.16. Ill, the next well downgradient, has more dissolved calcium, sodium, and sulfate than water from well 8N.6W. 20 . 3334 (fig. 28), indicating that gypsum dissolution and cation exchange continue. Little change in the proportion of cations and anions compared with water from wells 9N.6W.16.111 and 8N.6W.20.3334 is shown in the Piper diagram, indicating no large change in the chemical processes affecting the water chemistry between these wells. This seems to support the assumption that, in general, ground-water chemistry is homogeneous along a potentiometric contour in T. 8 N. and T. 9 N.
There is a substantial difference in the water chemistry of well 9N.6W.16.111 and that of well 9N.5W.12.442 (fig. 28). Although the calcium concentration decreases from 540 to 200 mg/L (fig. 28 and table 9), the sodium concentration increases from 810 to 2,800 mg/L, bicarbonate concentration increases from 548 to 1,500 mg/L, sulfate concentration increases from 3,200 to 3,500 mg/L, and chloride concentration increases from 250 to 2,100 mg/L. The decrease in calcium and increase in bicarbonate are difficult to account for but may be due to dissolution of limestone in conjunction with cation exchange. The increase in sulfate indicates continued gypsum dissolution. The substantial increase in sodium and chloride concentrations could indicate dissolution of halite.
71

There are increases in all dissolved constituents in water from well 8N.3W.15.324, the next well downgradient, compared with water from well 9N.5W.12.442 (fig. 28 and table 9). This probably means that gypsum, limestone, and halite dissolution continues to occur; however, the increase in calcium may indicate that cation exchange is not as significant between wells 9N.5W.12.442 and 8N.3W.15.324 as it is between wells 9N.6W.16.111 and 9N. 5W. 12.442. The large increase in the concentration of potassium (12 mg/L in water from well 9N.5W.12.442 and 120 mg/L in water from well 8N.3W.15.324) may indicate dissolution of sylvite (potassium chloride), which is an evaporite mineral commonly found in conjunction with anhydrite and halite deposits. Relatively small changes in the proportion of cations and anions are seen in the Piper diagram, indicating little change in the chemical processes affecting the water chemistry between wells 9N.5W.12.442 and 8N.3W.15.324 (fig. 29).
The chemical composition of water from well ION. 9W. 25 . 3241 is anomalous compared with water from other wells in the vicinity (fig. 28). The sodium concentration of 1,100 mg/L and the chloride concentration of 1,300 mg/L (fig. 28) possibly indicate that halite dissolution has been important in the evolution of water from this well. The proportion of anions in water from this well is similar to water from wells 8N.3W.15.324 and 9N.5W.12.442 (fig. 29). Water from wells 8N.3W.15.324 and 9N.5W.12.442 represents ground water that has been in the San Andres-Glorieta aquifer a relatively long time and that has evolved chemically to the present composition (large specific conductance and large sodium and chloride concentrations). A relatively long residence time also may be the explanation for the relatively large specific conductance and large sodium and chloride concentrations in water from well ION.9W.25.3241. Ground-water flow may be relatively slow in this part of the aquifer. Another explanation could be that the water has come in contact with a considerable quantity of soluble evaporite minerals in a relatively short time; thus, the water may not have been in the aquifer a long time but instead has traveled through parts of the aquifer containing a significant quantity of soluble material.
Water from well 6N.10W.7.1413 also is anomalous compared with water from other wells in the vicinity (fig. 28). Sodium and chloride concentrations are relatively large in water from this well, as they are in water from well ION. 9W. 25 . 3241 (fig. 28). The potassium and bicarbonate concentrations in water from well 6N. 10W. 7.1413 also are relatively large compared with water from other wells in the Acoma embayment area. Water from this well probably has been in the San Andres-Glorieta aquifer a relatively long time.
Water from well 5N.8W.35.123 has a specific conductance of 2,800 microsiemens and a sulfate concentration of 940 mg/L (table 9), which are small compared with water from wells a similar distance from the outcrop areas of the San Andres-Glorieta aquifer. The small sulfate concentration indicates that gypsum dissolution is not as significant a process in the chemical evolution of water from this well as it is in water from most other wells in the Acoma embayment area. The chloride concentration of 210 mg/L generally is larger than that in water from other wells in the area. On the basis of the proportion of the individual cations and anions, water from well 5N.8W.35.123 is similar to water from well 9N.9W.28.1344 (fig. 29), which represents
72

recharge water to the San Andres-Glorieta aquifer in the area. The explanation for the relatively dilute nature of water from this well compared with other water in the Acoma embayment area is unknown; however, the relatively small sulfate concentrations indicate that water from this well has not come in contact with or dissolved as much gypsum as water from many of the other wells in the Acoma embayment area.
In water from wells 5N.4W.5.142, 7N. 4W. 25 . Ill, 6N . 5W. 26 .132 , and 4N.6W.27.4314 calcium is the dominant cation and sulfate is the dominant anion (fig. 29). The specific conductance and concentration of dissolved ions in water from these wells are much smaller than in water from wells 8N.3W.15.324 and 9N. 5W. 12 .442, which are approximately the same distance from the outcrop or recharge area of the San Andres-Glorieta aquifer on the eastern side of the Zuni uplift.
The chemistry of water from wells 5N.4W.5.142, 7N.4W.25.Ill , and 6N.5W.26.132 indicates that this water flows westward (fig. 18) and is recharged along the outcrop area of the San Andres-Glorieta aquifer on the south and east sides of the Acoma embayment area (fig. 28). Water from well 5N.4W.5.142, which is on the outcrop area of the aquifer, has the smallest specific conductance and chloride concentration of these three wells (fig. 28). Water from this well probably is representative of recharge water to the San Andres-Glorieta aquifer along the east side of the Acoma embayment area. The San Andres-Glorieta aquifer contains a large quantity of gypsum in the southeastern part of the Acoma embayment area, thus water recharging the aquifer would come in contact with and probably dissolve gypsum. The dissolution of gypsum probably is the reason for the large dissolved-sulfate concentrations in water from the three wells, which are relatively close to the outcrop or recharge area. Chloride concentrations of 140 mg/L in water from wells 7N.4W.25.111 and 6N.5W.26.132 probably indicate that this water has dissolved halite. The San Andres-Glorieta aquifer probably contains relatively more halite in this area of the Acoma embayment because the large thickness of gypsum in the aquifer in this area was deposited in a constricted evaporite basin and halite probably was deposited in conjunction with the gypsum.
If recharge does occur on the eastern side of the Acoma embayment area and this water flows westward, there must be a mechanism for discharge of this water from the San Andres-Glorieta aquifer and for recharge water along the eastern side of the Zuni uplift that flows eastward. The mechanism for and location of the discharge are not known, although by using available geologic and water-chemistry data from other aquifers, some possible mechanisms for discharge can be conjectured. Jicha (1958, p. 53) mapped and discussed a large travertine deposit of late Tertiary or Pleistocene age in T. 6 N., R. 5 W. and T. 5 N., R. 5 W. This deposit is as much as 150 feet thick and in excess of 100 million tons. The travertine, composed of approximately 97.5 percent calcium carbonate (Jicha, 1958, p. 53), probably was deposited by water from springs discharging in the area, which presently are not active. It is possible that these springs were discharging from the San Andres- Glorieta aquifer. Water in the San Andres-Glorieta aquifer west of this area presently contains relatively large bicarbonate concentrations and effervesces carbon dioxide. This water generally is supersaturated with respect to
73

calcite (calcium carbonate) at the partial pressure of carbon dioxide at land surface. Presently (1988), water levels in wells completed in the San Andres- Glorieta aquifer near the travertine deposits are approximately 300 feet below the deposits (land surface). Potentiometric levels in the San Andres-Glorieta aquifer may have been higher in the past for several reasons. The outcrop areas along the east and west sides of the Acoma embayment area probably were at a higher altitude (erosion has since lowered the outcrop areas). Precipitation and thus recharge also probably were greater in the past (during the Pleistocene), which could cause higher potentiometric levels in the San Andres-Glorieta aquifer. If the potentiometric surface in the San Andres- Glorieta aquifer was above land surface near these spring deposits in the late Tertiary or Pleistocene and the composition of water in the aquifer was similar to the present composition west of the travertine deposits, the large travertine deposit could have been deposited by ground-water discharge from the aquifer moving upward along faults or dikes.
Discharge from the San Andres-Glorieta aquifer currently may be leaking downward into older Permian and Pennsylvanian rocks. Saline springs (specific conductance of water greater than 20,000 microsiemens) issue from rock units of varying ages (table 9) along the eastern margin of the Lucero uplift. Many of these springs are near the fault zone that separates the Cretaceous and older rocks of the Acoma embayment from the Quaternary and Tertiary deposits of the Rio Grande rift. The chemical similarity of water from these saline springs indicates that the water from these springs is derived from the same aquifer (Titus, 1963, p. 46). The fact that some of these springs discharge from Pennsylvanian rocks could indicate that they are derived from the Pennsylvanian rocks (Titus, 1963, p. 46). Many of the springs discharge from rocks younger than Pennsylvanian age at the surface, but the actual source of the water could be the Pennsylvanian rocks from which the water moves upward along fault zones to discharge from younger strata at land surface (Titus, 1963, p. 46). The altitude of these springs generally is lower than the present altitude of the potentiometric surface of the aquifer. The source of saline water in the Pennsylvanian rocks is unknown because these rocks do not crop out in the Zuni uplift or anywhere close to the discharge area, thus there is no obvious recharge area for the flow system in these rocks. Water from the San Andres-Glorieta aquifer may be leaking downward into Lower Permian and Pennsylvanian rocks along faults and dikes in the area west of the outcrop of the aquifer in the Lucero uplift. Jicha (1958, pi. 1) showed a large number of dikes and sills in the area and indicated that, on the basis of drill-hole data and structures observed in the outcrop of the Chinle Formation, these dikes and sills may be quite extensive in the subsurface. Water could flow eastward in the Lower Permian and Pennsylvanian rocks and discharge east of the outcrop area of the San Andres-Glorieta aquifer after leaking downward along dikes (fig. 30).
74

/9,
000'
-i
8,00
0' -
7,00
0' -
6,0
00
'-
5,00
0' -
3,00
0' -
2,00
0' -
1,0
00
'-
3
kPs
a / P
g
/Ay \
Psa/
Pg
u Py
/Pa
Py/
Paf
t rC
X|
Qal
\v ^ T
,' P
y/^a
Vlfc
-e 4- ̂̂
^
1 A
\--=
-Jrl
X^N
*" ^
h
1r
^jjty
^%
.t4>
v
^X
'
nv
v1
xv
Py/
Pa
s
v
' ^
JS'\
^
Qb
QUf
iCT
Qal
Q
UfC
T
Ku
CfiE
T^
J u
JUR
A
"Ru
TRIA
S
Psa
/Pg
P
ER
M
Py/
Pa
PE
RM
FPu
PE
NN
-
GE
OL
-^-
FAUL
T
"
D
IREC
on
the
AR
EA
OF
NU
ME
RO
US
D
IKE
S A
ND
SIL
LS
(JIC
HA
, 19
58)
A*
S
Qb
°"
/
\
2
o)
,/
Ku
\
iu
Ju RU
---_
_P
_sa/P
g - - - "
Py/
Pa
I \i Al
__-^
-!-
.
~~~
I
»
^-
Kll
PO
TEN
TIO
ME
TRIC
SU
RFA
CE
Is-
' 2.
OF
THE
SA
N A
ND
RE
S-
^r\
GLO
RIE
TA A
QU
IFE
RJ \
\ /
^u ^
_V
- - - ̂
--^^t_
Ps
a~Pg
~ ~
" ^,-
x -V
'-^ _
~-~-
-^__
^
^-*
~^~
~
~~
~~
^- ^
FP
u~
~~
~
~~~
02
46
8
10 M
ILE
S
I I
1 i
I J
I 1
1 i
l 1
02
46
8
10K
EX
PL
AN
AT
ION
V
ER
TIC
AL
EX
AG
GE
RA
TIO
ER
NA
RY
BA
SA
LT
Dat
um is
sea
.eve
.
ER
NA
RY
ALL
UV
IUM
AC
EO
US
RO
CK
S,
UN
DIV
IDE
D
SSIC
RO
CK
S,
UN
DIV
IDE
D
SIC
RO
CK
S,
UN
DIV
IDE
D
IAN
SA
N A
ND
RE
S L
IME
STO
NE
AN
D G
LOR
IETA
SA
ND
STO
NE
IAN
YE
SO
FO
RM
ATI
ON
AN
D A
BO
FO
RM
ATI
ON
SY
LVA
NIA
N R
OC
KS
, U
ND
IVID
ED
OG
IC C
ON
TAC
T
'--A
rrow
s sh
ow d
irect
ion
of m
ovem
ent
,TIO
N O
F G
RO
UN
D-W
ATE
R F
LOW
- P
ostu
late
d ba
sis
of g
roun
d-w
ater
che
mis
try d
ata
.«
^
I*
*
t>
o> |r
LUC
ER
O U
PLI
FT
-n
^l^"^
7^^.
Ju
^ '
/ ^,-
' /
^^ ~
\"^f
-.--
^
^-"
/7
--/"
" -x
/ ^
" :-^
>"'
^-**
-^ / s~^
-9,0
00'
- 8
,000
'
-7,0
00
'
- 6
.000
'
- 5
,000
'
- 4
,000
'
- 3
,000
'
- 2,
000'
- 1,
000'
LOM
ETE
RS
LO
CA
TIO
N O
F G
EO
LOG
IC S
EC
TIO
N
108°
00'
451
30'
15-
107-
00'
35-3
0' -
,,
Blu
ew
15
Lake
35-0
0- -
45'
-
McK
INLE
Y
1 >
00
r-,
! i8
^r=
S[ r L
U
VSX
B
ER
NA
-Vl
- W
U
LLO
\
^
CO
- 1_
«>^~
^rx.
\
jS-C
IBO
LA C
O
\
|8"A
TRor
yJo 1J
s6co
iJR
Oco
>^A: '
0 10
20
30
MIL
ES
0 10
20
30
KIL
OM
ETE
RS
Figu
re 30
.--H
ydroge
olog
ic se
ctio
n th
roug
h th
e Acoraa em
baym
ent
area (surface ge
olog
y from Dane an
d Ba
chma
n, 1965).

The location of the saline springs along the eastern side of the Lucero uplift seems to be controlled by faults and emergence altitude. A few saline springs are present in T. 4 N. and T. 5 N. but most of the known springs are in T. 7 N and T. 8 N. (fig. 31). The springs in T. 4 N. and T. 5 N. generally are in the bottom of arroyo channels close to a large, structurally complex fault Zone. In T. 5 N., this fault zone juxtaposes Pennsylvanian rocks (permeable rocks) with Precambrian rocks (impermeable rocks) in the subsurface (Callender and Zilinski, 1976), and the saline springs may be the result of the large contrast in the permeability of the Pennsylvanian and Precambrian rocks. In areas where the Pennsylvanian rocks are juxtaposed with rocks of similar permeability, springs would not be expected to exist.
The saline springs in T. 7 N. and T. 8 N. also are along a fault zone, and travertine is found in the area (Kelley and Wood, 1946). The emergence altitude of these springs generally is 300 to 700 feet lower than the springs in T. 4 N. and T. 5 N. The springs in this area also may be the result of a permeability contrast similar to the proposed mechanism of the springs in T. 4 N. and T. 5 N. The geometry of the fault in this area is not known, but because of the complex nature of the fault zone, the Pennsylvanian and Permian rocks possibly are juxtaposed with less permeable rocks. If a permeability contrast is the cause of the saline springs along the eastern side of the Acoma embayment area, not all of the ground water flowing eastward in the Permian and Pennsylvanian rocks would be forced to the surface as spring flow. Some of the water would continue to flow eastward to discharge into the basin- fill aquifer in the Albuquerque-Belen Basin.
The chemical composition of ground water varies in the eastern Acoma embayment area where chloride concentrations range from 6 to 27,000 mg/L (fig. 31). Water from the San Andres-Glorieta aquifer south of T. 8 N. has chloride concentrations less than 150 mg/L, whereas water from the aquifer in T. 8 N. and T. 9 N. has chloride concentrations greater than 2,000 mg/L (fig. 31).
Water from two large springs, Suwanee Spring (8N.3W.10.222) and Dipping Vat Spring, has chloride concentrations of 340 and 380 mg/L, respectively. By contrast, chloride concentrations are greater than 2,000 mg/L in water from the San Andres-Glorieta aquifer in this area. The large difference in chloride concentration in this water and in water from the two springs indicates that the source of water in Suwanee and Dipping Vat Springs is not the San Andres-Glorieta aquifer.
76

107°15' 107°
35°00' -
34°45' -
T.9N.
T.8N.
T.7N.
T.6N.
T.5N.
EXPLANATION
Qs QUATERNARY SPRING DEPOSITS Qal QUATERNARY ALLUVIUM Qb QUATERNARY BASALT
QTp QUATERNARY AND TERTIARYPEDIMENT GRAVELS
QTs QUATERNARY AND TERTIARY SANTAFE GROUP
Tb TERTIARY BASALT KJu CRETACEOUS AND JURASSIC
SEDIMENTARY ROCKS, UNDIVIDED"Ru TRIASSIC SEDIMENTARY ROCKS
UNDIVIDEDPsa PERMIAN SAN ANDRES LIMESTONEPg PERMIAN GLORIETA SANDSTONE
Py PERMIAN YESO FORMATIONPa PERMIAN ABO FORMATION
fPu PENNSYLVANIAN SEDIMENTARYROCKS, UNDIVIDED
p6 PRECAMBRIAN ROCKS
GEOLOGIC CONTACT
FAULT 18 WELL--Number is chloride concentration,
in milligrams per liter. * indicates source of water is San A, '-RS-
25Q Glorieta aquifer
k SPRING-Number is chloride concentration, ! ; milligrams per liter
T.4N.
O A OO/V 6434 30 -
T.3N.
R.5W. R.4W. R.3W. R.2W.01 2345 6 MILES
I I I I I I II I I I I I I01 23456 KILOMETERS
Figure 31.--Generalized geologic map and dissolved-chloride concentration in water from selected wells and springs in the eastern part of the Acoma embayment area (geology from Dane and Bachman, 1965).
77

Specific conductance of water from the saline springs generally is greater than 20,000 microsiemens, and chloride concentration generally is greater than 6,000 mg/L (table 9 and fig. 31). Sodium and chloride are the dominant dissolved ions in water from these springs (fig. 32). The bicarbonate concentration in water from these springs is relatively large, greater than 1,500 mg/L (table 8), and the water presently deposits travertine. Water discharging from these springs has a larger specific conductance and concentration of dissolved ions than water in the San Andres- Glorieta aquifer, although the proportion of cations and anions is similar to water from wells 8N.3W.15.324 and 9N.5W.12.442 (figs. 29 and 32). The larger specific conductance in water from the springs discharging from the older rocks east of the outcrop of the San Andres-Glorieta aquifer probably is due to water leaking downward from the aquifer into the older rocks west of the outcrop area of the aquifer; the water in the older rocks then dissolves aquifer material as it moves eastward. The large variation in the mineralogy of saline water from the springs (table 9) may be the result of mixing of saline water with water containing less dissolved ions and of variations in the composition of the aquifer with which the water has come into contact. At the present time (1988), data are not sufficient to do more than postulate discharge mechanisms and areas of discharge for the San Andres-Glorieta aquifer. Collection of more hydrologic and water-chemistry data would be useful for a better understanding of the flow system of the San Andres- Glorieta aquifer and the source of water discharging from the saline springs.
Horace Springs
The source of ground water that discharges into the Rio San Jose from Horace Springs (ION.9W.23.423) is not known; however, the available water- chemistry data can be used to evaluate several possible sources. A comparison of the water chemistry from Horace Springs and from well 10N.9W.25.3241, which is completed in the San Andres-Glorieta aquifer and is about 1 mile from Horace Springs, shows that water from the well contains significantly larger concentrations of dissolved ions than water from Horace Springs (table 8). The chloride concentration in water from the well is 1,300 mg/L, whereas the chloride concentration in water from Horace Springs is only 120 mg/L (1986 analysis; table 8). A comparison of the water chemistry from Horace Springs (1957 analysis) and from Ojo del Gallo (10N.10W. 3.423, 1946 analysis), which discharges water from the San Andres-Glorieta aquifer and is about 8 miles upgradient from Horace Springs, indicates slight differences in composition.
78

Calcium
CATIONS
Chloride
ANIONS
PERCENTAGE OF TOTAL IONS, IN MILLIEQUIVALENTS PER LITEREXPLANATION
* SALINE SPRINGS
o WATER FROM WELLS 8N.3W. 15.324 AND 9N.5W. 12.442
+ WATER FROM OTHER WELLS AND SPRINGS IN THE AREA
Figure 32.--Piper diagram of selected chemical analyses of water from wells and springs in the eastern part of the Acoma embayment area.
79

Calcium and bicarbonate concentrations are 31 and 80 mg/L larger in water from Ojo del Gallo than in water from Horace Springs. Sodium plus potassium, sulfate, and chloride concentrations are 55 mg/L, 20 mg/L, and 44 mg/L larger in water from Horace Springs than in water from Ojo del Gallo. The source of water discharging from Horace Springs probably is not the San Andres-Glorieta aquifer because water would have to move about 8 miles through the aquifer from the Ojo del Gallo area to the Horace Springs area and then move vertically through approximately 1,600 feet of Chinle Formation and approximately 1,000 feet of Jurassic and Cretaceous rocks (figs. 9 and 10) with little change in water chemistry. Large chemical gradients also would be needed in the San Andres-Glorieta aquifer between the Horace Springs area and well ION. 9W. 25.3241 to explain the source of water discharging from Horace Springs as the San Andres-Glorieta aquifer. The relatively .large concentrations of dissolved ions in water from well ION. 9W. 25.3241 probably are more representative of water from the San Andres-Glorieta aquifer in the Horace Springs area than water from Ojo del Gallo; thus the large difference in the concentration of dissolved ions in water from well ION. 9W.25.3241, which is completed in the San Andres-Glorieta aquifer, and water from Horace Springs seems to indicate that the source of water discharging from Horace Springs is not the San Andres-Glorieta aquifer.
If the source of water discharging from Horace Springs is not the San Andres-Glorieta aquifer, the water must be coming from another aquifer. Comparison of the concentration of selected dissolved ions in water from wells completed in aquifers in Jurassic rocks near Horace Springs indicates that water from Horace Springs has larger concentrations of dissolved ions than water from aquifers in Jurassic rocks. Water from well ION. 9W. 25 . 324 , which is completed in the Dakota Sandstone, however, has larger sulfate concentrations than water from Horace Springs (fig. 33). Water from well ION.8W.32.312, which is completed in the Mancos Shale, has much smaller concentrations of chloride than water from Horace Springs (fig. 33).
The concentration of dissolved ions in water from alluvium and basalt aquifers in the vicinity of Horace Springs varies considerably (fig. 33). Water from spring ION.9W.6.442 and well ION.9W.17.113 has sodium, sulfate, and chloride concentrations greater than those in water from Horace Springs (fig. 33). Water from well ION. 9W. 29.132, however, has sodium, sulfate, and chloride concentrations less than those in water from Horace Springs (fig. 33). Water in the alluvium and basalt aquifers in The Malpais Valley area flows northward and eastward (fig. 33); water in the alluvium and basalt aquifers along the Rio San Jose valley generally flows eastward (fig. 33). These ground waters in the alluvium and basalt aquifers converge in the vicinity of Horace Springs (fig. 33) because of a reduction in the extent of the aquifers. Therefore, the water from Horace Springs may be a mixture of water from spring ION.9W.6.442 and wells ION.9W.17.113 and ION.9W.29.132.
80

107°
50'
107°
45'
107°
40'
35°2
0'
35°1
5*
35°1
0'
OO
35°0
5'
35°
R.
10 W
.R
. 9
W.
R.
8 W
.
EX
PL
AN
AT
ION
3 M
ILE
S
Aqu
ifer
Wel
l dep
th
Spe
cific
cond
ucta
nce
Sulfa
te
Chl
orid
eSo
dium
WE
LL O
R S
PR
ING
-lncl
udes
wat
er-c
hem
istry
val
ues.
All
valu
es
in m
illig
ram
s pe
r lit
er e
xcep
t spe
cific
con
duct
ance
, whi
ch is
in
mic
ro-S
iem
ens
per c
entim
eter
at 2
5 de
gree
s C
elsi
us.
Aqu
ifers
fro
m w
hich
wel
ls d
eriv
e w
ater
and
wel
l dep
th a
re a
lso
incl
uded
. Q
al,
Qua
tern
ary
allu
vium
; Qb,
Qua
tern
ary
basa
lt; K
m,
Cre
tace
ous
Man
cos
Sha
le; K
d, C
reta
ceou
s D
akot
a S
ands
tone
; Je,
Jur
assi
c E
ntra
da S
ands
tone
; Ps
a, P
erm
ian
San
And
res
Lim
esto
ne a
nd
Glo
rieta
San
dsto
ne.
Wel
l de
pth
in fe
et b
elow
land
sur
face
; SP
, sp
ring
DIR
EC
TIO
N O
F G
RO
UN
D W
AT
ER
FLO
W
l 3 K
ILO
ME
TE
RS
Figure 33
.--S
elec
ted
wate
r-ch
emis
try
valu
es in w
ater fr
om w
ells
in the
vici
nity
of
Ho
race
Springs

A comparison of two chemical analyses of water from well ION. 9W. 17.113 collected in 1950 and 1978 indicates a general decrease in the concentration of dissolved ions (table 9 and fig. 33). Chloride concentrations decreased from 750 mg/L in 1950 to 330 mg/L in 1978. The ratio of sodium to chloride is approximately the same in the two analyses, which may indicate that the difference in the chemical composition of water from the well may be the result of differences in the amount of evapotranspiration occurring in the vicinity of the well. Prior to the cessation of flow of Ojo del Gallo in the early 1950's, water levels in the area of well ION.9W.17.113 probably were close to land surface because part of the water from Ojo del Gallo flowed near this well, infiltrated, and recharged the alluvial aquifer. After Ojo del Gallo ceased to flow, water levels probably decreased in this area because of the reduced amount of recharge. The amount of evapotranspiration and thus concentration of dissolved ions in water probably were greatest prior to the cessation of flow of Ojo del Gallo because the water levels were closer to land surface.
The chloride concentration of water from Horace Springs generally has increased since 1962 (fig. 34). This change in chloride concentration also is evident in water in the Rio San Jose just downstream from Horace Springs at the gaging station Rio San Jose near Grants (fig. 34). During periods of low flow in the Rio San Jose, most water downstream from Horace Springs is the result of flow from Horace Springs (Risser, 1982, p. 29). Risser (1982, p. 31) indicated that wastewater from the city of Grants began to reach Horace Springs intermittently in 1957; however, the quantity of this water was not large enough to result in measurable differences in streamflow at the gaging station until the 1970's. Risser (1982, p. 31) estimated the flow of Horace Springs to be approximately 5 cubic feet per second and the increase in streamflow at the Rio San Jose near Grants gaging station due to wastewater from Grants to be approximately 1 cubic foot per second in the 1970's. The reason for the change in the chemical composition of water from Horace Springs is not known but may be related to the change in the flow and chemical composition of Ojo del Gallo, the change in chemical composition of water from well ION.9W.17.113, or the flow of Grants wastewater.
190
170
150
SZ 130
110
90
uj 70 Q
§ soO 1961
o o o
o o o
OO O
I I I I I I I I I I I I I I 1 I I I1965 1970 1975 I960 1965
EXPLANATION
o WATER FROM THE RIO SAN JOSE NEAR GRANTS
WATER FROM HORACE SPRINGS
Figure 34.--Concentration of chloride in water from Horace Springs and the Rio San Jose near Grants, 1961-86.
82

SUMMARY
The San Andres Limestone and the underlying Glorieta Sandstone of Permian age comprise the San Andres-Glorieta aquifer in west-central New Mexico. The San Andres Limestone is composed mainly of limestone with some sandstone and is unconformably overlain by the Chinle Formation. The erosional period represented by the unconformity lasted from Early Permian to Middle Trias sic time, and in the area of the Zuni uplift cavernous zones developed. The Glorieta Sandstone conformably overlies the Yeso Formation and is composed of well-sorted, well-cemented, fine- to medium-grained sandstone. In the Lucero uplift area, the San Andres Limestone contains gypsum and anhydrite, and the Glorieta Sandstone is thin or absent.
Most water in the San Andres-Glorieta aquifer is transmitted in solution channels, cavernous zones, and fractures in the San Andres Limestone. These solution channels, cavernous zones, and fractures are believed to be best developed near the Zuni uplift, where the San Andres Limestone was subjected to weathering, solution activity, and fracturing during periods of uplift and erosion. Seven transmissivity zones, delineated on the basis of aquifer-test results and the lithology of the aquifer, were identified in the study area. Transmissivity of the zones ranges from 10 to 50,000 feet squared per day. Zones having values of transmissivity of 50,000 feet squared per day are in the Grants area and in an area east and south of the Zuni uplift. Cavernous zones, faults, and fractures are common in many of these areas. Well yields of as much as 2,830 gallons per minute have been measured. The transmissivity of a zone near Bluewater Lake and Thoreau is 140 feet squared per day. The zone with the smallest transmissivity (10 feet squared per day) is at the eastern margin of the study area. In this area, the aquifer contains less limestone and more gypsum and anhydrite than in other parts of the study area.
Recharge to the San Andres-Glorieta aquifer occurs on outcrops along the Zuni uplift by infiltration of precipitation and by infiltration of surface flow. The quantity of recharge is related to the areal extent of outcrops of the aquifer. Along the eastern side of the Zuni uplift, the outcrop area of the San Andres-Glorieta aquifer is narrow and the amount of recharge probably is small, whereas along the northern side of the Zuni uplift, the outcrop area is extensive and the amount of recharge to the aquifer is larger. Some recharge to the San Andres-Glorieta aquifer also occurs south of the Zuni uplift where the aquifer subcrops in The Malpais Valley.
Another source of recharge to the San Andres-Glorieta aquifer is leakage of water from Bluewater Lake and Bluewater Creek. Surface water and ground water used for irrigation also may infiltrate and recharge the aquifer in the Grants-Bluewater area.
Ground-water movement in the San Andres-Glorieta aquifer generally is outward from the Zuni uplift (recharge area). In the northwestern part of the study area, ground water moves to the northeast, but the direction of movement changes to the east at distance from the Zuni uplift. Ground water moves to the east away from the Zuni uplift and toward the Rio Grande rift in the eastern part of the study area; however, in the Lucero uplift area there is some recharge to the San Andres-Glorieta aquifer. The ground water near this localized recharge area moves to the west.
83

Discharge of water from the San Andres-Glorieta aquifer occurs by spring discharge, withdrawal from wells, underflow out of the study area, and leakage to adjacent rocks. Prior to development of ground-water resources in the Grants area, Ojo del Gallo probably was a major discharge point in the part of the aquifer northwest of Grants. The earliest recorded discharge of the spring, measured in August and November 1937, was 7 cubic feet per second. Discharge did not occur at Ojo del Gallo from 1953 to 1982. The decrease in discharge at Ojo del Gallo probably was due to ground-water withdrawal in the Grants-Bluewater area. In February 1983, discharge from Ojo del Gallo was 0.03 cubic foot per second, which increased to 1.72 cubic feet per second by February 1986. Concentrations of dissolved constituents in ground water discharging from Ojo del Gallo also increased between 1946 and 1984.
Discharge from the San Andres-Glorieta aquifer at Horace Springs has been postulated. However, evaluation of hydrologic, geologic, and water-chemistry data seems to indicate that water discharging from Horace Springs is derived from the alluvial aquifer.
Discharge of water from the San Andres-Glorieta aquifer in the Grants- Bluewater area increased substantially in the mid-1940's when irrigation wells began to withdraw water for irrigation. In 1955, 85 percent of the 13,600 acre-feet of water withdrawn from the aquifer was used for irrigation. However, the discovery of uranium ore north of Grants in 1955, a population increase in the Grants-Bluewater area, and a decline in the amount of land irrigated by ground water led to major changes in ground-water use and the location of ground-water withdrawals after 1955. Ground-water withdrawals peaked in 1956 when 14,210 acre-feet was pumped from the aquifer. Industrial use accounted for 32 percent and irrigation accounted for 65 percent of the withdrawals. By 1982, ground-water pumpage had decreased to 3,900 acre-feet. The large amount of ground-water pumpage and the change in location of pumpage with time probably resulted in changes in the direction of ground-water movement in the aquifer. Water-chemistry data indicate that changes in ground-water chemistry also occurred during this time. The mechanism for discharge of ground water from the San Andres-Glorieta aquifer east of the Zuni uplift is not known, but several possibilities exist. Underflow of ground water into the Rio Grande rift sediments is one possibility; however, in the area north of the Lucero uplift where this underflow possibly could occur, the San Andres-Glorieta aquifer is probably in fault contact with fine grained sediments and the amount of leakage into these sediments is thought to be very small. Another possibility is discharge from Pennsylvanian rocks east of the San Andres-Glorieta aquifer in the Lucero uplift area. The source of this water may be downward leakage from the San Andres-Glorieta aquifer through the Yeso and Abo Formations. No obvious recharge areas for the Pennsylvanian rocks are known so the source of water discharging from these rocks may be leakage (discharge) from the San Andres-Glorieta aquifer along faults and dikes in the Acoma embayment area. Water-chemistry data indicate that the relative proportions of dissolved constituents are similar between ground water in the San Andres-Glorieta aquifer near the Lucero uplift area and ground water discharging from the Pennsylvanian rocks in this same area. However, the concentration of dissolved constituents in ground water in the San Andres-Glorieta aquifer is smaller than in water discharging from the Pennsylvanian rocks.
84

Specific conductance of ground water derived from the San Andres-Glorieta aquifer in the Thoreau area ranges from 470 to 1,390 microsiemens per centimeter at 25 degrees Celsius. Calcium and magnesium are the dominant cations and bicarbonate and sulfate are the dominant anions in ground water in this area. Ground-water chemistry in the Grants-Bluewater area is variable, although, in general, calcium is the dominant cation and bicarbonate and sulfate are the dominant anions. Changes in the concentrations of dissolved sulfate, chloride, and nitrate have occurred in ground water in the Grants- Bluewater area. These changes probably are, in part, due to human activities. Ground water in the Acoma embayment area increases in specific conductance from west to east from approximately 1,000 to greater than 14,000 microsiemens. Calcium is the dominant cation and bicarbonate and sulfate are the dominant anions in ground water near the recharge area on the western side of the Acoma embayment area. As ground water moves eastward in the Acoma embayment area, dissolved-sodium, sulfate, and chloride concentrations increase significantly. On the basis of ground-water chemistry, some ground water recharges the San Andres-Glorieta aquifer in the Lucero uplift area along the southeastern margin of the Acoma embayment.
85

SELECTED REFERENCES
Aqua Science, Inc., 1982, Study of the Rio San Jose basin above the Acoma Indian Reservation: Consultant's report to the Pueblo of Acoma, March 1982, 370 p.
Baars, D.L., 1962, Permian system of Colorado Plateaus: American Association of Petroleum Geologists Bulletin, v. 46, no. 2, p. 149-218.
Baars, D.L., and Stevenson, G.M., 1977, Permian rocks of the San Juan Basin, in Guidebook of San Juan Basin III, northwestern New Mexico: New Mexico Geological Society, 28th Field Conference, p. 133-138.
Billings and Associates, Inc., and S.S. Papadopulos & Associates, Inc., no date, Hydrogeologic investigation to evaluate the effects of Plains' applications, file numbers B-72 and B-72-S into 1605 and B-17 et al Comb.; B-43-H into 1605 and B-17 et al Comb.; B-43-F and B-43-I into 1605 and B-17 et al Comb.; B-87-C into 1605 and B-17 et al Comb.; B-87-D into 1605 and B-17 et al Comb.: Consultants' report to Plains Electric Generation and Transmission Cooperative, Inc., 38 p., 6 pis.
Callender, J.F. , and Zilinski, R.E., Jr., 1976, Kinematics of Tertiary and Quaternary deformation along the eastern edge of the Lucero Uplift, central New Mexico: New Mexico Geological Society Special Publication 6, p. 53-61.
Cooper, J.B., and John, E.G., 1968, Geology and ground-water occurrence in southeastern McKinley County, New Mexico: New Mexico State Engineer Technical Report 35, 108 p.
Grumpier, L.S., 1982, Volcanism in the Mount Taylor region, in Albuquerque Country II: New Mexico Geological Society, 33d Field Conference, p. 291-298.
Dames and Moore, 1981, Volume VIII--Pumping test evaluations, Bluewater Uranium Mill vicinity near Grants, New Mexico, for Anaconda Copper Company: Consultant's report to Anaconda Copper Company, October 15, 1981, 7 p.
1986. Ground water model, above-grade tailings impoundment, Bluewater Mill and vicinity near Grants, New Mexico, for Anaconda Minerals Company: Consultant's report to Anaconda Copper Company, job 4010-091-06, 26 p., 99 pis., 2 appendices.
Dane, C.H., and Bachman, G.O., 1965, Geologic map of New Mexico: U.S. Geological Survey, scale 1:500,000, 2 sheets.
Davies, P.B., 1987, Modeling areal, variable-density, ground-water flow using equivalent freshwater head--Analysis of potentially significant errors: NWWA Conference on Solving Ground Water Problems with Models, February 10-12, 1987, Denver, Colo., Proceedings, v. 2, p. 888-903.
86

SELECTED REFERENCES-- Continued
Fitzsimmons, J.P., 1959, The structure and geomorphology of west-central New Mexico, in Guidebook of west-central New Mexico: New Mexico Geological Society, 10th Field Conference, p. 112-116.
Foster, R.W. , 1957, Stratigraphy of west-central New Mexico, in Geology of southwestern San Juan Basin: Four Corners Geological Society, Second Field Conference, p. 62-72.
Freeze, R.A., and Cherry, J.A., 1979, Groundwater: Englewood Cliffs, N.J., Prentice-Hall, 604 p.
Frenzel, P.P., 1992, Simulation of ground-water flow in the San Andres- Glorieta aquifer in the Acoma embayment and eastern Zuni uplift, west- central New Mexico: U.S. Geological Survey Water-Resources Investigations Report 91-4099, 381 p.
Frenzel, P.F., and Lyford, F.P., 1982, Estimates of vertical hydraulic conductivity and regional ground-water flow rates in rocks of Jurassic and Cretaceous age, San Juan Basin, New Mexico and Colorado: U.S. Geological Survey Water-Resources Investigations Report 82-4015, 59 p.
Geohydrology Associates, Inc., 1981, In the matter of the plan of replacement of Plains Electric Generation and Transmission Cooperative, Inc.: Consultant's report to Plains Electric Generation and Transmission Cooperative, Inc., Albuquerque, N. Mex., September, 1981, 81 p.
_____1983, In the matter of items relating to the declaration of water rightsfor land owned by Mr. Henry Andrews, Jr.: Consultant's report toMr. Henry Andrews, June 1983, Albuquerque, N. Mex., 6 p.
_____1984, Summary of well and aquifer performance test of Plains wells B-18 and B-19, Yager and McBride wells, near Grants, New Mexico: Consultant's report to Plains Electric Generation and Transmission Cooperative, Inc., Albuquerque, N. Mex., August 1984, 47 p.
Goff, F.E., McCormick, T., Gardner, J.N., Trujillo, P.E., Counce, D., Vidale, Rosemary, and Charles, R.W., 1983, Water geochemistry of the Lucero uplift, New Mexico--A geothermal investigation of 1 ow-temperature mineralized fluids: Los Alamos National Laboratories Report LA-9738-OBES, April 1983, 26 p.
Gordon, E.D., 1961, Geology and ground-water resources of the Grants-Bluewater area, Valencia County, New Mexico, with a section on Aquifer characteristics, by N.L. Reeder, and a section on Chemical quality of the ground water, by J.L. Kunkler: New Mexico State Engineer Technical Report 20, 109 p.
Green, M.W., and Pierson, C.T., 1971, Geologic map of the Thoreau NE quadrangle, McKinley County, New Mexico: U.S. Geological Survey Geologic Quadrangle Map GQ-954, scale 1:24,000.
87

SELECTED REFERENCES--Continued
Guilinger, D.R., 1982, Geology and uranium potential of the Tejona Mesa- Hubbell Draw area, Catron County, New Mexico: Socorro, New Mexico Bureau of Mines and Mineral Resources Open-File Report 176, 129 p.
Heath, R.C., 1983, Basic ground-water hydrology: U.S. Geological Survey Water-Supply Paper 2220, 84 p.
Hodges, P.V., 1938, Report on irrigation and water supply of the pueblos of New Mexico in the Rio Grande basin: U.S. Department of the Interior, Indian Irrigation Service, 438 p.
Hydro-Search, Inc., 1977, Hydrogeology of the Bluewater Mill tailings pond area, Valencia County, New Mexico: Consultant's report to Anaconda Copper Company, October 17, 1977, 111 p.
_____1978a, Supplement to the hydrogeology report of October 17, 1977, Bluewater Mill area, Valencia County, New Mexico: Consultant's report to Anaconda Copper Company, November 15, 1978, 69 p.
_____1978b, Ground-water monitoring program, Bluewater Mill area, Valencia County, New Mexico: Consultant's report to Anaconda Copper Company, November 15, 1978, 25 p.
_____1981, Regional ground-water hydrology and water chemistry, Grants- Bluewater area, Valencia County, New Mexico: Consultant's report to Anaconda Copper Company, May 15, 1981, 85 p., 9 pis., 6 appendices, 2 v.
Jacob, C.E., 1956, Preliminary report on mine drainage and groundwater supply in Ambrosia Lake area, McKinley County, New Mexico: Consultant's report to Kermac Nuclear Fuels Corporation, Grants, N. Mex., October 1957, 24 p., 10 appendices.
Jicha, H.L. , 1958, Geology and mineral resources of Mesa del Oro quadrangle, Socorro and Valencia Counties, New Mexico: Socorro, New Mexico Bureau of Mines and Mineral Resources Bulletin 56, 67 p.
Kelley, V.C., and Clinton, N.J., 1960, Fracture systems and tectonic elements of the Colorado Plateaus: Albuquerque, University of New Mexico Press, Publications in Geology, no. 6, 104 p.
Kelley, V.C., and Wood, G.H., 1946, Geology of the Lucero uplift, Valencia, Socorro, and Bernalillo Counties, New Mexico: U.S. Geological Survey Oil and Gas Inventory Preliminary Map 47, scale 1:63,360.
Kernodle, J.M., and Scott, W.B., 1986, Three-dimensional model simulation of steady-state ground-water flow in the Albuquerque-Belen Basin, New Mexico: U.S. Geological Survey Water-Res ources Investigations Report 84-4353, 58 p.
Lohman, S.W., 1972, Ground-water hydraulics: U.S. Geological Survey Professional Paper 708, 80 p.
88

SELECTED REFERENCES--Continued
Lyf ord, F.P., 1979, Ground water in the San Juan Basin, New Mexico and Colorado: U.S. Geological Survey Water-Resources Investigations 79-73, 22 p.
Lyford, F.P., Frenzel , P.P., and Stone, W.J., 1980, Preliminary estimates of effects of uranium-mine dewatering on water levels, San Juan Basin, in Geology and mineral technology of the Grants uranium region, 1979: Socorro, New Mexico Bureau of Mines and Mineral Resources Memoir 38, p. 320-333.
Maxwell, C.H., 1976, Stratigraphy and structure of the Acoma region, New Mexico, in Woodward, L.A., and Northrop, S.A., eds., Tectonics and mineral resources of southwestern North America: New Mexico Geological Society Special Publication 6, p. 95-101.
_____1981, Geologic map of El Malpais Instant Study area and adjacent areas, Valencia County, New Mexico: U.S. Geological Survey Miscellaneous Field Studies Map MF-1375-A, scale 1:62,500.
McKee, E.D., 1933, The Coconino Sandstone--Its history and origin: Carnegie Institute of Washington Publication 440, p. 77-115.
Moench, R.H., and Schlee, J.S., 1967, Geology and uranium deposits of the Laguna District, New Mexico: U.S. Geological Survey Professional Paper 519, 117 p.
Morgan, A.M., 1938, Ground-water conditions in a portion of the Rio San Jose- Bluewater valley in the vicinity of Grants, New Mexico: U.S. Geological Survey open-file report, 16 p.
Murray, C.R., 1945, Preliminary conclusions on ground-water conditions in the Bluewater area, Valencia County, New Mexico: U.S. Geological Survey Open-File Report, 4 p.
Orr, B.O., 1987, Water resources of the Zuni tribal lands, McKinley and Cibola Counties, New Mexico: U.S. Geological Survey Water-Supply Paper 2227, 76 p.
O'Sullivan, R.B., 1977, Triassic rocks in the San Juan Basin of New Mexico and adjacent areas, in Guidebook of San Juan Basin III, northwestern New Mexico: New Mexico Geological Society, 28th Field Conference, p. 139-146.
Piper, A.M., 1944, A graphic procedure in the geochemical interpretation of water analyses: American Geophysical Union Transactions, v. 25, p. 914-923.
Reiter, Marshall, Edwards, C.L., Hartman, Harold, and Weidman, Charles, 1975, Terrestrial heat flow along the Rio Grande Rift, New Mexico and southern Colorado: Geological Society of America Bulletin, v. 86, p. 811-818.
89

SELECTED REFERENCES--Continued
Risser, D.W., 1982, Estimated natural streamflow in the Rio San Jose upstream from the Pueblos of Acoma and Laguna, New Mexico: U.S. Geological Survey Water-Resources Investigations Report 82-4096, 51 p.
Risser, D.W., and Lyford, P.P., 1983, Water resources on the Pueblo of Laguna, west-central New Mexico: U.S. Geological Survey Water-Resources Investigations Report 83-4038, 308 p.
Shomaker, J.W., 1968, Site study for a water well, Fort Wingate Army Ordinance Depot, McKinley County, New Mexico: U.S. Geological Survey Open-File Report, 28 p.
_____1969, Drilling and testing of well 340, Fort Wingate Army Depot, McKinley County, New Mexico: U.S. Geological Survey Open-File Report, 57 p.
_____1971, Water resources of Fort Wingate Army Depot and adjacent areas, McKinley County, New Mexico: U.S. Geological Survey Open-File Report, 230 p.
Slack, P.B., and Campbell, J.A., 1976, Structural geology of the Rio Puerco fault zone and its relationship to central New Mexico tectonics, jLn Woodward, L.A., and Northrop, S.A., eds., Tectonics and mineral resources of southwestern North America, 1976: New Mexico Geological Society Special Publication 6, p. 46-51.
Spiegel, Zane, 1955, Geology and ground-water resources of northeastern Socorro County, New Mexico: Socorro, New Mexico Bureau of Mines and Mineral Resources Ground-Water Report 4, 99 p.
Stone, W.J., Lyford, F.P., Frenzel , P.F., Mizell, N.H., and Padgett, E.T. , 1983, Hydrogeology and water resources of San Juan Basin, New Mexico: Socorro, New Mexico Bureau of Mines and Mineral Resources Hydrologic Report 6, 69 p.
Thaden, R.E., and Ostling, E.J., 1967, Geologic map of the Bluewater quadrangle, Valencia and McKinley Counties, New Mexico: U.S. Geological Survey Geologic Quadrangle Map GQ-679, scale 1:24,000.
Thaden, R.E. , Merrin, Seymour, and Raup, O.B., 1967a, Geologic map of the Grants SE quadrangle, Valencia County, New Mexico: U.S. Geological Survey Geologic Quadrangle Map GQ-682, scale 1:24,000.
Thaden, R.E., Santos, E.S., and Raup, O.B., 1967b, Geologic map of the Dos Lomas quadrangle, Valencia and McKinley Counties, New Mexico: U.S. Geological Survey Geologic Quadrangle Map GQ-680, scale 1:24,000.
_____1967c, Geologic map of the Grants quadrangle, Valencia County, New Mexico: U.S. Geological Survey Geologic Quadrangle Map GQ-681, scale 1:24,000.
90

SELECTED REFERENCES--Concluded
Thaden, R.E., and Zech, R.S., 1984, Preliminary structure contour map on the base of the Cretaceous Dakota Sandstone in the San Juan Basin and vicinity, New Mexico, Arizona, Colorado, and Utah: U.S. Geological Survey Miscellaneous Field Studies Map MF-1673, scale 1:500,000.
Titus, F.B., Jr., 1963, Geology and ground-water conditions in eastern Valencia County, New Mexico: Socorro, New Mexico Bureau of Mines and Mineral Resources Ground-Water Report 7, 113 p.
Todd, D.K., 1959, Ground water hydrology: New York, John Wiley and Sons, 336 p.
Tonking, W.H., 1957, Geology of Puertocito quadrangle, Socorro County, New Mexico: Socorro, New Mexico Bureau of Mines and Mineral Resources Bulletin 41, 67 p.
U.S. Bureau of Indian Affairs, 1984, Bluewater Basin--Withdrawals and sources of water: Bureau of Indian Affairs, Albuquerque, N. Mex., 36 p.
U.S. Department of Agriculture, 1972, Gross annual lake evaporation--New Mexico, in U.S. Bureau of Reclamation, 1976, New Mexico water resources assessment for planning purposes: U.S. Bureau of Reclamation Map 8.
U.S. Geological Survey, 1946-55, Water levels and artesian pressures in observation wells in the United States, Pt. 6, Southwestern States and Territory of Hawaii: Water-Supply Papers 1076, 1101, 1131, 1161, 1170, 1196, 1226, 1270, 1326, and 1409.
Walton, W.C., 1970, Ground-water resource evaluation: New York, McGraw-Hill, 664 p.
Ward, J.J., Walters, G.R., Alweis, S.J., Axen, G.J., and Bentley, H.W., 1982, Effects of uranium mine dewatering on the resources of the Pueblo of Laguna, New Mexico: Consultant's report to Pueblo of Laguna, New Mexico.
West, S.A., 1972, Disposal of uranium-mill effluent by well injection in the Grants area, Valencia County, New Mexico: U.S. Geological Survey Professional Paper 386-D, 28 p.
Wolff, R.G., 1981, Porosity, permeability, distribution coefficients, and dispersivity, in Touloukian, Y.S., Judd, W.R., and Roy, R.F., 1981, Physical properties of rocks and minerals: New York, McGraw Hill/CINDAS, v. II-2, p. 45-81.
Woodward, L.A., and Callender, J.F., 1977, Tectonic framework of the San Juan Basin, in Guidebook of San Juan Basin III, northwestern New Mexico: New Mexico Geological Society, 28th Field Conference, p. 209-212.
Wright, H.E. , Jr., 1946, Tertiary and Quaternary geology of the lower Rio Puerco area, New Mexico: Geological Society of America Bulletin, v. 57, no. 5, p. 383-456.
91

SUPPLEMENTAL INFORMATION
92

This Supplemental Information section contains the results of aquifer tests conducted on hydrologic-test wells that were drilled in areas where little or no data were available when the study began. Different types of analyses were done depending on the data obtained during the test. When sufficient water-level-recovery data were available, the Jacob straight-line method and the recovery method (Lohman, 1972, p. 19-27) were used to calculate a transmissivity of the tested interval. A method of estimating transmissivity using specific-capacity data (Walton, 1970, p. 314-321) obtained during an aquifer test was used when the available data were not adequate for more detailed analysis.
Flow Test Conducted at Laguna Casa Blanca 86-1 Well f9N.6W.16.lll) on July 8. 1986
On July 8, 1986, an aquifer test was conducted at Laguna Casa Blanca 86-1 well (9N.6W.16.Ill) to determine aquifer properties. The hole was open to 328 feet of the San Andres Limestone and 120 feet of the Glorieta Sandstone of the San Andres-Glorieta aquifer. The shut-in pressure at 1330 hours, just prior to the start of the test, was 159.5 pounds per square inch at a measuring point 1.6 feet above land surface. This pressure was not corrected for barometric effects. Converted to feet of head, the water would stand 368 feet above land surface. Land surface is approximately 5,990 feet above sea level at this well; therefore, the potentiometric surface at this well is approximately 6,358 feet above sea level.
At 1330 hours July 8, 1986, the valve on the well was opened and the well was allowed to flow freely. Discharge was measured by diverting the discharge into a 55-gallon barrel and measuring the time it took to fill the barrel. At 1915 hours July 11, 1986, the well was shut in. The average discharge for the 4,665-minute flow test was 46 gallons per minute. Water-level-recovery data were collected after shut-in using a pressure transducer and a data logger. A 0- to 200-pound-per-square-inch pressure gage was used as a check and backup to the pressure transducer. The gage was marked in divisions of 2 pounds per square inch. The linearity and accuracy of the gage were checked using a dead-weight tester. The gage response was linear over the range of 0 to 200 pounds per square inch and had an accuracy of 1 pound per square inch ±0.5 pound per square inch. Checks between the pressure transducer and the pressure gage indicated that the pressure-transducer readings were within the accuracy of the pressure gage.
The Jacob straight-line method and the recovery method (Lohman, 1972, p. 19-27) were used to calculate the transmissivity (figs. 35 and 36). An average discharge of 46 gallons per minute was used in the calculation of transmissivity. A transmissivity of 506 feet squared per day was calculated using the Jacob straight-line method (fig. 35) and a transmissivity of 579 feet squared per day was calculated using the recovery method (fig. 36).
93

VO
LU
LU
U.
O
Q I <r
Q Z) 9 CO
LU <rD
RA
WD
OW
N P
ER
LO
G C
YC
LE -
3.2
fee
t F
LOW
RA
TE
= 4
6 gallo
ns
per
min
ute
n 1
46 g
allo
ns \ /
T
RA
NS
MIS
SIV
ITY
=
2.3
( m
jnut
e )
(
4
/ 3.^
teet
\ /
f.4
o g
anon
s \
\ lo
g cy
cle
/ \
cubic
fe
et
/
= 50
6 fe
et s
quar
ed p
er d
ay
1,00
010
,000
TIM
E S
INC
E F
LOW
BE
GA
N.
IN M
INU
TE
S
TIM
E S
INC
E F
LOW
EN
DE
D,
IN M
INU
TE
S
Fig
ure
35.-
-Resu
lts
of
Jaco
b str
aig
ht-
lin
e
met
hod
of
analy
sis
use
d to
calc
ula
te
transm
issi
vit
y of
Lag
una
Cas
a B
lanca
86
-1 w
ell
.

cn
2.5
cc LJJ
Q
CC
O
O
LJJ * LJJ
O m SK
7.5
LJJ
X O CC
Q
10
12.5 15
i I
i i
i i
i i
1 I
I I
i i
i i i
I
I I
I i
i i
11T
I I
i i
i i
DR
AW
DO
WN
PE
R L
OG
CY
CLE
= 2
.8 F
EE
T
FLO
W R
ATE
= 4
6 G
ALL
ON
S P
ER
MIN
UT
E
TR
AN
SM
ISS
IVIT
Y =
2.3
( 4
6 9
a"°n
s )
(1.
440
min
utes
V
min
ute
/V
dav
day
An
( 2
-8fe
et
W 7
.48
gallo
ns\
v lo
g cy
cle
/ \
cubi
c fe
et
/
579
feet
squ
ared
per
day
J i
i i
i I
i i i
i i
i I
i I
i I
iI
I I
I I
I 1
I
10
100
1,00
0
TIM
E S
INC
E F
LOW
ST
OP
PE
D,
IN M
INU
TE
S
10,0
00
Figu
re 36
.--R
esul
ts of
re
cove
ry method of
an
alys
is used to
ca
lcul
ate
tran
smis
sivi
ty
of Laguna Ca
sa Blanca 86
-1 we
ll.

Flow Test Conducted at Laguna Sand Canyon 86-1 Well (8N.6W. 20.333') on May 23. 1986
On May 23, 1986, a flow test was conducted at Laguna Sand Canyon 86-1 well (8N.6W.20.333) to determine aquifer properties of the San Andres-Glorieta aquifer. The hole was open to 89 feet of the Chinle Formation, 342 feet of the San Andres Limestone, 167 feet of the Glorieta Sandstone, and 33 feet of the Yeso Formation. The shut-in pressure at 1300 hours May 23, 1986, just prior to the test, was 156.4 pounds per square inch measured with a pressure transducer at 7.3 feet above land surface. The pressure was not corrected for barometric effects. Converted to feet of head, the water would stand 365 feet above land surface. Land surface is approximately 6,025 feet above land surface, so the potentioraetric surface at this well is approximately 6,390 feet above sea level. At 1530 hours May 23, 1986, the valve on the well was opened and the well was allowed to flow freely. Discharge was measured by diverting the discharge into a 55-gallon barrel and measuring the time it took to fill the barrel. Discharge at 1300 hours on May 24, 1986 (1,290 minutes since flow began), was 40.7 gallons per minute. Discharge at 1048 hours on May 27, 1986 (5,490 minutes since flow began), was 38.8 gallons per minute. The well was shut in at 1100 hours, May 27, 1986, and water-level-recovery data were collected using a pressure transducer and data logger. A 0- to 200- pound -per -square -inch pressure gage was used as a check and backup to the pressure transducer. The gage was marked in increments of 2 pounds per square inch. The linearity and accuracy of the gage were checked using a dead-weight tester. The gage response was linear over the range of 0 to 200 pounds per square inch and had an accuracy of 1 pound per square inch ±0.5 pound per square inch. The Jacob straight-line method and the recovery method (Lohman, 1972, p. 19-27) were used to calculate transmissivity (figs. 37 and 38). A discharge of 40 gallons per minute was used in the calculation of transmissivity. A transmissivity of 100 feet squared per day was calculated using the Jacob straight-line method (fig. 37), and a transmissivity of 117 feet squared per day was calculated using the recovery method (fig. 38).
Flow Test Conducted at Acoma-Sky City 86-1 Well (8N.8W.25.423) on December 4-8. 1986
December 4 through December 8, 1986, an aquifer test was conducted at Acoma-Sky City 86-1 well (8N.8W.25.423) to determine aquifer properties of the San Andres-Glorieta aquifer. The hole was open to 355 feet of the San Andres- Glorieta aquifer. The static water level on June 8, 1987, in this well was 14.2 feet above land surface. Land surface at this well is approximately 6,400 feet; therefore, the potentiometric surface at this well is 6,414.2 feet above sea level.
96

100
H LLJ UJ
OQ
DC Q
200
300
400
o
o
DRAWDOWN PER LOG CYCLE = 14.0 feet FLOW RATE = 40 gallons per minute
40 gallons \ /1,440 minutes\TRANSMISSIVITY = 2.3 (
O
minute day
/ 14 feet \ / 7.48 gallons \ \ log cycle / V cubic feet /
= 100 feet squared per day
I I I 11110 100 1,000 10,000 100,000
TIME SINCE FLOW BEGAN. IN MINUTES TIME SINCE FLOW ENDED, IN MINUTES
Figure 37.--Results of Jacob straight-line method of analysis used to calculate transraissivity of Laguna Sand Canyon 86-1 well.
At 0725 hours on December 4, 1986, the pumping part of the aquifer test was begun with a 10-horsepower pump. Before pumping, the well was flowing at 2.9 gallons per minute over the top of the casing, which was 1.4 feet above land surface. The pump ran continuously until 0800 hours on December 7, 1986. The total volume of water pumped, measured with a flowmeter, was 157,868 gallons during the 4,355 minutes of pumping. The average discharge for the pumping period was 36.2 gallons per minute. At 0725 hours on December 7, 1986, the drawdown was 401.5 feet below land surface. The drawdown below the static water level was 415.7 feet. The specific capacity of the well at 0725 hours on December 7, 1986, assuming an average discharge of 36.2 gallons per minute, was approximately 0.1 gallon per minute per foot of drawdown. The estimated transmissivity using the above specific capacity, assuming a 24-hour pumping period, is approximately 25 feet squared per day (Walton, 1970, p. 318).
97
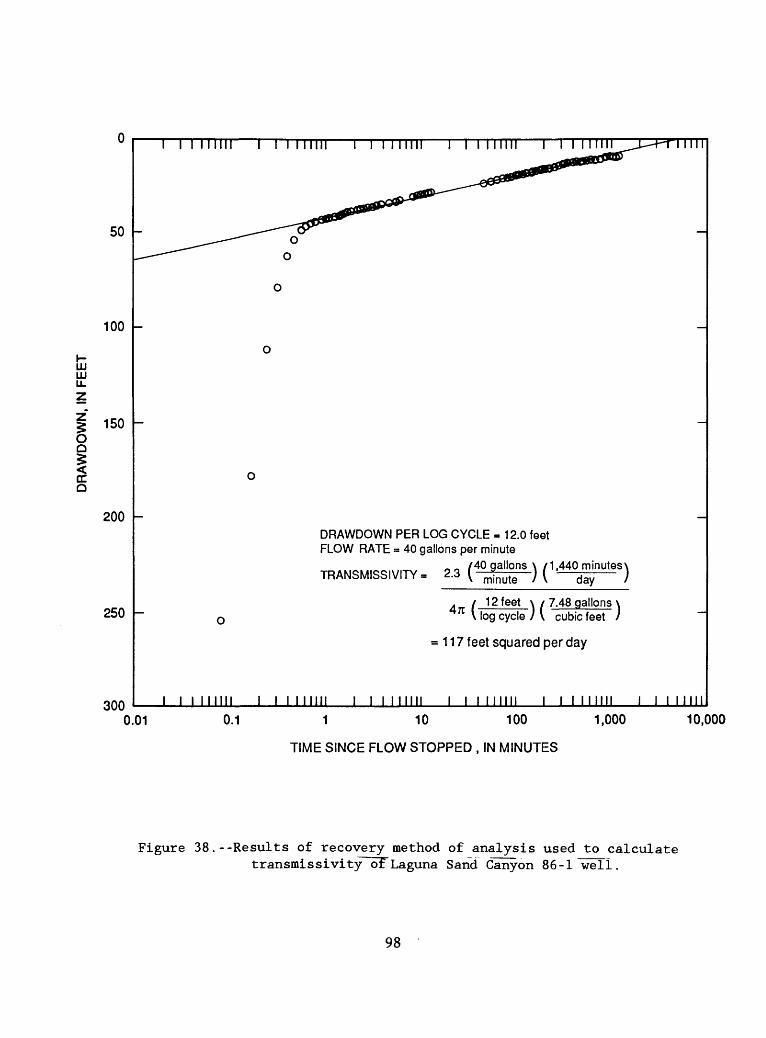
50
100
UJ UJu.
IaIoc a
150
200
250
300
i i i 11 mi i i i i inn I I I I Mill 11iii
DRAWDOWN PER LOG CYCLE = 12.0 feet FLOW RATE = 40 gallons per minute
^40 gallons \ /1,440 minutes\ minute / \ day /
/ 12 feet \ / 7.48 gallons \
TRANSMISSIVITY = 2.3
4 / ee \ / . gaons \ \ log cycle / \ cubic feet /
= 117 feet squared per day
i i i unn i i i i inn i i i i inn i i i i mi0.01 0.1 1 10 100
TIME SINCE FLOW STOPPED , IN MINUTES
1,000 10,000
Figure 38.--Results of recovery method of analysis used to calculate transmissivity of Laguna Sand Canyon 86-1 well.
98

Flow Test Conducted at BLM-North Pasture 86-1 Well (6N.10W.7.141 ̂ on November 26. 1986
On November 26, 1986, an aquifer test was conducted at BLM-North Pasture 86-1 well (6N. 10W. 7 .141) to determine aquifer properties of the San Andres- Glorieta aquifer. The hole was open to 45 feet of the Chinle Formation and 383 feet of the San Andres Limestone and Glorieta Sandstone. The static water level in this well is 711 feet below land surface. Land surface at this well is approximately 7,130 feet above sea level; therefore, the potentiometric surface at this well is 6,419 feet above sea level.
At 0914 hours on November 26, 1986, the pumping part of the aquifer test was begun with a 15-horsepower pump. The pump ran continuously until 1830 hours on November 26, 1986. A total volume of 21,761 gallons of water was pumped during the 556 minutes of the test. The average flow rate for the test was 39 gallons per minute. At 1700 hours, November 26, the pumping water level was 845.3 feet below land surface and drawdown was 134.3 feet. The specific capacity of the well at 1700 hours, assuming an average discharge of 39 gallons per minute, is 0.3 gallon per minute per foot. The estimate of transmissivity using the calculated specific capacity, assuming 8 hours of pumping, is about 70 feet squared per day (Walton, 1970, p. 317).
Flow Test Conducted at Red Lake Ranch-La Mosca 86-1 Well (5N.8W.35.123) on December 14-18. 1986
December 14 through December 18, 1986, an aquifer test was conducted at Red Lake Ranch-La Mosca 86-1 well (5N.8W.35.123) to determine the aquifer properties of the San Andres-Glorieta aquifer. The hole was open to 1 foot of the Chinle Formation and 323 feet of the San Andres Limestone. A 10-foot cavernous zone and three 2-foot cavernous zones were penetrated in the San Andres Limestone during the drilling of this hole. The static water level in this well on December 14, 1986, prior to the start of the test, was 552.8 feet below land surface. Land surface at this well is approximately 6,977 feet above sea level; therefore, the potentiometric surface at this well is about 6,424 feet above sea level.
At 1546 hours on December 14, 1986, the pumping part of the test was begun with a 40-horsepower pump. The pump was stopped at 0900 hours on December 16, 1986. A total volume of 356,557 gallons was pumped during the 2,474 minutes of pumping. The average flow rate was 144 gallons per minute. At approximately 0845 hours on December 16, 1986, the drawdown was 3.8 feet. This drawdown can be attributed to head loss due to friction in the liner and casing in the well. This indicates that the pumping rate used during the test of this well was not large enough to sufficiently stress the aquifer. Therefore, no quantitative estimate of the transmissivity of the aquifer at this well can be made. The presence of cavernous zones and the lack of drawdown in the well during the aquifer test do indicate that the transmissivity of the San Andres-Glorieta aquifer in this area is large.
99

Flow Test Conducted at Anzac 86-1 Well QO.9.25.3241) on July 9-10. 1986
On July 9, 1986, an aquifer test was conducted at Anzac 86-1 well (10.9.25.3241) to determine aquifer properties. This well had been shut in since June 6, 1986, when drilling operations at the well were completed. The well was equipped with an 8-inch shutoff valve on top of the casing. The top of the shutoff valve, referred to hereafter as the measuring point, is 2.0 feet above land surface. Land surface is estimated to be 6,280 feet above sea level from a Geological Survey topographic map. Shut-in pressure on June 11, 1986, was 62 pounds per square inch, measured with a pressure gage at a point 4.0 feet above land surface. The pressure reading was not corrected for barometric effects. Converted to feet of head, water would stand at 147 feet above land surface. Potentiometric surface at this pressure is at an altitude of 6,427 feet.
For the flow test, the well was equipped with a 6-inch tee on the 8-inch valve, and a 40-foot-long, 6-inch-diameter discharge pipe was run from the 6- inch tee. A 4-foot section of 6-inch pipe was added to the 40-foot pipe to accommodate a Glampitron 1 discharge meter. Tubing for a pressure transducer also was installed in the 4-foot section of pipe. Downstream from the 4-foot section a 6-inch McCrowmeter was installed.
A 6-inch shutoff valve was installed on the downstream end of the McCrowmeter to provide back pressure for discharge control. Approximately 300 feet of 6-inch pipe was added to carry the discharge water to the Rio San Jose.
Monitoring equipment for the test included a pressure transducer mounted 0.9 foot above the measuring point, 0- to 60- and 0- to 200-pound-per-square - inch pressure gages mounted 0.1 foot below the measuring point, a McCrowmeter discharge meter with discharge and totalizer readings, and a Clampitron flowmeter. Shut-in pressure on July 9, 1986, before the test was started, was 59.8 pounds per square inch, or about 139.9 feet of head above land surface.
iUse of brand names in this report is for identification purposes only and does not constitute endorsement by the U.S. Geological Survey.
100

The test, started July 9, was run as a step-drawdown test and the discharge was measured with the McCrowmeter and the Clarapitron flowmeters. The Clampitron flowmeter malfunctioned at 1630 hours, July 9. On July 10, it became apparent that the discharge measurements made with both flowmeters were in error. The discharge water contained a considerable amount of gas. It is believed that the gas resulted from degassing of the discharge water as it was raised from the aquifer to land surface. The gas in the discharge water probably caused both flowmeters to underestimate the actual discharge. On July 10, a modified 6-inch Parshall flume was installed in a concrete irrigation ditch into which the discharge was directed. The discharge was measured at 2,820 gallons per minute. The McCrowmeter indicated a discharge of 1,100 gallons per minute. The step intervals, McCrowmeter measurements, and the Parshall flume measurement are listed below. Numbers in parentheses were interpolated from observed flowmeter and Parshall flume measurements made during step 8. The average discharge rate for the flow test was 2,360 gallons per minute.
Discharge (gallons per minute)
Step Time McCrowmeter Parshall flume
1 0800-0900 July 92 0900-10303 1030-12304 1230-14125 1412-1530
6 1530-18357 1835-19008 1900-1500 July 10
100240400550750
9501,2001,100
(260)(6-20)
(1,020)(1,410)(1,920)
(2,440)(3,080)2,820
The initial increase in head from 0800 to about 0900 hours probably was due to thermal expansion or degassing of the column of water. Thermal expansion or degassing of the water may have continued past 0900 hours.
The well was shut in at 1500 hours, July 10, 1986, and the head was monitored through 1140 hours, July 14, 1986. After the well was shut in, the transducer and pressure gage were moved to the well head to allow the drilling crew to remove the discharge pipe. At this new location the transducer was mounted at 1.8 feet above the measuring point and the pressure gage was mounted at 3.0 feet above the measuring point.
101

Recovery at Acoma 1 Well
Acoraa 1 well (9.9.28.1344) was equipped with a Fischer-Porter analog digital recorder, set on 1/2-hour punch intervals. The recorder therefore collected water levels 48 times per day. The recorder was driven by a float and counterweight, and clock time was advanced by a battery-driven digital clock. Punched tapes are removed from the recorder at approximately 3-month intervals. When the tape was removed from the recorder on August 1, 1986, two drawdown and recovery intervals were recorded.
The first drawdown and recovery interval at Acoma 1 well coincided with drilling of the Anzac 86-1 well during June 4-6, 1986, when the well flowed freely from the San Andres-Glorieta aquifer. The second drawdown and recovery period at Acoma 1 coincided with flow testing of Anzac 86-1 on July 9-10, 1986. Water-level data from Acoma 1 well for this recovery period were run through a smoothing program to reduce the amount of "noise" due to barometric and earth-tide fluctuations. Recovery data from Acoma 1 well for 1730 hours, July 10, to 1400 hours, August 1, 1986, were then plotted as time since flow stopped versus recovery in feet on a semilog plot (fig. 39). The recorder clock time at Acoma 1 probably was not synchronized with watch time used at Anzac 86-1. The distance from Anzac 86-1 to Acoma 1 is approximately 35,000 feet.
Water-level monitoring at Acoma 1 indicates that from January 1984 through September 1985 water levels in the well fluctuated over a range of about 0.8 foot but did not show long-term rises or declines (fig. 40). However, in mid-September 1985, a water-level decline of about 0.5 foot occurred, followed by a gradual rise in water level. This water-level rise continued through mid-March 1986 when a second decline of about 0.8 foot occurred. Water levels in the well then began a second period of long-term water-level rise. The water-level decline that took place in September 1985 could be due to the Mexico City earthquake of September 19, 1985, at 0719 hours (local time). Effects of this earthquake were noted in several other wells in New Mexico.
The cause of the March 1986 water-level decline is unclear. Approximately 45,000 gallons of water was pumped from the well from March 7 through March 10 at a pumping rate of 12 gallons per minute prior to collecting water samples from the well. The recorder was removed from the well from March 7 through March 12 while the well was pumped. Results of a pumping test conducted at the well during October 1984 indicated that water levels in the well recovered to levels above the prepumping water level within 2 minutes after the pump was shut off. (Recovery above the prepumping water level was due to the heated column of water in the casing.) The pumping rate for this test was 500 gallons per minute. It does not seem likely that the small pumping rate for the sample collection caused the March 1986 water-level decline. Following the water-level decline in March 1986, a water-level rise of 1.5 feet per year began. This trend continued through October 1986.
The long-term water-level trend was subtracted from the smoothed data, and a line with the corrected slope, plotted below the uncorrected curve (fig. 39), was used to determine the transmissivity value at the well. A transmissivity value of about 200,000 feet squared per day was calculated from the corrected straight-line plot.
102

1.5
1.0
LLI
CE LLI
O
0.5
0.0
I I I I I I I I
DRAWDOWN (S) = 0.41 footFLOW RATE (Q) = 2,360 gallons per minute
2.30 QTRANSMISSIVITY (T)
47tS /log cycle
= 200,000 feet squared per day
0.72 foot
Straight-line plot after correcting for 1.5-foot-per- year water-level rise
I I I I I I I
100 1,000 10,000
TIME SINCE FLOW STOPPED, IN MINUTES
100,000
Figure 39.--Recovery at Acoma 1 observation well (9.9.28.1344) from flow test at Anzac 86-1 (10.9.25.3241).
103

LU < U_ DC 3 o 2£ 3 o _i LU GO LU LU LL 2 of
LU I O 1- X Q_
LU Q
<L
£3
226
227
228
229
230
231
232
233
234
235
1 1
| 1
1 1
1 1
1 1
1 1
I 1
1 1
1 1
1 1
1 |
1 I
-
-
-
Anz
ac 8
6-1
drill
ed/
k-4
/*
V«.
I.
^
^
/
*.w
»/sA
^'^'\
AA
A/^
y^^^^
7^^
AM
^V
* +
J
j** ^^
_
o*
>» w
v
I**
\ . .J
^ ^r" \
i
J\.T
+f*
*\ f*\r
_y^^ \
L^tJ
\t\1
r^
\fS
^*^
\J
1
ww
v v
r
if /
/Fl
ow te
stin
g at
Anz
ac 8
6-1
_ _
I I
i i
i i
i i
| i
i i
I I
I i
i i
i i
i i
i i
o,<w
u
6,42
9
6,42
8
6,42
7
6,4
26
6,42
5
6,42
4
6,42
3
6,42
2
6,42
1
6,42
0I
>
O
?
' rn
DC
o
f >
- W
>
" CD
t~
1
>
O
-»
' r«
DC
rr
>
- ^
^i
CD
t"
1
I- LU K z LU Q ID t _l
< _l
LU LU _J
LU ^f
^
1984
1985
1986
Figu
re 40.--Water-level trends at Acoma 1 observation w
ell
(9.9
.28.
1344
).

Table 1.-Records of wells and springs in theAcoma Embayment and eastern Zuni uplift
EXPLANATION
Local identifier: see text for explanation. Station number: the first sixnumbers are the latitude, the next seven numbers are the longitude, and the
last two numbers are the sequence number. Contributing unit: U, unknown;P, principal aquifer; N, no contribution; S, secondary aquifer. Aquifer code
indicates source of water: 111MCCR, Quaternary McCartys Basalt flow;OOOEXRV, extrusive rocks; 110AVMB, Quaternary and Tertiary alluvium;
210MNCS, Cretaceous Mancos Shale; 211DKOT, Cretaceous Dakota Sandstone;221TDLT, Jurassic Todilto Limestone Member of Wanakah Formation; 221ENRD,
Jurassic Entrada Sandstone; 231CHNL, Triassic Chinle Formation; 231SNSL,Triassic Sonsela Sandstone Bed of Petrified Forest Member of Chinle Formation;313SADG, Permian San Andres Limestone and Glorieta Sandstone, undivided;
313SADR, Permian San Andres Limestone; 310GLRT, Permian Glorieta Sandstone;313SADY, Permian San Andres Limestone and Yeso Formation, undivided;310YESO, Permian Yeso Formation. Water levels: R, reported. Primary useof water: S, stock; U, unused; H, domestic; T, institutional; P, public supply;
J, industrial (cooling); I, irrigation; N, industrial; Z, other; E, power;R, recreation. ~, no data.
105

Tab
le 1
. R
ecor
ds o
f wel
ls a
nd sp
ring
s in
theA
com
a em
baym
ent a
nd e
aste
rn Z
uni u
plif
t Con
tinue
d
Local
identifier
03N.06W.04
04N.04W.30
04N.05W.33
04N.05W.33
04N.06W.12
04N.06W.15
04N.06W.15
04N.06W.15
04N.06W.26
04N.06W.27
04N.06W.32
05N.04W.05
05N.04W.26
05N.05W.16
05N.05W.10
05N.05W.10
05N.05W.10
05N.05W.25
05N.05W.26
05N.06W.03
05N.06W.05
05N.06W.06
05N.06W.25
05N.06W,31
05N.08W.35
.211
.223
.200
.223
.300
.400
.424
.424
.312
.431
4
.214
.142
.411
.443
.300
.333A
.333B
.1223
.100
.300
.414
.443
.122
.242
.123
Station
number
343117107281801
343258107173201
343215107220001
343208107215301
343620107260001
343407107265901
343410107263701
343410107263801
343233107262801
343218107270801
343158107290801
344128107165501
343748107134601
343915107215301
344021107212301
344005107213301
344005107213302
343816107252501
343804107202201
344106107292701
344112107291701
344100107301501
343815107252501
343710107300801
343715107391501
Owner
Major, Buddy
__
Major, Buddy
Pino Plac
Major, Buddy
Major, Buddy
Major, Buddy
Dockery
Yria
rt,
Juan
Sies,
Wally
Sies
, Wally
Sies
, Wally _
Seis-Wilson
Sies
, Wally
R.L.
Ranch
Con
trib
uting
unit U _ P
P N P P P P P __
N P N
Aquifer
code __
310YESO
231CHNL
do.
do.
do.
do.
do.
do.
313SADG
313SADG
313SADG
231CHNL
do.
do.
do.
do.
do.
do.
do.
do.
do.
do.
do.
313SADR
Altitude
_of
land
surface
(feet)
6,07
0
6,050
5,980
6,020.00
6,170
6,61
06,
060
6,28
0
6,35
86,
360
6,78
07,025
6,980
Depth
of well,
total
(feet)
100
784
750
630
150 78.0
251
453
155
1,999.0
Water
leve
l (f
eet)
94.3
5
-1.00
580.00
66.62
76.28
139.99
270.00
147.29
552.80
Water-
leve
l date
06-05-81
~
06-05-81
06-09-80
02-05-57
06-09-81
06-09-81
06-24-61
06-10-81
12-14-86
Primary
use of
water
S
S S
S S S S
S S S S U
Diameter
of
casing
(inches)
__ ~
16.00
5.60
--
16.25
7.00
7.08
9.63

Tab
le 1
.--R
ecor
ds o
f wel
ls a
nd s
prin
gs in
the
Aco
ma
emba
ymen
t and
eas
tern
Zun
i upl
ift
Con
tinue
d
Local
identifier
05N.08W.35
05N.08W.36
05N.08W.36
06N.04W.02
06N.05W.26
06N.10W.07
07N.04W.03
07N.04W.03
07N.04W.il
07N.04W.22
07N.04W.25
07N.05W.06
07N.05W.28
07N.05W.36
07N.06W.10
07N.06W.10
07N.06W.18
07N.06W.22
07N.11W.02
07N.12W.13
.123
.433A
.433
B.2
217
.132
.1413
.344
.43
.431
.323
.111
.221A
.113
.333
.443A
.443B
.424
.331
.311
.244
Station
number
343715107391501
343638107375101
343638107375102
344659107132501
344311107202001
344545107560801
345122107144801
345155107134801
345C38107133801
344900107145601
344845107130801
345210107235701
344833107223201
344702107192601
345034107270802
345034107270801
344953107300801
344858107275301
345150107582301
345013108023801
Owner
R.L.
Ranch
R.L.
Ranch
Sies,
Wally
Seis-Wilson
BLM
U.S.
Low Water
Sies
, Wally --
Major, Buddy
Marm
on,
Fred
Sies,
Wally
Marm
on,
Fred
Marm
on,
Fred
Marm
on,
Fred
Marm
on,
Fred
King Bros.
King Bros.
Con
trib
uting
unit N P P P P P N N N
P
P P
P __
P P P
Aquifer
code
231CHNL
231CHNL
231CHNL
313SADG
313SADR
231CHNL
231CHNL
231CHNL
231CHNL
313SADG
231CHNL
231CHNL
231CHNL
231CHNL
231CHNL
231CHNL
231CHNL
313SADG
Altitude
Depth
of land
of we
ll,
surface
total
(feet)
(feet)
6,830
6,830
6,220
6,370
7,130 __
5,938
5,980
5,755 ~
6,130
5,850
5,850
5,940
5,820
7,070
7,200
163
150
623
2,783.0
__ 300
150
261
--
96.5
420
1,000
Water
level
(fee
t)
115.85
109.69
153.54
620.
OOR
711.00
273.00
125.82
~ 70.21
70.50
92.99
689.60
683.65
Water-
Primary
leve
l use of
date
water
05-12-81
05-12-81
05-19-81
10-12-53
11-17-86
06-09-81
05-19-81
03-19-81
03-19-81
03-19-81
08-02-84
01-15-86
U U U s U -- U s s s H S
__
s s s
Diameter
of
casing
(inches)
6.63
4.5
6.70
7.00
5.80
9.63
6.63
4.5
5.50
6.63
7.10
6.53
6.23
5.53
6.22

Tab
le 1
. Rec
ords
of w
ells
and
spri
ngs
in th
eAco
ma
emba
ymen
t and
eas
tern
Zun
i upl
ift C
ontin
ued
Local
identifier
07N.12W.13
08N.03W.10
08N.03W.15
08N.05W.17
08N.05W.33
08N.06W.20
08N.08W.25
08N.10W.24
08N.11W.06
08N.11W.10
08N.11W.14
08N.12W.19
08N.15W.27
08N.15W.27
09N.03W.20
09N.04W.16
09N.04W.18
09N.04W.33
.244
.2
22.413
.213
.300
.3334
.423
1
.341
.233
.111
.323
3
.334
.311
.342
.423
1
.324
.300
.2232A
Station
number
345013108023801
345629107075501
345503107082701
345531107230601
345227107222601
345402107295701
345329107374001
345416107505101
345706108015701
345633107591701
345509107580401
345403108085001
345335108245201
345320108242601
345928107101901
350018107161201
350017107182601
345811107153202
Owner
Suwanee, S.
B I A- SPA
Lagu
na,
Pueblo of
Acoma, Pueblo of
Kowina
Brig
ht,
Lewis
Port
er,
Bill
Port
er,
Mike
Major, Buddy
BIA
Laguna Pueblo
BIA-Laguna
Pino
, Steven
Con
trib
uting
unit
P N N P N N __ P P P
N N
P
P
Aquifer
code
221TDLT
313SADG
231CHNL
231CHNL
313SADR
313SADR
313SADG
313SADG
310YESO
231CHNL
313SADG
310GLRT
313SADG
231CHNL
231CHNL
231CHNL
231CHNL
Altitude
Depth
of land
of we
ll,
surface
total
(feet)
(feet)
6,00
0
6,030
6,40
0
7,405
7,110
7,000
7,500
7,478
7,47
8
5,613
5,620
5,590
93.0
2,189.0
2,650.0
2,596
520
3,590
3,590
250 64.6
100
. Water
level
(feet)
684.45
71.00
-368.2 _
495.
00230.00
465.
94463.38
463.29
430.00
978.
0097
8.00
128.00
122.39
57.00
26.70
Water-
level
date
09-16-86
04-28-35
05-23-86
__07-27-81
07-15-81
04-27-84
01-15-86
09-18-86
05-06-81
05-01-75
05-01-75
00-00-59
05-06-87
05-02-59
05-03-73
Primary
use of
water
U
S U U
__ S H S S T T
S S S
Diameter
of
casing
(inches)
6.62
9.63
6.63
4.5
9.63
6.63
__ 5.50
__ 5.30
8.62
6.62
6.63
6.62

Tab
le 1
.-R
ecor
ds o
f wel
ls a
nd s
prin
gs in
theA
com
a em
baym
ent a
nd e
aste
rn Z
uni u
plif
t Con
tin
ued
Local
Station
identifier
number
Owner
09N.04W.33.2232A
345811107153202
09N.05W.12.442
350108107183501
Laguna Pueblo
09N.05W.13.233
350034107185701
Laguna Pueblo
09N.05W.14.200
350043107191801
09N.05W.24.4133
345927107190301
EPNG
09N.05W.24.4144
345928107185201
EPNG
09N.06W.16.111
350053107290101
Lagu
na,
Pueblo of
09N.09W.28.113
345901107480901
Acoma No
.09N.09W.28.1344
345850107475401
Acoma, Pueblo of
Con
trib
uting
unit
__
P ~ -- P
P -- P N P N N N P
Altitude
Depth
of land
of well,
Water
Aquifer
surface
total
leve
l code
(feet)
(feet)
(feet)
42.92
313SADG
5,640
392.00
231CHNL
5,660
230
49.00
231CHNL
231CHNL
5,686
285
55.00
88.00
80.00
68.53
231CHNL
5,677
362
54.00
88.00
73.00
231CHNL
5,677
362
80.00
69.00
66.00
54.78
313SADR
5,990
2,650.0 -369.70
313SADR
2,391
211.73
313SADR
6,660
2,520.0
231.03
230.03
229.73
229.88
229.98
229.83
229.60
Water-
Primary
level
use of
date
water
05-05-87
01-01-64
03-16-65
P
02-07-57
J
06-16-82
01-17-85
05-13-87
01-27-57
J09-23-82
11-06-84
07-10-85
J11-11-85
04-09-86
05-13-87
07-08-86
U
01-16-89
10-02-84
U01-18-85
02-01-85
03-01-85
04-01-85
05-01-85
06-01-85
Diameter
of
casing
(inches)
13.00
12.75
8.62
168.
62
_ 9.63
6.63
13.3
86.62
__

Tab
le 1
. Rec
ords
of w
ells
and
spri
ngs
in th
eAco
ma
emba
ymen
t and
eas
tern
Zun
i upl
ift-
Con
tinue
d
Con-
Altitude
Depth
trib-
of land
of well
, Water
Local
Station
uting
Aquifer
surface
total
level
identifier
number
Owner
unit
code
(feet)
(feet)
(fee
t)
09N.09W.28.1344
345850107475401
--
229.76
229.80
229.73
230.17
230.27
230.34
230.16
229.95
229.90
230.16
230.19
229.90
229.86
229.76
229.49
229.31
229.50
230.15
229.88
229.56
229.51
229.52
229.62
09N.10W.10.414
350111107523501
Mirabal, Alfredo
P 313SADG
6,519
105
84.03
84.15
Water-
Primary
leve
l us
e of
date
water
07-01-85
08-01-85
09-01-85
10-01-85
11-01-85
12-01-85
01-01-86
02-01-86
03-01-86
04-01-86
05-01-86
06-01-86
07-01-86
08-01-86
09-01-86
10-01-86
11-01-86
12-01-86
01-01-87
02-01-87
03-01-87
03-26-87
05-21-87
10-02-46
H11-06-46
Diameter
of
casing
(inches)
_ _ _ _ 8.60

Tab
le 1
. Rec
ords
of w
ells
and
spr
ings
in th
e A
com
a em
baym
ent a
nd e
aste
rn Z
uni u
plif
t Con
tinue
d
Con-
Altitude
Depth
trib-
of land
of we
ll,
Water
Local
Station
uting
Aquifer
surface
total
level
identifier
number
Owner
unit
code
(feet)
(feet)
(feet)
09N.10W.10.414
350111107523501
84.1
983
.79
313SADG
6,519
105
84.04
84.4
289.65
91.5
491.83
91.23
90.7
091.34
92.04
90.97
90.70
91.18
93.9
7
92.2
891.62
92.6
593.30
93.6
8
92.13
93.7
194
.70
91.85
93.0
5
Water-
Primary
leve
l use of
date
water
12-03-46
07-07-47
02-02-48
H02-10-49
01-21-56
08-02-56
10-02-56
12-11-56
02-12-57
05-07-57
08-01-57
11-13-57
02-05-58
05-15-58
08-19-58
11-19-58
02-17-59
05-05-59
09-02-59
11-04-59
02-08-60
05-11-60
08-26-60
11-14-60
02-15-61
Diameter
of
casing
(inches)
__ _ __

Tab
le "
L R
ecor
ds o
f wel
ls a
nd s
prin
gs in
theA
com
a em
baym
ent a
nd e
aste
rn Z
uni u
pli
ft C
onti
nued
Con-
Altitude
Depth
trib-
of land
of we
ll,
Water
Local
Station
uting
Aquifer
surface
tota
l level
identifier
number
Owner
unit
code
(feet)
(fee
t)
(fee
t)
09N.10W.10.414
350111107523501
93.63
94.89
92.9
793
.21
91.93
93.59
93.95
95.20
93.53
95.5
8
95.9
792.93
92.5
394
.45
94.25
84.0
594.43
313SADG
6,519
105
97.3
595.89
95.57
09N.10W.15.212
350053107523301
Mirabal, Alfredo
Jr.
P 313SADG
6,529.00
164
99.6
010
6.21
105.
9210
6.02
105.78
Water-
level
date
05-11-61
08-08-61
11-29-61
02-13-62
05-15-62
08-14-62
02-05-63
08-19-63
03-10-64
08-12-64
02-09-65
08-05-65
02-09-66
08-23-66
02-21-67
04-02-68
02-12-69
02-16-70
04-13-84
01-30-85
01-21-56
04-13-84
01-30-85
01-15-86
09-17-86
Diameter
Primary
of
use of
casing
water
(inches)
__ _
H
S 7.00

Tab
le l
.~R
ecor
ds o
f wel
ls a
nd s
prin
gs i
n th
e A
com
a em
baym
ent a
nd e
aste
rn Z
uni u
pli
ft C
onti
nued
Local
identifier
09N.10W.33.110
09N.14W.06.313
09N.15W.32.330
10N.08W.32.312
ION. 09W. 06.
2311
10N.09W.06.442
10N.09W.10.433
10N.09W.15.221
10N.09W.17.113
Con-
trib-
Station
uting
number
Owner
unit
345815107541501
Mirabal, Alfredo
Jr.
P __ __
350212108212801
National Park Service
N345742108265501
Eidal, R.
P350304107423601
Acoma Pueblo
N
350741107493301
Gunderson Oil Co.
P350714107491201
Gottlieb, Sydney S.
P350618107462501
350609107460701
P350603107485801
Gottlieb, Sydney S.
P S
.
__
Altitude
of land
Aquifer
surface
code
(feet)
313SADG
6,760.00
231CHNL
7,230
310GLRT
7,190.00
210MNCS
6,580
231CHNL
6,415
OOOEXRV
6,400
6,460
110AVMB
6,340
110AVMB
6,440
110AVMB
6,440
Depth
of well,
total
(feet)
347
473
3,109
373
122
120 52.0
76.0
76.0
Water
level
(fee
t)
325.37
326.22
327.30
331.15
335.62
330.47
330.67
200.00
700.00
7.27
49.27
36.19
41.85
44.24
43.40
51.15
45.73
44.60
41.82
40.34
40.26
39.28
40.38
Water-
Primary
level
use of
date
water
12-28-55
S07-27-56
11-06-57
04-16-84
05-02-85
08-15-85
01-15-86
01-01-38
U01-01-71
H
07-11-84
U S04-12-84
U04-12-84
U06-14-49
S
12-08-50
11-12-57
S02-03-58
05-13-58
08-19-58
11-19-58
05-04-59
09-03-59
11-03-59
02-10-60
Diameter
of
casing
(inches)
6.00
__ 5.63
6.00
5.00
6.00
6.00
__ __ --

Tab
le 1
. Rec
ords
of w
ells
and
spr
ings
in th
e A
com
a em
baym
ent a
nd e
aste
rn Z
uni u
plif
t-C
ontin
ued
Con-
Altitude
Depth
trib-
of land
of we
ll,
Water
Local
Station
uting
Aquifer
surface
total
leve
l identifier
number
Owner
unit
code
(fee
t)
(feet)
(feet)
10N.09W.17.113
350603107485801
39.55
40.1
740.07
39.2
539.13
40.09
39.32
39.73
39.7
340.00
46.0
910N.09W.21.222
350516107470001
Gottlieb
P 111MCCR
6,399.00
70.0
47.4
948.58
47.6
047.60
47.70
47.7
247
.75
47.9
547
.75
47.70
48.95
47.7
848.10
47.8
0
Water-
Primary
level
use of
date
water
05-10-60
08-25-60
11-14-60
02-16-61
05-11-61
08-07-61
02-14-62
05-15-62
08-15-62
02-04-63
03-13-84
12-08-50
S11-07-57
11-12-57
02-03-58
05-13-58
08-19-58
11-19-58
05-04-59
09-03-59
11-03-59
02-10-60
05-10-60
08-25-60
11-14-60
Diameter
of
casing
(inches)
__ _ 6.00
-- _ __

Tab
le 1
. R
e cor
ds o
f wel
ls a
nd s
prin
gs in
the
Aco
ma
emba
ymen
t and
eas
tern
Zun
i upl
ift C
ontin
ued
Con-
Altitude
Depth
trib-
of land
of well,
Water
Local
Station
uting
Aquifer
surface
total
level
identifier
number
Owner
unit
code
(feet)
(feet)
(feet)
10N.09W.21.222
350516107470001
49.8
050.00
50.74
51.40
49.9
7
50.25
111MCCR
6,399.00
70.0
50.05
47.8
748
.03
51.3
3
49.7
349.28
50.33
49.68
50.32
48.7
147
.35
47.39
47.68
47.85
47.32
48.7
047.67
47.56
Water-
Primary
level
use of
date
water
02-16-61
05-11-61
08-07-61
11-30-61
02-14-62
08-15-62
02-04-63
S08-20-63
03-10-64
08-12-64
02-09-65
08-06-65
02-09-66
08-22-66
02-20-67
04-02-68
02-14-69
02-16-70
01-11-71
01-19-72
01-24-73
01-17-75
03-08-79
01-31-84
Diameter
of
casing
(inc
hes)
-- -- __ -- -- -- __ -- -- __ -- -- __ --
10N.09W.21.223
350511107470801
Gottlieb,
Sydney S.
110AVMB
6,392.00
202
14.0
0

Tab
le 1
. Rec
ords
of w
ells
and
spr
ings
in th
e A
com
a em
baym
ent a
nd e
aste
rn Z
uni u
plif
t Con
tin
ued
Local
identifier
10N.09W.23.134
10N.09W.23.443
10N.09W.23.443A
10N.09W.25.000
10N.09W.25.244
10N.09W.25.324
ION.
09W. 25.
3241
10N.09W.25.400
10N.09W.26.224
10N.09W.26.224
Station
number
Owner
350452107454801
Gottlieb, Sidney S.
350432107450801
350432107450802
350359107442301
350400107440001
76-3 Well
350349107442701
350352107442601
Acoma, Pueblo of
350346107442001
350410107445701
Gottlieb __
350410107445701
__
Con
trib
uting
unit S U
__ N N P
P__ _ __
Altitude
Depth
of land
of well,
Water
Aquifer
surface
total
level
code
(feet)
(feet)
(fee
t)
221ENRD
6,344
1,010
-.23
6,280
30.0
8.26
6,280
33.0
OOOEXRV
110AVMB
165
211DKOT
313SADR
6,280
2,901.0 -147.10
110AVMB
111MCCR
6,275.00
100
8.78
111MCCR
6,275.00
100
8.67
8.56
8.36
8.35
8.14
8.67
8.76
8.75
8.65
8.36
8.27
8.37
8.84
8.96
Water-
Primary
level
use of
date
water
12-13-50
I06-14-49
H H __
__
06-11-86
U
10-03-46
S05-05-47
S06-04-47
07-07-47
08-06-47
09-02-47
10-02-47
12-10-47
02-02-48
04-05-48
06-10-48
08-04-48
10-05-48
12-09-48
02-10-49
Diameter
of
casing
(inc
hes)
__ 7.00
7.00
__ 9.63
6.63
6.00
_ __

Tab
le 1
, Rec
ords
of w
ells
and
spr
ings
in th
e A
com
a em
baym
ent a
nd e
aste
rn Z
uni u
plif
t Con
tin
ued
Con-
Altitude
Depth
trib-
of land
of well,
Water
Local
Station
uting
Aquifer
surface
total
level
identifier
number
Owner
unit
code
(fee
t)
(feet)
(fee
t)
10N.09W.26.224
350410107445701
8.92
8.86
7.95
8.61
8.92
8.92
8.85
8.23
8.46
8.65
8.73
8.72
8.74
8.75
8.81
8.92
8.95
8.93
8.76
8.66
8.93
8.96
9.04
8.97
8.95
Water-
Primary
level
use of
date
water
04-11-49
06-08-49
08-18-49
10-11-49
12-14-49
02-07-50
04-18-50
06-26-50
08-23-50
10-16-50
12-12-50
02-12-51
04-20-51
06-19-51
08-16-51
10-31-51
02-19-52
04-23-52
06-19-52
08-25-52
10-22-52
12-16-52
02-17-53
04-15-53
06-10-53
Diameter
of
casing
(inches)
-- __ __ __ __

Tab
le 1
. Rec
ords
of w
ells
and
spri
ngs
in th
eAco
ma
emba
ymen
t and
eas
tern
Zun
i upl
ift C
ontin
ued
00
Con-
Altitude
Depth
trib-
of land
of well,
Water
Local
Station
uting
Aquifer
surface
total
leve
l identifier
number
" Owner
unit
code
(feet)
(feet)
(fee
t)
10N.09W.26.224
350410107445701
~
--
8.46
111MCCR
6,275.00
100
8.77
8.90
8.95
8.87
7.79
8.42
8.70
9.00
9.06
8.99
9.05
8.77
8.67
8.67
8.39
8.71
8.79
8.74
7.50
8.67
8.74
8.68
8.72
8.82
Water-
Primary
leve
l us
e of
date
water
08-10-53
12-19-53
S02-08-54
04-06-54
06-15-54
08-26-54
10-12-54
12-01-54
02-09-55
04-11-55
06-13-55
12-06-55
04-16-56
06-04-56
08-03-56
10-01-56
12-10-56
02-11-57
05-06-57
08-01-57
11-12-57
02-03-58
05-13-58
08-18-58
11-19-58
Diameter
of
casing
(inc
hes)
_ __ ~ __ __

Tab
le 1
. Rec
ords
of w
ells
and
spri
ngs
in th
e A
com
a em
baym
ent a
nd e
aste
rn Z
uni u
plif
t Con
tinue
d
Con-
Altitude
Depth
trib-
of land
of well
, Water
Local
Station
uting
Aquifer
surface
total
leve
l identifier
number
Owner
unit
code
(feet)
(feet)
(fee
t)
10N.09W.26.224
350410107445701
~
8.82
8.77
8.50
8.90
111MCCR
6,275.00
100
9.02
8.65
8.80
8.87
8.17
8.04
8.54
8.92
9.02
8.66
8.36
9.10
9.16
8.76
8.97
8.39
8.70
8.84
8.92
8.54
8.73
Water-
Primary
level
use of
date
water
02-18-59
05-04-59
09-01-59
11-03-59
02-10-60
S
05-10-60
08-26-60
11-14-60
02-15-61
05-11-61
08-07-61
11-29-61
02-12-62
05-14-62
08-14-62
11-26-62
02-04-63
08-19-63
03-10-64
08-12-64
02-09-65
08-06-65
02-09-66
08-22-66
02-20-67
Diameter
of
casing
(inc
hes)
__ -- __

Tab
le 1
. Rec
ords
of w
ells
and
spr
ings
in th
e A
com
a em
baym
ent a
nd e
aste
rn Z
uni u
plif
t Con
tin
ued
Con-
Altitude
Depth
trib-
of land
of well,
Water
Local
Station
uting
Aquifer
surface
total
level
identifier
number
Owner
unit
code
(fee
t)
(fee
t)
(fee
t)
10N.09W.26.224
350410107445701
8.42
8.65
8.57
8.91
8.97
8.90
8.27
8.79
8.83
8.91
8.83
8.89
8.90
8.74
10N.09W.26.433
350335107452501
Gottlieb
P 231CHNL
6,347.00
965
22.00
21.90
24.39
24.22
24.95
_
O O
Q Q
^^ .
o o
154.20
146.95
24.47
25.9
525.48
Water-
leve
l date
04-02-68
02-12-69
02-16-70
01-12-71
01-20-72
01-24-73
01-14-74
01-16-75
02-11-76
01-17-77
02-02-78
03-06-79
01-23-81
01-31-84
11-13-57
02-03-58
11-19-58
05-04-59
11-03-59
02-10-60
08-26-60
11-14-60
08-07-61
11-29-61
02-12-62
Diameter
Primary
of
use of
casing
water
(inches)
__
S 14.00

Tab
le 1
.-R
ecor
ds o
f wel
ls a
nd s
prin
gs in
the
Aco
tna
emba
ymen
t and
eas
tern
Zun
i upl
ift C
onti
nu
ed
Con-
Altitude
Depth
trib-
of la
nd
of well,
Water
Local
Station
uting
Aquifer
surface
total
leve
l identifier
number
Owner
unit
code
(feet)
(feet)
(feet)
10N.09W.26.433
350335107452501
--
~
25.32
27.92
24.68
23.79
23.70
25.94
231CHNL
6,347.00
965
24.98
27.45
23.02
25.44
23.33
23.79
24.16
23.49
23.88
24.86
10N.09W.28.142
350405107473201
Paya
so,
Maria
P 110AVMB
6,409.00
30.0
29.00
10N.09W.29.132
350403107485401
Gottlieb
P 110AVMB
6,455.00
80.0
60
.78
62.37
62.4
5
62.60
63.1
762.80
63.6
063.60
Water-
Primary
level
use of
date
water
05-14-62
08-14-62
02-04-63
03-10-64
08-12-64
02-09-65
02-09-66
S08-22-66
04-02-68
02-14-69
02-16-70
01-12-71
01-24-73
01-14-74
01-16-75
03-08-79
09-26-55
H06-
-49
S11-13-57
02-03-58
05-15-58
08-19-58
11-19-58
02-18-59
05-04-59
Diameter
of
casing
(inches)
-- __ _ __ 7.00
-- __

Tab
le 1
.-R
ecor
ds o
f wel
ls a
nd s
prin
gs in
theA
com
a em
baym
ent a
nd e
aste
rn Z
uni u
plif
t Con
tinue
d
Con-
Altitude
Depth
trib-
of land
of well
, Water
Local
Station
uting
Aquifer
surface
total
level
identifier
number
Owner
unit
code
(feet)
(fee
t)
(fee
t)
10N.09W.29.132
350408107485401
64.60
63.60
63.80
64.00
63.45
64.50
63.40
63.70
62.42
61.50
63.9
565.90
10N.09W.31.324
350300107491201
Gottlieb
P 110AVMB
6,484.00
165
71.64
74.8
575.77
75.50
75.70
75.40
75.54
110AVMB
6,484.00
165
76.50
74.20
76.20
75.70
80.50
73.85
Water-
Primary
level
use of
date
water
09-01-59
11-03-59
02-10-60
05-10-60
08-25-60
11-14-60
08-07-61
11-30-61
02-14-62
08-15-62
11-26-62
03-13-84
06-14-49
S11-12-57
02-03-58
05-15-58
08-19-58
11-19-58
02-18-59
05-04-59
S
09-01-59
11-03-59
02-10-60
05-10-60
08-25-60
Diameter
of
casing
(inches)
__ __ 7.00
_ __

Tab
le 1
.-R
ecor
ds o
f wel
ls a
nd s
prin
gs in
the
Aco
ma
emba
ymen
t and
eas
tern
Zun
i upl
ift C
ontin
ued
Con-
Altitude
Depth
trib-
of land
of well
, Water
Local
Station
uting
Aquifer
surface
total
level
identifier
number
Owner
unit
code
(feet)
(feet)
(fee
t)
10N.09W.31.324
350300107491201
75.35
77.45
77.43
76.08
76.3
0
76.73
78.3
577
.45
83.7
776.75
82.80
77.97
92.33
ION. 10W
. 03
. 3113
350724107532001
Small, Dwight
U
6,770
~
420.00
ION. 10W
. 03
. 423
350720107523001
Ojo del Gallo
P 313SADG
6,450
ION.
10W
. 03
. 433
350704107524401
Padilla, Joe
P 110AVMB
6,47
5 16
.5
10.82
10.20
10.34
10.3
79.
83
9.87
10.60
9.97
10.66
110AVMB
6,475
16.5
11.19
Water-
Primary
level
use
of
date
water
11-14-60
02-16-61
05-11-61
08-07-61
11-30-61
02-14-62
05-15-62
08-15-62
11-26-62
02-04-63
03-10-64
02-09-65
03-13-84
04-04-84
H I
10-03-46
U11-06-46
12-03-46
01-03-47
02-03-47
03-11-47
04-07-47
05-05-47
06-04-47
07-07-47
U
Diameter
of
casing
(inc
hes)
._ ~ _ ~ __ ~

Tab
le ^
. Rec
ords
of w
ells
and
spr
ings
in th
e A
com
a em
baym
ent a
nd e
aste
rn Z
uni u
plif
t Con
tinue
d
Con-
Altitude
Depth
trib-
of land
of well,
Water
Local
Station
uting
Aquifer
surface
total
level
identifier
number
Owner
unit
code
(fee
t)
(feet)
(fee
t)
ION. 10W
. 03
. 433
350704107524401
11.70
11.04
11.66
10.88
11.26
11.06
12.70
13.17
11.64
10.28
11.07
12.05
12.58
11.92
10.95
10.90
11.12
12.18
13.31
13.23
11.89
12.0
511.11
12.98
14.65
Water-
Primary
leve
l use of
date
water
08-06-47
09-02-47
10-02-47
02-02-48
04-05-48
06-11-48
08-04-48
10-05-48
12-09-48
02-10-49
04-12-49
06-11-49
08-18-49
10-11-49
12-14-49
02-07-50
04-18-50
06-26-50
08-24-50
10-16-50
12-13-50
02-12-51
04-20-51
06-22-51
08-16-51
Diameter
of
casing
(inches)
.. __ __

Tab
le ^
. Rec
ords
of w
ells
and
spr
ings
in t
heA
com
a em
baym
ent a
nd e
aste
rn Z
uni u
plif
t Con
tin
ued
Local
identifier
ION.
10W. 03
. 433
ION.
10W. 03. 4331
10N.10W.03.433A
10N.10W.03.433B
ION.
10W
. 10
. 321
ION. 10W
. 10. 32
2ION. 10W. 10
. 41
2ION. 10W. 10. 414
Con-
trib-
Station
uting
number
Owner
unit
350704107524401
350710107523901
Mirabal, Miguel
P
350719107523101
San Rafael
N""
"
S S S S S S S
P
350719107523102
San Rafael
P
350631107525801
Chav
ez,
Dora
P350635107525801
Candelaria, Rosalio
P350633107523701
P350630107523701
P
Altitude
Depth
of land
of well
, Water
Aquifer
surface
total
level
code
(feet)
(feet)
(fee
t)
14.7
013.35
12.1
911
.65
13.3
0
14.8
910.18
13.53
14.6
0110AVMB
6,470
43.0
26.46
313SADG
6,46
0 148
28.7
025.79
24.7
026.38
28.97
27.85
28.90
25.76
32.0
3313SADG
6,480
150
30.57
32.47
110AVMB
6,46
5 57
.0
38.83
313SADG
6,460
23.60
110AVMB
6,460
71.0
13.12
110AVMB
6,460
47.7
15.82
Water-
Primary
level
use of
date
water
10-30-51
12-24-51
02-26-52
04-24-52
06-25-52
08-27-52
02-20-53
02-09-54
02-12-55
06-29-84
U
09-20-56
P11-06-57
02-05-58
02-17-59
09-01-59
02-08-60
02-05-63
03-10-64
02-09-65
02-16-61
P
02-13-62
07-11-84
I07-27-56
U04-13-84
U04-13-84
U
Diameter
of
casing
(inc
hes)
__ 6.00
6.00
__ -- 8.00
__ 6.00
10.0
04.00
5.00

Tab
le I
. Rec
ords
of w
ells
and
spr
ings
in th
e A
com
a em
baym
ent a
nd e
aste
rn Z
uni u
plif
t Con
tinue
d
Local
identifier
ION. 10W
. 10
. 433
ION.
10W
. 15
. 124
ION.
10W
. 15
. 34
4
ION.
10W
. 22. 21
0
ION.
10W. 22
. 211
10N.10W.22.211A
ION.
10W
. 22
. 23
3IO
N. 10W
. 22
. 32
2IO
N. 10W
. 22
. 421
ION.
10W
. 23. 13
2IO
N. 10W
. 24
. 212
Station
number
Owner
350615107524601
Bare
la,
Elfego
Chav
ez,
Dora
__
350603107525401
Ortiz, Ted
350523107525501
Chav
ez,
Eddie
-
350512107524201
350515107523801
350515107523802
350456107524601
350451107525001
350452107522901
Miribal, Monico
__
350504107520301
350514107502701
Con
trib
uting
unit P __ P P P P P U U P __
U P
Altitude
of land
Aquifer
surface
code
(feet)
313SADG
6,450.00
231CHNL
6,460
110AVMB
6,450.00
110AVMB
6,455.00
110AVMB
6,455.00
110AVMB
6,455.00
6,460
6,465
231CHNL
6,450
6,442
110AVMB
6,445.00
Depth
of we
ll,
total
(feet)
200
109 40.0
70.0
32.0
130 65.3
165
16.2
70.0
Water
leve
l (f
eet)
21.40
29.91
29.03
28.4
026
.84
26.93
32.50
23.7
035.57
23.0
0
27.0
026.19
45.4
244.73
22.07
22.37
23.1
023.65
24.2
324
.81
25.55
34.0
211
.74
33.00
33.28
Water-
leve
l date
07-27-56
07-25-84
01-31-85
08-13-85
01-16-86
09-26-86
07-25-56
07-25-56
06-29-84
08-19-58
07-25-56
07-25-56
04-13-84
04-13-84
02-21-52
04-24-52
06-25-52
08-27-52
12-17-52
02-20-53
04-16-53
06-11-53
04-13-84
11-13-57
02-03-58
Primary
use of
water
I I U H H I U U U U s
Diameter
of
casing
(inches)
18.00
_ 8.00
8.00
6.00
6.00
8.00
4.00
5.00
__ 9.00
4.00

Tab
le 1
. R
ecor
ds o
f wel
ls a
nd s
prin
gs in
the
Aco
ma
emba
ymen
t and
eas
tern
Zun
i MpK
ff C
ontin
ued
Con-
Altitude
Depth
trib-
of land
of well
, Water
Local
Station
uting
Aquifer
surface
total
leve
l identifier
number
Owner
unit
code
(feet)
(feet)
(feet)
ION. 10W. 24. 21
2 350514107502701
33.88
33.83
34.66
34.87
35.28
35.45
35.54
35.64
33.48
31.98
33.15
31.75
110AVMB
6,445.00
70.0
45
.17
ION. 10W. 25
. 114
350418107510101
Gottlieb
P 110AVMB
6,440.00
40.0
24.94
25.09
25.29
25.35
39.25
25.72
25.17
ION. 10W
. 26
. 33
1 350346107521201
Mirabal, Monico
N 313SADG
6,45
0 21
6 22.18
S 22.29
S 22.88
23.16
S 23.02
Water-
Primary
leve
l use of
date
water
05-15-58
08-19-58
05-04-59
09-01-59
05-10-60
08-25-60
11-14-60
02-16-61
05-11-61
08-07-61
11-30-61
02-14-62
03-13-84
S11-12-57
U02-03-58
05-15-58
08-19-58
02-18-59
05-04-59
11-03-59
02-21-52
I04-24-52
06-25-52
08-27-52
12-17-52
Diameter
of
casing
(inc
hes)
~ ~ __ 4.00
__ 16.0
0

Tab
le 1
. Rec
ords
of w
ells
and
spri
ngs
in th
e A
com
a em
baym
ent a
nd e
aste
rn Z
uni u
plif
t Con
tinue
d
Con-
Altitude
Depth
trib-
of land
of well,
Water
Local
Station
uting
Aquifer
surface
total
level
identifier
number
Owner
unit
code
(feet)
(feet)
(fee
t)
ION.
10W. 26. 33
1 350346107521201
S 23.03
S 22.97
S 24.33
P 24.12
23.78
23.57
23.8
448.68
25.35
24.39
24.34
58.24
58.2
449.50
25.34
25.34
24.89
47.79
47.00
ION. 10W. 26. 331
350346107521202
~
313SADG
6,450
216
27.28
44.59
26.4
425.90
27.18
27.17
Water-
leve
l date
02-20-53
04-16-53
08-12-53
10-08-53
12-17-53
02-09-54
04-06-54
06-11-54
08-31-54
10-12-54
12-01-54
02-09-55
04-15-55
06-15-55
08-10-55
12-06-55
01-21-56
04-17-56
06-05-56
08-02-56
10-02-56
12-11-56
02-12-57
05-07-57
08-01-57
Diameter
Primary
of
use of
casing
water
(inches)
_ __ __
I
_

Tab
le 1
. Rec
ords
of w
ells
and
spr
ings
in th
e A
com
a em
baym
ent a
nd e
aste
rn Z
uni u
plif
t C
onti
nued
Con-
Altitude
Depth
trib-
of land
of well,
Water
Local
Station
uting
Aquifer
surface
total
leve
l identifier
number
Owner
unit
code
(fee
t)
(feet)
(fee
t)
ION. 10W
. 26
. 331
350346107521202
26.08
25.80
27.43
27.38
26.71
27.85
28.35
49.5
249.59
28.45
27.83
40.40
29.31
28.22
27.95
28.99
23.73
49.53
29.62
26.12
44.50
27.40
24.17
32.77
ION. 10W
. 26
. 33
1 350346107521201
-
313SADG
6,450
216
28.1
4
Water-
Primary
level
use of
date
water
11-13-57
02-05-58
08-19-58
11-19-58
02-17-59
05-05-59
11-04-59
05-11-60
08-26-60
11-15-60
02-16-61
05-10-61
08-08-61
11-30-61
02-13-62
08-14-62
02-05-63
08-19-63
08-12-64
02-09-65
08-05-65
02-08-66
02-09-66
08-23-66
02-21-67
I
Diameter
of
casing
(inches)
~ _ __ -- __ __

Tab
le 1
.-R
ecor
ds o
f wel
ls a
nd s
prin
gs in
theA
com
a em
baym
ent a
nd e
aste
rn Z
uni u
plif
t Con
tinue
d
Con-
Altitude
Depth
trib-
of land
of we
ll,
Water
Local
Station
uting
Aquifer
surface
total
level
identifier
number
Owner
unit
code
(fee
t)
(fee
t)
(fee
t)
ION. 10W
. 26
. 331
350346107521201
22.15
28.47
28.75
28.49
28.44
28.83
28.60
29.6
428.53
30.26
29.17
33.83
29.96
34.69
29.87
29.71
30.49
29.72
31.90
31.5
8
30.32
29.7
730.82
30.2
330.55
Water-
Primary
level
use of
date
water
04-02-68
02-21-69
02-16-70
08-18-70
01-11-71
01-20-72
01-24-73
08-28-73
01-14-74
08-06-74
01-16-75
02-11-76
08-11-76
01-17-77
08-16-77
02-02-78
08-07-78
03-06-79
07-17-79
02-14-80
07-15-80
01-22-81
07-20-81
02-23-82
09-07-82
Diameter
of
casing
(inches)
__ _ __ __

Tab
le 1
. Rec
ords
of w
ells
and
spri
ngs
in th
e A
com
a em
baym
ent a
nd e
aste
rn Z
uni u
plif
t Con
tinue
d
Con-
trib-
Local
Station
uting
identifier
number
Owner
unit
ION.
10W
. 26. 331
350346107521201
ION. 10W. 27. 333
350336107531502
Mirabal
P
10N.10W.27.333A
350336107531501
Mirabal, Nabor
N S S S S S P__ _
Altitude
Depth
of land
of well
, Water
Aquifer
surface
total
level
code
(feet)
(feet)
(feet)
29.39
29.38
30.1
531
.91
30.0
5
31.71
28.72
28.98
28.67
313SADG
6,526.00
150
96.0
5
313SADG
6,530
165
99.1
897
.66
98.75
99.49
100.42
100.67
99.30
98.7
5100.20
100.08
98.8
598.67
99.98
100.35
99.66
Water-
Primary
level
use of
date
water
01-17-83
02-17-83
01-11-84
04-13-84
08-14-84
01-29-85
08-13-85
01-06-86
09-18-86
08-27-52
09-26-55
I02-08-56
04-17-56
06-05-56
08-02-56
10-02-56
12-11-56
02-12-57
05-07-57
08-01-57
11-13-57
02-05-58
05-15-58
.11-
19-5
802-17-59
Diameter
of
casing
(inc
hes)
16.0
0
16.00

Tab
le I
. Rec
ords
of w
ells
and
spr
ings
in th
eAco
ma
emba
ymen
tand
eas
tern
Zun
i upl
ift C
onti
nu
ed
Con-
Altitude
Depth
trib-
of land
of we
ll,
Water
Local
Station
uting
Aquifer
surface
total
level
identifier
number
Owner
unit
code
(feet)
(feet)
(feet)
10N.10W.27.333A
350336107531501
102.
23100.75
100.50
100.
63100.95
101.
22100.38
101.28
313SADG
6,530
165
104.
5510
1.31
101.
5710
1.77
102.00
98.85
95.75
101.40
98.98
102.39
102.
64102.46
107.
9310
3.05
103.
6310
3.67
102.
95
Water-
leve
l date
09-02-59
11-04-59
02-08-60
11-14-60
02-16-61
02-13-62
05-15-62
08-14-62
11-27-62
02-05-63
03-10-64
08-12-64
02-09-65
08-05-65
02-09-66
08-23-66
04-03-68
02-12-69
02-16-70
01-11-71
01-20-72
01-24-73
01-14-74
01-16-75
02-11-76
Diameter
Primary
of
use of
casing
water
(inches)
.. __
I __ __

Tab
le ^
. Rec
ords
of-
wel
ls a
nd s
prin
gs i
n th
e A
com
a em
baym
ent a
nd e
aste
rn Z
uni u
pli
ft C
onti
nued
Local
identifier
ION.
10W
.
ION.
10W.
ION.
10W.
ION.
10W.
ION.
10W.
ION.
10W.
ION. 10W
.IO
N. 10W
.
ION.
10W
.IO
N. 10W
.10N.11W.
11N.11W.
27.333A
28.224
33.1333
34.1134
34.124
34.131
34.132
34.1331
34.141
34.1423
05.332
23.333
Station
number
350336107531501
350417107532501
350311107542101
350322107531401
350324107525101
350337107531701
350319107531101
350301107540401
350322107525101
350317107525201
350717108013001
350943107582701
Owner
Griego
Clymo,
Garcia
Anaya,
Garcia
, Benigno
Donald
, Felix
Robert
Archuleta, Chris
Garcia
Shulte
Villa,
USFS
USFS
Bell,
, Tom
, Arthur
Ben
Bill
Con
trib
uting
unit
P P --
P P P P U P P U P
Aquifer
code
313SADG
do.
do.
do.
do.
do.
313SADG
313SADG
310YESO
Altitude
of land
surface
(fee
t)
6,63
0
6,75
0
6,55
06,
510
6,570
6,55
06,570
6,510
6,510.00
7,575
7,31
0
Depth
of well
, total
(feet)
146
383
146
109
190
135
185
120
67.0
980
Water
leve
l (feet)
103.
03
106.
50
103.
41
103.36
103.26
103.
18
102.96
103.
10102.90
91.5
0
336.58
335.38
335.35
335.42
335.33
119.41
84.1
0128.60
114.66
133.85
81.09
26.60
940.00
451.00
Water-
Primary
level
use of
date
water
02-02-78
01-22-81
02-08-84
04-03-84
09-13-84
01-29-85
08-13-85
01-14-86
09-19-86
04-03-84
04-03-84
01-30-85
08-14-85
01-14-86
09-19-86
04-04-84
04-04-84
09-26-55
04-04-84
04-04-84
04-04-84
07-14-81
03-01-52
06-04-80
H U U H S U H H H S S
Diameter
of
casing
(inches)
5.00
4.00
4.50
4.00
5.00
4.50
6.00
__ 7.00
6.00

Tab
le 1
.-R
ecor
ds o
f wel
ls a
nd s
prin
gs in
theA
com
a em
baym
ent a
nd e
aste
rn Z
uni u
plif
t Con
tinue
d
Local
identifier
11N.05W.14.241
11N.09W.20.111
11N.09W.20.111A
11N.09W.30.122
11N.09W.30.122A
11N.09W.30.211
11N.09W.31.423
UN. 10W. 02
. Il
lUN. 10W. 02
. 41
2
UN. 10W. 03
. 400
UN. 10W. 04
. Ill
Station
number
Owner
Schneeman
351105107194801
Sohio Western
351029107490201
Chapman, Harold D.
351029107490202
Chapman, Harold D.
350937107493901
Hawkinson, O.
H.
350937107493902
Hawkinson
350937107493201
McCluskey, L.
C.350815107491901
351257107520601
Republic Supply
351234107512701
Harding, Charles
351234107522501
S M BRNG C
351303107541801
Evan
s, John __
Con
trib
uting
unit P P P P P P P P P ~ P P ~ _
Altitude
Depth
of land
of well,
Water
Aquifer
surface
total
level
code
(feet)
(fee
t)
(fee
t)
424
313SADG
6,235
3,390
10.00
110AVMB
6,530
128
108.39
do.
6,530
275
106.75
do.
6,470
170
53.07
do.
6,470
106
41.00
do.
6,480
68.0
38.00
do.
6,415
145
2.00
231CHNL
6,560
150
231CHNL
6,600
259
130.35
129.79
128.34
127.11
132.14
124.18
231CHNL
6,560
195
313SADG
6,547.00
118
67.68
72.29
71.4
3313SADG
6,547.00
118
71.02
70.10
46.85
69.5
069
.25
69.0
5
Water-
Primary
level
use of
date
water
06-05-80
03-01-75
04-12-84
04-12-84
05-11-49
08-02-56
01-01-56
04-12-84
03-20-84
04-11-84
01-31-85
08-13-85
01-17-86
09-04-86
05-10-46
07-11-46
09-04-46
10-01-46
11-06-46
12-03-46
01-03-47
02-03-47
03-11-47
N H H H H H U H S N U U
Diameter
of
casing
(inches)
10.00
7.00
6.00
6.00
6.00
4.00
6.00
5.00
4.00
12.00
_

Tab
le "
L R
ecor
ds o
f wel
ls a
nd s
prin
gs in
the
Aco
ma
emba
ymen
t and
eas
tern
Zun
i upl
ift C
ontin
ued
Con-
Altitude
Depth
trib-
of land
of we
ll,
Water
Local
Station
uting
Aquifer
surface
total
level
identifier
number
Owner
unit
code
(feet)
(feet)
(fee
t)
UN. 10W
. 04. Il
l 351303107541801
69.9
273.03
73.39
74.50
75.80
75.02
74.32
72.83
72.39
72.40
83.60
77.49
76.02
74.36
73.62
73.92
74.05
75.35
78.43
73.39
72.73
74.28
81.33
84.70
84.69
Water-
level
date
04-07-47
05-05-47
06-04-47
07-07-47
08-06-47
09-02-47
10-02-47
12-10-47
02-02-48
04-05-48
06-10-48
08-04-48
10-05-48
12-09-48
02-10-49
04-11-49
06-09-49
08-18-49
10-11-49
12-14-49
02-07-50
04-18-50
06-27-50
08-23-50
10-16-50
Diameter
Primary
of
use of
casing
water
(inc
hes)
_ _ _ _

Tab
le 1
.-R
ecor
ds o
f wel
ls a
nd s
prin
gs in
the
Aco
ma
emba
ymen
t and
eas
tern
Zun
i upl
ift C
onti
nu
ed
Con-
Altitude
Depth
trib-
of land
of well
, Water
Loca
l Station
uting
Aquifer
surface
total
leve
l identifier
number
Owner
unit
code
(feet)
(feet)
(feet)
UN. 10W. 04
. Il
l 351303107541801
77.80
76.61
77.63
84.1
286
.63
83.30
80.86
79.7
281.59
78.4
2
81.30
80.0
880
.68
86.1
185
.32
83.3
482.66
86.08
86.20
83.7
783
.40
UN. 10W. 04
. 211
351104107534701
Evans, John
N 313SADG
6,530
315
57.9
7S
57.99
S 64
.02
Water-
Primary
leve
l us
e of
date
water
12-12-50
02-12-51
04-19-51
06-22-51
08-16-51
10-31-51
12-24-51
02-26-52
04-24-52
06-25-52
12-17-52
02-17-53
04-15-53
06-10-53
12-17-53
02-11-54
04-08-54
06-11-54
10-14-54
02-10-55
04-15-55
02-26-46
I02-27-46
09-04-46
Diameter
of
casing
(inches)
__ _ __ 16.0
014.00
12.00

Tab
le 1
. R
ecor
ds o
f wel
ls a
nd s
prin
gs in
the
Aco
ma
etri
baym
ent a
nd e
aste
rn Z
uni u
plif
t Con
tinue
d
Con-
trib-
Local
Station
uting
identifier
number
Owner
unit
UN. 10W
. 04. 211
351104107534701
--
S S S S S P -- __
__
__ -- __
__-- -- __
__
Altitude
Depth
of land
of we
ll,
Water
Aquifer
surface
total
leve
l code
(feet)
(feet)
(fee
t)
63.8
663
.19
313SADG
6,53
0 31
5 63
.09
62.89
62.73
64.9
365
.96
66.98
67.7
667.37
66.94
66.07
65.7
578
.20
71.6
3
69.70
67.88
68.03
83.1
468.41
67.79
69.5
185
.44
85.83
77.14
Water-
Primary
level
use of
date
water
10-02-46
11-06-46
12-03-46
I01-03-47
02-03-47
05-05-47
06-04-47
07-07-47
08-06-47
09-02-47
10-02-47
12-10-47
02-02-48
08-04-48
10-05-48
12-09-48
02-10-49
04-11-49
08-18-49
12-14-49
02-07-50
04-18-50
06-27-50
08-23-50
10-16-50
Diameter
of
casing
(inc
hes)
-- -- -- -- --

Tab
le 1
. Rec
ords
of w
ells
and
spr
ings
in th
eAco
ma
emba
ymen
t and
eas
tern
Zun
i upl
ift C
ontin
ued
Local
identifier
Station
number
Con
trib
uting
Owner
unit
Aquifer
code
Altitude
of land
surface
(fee
t)
Depth
of we
ll,
total
(feet)
Water
level
(feet)
Water-
leve
ldate
Primary
use
ofwater
Diameter
ofcasing
(inc
hes)
UN.10W.04.211
351104107534701
313SADG
6,530
315
73.3
9
12-1
2-5
071.5
4
02-1
2-5
182.6
1
04-1
8-5
186.1
2
06-2
2-5
186.1
8
08-1
6-5
1
82
.23
76.8
775.5
09
0.6
486.2
2
10-3
1-5
1
12-2
4-5
1
02-2
6-5
2
06-2
5-5
2
08
-25
-52
80
.87
1
0-2
3-5
277.8
8
12
-16
-52
76.0
3
02
-17
-53
86
.09
0
4-1
5-5
38
6.2
1
06
-10
-53
86
.05
0
8-1
0-5
38
1.3
2
12
-17
-53
79
.21
0
2-1
1-5
480.6
6
04
-08
-54
85.9
6
08
-27
-54
83
.70
1
0-1
4-5
481.5
8
12
-01
-54
79.7
9
02
-10
-55
79
.88
0
4-1
5-5
587.0
8
10
-11
-55

Tab
le 1
.-R
ecor
ds o
f wel
ls a
nd sp
ring
s in
the
Aco
ma
emba
ymen
t and
eas
tern
Zun
i upl
ift C
ontin
ued
Con-
Altitude
Depth
trib-
of land
of we
ll,
Water
Local
Station
uting
Aquifer
surface
total
leve
l identifier
number
Owner
unit
code
(fee
t)
(feet)
(feet)
UN. 10W
. 04
. 21
1 351104107534701
85.1
484.12
84.70
86.84
87.29
86.8
887
.64
87.33
87.9
387.69
87.2
487.42
90.9
487
.94
313SADG
6,53
0 315
87.9
8
87.0
487.00
86.36
85.86
86.6
0
87.34
87.69
86.7
489
.18
86.36
Water-
Primary
leve
l use of
date
water
12-07-55
02-
-56
04-17-56
08-01-56
10-02-56
12-11-56
02-13-57
05-07-57
08-01-57
11-14-57
02-04-58
05-14-58
11-19-58
02-17-59
05-05-59
I
09-02-59
11-04-59
02-09-60
05-11-60
08-25-60
11-15-60
02-15-61
05-10-61
08-08-61
11-30-61
Diameter
of
casing
(inc
hes)
__ __ __

Tab
le ^
.-R
ecor
ds o
f wel
ls a
nd s
prin
gs in
theA
com
a em
bayn
tent
and
eas
tern
Zun
i upl
ift C
onti
nu
ed
Con-
Altitude
Depth
trib-
of land
of well,
Water
Local
Station
uting
Aquifer
surface
total
level
identifier
number
Owner
unit
code
(fee
t)
(feet)
(feet)
UN. 10W
. 04. 21
1 351104107534701
85.5
085
.67
86.7
490
.73
92.9
1
86.86
86.36
87.8
983.76
83.0
9
80.39
80.07
79.01
74.9
183.98
88.54
89.7
088.38
90.5
085
.90
82.60
78.5
377
.80
79.84
87.0
5
Water-
Primary
leve
l use of
date
water
02-13-62
05-15-62
08-15-62
11-27-62
02-04-63
08-19-63
03-09-64
08-12-64
02-09-65
08-05-65
02-09-66
08-23-66
02-21-67
04-03-68
02-12-69
02-16-70
01-11-71
01-19-72
01-24-73
01-14-74
01-16-75
02-11-76
01-17-77
02-02-78
03-28-79
Diameter
of
casing
(inc
hes)
-- __ -- __ -- -- -- -- -- __ __ -- -- -- __

Tab
le T
L. R
ecor
ds o
f wel
ls a
nd s
prin
gs in
the
Aco
ma
emba
ymen
t and
eas
tern
Zun
i upl
ift
Con
tinu
ed
Con-
Altitude
Depth
trib-
of land
of well
, Water
Local
Station
uting
Aquifer
surface
total
leve
l identifier
number
Owner
unit
code
(feet)
(feet)
(fee
t)
UN. 10W
. 04. 21
1 351104107534701
--
78.13
74.50
70.67
66.6
868.74
65.33
71.9
570.50
UN. 10W
. 04
. 222
351303107532201
John
P 110AVMB
6,54
0 94
.0
58.7
0John
60.3
5
60.3
760
.84
60.7
260.73
60.86
60.8
560
.83
60.98
61.2
961
.65
61.98
62.1
662.68
62.9
163
.03
Water-
Primary
leve
l use of
date
water
01-23-81
01-31-84
03-30-84
09-11-84
01-29-85
08-12-85
01-15-86
09-04-86
05-10-46
H07-11-46
09-04-46
10-01-46
11-06-46
12-03-46
01-03-47
02-03-47
03-11-47
04-07-47
05-05-47
06-04-47
07-07-47
08-06-47
10-02-47
12-10-47
02-02-48
Diameter
of
casing
(inc
hes)
_ 6.00
_ _ _

Tab
le l.
-Rec
ords
of w
ells
and
spr
ings
in th
e A
com
a em
baym
ent a
nd e
aste
rn Z
uni w
p///f
--C
ontin
ued
Con-
Altitude
Depth
trib-
of land
of we
ll,
Water
Local
Station
uting
Aquifer
surface
total
level
identifier
number
Owner
unit
code
(fee
t)
(feet)
(fee
t)
UN. 10W. 04. 222
351303107532201
63.25
64.60
65.08
65.17
65.22
66.66
66.08
65.92
66.05
66.97
67.56
67.50
67.72
67.89
68.1
4
68.98
69.29
70.03
70.78
70.44
71.24
72.27
72.40
72.44
74.05
Water-
level
date
04-05-48
08-04-48
12-09-48
02-10-49
04-11-49
10-11-49
12-14-49
02-07-50
04-18-50
06-27-50
08-23-50
10-16-50
12-12-50
02-12-51
04-18-51
06-22-51
08-16-51
10-31-51
02-26-52
04-24-52
06-25-52
10-24-52
02-17-53
04-15-53
06-10-53
Diameter
Primary
of
use of
casing
water
(inches)
__ __ __ __

Tab
le 1
. Rec
ords
of w
ells
and
spr
ings
in th
e A
com
a em
bayn
tent
and
eas
tern
Zun
i upl
ift C
ontin
ued
Con-
Altitude
Depth
trib-
of land
of we
ll,
Water
Local
Station
uting
Aquifer
surface
total
level
identifier
number
Owner
unit
code
(fee
t)
(feet)
(feet)
UN. 10W. 04. 222
351303107532201
~
73.0
473.52
73.1
573
.13
110AVMB
6,54
0 94
.0
73.5
8
74.33
74.8
074
.34
74.2
074
.60
75.61
75.8
777
.45
79.29
81.2
2
82.8
581.05
11N.10W.04.222A
351303107532102
Phillips, Boyd
P 231CHNL
6,54
0 29
3 76.87
74.85
74.39
73.1
572.20
UN. 10W. 04
. 311
351237107541901
Evans Rpod.
P 313SADG
6,540
1,000
96.3
274
.81
73.84
Water-
Primary
leve
l use of
date
water
08-10-53
10-08-53
12-17-53
02-11-54
04-07-54
H
06-11-54
10-14-54
12-01-54
02-10-55
04-15-55
08-10-55
02-07-56
02-13-57
02-04-58
02-17-59
02-09-60
02-15-61
03-30-84
U01-29-85
08-13-85
01-17-86
09-04-86
08-28-56
I03-30-84
01-30-85
Diameter
of
casing
(inc
hes)
__ _ -- -- __ -- -- __ __ -- ~

Tab
le 1
.-R
ecor
ds o
f wel
ls a
nd s
prin
gs in
the
Aco
ma
emba
ymen
t and
eas
tern
Zun
i upl
ift C
ontin
ued
Con-
Altitude
Depth
trib-
of land
of well,
Water
Local
Station
uting
Aquifer
surface
total
level
identifier
number
Owner
unit
code
(feet)
(feet)
(fee
t)
UN. 10W
. 04
. 31
1 351237107541901
69.21
72.23
65.9
471
.24
UN. 10W
. 04. 333
351216107541701
Dow Chemical Co
. P
313SADG
6,540.00
198
85.77
84.84
86.83
91.15
87.64
313SADG
6,540.00
198
89.3
5
90.85
89.37
87.56
88.60
94.51
92.0
893.58
91.9
491
.35
88.9
5
84.5
382
.64
81.3
080
.97
81.3
7
Water-
leve
l date
08-13-85
01-17-86
09-04-86
03-18-89
01-28-58
04-18-58
05-15-58
08-21-58
02-17-59
05-05-59
09-02-59
11-04-59
02-09-60
05-11-60
08-26-60
05-11-61
11-30-61
02-13-62
08-15-62
11-27-62
03-09-64
02-09-65
02-10-66
08-23-66
02-21-67
Diameter
Primary
of
use
of
casing
water
(inc
hes)
N 12.00
N
__

Tab
le 1
.-R
ecor
ds o
f wel
ls a
nd s
prin
gs in
the
Aco
ma
emba
ymen
t and
eas
tern
Zun
i upl
ift C
onti
nu
ed
Local
Station
identifier
number
Owner
UN. 10W. 04. 333
351216107541701
-- --
__
UN. 10W. 04. 344
3512
"! 6107535101
Evans, John
UN. 10W. 04. 422
351237107532201
Evans, John
Phillips, Boyd
UN. 10W. 05.
212
351304107541801
Evans, John
UN. 10W. 05. 213
351254107545001
Mirabal, Vidal
UN. 10W. 05. 214
351255107544001
Miribal, V.M.
Con-
Altitude
Depth
trib-
of land
of well,
Water
uting
Aquifer
surface
total
level
unit
code
(fee
t)
(feet)
(fee
t)
79.92
83.04
84.17
86.35
89.01
90.80
86.20
89.15
83.36
72.57
74.56
70.86
70.98
70.91
68.80
P 313SADG
6,530
120
84.40
P 110AVMB
6,540
89.0
75.80
73.72
P 313SADG
6,550
225
85.11
P 313SADG
6,550
153
95.20
P 110AVMB
6,550
68.79
75.32
71.86
72.06
70.46
Water-
Primary
level
use of
date
water
04-03-68
02-12-69
02-16-70
01-12-71
01-19-72
01-26-73
01-16-75
03-28-79
01-23-81
01-31-84
09-11-84
01-29-85
08-13-85
01-15-86
09-03-86
07-26-56
H07-25-56
H03-30-84
10-03-56
I11-05-57
H
05-10-46
U07-12-46
09-03-46
10-01-46
11-07-46
Diameter
of
casing
(inc
hes)
-- -- -- -- -- -- __ -- 4.00
6.00
16.00
12.00
4.00
-- --

Tab
le 1
.-R
ecor
ds o
f wel
ls a
nd s
prin
gs in
theA
com
a em
baym
ent a
nd e
aste
rn Z
uni u
plif
t Con
tinue
d
Con-
Altitude
Depth
trib-
of land
of we
ll,
Water
Local
Station
uting
Aquifer
surface
total
level
identifier
number
Owner
unit
code
(fee
t)
(feet)
(fee
t)
UN. 10W. 05. 214
351255107544001
--
69.80
69.34
68.99
68.78
70.60
76.59
78.70
80.28
83.38
77.60
75.61
73.23
72.42
72.25
110AVMB
6,550
81.20
83.13
77.87
74.90
73.70
75.10
79.68
78.73
75.52
73.43
72.18
Water-
Primary
level
use of
date
water
12-03-46
01-03-47
02-03-47
03-11-47
04-07-47
05-05-47
06-04-47
07-07-47
08-06-47
09-02-47
10-02-47
12-10-47
02-03-48
04-05-48
06-10-48
U
08-04-48
10-05-48
12-09-48
02-10-49
04-11-49
06-09-49
08-18-49
10-12-49
12-15-49
02-07-50
Diameter
of
casing
(inches)
_ _ __ __

Tab
le l
.~R
ecor
ds o
f wel
ls a
nd s
prin
gs in
the
Aco
ma
emba
ymen
t and
eas
tern
Zun
i upl
ift C
ontin
ued
Local
Station
identifier
number
Owner
UN. 10W. 05
. 21
4 351255107544001
. _ ~ __
UN. 10W
. 05
. 23
2 351251107543401
Evans
& Ellenger
UN. 10W
. 05
. 3211
351238107550501
Thornton, C.
B.UN. 10W
. 05. 3212
351238107550301
Thornton, C.B.
UN. 10W
. 08
. Il
l 351209107552502
Milan, Salvador
__
Con-
Altitude
Depth
trib-
of land
of well.
Water
uting
Aquifer
surface
total
leve
l unit
code
(feet)
(feet)
(feet)
75.23
89.19
87.62
82.52
78.40
76.6
079
.88
93.8
893
.50
85.45
80.2
084.72
P 313SADG
6,55
0 14
5 98.45
P 313SADG
6,55
0 15
5 84
.27
P 313SADG
6,55
0
74.2
2
P 313SADG
6,552.00
150
95.60
72.95
76.3
976
.55
75.21
74.5
874.11
73.7
573
.45
313SADG
6,552.00
150
75.1
0
Water-
Primary
leve
l use of
date
water
04-18-50
06-27-50
08-23-50
10-16-50
12-12-50
02-12-51
04-19-51
06-22-51
08-15-51
10-31-51
02-26-52
04-24-52
07-20-56
H07-25-84
H07-25-84
I
02-26-46
I05-09-46
09-03-46
10-01-46
11-07-46
12-03-46
01-03-47
02-03-47
03-11-47
04-07-47
I
Diameter
of
casing
(inches)
__ 16.00
6.00
10.00
12.00

Tab
le "
L R
ecor
ds o
f wel
ls a
nd s
prin
gs in
the
Aco
ma
emba
ymen
t and
eas
tern
Zun
i upl
ift
Con
tinu
ed
Con-
Altitude
Depth
trib-
of land
of well,
Water
Local
Station
uting
Aquifer
surface
total
level
identifier
number
Owner
unit
code
(fee
t)
(feet)
(feet)
UN. 10W
. 08. Ill
351209107552502
94.36
94.42
84.43
84.66
86.12
81.37
80.37
77.90
77.1
276.90
102.50
87.21
82.53
79.65
78.46
79.91
85.10
94.73
80.2
478.36
77.40
93.0
796
.83
90.96
87.1
7
Water-
level
date
05-05-47
06-04-47
07-07-47
07-10-47
08-06-47
09-02-47
10-02-47
12-10-47
02-02-48
04-05-48
06-11-48
08-05-48
10-05-48
12-09-48
02-10-49
04-11-49
06-11-49
08-18-49
10-12-49
12-15-49
02-07-50
04-18-50
06-27-50
08-24-50
10-16-50
Diameter
Primary
of
use of
casing
water
(inches)
__ __ __ -- __ --

Tab
le l
.~R
ecor
ds o
f wel
ls a
nd s
prin
gs in
the
Aco
ma
emba
ymen
t and
eas
tern
Zun
i upl
ift C
onti
nu
ed
Con-
Altitude
Depth
trib-
of land
of well,
Water
Local
Station
uting
Aquifer
surface
total
level
identifier
number
Owner
unit
code
(feet)
(feet)
(fee
t)
UN. 10W. 08
. Il
l 351209107552502
83.17
81.3
684
.13
88.1
2313SADG
6,552.00
150
88.85
92.93
96.90
98.93
96.9
098.85
98.75
101.05
103.05
98.70
95.64
93.75
95.8
896.24
94.1
7101.98
103.84
100.40
97.77
99.3
595
.05
Water-
Primary
level
use of
date
water
12-12-50
02-12-51
02-26-52
02-09-54
02-10-55
I
02-07-56
02-12-57
11-14-57
02-05-58
02-17-59
02-09-60
02-16-61
02-13-62
02-05-63
03-09-64
02-09-65
02-12-69
02-16-70
01-12-71
01-19-72
01-26-73
01-15-74
01-16-75
02-02-78
01-23-81
Diameter
of
casing
(inches)
__ _ __ _

Tab
le 1
.-R
ecor
ds o
f wel
ls a
nd s
prin
gs in
the
Aco
ma
enib
aym
ent a
nd e
aste
rn Z
uni u
plif
t Con
tinue
d
Con-
Altitude
Depth
trib-
of la
nd
of well
, Water
Local
Station
uting
Aquifer
surface
total
level
identifier
number
Owner
unit
code
(fee
t)
(feet)
(f
eet)
UN. 10W
. 08. Ill
351209107552502
~
84.0
781.56
82.37
81.56
81.04
79.95
11N.10W.08.111A
351209107552501
Milan, Salvador
P 110AVMB
6,56
0 13
5 25.00
UN. 10W. 08
. 122
351213107545401
Milan, Salvador
P 313SADG
6,537.00
150
67.84
86.0
063
.78
62.7
466
.67
90.04
69.9
470
.50
73.8
374
.64
78.13
82.4
182
.68
84.41
86.6
789
.23
69.75
UN. 10W. 08. 221
351213107542701
Mila
n, Salvadore
N
313SADG
6,540
165
60.3
5
Water-
Primary
level
use of
date
water
01-31-84
09-11-84
01-29-85
08-13-85
01-15-86
09-04-86
10-19-44
H12-10-47
I08-05-48
02-10-49
02-07-50
02-13-51
06-22-51
02-26-52
02-19-53
02-09-54
02-10-55
02-07-56
02-12-57
02-05-58
02-17-59
02-16-61
02-13-62
03-06-84
02-01-46
I
Diameter
of
casing
(inc
hes)
__ 6.00
14.00
__ __ _ 16.00

Tab
le l.
-Rec
ords
of w
ells
and
spr
ings
in th
e A
com
a em
baym
ent a
nd e
aste
rn Z
uni u
plif
t Con
tin
ued
Con-
t rib-
Local
Station
uting
identifier
number
Owner
unit
UN. 10W
. 08
. 221
351213107542701
S S S S P
__
__
__
__
__
__
Altitude
Depth
of land
of we
ll,
Water
Aquifer
surface
total
level
code
(feet)
(feet)
(feet)
57.8
565.37
65.4
964.37
63.8
0
313SADG
6,54
0 16
5 63.37
63.04
62.7
964.52
72.1
8
73.9
975
.49
76.95
70.1
569
.22
67.02
66.32
66.2
576
.77
75.88
71.09
69.8
167
.60
72.2
678.20
Water-
Primary
leve
l use of
date
water
02-27-46
09-03-46
10-01-46
11-07-46
12-03-46
01-03-47
I02-03-47
03-11-47
04-07-47
05-05-47
06-04-47
07-07-47
08-06-47
09-02-47
10-02-47
12-10-47
02-02-48
04-05-48
06-10-48
08-05-48
10-05-48
12-09-48
02-10-49
04-11-49
06-11-49
Diameter
of
casing
(inc
hes)
__ __ __ _

Tab
le 1
.--R
ecor
ds o
f wel
ls a
nd s
prin
gs in
theA
com
a em
baym
ent a
nd e
aste
rn Z
uni u
plif
t Con
tin
ued
Con-
Altitude
Depth
trib-
of land
of well,
Water
Local
Station
uting
Aquifer
surface
total
level
identifier
number
Owner
unit
code
(fee
t)
(feet)
(fee
t)
UN. 10W
. 08
. 22
1 351213107542701
72.73
69.30
67.47
66.55
71.4
3
83.75
79.54
78.37
72.09
70.43
75.09
86.73
84.16
78.27
73.66
78.17
92.92
83.13
76.25
313SADG
6,540
165
74.25
77.10
90.6
186
.32
89.06
79.5
0
Water-
Primary
level
use
of
date
water
08-18-49
10-12-49
12-15-49
02-07-50
04-18-50
06-27-50
08-23-50
10-16-50
12-12-50
02-13-51
04-19-51
06-22-51
08-15-51
10-31-51
02-26-52
04-24-52
06-25-52
08-26-52
12-17-52
02-19-53
I
04-16-53
06-11-53
08-11-53
10-08-53
12-17-53
Diameter
of
casing
(inc
hes)
-- __ __ __ __ -_

Tab
le 1
. R
ecor
ds o
f wel
ls a
nd s
prin
gs i
n th
e A
com
a em
baym
ent a
nd e
aste
rn Z
uni u
plif
t Con
tin
ued
Con-
Altitude
Depth
trib-
of land
of well,
Water
Local
Station
uting
Aquifer
surface
total
leve
l identifier
number
Owner
unit
code
(feet)
(feet)
(fee
t)
UN. 10W. 08. 22
1 351213107542701
77.5
387
.47
92.4
182
.14
79.9
4
78.20
80.97
92.7
992.53
86.2
3
83.1
681.72
93.67
90.6
287.55
86.05
88.9
591.24
86.27
87.41
92.32
89.74
88.23
89.7
6313SADG
6,540
165
91.0
6
Water-
Primary
level
use of
date
water
02-09-54
04-08-54
06-11-54
10-14-54
12-01-54
02-10-55
04-15-55
06-15-55
08-10-55
10-11-55
12-07-55
02-07-56
08-02-56
10-02-56
12-12-56
02-12-57
05-07-57
08-01-57
02-05-58
05-15-58
08-21-58
11-20-58
02-17-59
05-05-59
09-02-59
I
Diameter
of
casing
(inches)
__ __ __ __

Tab
le 1
. R
ecor
ds o
f wel
ls a
nd s
prin
gs in
theA
com
a em
baym
ent a
nd e
aste
rn Z
uni u
plif
t Con
tinue
d
Con-
Altitude
Depth
trib-
of land
of we
ll,
Water
Local
Station
uting
Aquifer
surface
total
level
identifier
number
Owner
unit
code
(feet)
(feet)
(f
eet)
UN. 10W. 08
. 221
351213107542701
~
90.7
588.15
89.48
95.09
92.9
7
90.52
91.60
92.49
93.4
791.46
90.6
573.35
UN. 10W. 08
. 34
3 351125107550401
Milan, Salvador
P 313SADG
6,530
100
55.30
54.41
53.91
53.42
53.02
52.76
54.41
59.11
60.99
62.50
64.06
60.0
359.05
Water-
level
date
11-04-59
02-09-60
05-11-60
08-26-60
11-15-60
02-16-61
08-08-61
02-13-62
05-15-62
08-15-62
11-27-62
03-06-84
10-02-46
11-07-46
12-03-46
01-04-47
02-04-47
03-11-47
04-08-47
05-06-47
06-05-47
07-08-47
08-06-47
09-03-47
10-03-47
Diameter
Primary
of
use of
casing
water
(inches)
. _ __
S 6.00
_ __

Tab
le ^
.-Rec
ords
of w
ells
and
spri
ngs
in th
e A
com
a em
baym
ent a
nd e
aste
rn Z
uni u
plif
t Con
tinue
d
Con-
trib-
Local
Station
uting
identifier
number
Owner
unit
UN. 10W. 08. 34
3 351125107550401
_
__
UN. 10W. 09. 22
1 351211107532901
Stanley & Card
N S s S s s s
-.
p s"
^
_
__
Altitude
Depth
of land
of we
ll,
Water
Aquifer
surface
total
leve
l code
(fee
t)
(feet)
(feet)
57.56
56.69
60.45
63.5
961.42
61.1
760.60
58.83
313SADG
6,53
4 48
0 54.49
61.2
0
61.25
60.5
060.08
60.04
59.4
5
60.12
91.8
993
.12
94.4
695.51
68.96
65.46
313SADG
6,53
4 480
66.04
63.06
62.4
2
Water-
Primary
level
use of
date
water
02-11-49
02-08-50
02-13-51
03-06-84
01-29-85
08-13-85
01-17-86
09-17-86
02-26-46
I09-04-46
10-01-46
11-06-46
12-03-46
01-03-47
02-03-47
03-11-47
04-07-47
05-05-47
06-04-47
07-07-47
08-06-47
09-02-47
10-02-47
I12-10-47
02-02-48
Diameter
of
casing
(inc
hes)
~ ~ ~ ~
20.00
~ _ ~ ~ ~ ~

Tab
le 1
.-R
ecor
ds o
f wel
ls a
nd s
prin
gs in
the
Aco
ma
emba
ymen
t and
eas
tern
Zun
i upl
ift
Con
tinu
ed
Con-
Altitude
Depth
trib-
of land
of we
ll,
Water
Local
Station
uting
Aquifer
surface
total
level
identifier
number
Owner
unit
code
(feet)
(feet)
(feet)
UN. 10W
. 09
. 221
351211107532901
90.0
069
.70
95.5
067
.63
64.7
9
63.72
65.42
70.16
93.57
65.23
63.6
562.88
74.8
574
.77
71.5
0
67.6
966.04
93.24
99.6
5100.00
74.0
570
.70
69.3
910
2.24
100.75
Water-
level
date
04-05-48
06-10-48
08-04-48
10-05-48
12-09-48
02-10-49
04-11-49
06-09-49
08-18-49
10-11-49
12-14-49
02-07-50
06-27-50
08-23-50
10-16-50
12-12-50
02-12-51
04-18-51
06-22-51
08-16-51
10-31-51
12-24-51
02-26-52
06-25-52
08-25-52
Diameter
Primary
of
use of
casing
water
(inc
hes)
_ -- _

Tab
le ^
.-Rec
ords
of w
ells
and
spr
ings
in th
e A
com
a em
baym
ent a
nd e
aste
rn Z
uni u
plif
t C
onti
nued
Con-
Altitude
Depth
trib-
of land
of well,
Water
Local
Station
uting
Aquifer
surface
total
level
identifier
number
Owner
unit
code
(feet)
(feet)
(fee
t)
UN. 10W
. 09. 221
351211107532901
74.5
295
.22
69.8
572
.82
101.
04
79.7
674.35
72.5
796.34
101.
19
80.00
76.8
975.82
73.04
81.0
8
80.13
77.63
75.8
181.93
106.
40
84.8
081.76
80.22
84.78
82.22
Water-
Primary
level
use of
date
water
10-23-52
12-17-52
02-17-53
04-15-53
06-10-53
08-10-53
12-17-53
02-11-54
04-08-54
06-11-54
08-31-54
10-14-54
12-01-54
02-11-55
06-15-55
10-11-55
12-07-55
02-07-56
06-05-56
08-01-56
10-02-56
12-12-56
02-13-57
08-02-57
11-14-57
Diameter
of
casing
(inc
hes)
__ -- __ __ -- __

Tab
le 1
. Rec
ords
of w
ells
and
spr
ings
in th
eAco
ma
emba
ymen
t and
eas
tern
Zun
i upl
ift C
ontin
ued
Con-
Altitude
Depth
trib-
of land
of we
ll,
Water
Local
Station
uting
Aquifer
surface
total
leve
l identifier
number
Owner
unit
code
(feet)
(fee
t)
(fee
t)
UN. 10W
. 09. 221
351211107532901
~
~
80.45
86.2
084.24
82.40
105.57
85.30
82.90
87.2
785
.12
85.62
88.7
487
.10
88.68
85.35
82.7
9
83.27
79.96
77.92
79.08
313SADG
6,53
4 48
0 76
.31
82.9
075
.69
75.69
77.8
077.97
Water-
leve
l date
02-04-58
08-19-58
11-20-58
02-17-59
05-05-59
11-03-59
02-09-60
11-15-60
02-16-61
05-11-61
11-30-61
02-13-62
05-15-62
11-27-62
02-04-63
08-19-63
03-09-64
02-09-65
08-06-65
02-09-66
08-23-66
02-21-67
04-03-68
02-12-69
02-16-70
Diameter
Primary
of
use of
casing
water
(inc
hes)
__ ~ _ __
I
__

Tab
le 1
.-R
ecor
ds o
f wel
ls a
nd s
prin
gs in
theA
com
a em
baym
ent a
nd e
aste
rn Z
uni u
plif
t C
ontin
ued
Con-
Altitude
Depth
trib-
of land
of we
ll,
Water
Local
Station
uting
Aquifer
surface
total
leve
l identifier
number
Owner
unit
code
(feet)
(feet)
(fee
t)
UN. 10W
. 09
. 22
1 351211107532901
79.7
082
.92
85.4
283
.01
81.4
5
82.0
884.43
83.4
283.40
80.33
70.38
70.6
568
.41
68.5
467.36
67.02
66.10
UN. 10W
. 09
. 24
1 351157107532801
Stanley & Card
P 313SADG
6,530
125
52.24
59.70
63.9
8
59.05
58.38
57.98
58.06
313SADG
6,530
125
57.3
3
Water-
Primary
level
use of
date
water
01-11-71
01-19-72
01-24-73
01-14-74
01-16-75
02-11-76
01-17-77
02-02-78
03-26-79
01-23-81
01-31-84
03-30-84
09-11-84
01-29-85
08-12-85
01-15-86
09-04-86
02-26-46
H05-09-46
07-11-46
10-01-46
11-06-46
12-03-46
01-03-47
02-03-47
H
Diameter
of
casing
(inc
hes)
__ 8.00

Tab
le 1
.-R
ecor
ds o
f wel
ls a
nd s
prin
gs in
the
Aco
ma
emba
ymen
t and
eas
tern
Zun
i upl
ift C
onti
nu
ed
Con-
Altitude
Depth
trib-
of land
of well,
Water
Local
Station
uting
Aquifer
surface
total
level
identifier
number
Owner
unit
code
(feet)
(feet)
(f
eet)
UN. 10W
. 09. 24
1 351157107532801
--
57.71
62.9
665.39
67.31
68.97
66.80
63.48
62.75
61.1
360.44
63.17
66.23
71.1
365.19
62.7
8
61.66
62.52
67.0
567.99
63.24
61.7
260
.84
62.8
074
.08
73.22
Water-
level
date
03-11-47
04-07-47
05-05-47
06-04-47
07-07-47
08-06-47
09-02-47
10-02-47
12-10-47
02-02-48
04-05-48
06-10-48
08-04-48
10-05-48
12-09-48
02-10-49
04-11-49
06-09-49
08-18-49
10-11-49
12-14-49
02-07-50
04-18-50
07-27-50
08-23-50
Diameter
Primary
of
use of
casing
water
(inc
hes)
_ _

Tab
le ^
. Rec
ords
of w
ells
and
spr
ings
in th
e A
com
a em
baym
ent a
nd e
aste
rn Z
uni u
plif
t C
onti
nued
Con-
Altitude
Depth
trib-
of land
of we
ll,
Water
Local
Station
uting
Aquifer
surface
total
level
identifier
number
Owner
unit
code
(feet)
(fee
t)
(fee
t)
UN. 10W
. 09
. 24
1 351157107532801
~
69.2
966.07
64.4
267
.25
78.0
2
78.9
871
.93
69.0
067
.44
74.6
0
80.36
68.2
5UN. 10W
. 09
. 424
351138107532201
Card,
A.R.
P
313SADG
6,600
235
62.0
0UN. 10W
. 10
. Il
l 351213107531701
Harding, Milton
P 110AVMB
6,54
0
52.82
51.9
2
57.25
58.6
253.35
54.18
54.4
7
54.8
754
.97
55.1
255.26
55.39
Water-
Primary
level
use of
date
water
10-16-50
12-12-50
02-12-51
04-18-51
06-22-51
08-16-51
10-31-51
12-24-51
02-26-52
04-24-52
06-25-52
05-30-84
07-01-50
H11-06-44
U02-26-46
05-09-46
05-10-46
07-11-46
09-04-46
10-01-46
11-06-46
12-03-46
01-03-47
02-03-47
03-11-47
Diameter
of
casing
(inches)
-- __ __ 7.00
-- __ __

Tab
le l.
~R
ecor
ds o
f wel
ls a
nd sp
ring
s in
the
Aco
ma
emba
ymen
t and
eas
tern
Zun
i upl
ift C
ontin
ued
Con-
trib-
Local
Station
uting
identifier
number
Owner
unit
UN. 10W
. 10. Ill
351213107531701
IIN.IOW.IO.IIIA
351213107531702
Harding, Milton
P--
__
UN. 10W
. 16. 121
351122107535901
Hano
sh,
Lee
N S S S P
Altitude
Depth
of land
of well,
Water
Aquifer
surface
total
level
code
(feet)
(fee
t)
(feet)
55.50
55.6
255.84
56.16
59.86
82.50
84.9
0110AVMB
6,540
73.38
313SADG
6,53
5 200
82.48
82.5
0
84.9
073.38
313SADG
6,530
155
46.47
54.96
52.96
53.06
52.52
52.15
51.75
51.42
52.58
71.6
556
.12
75.3
477.25
Water-
leve
l date
04-07-47
05-05-47
06-04-47
07-07-47
06-10-48
02-13-57
11-14-57
03-30-84
10-10-55
02-13-57
11-14-57
03-30-84
02-27-46
07-12-46
09-03-46
10-01-46
11-07-46
12-03-46
01-03-47
02-03-47
03-11-47
04-07-47
05-05-47
06-05-47
07-07-47
Diameter
Primary
of
use of
casing
water
(inc
hes)
_
U H 6.
00 _ 16.0
014
.00
__ __

Tab
le 1
, Rec
ords
of w
ells
and
spri
ngs
in th
e Aco
ma
emba
ymen
t and
eas
tern
Zun
i upl
ift-
Con
tinue
d
Con-
Altitude
Depth
trib-
of land
of we
ll,
Water
Local
Station
uting
Aquifer
surface
total
level
identifier
number
Owner
unit
code
(fee
t)
(feet)
(feet)
UN. 10W
. 16. 121
351122107535901
60.18
57.3
256
.62
55.12
54.4
5
54.60
89.3
281.56
59.55
57.01
55.88
56.51
80.4
179
.07
313SADG
6,53
0 15
5 57.39
55.88
54.98
74.36
82.96
84.05
63.20
60.0
858.47
77.85
85.32
Water-
Primary
level
use of
date
water
08-06-47
09-02-47
10-02-47
12-10-47
02-02-48
04-05-48
06-11-48
08-04-48
10-05-48
12-09-48
02-10-49
04-12-49
06-09-49
08-18-49
10-11-49
12-14-49
02-07-50
04-18-50
06-27-50
08-23-50
10-16-50
12-12-50
02-13-51
04-19-51
06-22-51
Diameter
of
casing
(inc
hes)
__ ~ __ __ ~ ~ ~ ~ ~

Tab
le 1
.~R
ecor
ds o
f wel
ls a
nd s
prin
gs i
n th
e A
com
a em
baym
ent a
nd e
aste
rn Z
uni M
/7/f/
f--C
ontin
ued
Con-
Altitude
Depth
trib-
of land
of well,
Water
Local
Station
uting
Aquifer
surface
total
level
identifier
number
Owner
unit
code
(feet)
(feet)
(fee
t)
UN. 10W. 16. 121
351122107535901
87.77
65.60
61.36
87.0
787
.23
66.66
64.27
62.0
182
.54
86.1
0
11N.10W.16.121A
351122107535902
Hanosh, Lee
P 313SADG
6,530
180
89.2
371.29
66.13
64.30
64.59
91.30
86.11
68.2
966
.48
313SADG
6,530
180
64.7
1
64.66
72.8
271
.80
69.3
667
.85
Water-
level
date
08-16-51
10-31-51
02-26-52
06-25-52
08-26-52
10-22-52
12-16-52
02-19-53
04-16-53
06-11-53
08-11-53
10-09-53
12-17-53
02-09-54
04-08-54
06-11-54
08-31-54
10-14-54
12-11-54
02-10-55
04-15-55
06-15-55
10-10-55
12-07-55
02-07-56
Diameter
Primary
of
use of
casing
water
(inches)
-- -- __ -- -- --
I 16
.00
__ -- --
I
__ --

Tab
le ^
.-R
ecor
ds o
f wel
ls a
nd s
prin
gs in
the
Aco
ma
emba
ymen
t and
eas
tern
Zun
i upl
ift C
onti
nu
ed
Con-
Altitude
Depth
trib-
of land
of well,
Water
Local
Station
uting
Aquifer
surface
total
level
identifier
number
Owner
unit
code
(fee
t)
(feet)
(f
eet)
11N.10W.16.121A
351122107535902
~
68.63
72.70
92.56
91.28
73.20
71.84
73.52
76.07
73.95
72.13
72.96
77.34
75.83
74.44
75.70
77.38
76.93
74.61
75.97
80.48
78.93
76.81
77.05
83.68
80.47
Water-
Primary
level
use of
date
water
04-17-56
06-05-56
08-02-56
10-02-56
12-12-56
02-12-57
05-07-57
08-01-57
11-14-57
02-05-58
05-15-58
08-21-58
11-20-58
02-17-59
05-05-59
09-02-59
11-04-59
02-09-60
05-11-60
08-26-60
11-15-60
02-16-61
05-11-61
08-08-61
11-30-61
Diameter
of
casing
(inches)
__ __ __

Tab
le 1
. Rec
ords
of w
ells
and
spr
ings
in th
eAco
ma
enib
aym
ent a
nd e
aste
rn Z
uni u
plif
t Con
tinue
d
Con-
Altitude
Depth
trib-
of land
of we
ll,
Water
Local
Station
uting
Aquifer
surface
total
level
identifier
number
Owner
unit
code
(feet)
(fee
t)
(feet)
11N.10W.16.121A
351122107535902
~
78.8
285
.28
76.03
74.8
584.73
71.5
374
.67
70.9
572.00
71.6
8
69.75
72.9
771
.43
74.48
75.1
5
78.8
877
.15
121.00
UN. 10W. 16
. 142
351107107535201
Hanosh, Lee
P 110AVMB
6,530
83.0
41.50
45.50
47.9
351.00
50.90
51.05
50.80
Water-
Primary
level
use of
date
water
02-13-62
05-15-62
11-27-62
02-05-63
08-19-63
03-09-64
08-12-64
02-09-65
08-06-65
02-09-66
02-21-67
04-02-68
02-12-69
01-11-71
01-19-72
01-26-73
01-14-74
03-21-79
11-06-44
H02-26-46
05-09-46
07-10-46
09-03-46
10-01-46
11-07-46
Diameter
of
casing
(inc
hes)
__ __ ~ __ 8.00
__

Tab
le I
. Rec
ords
of w
ells
and
spr
ings
in th
e A
com
a em
baym
ent a
nd e
aste
rn Z
uni u
plif
t Con
tinue
d
Con-
Altitude
Depth
trib-
of land
of well,
Water
Local
Station
uting
Aquifer
surface
total
level
identifier
number
Owner
unit
code
(feet)
(feet)
(feet)
UN. 10W. 16
. 14
2 351107107535201
110AVMB
6,530
83.0
50.53
50.15
49.8
549.56
50.89
52.04
52.53
53.96
54.79
54.69
54.38
53.33
52.77
52.55
54.40
56.09
56.68
54.25
54.29
54.92
55.19
53.44
UN. 10W. 16. 21
4 351113107533701
P 110AVMB
6,540
109
83.00
UN. 10W. 16. 23
3 351057107533701
Elkins
P 110AVMB
6,530
60.0
UN. 10W. 16. 43
4 351033107533501
Turner, Jack
P 313SADG
6,520
240
72.00
Water-
Primary
level
use of
date
water
12-03-46
H01-03-47
02-03-47
03-11-47
04-07-47
05-05-47
06-04-47
07-07-47
08-06-47
09-02-47
10-02-47
12-10-47
02-02-48
04-05-48
06-10-48
08-04-48
10-06-48
02-11-49
04-12-49
06-09-49
10-11-49
02-07-50
11-13-57
H U07-27-56
H
Diameter
of
casing
(inches)
__ __ 6.00
6.00
4.00

Tab
le \.
~Rec
ords
of w
ells
and
spri
ngs
in th
e A
com
a em
baym
ent a
nd e
aste
rn Z
uni «
pW/f~
Con
tinue
d
Con-
Altitude
Depth
trib-
of land
of we
ll,
Water
Local
Station
uting
Aquifer
surface
total
level
identifier
number
Owner
unit
code
(feet)
(feet)
(feet)
UN. 10W. 17. 22
2 351117107542301
Mila
n, Salvador
P 313SADG
6,527
125
46.87
52.00
49.7
249.74
49.00
48.61
48.44
47.84
47.64
313SADG
6,527
125
51.97
51.37
54.9
757.97
58.58
61.67
62.0
965.30
68.9
469
.80
75.7
2
72.2
774
.23
75.2
358.78
56.47
Water-
leve
l date
05-09-46
07-11-46
09-03-46
10-01-46
11-07-46
12-03-46
01-04-47
02-04-47
03-11-47
02-11-49
02-08-50
02-13-51
02-26-52
02-19-53
02-09-54
02-10-55
02-07-56
02-12-57
02-05-58
05-05-59
02-09-60
02-16-61
02-13-62
03-06-84
09-11-84
Diameter
Primary
of
use of
casing
water
(inches)
I 12
.00
I
__ __ __

Tab
le 1
.-R
ecor
ds o
f wel
ls a
nd s
prin
gs in
the
Aco
ma
emba
ymen
t and
eas
tern
Zun
i upl
ift C
onti
nu
ed
Local
identifier
UN. 10W. 17
UN. 10W. 20
UN. 10W
. 21
UN. 10W. 21
UN. 10W. 21
UN. 10W
. 21
UN. 10W
. 21
UN. 10W. 21
UN. 10W
. 22
UN. 10W. 25
UN. 10W. 26
UN. 10W
. 26
.222
.242
.144
.212
.214
.221
.232
.242
.311
.221
.133
.321
Station
number
351117107542301
351017107542901
351008107535501
351028107533601
351018107533601
351030107532601
351015107533601
351015107532201
351003107531201
350935107502101
350917107520901
350910107515401
Owner
Milan,
Mila
n,Stewart
Failing
-- --
Salvador
Salvador
Bros.
Co. --
Std.
Bulk Sta.
Mila
n,
Thigpen
Salvador
, W.A.
Hawkinson
Grants
City ofLumber
Grants
-- -- --
Con
trib
uting
unit
~ --
P P P P --
P P P P P P -- --
Aquifer
code
313SADG
110AVMB
do.
do.
do.
do.
do.
do.
do.
do.
do.
Altitude
of land
surface
(feet)
6,55
0
6,52
06,
520
6,52
0 --
6,510
6,52
0
6,52
06,
460
6,48
06,
470
Depth
of well
, total
(fee
t)
180
126
135
125
-- 104 90.0
140
138
135
110
Water
leve
l (f
eet)
56.6
3 56.16
55.54
54.73
66.5
054
.07
52.26
51.8
351.76
64.74
65.11
54.0
048
.00
48.80
18.6
031.30
9.36
7.95
7.40
10.86
8.92
9.44
12.6
0
Water-
Primary
level
use of
date
water
01-29-85
08-13-85
01-15-86
09-04-86
S
11-25-57
P10-02-47
H12-10-47
02-02-48
04-05-48
09-27-56
09-27-56
H
04-09-54
H06-13-49
Z
06-13-49
H08-28-56
H08-19-57
N10-02-46
P02-04-47
03-11-47
04-07-47
05-05-47
06-04-47
07-07-47
Diameter
of
casing
(inches)
~ -- 6.00
12.0
0-- -- -- __ 6.
00 8.
00
7.00
6.00
8.00
16.0
0 __

Tab
le 1
.-R
ecor
ds o
f wel
ls a
nd sp
ring
s in
theA
com
a em
baym
ent a
nd e
aste
rn Z
uni u
plif
t-C
ontin
ued
Con-
Altitude
Depth
trib-
of land
of we
ll,
Water
Local
Station
uting
Aquifer
surface
total
level
identifier
number
Owner
unit
code
(feet)
(feet)
(fee
t)
UN. 10W. 26. 321
350910107515401
12.7
5110AVMB
6,470
110
10.71
10.59
9.70
11.70
8.71
13.79
14.7
214.70
12.3
3
9.77
9.08
11.79
14.9
811.69
13.5
29.32
8.85
17.60
110AVMB
6,470
110
18.0
9
18.7
2.
15.0
211
.90
9.70
11.20
Water-
Primary
level
use of
date
water
08-06-47
09-02-47
P10-02-47
12-10-47
02-02-48
04-05-48
06-11-48
08-04-48
10-05-48
12-09-48
02-10-49
04-11-49
06-08-49
08-18-49
10-11-49
12-14-49
02-08-50
04-18-50
06-26-50
08-23-50
P
10-16-50
10-17-50
12-12-50
02-12-51
04-19-51
Diameter
of
casing
(inc
hes)
__ __ __ __

Tab
le 1
. Rec
ords
of w
ells
and
spr
ings
in th
e A
com
a em
baym
ent a
nd e
aste
rn Z
uni u
plif
t Con
tinue
d
Con-
Altitude
Depth
trib-
of land
of we
ll,
Water
Local
Station
uting
Aquifer
surface
total
leve
l identifier
number
Owner
unit
code
(feet)
(feet)
(feet)
UN. 10W
. 26
. 32
1 350910107515401
13.85
20.26
13.19
13.09
21.42
16.30
14.91
18.07
19.55
17.1
1
19.3
923.70
24.93
20.22
18.2
4
16.95
21.60
26.18
25.90
22.46
28.09
27.55
28.64
71.10
32.82
Water-
Primary
level
use of
date
water
06-20-51
08-16-51
02-26-52
04-23-52
10-28-52
02-20-53
04-16-53
12-18-53
02-11-54
04-09-54
06-15-54
08-31-54
10-14-54
12-03-54
02-12-55
04-15-55
06-15-55
08-10-55
10-10-55
02-08-56
08-02-56
12-12-56
02-12-57
05-07-57
08-01-57
Diameter
of
casing
(inches)
__

Tab
le 1
. Rec
ords
of w
ells
and
spr
ings
in th
e A
com
a em
baym
ent a
nd e
aste
rn Z
uni u
plif
t Con
tin
ued
Local
identifier
UN. 10W.
UN. 10W.
UN. 10W.
UN. 10W.
UN. 10W
.UN. 10W
.UN. 10W
.UN. 10W
.
UN. 10W
.UN. 10W
.UN. 10W
.UN. 10W
.UN. 10W
.
26 26 26 26 26 26 26 26 26 26 27 27 27
.321
.321A
.321B
.321C
.3210
.322
.411
.412
.414
.441
.211
.232
.241
Station
number
Owner
350910107515401
350910107514602
City of Grants
350910107514603
City of Grants
350910107514604
City of Grants
350910107515402
City of Grants
350910107514601
350911107511701
AT&SF RR
350911107511702
350903107511601
350852107512201
350939107534701
350926107523401
350923107522701
Growers Assoc.
__ __
Con
trib
uting
unit
P P P P U P P P U --
P
__ __ --
Aquifer
code
110AVMB
110AVMB
313SADG
110AVMB
110AVMB
110AVMB
110AVMB
313SADG
313SADG
313SADG
Altitude
of land
surface
(feet)
6, 6, 6, 6, 6, 6, 6, 6, 6, 6,
470
470
470
460
460
460
450
450
450 -- 480
Depth
of we
ll,
Water
total
level
(feet)
(f
eet)
21
21 2310
0 33
95.0
245
2212
0 40.0
24 2042
.0
40.0
15 15
158
19 20 29 23 21 21 26 23 22 21 26
.14
.30
.48
.80
- .00
- .20
.20
- .90
.40
- - .86
.34
.45
.45
.85
.35
.28
.63
.28
.60
.31
Water-
Primary
level
use of
date
water
02-17-59
05-05-59
09-02-59
09-05-57
P P
06-26-58
P U09-21-57
U09-21-57
U
09-20-57
U09-20-57
I __
02-20-53
N
04-16-53
10-09-53
12-17-53
02-09-54
04-06-54
06-14-54
12-03-54
02-10-55
04-15-55
06-15-55
Diameter
of
casing
(inc
hes)
~ 8.00
8.00
16.00
10.00
8.00
16.00
__ ~ __ ~

Tab
le 1
.-R
ecor
ds o
f wel
ls a
nd s
prin
gs in
the
Aco
ma
emba
ymen
t and
eas
tern
Zun
i upl
ift
Con
tinu
ed
Con-
Altitude
Depth
trib-
of land
of we
ll,
Water
Local
Station
uting
Aquifer
surface
total
level
identifier
number
Owner
unit
code
(feet)
(feet)
(fee
t)
UN. 10W. 27
. 241
350923107522701
--
313SADG
6,480
158
26.08
24.7
524.58
27.3
029
.33
30.19
29.15
28.1
528
.94
31.49
28.60
28.7
832
.77
32.1
331
.13
31.90
34.05
34.7
331.79
32.35
36.30
35.4
733.59
33.58
38.42
Water-
Primary
level
use of
date
water
12-07-55
N02-08-56
04-17-56
06-05-56
06-27-56
08-02-56
12-11-56
02-12-57
05-06-57
08-01-57
02-05-58
05-15-58
08-18-58
11-20-58
02-17-59
05-05-59
09-02-59
11-04-59
02-08-60
05-11-60
08-26-60
11-15-60
02-16-61
05-11-61
08-08-61
Diameter
of
casing
(inc
hes)
__ __ __ __ __

Tab
le 1
. Rec
ords
of w
ells
and
spri
ngs
in th
eAco
ma
emba
ymen
t and
eas
tern
Zun
i upl
ift C
ontin
ued
Con-
Altitude
Depth
trib-
of land
of we
ll,
Water
Local
Station
uting
Aquifer
surface
total
level
identifier
number
Owner
unit
code
(feet)
(feet)
(feet)
UN. 10W. 27
. 241
350923107522701
36.82
36.22
36.44
36.52
33.10
33.25
30.0
531.64
28.25
313SADG
6,480
158
29.31
27.10
27.2
525.78
25.60
28.5
4
27.8
433
.23
31.25
33.99
35.27
36.57
33.84
35.18
32.46
30.96
Water-
Primary
level
use of
date
water
11-30-61
02-13-62
05-15-62
08-15-62
02-04-63
08-19-63
03-09-64
08-12-64
02-09-65
08-05-65
N
02-09-66
08-23-66
02-21-67
04-02-68
02-12-69
02-16-70
08-18-70
01-11-71
01-19-72
01-24-73
08-28-73
01-14-74
08-06-74
01-16-75
02-11-76
Diameter
of
casing
(inches)
__ __ __

Tab
le 1
. Rec
ords
of w
ells
and
spr
ings
in th
eAco
ma
emba
ymen
t and
eas
tern
Zun
i upl
ift C
ontin
ued
Con-
Altitude
Depth
trib-
of land
of well
Water
Local
Station
uting
Aquifer
surface
total
leve
l identifier
number
Owner
unit
code
(feet)
(feet)
(feet)
UN. 10W. 27
. 24
1 350923107522701
31.01
28.64
34.62
32.98
36.98
34.22
38.44
34.61
30.95
32.64
28.51
28.59
25.74
24.98
313SADG
6,480
158
22.55
25.39
20.97
21.58
21.88
20.14
19.59
19.5
119
.68
19.98
20.06
Water-
Primary
level
use of
date
water
08-11-76
01-17-77
08-16-77
02-02-78
08-07-78
03-07-79
07-17-79
07-15-80
01-22-81
07-20-81
02-23-82
09-07-82
01-17-83
08-12-83
01-11-84
N
08-14-84
02-06-85
08-08-85
09-01-85
10-01-85
11-01-85
12-01-85
01-01-86
01-06-86
02-04-86
Diameter
of
casing
(inches)
_ _ _

Tab
le 1
. Rec
ords
of w
ells
and
spr
ings
in th
eAco
ma
emba
ymen
t and
eas
tern
Zun
i upl
ift C
onti
nu
ed
Con-
Altitude
Depth
trib-
of land
of well,
Water
Local
Station
uting
Aquifer
surface
total
leve
l identifier
number
Owner
unit
code
(feet)
(feet)
(fee
t)
UN. 10W. 27
. 24
1 350923107522701
19.9
120
.14
20.8
320
.33
21.14
21.34
19.9
219.31
19.1
8UN. 10W. 27
. 24
2 350925107522801
Grants CI
313SADG
UN. 10W. 27
. 414
350903107523301
P 110AVMB
6,50
0 55.0
35.84
35.8
135.86
35.77
35.59
35.54
36.22
36.81
37.22
38.12
38.73
36.77
37.2
437
.04
36.84
Water-
leve
l date
03-01-86
04-17-86
05-01-86
06-01-86
07-01-86
08-01-86
09-01-86
10-01-86
11-01-86
10-02-46
11-06-46
12-03-46
01-03-47
02-03-47
03-11-47
04-07-47
05-05-47
06-04-47
07-07-47
08-06-47
09-02-47
10-02-47
12-10-47
02-02-48
Diameter
Primary
of
use of
casing
water
(inc
hes)
..
U 8.
00 _

Tab
le ^
. Rec
ords
of w
ells
and
spr
ings
in th
e A
com
a en
ibay
men
t and
eas
tern
Zun
i upl
ift
Con
tinu
ed
Local
Station
identifier
number
Owner
UN. 10W
. 27. 414
350903107523301
--
UN. 10W
. 27. 441
350854107523401
Navajo Butane
UN. 10W
. 27
. 443
350851107522401
Doxol Gas
UN. 10W
. 28. 1433
350914107540301
Sanchez, Popo
UN. 10W
. 28
. 322
350911107535301
UN. 10W. 28. 3441
350853107535401
South, I.
W.UN. 10W. 28. 4422
350857107532001
Pemb
le,
Ernie
UN. 10W. 34
. 1134
350835107531101
Meisner, James
UN. 10W. 34
. 13
4 350823107530401
Hano
sh,
George
Con
trib
uting
unit
--
P P P P
P P
P P
Altitude
of land
Aquifer
surface
code
(feet)
110AVMB
6,50
0110AVMB
6,480
313SADG
6,56
0do.
6,550
do.
6,55
0
do.
6,580
do.
6,540
do.
6,58
0do
. 6,600
Depth
of we
ll,
total
(feet) 54.0
55.0
185
151
151
180
164
220
Water
level
(fee
t)
36.9
338
.76
39.7
039
.16
38.0
8
37.50
37.6
439
.03
39.06
38.37
49.90
42.8
434.61
100.
9293
.02
91.5
191.09
90.2
190.22
88.9
5
144.
4110
8.65
107.46
131.21
176.
95
Water-
Primary
leve
l use of
date
water
04-05-48
06-11-48
08-04-48
10-05-48
12-09-48
02-10-49
04-12-49
06-11-49
08-18-49
10-11-49
11-14-57
08-17-57
H04-04-84
H04-03-84
S04-03-84
U
01-29-85
08-13-85
01-16-86
09-09-86
03-28-89
U
04-03-84
H04-03-84
H01-29-85
04-03-84
H04-03-84
H
Diameter
of
casing
(inches)
__ 4.00
5.50
6.00
4.50
__ 5.00
5.50
5.50
4.50
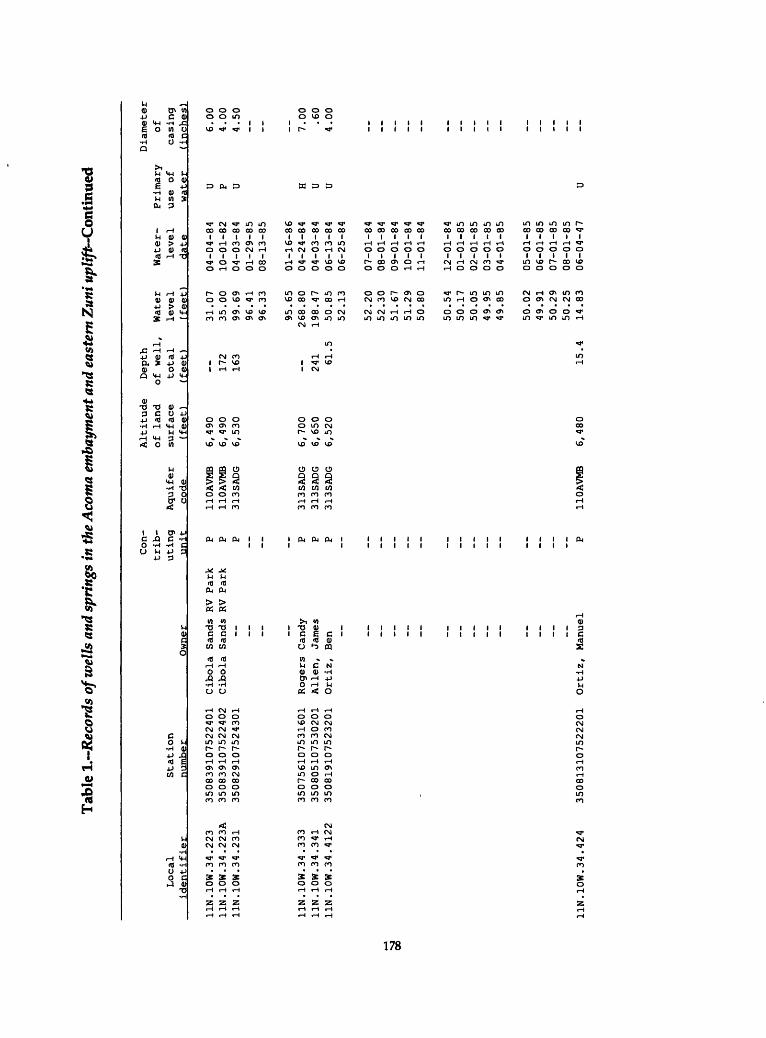
Tab
le 1
. Rec
ords
of w
ells
and
spr
ings
in th
e A
com
a em
baym
ent a
nd e
aste
rn Z
uni u
plif
t Con
tinue
d
Local
identifier
11N.10W.34.223
11N.10W.34.223A
11N.10W.34.231
UN. 10W. 34
. 33
3UN. 10W
. 34. 34
1UN. 10W. 34. 4122
UN. 10W. 34
. 42
4
Con-
trib-
Station
uting
number
Owner
unit
350839107522401
Cibola Sands RV Park
P350839107522402
Cibola Sands RV Park
P350829107524301
~
P
350756107531601
Rogers Candy
P350805107530201
Alien, James
P350819107523201
Orti
z, Ben
P
-
_
_ __
_
350813107522201
Ortiz, Manuel
P
Altitude
Depth
of land
of well,
Water
Aquifer
surface
total
leve
l code
(feet)
(feet)
(fee
t)
110AVMB
6,49
0 ~
31.0
7110AVMB
6,490
172
35.0
0313SADG
6,53
0 16
3 99
.69
96.4
196
.33
95.65
313SADG
6,700
268.80
313SADG
6,650
241
198.47
313SADG
6,52
0 61
.5
50.8
552.13
52.2
052.30
51.67
51.29
50.80
50.54
50.1
750.05
49.95
49.8
5
50.02
49.91
50.2
950.25
110AVMB
6,48
0 15
.4
14.83
Water-
Primary
level
use of
d.ate
water
04-04-84
U10-01-82
P04-03-84
U01-29-85
08-13-85
01-16-86
04-24-84
H04-03-84
U06-13-84
U06-25-84
07-01-84
08-01-84
09-01-84
10-01-84
11-01-84
12-01-84
01-01-85
02-01-85
03-01-85
04-01-85
05-01-85
06-01-85
07-01-85
08-01-85
06-04-47
U
Diameter
of
casing
(inches)
6.00
4.00
4.50
__ 7.00 .60
4.00
_ ~ _ _

Tab
le 1
.-R
ecor
ds o
f wel
ls a
nd s
prin
gs in
the
Aco
ma
emba
ymen
t and
eas
tern
Zun
i upl
ift C
ontin
ued
Con-
trib-
Local
Station
uting
identifier
"num
ber
Owner
unit
UN. 10W. 34
. 43
3 350758107524501
Ortiz, Ben
N N N N P
__
_
__ __
____ __
__
__
Altitude
Depth
of land
of well,
Water
Aquifer
surface
total
leve
l code
(feet)
(feet)
(feet)
313SADG
6,59
0 18
7 13
2.37
132.
24132.21
132.
25313SADG
6,59
0 187
132.29
132.
17132.56
132.
60132.42
131.89
131.56
131.62
131.57
131.64
131.69
131.64
131.76
131.
7713
2.03
132.00
131.78
131.41
131.15
131.09
131.16
Water-
Primary
level
use of
date
water
01-30-85
U02-28-85
03-01-85
04-01-85
05-01-85
U
06-01-85
07-01-85
08-01-85
09-01-85
10-01-85
11-01-85
12-01-85
01-01-86
02-01-86
03-01-86
04-01-86
05-01-86
06-01-86
07-01-86
08-01-86
09-01-86
10-01-86
11-01-86
12-01-86
01-01-87
Diameter
of
casing
(inches)
5.50
-- -- __

Tab
le l.
~R
ecor
ds o
f wel
ls a
nd s
prin
gs in
the
Aco
ma
emba
ymen
t and
eas
tern
Zun
i upl
ift
Con
tinu
ed
Local
identifier
UN. 10W. 34
UN. 10W. 34
UN. 10W
. 34
UN. 10W. 34
11N.11W.23
11N.11W.05
11N.11W.12
11N.15W.04
11N.15W.05
12N.09W.06
12N.09W.07
12N.09W.07
12N.09W.08
12N.09W.18
12N.10W.01
12N.10W.01
12N.10W.05
12N.10W.05
.433
.434
.444
.4442
.333
.232
.411
.223
.123
.312
.343
.343A
.431
.311
.222
.244
.341
-341A
Station
number
350758107524501
350756107523101
350757107522001
350800107521601
350942107582701
351248108010201
351145107565401
351300108251501
351233108264401
351745107495301
351638107495001
351640107494801
351644107482901
351604107500501
351815107501001
351755107501201
351507107550702
351736107550701
Owner
Calvert, James L.
__
Garc
ia,
Wilford
Carrell, Tom
USFS
Schneeman, P.
Bell,
Bill R.
Sohiowestern
Clawson, Ronald
Sanchez Co
.Roundy, G.P.
Roundy, G.
P.Ro
undy
, Bert
Roun
dy,
G.P.
Roundy, G.
P.
Hubbell Bros.
Berryhill, Duane
Berryhill, Duane
Con
trib
uting
unit
P __ P P P
P P P P P P P P P P P
Aquifer
code
313SADG
313SADG
313SADG
310YESO
313SADG
231CHNL
231CHNL
110AVMB
110AVMB
110AVMB
231CHNL
231CHNL
231CHNL
231CHNL
231CHNL
313SADG
Altitude
of land
surface
(feet)
6,540
6,500
6,485
7,305
7,000
6,70
07,600
7,530
6,673.00
6, 640
6, 642
6,770
6,680
6, 680
6,710
6,700
Depth
of well,
total
(feet)
200
100
105
450
360
254
91.0
98.0
62.0
98.1
192
200
351
725
Water
leve
l (f
eet)
131.
23
131.
19
130.
9713
1.00
94.20
93.3
833.52
25.89
431.
43
227.40
34.00
21.1
173.90
58.0
042.21
84.8
3
45.90
64.0
0245.71
231.
42229.11
Water-
level
date
02-01-87
03-01-87
03-27-87
05-21-87
04-24-84
01-30-85
04-04-84
07-11-84
07-29-81
08-25-49
07-23-71
11-09-78
07-25-56
11-30-55
03-29-84
07-25-56
07-24-56
05-18-49
01-08-58
03-16-84
09-13-84
Primary
use of
water
H H H S S S H S u S u H
U u u S
Diameter
of
casing
(inches)
5.00
_ 7.50
4.00
6.10
7.00
6.00
6.62
8.00
4.00
6.00
3.00
3.50

Tab
le 1
.-R
ecor
ds o
f wel
ls a
nd s
prin
gs in
the
Aco
ma
emba
ymen
tan
d ea
ster
n Z
uni u
plif
t Con
tin
ued
Local
Station
identifier
number
Owner
12N.10W.05.341A
351736107550701
12N.10W.07.143
351704107560601
Berryhill, Duane
12N.10W.08.300
351649107551101
12N.10W.08.314
351653107551401
12N.10W.12.221
351722107502001
Roundy, Bert
12N.10W.12.433
351637107503701
Roundy, Bert
12N.10W.12.433A
351637107503702
Roundy, Bert
12N.10W.14.212
351630107513101
Roundy, Bert
12N.10W.20.333A
351452107552301
Anaconda
Con
trib
uting
unit P
P P
P N N N N N N N N N N S S S P
Altitude
Depth
of land
of well,
Water
Aquifer
surface
total
level
code
(feet)
(fee
t)
(fee
t)
229.43
227.71
227.60
225.62
313SADG
6,640
250
176.95
313SADG
310GLRT
110AVMB
6,652
32.48
110AVMB
6,228
70.0
58.10
6,228
110AVMB
6,621
100
55.83
313SADR
6,570
275
118.40
124.42
122.07
313SADR
6,570
175
122.24
124.30
119.48
116.57
114.49
113.20
112.14
112.79
115.26
114.30
118.41
Water-
Primary
level
use of
date
water
01-29-85
08-13-85
01-16-86
09-25-86
06-27-56
S
03-29-84
U07-25-56
S U
03-29-84
S02-12-57
S08-17-57
05-11-60
02-15-61
S
02-12-62
02-04-63
03-09-64
02-09-65
02-10-66
02-21-67
04-03-68
02-14-69
02-16-70
01-12-71
Diameter
of
casing
(inc
hes)
7.00
5.00
8.00
5.50
12.00
16.00
10.00
__ __

Tab
le 1
. R
ecor
ds o
f wel
ls a
nd sp
ring
s in
the
Aco
ma
emba
ymen
t and
eas
tern
Zun
i upl
ift C
ontin
ued
Con-
trib-
Local
Station
uting
identifier
number
Owner
unit
12N.10W.20.333A
351452107552301
S __ __ _
__ __
__
12N.10W.23.233
351519107513901
Roun
dy,
Kyle
N N N N N N P S S
Altitude
Depth
of land
of we
ll,
Water
Aquifer
surface
total
leve
l code
(fee
t)
(fee
t)
(feet)
121.39
123.
3712
1.12
118.19
115.
50
112.
8311
2.42
121.
70103.04
100.
13
101.
6099
.84
99.3
597
.45
313SADR
6,592
865
136.
35
115.59
122.
1312
2.35
121.
25313SADR
6,592
865
120.74
120.
45120.14
139.
91140.02
126.71
Water-
level
date
01-19-72
01-26-73
01-15-74
01-16-75
02-11-76
01-17-77
02-02-78
03-28-79
01-31-84
09-12-84
01-30-85
08-14-85
01-17-86
09-25-86
06-27-40
02-26-46
09-04-46
10-02-46
11-07-46
12-03-46
01-03-47
02-03-47
03-11-47
04-07-47
05-05-47
Diameter
Primary
of
use of
casing
water
(inc
hes)
__ __
U 20.00
16.00
12.00
U
__

Tab
le ^
.-Rec
ords
of w
ells
and
spr
ings
in th
e A
com
a em
baym
ent a
nd e
aste
rn Z
uni u
plif
t C
ontin
ued
Con-
Altitude
Dept
h tr
ib-
of land
of we
ll,
Water
Loca
l St
atio
n uting
Aquifer
surf
ace
tota
l le
vel
identi
fier
number
Owner
unit
code
(feet)
(feet)
(fee
t)
12N.10W.23.233
351519107513901
142.
9312
9.78
130.
1612
6.13
125.
45
123.
6912
3.02
123.74
144.
4214
1.55
125.44
124.
41149.04
150.
3015
5.47
125.
8712
4.31
123.
50125.84
135.
52
156.
7512
8.34
126.
8312
9.83
313S
ADR
6,59
2 86
5 16
9.18
Water-
Primary
level
use
of
date
water
06-0
4-47
07-0
7-47
08-0
6-47
09-0
2-47
10-02-47
12-10-47
02-0
2-48
04-0
5-48
08-04-48
10-05-48
12-09-48
02-1
0-49
04-1
1-49
06-0
9-49
08-1
8-49
10-1
1-49
12-1
4-49
02-0
7-50
04-1
8-50
08-2
3-50
10-16-50
12-12-50
02-1
2-51
04-1
8-51
06-2
2-51
U
Diam
eter
of
casing
(inc
hes)
_

Tab
le I
. Rec
ords
of w
ells
and
spr
ings
in t
he A
com
a em
baym
ent a
nd e
aste
rn Z
uni u
plif
t Con
tin
ued
Con-
Altitude
Depth
trib-
of land
of well,
Water
Local
Station
uting
Aquifer
surface
total
leve
l identifier
number
Owner
unit
code
(fee
t)
(feet)
(fee
t)
12N.10W.23.233
351519107513901
144.
2713
3.04
143.53
134.38
147.34
143.96
142.20
145.64
147.
5614
4.55
142.
6514
4.38
149.44
147.
0514
5.48
147.
6614
8.36
147.
8514
5.23
153.
17
149.75
147.60
148.23
150.
5914
9.57
Water-
leve
l date
08-16-51
02-11-54
02-11-55
04-15-55
10-01-56
12-11-56
02-13-57
05-07-57
08-01-57
11-14-57
02-04-58
05-14-58
08-21-58
11-20-58
02-14-59
05-07-59
09-02-59
11-04-59
02-09-60
08-26-60
11-15-60
02-15-61
05-10-61
11-29-61
02-12-62
Diameter
Primary
of
use of
casing
water
(inches)

Tab
le l
.~R
ecor
ds o
f wel
ls a
nd s
prin
gs in
the
Aco
ma
emba
ymen
t and
eas
tern
Zun
i upl
ift C
onti
nu
ed
Con-
Altitude
Depth
trib-
of land
of well,
Water
Local
Station
uting
Aquifer
surface
total
level
identifier
number
Owner
unit
code
(fee
t)
(fee
t)
(fee
t)
12N.10W.23.233
351519107513901
~
151.56
149.40
146.94
145.40
141.99
140.52
147.18
146.93
141.06
139.66
130.83
131.48
129.50
129.33
128.69
127.51
127.06
12N.10W.23.233A
351521107514101
Elkins, Henry
P 231CHNL
6,590
500
129.22
130.14
130.12
127.44
127.51
125.18
124.71
12N.10W.26.242
351433107511601
Homestake Mine
N 313SADG
6,590
971
133.00
Water-
Primary
level
use of
date
water
05-14-62
08-15-62
11-27-62
02-04-63
08-20-63
03-10-64
08-12-64
02-09-65
02-10-66
02-14-69
02-09-84
03-29-84
09-12-84
01-30-85
08-14-85
01-15-86
09-03-86
02-08-84
H03-29-84
09-12-84
01-30-85
01-17-86
09-03-86
03-18-89
05-22-58
N
Diameter
of
casing
(inc
hes)
__ _ __
10.00
7.00
__
16.00

Tab
le 1
.-R
ecor
ds o
f wel
ls a
nd sp
ring
s in
the
Aco
ma
emba
ymen
t and
eas
tern
Zun
i upl
ift C
onti
nued
Con-
trib-
Local
Station
uting
identifier
number
Owner
unit
12N.10W.26.242
351433107511601
~
S S12
N. 10W. 26. 3222
351422107514501
12N.10W.26.322A
351407107520101
Henderson, C.
T.
N S S S S S S S 5g?
12N.10W.27.244
351425107522101
Morris, Tom A
. P
12N.10W.27.333
351402107531901
Stanley, Dean
P
_
__ _
__
Altitude
Depth
of land
of we
ll.
Water
Aquifer
surface
total
level
code
(feet)
(fee
t)
(feet)
313SADG
6,590
971
133.00
313SADG
313SADG
6,570
863
122.35
123.52
126.
24121.25
124.40
126.18
124.35
123.55
125.03
110AVMB
6,560
314
90.5
4313SADG
6,560
551
87.0
3104.73
106.27
108.60
110.
67106.05
103.
04
90.98
99.5
799.89
101.
32100.59
Water-
Primary
level
use of
date
water
05-22-58
N
10-13-55
I05-26-56
10-03-56
02-13-57
05-08-57
08-01-57
11-14-57
02-04-58
02-17-59
07-25-56
H04-18-50
I02-04-58
02-09-60
02-15-61
02-13-62
02-04-63
03-09-64
02-09-65
02-10-66
02-21-67
02-12-69
02-16-70
Diameter
of
casing
(inches)
12.7
5
20.00
16.0
0
_ __ 6.00
20.00
16.0
0
_ _

Tab
le 1
. Rec
ords
of w
ells
and
spr
ings
in th
e A
com
a em
baym
ent a
nd e
aste
rn Z
uni u
plif
t Con
tinue
d
Con-
trib-
Local
Station
uting
identifier
number
Owner
unit
12N.10W.27.333
351402107531901
__ __
__ __ __
__
__ __
12N.10W.27.343
351403107531801
Rusb
y, Don
P __
__
12N.
10W. 27
. 43
11
351407107524401
12N.10W.29.434
351304107543701
Card & Stanley
N S P S S
Altitude
Depth
of land
of we
ll,
Water
Aquifer
surface
total
level
code
(feet)
(feet)
(feet)
104.50
107.38
109.26
107.02
104.25
106.93
115.
10104.98
107.20
313SADG
6,56
0 551
101.20
101.
4789.58
86.7
7110AVMB
6,55
0 90.0
42.86
38.47
39.93
38.4
732.48
313SADG
110AVMB
6,55
0 15
2 65.46
69.2
378.19
75.1
574
.20
74.05
Water-
Primary
level
use of
date
water
01-11-71
01-19-72
01-24-73
01-14-74
01-16-75
02-11-76
01-17-77
02-02-78
03-26-79
01-22-81
I
07-20-81
01-31-84
09-12-84
03-22-84
H09-12-84
01-30-85
01-16-86
09-19-86
10-14-44
I
02-26-46
09-04-46
10-01-46
11-06-46
12-03-46
Diameter
of
casing
(inches)
.. _ ~ ~ _ 5.00
__ 6.63

Tab
le 1
.-R
ecor
ds o
f wel
ls a
nd sp
ring
s in
the
Aco
ma
emba
ymen
t and
eas
tern
Zun
i upl
ift C
ontin
ued
Con-
Altitude
Depth
trib-
of land
of well,
Water
Local
Station
uting
Aquifer
surface
total
level
identifier
number
Owner
unit
code
(feet)
(feet)
(feet)
12N.10W.29.434
351304107543701
--
73.8
773
.76
73.65
73.97
78.04
77.3
976.73
76.64
76.6
578.68
77.87
77.55
77.44
100.
7210
1.19
77.42
77.33
76.72
80.45
110AVMB
6,550
152
98.14
98.1
285
.93
83.98
82.7
584.69
Water-
leve
l date
01-04-47
02-03-47
03-11-47
04-07-47
09-02-47
10-02-47
12-10-47
02-02-48
04-05-48
10-05-48
12-09-48
02-10-49
04-11-49
06-09-49
08-18-49
10-12-49
12-14-49
02-08-50
04-18-50
06-27-50
08-24-50
10-16-50
12-12-50
02-15-51
04-18-51
Diameter
Primary
of
use
of
casing
water
(inc
hes)
-- __ -- __
I
__

Tab
le ^
.. R
ecor
ds o
f wel
ls a
nd s
prin
gs i
n th
e A
com
a em
baym
ent a
nd e
aste
rn Z
uni u
plif
t Con
tin
ued
Con-
Altitude
Depth
trib-
of land
of well,
Water
Local
Station
uting
Aquifer
surface
total
level
identifier
number
Owner
unit
code
(feet)
(feet)
(fee
t)
12N.10W.29.434
351304107543701
98.25
98.33
98.30
87.69
97.97
98.39
98.22
87.11
86.16
98.50
98.68
98.68
96.02
91.58
90.17
98.71
98.76
98.77
94.17
92.45
91.33
98.74
98.94
98.86
110AVMB
6,550
152
97.99
Water-
Primary
level
use of
date
water
06-21-51
08-15-51
10-31-51
12-24-51
02-26-52
04-24-52
06-25-52
12-16-52
02-17-53
04-15-53
06-10-53
08-11-53
10-08-53
12-17-53
02-11-54
04-07-54
06-11-54
08-27-54
10-13-54
12-01-54
02-10-55
04-15-55
06-15-55
08-10-55
10-10-55
I
Diameter
of
casing
(inches)
__ _ __ _

Tab
le 1
.-R
ecor
ds o
f wel
ls a
nd sp
ring
s in
the
Aco
ma
emba
ymen
t and
eas
tern
Zun
i upl
ift C
ontin
ued
Con-
Altitude
Depth
trib-
of land
of we
ll,
Water
Local
Station
uting
Aquifer
surface
total
level
identifier
number
Owner
unit
code
(feet)
(fee
t)
(feet)
12N.10W.29.434
351304107543701
~
95.4
993.67
95.19
98.84
98.65
98.69
98.73
98.7
098.77
98.70
98.75
98.77
98.8
098.72
98.8
0
98.7
998.65
100.74
98.7
898.82
102.10
98.85
98.8
599.04
98.95
Water-
level
date
12-07-55
02-07-56
04-17-56
06-05-56
08-01-56
10-02-56
12-12-56
02-13-57
05-07-57
08-01-57
11-14-57
02-04-58
05-14-58
08-19-58
11-20-58
05-05-59
09-02-59
11-03-59
02-09-60
05-11-60
08-25-60
11-15-60
02-15-61
05-10-61
08-08-61
Diameter
Primary
of
use of
casing
water
(inches)
_ _ __ __

Tab
le 1
.-R
ecor
ds o
f wel
ls a
nd s
prin
gs in
the
Aco
ma
emba
ymen
t and
eas
tern
Zun
i upl
ift
Con
tinue
d
Con-
Altitude
Depth
trib-
of land
of well,
Water
Local
Station
uting
Aquifer
surface
total
leve
l identifier
number
Owner
unit
code
(feet)
(feet)
(fee
t)
12N.10W.29.434
351304107543701
99.1
098
.93
98.9
398
.87
110AVMB
6,550
152
100.07
98.8
498
.81
100.03
99.9
596.27
96.7
7100.60
93.80
94.56
96.99
95.9
598
.93
99.0
2100.29
98.8
2
98.8
598.80
98.60
96.4
592.63
Water-
Primary
level
use
of
date
water
11-30-61
02-13-62
05-15-62
08-15-62
11-27-62
I
02-04-63
08-19-63
03-09-64
08-12-64
02-09-65
08-06-65
08-23-66
02-21-67
04-03-68
02-12-69
02-16-70
01-11-71
01-19-72
01-24-73
08-28-73
01-14-74
08-21-74
01-16-75
02-11-76
01-17-77
Diameter
of
casing
(inches)
__ ~

Tab
le I
. Rec
ords
of w
ells
and
spr
ings
in th
e A
com
a em
baym
ent a
nd e
aste
rn Z
uni u
plif
t Con
tinue
d
Con-
Altitude
Depth
trib-
of land
of well
, Water
Local
Station
uting
Aquifer
surface
total
level
identifier
number
Owner
unit
code
(feet)
(feet)
(feet)
12N.10W.29.434
3513041075433701
98.7
898.84
98.75
98.8
598.79
101.81
90.23
90.97
90.87
90.0
4
91.58
83.96
80.95
87.8
781.63
76.7
976
.37
76.5
574.23
76.5
1
73.35
12N.10W.29.434A
351304107543702
Plains Elect
P 313SADR
6,55
0 --
87.9
312N.10W.30.112
351447107561701
Anaconda
P 313SADG
6,589
280
143.
10
Water-
leve
l date
08-16-77
02-02-78
08-07-78
03-26-79
07-17-79
02-14-80
07-15-80
01-22-81
07-20-81
02-23-82
09-07-82
01-17-83
08-12-83
01-11-84
03-20-84
08-15-84
09-02-84
01-30-85
08-14-85
01-06-86
09-19-86
10-16-50
12-01-44
Diameter
Primary
of
use of
casing
water
(inches)
-- -- __
E 18.00
H 5.65
12N.10W.30.242
351434107552601
Frea
s, Jack
110AVMB
6,570
160
:.45
05-10-46
4.00
4.50

Tab
le L
Rec
ords
of w
ells
and
spr
ings
in th
e A
com
a em
baym
ent a
nd e
aste
rn Z
uni u
plif
t Con
tin
ued
Local
Station
identifier
number
Owner
12N.10W.30.332
351408107561501
12N.10W.30.412
351423107554601
Freas, Fred
12N.10W.30.421
351419107553101
Harding, Milton
12N.10W.30.433
351402107555001
Freas, Fred
12N.10W.31.121
351357107561001
Powell, Daniel C.
~
12N.10W.31.214
351349107554801
Harding, Charles
12N.10W.32.111
351354107552401
Anaconda --
Con
trib
uting
unit N P P P N N S S S S P __ P
N S S S S P S
Altitude
Depth
of land
of well
. Water
Aquifer
surface
total
level
code
(feet)
(feet)
(f
eet)
231CHNL
6,590
230
106.54
313SADG
6,580
225
92.04
313SADG
6,580
225
88.38
313SADG
6,570
139
313SADR
6,575
164
123.83
111.79
109.19
109.37
109.68
109.77
109.83
109.71
109.15
109.05
108.89
313SADG
6,570
197
97.06
95.13
313SADG
6,570
253
82.09
90.20
313SADG
6,570
253
88.70
87.97
87.47
87.12
87.15
Water-
Primary
level
use of
date
water
02-04-47
H02-26-46
I
02-26-46
I H
03-14-84
U01-30-85
01-13-86
02-19-86
03-01-86
04-01-86
05-01-86
06-01-86
07-01-86
08-01-86
03-16-89
03-14-84
H01-30-85
02-26-46
I09-03-46
11-06-46
I12-03-46
01-04-47
02-03-47
03-11-47
Diameter
of
casing
(inches)
8.00
16.00
14.00
6.00
12.00
~ ~ __ -- __ 5.00
20.00
18.00
1-

Tab
le "
L R
ecor
ds o
f wel
ls a
nd s
prin
gs in
theA
com
a em
baym
ent a
nd e
aste
rn Z
uni u
plif
t-C
ontin
ued
Con-
Altitude
Depth
trib-
of land
of we
ll,
Water
Local
Station
uting
Aquifer
surface
total
level
identifier
number
Owner
unit
code
{feet)
(fee
t)
(feet)
12N.10W.32.111
351354107552401
--
92.84
101.53
95.14
94.45
91.49
90.70
90.45
102.29
104.29
96.32
93.12
91.9
395
.67
100.70
97.4
0
93.6
191.83
90.81
96.04
313SADG
6,570
253
107.75
108.39
101.01
96.76
94.9
5101.11
Water-
Primary
level
use of
date
water
04-07-47
08-06-47
09-02-47
10-02-47
12-10-47
02-02-48
04-05-48
06-10-48
08-04-48
10-05-48
12-09-48
02-10-49
04-11-49
06-09-49
08-18-49
10-11-49
12-14-49
02-08-50
04-18-50
06-27-50
I
08-24-50
10-16-50
12-12-50
02-13-51
04-20-51
Diameter
of
casing
(inches)
_ __ _

Tab
le I
. Rec
ords
of w
ells
and
spr
ings
in th
e A
com
a em
baym
ent a
nd e
aste
rn Z
uni u
plif
t Con
tinue
d
Con-
Altitude
Depth
trib-
of land
of well,
Water
Local
Station
uting
Aquifer
surface
total
leve
l identifier
number
Owner
unit
code
(feet)
(fee
t)
(feet)
12N.10W.32.111
351354107552401
~
112.10
111.41
104.35
98.7
0110.47
104.78
101.42
99.68
301.55
113.01
112.04
111.12
104.87
103.09
103.18
117.05
130.20
108.06
106.45
112.90
109.05
107.74
108.49
118.97
119.35
Water-
Primary
leve
l us
e of
date
water
06-21-51
08-15-51
10-31-51
02-26-52
08-25-52
10-23-52
12-16-52
02-17-53
04-15-53
06-10-53
08-11-53
10-08-53
12-17-53
02-11-54
04-07-54
06-11-54
08-27-54
10-13-54
12-13-54
10-11-55
12-07-55
02-07-56
04-17-56
06-05-56
08-01-56
Diameter
of
casing
(inches)
.. _

Tab
le 1
.. R
ecor
ds o
f wel
ls a
nd sp
ring
s in
the
Aco
ma
emba
ymen
t and
eas
tern
Zun
i upl
ift C
ontin
ued
Con-
Altitude
Depth
trib-
of land
of we
ll,
Water
Local
Station
uting
Aquifer
surface
total
level
identifier
number
Owner
unit
code
(feet)
(feet)
(feet)
12N.10W.32.111
351354107552401
~
119.
50113.95
112.46
118.
00116.70
112.
40114.33
119.
87119.38
114.18
118.
2311
7.90
116.
40113.55
118.56
115.
82116.69
119.
80117.39
115.
28
116.
65114.39
97.8
195.67
12N.10W.32.111A
351354107552501
~
S 231CHNL
6,567
126
75.89
Water-
level
date
10-02-56
12-12-56
02-13-57
08-01-57
11-14-57
02-05-58
05-14-58
08-19-58
11-20-58
02-17-59
05-05-59
09-02-59
11-04-59
02-09-60
11-15-60
02-16-61
05-10-61
11-30-61
02-13-62
05-15-62
08-15-62
11-27-62
03-20-84
01-30-85
03-20-84
Diameter
Primary
of
use of
casing
water
(inches)
.. __ __ __ __
U 4.00

Tab
le l.
~-R
ecor
ds o
f wel
ls a
nd s
prin
gs in
the
Aco
ma
emba
ymen
t and
eas
tern
Zun
i upl
ift-
-Con
tinu
ed
Local
Station
identifier
number
Owner
12N.10W.32.111A
351354107552501
12N.10W.32.211
351355107545201
Chapman
12N.10W.32.313
351323107552401
Harding, Charles
__
12N.10W.33.444
351307107533001
Stanley & Card
12N.10W.34.214
351347107523701
Murray, W.A.
12N.10W.34.232
351343107523701
Plains Elec
12N.10W.34.412
351331107523401
Church, John
12N. 10W
. 35. 1422
351344107514501
12N.10W.35.221
351355107511901
Con
trib
uting
unit P
P P
P P P
__ N S S S P P
Altitude
of land
Aquifer
surface
code
(feet)
231CHNL
6,567
110AVMB
6,555
313SADG
6,580
231CHNL
6,542
231CHNL
6,560
110AVMB
6,560
313SADG
6,560
110AVMB
6,570
231CHNL
6,585
Depth
of well,
total
(fee
t)
126
135
210
195
275 75.0
843 84.0
248
Water
level
(feet)
74.90
65.78
71.24
69.23
74.87
122.61
120.65
119.09
118.57
116.75
117.55
81.75
33.42
33.14
107.25
42.13
97.55
90.03
88.40
87.93
Water-
Primary
level
use of
date
water
01-30-85
U08-14-85
01-13-86
09-19-86
05-10-46
H
03-14-84
H01-30-85
08-14-85
01-16-86
09-24-86
03-16-89
H
10-02-56
H03-22-84
U
01-30-85
08-28-56
I
03-29-84
U03-20-84
U01-30-85
08-13-85
01-16-86
Diameter
of
casing
(inches)
5.00
5.00
__ 7.25
5.50
12.00
4.00
18.00
16.00
13.00
10.75
5.00
5.00

Tab
le l.
~Rec
ords
of w
ells
and
spr
ings
in th
e A
com
a em
baym
ent a
nd e
aste
rn Z
itni u
plif
t Con
tinue
d
Local
Station
identifier
number
Owner
12N.10W.35.221
351355107511901
12N.11W.03.112
351816107592601
Gibbs, Floyd M.
12N.11W.03.121
351815107591701
Stansberg, James
.
12N.11W.03.332
351737107593001
12N.11W.04.410
351744108000401
12N.11W.04.422
351750107594301
12N.11W.05.413
351743108010601
Con
trib
uting
unit
_. N P P
P
P P
N N N N N
Altitude
Depth
of land
of well,
Water
Aquifer
surface
total
level
code
(feet)
(fee
t)
(fee
t)
86.7
5231CHNL
6,700
200
60.38
231CHNL
6,70
0 20
0 60.38
231CHNL
6,69
5 12
0 58.60
59.18
60.1
360.06
313SADG
6,65
5 28
0 113.41
109.69
116.31
107.92
108.
35104.75
111.35
313SADG
6,760
251
116.29
313SADG
6,67
0 310
139.
3213
6.78
143.
32134.06
134.30
231CHNL
6,71
5 200
191.60
192.03
191.99
190.03
186.75
Water-
Primary
level
use of
date
water
09-04-86
01-28-58
H01-28-58
H02-22-84
H09-11-84
01-29-85
08-14-85
02-20-84
U09-11-84
01-29-85
08-13-85
01-14-86
09-05-86
03-28-89
03-28-84
U
02-20-84
U09-11-84
01-29-85
08-13-85
01-14-86
10-06-48
U12-10-48
02-11-49
04-12-49
06-10-49
Diameter
of
casing
(inc
hes)
7.00
5.00
__ 5.00
__ 5.00
5.00
8.00

Tab
le 1
. Rec
ords
of w
ells
and
spr
ings
in th
e A
com
a em
baym
ent a
nd e
aste
rn Z
uni u
plif
t Con
tinue
d
Con-
t rib-
Local
Station
uting
identifier
number
Owner
unit
12N.11W.05.413
351743108010601
~
P S S S N S__ __
__
__ __
__ __
__
Altitude
Depth
of land
of well,
Water
Aquifer
surface
total
leve
l code
(fee
t)
(feet)
(feet)
184.00
183.46
186.00
186.80
187.
74
202.24
202.71
203.38
201.60
201.02
200.98
215.39
220.80
218.60
231CHNL
6,71
5 20
0 215.91
213.50
212.26
215.90
213.67
211.76
208.79
209.94
225.45
231.65
230.02
Water-
Primary
level
use
of
date
water
08-19-49
10-12-49
12-14-49
02-08-50
04-19-50
06-28-50
08-24-50
10-17-50
12-13-50
02-15-51
04-17-51
06-20-51
08-14-51
10-30-51
12-18-51
U
02-20-52
04-23-52
08-26-52
10-28-52
12-17-52
02-18-53
04-16-53
06-11-53
08-10-53
10-06-53
Diameter
of
casing
(inches)
__ __ __

Tab
le 1
. Rec
ords
of w
ells
and
spr
ings
in th
e A
com
a em
baym
ent a
nd e
aste
rn Z
uni u
plif
t Con
tinue
d
Con-
Altitude
Depth
trib-
of land
of well
, Water
Local
Station
uting
Aquifer
surface
total
level
identifier
number
Owner
unit
code
(feet)
(feet)
(feet)
12N.11W.05.413
351743108010601
--
--
222.
3521
6.64
218.
74239.83
249.
54
234.58
229.46
225.
65224.20
246.13
246.11
243.60
235.90
231.50
246.89
251.10
251.35
242.81
237.
2517
7.26
174.25
171.43
171.
1216
9.92
12N.11W.09.114
351716108002901
Church
& Hardin
S 313SADG
6,660
176
142.
16
Water-
level
date
12-18-53
02-10-54
04-07-54
06-10-54
08-27-54
10-13-54
12-02-54
02-11-55
04-14-55
06-14-55
08-09-55
10-10-55
12-06-55
04-16-56
06-04-56
08-01-56
10-01-56
12-10-56
02-12-57
01-24-84
09-11-84
08-13-85
01-14-86
09-24-86
06-05-47
Diameter
Primary
of
use of
casing
water
(inc
hes)
-- __ __ -- __

Tab
le 1
.-R
ecor
ds o
f wel
ls a
nd s
prin
gs in
the
Aco
ma
emba
ymen
t and
eas
tern
Zun
i upl
ift-
Con
tin
ued
Con-
t rib-
Local
Station
uting
identifier
number
Owner
unit
12N.11W.09.114A
351715108003001
Roundy
N N N N N N N P S S S S N N N N N N N __
Altitude
Depth
of land
of well,
Water
Aquifer
surface
total
level
code
(feet)
(feet)
(feet)
313SADG
6,660
523
144.14
137.83
135.80
135.14
136.38
136.14
131.05
123.30
128.46
133.51
132.06
146.37
147.45
148.65
146.38
146.36
147.29
157.32
175.35
161.88
158.96
157.52
149.31
143.92
313SADG
6,660
523
146.85
Water-
Primary
level
use of
date
water
04-06-48
U06-11-48
08-05-48
10-06-48
12-10-48
02-11-49
06-10-49
08-19-49
10-12-49
12-15-49
02-08-50
06-28-50
08-24-50
10-17-50
12-13-50
02-15-51
04-17-51
06-20-51
08-14-51
10-30-51
12-18-51
02-20-52
04-23-52
06-25-52
08-26-52
U
Diameter
of
casing
(inches)
16.00
__ _ _ __ ~

Tab
le I
. Rec
ords
of w
ells
and
spri
ngs
in th
e A
com
a em
baym
ent a
nd e
aste
rn Z
uni u
plif
t Con
tinue
d
Con-
Altitude
Depth
trib-
of land
of we
ll,
Water
Local
Station
uting
Aquifer
surface
total
leve
l identifier
number
Owner
unit
code
(feet)
(fee
t)
(feet)
12N.11W.09.114A
351715108003001
151.94
150.
87153.27
152.54
161.32
164.73
164.
9316
2.24
160.97
161.
48
167.07
165.
3416
5.03
164.77
163.95
165.86
172.41
171.
8117
2.44
167.62
167.70
168.55
171.
67177.91
179.
83
Water-
Primary
level
use of
date
water
10-28-52
12-17-52
02-18-53
04-16-53
06-11-53
08-10-53
10-06-53
12-18-53
02-10-54
04-07-54
06-10-54
08-27-54
10-13-54
12-02-54
02-11-55
04-14-55
06-14-55
08-09-55
10-10-55
12-06-55
02-06-56
04-16-56
06-04-56
08-01-56
10-01-56
Diameter
of
casing
(inches)
__ __ __ __

Tab
le 1
.--R
ecor
ds o
f wel
ls a
nd s
prin
gs in
theA
com
a em
baym
ent a
nd e
aste
rn Z
uni u
plif
t Con
tinue
d
Con-
Altitude
Depth
trib-
of land
of well,
Water
Local
Station
uting
Aquifer
surface
total
level
identifier
number
Owner
unit
code
(feet)
(feet)
(feet)
12N.11W.09.114A
351715108003001
177.44
175.
5417
9.77
177.
44313SADG
6,660
523
163.43
165.
07150.40
149.06
150.
95146.42
105.76
151.
27148.20
163.20
161.98
143.28
146.
65153.30
155.32
147.
05
152.40
164.05
157.64
144.88
156.92
Water-
Primary
level
use of
date
water
12-10-56
02-12-57
05-06-57
08-01-57
11-14-57
U
02-04-58
05-14-58
08-18-58
11-19-58
02-16-59
05-04-59
09-02-59
11-03-59
02-08-60
05-10-60
08-25-60
11-14-60
02-15-61
05-10-61
08-07-61
11-29-61
02-12-62
05-14-62
08-14-62
02-04-63
Diameter
of
casing
(inches)
_ -- __

Tab
le 1
.-R
ecor
ds o
f wel
ls a
nd sp
ring
s in
the
Aco
ma
emba
ymen
t and
eas
tern
Zun
i upl
ift C
ontin
ued
Con-
Altitude
Depth
trib-
of land
of well
, Water
Local
Station
uting
Aquifer
surface
total
level
identifier
number
Owner
unit
code
(feet)
(feet)
(feet)
12N.11W.09.114A
351715108003001
~
158.
1211
4.14
125.
97116.89
112.
52
113.
7412N.11W.09.221
351719107594901
Roundy
N 313SADR
6,649
115.70
P 120.52
S 13
0.62
S 12
9.38
130.13
128.
40128.21
127.60
127.68
127.61
127.71
129.
18133.45
139.16
143.
89139.84
138.
11137.07
136.
46
Water-
level
date
08-19-63
02-08-84
01-30-85
08-13-85
01-14-86
09-24-86
02-26-46
05-10-46
07-12-46
09-08-46
10-01-46
11-10-46
12-01-46
01-01-47
02-01-47
03-01-47
04-08-47
05-01-47
06-01-47
07-01-47
08-01-47
09-01-47
11-01-47
12-01-47
01-01-48
Diameter
Primary
of
use of
casing
water
(inches)
__
U 12
.00
20.00
6.00
__ -- __ __ -- __

Tab
le I
. Rec
ords
of w
ells
and
spr
ings
in th
e A
com
a em
baym
ent a
nd e
aste
rn Z
uni u
plif
t C
onti
nued
Con-
Altitude
Depth
trib-
of land
of we
ll,
Water
Local
Station
uting
Aquifer
surface
total
leve
l identifier
number
Owner
unit
code
(fee
t)
(fee
t)
(feet)
12N.11W.09.221
351719107594901
136.02
135.48
134.95
135.17
131.83
130.65
129.
85128.96
128.08
127.70
128.36
128.12
128.49
128.59
313SADR
6,649
128.31
126.84
126.84
124.07
123.04
120.88
120.11
120.97
122.47
122.98
123.33
Water-
Primary
leve
l use of
date
water
02-01-48
03-01-48
04-01-48
05-01-48
06-11-48
07-01-48
08-01-48
09-01-48
10-01-48
11-01-48
12-01-48
01-01-49
02-11-49
03-01-49
04-01-49
U
05-01-49
06-01-49
07-01-49
08-01-49
09-01-49
10-09-49
11-01-49
12-14-49
01-01-50
02-01-50
Diameter
of
casing
(inches)
__ __ __ __

Tab
le 1
.-R
ecor
ds o
f wel
ls a
nd s
prin
gs in
the
Aco
ma
emba
ymen
t and
eas
tern
Zun
i upl
ift C
ontin
ued
Con-
Altitude
Depth
trib-
of land
of well
, Water
Local
Station
uting
Aquifer
surface
total
level
identifier
number
Owner
unit
code
(feet)
(feet)
(feet)
12N.11W.09.221
351719107594901
--
~
124.78
125.97
134.16
140.65
140.
04
140.
72139.80
139.19
138.10
140.48
137.46
137.35
137.60
140.48
152.
97
156.41
157.17
157.
07155.23
313SADR
6,649
152.45
150.95
149.61
149.08
149.
85151.75
Water-
level
date
04-01-50
05-01-50
06-01-50
07-01-50
08-01-50
09-01-50
10-17-50
11-01-50
12-01-50
01-01-51
02-01-51
03-01-51
04-01-51
05-01-51
06-19-51
07-04-51
08-14-51
09-01-51
10-01-51
12-01-51
01-01-52
02-01-52
03-01-52
04-01-52
05-01-52
Diameter
Primary
of
use of
casing
water
(inches)
_ _ __
U
_

Tab
le ^
.-R
ecor
ds o
f wel
ls a
nd s
prin
gs in
theA
com
a em
baym
ent a
nd e
aste
rn Z
uni u
plif
t C
onti
nued
Con-
Altitude
Depth
trib-
of land
of well
, Water
Local
Station
uting
Aquifer
surface
total
leve
l identifier
number
Owner
unit
code
(feet)
(fee
t)
(fee
t)
12N.11W.09.221
351719107594901
151.
8515
0.14
151.16
149.
2214
8.93
147.10
146.
6714
5.78
144.76
145.
01
151.
1516
0.72
167.
6216
4.32
161.
17
158.
25156.46
155.06
154.
0115
4.18
167.
1017
6.10
181.51
175.73
313SADR
6,649
173.75
Water-
Primary
level
use of
date
water
06-01-52
07-01-52
08-01-52
10-28-52
11-01-52
12-17-52
01-01-53
02-01-53
03-01-53
04-01-53
05-01-53
06-01-53
08-11-53
10-08-53
11-01-53
12-01-53
01-01-54
02-01-54
03-01-54
04-01-54
05-01-54
06-01-54
07-01-54
08-01-54
09-01-54
U
Diameter
of
casing
(inches)
__ _

Tab
le 1
.-R
ecor
ds o
f wel
ls a
nd s
prin
gs in
theA
com
a em
baym
ent a
nd e
aste
rn Z
uni u
plif
t Con
tinue
d
Con-
Altitude
Depth
trib-
of land
of well
, Water
Local
Station
uting
Aquifer
surface
total
level
identifier
number
Owner
unit
code
(feet)
(feet)
(fee
t)
12N.11W.09.221
351719107594901
~
170.40
166.
1816
3.36
161.
62159.96
159.20
158.
2018
2.13
180.
8818
1.82
177.
47179.91
170.
4516
6.82
171.
66
177.
9018
3.93
186.
56186.18
176.95
174.73
172.71
170.98
171.80
184.53
Water-
level
date
10-01-54
11-01-54
12-01-54
01-01-55
02-14-55
03-01-55
04-01-55
06-14-55
07-01-55
08-09-55
09-01-55
10-01-55
12-01-55
04-20-56
05-05-56
06-01-56
07-05-56
08-05-56
10-05-56
12-05-56
01-05-57
02-05-57
03-05-57
04-05-57
05-05-57
Diameter
Primary
of
use
of
casing
water
(inc
hes)
_. __

Tab
le L
Rec
ords
of w
ells
and
spr
ings
in th
e A
com
a em
baym
ent a
nd e
aste
rn Z
uni u
plif
t Con
tin
ued
Con-
Altitude
Depth
trib-
of land
of we
ll,
Water
Local
Station
uting
Aquifer
surface
total
leve
l identifier
number
Owner
unit
code
(feet)
(fee
t)
(fee
t)
12N.11W.09.221
351719107594901
187.47
192.
39185.93
186.
23181.35
176.
43173.44
171.04
168.74
167.
68
165.
8716
3.48
162.
3316
4.68
164.45
168.06
168.
04164.39
164.41
161.
68
161.29
158.
93162.91
166.51
170.21
Water-
Primary
level
use of
date
water
06-10-57
07-05-57
08-05-57
09-05-57
10-05-57
11-05-57
12-05-57
01-05-58
02-05-58
03-05-58
04-05-58
05-15-58
06-05-58
07-05-58
08-05-58
09-05-58
10-05-58
11-20-58
12-05-58
01-20-59
02-05-59
03-05-59
04-05-59
05-01-59
06-01-59
Diameter
of
casing
(inches)
-- __ __ __ __

Tab
le l.
~R
ecor
ds o
f wel
ls a
nd sp
ring
s in
the
Aco
ma
emba
ymen
t and
eas
tern
Zun
i upl
ift
Con
tinue
d
Con-
Altitude
Depth
trib-
of land
of well,
Water
Local
Station
uting
Aquifer
surface
total
level
identifier
number
Owner
unit
code
(feet)
(feet)
(fee
t)
12N.11W.09.221
351719107594901
~
169.45
167.67
167.27
150.63
150.81
150.25
152.21
151.25
150.49
313SADR
6,649
149.69
149.88
150.13
150.10
149.20
150.53
152.22
154.08
153.85
153.17
152.24
149.84
148.23
147.82
147.77
149.80
Water-
Primary
level
use of
date
water
07-05-59
08-05-59
09-05-59
02-09-65
03-22-65
05-
-65
06-
-65
07-
-65
08-
-65
09-
-65
U
10-
-65
11-
-65
12-
-65
04-02-68
01-
-69
02-
-69
02-14-69
03-
-69
04-
-69
05-
-69
06-
-69
07-
-69
08-
-69
09-
-69
10-
-69
Diameter
of
casing
(inc
hes)
_. _ _ __ __

Tab
le 1
.-R
ecor
ds o
f wel
ls a
nd s
prin
gs in
the
Aco
ma
emba
ymen
t and
eas
tern
Zun
i upl
ift C
ontin
ued
Con-
Altitude
Depth
trib-
of land
of well,
Water
Local
Station
uting
Aquifer
surface
total
level
identifier
number
Owner
unit
code
(feet)
(feet)
(fee
t)
12N.11W.09.221
351719107594901
150.41
150.
6715
0.75
150.75
150.
54
150.
5215
1.17
151.
8215
2.48
153.06
153.66
154.11
154.
3415
4.58
313SADR
6,649
--
154.88
155.
83155.06
157.
38158.66
159.76
160.79
160.
3516
0.48
160.
6516
0.74
Water-
Primary
level
use of
date
water
11-
12-
01-
02-
03-
04-
05-
06-
07-
08-
09-
10-
11-
12-
01-
-69
-69
-70
-70
-70
-70
-70
-70
-70
-70
-70
-70
-70
-70
-71
U
Diameter
of
casing
(inches)
__ __ __
01-12-71
03-
04-
05-
06-
07-
08-
09-
10-
11-
-71
-71
-71
-71
-71
-71
-71
-71
-71
__ __

Tab
le l
.~R
ecor
ds o
f wel
ls a
nd s
prin
gs in
the
Aco
ma
emba
ymen
t and
eas
tern
Zun
i upl
ift C
onti
nu
ed
ro > »
ro
Con-
Altitude
Depth
trib-
of land
of we
ll,
Water
Local
Station
uting
Aquifer
surface
total
leve
l identifier
number
Owner
unit
code
(feet)
(feet)
(feet)
12N.11W.09.221
351719107594901
~
160.81
160.
83159.75
165.
3116
6.45
165.
5116
4.34
163.
85163.48
163.16
163.
30162.32
160.01
155.88
155.80
151.
82149.39
148.30
145.98
313SADR
6,649
~
146.67
144.62
143.
75143.10
141.
42141.97
Water-
leve
l date
12-
-71
01-
-72
01-19-72
08-
-72
09-
-72
10-
-72
11-
-72
12-
-72
01-
-73
01-26-73
02-
-73
03-
-73
04-
-73
05-
-73
05-18-73
06-
-73
07-
-73
08-
-73
01-
-74
01-15-74
02-
-74
03-
-74
04-
-74
04-25-74
05-
-74
Diameter
Primary
of
use of
casing
water
(inc
hes)
-- -- -- -- -- -- __ -- __ __
U
__ _-

Tab
le 1
.--R
ecor
ds o
f wel
ls a
nd s
prin
gs in
the
Aco
tna
emba
ymen
t and
eas
tern
Zun
i upl
ift C
onti
nu
ed
Con-
Altitude
Depth
trib-
of land
of well
, Water
Local
Station
uting
Aquifer
surface
total
level
identifier
number
Owner
unit
code
(fee
t)
(feet)
(fee
t)
12N.11W.09.221
351719107594901
--
140.51
140.37
140.99
141.27
141.62
142.52
143.24
143.89
143.72
143.86
143.58
143.52
143.22
142.61
141.79
141.67
141.52
141.01
142.25
142.43
141.71
141.26
140.89
138.09
136.42
Water-
Primary
level
use of
date
water
06-
-74
07-
-74
08-
-74
08-21-74
09-
-74
10-
-74
11-
-74
12-
-74
01-
-75
01-15-75
02-
-75
03-
-75
04-
-75
05-
-75
06-
-75
07-
-75
08-
-75
09-
-75
02-
-76
02-11-76
03-
-76
04-
-76
05-
-76
06-
-76
07-
-76
Diameter
of
casing
(inches)
__ -- _ -- __ -- __ ~ ~

Tab
le I
. Rec
ords
of w
ells
and
spr
ings
in th
eAco
ma
emba
ymen
t and
eas
tern
Zun
i upl
ift C
ontin
ued
Con-
Altitude
Depth
trib-
of land
of we
ll,
Water
Local
Station
uting
Aquifer
surface
total
level
identifier
number
Owner
unit
code
(feet)
(feet)
(fee
t)
12N.11W.09.221
351719107594901
134.33
134.54
134.83
130.69
138.60
139.07
140.66
143.99
164.43
160.31
158.50
156.93
156.48
154.81
112.88
109.36
106.68
107.38
109.17
108.47
109.88
107.90
107.59
107.78
108.98
Water-
Primary
level
use of
date
water
08-
-76
08-11-76
10-
-76
01-
-77
01-17-77
02-
-77
06-
-77
07-
-77
08-
-77
09-
-77
10-
-77
11-
-77
12-14-77
02-02-78
02-08-84
08-14-84
08-13-85
10-09-85
11-01-85
12-01-85
01-01-86
02-01-86
03-01-86
04-01-86
05-01-86
Diameter
of
casing
(inches)
__ __ __ __

Tab
le 1
.-R
ecor
ds o
f wel
ls a
nd s
prin
gs in
the
Aco
ma
emba
ymen
t and
eas
tern
Zun
i upl
ift C
onti
nu
ed
Con-
trib-
Local
Station
uting
identifier
number
Owner
unit
12N.11W.09.221
351719107594901
12N.11W.09.424
351651107594501
Yager, Tom
N N N P N N N S N__ __
___ __ __
__
Altitude
Depth
of land
of well
, Water
Aquifer
surface
total
level
code
(feet)
(fee
t)
(feet)
107.52
107.17
310YESO
6,640
370
93.75
98.76
310YESO
6,640
370
99.09
99.05
99.15
99.2
199
.23
99.6
6
100.09
100.59
101.74
103.96
105.57
105.14
105.29
104.97
105.00
104.75
103.19
102.79
102.13
102.39
101.97
Water-
Primary
leve
l use of
date
water
06-01-86
07-01-86
05-10-46
U09-04-46
10-02-46
U
11-07-46
12-04-46
01-03-47
02-03-47
03-11-47
04-08-47
05-06-47
06-05-47
07-08-47
08-07-47
09-03-47
10-03-47
12-11-47
02-03-48
04-06-48
06-11-48
08-05-48
10-06-48
12-10-48
02-11-49
Diameter
of
casing
(inches)
_.
16.0
0 _

Tab
le ^
. Rec
ords
of w
ells
and
spr
ings
in th
e A
com
a em
baym
ent a
nd e
aste
rn Z
uni u
plif
t Con
tin
ued
ro i >
o\
Con-
Altitude
Depth
trib-
of land
of well,
Water
Local
Station
uting
Aquifer
surface
total
level
identifier
number
Owner
unit
code
(feet)
(fee
t)
(feet)
12N.11W.09.424
351651107594501
101.35
99.9
498.46
97.5
798.53
99.0
199
.50
103.66
105.08
310YESO
6,64
0 37
0 106.23
106.26
106.39
106.69
110.
65113.51
114.36
114.19
114.10
113.80
113.
00
113.
43113.39
113.
2011
2.60
112.89
Water-
Primary
level
use
of
date
water
04-12-49
06-10-49
08-19-49
10-12-49
12-15-49
02-08-50
04-19-50
06-28-50
08-24-50
10-17-50
U
12-13-50
02-15-51
04-17-51
06-20-51
08-14-51
10-30-51
12-24-51
02-20-52
04-23-52
06-25-52
08-26-52
10-28-52
12-17-52
02-18-53
04-16-53
Diameter
of
casing
(inches)
__ __

Tab
le 1
.-R
ecor
ds o
f wel
ls a
nd s
prin
gs i
n th
e A
com
a em
baym
ent a
nd e
aste
rn Z
uni u
pli
ft C
onti
nued
Con-
Altitude
Depth
trib-
of land
of well,
Water
Local
Station
uting
Aquifer
surface
total
level
identifier
number
Owner
unit
code
(feet)
(fee
t)
(feet)
12N.11W.09.424
351651107594501
--
116.79
119.96
119.62
118.30
119.
17
122.21
126.
15123.81
123.74
126.
27
130.42
129.40
129.41
131.88
310YESO
6,640
370
134.80
136.45
135.08
134.50
136.
2513
9.05
135.58
133.92
130.91
129.69
129.23
Water-
Primary
leve
l use of
date
water
06-11-53
10-06-53
12-18-53
02-10-54
04-07-54
06-10-54
10-13-54
02-11-55
04-14-55
10-10-55
12-07-55
02-06-56
04-16-56
06-04-56
08-01-56
U
10-01-56
12-11-56
02-12-57
05-06-57
08-01-57
11-14-57
02-04-58
05-14-58
08-18-58
11-19-58
Diameter
of
casing
(inc
hes)
__ __

Tab
le 1
. Rec
ords
of w
ells
and
spr
ings
in th
e A
com
a em
baym
ent a
nd e
aste
rn Z
uni u
plif
t Con
tin
ued
N>
i i
00
Con-
Altitude
Depth
trib-
of land
of well,
Water
Local
Station
uting
Aquifer
surface
total
level
identifier
number
Owner
unit
code
(feet)
(feet)
(feet)
12N.11W.09.424
351651107594501
127.57
128.13
127.65
129.23
128.17
127.99
129.77
131.93
127.78
127.95
131.24
130.38
129.90
126.24
125.69
124.65
124.22
124.40
124.92
121.22
125.40
121.59
125.50
119.98
120.53
Water-
Primary
leve
l us
e of
date
water
02-16-59
05-04-59
09-02-59
11-03-59
02-08-60
05-10-60
08-25-60
11-14-60
02-15-61
05-10-61
08-07-61
11-29-61
02-12-62
05-14-62
08-14-62
11-26-62
02-04-63
08-19-63
03-10-64
08-12-64
02-09-65
08-05-65
02-09-66
08-22-66
02-20-67
Diameter
of
casing
(inches)
__ __ __ __

Tab
le ^
. Rec
ords
of w
ells
and
spr
ings
in th
e A
com
a em
baym
ent a
nd e
aste
rn Z
uni u
plif
t Con
tin
ued
Con-
Altitude
Depth
trib-
of land
of we
ll,
Water
Local
Station
uting
Aquifer
surface
total
leve
l identifier
number
Owner
unit
code
(feet)
(fee
t)
(feet)
12N.11W.09.424
351651107594501
124.
63124.15
122.39
123.40
124.38
126.70
128.70
121.85
119.65
117.34
119.06
117.03
114.
58115.15
122.69
123.15
122.18
118.47
123.40
123.98
123.69
123.
23122.39
121.93
310YESO
6,640
370
121.40
Water-
Primary
level
use of
date
water
04-02-68
02-14-69
02-16-70
08-18-70
01-12-71
01-19-72
01-26-73
08-28-73
01-15-74
08-21-74
01-16-75
02-11-76
08-11-76
01-17-77
08-16-77
02-02-78
08-
-78
08-07-78
09-
-78
10-
-78
02-28-79
03-
-79
04-
-79
05-
-79
06-
-79
U
Diameter
of
casing
(inches)
__ _ _ __

Tab
le ^
.. R
ecor
ds o
f wel
ls a
nd s
prin
gs in
the
Aco
ma
emba
ymen
t and
eas
tern
Zun
i upl
ift
Con
tinu
ed
Con-
Altitude
Depth
trib-
of land
of well,
Water
Local
Station
uting
Aquifer
surface
total
level
identifier
number
Owner
unit
code
(feet)
(fee
t)
(feet)
12N.11W.09.424
351651107594501
120.
41120.69
119.
5811
9.50
119.39
119.
63119.72
119.
6011
9.51
119.
53
119.
4411
5.82
114.86
114.06
114.09
113.
5711
3.25
113.20
113.
4011
3.15
111.
6411
0.44
110.
08110.19
109.45
Diameter
Water-
Primary
of
level
use of
casing
date
water
(inches)
07-
-79
07-17-79
08-
-79
09-
-79
10-
-79
11-
-79
12-
-79
01-
-80
02-
-80
02-14-80
03-
-80
05-
-80
06-
-80
07-
-80
07-15-80
08-
-80
09-
-80
10-
-80
01-23-81
03-
-81
06-
-81
07-
-81
07-20-81
08-
-81
09-
-81
__ -- _ __ __

Tab
le 1
.-R
ecor
ds o
f wel
ls a
nd s
prin
gs i
n th
e A
com
a em
baym
ent a
nd e
aste
rn Z
uni u
pli
ft C
onti
nued
Con-
Altitude
Depth
trib-
of land
of we
ll,
Water
Local
Station
uting
Aquifer
surface
total
leve
l identifier
number
Owner
unit
code
(feet)
(fee
t)
(fee
t)
12N.11W.09.424
351651107594501
109.73
110.28
110.54
110.68
310YESO
6,640
370
110.
67
110.
65110.44
110.
2810
9.76
108.
81
107.
9210
7.27
106.
8010
6.98
106.
56
106.
4310
6.50
106.
65106.61
106.69
106.
3510
4.75
101.
7310
0.48
101.
07
Water-
Primary
level
use of
date
water
10-
-81
11-
-81
12-
-81
01-
-82
02-
-82
U
02-23-82
03-
-82
04-
-82
05-
-82
06-
-82
07-
-82
08-
-82
09-
-82
09-07-82
10-
-82
11-
-82
12-
-82
01-
-83
01-17-83
02-
-83
03-
-83
04-
-83
05-
-83
06-
-83
07-
-83
Diameter
of
casing
(inches)
__ __ __ __

Tab
le 1
, Rec
ords
of w
ells
and
spr
ings
in th
e A
cont
a en
ibay
men
t and
eas
tern
Zun
i upl
ift C
onti
nu
ed
Local
Station
identifier
number
Owner
12N.11W.09.424
351651107594501
12N.11W.10.114
351718107592301
12N.11W.10.344
351636107591301
Roundy
~
12N.11W.10.431
351644107585901
Johns & Ross
12N.11W.10.4312
351645107590001
Electric Plains
12N.11W.11. 343
351637108583001
Berryhill, Duane
Con-
Altitude
Depth
trib-
of land
of well
, Water
uting
Aquifer
surface
total
level
unit
code
(feet)
(feet)
(feet)
101.
2493
.72
96.2
692
.36
90.0
4
P 313SADG
6,65
0 25
4 110.56
106.
21103.26
P 313SADR
6,635
378
121.72
105.
34
96.2
3104.11
93.5
697.24
91.6
2
98.1
8
N 313SADG
6,64
0 24
8 10
3.67
P 313SADG
6,64
0 50
0 103.70
169.0
94.3
5P
110AVMB
6,63
0 150
123.65
123.
86123.59
Water-
Primary
leve
l use of
date
water
08-12-83
08-08-85
08-13-85
01-06-86
09-05-86
02-10-84
U09-11-84
08-14-85
04-06-48
U01-24-84
09-11-84
01-29-85
08-14-85
01-16-86
09-05-86
03-14-89
02-27-46
I02-27-46
I
09-05-57
07-16-85
07-08-47
H08-07-47
09-03-47
Diameter
of
casing
(inches)
5.00
8.00
6.00
__
14.0
014.00
_ 8.00

Tab
le 1
. Rec
ords
of w
ells
and
spr
ings
in th
e A
com
a em
baym
ent a
nd e
aste
rn Z
uni u
plif
t Con
tin
ued
Con-
trib-
Local
Station
uting
identifier
number
Owner
unit
12N.11W.11. 343
351637108583001
__ __
__ __
__
12N.11W.14.213
351630107572801
Berryhill, Duane
N S S S S S S S S S S S
Altitude
Depth
of land
of we
ll,
Water
Aquifer
surface
total
leve
l code
(feet)
(feet)
(feet)
110AVMB
6,630
150
123.
62123.69
123.
6412
3.84
123.73
123.79
123.
55123.47
123.46
123.
64
123.83
123.61
123.38
111MCCR
6,605.40
115
98.80
111MCCR
6,605.40
115
98.60
98.2
698
.46
98.7
699
.13
99.30
99.5
399.82
100.02
100.26
100.51
Water-
Primary
leve
l use of
date
water
10-03-47
H12-11-47
02-03-48
04-06-48
06-11-48
08-04-48
10-06-48
12-10-48
02-11-49
04-11-49
06-10-49
08-19-49
10-12-49
06-13-49
08-19-49
02-08-50
04-19-50
06-27-50
08-24-50
10-17-50
12-13-50
02-15-51
04-18-51
06-19-51
08-14-51
Diameter
of
casing
(inches)
_. -- -- -- __ -- __ -- -- -- __

Tab
le ^
. Rec
ords
of w
ells
and
spr
ings
in th
e A
com
a em
baym
ent a
nd e
aste
rn Z
uni u
plif
t Con
tin
ued
Con-
Altitude
Depth
trib-
of land
of well,
Water
Local
Station
uting
Aquifer
surface
total
leve
l identifier
number
Owner
unit
code
(feet)
(feet)
(feet)
12N.11W.14.213
351630107572801
P 100.69
S 100.99
101.17
101.
25100.82
100.72
100.77
100.80
100.
93100.97
101.12
101.16
101.
27101.39
101.31
101.19
101.16
101.16
101.
1499.39
101.
34101.38
101.10
100.
84100.52
Water-
level
date
10-25-51
02-20-52
04-23-52
06-25-52
10-24-52
12-17-52
02-20-53
04-15-53
06-10-53
08-10-53
12-19-53
02-10-54
04-07-54
06-10-54
08-27-54
10-13-54
12-02-54
02-11-55
04-14-55
04-16-55
06-14-55
08-09-55
10-10-55
12-06-55
02-06-56
Diameter
Primary
of
use of
casing
water
(inches)
__ __

Tab
le 1
. Rec
ords
of w
ells
and
spr
ings
in
the
Aco
ma
emba
ymen
t and
eas
tern
Zun
i upl
ift C
onti
nu
ed
Con-
Altitude
Depth
trib-
of land
of well,
Water
Local
Station
uting
Aquifer
surface
total
leve
l identifier
number
Owner
unit
code
(feet)
(feet)
(feet)
12N.11W.14.213
351630107572801
99.69
97.9
396.50
95.5
793
.84
92.6
192.51
90.5
091
.13
89.5
0
89.6
289
.34
88.1
087.85
89.1
0
88.4
788
.80
89.17
89.55
89.4
4
89.0
089.19
89.3
789.45
111MCCR
6,605.40
115
89.72
Water-
Primary
leve
l use of
date
water
06-04-56
08-01-56
10-01-56
12-10-56
04-13-57
05-18-57
08-01-57
11-14-57
02-04-58
05-14-58
08-18-58
11-19-58
02-16-59
05-04-59
09-02-59
11-03-59
02-08-60
05-11-60
08-25-60
11-14-60
02-15-61
05-11-61
08-07-61
11-29-61
02-12-62
Diameter
of
casing
(inches)
__ __ __ __

Tab
le 1
. Rec
ords
of w
ells
and
spri
ngs
in th
eAco
ma
emba
ymen
t and
eas
tern
Zun
i upl
ift C
ontin
ued
Con-
Altitude
Depth
trib-
of land
of we
ll,
Water
Local
Station
uting
Aquifer
surface
total
level
identifier
number
Owner
unit
code
(feet)
(feet)
(fee
t)
12N.11W.14.213
351630107572801
--
90.2
990.35
90.20
90.38
90.79
91.05
91.30
91.03
88.09
90.85
90.45
90.5
092
.32
91.5
790.43
91.1
490
.74
91.8
491.65
90.3
1
89.65
88.79
86.96
86.48
86.22
Water-
Primary
leve
l us
e of
date
water
05-14-62
08-14-62
11-26-62
02-04-63
08-20-63
03-09-64
08-12-64
02-09-65
08-05-65
02-10-66
08-22-66
02-20-67
04-02-68
02-14-69
02-16-70
08-18-70
01-12-71
01-19-72
01-26-73
08-28-73
01-15-74
08-21-74
01-16-75
02-11-76
08-11-76
Diameter
of
casing
(inches)
_ ~ __ __ ~ _

Tab
le 1
. R
ecor
ds o
f wel
ls a
nd s
prin
gs in
theA
com
a em
baym
ent a
nd e
aste
rn Z
uni u
plif
t Con
tinue
d
IS
Local
Station
identifier
number
Owner
12N.11W.14.213
351630107572801
__ _
12N.11W.14.311
351603107583201
Frea
s, Fred
12N.11W.14.311A
351554107582701
12N.11W.15.111
351631107593601
Yager, Tom
12N.11W.15.211
351633107590301
Roundy
Con-
Altitude
Depth
trib-
of land
of well,
Water
uting
Aquifer
surface
total
level
unit
code
(feet)
(feet)
(fee
t)
85.8
886.20
86.50
86.82
111MCCR
6,605.40
115
86.95
87.1
586.76
85.40
84.8
484
.60
84.20
84.0
183.87
83.89
83.3
1
83.14
82.52
82.6
385.83
81.87
81.7
4110AVMB
6,622
140
110AVMB
P 231CHNL
6,635
200
116.21
P 313SADR
6,630
~
171.50
Water-
Primary
level
use of
date
water
01-17-77
08-16-77
02-02-78
08-07-78
03-28-79
07-17-79
02-14-80
07-15-80
01-23-81
07-20-81
02-23-82
09-07-82
01-17-83
08-12-83
01-11-84
08-14-84
01-29-85
02-21-85
08-13-85
01-06-86
09-25-86
__ __
03-11-47
U10-02-56
U
Diameter
of
casing
(inc
hes)
-- _ 6.87
16.0
0

Tab
le l
.~R
ecor
ds o
f wel
ls a
nd s
prin
gs i
n th
e A
com
a em
baym
ent a
nd e
aste
rn Z
uni u
plif
t Con
tin
ued
Con-
trib-
Local
Station
uting
Aquifer
identifier
number
Owner
unit
code
12N.11W.15.321A
351608107592101
Roundy
P 313SADR
P12N.11W.15.341
351554107591501
Freas, Edward C.
N 310GLRT
S S S S P S S 310GLRT
S __
__
__
Altitude
Depth
of land
of well,
Water
surface
total
level
(feet)
(feet)
(f
eet)
6,630
178
109.00
91.28
6,630
232
107.72
109.12
106.76
106.55
106.22
106.07
105.86
6,630
232
106.09
139.45
117.71
117.92
113.79
139.50
107.18
106.99
107.29
107.79
103.54
101.90
99.78
101.15
102.34
103.92
Water-
level
date
12-03-49
09-11-84
09-04-46
10-02-46
11-08-46
12-04-46
01-03-47
02-04-47
03-11-47
04-08-47
05-06-47
09-03-47
10-03-47
02-03-48
04-06-48
10-06-48
12-10-48
02-11-49
04-12-49
06-10-49
08-19-49
10-12-49
12-15-49
02-08-50
04-19-50
Diameter
Primary
of
use of
casing
water
(inches)
I 18.00
I 14.00
I
_ __

Tab
le 1
. Rec
ords
of w
ells
and
spr
ings
in th
e A
com
a em
baym
ent a
nd e
aste
rn Z
uni u
plif
t Con
tin
ued
Con-
Altitude
Depth
trib-
of land
of well,
Water
Local
Station
uting
Aquifer
surface
total
level
identifier
number
Owner
unit
code
(feet)
(feet)
(feet)
12N.11W.15.341
351554107591501
161.68
159.
0211
6.10
115.49
115.74
133.72
136.15
133.
14128.68
126.75
130.
24125.01
123.00
126.00
310GLRT
6,630
232
160.68
147.
23143.10
135.40
132.
62135.22
159.98
152.35
147.
03141.80
137.05
Water-
Primary
leve
l use of
date
water
06-28-50
08-24-50
12-13-50
02-15-51
04-17-51
06-20-51
08-15-51
10-31-51
12-24-51
02-20-52
06-25-52
12-17-52
02-19-53
04-16-53
06-11-53
I
08-10-53
10-07-53
12-18-53
02-10-54
04-07-54
06-10-54
08-27-54
10-13-54
12-03-54
02-11-55
Diameter
of
casing
(inches)
__ __ __

Tab
le 1
. Rec
ords
of w
ells
and
spri
ngs
in th
e A
com
a ei
riba
ymen
t and
eas
tern
Zun
i upl
ift C
ontin
ued
Con-
Altitude
Depth
trib-
of land
of we
ll,
Water
Local
Station
uting
Aquifer
surface
total
level
identifier
number
Owner
unit
code
(feet)
(feet)
(feet)
12N.11W.15.341
351554107591501
141.53
161.53
161.
0015
6.60
148.
18
145.
6015
6.30
153.81
149.
4414
7.07
138.
1714
5.27
139.
70142.39
131.
08
132.88
133.45
125.
1012
6.88
131.
81
140.20
132.
0714
3.73
141.
9712
5.65
Water-
Primary
level
use of
date
water
04-14-55
06-14-55
08-09-55
10-10-55
12-07-55
04-16-56
06-04-56
12-10-56
02-13-57
I02-04-58
02-10-59
02-08-60
02-15-61
02-12-62
02-04-63
02-09-65
02-10-66
02-20-67
04-02-68
02-14-69
02-16-70
01-12-71
01-19-72
01-26-73
01-15-74
Diameter
of
casing
(inc
hes)
__ __ __ ~ __

Tab
le 1
.-R
ecor
ds o
f wel
ls a
nd s
prin
gs in
the
Aco
ma
emba
ymen
t and
eas
tern
Zun
i upl
ift C
ontin
ued
Con-
Altitude
Depth
trib-
of land
of well
, Water
Local
Station
uting
Aquifer
surface
total
level
identifier
number
Owner
unit
code
(fee
t)
(feet)
(feet)
12N.11W.15.341
351554107591501
120.09
123.67
124.68
94.11
94.1
2
84.05
94.12
81.36
89.06
83.23
12N.11W.16.230
351503108000301
Bowlin, E.
B.
N 310GLRT
6,640
180
123.68
S 123.68
S 123.60
P 123.82
125.77
131.95
137.40
139.95
135.
24135.44
139.38
131.49
130.70
310GLRT
6,640
180
126.73
124.66
Water-
Primary
level
use of
date
water
02-11-76
01-17-77
02-02-78
01-31-84
02-08-84
09-11-84
01-29-85
08-13-85
01-16-86
09-24-86
10-12-44
S02-03-47
03-11-47
04-08-47
05-06-47
06-05-47
07-08-47
08-07-47
09-03-47
10-03-47
12-11-47
02-03-48
04-06-48
08-05-48
S10-06-48
Diameter
of
casing
(inches)
__ -- __ 6.00
--
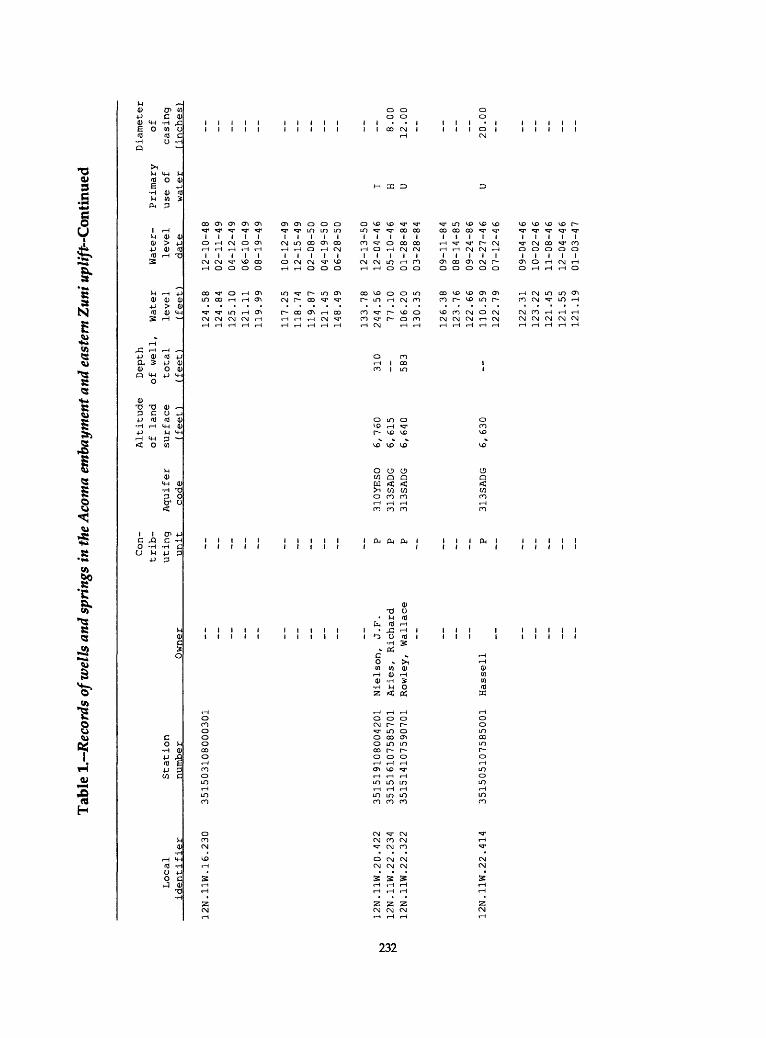
Tab
le 1
. Rec
ords
of w
ells
and
spr
ings
in th
e A
com
a em
baym
ent a
nd e
aste
rn Z
uni u
plif
t Con
tinue
d
Local
Station
identifier
number
Owner
12N.11W.16.230
351503108000301
__ __ __ ~ __
12N.11W.20.422
351519108004201
Nielson, J.
F.12N.11W.22.234
351516107585701
Aries, Richard
12N.11W.22.322
351514107590701
Rowl
ey,
Wallace
--
12N.11W.22.414
351505107585001
Hassell __
Con-
Altitude
Depth
trib-
of land
of well,
Water
uting
Aquifer
surface
total
leve
l unit
code
(feet)
(feet)
(feet)
124.
5812
4.84
125.10
121.
11119.99
117.
2511
8.74
119.
8712
1.45
148.49
133.
78P
310YESO
6,760
310
244.56
P 313SADG
6,615
77.10
P 313SADG
6,640
583
106.
2013
0.35
126.38
123.76
122.66
P 313SADG
6,630
110.59
122.79
122.
3112
3.22
121.
4512
1.55
121.
19
Water-
leve
l date
12-10-48
02-11-49
04-12-49
06-10-49
08-19-49
10-12-49
12-15-49
02-08-50
04-19-50
06-28-50
12-13-50
12-04-46
05-10-46
01-28-84
03-28-84
09-11-84
08-14-85
09-24-86
02-27-46
07-12-46
09-04-46
10-02-46
11-08-46
12-04-46
01-03-47
Diameter
Primary
of
use of
casing
water
(inches)
__ -- -- __
I H 8.00
U 12
.00
__
U 20.00
__

Tab
le 1
. Rec
ords
of w
ells
and
spr
ings
in th
e A
com
a em
baym
ent a
nd e
aste
rn Z
uni u
plif
t Con
tin
ued
Con-
Altitude
Depth
trib-
of land
of we
ll,
Water
Local
Station
uting
Aquifer
surface
total
level
identifier
number
Owner
unit
code
(feet)
(feet)
(feet)
12N.11W.22.414
351505107585001
121.06
313SADG
6,630
120.82
121.22
123.52
130.14
134.60
136.48
133.28
133.16
130.75
129.07
128.47
127.28
126.66
123.91
123.08
122.95
123.28
121.36
120.11
117.94
118.53
119.12
120.35
135.67
Water-
Primary
level
use of
date
water
02-04-47
03-11-47
U04-08-47
05-06-47
06-05-47
07-07-47
08-07-47
09-03-47
10-03-47
12-11-47
02-03-48
04-06-48
06-11-48
08-05-48
10-06-48
12-10-48
02-11-49
04-12-49
06-10-49
08-19-49
10-12-49
12-15-49
02-08-50
04-19-50
06-28-50
Diameter
of
casing
(inches)
__ -- __

Tab
le 1
.-R
ecor
ds o
f wel
ls a
nd s
prin
gs in
theA
com
a em
baym
ent a
nd e
aste
rn Z
uni u
plif
t Con
tinue
d
Local
Station
identifier
number
Owner
12N.11W.22.414
351505107585001
--
12N.11W.23.231
351526107580001
Roun
dy,
G.P.
12N.11W.23.333
351454107583101
Roun
dy,
G.P.
12N.11W.24.233
351518107565601
Anaconda Co
.12N.11W.24.334
351453107572101
Chalamidas, Peter
12N.11W.24.411
351513107565602
Anaconda Co
.12N.11W.25.1122
351448107571801
Wils
on,
Richard
Con
trib
uting
unit
_. __ __ P P P P P P __
Altitude
Depth
of land
of well,
Water
Aquifer
surface
total
leve
l code
(feet)
(fee
t)
(fee
t)
135.39
134.74
132.88
132.38
132.50
144.27
150.39
146.41
140.82
143.23
140.51
140.37
313SADG
6,610
300
69.07
313SADG
6,62
0 35
0
313SADR
6,63
0 38
6 156.00
313SADG
6,600
250
160.00
313SADR
6,610
357
173.50
313SADG
6,600
260
123.53
121.72
121.81
121.05
119.54
117.26
118.56
Water-
Primary
leve
l use of
date
water
08-24-50
10-17-50
12-13-50
02-15-51
04-17-51
06-20-51
08-15-51
10-31-51
02-21-52
04-24-52
02-19-53
04-07-54
10-02-46
H U
01-13-56
N06-01-58
H07-18-56
N02-09-84
H09-12-84
01-30-85
08-13-85
01-15-86
09-24-86
03-28-89
Diameter
of
casing
(inches)
__ __ 8.00
16.00
16.0
06.
0014
.00
5.00
__

Tab
le 1
. Rec
ords
of w
ells
and
spr
ings
in th
e A
com
a em
baym
ent a
nd e
aste
rn Z
uni u
plif
t Con
tinue
d
Con-
trib-
Local
Station
uting
identifier
number
Owner
unit
12N.11W.25.213
351449107570102
Anaconda
N S S S P S S __
____ __
__
_-__ __ _
__
__ __
Altitude
Depth
of land
of well,
Water
Aquifer
surface
total
level
code
(fee
t)
(feet)
(fee
t)
313SADG
6,580
236
107.81
111.10
107.69
107.16
106.82
106.98
121.26
115.22
114.43
111.36
110.52
313SADG
6,580
236
110.18
116.
34112.84
111.64
116.81
118.75
120.44
113.12
111.29
110.69
133.53
127.42
121.21
116.83
Water-
Primary
level
use of
date
water
05-10-46
I10-02-46
12-04-46
01-04-47
02-03-47
03-11-47
08-07-47
09-02-47
10-02-47
12-10-47
02-02-48
04-05-48
I10-05-48
12-09-48
02-10-49
04-11-49
06-10-49
08-19-49
10-12-49
12-15-49
02-08-50
06-27-50
08-24-50
10-17-50
12-12-50
Diameter
of
casing
(inches)
20.00
18.0
014
.00
__ _ _

Tab
le 1
. Rec
ords
of w
ells
and
spr
ings
in th
e A
com
a em
baym
ent a
nd e
aste
rn Z
uni u
plif
t Con
tin
ued
Con-
Altitude
Depth
trib-
of land
of well,
Water
Local
Station
uting
Aquifer
surface
total
level
identifier
number
Owner
unit
code
(feet)
(fee
t)
(feet)
12N.11W.25.213
351449107570102
132.31
121.42
118.86
124.55
121.53
119.42
124.03
130.86
124.74
131.28
125.26
123.02
122.96
119.74
131.99
128.78
125.84
124.41
123.83
128.91
129.50
129.
71142.85
134.56
12N.11W.25.214
351441107552401
Anaconda
P 313SADG
6,580
238
102.
98
Water-
leve
l date
04-18-51
06-20-51
02-26-52
04-24-52
12-16-52
02-17-53
04-15-53
06-10-53
08-12-53
10-06-53
12-18-53
02-10-54
04-07-54
06-10-54
08-27-54
10-13-54
12-02-54
02-11-55
04-14-55
12-07-55
02-06-56
04-16-56
12-12-56
02-17-59
02-27-46
Diameter
Primary
of
use
of
casing
water
(inches)
_ _
I 18.00

Tab
le 1
. R
ecor
ds o
f wel
ls a
nd s
prin
gs in
the
Aco
ma
emba
ymen
t and
eas
tern
Zun
i upl
ift C
onti
nu
ed
Con-
Altitude
Depth
trib-
of land
of well,
Water
Local
Station
uting
Aquifer
surface
total
level
identifier
number
Owner
unit
code
(feet)
(feet)
(feet)
12N.11W.25.214
351441107552401
S12N.11W.25.313
351416107571001
Harmon
& Reid
P 313SADG
6,590
365
132.70
124.50
127.48
128.52
127.25
131.86
135.70
136.18
139.99
141.18
143.55
150.25
152.90
151.28
152.60
151.79
154.08
156.00
150.90
147.83
148.11
147.35
143.00
313SADG
6,59
0 36
5 145.20
Water-
Primary
leve
l use of
date
water
07-11-46
I02-03-47
02-03-48
02-10-49
02-28-50
02-15-51
02-26-52
02-19-53
02-10-54
02-11-55
02-08-56
02-13-57
11-14-57
02-04-58
02-17-59
02-09-60
02-15-61
02-12-62
02-04-63
03-09-64
02-09-65
02-10-66
02-20-67
04-02-68
I
Diameter
of
casing
(inches)
16.0
018.00
-- __ __ -- __ __ -- __

Tab
le 1
. Rec
ords
of w
ells
and
spr
ings
in th
e A
com
a em
baym
ent a
nd e
aste
rn Z
uni u
plif
t Con
tin
ued
Con-
Altitude
Depth
trib-
of land
of we
ll,
Water
Local
Station
uting
Aquifer
surface
total
leve
l identifier
number
Owner
unit
code
(feet)
(feet)
(feet)
12N.11W.25.313
351416107571001
--
146.45
145.67
150.
84152.83
155.05
155.17
146.
74150.86
154.05
146.
74
133.27
130.20
126.90
127.36
124.2
12N.11W.25.413
351416107565801
--
P 313SADG
6,595
190
130.77
126.
83126.51
124.31
12N.11W.26.244
351417107573301
Roundy
P 313SADG
6,610
138.90
12N.11W.27.222
351445107584201
Prewitt, Harold
P 313SADG
6,63
5 17
0 162.86
156.
12154.76
152.21
160.56
Water-
Primary
leve
l use of
date
water
02-12-69
02-16-70
01-12-71
01-19-72
01-26-73
01-15-74
02-11-76
02-02-78
03-28-79
01-23-81
03-06-84
01-30-85
08-12-85
01-15-86
09-03-86
03-14-84
U08-14-85
01-16-86
09-24-86
06-10-46
U
07-08-47
U02-03-48
02-11-49
02-08-50
02-15-51
Diameter
of
casing
(inches)
__ -- __ 9.50
6.00

Tab
le 1
. R
ecor
ds o
f wel
ls a
nd s
prin
gs in
the
Aco
ma
emba
ymen
t and
eas
tern
Zun
i upl
ift
Con
tinu
ed
Local
identifier
12N.11W.27.222
12N.12W.17.143
12N.12W.17.432
12N.15W.02.3343
12N.15W.29.412
13N. 10W. 27. 44
44
13N.11W.07.344
13N.11W.07.433
13N.11W.08.2211
13N.11W.14.322
Station
number
Owner
351445107584201
__
351623108074801
Morr
ow,
Jim
351605108072001
351734108234801
Navarre, Leroy
351428108262201
Old Bond Ranch
351912107523401
Berryhill
~
352149108023801
352148108023001
352234108011401
352115107582801
Navajo Nation
Con
trib
uting
unit
~ __ ~
P P P P P
~ ~
N N __
P
Altitude
Depth
of land
of well,
Water
Aquifer
surface
total
leve
l code
(feet)
(feet)
(fee
t)
166.
5216
6.50
172.16
173.
9317
9.27
153.
8415
0.25
146.32
147.
6514
4.37
313SADG
7,550
200.
0 12
4.73
313SADG
7,530
162.
0 99
.10
310YESO
8,000
250
9.12
231CHNL
7,850
~
14.1
9231CHNL
6,81
0 422
324.17
323.45
325.69
324.
0320
3.60
231CHNL
231CHNL
231CHNL
313SADR
6,86
0 1,269
369.00
369.52
Water-
Primary
level
use of
date
water
02-26-52
02-19-53
02-11-54
02-11-55
02-07-56
01-28-84
01-30-85
08-14-85
01-15-86
09-25-86
07-15-81
H07-15-81
H06-14-84
U06-17-80
S03-07-84
S
08-13-85
01-16-86
09-25-86
07-29-85
__
____ __
02-24-84
S03-23-84
Diameter
of
casing
(inches)
~ ~ _ 6.0
6.50
5.00
6.00
6.63
4.50

Tab
le 1
.-R
ecor
ds o
f wel
ls a
nd s
prin
gs in
theA
com
a em
baym
ent a
nd e
aste
rn Z
uni u
plif
t Con
tinue
d
Local
identifier
13N.11W.14.322
13N.11W.17.1132
13N.11W.17.114A
13N.11W.17.123
13N.11W.17.123
13N.11W.17.333
13N.11W.18.120
13N.11W.18.122B
13N.11W.18.224
13N.11W.21.121
13N.11W.23.324
13N.11W.32.142
13N.11W.33.332
13N.13W.01.2223
Station
number
Owner
352115107582801
352136108015901
352136108015101
352135108014801
Barnes, Malson E.
352136108014301
352057108020201
Navarre Pistol
352140108024301
352143108023801
352136108020401
EPNG
352046108003401
Navarre Pistol
__
352020107582301
Elkins
351855108013301
Navarre Pistol
351829108004401
Andrews, Henry Jr.
352330108093401
AT&SF
Con
trib
uting
unit
__
P
P--
P
P
__
N P N P
Aquifer
code
231CHNL
231CHNL
231CHNL
231CHNL
313SADG
231CHNL
231CHNL
231CHNL
231CHNL
231CHNL
313SADG
310GLRT
313SADG
Altitude
of land
surface
(fee
t)
__
6,800
6,920 _
6,805
6,755
6,785
6,635
6,740
7,005
Depth
of well,
Water
total
level
(fee
t)
(fee
t)
368.91
369.86
369.12
369.38
__
__
790
218.16
540
381.00
390.11
__
_ 200
87.6
66.50
130
57.31
56.92
56.46
56.33
800
303.80
628
274.00
26.41
26.43
26.18
25.56
Water-
level
date
01-29-85
08-14-85
01-15-86
09-18-86
_06-06-84
~10-24-62
03-23-84
08-02-61
08-07-84
05-01-82
02-22-84
01-29-85
08-14-85
08-03-61
03-23-84
01-14-86
01-16-86
02-01-86
03-01-86
Diameter
Primary
of
use of
casing
water
(inches)
~ _
__
H 10.00
__
S 5.50
__
__
__
U 6.00
S
__
S 6.00
S 8.00
S U 10.00
12.50

Tab
le L
Rec
ords
of w
ells
and
spr
ings
in th
e A
com
a em
baym
ent a
nd e
aste
rn Z
uni u
plif
t Con
tin
ued
Con-
Altitude
trib-
of land
Loca
l Station
uting
Aquifer
surface
identifier
number
Owner
unit
code
(fee
t)
13N.13W.01.2223
352330108093401
__ __ __ __
__
__ __
13N.13W.01.2223A
352330108093402
AT&SF
N
310GLRT
7,005
N13N.13W.01.2223B
352330108093601
AT&SF
N
310GLRT
6,995
N13N.13W.04.1431
352315108132501
Anderson, Dempse
P 313SADG
7,210
13N.13W.05.214
352319108143701
Terpin Tob
P 313SADG
7,190
13N.13W.06.2244
352324108145001
Atchison, Floyd
P 313SADG
7,230
13N.13W.08.444
352155108134701
~
313SADG
13N.13W.22.1333
352037108123701
Bass
, Charlie G.
N
310GLRT
7,420
Depth
of we
ll,
Water
total
level
(feet)
(feet)
24 23 22 23 24 24 25 25 24 23 21 20 17 15 14
930
17-
__ 600
79 50-
648
23 30
0 -3
.60
.78
.87
.43
.28
.77
.30
.29
.61
.20
.80
.45
.54
.21
.87
.72
- - .18
.08
- .49
- .87
Water-
Primary
leve
l use of
date
water
04-01-86
05-01-86
06-01-86
07-01-86
08-01-86
09-01-86
10-01-86
11-01-86
12-01-86
01-01-87
02-01-87
03-01-87
03-26-87
05-21-87
06-08-87
06-14-84
U
09-16-31
U
06-12-84
H
07-10-84
H
07-10-84
H
11-12-81
S
Diameter
of
casing
(inches)
__ __ 16.00
12.5
010
.00
8.00
6.00
4.50
6.50
6.62

Tab
le ^
.. R
ecor
ds o
f wel
ls a
nd s
prin
gs in
the
Aco
ma
emba
ymen
t and
eas
tern
Zun
i if^
/i/t C
onti
nued
Local
identifier
13N.13W
13N.13W
13N.13W
13N.13W
13N.13W
13N.13W
13N.14W
13N.14W
13N.14W
13N.14W
14N.09W
.22
.27
.27
.28
.30
.34
.05
.16
.16
.25
.28
.133
3
.431
2.4
433
.131
2.1223
.122
.311
.144
.322
.2143
.441
Station
number
352037108123701
351927108115201
351920108115101
351953108133701
352002108152601
351914108121001
352308108210701
352126108193801
352121108193901
351952108161201
352433107462101
Owner
Carv
er,
Carv
er,
Carv
er,
Kimbler
Carv
er,
Alien,
Alien,
USFS
United
Lee
J.Le
e J.
Lee
J.,
D.L.
Lee
Bob
Bob
Nuclear
__
Con
trib
uting
unit N P S
P P P P P
S P P P S N S N S S S
Aquifer
code
313SADG
do.
do.
do.
do.
do.
310GLRT
310GLRT
313SADG
313SADG
313SADG
Altitude
Depth
of land
of well
surface
total
(feet)
(feet)
7,430
7,44.5
7,470
7,500
7,470
7, 660
7,670
7,590
6,980
6,980
150
150
130
141
431
450
163
3,275
3,275
, Water
leve
l (f
eet)
-2.61
-2.53
-2.73
-3.00
-2.20
-4.27
-4.25
-5.5
3 __
20.95
33.10
73.0
0
108.96
91.51
532.15
530.76
530.68
530.55
530.60
530.59
530.56
531.16
Water-
Primary
level
use of
date
water
07-20-82
04-06-83
02-13-84
08-23-84
01-29-85
08-12-85
01-16-86
09-26-86
06-12-84
06-12-84
06-12-84
06-12-84
06-12-84
07-10-84
07-10-84
01-09-80
05-21-84
09-19-84
10-01-84
11-10-84
12-01-84
01-01-85
02-01-85
03-01-85
S H S u S H U U U u
Diameter
of
casing
(inches)
5.00
6.00
4.50
6.50
6.50
4.00
16.0
010
.75
__

Tab
le 1
.-R
ecor
ds o
f wel
ls a
nd s
prin
gs in
the
Aco
ma
emba
ymen
t and
eas
tern
Zun
i upl
ift C
ontin
ued
Con-
t rib-
Local
Station
uting
identifier
number
Owner
unit
14N.09W.28.441
352433107462101
S S S P _
____ __ __
__
__ __ __
____ __ __ _
__ __ __
14N.10W.22.414
352532107524901
Kerr McGee
N
Altitude
Depth
of land
of well,
Water
Aquifer
surface
total
level
code
(feet)
(feet)
(feet)
531.53
531.26
530.81
531.02
530.37
530.44
528.27
527.13
527.08
527.43
527.49
527.88
528.01
528.18
528.18
528.21
528.24
527.51
526.83
527.00
527.04
527.12
527.10
527.48
313SADR
7,030
3,081
570.00
Water-
Primary
level
use of
date
water
04-01-85
05-01-85
06-01-85
07-01-85
08-01-85
09-01-85
10-01-85
11-01-85
12-01-85
01-01-86
02-01-86
03-01-86
04-01-86
05-01-86
06-01-86
07-01-86
08-01-86
09-01-86
10-01-86
11-01-86
12-01-86
01-01-87
02-01-87
03-01-87
11-21-56
U
Diameter
of
casing
(inc
hes)
~ __ _ _ 16.0
0

Tab
le ^
. Rec
ords
of w
ells
and
spr
ings
in th
e A
com
a em
baym
ent a
nd e
aste
rn Z
uni u
plif
t Con
tinue
d
Con-
trib-
Local
Station
uting
Aquifer
identifier
number
Owner
unit
code
14N.10W.22.414
352532107524901
N S 313SADR
N N N P N N P S
__ __ __ __ __ __ __
____ __ __
Altitude
Depth
of land
of well,
Water
surface
total
level
(feet)
(fee
t)
(fee
t)
557.67
7,030
3,081
557.44
557.28
556.81
556.19
555.78
556.35
557.12
555.32
555.63
555.63
555.77
556.45
555.75
554.92
555.29
554.56
554.87
554.55
553.95
554.07
554.11
554.16
557.28
557.09
Water-
level
date
02-02-84
05-01-84
06-01-84
07-01-84
08-01-84
09-01-84
10-01-84
11-01-84
12-01-84
01-01-85
02-01-85
03-01-85
04-01-85
05-02-85
06-19-85
07-01-85
08-01-85
09-01-85
10-01-85
11-01-85
12-01-85
01-01-86
02-01-86
03-13-86
04-01-86
Diameter
Primary
of
use of
casing
water
(inches)
20.00
U 10.75
-- __ -- -- __ -- --
__ -- __ -- --

Tab
le I
. Rec
ords
of w
ells
and
spr
ings
in th
e A
com
a em
baym
ent a
nd e
aste
rn Z
uni u
plif
t Con
tin
ued
Local
identifier
14N.10W.22.414
14N.12W.23.311
14N.12W.23.3222
14N.12W.23.324
14N.12W.23.333
14N.13W.19.1
14N.13W.20.4321
14N.13W.20.4322
14N.13W.20.4323
14N.13W.25.1334
14N.13W.27.342A
14N.13W.28.1234
14N.13W.33.124
14N.13W.33.124A
Station
number
Owner
352532107524901
352538108050801
Plains
352519108044101
Plains
352532108044401
Plains
--
352519108051101
Plains
352600108153201
352532108140601
352532108140001
352528108140601
352456108102501
352438108121501
352512108131901
352418108131501
352418108131502
Con-
Altitude
Depth
trib-
of la
nd
of well,
Water
Water-
Primary
uting
Aquifer
surface
total
leve
l le
vel
use of
unit
code
(feet)
(fee
t)
(feet)
date
water
555.93
08-01-86
554.83
09-01-86
554.11
10-01-86
554.16
11-01-86
554.22
12-01-86
554.12
01-01-87
554.22
02-01-87
554.20
03-01-87
554.12
03-26-87
P 310GLRT
7,020
1,790.0
J
--
P do.
6,93
0 1,724.0
J P
do.
6,980
1,555.0
J
P do.
6,94
0
Jdo
.do
.do
.231CHNL
231CHNL
313SADY
231SNSL
231SNSL
313SADG
Diameter
of
casing
(inc
hes)
8.0
6.0
8.0
6.0
8.62
5.5
__ -- __

Tab
le 1
. R
ecor
ds o
f wel
ls a
nd s
prin
gs in
the
Aco
ma
emba
ymen
t and
eas
tern
Zun
i upl
ift C
onti
nu
ed
Local
identifier
14N.13W.33.141
14N.13W.33.211
14N.13W.33.211
14N.13W.33.3341
14N.14W.10.333
14N.14W.25.3323
14N.15W.01.3134
14N.15W.04.1134
Con-
Altitude
Depth
trib-
of land
of well,
Water
Station
uting
Aquifer
surface
total
level
number
Owner
unit
code
(feet)
(feet)
(feet)
352414108132401
--
~
231CHNL
352426108130802
--
--
231CHNL
352426108130803
~
--
231CHNL
352338108133101
--
~
313SADG
352712108185901
Navajo Nation
P 313SADG
7,280
1,730
5.07
9.95
352434108164201
New Mexico Hwy Dept .
P 313SADG
7,210
862
10.8
4.40
7.27
1.18
28.6
491.88
1.10 .03
352812108230701
Myer
s, Jo
n P
313SADG
7,020
1,600
352838108261601
New Mexico Hwy Dept .
P 310GLRT
6,960
608
-187.00
-153.00
-153.00
-160.00
-222.00
-234.00
-234.00
-218.00
-209.00
-206.00
Water-
leve
ldate
__ -- __ --03-28-84
06-13-84
01-18-82
07-20-82
04-05-83
11-10-83
06-08-84
08-14-84
01-30-85
09-18-86
05-21-69
01-18-79
01-10-80
01-15-81
01-23-81
07-20-82
04-07-83
11-10-83
06-08-84
08-15-84
Diameter
Primary
of
use of
casing
water
(inches)
S 8.00
__
N 4.00
__ -- --
I P 5.00
-- __ ~

Tab
le l
.~R
ecor
ds o
f wel
ls a
nd s
prin
gs in
the
Aco
ma
emba
ymen
t and
eas
tern
Zun
i upl
ift
Con
tinu
ed
Local
Station
identifier
number
Owner
14N.15W.04.1134
352838108261601
~
14N.15W.04.1433
352827108260501
Meye
rs,
Jon _
14N.15W.14.3423
352621108235101
USFS
__
14N.15W.17.4120
352635108264201
Meye
rs,
Jon
14N.15W.20.4320
352530108264301
14N.15W.28.1143
352507108264301
Meye
rs,
Jon __
14N.15W.28.1434
352455108260101
USFS
__
Con
trib
uting
unit
P
P ~ __
P P P ~
P __ ~
Altitude
Depth
of la
nd
of well,
Water
Aquifer
surface
total
leve
l code
(fee
t)
(fee
t)
(fee
t)
-208.00
-196.00
-208.00
-189.00
313SADG
6,99
0 63
5 -189.00
-117.00
do.
7,19
4 900
-150.00
-158.00
-133.80
-137.80
-138.00
do.
7,20
4 66
1 -43.00
-65.00
-65.00
do.
7,31
0 21
9 -76.00
do.
7,360
298
7.00
28.00
14.28
do.
7,402
13.23
21.76
27.8
429.08
40.00
45.00
59.00
Water-
Primary
leve
l use of
date
water
01-29-85
08-13-85
01-14-86
09-17-86
03-
-61
R
07-31-80
- -45
S03-
-61
08-13-85
01-16-86
09-11-86
- -5
9 S
03-
-60
03-
-61
06-21-50
U
04-
-68
S07-31-80
06-08-84
10-17-41
U06-21-50
03-19-56
07-20-56
03-
-61
04-
-68
01-23-79
Diameter
of
casing
(inc
hes)
__ ~ ~ 6.00
6.00
__ 7.00
8.50
-- ~ ~ __

Tab
le l.~
Rec
ords
of w
ells
and
spr
ings
in th
eAco
ma
emba
ymen
t and
eas
tern
Zun
i upl
ift C
oncl
ude
d
Con-
Altitude
Depth
trib-
of land
of well
, Water
Local
Station
uting
Aquifer
surface
total
leve
l identifier
number
Owner
unit
code
(feet)
(feet)
(feet)
14N.15W.28.1434
352455108260101
64.0
062
.00
64.66
61.0
059.88
59.88
60.83
52.65
54.62
53.33
53.28
54.0
454
.64
15N.12W.17.111
353212108081701
--
313SADG
15N.13W.25.1423
353016108100401
Nuclear Western
P 313SADG
7,490
3,102
550.00
603.
0060
7.16
313SADG
7,490
3,10
2 63
1.10
639.04
644.
0564
5.38
646.
0064
5.53
644.43
640.
3863
7.67
635.12
633.
19
Water-
Primary
leve
l use of
date
water
01-10-80
07-31-80
01-15-81
04-20-82
07-20-82
07-20-83
12-13-83
06-08-84
08-15-84
01-31-85
08-13-85
01-16-86
09-11-86
__
- -79
N
01-29-82
08-17-82
03-28-84
N08-23-84
08-29-85
02-05-86
09-12-86
10-08-86
02-10-87
10-06-87
03-10-88
10-27-88
04-27-89
Diameter
of
casing
(inches)
__ __ 6.00
5.00

Table 2.--Temperature r geothermal gradient, and specific conductance for hydrologic-test wells in the Acoma embayment
[Microsiemens, raicrosieraens per centimeter at 25 degrees Celsius]
Welllocation
Temperature(degreesCelsius)
Adjustedtemperature(minus 16degreesCelsius)
Depth(feetbelowland
surface)
Geothermalgradient
(degrees Celsius100 feet)
Specificconductance
(microsiemens )
5.8.35.123 41.06.10.7.1413 33.58.6.20.3334 40.08.8.25.4231 36.59.6.16.111 39.0
9.9.28.1344 41.010.9.25.3241 56.8
25.017.524.020.523.0
25.040.8
2,0192,7832,2032,6502,650
2,5152,901
1.20.631.10.770.87
0.99 1.4
2,8008,0004,4502,9005,100
1,4007,300
249

Table 3.--Transmissivity values of the San Andres-Glorieta aquifer1 In the study area
EXPLANATION
[Geohydrologic unit: 313SADG, San Andres Limestone and Glorieta Sandstone,undivided; 310GLRT, Glorieta Sandstone. USGS, U.S. Geological Survey;
PHS, Public Health Service; SEO, New Mexico State Engineer Office]
Well location
6N. 10W. 7. 14138N.6W.20.3338N.8W.25.4239N.5W.12.4429N.6W.16.111
9N.9W.28.134ION. 9W. 25. 324UN. 5W. 14. 241UN. 10W. 8. 122UN. 10W. 8. 221
12N.10W.8.31412N.10W.18.31112N.10W.18.31212N.10W.23.23312N.10W.30.412
12N.10W.30.42112N.10W.32.11112N.11W.10.33412N.11W.10.34412N.11W.10.431
12N.11W.15.21112N.11W.24.23312N.11W.24.23412N.11W.24.41112N.11W.24.411
Geo hydro logic unit
313SADGdo.do.do.do.
do.do.do.do.do.
310GLRT310GLRT310GLRT313SADG
do.
do.do.do.do.do.
do.do.do.do.do.
Trans - missivity
(feet squared per day)
701002510500
200,000200,000
5264,000304,000
1004,2003,300
51,000450,000
420,000300,000129,00060,00076,000
57,00066,00020,00026,00055,000
Source of data
USGSUSGSUSGSRisser and Lyford, 1983USGS
USGSUSGS (estimated from flow rate)Risser and Lyford, 1983Geohydrology Associates, Inc.,Geohydrology Associates, Inc.,
West, 1972Dames and Moore, 1981Dames and Moore, 1981Dames and Moore, 1981Gordon, 1961, table 4
Gordon, 1961, table 4Gordon, 1961, table 4Geohydrology Associates, Inc.,Geohydrology Associates, Inc.,Geohydrology Associates, Inc.,
Geohydrology Associates, Inc.,Dames and Moore, 1981Dames and Moore, 1981Dames and Moore, 1981Dames and Moore, 1981
19841984
198419841984
1984
250

Table 3.--Transmissivity values of the San Andres-Glorieta aquifer in the study area-Concluded
Well location
Geo-hydro -logicunit
Trans -missivity
(feetsquaredper day) Source of data
12N.11W.26.24413N.11W.33.33213N.12W.5.31414N.10W.22.41414N.12W.23.324
14N.12W.23.333 14N.13W.19.121 14N.13W.19.224 14N.13W.33.143 14N.14W.28.111
14N.15W.4.113 14N.15W.4.143 14N.15W.14.342 14N.15W.17.441
313SADG 61,000 Gordon, 1961, table 4310GLRT 24,000 Geohydrology Associates, Inc., 1983313SADG 220 PHS, unpublished data313SADG 850 Jacob, 1956310GLRT 70 SEO, unpublished data
310GLRT 60 SEO, unpublished data313SADG 140 PHS, unpublished data
do. 80 PHS, unpublished datado. 30 Geohydrology Associates, Inc., 1981do. 55 Geohydrology Associates, Inc., 1981
do. 140 Geohydrology Associates, Inc., 1981do. 280 Geohydrology Associates, Inc., 1981do. 140 Geohydrology Associates, Inc., 1981do. 110 Geohydrology Associates, Inc., 1981
251

Table 4.--Storage coefficients calculated from four aquifer tests
Pumped Observation well well
12N.10W.30.412 12N. 10W. 30 .421
Storage coefficient
5 .2 X10" 4
Source of data
Gordon, 1961
Rocks tested
San Andres
Limestone
12N.
12N.
12N.
12N.
12N.
12N.
12N.
12N.llW.24.233a 12N.
12N.llW.24.233b 12N.
10W.
10W.
10W.
10W.
10W.
10W.
10W.
11W.
11W.
30
30
30
32
32
32
32
24
24
.421
.421
.421
.111
.111
.111
.111
.411
.233c
4
4
4
1
9
8
1
1
3
.7
.2
.2
.4
.7
.1
.1
.3
.2
X
X
X
X
X
X
X
X
X
10"
10"
10"
10"
10"
10"
10"
10"
10"
4
4
4
3
4
4
3
4
4
do.
do.
do.
do.
do.
do.
do.
Dames and
Moore, 1981
do.
Do
Do
Do
Do
Do
Do
Do
San Andres
Limestone
Glorieta
Sandstone
12N.
12N.
12N.
12N.
12N.
12N.10W.18.312a 12N.
12N.
12N.
11W.
11W.
11W.
11W.
11W.
10W.
10W.
10W.
24
24
24
24
24
18
18
18
.233c
.233a
.233a
.411
.411
.312b
.311
.311
6
1
1
1
8
5
8
2
.0
.4
.2
.3
.1
.3
.9
.8
X
X
X
X
X
X
X
X
10"
10"
10"
10"
10"
10"
10"
10"
5
2
2
3
4
5
5
4
do.
do.
do.
do.
do.
do.
do.
do.
Do
Do
Do
Do
Do
Do
Do
Do
252

Table 5.--Ground-water withdrawals for 1945-57 and 1979-82 in the Grants-Bluewater area
Year
Ground-waterwithdrawals(acre-feet) Year
Ground-waterwithdrawals(acre-feet)
19451946194719481949
1950195119521953
3,7009,20010,5009,5007,125
12,05012,50010,97013,320
1954195519561957
1979198019811982
14,08013,60014,21012,800
6,7007,0005,9003,900
Table 6.--Lithology percentages for Pennsylvanian rocks and the Yeso and Abo Formations in the study area
Sandstone Siltstone-shale Carbonates Evaporites
Pennsylvanian 10
Yeso and Abo 34 Formations
42
50
48
7
253

Table 7. Selected water analyses from wells in the Thoreau area
EXPLANATION
Local identifier: see text for explanation. Station number: the first six numbers arethe latitude, the next seven numbers are the longitude, and the last two numbers
are the sequence number. Geologic unit indicates source of water: 310GLRT,Permian Glorieta Sandstone; 313SADG, Permian San Andres Limestone and
Glorieta Sandstone, undivided; 313SADY, Permian San Andres Limestone andYeso Formation, undivided. nS/cm, microsiemens per centimeter at 25 degrees
Celsius; deg C, degrees Celsius measured onsite; mg/L, milligrams per liter; |ig/L, micrograms per liter; E, estimated; <, less than; >, greater than; bicarbonate or carbonate wh wat total field, bicarbonate or carbonate whole water sample, not
filtered, done onsite; , no data.
254

Tab
le 7
. Sel
ecte
d w
ater
ana
lyse
s fr
om w
ells
in th
e Th
orea
u ar
ea C
onti
nued
Local
identifier
12N
12N
12N
12N
12N
13N
13N
13N
13N
13N
13N
13N
13N
14N
14N
14N
.12W
.12W
.12W
.12W
.12W
.11W
.12W
.13W
.13W
.13W
.13W
.13W
.14W
.13W
.13W
.13W
.4.
.6.
.8.
.17
.17
.17
.34
.1.
.8.
.22
.27
.28
.5.
.19
.20
.2722
4400
230
.122
.200
.123
.332
222
444
.133
3
.400
.131
311
.100
.4322
.342A
Station
number
351806108060301
351746108080801
351716108072401
351641108073601
351604108075001
352135108014801
351830108060601
352329108093401
352155108134701
352037108123701
351919108115101
351954108133201
352308108210701
352600108153201
352532108140001
352438108121501
Date
08-17-63
08-09-62
08-07-62
08-19-62
06-26-63
08-19-62
06-26-63
08-30-64
03-07-86
09-04-62
08-04-61
12-11-62
08-20-63
07-19-61
07-25-86
09-04-85
06-26-63
09-04-62
12-11-62
05-29-63
03-20-64
07-14-70
03-13-75
12-06-67
04-07-72
Geologic
unit
310GLRT
313SADG
310GLRT
310GLRT
310GLRT
313SADG
do.
do.
do.
do.
do.
do.
do.
do.
310GLRT
310GLRT
313SADG
310GLRT
310GLRT
313SADG
310GLRT
310GLRT
310GLRT
313SADY
313SADY
Depth
o f
we 1 1 ,
total
(feet)
__ 105
222
790
250
566
422
398
398
175
130
130
1,710
1,710
1,220
1,22
0
Spe
cific
con
duct
ance
(JiS/cm)
770
1,390
721
755
755
1,11
01,
170
647
1,33
01,120
905
901
903
529
725
762
481
479
476
490
687
1,000
480
1,000
1,03
0
pH
(sta
nd
ard
units)
7 7 7 7 7 7 7 7 7 7 7 7 7 7 7 7 7 7 8 7 8 8 7 7
.60
.40
.50
.40
.50
.20
.30
.40
.10
.80
.40
.80
.70
.30
.48
.50
.50
.90
.00
.30
.20
.50
.40
.50
Water
temper
atur
e(d
eg C)
13.0
16.0 16.5 __ 15.5 -- 18.5
13.0
19.0
18.5
19.5
17.0
12.5
12.5
11.5
11.5
11.5 16.5
20.0

Tab
le 7
.~Se
lect
ed w
ater
ana
lyse
s fr
om w
ells
in th
e Th
orea
u ar
ea C
onti
nu
ed
Local
identifier
12N.12W.
12N.12W.
12N.12W.
12N.12W.
12N.12W.
13N.11N.
13N.12W.
13N.13W.
13N.13W.
13N.13W.
13N.13W.
13N.13W.
13N.14W.
14N.13W.
14N.13W.
14N.13W.
04
06
08 17 17 17 34 01 08 22 27 28 05 19 20 27
.224
.400
.2
30
.122
.200
.123
.332
.222
.444
.1333
.400
.131
.311
.100
.4322
.342A
Calcium,
dis
solved
(mg/L
as Ca)
100
260 99
110
120
180
190 82
180
160
130
130
120 78 62 63 87 76 76 67 10 31 44
180
180
Magne
sium,
dis
solved
(mg/L
as Mg)
37
45
35
35 28 48 57 29 76 60 33 32 38 19 20 20 11 15 14 14 2.4
14 5.1
29 28
Sodi
um,
dis
solved
(mg/
L as Na
)
8.1
9.9
14 40 27 28
9.5
79 77
7.4
8.0
20 __ 170 43 106.
9
Sodium +
potas
sium
, dis
solved
(mg/L
as Na
)
12
12 10 15 42 20 28 23 10 78
9 2
150 44
Potas
sium
, dis
solved
{mg/L
as K) 1. 1. 1. 3. 2. 1. 1. 0. 1. 1. 0. 0. 1. __
>0. 2.
>0.
>0.
0 0 0 1 0 7 9 8 7 7 9 9 0 0 5 0 0
Bicar
bona
te,
wh wat
total,
field
(mg/
L as
HC0
3) 230
300
270
290
290
300
300
290
228
280
250
250
250
260
280
296
290 3
270
260
240
220
270
250
250
Car
bona
te,
wh wa
t total,
field
(mg/L
as
C03) 0 0 0 0 0 0 0 0 0 0 0 0 0 __ 0 0 0 0 0 8 >0 >0
Sulfate,
dis
solved
(mg/L
as S0
4)
220
580
170
390 87
680
420
290
300
290 63
150
150 32 33 48 92 72 40
360
360

Tab
le 7
. Sel
ecte
d w
ater
ana
lyse
s fr
om w
ells
in
the
Thor
eau
area
Con
tinu
ed
Local
identifier
12N.12W
12N.12W
12N.12W
12N.12W
12N.12W
13N.11N
13N.12W
13N.13W
13N.13W
13N.13W
13N.13W
13N.13W
13N.14W
14N.13W
14N.13W
14N.13W
.4.
.6.
.8.
.17
.17
.17
.34
.1.
.8.
.22
.27
.28
.5.
.19
.20
.2722
440
0 230
.122
.200
.123
.332
222
444
.133
3
.400
.131
311
.100
.4322
.342A
Chlo
ride
, dis
solved
(mg/
L as CD
813 149
12 11 133 8 3 6 4 8 6 6 8 6 9 4
4415
0 317 10
.0 .2 .8 .1 .8 .4 .8 .0 .5 .5 .4 .9 .6 .6 .8
Fluo-
ride
, dis
solved
(mg/L
as F)
0.
0.- 0. - 0. 0. 0. 0. 0. 0. 0. 0. 0.-
0. 0. 0. 0. 0. 0. 0. 0.
0 1 - 1 - 6 4 6 4 7 4 3 5 6 - 4 4 1 8 3 3 3 3
Sili
ca,
Bromide,
dis-
dis-
solved
solved
(mg/
L (mg/L
as
as Br)
Si02)
10
18
9.9
10__
8.1
0.05
9.1
12 15 11 11 160.
1 9.8
0.082
9.5
16 14 12
7.1
__
9.5
Nitro-
Nitro
gen,
gen,
nitrate,
N02 +N03
, dis-
dis
solved
solved
(mg/
L (m
g/L
as N)
as
N)
0.
0. 0.-
0.-
1.-
0. 0. 0. 0. 0.- _ -
0. 0. 0. 0. 0.- -
0.
02
07 43 - 54 _ 30<0.10
02 02 00 00 09<0.10
_ __
_ 18 16 09 00 270.
02_ 03
Boron,
dis
solved
as B)
110 50
100
90 90140
100 90
90 80 90
20 60 80
__ 300
>0120
Iron
, dis
solved
as Fe
) 0
1098
0 0 050
102,100
2,000
200
20
_
>0<1
0140 >0

Tab
le 7
. Se
lect
ed w
ater
ana
lyse
s fr
om w
ells
in
the
Thor
eau
are
a C
onti
nued
Local
identifier
14N
14N
14N
14N
14N
14N
15N
15N
15N
15N
.13W.
.13W.
.14W
.
.15W
..1
5W.
.15W
..1
2W.
.13W
.
.15W.
.15W.
27 33 18 1. 14 28 17 25 18 18
.342A
.334
1
.000
3134
.3423
.1434
.111
.142
3 W Nuclear R
.3313
.3344
Station
number
352438108121501
352338108133101
352638108214801
352811108230601
352620108235001
352454108260101
353212108081701
353017108100401
353135108283001
353126108281801
Date
03-13-75
07-19-61
03-13-75
03-13-75
05-24-56
01-20-50
01-20-50
12-07-50
12-06-75
02-08-77
02-24-82
09-06-85
06-22-55
06-15-66
08-01-68
11-06-69
07-01-70
12-08-70
03-16-72
Geologic
unit
313SADY
313SADG
313SADG
313SADG
3 13 SAD
Y
313SADG
313SADG
313SADG
313SADG
313SADG
313SADG
do.
do.
do.
do.
do.
do.
do.
do.
Depth
of we
ll,
total
(feet)
__
870
870
800
792
El, 50
0900
370
1,62
0
3,10
23,10
21,610
__ 1,370
Spe
cific
con
duct
ance
(H.S/cm)
1,020
563
581
549
853
881
801
960
1,31
0
470
1,190
1,18
0
1,19
01,190
1,14
01,
170
pH
(sta
nd
ard
units)
7 7 7 7 9 7 7 7 7 7 7 7 7
.30
.40
.40
.70
.30
.40
.60
.30
.50
.70
.20
.70
.90
Water
temper
atur
e(d
eg C)
19.0 16.0
18.5 __
20.0
18.0
15.5 __

Tab
le 7
.-Se
lect
ed w
ater
ana
lyse
s fro
m w
ells
in th
e Th
orea
u ar
ea C
ontin
ued
Local
identifier
14N.13W
14N.13W
14N.14W
14N.15W
14N.15W
14N.15W
15N.12W
15N.13W
15N.15W
15N.15W
.27
.33
.18
.01
.14
.28
.17
.25
.18
.18
.342A
.334
1
.000
.313
4.3
423
.1434
.111
.1423 W Nuclear R
.3313
.334
4
Calcium,
dis
solved
(mg/L
as Ca
)
150 90 91 75
130
140
130 546.G
50 4918
0170
190
190
190
190
190
Magne
sium,
dis
solved
(mg/L
as Mg)
28 15 16 25 38 41 36 18 >0.0
18 20 55 35 35 38 38 38 37
Sodi
um,
dis
solved
(mg/L
as Na
)
11 10 10 __
130
270 13 15 34 24 22 27 27 25
Sodium +
potas
sium
, dis
solved
(mg/L
as Na
)
12 11 __
7.0
7.0
3.0
3.0
272
15 14 -- 27
Potas
sium,
dis
solved
(mg/L
as
1 1 1 - _ - -
>0
2 2 - -
>0
2>00
>0
K) .8 .2 .4 - _ - - .0 3.0
.9 .7 - - .0 .0 .0 .1 .0
Bicar
bona
te,
wh wa
t total,
field
(mg/L
asHC
O3) 180
280
280
290
260
280
280
180 220
190
240
170
210
240
230 42
240
Car
bonate,
wh wa
t total,
field
(mg/L
asC03) 0 0
_
0 0 8 24
__
0 6>0 >0 >0 >0 >0
Sulfate,
dis
solved
(mg/L
as SO
4)
350 72 85 61
270
280
230
300 220
84 7849
0460
480
460
410
450
460

Tab
le 7
. Sel
ecte
d w
ater
ana
lyse
s fro
m w
ells
in th
e Th
orea
u ar
ea C
oncl
uded
Local
identifier
14N.13W.
14N.13W.
14N.14W.
14N.15W.
14N.15W.
14N.15W.
15N.12W.
15N.13W.
15N.15W.
15N.15W.
27 33 18 1. 14 28 17 25 18 18
.342
A.3341
.000
3134
.3423
.1434
.111
.1423
W Nuclear R
.3313
.3344
Chlo
ride,
dis
solved
(mg/
L as Cl
)
4. 4. 4. 4. 6. 6. 6. 1.130 2. 2. 6. 3.10
9. 7.140 9.
8 8 7 0 0 0 0 8 9 5 0 5 9 0 9
Fluo-
ride,
dis
solved
(mg/
L as F)
0. 0. 0. 0. 0. 0. 0. 0. 2. 0. 0. 0. 0. 0. 0. 0. 0. 0.
4 2 1 6 2 0 1 5 7 5 3 2 3 3 3 2 2 4
Sili
ca,
Bromide,
dis-
dis-
solved
solved
(mg/L
(mg/
L as
as Br)
Si02)
16 13
9.7
6.7
__
__
17
150.029
15 13__
____ __
Nitro
gen,
nitrate,
dis
solved
(mg/
L as
N)
0 0 0 0 0 0 0 0 0 0 0 0
__ .00
.05
.11
.07
.11
.03
__ .00
.20
.06
.03
.14
.14
Nitro
gen,
N02 +N03
, Boron,
dis-
dis
solved
solved
(mg/
L (Hg/L
as N)
as
B)
0.08
' ~
110
<0.1
0
__
__ __1,400
<0.0
9<0
.10
40__
>0 50 50220 >0
160
Iron,
dis
solved
as Fe)
<10 10 200
__
1,90
0360
1,500
1,10
0
70 80
110 70 70 >0

Table S. Selected water analyses from wells and springs in the Grants-Bluewater area
EXPLANATION
Local identifier: see text for explanation. Station number: the first six numbers arethe latitude, the next seven numbers are the longitude, and the last two numbers
are the sequence number. Geologic unit indicates source of water: 313SADG,Permian San Andres Limestone and Glorieta Sandstone, undivided; 110AVMB,Alluvium, bolson deposits, and other surface deposits; 111MCCR, QuaternaryMcCartys basalt flow; 313SADR, Permian San Andres Limestone; 310GLRT,
Permian Glorieta Sandstone. nS/cm, microsiemens per centimeter at 25 degreesCelsius; deg C, degrees Celsius measured onsite; mg/L, milligrams per liter;
Hg/L, micrograms per liter; E, estimated; <, less than; >, greater than; bicarbonate or carbonate wh wat total field, bicarbonate or carbonate whole water sample, not
filtered, done onsite; --, no data.
261

Tab
le 8
. Sel
ecte
d w
ater
ana
lyse
s fro
m w
ells
and
spri
ngs
in th
e G
rant
s-B
luew
ater
are
a C
onti
nued
Local
identifier
9N. 10W. 10. 414
9N. 10W. 15. 212
ION. 10W. 3.
423 Ojo del
Gallo
10N.10W.3.433A
10N.10W.3.433B
ION. 10W. 26
. 33
1
UN. 10W. 4.
211
UN. 10W. 4.
333
Station
number
Date
350111107523501
03-05-86
350053107523301
03-05-86
350720107523201
07-12-46
06-06-84
10-09-84
09-05-85
350719107523101
05-07-57
06-26-62
08-17-63
350719107523102
06-26-62
08-17-63
03-11-65
11-18-86
350346107521201
06-15-55
06-07-57
05-15-58
06-26-62
08-17-63
08-19-63
10-13-64
351104107534701
08-05-48
08-10-53
06-15-55
07-17-56
06-07-57
07-29-68
351216107541701
12-11-62
06-26-63
08-23-66
07-16-80
Geologic
unit
313SADG
do.
do.
do.
do.
do.
do.
do.
do.
do.
do.
do.
do.
do.
do.
do.
do.
do.
do.
do.
do.
do.
do.
do.
do.
do.
do.
do.
do.
do.
Depth
of well,
total
(feet)
105
164 -- __
E130
148
148
148
150
150
150
216
216
216
216
216
216
216
315
315
315
315
315
315
150
198
198
198
Spe
cific
con
duct
ance
(^.S
/cm)
575
420
1,070
1,490
1,430
1,040
977
1,070
977
1,070
1,240
1,300
1,100
1,320
1,110
1,140
1,150
1,150
1,180
972
1,040
1,070
1,050
1,300
1,240
1,010
966
1,030
1,220
PH
(sta
nd
ard
units)
7.26
7.40 7.10 6.90
7.40
7.60
7.30
7.60
7.30
7.30
6.99
7.20
7.60
7.40
7.20
7.40
7.30
7.40 7.30
7.50
7.60
7.80
7.90
7.60
7.60
Water
temper
ature
(deg
C)
16.0
15.5
16.0
14.5 17.0 1.5
18.0
16.5
18.0
16.5
24.5 17.0
16.0 17.0
17.0
17.0
__ 14.5
14.5
15.0
18.0
15.0
21.5

Tab
le S
. Sel
ecte
d w
ater
ana
lyse
s fro
m w
ells
in th
e G
rant
s-B
luew
ater
are
a C
onti
nued
Local
identifier
9N. 10W. 10. 414
9N. 10W. 15.
212
ION.
10W. 3. 423 Ojo de
l Gallo
10N.10W.3.433A
10N.10W.3.433B
ION.
10W
. 26
. 33
1
UN. 10W. 4.
211
UN. 10W
. 4.
333
Calcium,
dis
solved
(mg/L
as Ca)
52 3911
0150
130
110
110
110
110
110
130
140
110
__ 130
120
120
__ 150
140
130
140
Magne
sium,
dis
solved
(mg/L
as Mg
)
18 13 41 47 44 39 33 39 33 39 39 47 42 __ 32 41 41 __ 46 32 31 34
Sodi
um,
dis
solved
(mg/L
as Na
)
40 37 ~
130
120 65 65 __
120 72 75 ~ __ 44 ~
Sodium +
potas
sium,
dis
solved
(mg/L
as Na)
_.
76 :: .. 72--
74
74 94
75 >0 76 ~
73 ~
54
65~ ~
41
Potas
sium
,dis
solved
(mg/
Las K)
3.3
2.8
6.6
6.2
~ 4.6
5.0
__ 5.9
-- 4.0
5.0
__ 3.4
Bicar
bona
te,
wh wa
ttotal,
field
(mg/L
asHC03)
265
215
320
"""" 376
320
E310
320
310
320
350
385
310
320
320
290
290
290
300
300
300
300
290
280
290
260
260
260
Car
bona
te,
wh wa
ttotal,
field
(mg/L
asC03)
..
0 :: ._ 0 0 0 0 0 0 0 0 0 0 0 0 0 0 0 0 0 0 0 0 0 0
Sulfate,
dis
solved
(mg/L
as S0
4)
48 19210
400
340
250
220
250
220
250
300
370
250
250
260
250
260
270
-- 290
280
370
280
280
261

Tab
le ^
. Sel
ecte
d w
ater
ana
lyes
from
wel
ls in
the
Gra
nts-
Blu
ewat
er a
rea
Con
tinu
ed
Local
identifier
9N. 10W. 10.
414
9N. 10W. 15. 212
ION. 10W. 3. 423
Ojo de
l Gallo
10N.10W.3.433A
10N.10W.3.433B
ION. 10W. 26. 331
UN. 10W. 4.
211
UN. 10W. 4.
333
Chlo
ride,
dis
solved
(mg/L
as Cl
)
19 14 44
110 80 42 40 46 40 46 60 80 60 56 63 78 79
77 80 28 31 33 31 31 41 30 26 26 18
Fluo-
ride,
Bromide,
dis-
dis
solved
solved
(mg/L
(mg/
L as F)
as Br)
0.9
1.1
0.065
0.7
0.5
0.5
0.25
0.4
0.6 __
0.6 0.5
0.5
0.27
0.8 __
__
0.6
0.6
0.6 __
____ __
0.5
0.6 0.3
Sili
ca,
dis
solved
(mg/L
as
Si02)
24 29 18 17 20 18 19 18 19 18 18 21 __ 23 21 20 __ 19 25 24
Nitro
gen,
nitrate,
dis
solved
(mg/L
as N)
__
1.20 __ 0.88
1.10
0.86
1.10
0.86
0.90 0.61
0.63
0.61
0.77
0.68
0.
700.81 __ 3.20
3.80
4.10
6.80 7.50
1.70
Nitro
gen,
N02 +N03
, Boron,
dis-
dis
solved
solved
(mg/L
(Jig
/L
as N)
as B)
1.10
<0.10
90
0.20
460
420
__
240
240
__
_ 1.30
450
240
__
__ 240
--
-- 270
_
__
40
__ 150
160
7.50
Iron,
dis
solved
(jig/L
as Fe
)
<3 <3
9
<3 400
40
020 21 __ 10 __ -- -- __
0

Tab
le S
. Sel
ecte
d w
ater
ana
lyse
s fro
m w
ells
and
spr
ings
in th
e G
rant
s-B
luew
ater
are
a C
onti
nued
Local
identifier
UN.
UN.
UN.
UN.
UN.
UN.
UN.
UN.
UN.
UN.
UN.
UN.
UN.
UN.
UN.
UN.
low.
10W.
low.
10W.
10W.
10W.
low.
10W.
10W.
10W.
10W.
10W.
10W.
low.
4.333
5.321
6.212
8.111
9.221
9.221
12.411
16.121
16.121A
22.443
26.321
26.321A
26.321B
26.321C
10W. 27. 211
10W.27.232
Station
number
351216107541701
351211107532901
351210107534501
351122107535901
351122107535902
350909107515301
350908107515701
350908107515702
350909107515304
350939107534701
350926107523401
Date
03-06-86
07-16-80
07-17-80
07-24-80
07-11-46
07-19-56
06-07-57
06-26-62
07-22-80
07-25-80
07-12-46
09-00-51
08-11-53
07-17-56
08-15-62
08-19-63
08-22-66
07-29-68
07-17-56
07-24-80
05-07-57
10-21-44
06-15-55
12-16-33
06-12-58
06-27-58
12-15-58
12-11-62
08-19-63
10-13-64
Geologic
unit
313SADG
do.
do.
do.
do.
do.
do.
do.
do.
do.
do.
do.
do.
do.
do.
do.
do.
do.
do.
do.
110AVMB
111MCCR
111MCCR
313SADR
313SADR
313SADG
313SADG
313SADG
313SADG
313SADG
Depth
of well,
total
(fee
t)
198
195
286
150
480
480
480
480
150
155
155
155
155
180
155
180
155
180
367 __
E100
245
245
245
E250
250
Spe
cific
con
duct
ance
(H.S/cm)
1,150
838
671
556
856
1,030
1,290
1,080
1,270
552
872
801
799
812
805
824
826
837
812
820
1,170
863
1,070
2,210
2,110
1,880
954
980
984
pH
(stand
ard
units)
6.- - - -
7. 7. 7.- - _ - -
7. 7. 7. 8. 7. 7.-
7.-
7.-
7. 6. 7. 7. 7. 7.
99 - - - - 60 50 30 - - _ - - 60 80 60 20
50 60 - 40 - 40 - 00 90 00 70 40 30
Water
temper
ature
(deg
C)
13- - -
13 13 15 13- - 13 13-
13 13 14 21 18 13-
15-
15-
19
_
22 16 16 17
.5 .0 .5 .0 .5 - - .0 .0 - .5 .5 .0 .0 .0 .5 - .5 - .0 - .5 _ .5 .5 .5 .0

Tab
le S
. Sel
ecte
d w
ater
ana
lyse
s fro
m w
ells
in th
e G
rant
s-B
luew
ater
are
a C
onti
nu
ed
11N.10W
11N.10W
UN. 10W
UN. 10W
UN. 10W
11N.10W
UN. 10W
UN. 10W
UN. 10W
UN. 10W
UN. 10W
UN. 10W
UN. 10W
UN. 10W
UN. 10W
Local
identifier
.4.333
.5.321
.6.212
.8.111
.9.2
21
.12.
411
.16.
121
.22.
443
.26.
321
.16.121A
.26.321A
.26.321B
.26.321C
.27.
211
.27.
232
Calcium,
dis
solved
(mg/L
as Ca)
140
-- 100
__ 140
-- 110
110
100 96
100
_- 9712
013
021
0
__ 180
110
Magne
sium,
Sodi
um,
dis-
dis
solved
solved
(mg/
L (mg/L
as Mg)
as Na)
36
66 31 __
31
62 30 __ 27 31 31 32 __ __ 32 38 46 62
57 32
62
Sodium +
potas
sium
,dis
solved
(mg/
Las
Na)
51 62-- ~
45
35 34 35 37 34
77~
52 67120
280
240
190
61 63
Bicar-
Potas-
bona
te,
sium
, wh wa
tdis-
tota
l,solved
field
(mg/
L (mg/L
asas K)
HC03)
3.4
342
__
290
280
290
4.0
280
270
270
270
270
260
260
260
260
350
35
270
290
330
370
580
540
470
4.0
290
300
300
Car
bona
te,
wh wat
tota
l,fi
eld
(mg/
L as
C03)
._
0 0 0 0 0 0 0 0 0 0 0 0
_
0 0 0 0 0 0 0 0 0 0 0
Sulfate,
dis
solved
(mg/
Las SO
4)
300
240
153
115
210
280
290
300
400
115
220
190
190
190
190
190
260
280
190
200
260
350
610
560
500
240
240
240

Tab
le ^
. Sel
ecte
d w
ater
ana
lyse
s fro
m w
ells
in th
e G
rant
s-B
luew
ater
are
a C
onti
nued
UN. 10W
UN. 10W
UN. 10W
UN. 10W
UN. 10W
UN. 10W
UN. 10W
UN. 10W
UN. 10W
UN. 10W
UN. 10W
UN. 10W
UN. 10W
UN. 10W
UN. 10W
UN. 10W
Local
identifier
.4.333
.5.321
.6.212
.8.111
.9.221
.9.221
.12.
411
.16.
121
.16.121A
.22.
443
.26.
321
.26.321A
.26.321B
.26.321C
.27.
211
.27.
232
Chlo
ride
, dis
solved
(mg/L
as Cl)
33 197.7
5.0
20 29 29 34 39 <3 16 17 18 18 22 20 20 22 18 30 53 27 41 7520
0
160
130 33 33 32
Fluo-
ride,
Bromide,
dis-
dis
solved
solved
(mg/L
(mg/
L as
F)
as Br)
0.3
0.23
__ __ __ 0.7 __
0.6 __
0.7 __ __ __
0.3
0.4
0.4
0.4 __
0.3
0.6 __ 0.6
0.2
0.8
0.5
Sili
ca,
dis
solved
(mg/L
as
Si02)
26 -- -- -- -- 28 -- -- -- 22 21 20 21 -- 28 18 15 16 20 --
Nitro
gen,
nitrate,
dis
solved
(mg/
L as N)
_
1.<0. 0. 1. 2. 2. 5. 3. 0. 6.- -
2. 3. 3. 3. 3. 2. 0. 0. 1. 0. 0. 0.
_
0. 1. 0. 0.
_ 90 10 50 60 30 30 20 20 20 10 - - 90 40 20 20 60 90 80 70 30 86 09 02 _ 23 00 88 99
Nitro
gen,
N02 +N
03
, Bo
ron,
Ir
on,
dis-
dis-
dis
solved
solved
solved
(mg/
L (f
lg/L
(J
lg/L
as
N)
as
B)
as Fe
)
4.30
16
0 21
__ __
2.20
70
160
0__
50 50__ __
150
0
__
__ 260
__
70 __ __ __
240
0__ __

Tab
le 8
.-Se
lect
ed w
ater
nal
yses
from
wel
ls a
nd s
prin
gs in
the
Gra
nts-
Blu
ewat
er a
mi C
onti
nued
UN.
UN.
12N.
12N.
12N.
12N.
12N.
12N.
12N.
12N.
12N.
12N.
12N.
12N.
12N.
Local
identifier
10W. 27.
242
Grants City
10W.
34. 134
10W.
7. 143
10W. 8. 300
10W. 8. 314
10W. 17. 424
10W. 18. 312
10W.
19. 224
10W. 20. 333
10W.
23.
233
10W.
26. 242
10W.
26.
243
10W.
26.
322
2
10W.26.322A
10W.
27.
333
Station
number
Date
350925107522801
03-11-65
07-24-80
11-19-86
07-12-80
351704107560601
06-27-56
351649107551101
02-03-59
03-15-60
351653107551401
01-17-59
01-21-59
01-28-59
02-03-59
02-03-59
02-05-59
02-18-59
04-22-59
10-24-80
01-28-81
01-17-81
07-25-80
01-12-81
351519107513901
03-06-86
351433107511601
05-22-58
10-23-80
10-23-80
351422107514501
10-15-56
10-15-56
351407107520101
10-15-56
10-15-56
09-02-57
351402107531901
10-06-54
Geologic
unit
313SADG
do.
do.
do.
do.
do.
do.
310GLRT
do.
do.
do.
do.
do.
do.
do.
313SADG
313SADG
313SADG
313SADG
313SADG
313SADR
313SADG
do.
do.
do.
do.
do.
do.
do.
do.
Depth
of we
ll,
total
(feet) 300
300
300
250
250
1,51
062
8576
769
1,09
0
1,51
01,
510
1,922
1,830
330
337
355
275
865
865
971
870
1,00
0870
800
800
800
863
551
Spe
cific
con
duct
ance
(US /c
m)
992
1,180
1,10
0576
2,02
0
4,46
02,
220
2,290
3,810
4,37
0
4,41
04,
390
4,45
011
,100
4,36
0
3,070
6,270
2,51
01,220
2,460
1, 900
2,50
02,680
2,34
0
1,810
1,810
1,81
0~
1,430
PH
(sta
nd
ard
units)
7.50 --
7.15
7.10
7.60
7.40
7.40
7.50
7.40
7.40
7.60
7.90
7.20 __ -- --
8.13
7.10 --
7.00 ~
7.00
Water
temper
ature
(deg
C)
__
17.0 --
19.0
16.5 -- 5.5
19.0
19.0
24.0
16.0
24.0 __
14.0
20.0 ~ __

Tab
le S
.-Sel
ecte
d w
ater
ana
lyse
s fro
m w
ells
in th
e G
rant
s-B
luew
ater
are
a-C
ontin
ued
Local
identifier
UN.
UN.
12N.
12N.
12N.
12N.
12N.
12N.
12N.
12N.
12N.
12N.
12N.
12N.
12N.
10W.
10W.
10W.
10W.
10W.
low.
10W.
10W.
low.
10W.
10W.
low.
low.
low.
10W.
27 34 7. 8. 8. 17 18 19 20 23 26
2626
26 27
.242 Grants City
.134
143
300
314
.424
.312
.224
.333
.233
.242
.243
.3222
.322A
.333
Calcium,
dis
solved
(mg/L
as Ca)
110
130
5,800
200
210
470
590
570
300
600
41210
65
65
Magne
sium,
dis
solved
(mg/L
as Mg)
33 40 --
140 63 53
120
140
140 72
140
9.7
74
130
130
Sodium +
potas-
Potas-
Sodium,
sium,
sium,
dis-
dis-
dis
solved
solved
solved
(mg/L
(mg/L
(mg/L
as Na)
as Na)
as K)
62 77
4.9
200
400
8.0
240
--
14200
360
430
__
450
2,800
430
__
__ 400
1.8
300
150
150
110
Bicar
bonate,
wh wat
total,
field
(mg/L as
HCO3)
300
318
500
250
460
570
600
260
270
270
180
290
_ __ 620
470
470
470
380
Car
bonate,
wh wat
total,
field
(mg/L as
C03
)
0
0 0 0 0 0 0 0 0 0 0
__ -- --
0 0 0 0
Sulfate,
dis
solved
(mg/L
as SO4
)
250
280
310 80
550
2,200
660
540
1,400
2,300
2,300
2,300
6,200
2,200
1,290
2,110
940
300
810
690
670
569
669
470
470
470
390

Tab
le 8
.--Se
lect
ed w
ater
ana
lyse
s fro
m w
ells
in th
e G
rant
s-B
luew
ater
are
a C
onti
nued
ro 3
Local
identifier
UN. 10W. 27
. 24
2 Grants City
UN. 10W. 34
. 134
12N.10W.7.143
12N.10W.8.300
12N.10W.8.314
12N.10W.17.424
12N.10W.18.312
12N.10W.19.224
12N.10W.20.333A
12N.10W.23.233
12N.10W.26.242
12N.10W.26.243
12N. 10W. 26
. 32
22
12N.10W.26.322A
12N.10W.27.333
Chlo
ride
,dis
solved
(mg/L
as Cl)
33 50 488.4
130
300
140
110
340
300
300
290
410
300
365
895
205 66
180 43
200
358
139
110
110
110 65
Fluo-
ride,
Bromide,
dis-
dis
solved
solved
(mg/
L (m
g/L
as F)
as Br)
0.5
0.4
0.11
0.2
0.7
0.4
0.4
0.1
0.0
3.8
0.0 __ __
0.8
0.36
0.5
0.7
0.7
Sili
ca,
dis
solved
(mg/
Las
Si02)
19 18 -- 19 13 158.6
18 ~ 209.7
19 10 16 15 15
Nitro
gen,
nitrate,
dis
solved
(mg/L
as N)
0.95
0.70
1.00
0.07
0.00
2.30
0.05
0.16
0.07 0.07
0.50
0.16
6.50
4.80
12.00
4.60
0.10 __
0.27
0.50
0.80
0.72
0.72
2.50
Nitro
gen,
N02 +N03
, Bo
ron,
Ir
on,
dis-
dis-
dis
solved
solved
solved
(mg/
L (Jig/L
(|Ag
/Las N)
as B)
as Fe)
30
1.70
320
3
6079
0 470
__ --
__
_
<0.10
630
7 __

Tab
le S
. Sel
ecte
d w
ater
ana
lyse
s fro
m w
ells
and
spr
ings
in th
e G
rant
s-B
luew
ater
are
a C
onti
nued
12N
12N
12N
12N
12N
12N
12N
12N
12N
12N
12N
12N
12N
Local
identifier
.10W
. 27
. 333
.10W. 27
. 431
.10W
. 27
. 43
11
.10W
. 29
. 434
.10W.29.434A
.10W
. 30
. 11
2
.10W
. 30
. 332
.10W
. 30. 412
.10W. 30
. 42
1
.10W. 30
. 43
3
.10W. 32
. Ill
.10W. 34
. 22
2.10W. 34
. 31
2
Station
number
Date
351402107531901
07-17-56
05-07-57
04-20-65
07-10-80
351407107524401
07-25-56
351358107543901
07-12-46
351358107543902
06-28-56
05-14-58
351447107561701
07-18-56
05-08-57
10-22-80
07-23-80
351423107554601
05-10-46
08-05-48
08-18-49
09-00-51
06-25-52
08-10-55
06-05-56
11-18-80
351419107553101
08-11-53
07-18-56
05-07-57
351402107555001
10-21-44
07-12-80
351354107552401
07-12-46
06-15-55
07-18-56
07-12-80
07-10-80
Geologic
unit
313SADG
313SADG
313SADG
313SADG
313SADG
110AVMB
313SADG
do.
do.
do.
do.
do.
do.
do.
do.
do.
do.
do.
do.
do.
do.
do.
do.
do.
do.
do.
do.
do.
do.
do.
Depth
of well,
total
(fee
t)
550
551
551
584
584
152
398
398
280
280
280
238
225
225
225
225
225
225
225
225
225
245
245
135
135
253
253
253
980
498
Spe
cifi
c co
n
duct
ance
(H.S/cm)
1,45
01,
440
1,530
1,900
1,45
0
765
1,480
1,460
779
835
798
826
1,00
01,100
1,13
0
1,16
01,140
1,15
01,
450
1,20
0
1,16
01,
170
1,100
919
836
1,050
. 1,100
1,040
1,950
1,42
0
PH
(sta
nd
ard
unit
s)
7.30
7.30
7.40 7.30 __ 7.40
7.60
7.70
7.40 __ ~
7.30
7.60
7.50
7.40 __ 7.30
7.50 ~
Water
temper
ature
(deg
C)
15.5
15.5 15.0
13.0
13.0
13.5
15.5 __ 13.0
13.0
13.0
13.5
13.5 -- 13.5
15.0 13.0
13.5 --

Tab
le 8
. Se
lect
ed w
ater
ana
lyse
s fro
m w
ells
in th
e G
rant
s-B
luew
ater
are
a C
onti
nued
Local
identifier
12N.10W.27.333
12N.10W.27.431
12N. 10W. 27
. 4311
12N.10W.29.434
12N.10W.29.434A
12N.10W.30.112
12N.10W.30.332
12N.10W.30.412
12N.10W.30.421
12N.10W.30.433
12N.10W.32.111
12N.10W.34.222
12N.10W.34.312
Magne-
Calcium,
sium
, So
dium
, dis-
dis-
dis
solved
solved
solved
(mg/L
(mg/L
(mg/
L as Ca)
as Mg
) as Na)
__ 170
50
94
26 _
__
__ 13
0 41
__
__
____
98
39 13
0 42
__
Sodium +
potas
sium
, dis
solved
(mg/L
as Na
)
100
110
110
120 40 97 93 32 31
__
29 _ ~
36 86
40 46 51
50
41
Bicar-
Potas-
bona
te,
sium,
wh wa
t dis-
total,
solved
field
(mg/L
(mg/L
as
as K)
HC03)
380
380
350
390
230
260
260
290
290
_
____
250
350
350
340
350
340
350
350
320
320
300
310
290
280
__
Car
bona
te,
wh wat
total,
field
(mg/L
as
C0
3) 0 0 0
0 0 0 0 0 0
_ 0 0 0 0 0 0
0 0 0 0 0 0 0
Sulfate,
dis
solved
(mg/
L as
S0
4)
410
410
450
600
390
190
520
500
130
140
162
230
260
270
390
318
320
280
190
197
270
290
575
414

Tab
le S
. Sel
ecte
d w
ater
ana
lyse
s fro
m w
ells
in th
e G
rant
s-B
luew
ater
are
a C
onti
nued
Local
identifier
12N.10W.27.333
12N.10W.27.431
12N. 10W. 27. 4311
12N.10W.29.434
12N.10W.29.434A
12N.10W.30.112
12N.10W.30.332
12N.10W.30.412
12N.10W.30.421
12N.10W.30.433
12N.10W.32.111
12N.10W.34.222
12N.10W.34.312
Chlo
ride,
dis
solved
(mg/L
as Cl)
65 65 6610
9 72 16 58 58 16 24 18 12 38 38 37 36 38 38 65 41 37 38 36 33 25 32 30 2311
1 61
Nitro-
Nitro-
Fluo-
Sili
ca,
gen,
gen,
ride,
Bromide,
dis-
nitrate,
N02 +N03
,dis-
dis-
solved
dis-
dis
solved
solved
(mg/L
solved
solved
(mg/L
(mg/L
as
(mg/L
(mg/L
as F)
as Br)
Si02)
as
N)
as N)
2.10
2.10
0.5
16
2.90
2.40
1.60
0.5
3.20
7.00
7.20
13.00
1.60
1.70
0.3
7.20
-- __
8.10
__
__
__
__
6.10
5.90
7.20
2.10
0.5
--
4.70
5.00
3.20
1.90
1.30
Boro
n,
Iron
,dis-
dis
solved
solved
(jlg/L
(|Ag
/Las B)
as Fe)
_
__
330
__ __
40 __
_
__
__ __
__
70__
70__

Tab
le 8
. Sel
ecte
d w
ater
ana
lyse
s fro
m w
ells
and
spr
ings
in th
e G
rant
s-B
luew
ater
are
a C
onti
nued
Local
identifier
12N.11W.10.431
12N.11W.12.231
12N.11W.13.1313
12N.11W.15.211
12N.11W.15.321A
12N.11W.22.233
12N.11W.23.231
12N.11W.23.333
12N.11W.24.233
12N.11W.24.334
12N.11W.24.411
Station
number
Date
351644107585901
05-10-46
06-05-47
08-11-53
06-16-55
03-26-81
01-20-81
351633107590301
06-27-56
07-27-56
05-06-57
05-14-58
11-14-80
351608107592101
03-08-48
03-15-48
351517107585501
06-05-47
08-11-53
351526107580001
06-04-47
09-00-51
10-28-52
08-12-53
10-28-53
06-27-56
07-18-56
10-30-80
351454107583101
03-10-65
351518107565601
12-06-55
07-18-56
05-07-57
351453107572101
06-28-56
06-07-57
351513107565301
04-23-52
Geologic
unit
313SADG
do.
do.
do.
do.
do.
313SADR
313SADR
313SADR
313SADR
313SADG
3 13 S ADR
313SADR
313SADG
do.
do.
do.
do.
do.
do.
do.
do.
do.
do.
do.
do.
do.
do.
do.
do.
Depth
of we
ll,
total
(fee
t)
500
248
500
248
575
610
450 --
450
450
138
178
300
300
300
300
300
300
300
300
350
451
386
386
250
250
360
Spe
cific
con
duct
ance
(US /c
m)
1,700
1,88
02,310
2,300
1,81
0
2,380
2,320
2,290
2,430
1,800
645
640
1,52
01,370
794
863
899
925
1,010
997
1,49
01,460
1,270
1,33
01,
590
1,470
1,46
0
PH
(sta
nd
ard
unit
s)
__
7.00 __ 6.90
7.00
7.00 __ _ 7.20
7.20
7.20
7.40
7.30
7.20
7.40
7.20
Water
temper
ature
(deg C)
15.0
15.5 15.0 __
14.5
15.0
15.0 __ __
13.5 __ 14.5
15.0
13.5

Tab
le 8
. Sel
ecte
d w
ater
ana
lyse
s fro
m w
ells
in th
e G
rant
s-B
luew
ater
are
a C
onti
nued
Local
identifier
12N.11W.10.431
12N.11W.12.231
12N.11W.13.1313
12N.11W.15.211
12N.11W.15.321A
12N.11W.22.233
12N.11W.23.231
12N.11W.23.333
12N.11W.24.233
12N.11W.24.334
12N.11W.24.411
Calcium,
dis
solved
(mg/L
as Ca
)
180
__ 270
120
140
140
__ 180
140
160
Magne
sium,
Sodi
um,
dis-
dis
solved
solved
(mg/
L (mg/L
as Mg)
as Na)
47 __ __
_
68 30 __ 32 __ __ __
48 42 49
Sodium +
potas
sium
,dis
solved
(mg/L
as Na
)
160
-- 230
230
220
250
__
9.7
<10 18
9.4
12
12
88 10
013
0 90 8710
0
Bicar-
Potas-
bona
te,
sium,
wh wa
tdis-
tota
l,solved
field
(mg/
L (mg/L
asas K)
HC03)
430
470
540
530
510
520
510
540
_
__ 270
280
160
270
300
290
290
300
290
280
360
350
350
~
' 340
390
410
400
Car
bonate,
wh wa
ttotal,
field
(mg/
L as
C03) 0 0 0 0 __
0 0 0
_ 0 0 0 0 0 0 0
0
0 0 0 0 0 0 0
Sulfate,
dis
solved
(mg/L
as S0
4)
460
520
640
605
680
680
670
740
627
110 97
800
160
160
160
210
490
400
330
350
480
390
380
380

Tab
le S
. Sel
ecte
d w
ater
ana
lyse
s fro
m w
ells
in th
e G
rant
s-B
luew
ater
are
a C
onti
nued
Local
identifier
12N.11W.10.431
12N.11W.12.231
12N.11W.13.1313
12N.11W.15.211
12N.11W.15.321A
12N.11W.22.233
12N.11W.23.231
12N.11W.23.333
12N.11W.24.233
12N.11W.24.334
12N.11W.24.411
Chlo
ride
, dis
solved
(mg/
L as Cl
)
9811
016
016
010
5
180
160
160
160
180 91 11 12 26 12 16 22 20 32 31 63 69 57 60 65 79 75 70
Fluo-
ride,
Bromide,
dis-
dis
solved
solved
(mg/L
(mg/
L as
F)
as Br)
0.3
__ _
____ -
__
__ 0.2 ::
::.. 0.6
0.5
0.5
Nitro-
Nitro-
Sili
ca,
gen,
gen,
dis-
nitrate,
N02 +N0
3 ,
Boro
n,
Iron
, solved
dis-
dis-
dis-
dis-
(mg/
L solved
solved
solved
solved
as
(mg/
L (m
g/L
(flg/L
(p.g
/L
Si02)
as
N)
as
N)
as B)
as Fe
)
0.81
1.00
0.30
1.60
__
1.50
1,20
0
1.00
<100
<100
0.09
4.10
__
23
11.0
0--
--
17.0
017.00
7.30
16
6.80
100
15
4.30
13.0
02.90
3.40
15
3.40

Tab
le 8
. Sel
ecte
d w
ater
ana
lyse
s fr
om w
ells
and
spr
ings
in th
e G
rant
s-B
luew
ater
are
a C
onti
nued
Local
identifier
12N
12N
12N
12N
12N
12N
14N
14N
.11W.24
.11W.25
.11W.25
.11W.25
.11W.25
.11W.26
.10W. 22
.10W. 22
.411
.122
.211
.213
.214
.234
.414
.424
Station
number
Date
351513107565301
12-06-55
06-04-56
07-18-56
05-07-57
05-14-58
351546107570201
06-27-56
07-22-80
351439107565401
07-11-46
07-18-56
05-07-57
06-22-62
10-22-80
07-25-80
352532107524901
03-05-86
352531107523401
08-08-62
Geologic
unit
313SADG
do.
do.
do.
do.
do.
do.
do.
do.
do.
do.
do.
do.
313SADR
313SADR
Depth
of well,
total
(feet)
360
360
360
360
360
260
200
236
236 --
236
210
199
3,08
0 ~
Spe
cifi
c co
n-
duct-
ance
(^S/
cm)
1 1 1 1 1 1 1 1 1 1 1 1 1 2 1
,350
,140
,320
,630
,790
,150
,100
,320
,340
,320
,680
,120
,310
,850
,030
PH
(sta
nd
ard
units)
7 7 7 7 7 7 7 7 7 6 7
.50
.40
.40
.50
.30
.40
.40
.20
.00
-- .50
.40
Water
temper
atur
e(deg 13. -- 14.
15.
14. __ 14.
15. __ -- -- 40.
20.
C) 5 5 5 5 0 5 0 5

Tab
le S
. Sel
ecte
d w
ater
ana
lyse
s fro
m w
ells
in th
e G
rant
s-B
luew
ater
are
a C
onti
nued
12N
12N
12N
12N
12N
12N
14N
14N
Local
identifier
.11W.24.411
.11W.25.122
.IIW.25.211
.11W.25.213
.11W.25.214
.11W.26.234
.10W. 22
. 414
.10W. 22. 424
Calcium,
dis
solved
(mg/
Las
Ca)
_ 140
160
150
150
150
180
260 73
Magne
sium
, So
dium
,dis-
dis
solved
solved
(mg/L
(mg/
Las Mg
) as Na)
_
__ 45 56 49 52 49 49
130
79
370
33
Sodium +
potas
sium
,dis
solved
(mg/L
as Na)
__
95140
42__
95 88 84
120
Bicar-
Potas-
bona
te,
sium
, wh
wat
dis-
tota
l,solved
field
(mg/
L (mg/L
asas
K)
HC03)
360
330
350
300
390
330
370
340
340
6.7
340
__ 14
577
320
Car
bona
te,
wh wa
ttotal,
field
(mg/
L as
C03) 0 0 0 0 0 0
0 0 0 0 0
Sulfate,
dis
solved
(mg/
Las S0
4)
360
280
340
520
550
280
280
360
370
350
460
287
360
1,000
280

Tab
le 8
.-Se
lect
ed w
ater
ana
lyse
s fro
m w
ells
in th
e G
rant
s-B
luew
ater
are
a C
oncl
uded
Local
identifier
12N
12N
12N
12N
12N
12N
14N
14N
.11W.
.11W.
.11W.
.11W.
.11W.
.11W.
.10W.
.10W.
24
25
25 25 25 26
22
22
.411
.122
.211
.213
.214
.224
.414
.4
24
Chlo
ride,
dis
solved
(mg/L
as Cl)
63
38
59
68
79
150 36
57 55 54
100 30 48
240 15
Fluo-
ride,
dis
solved
(mg/L
as F)
0.
0.
-
0. 0. 0. 0.- -
0.
0.
3 3 - 6 3 8 8 - - 4 6
Silica,
Bromide,
dis-
dis-
solved
solved
(mg/L
(mg/L
as
as Br)
Si02)
16
20
17 21 19__
0.52
22
21
Nitro
gen,
nitrate,
dis
solved
(mg/L
as N)
4 15
7 2 6 9 6
146 3 0
.10
.00
.90
.60
.60
.00
.10
.00
.00
.20
.02
Nitro
gen,
N02 +N03
, Boron,
dis-
dis
solved
solved
(mg/L
(fig/L
as N)
as B)
--
150
__
330
320
__
<0.10
1,100
130
Iron,
dis
solved
(fig/L
as Fe
)
0
12,000
10

Table 9.-Selected water analyses front wells and springs in the Acoma enibayment area
EXPLANATION
Local identifier: see text for explanation. Station number: the first six numbers arethe latitude, the next seven numbers are the longitude, and the last two numbersare the sequence number. (B) after date indicates that analysis was done by the
U.S. Bureau of Indian Affairs Laboratory-all other analyses done by U.S. Geological Survey. Geologic unit indicates source of water: blank, unknown;
OOOEXRV, extrusive rocks; 110AVMB, Quaternary and Tertiary alluvium;112SNTF, Tertiary Santa Fe Group; 210MCDK, Cretaceous Mancos Shale and
Dakota Sandstone, undivided; 210MNCS, Cretaceous Mancos Shale; 211DKOT,Cretaceous Dakota Sandstone; 211GLLP, Cretaceous Gallup Sandstone;
211MVRD, Cretaceous Mesaverde Group; 221BLFF, Jurassic Bluff Sandstone(former usage; now Horse Mesa Member of Wanakah Formation); 221ENRD,
Jurassic Entrada Sandstone; 221MRSN, Jurassic Morrison Formation; 221TDLT,Jurassic Todilto Limestone Member of Wanakah Formation; 231CHNL, TriassicChinle Formation; 310YESO, Permian Yeso Formation; 313SADG, Permian SanAndres Limestone and Glorieta Sandstone, undivided; 313SADR, Permian SanAndres Limestone; 318ABOU, Permian Abo Sandstone, upper unit; 325MDER,
Pennsylvanian Madera Limestone; 326MGDL, Pennsylvanian Magdalena Group.SP, spring; GW, ground water; SW, surface water; uS/cm, microsiemens per
centimeter at 25 degrees Celsius; deg C, degrees Celsius measured onsite; mg/L,milligrams per liter; ug/L, micrograms per liter; bicarbonate or carbonate wh wattotal field, bicarbonate or carbonate whole water sample, not filtered, done onsite;
* indicates bicarbonate concentration calculated from laboratory alkalinityconcentration; E, estimated; <, less than; --, no data.
280

Tab
le ^
. Sel
ecte
d w
ater
ana
lyse
s fro
m w
ells
and
spr
ings
in th
e A
com
a em
baym
ent a
rea
Con
tinu
ed
Spe-
Depth
cific
of
con-
45 7N 8N 8N 9N 9NION
ION
ION
ION
ION
ION
ION
Rio
.3W.
.2W.
.4W.
. 9W.
.5W.
. 9W.
.3W.
.8W.
. 8W.
.9W.
.9W.
.9W.
8. 31 18 7. 19 28 20 27 29 23 26 26
Local
identifier
241
.14
.300
311
SB-Well
.412
.113
.000
.320
.323 Rio Sa
n Jose
.423 Horace Springs
.433
.434
.10W.27.333A
San
Jose near Grants
s
Station number
345843107100901
344735107052501
345503107181101
345619107505001
345934107541901
345903107480901
345935107103501
350353107402001
350348107423310
350440107450801
350336107452501
350337107452601
350336107531501
08343500
Site
SP SP GWGWGW
GWGWGWSW
SW
SP SP SP SP GWGW GW SW SW SWSWSWSW
Geo
logic
Date
unit
06-14-65
09-02-41
09-29-53
11-30-78
08-23-66
08-10-78
10-08-57
12-18-53
09-11-81
04-26-82
05-13-57
06-26-62
03-11-86
11-13-79 (B)
12-08-50
08-10-78
06-07-57
06-21-72
05-04-76
06-02-76
07-01-76
10-04-76
11-02-76
well,
duct-
tota
l ance
(fee
t)
(uS/
cm)
__ 14
1, __
1, 2,
1, 1, 1, 1, 1,965
165
1, 1,
__
288
090
893
372
556
170
980
1,200
240
170
200
430
510
668
665
000
280
pH
(sta
nd
ard
units)
7.80 7.60
8.10
7.40
7.60
8.30
8.60
8.30
7.90
7.38
8.00 7.60
7.50
7.80
Water
temper
ature
(deg
10.
26.
13. 16.
15.
18.
14.
61.
13.
20.
17.
17. 9.
17.
17.
18.
14.
C) 0 5 0 0 0 5 5 0 5 0 0 5 5 5 0 0 0

Tab
le 9
. Sel
ecte
d w
ater
ana
lyse
s fro
m w
ells
and
spri
ngs
in th
e A
com
a em
baym
ent a
rea
Con
tinu
ed
Local
identifier
4S.3W.8.241
7N.2W.31.14
8N.4W.18.300
8N.9W.7.311 SB-Well
9N.5W.19.412
9N.9W.28.113
ION.
3W. 20. 000
ION.
8W. 27. 320
ION. 8W. 29. 323 Rio San
Jose
ION. 9W.
23. 423
Horace Springs
ION.
9W. 26. 433
ION.
9W. 26. 434
10N.10W.27.333A
Rio San Jose near Grants
Calcium,
dis
solved
(mg/L
as Ca)
43 610 75 83 53
20086
83 79 90 89
102 30 27 93
Magne
sium,
dis
solved
(mg/L
as Mg
)
6.0
270 18 44 23 13037
40 40 37 46 49 14 13 41
Sodi
um,
dis
solved
(mg/L
as Na)
6.5
5,300 64 32 13
0
150 ~ 150
161
100
140
Sodium +
potas
sium
, dis
solved
(mg/
Las Na
)
360
120
120 100 ~ 16 __
Potas
sium,
dis
solved
(mg/
Las
K) 2.5
120 3.
5 2.
0
6.5
6.9
5.9
7.4
2.1
7.1
Bicar
bona
te,
wh wa
t total,
field
(mg/L
asHC03
)
160
1,62
034
0320*
210
210*
340
350 27
0
240
240
250
303
268
290
280*
250
300
Car
bona
te,
wh wa
t to
tal,
fi
eld
(mg/L
asC0
3 )
0 0 0 0
_
0 00
__ 4 0 120
0 0
Sulfate,
dis
solved
(mg/L
as S0
4 )
8.6
5,400
250 22 94
1,100
260
300
290
290
350
353
100
100
200
290

Tab
le 9
. Sel
ecte
d w
ater
ana
lyse
s fro
m w
ells
and
spr
ings
in th
e A
com
a em
baym
ent a
rea
Con
tinu
ed
B
Local
identifier
4S.3W.8.241
7N.2W.31.14
8N.4W.18.300
8N.9W.7.311 SB-Well
9N.5W.19.412
9N.9W.28.113
ION.
3W.
20. 000
ION.
8W.
27. 320
ION.
8W.
29. 323 Ri
o Sa
n Jose
ION.
9W. 23. 423
Horace Springs
ION.
9W. 26. 433
ION.
9W. 26. 434
10N.10W.27.333A
Rio San Jose Near Grants
Chlo
ride,
dis
solved
(mg/L
as Cl)
5.6
5,200 33 104.
3
10 1824
0 120
140 88 90
120
143 9.
07.
822 100
Fluo-
ride,
dis
solved
(mg/L
as F)
0.20
1.2
0.40 0.50 0.80 0.
80
0.90
0.80
0.80
0.80 __ 0.40
0.50 0.70
Nitro-
Sili
ca,
gen,
Bromide,
dis-
nitrate,
dis-
solved
dis
solved
(mg/L
solved
(mg/L
as
(mg/
L as Br
) SiO2
) as
N)
17
0.05
020
129.
9
14
19
1.2C
30
25 30
0.56
0 33
0.07
00.31
32
18
1.10
182.50
30
Nitro
gen,
NO2 +NO3
, Bo
ron,
Iron,
dis-
dis-
dis
solved
solved
solved
(mg/L
(ug/L
(ug/L
as N)
as
B)
as Fe
)
0 1.70
130
20
2.50
140
40
0.860
300
<10
0.95
0 340
14 101.
20
340
<3
1.10
110
500
2.10

Tab
le 9
. Se
lect
ed w
ater
ana
lyse
s fro
m w
ells
and
spr
ings
in th
e A
com
a em
baym
ent a
rea
Con
tinu
ed
NJ s
Local
identifier
Station number
Site
Rio San Jose near Grants
08343500
SW
SW
SW
SW
SWSW
SW
SW
SW
SWSW
SWSW
SW
SWSW
SWSW
Geo
logic
Date
unit
01-21-77
04-22-80
04-23-80
09-09-81
04-26-82
03-11-86
05-02-86
01-30-86
08-26-86
10-25-85
06-22-87
01-21-87
11-21-86
08-10-87
11-16-87
05-20-87
03-05-87
07-18-86
Spe-
Depth
cific
of
con-
well,
duct-
total
ance
(fee
t)
(uS/cm)
1,350
435
430
1,210
1,380
1,100
1,320
1,400
1,050
1,500
1,400
1,300
1,700
1,300
1,280
1,600
2,170
1,380
PH
(stand
ard
units)
7.80
7.70
7.80
8.10
8.12
8.00
8.38
7.90
8.40
8.00
8.00
7.90
8.00
7.80
7.90
7.90
8.30
8.10
Water
temper
ature
(deg C)
10.0
10.5
16.5
14.0
10.5
14.5
10.0
19.5
12.5
15.0
9.0
10.5
17.5
10.0
14.5
13.0
7.0

Tab
le 9
. Sel
ecte
d w
ater
ana
lyse
s fro
m w
ells
and
spri
ngs
in th
e A
com
a em
baym
ent a
rea
Con
tinue
d
Calcium,
dis
solved
Local
(mg/L
identifier
as Ca
)
Rio San Jose near Grants
8546
86 88
8880 87 88 91 88 9111
0 88
Magne
sium,
dis
solved
(mg/L
as Mg)
3812
37 42
4341 43 42 49 41 52 78 41
Sodi
um,
dis
solved
(mg/
Las Na)
130
20
140
170
160 140
160
150
180
150
200
300
150
Sodium +
potas-
Potas
sium,
slum,
dis-
dis
solved
solved
(mg/L
(mg/
Las Na
) as
K) 7.4
4.1
6.7
7.5
6.6 6.8
6.9
7.0
7.8
7.2
7.5
106.6
Bicar
bona
te,
wh wa
tto
tal,
field
(mg/L
asHC03
)
260
230
280
292 266
280*
274*
282*
272*
300*
306
273
Car
bonate,
wh wa
tto
tal,
field
(mg/
L as
C03
)
0
0 __ __
Sulfate,
dis
solved
(mg/L
as S0
4 )
290 82
270
340
360
340
320
340
410
330
410
650
310

Tab
le 9
. Sel
ecte
d w
ater
ana
lyse
s fro
m w
ells
and
spr
ings
in th
e A
com
a em
baym
ent a
rea
Con
tinue
d
Chlo
ride,
dis
solved
Local
(mg/
L identifier
as Cl)
Rio San Jose Near Grants
110 12 130
150
140 130 110
130
160
120
160
120
180
260
130
Fluo-
ride
, Bromide,
dis-
dis
solved
solved
(mg/L
(mg/L
as F)
as Br)
0.80
0.20
0.70
0.80
0.90 0.70 __
0.80
0.80 0.80 __
0.80
0.70
0.80
0.80
Nitro-
Sili
ca,
gen,
dis-
nitrate,
solved
dis-
(mg/L
solved
as
(mg/L
Si02
) as
N)
288.8
31 25
2727__ __
27 29
26
29 28 27 30
Nitro
gen,
N02 +N
03
, dis
solved
(mg/L
as N)
1.30
0.670
0.81
01.
30
1.80 0.92
01.
600.
570
2.00
2.40
1.30
2.20
1.60
2.70
1.70
1.40
1.50
Boro
n,
dis
solved
(ug/
L as B)
360 80
130
310
400
360 340
360
370 400
330
440
600
350
Iron,
dis
solved
(ug/
L as
Fe)
40 <10 <9 <36
5
11
5
<10 10
<10 9

Tab
le 9
.--Se
lect
ed w
ater
ana
lyse
s fro
m w
ells
and
spr
ings
in th
e A
com
a em
baym
ent a
rea
Con
tinu
ed
Local
identifier
10N.9W.
10N.9W.
Antonio
4N.3W.
4N.3
W.
5N.3W.
7N.4W.
7N.4
W.
7N.4
W.8N
.3W.
10N.8W.
10N.8W.
10N.8W.
10N.8W.
10N.9W.
10N.9W.
10N.
9W.
10N.9W.
10N.
9W.
6.442
25.000
Sedillo Grant
6.443
25.334 Coyote Sp
19.111
13 15 29 20 28 28 30 30 17 23 25 25 25
.114
.222
B Major
.421
.211
.310
.314
3B McCartys
.244
76
-4 Well
.244
.113
.443
.244
.244
76
-3 Well
.400
Station number
350714107491201
350359107442301
345614107071201
343537107113001
343209107065401
343905107122201
345013107125201
345028107141901
344813107163701
345445107103101
350351107414101
350349107413401
350400107425601
350603107485801
350400107440001
350346107442001
Site
SP,GW
GW
GW
SP
SP GWGW GWGWGW GWGWGW
GWGW
GW
GWGW GWGW
GW
GWGWGW
GW
Geo
logic
Date
unit
05-13-58
OOOEXRV
09-15-52
OOOEXRV
04-21-75
OOOEXRV
04-30-57
110AVMB
01-05-50
do.
04-01-51
do.
05-01-57
05-19-81
06-04-57
05-19-81
06-09-81
02-08-57
06-07-60
08-02-60
01-21-77
07-16-76(B)
07-17-76
07-17-76
07-17-76
12-08-50
10-24-78 (B)
10-24-78 (B)
10-2
1-76
(B)
07-21-76
03-21-60
do.
do.
do.
do.
do.
do.
do.
do.
do.
do.
do.
do.
do.
do.
do.
do.
do.
do.
do.
Depth
of
well,
total
(fee
t) 12
55 55 107 44 --
125
125 170
170
170
170 77 77 35
165
165 70
Spe
cific
con
duct
ance
(uS/
cm)
3,11
0 1,030
3,940
31,000
5,20
0
3,96
0826
3,42
03,
100
679
4,50
01,320
1,590
1,300
1,450
1,500
1,500
6,84
0
3,53
091
01,220
1,210
10,100
PH
(sta
nd
ard
units)
7.80
7.70
7.80
7.00 8.00
7.40
7.70
8.00
7.80
8.10
8.10
8.10
8.10
7.7
8.10
8.10
7.60
Water
temper
ature
(deg
C)
10 20
16 18 16 16 17 19 15 15- -
15 14 14 14- _
13 14 14 14
.5 .0
.0 .0 .0 .5 .0 .0 .0 .0 - - .0 .5 .5 .5 - _ .5 .5 .5 .5

Tab
le 9
.--S
elec
ted
wat
er a
naly
ses f
rom
wel
ls a
nd sp
ring
s in
the
Aco
ma
emba
ymen
t are
a C
ontin
ued
Local
identifier
ION.
9W.
6. 442
ION. 9W. 25.
000
Antonio Sedillo Grant
4N.3W.6.443
4N.3W.25.334 Coyote Sp
5N.3W.19.111
7N.4W.13.114
7N.4W.15.222 B
Major
7N.4W.29.421
8N.3W.20.211
ION.
8W. 28.
310
10N.8W.28.3143B McCartys
Calcium,
dis
solved
(mg/
Las Ca
)
210
250
690
140
400 96
610
590 17
450 73 68
Magne
sium,
dis
solved
(mg/L
as Mg)
110 ~
100
320 67
230 33 150
130 26
250 31 34
Sodium,
dis
solved
(mg/L
as Na)
530 -- 25
150 98
170
Sodium +
potas
sium
,dis
solved
(mg/L
as Na)
420
~
7,600
890
340
340
150
380
190
Potas
sium,
dis
solved
(mg/L
as K)
12 5.6
11 3.2
4.6
Bicar
bona
te,
wh wat
tota
l,field
(mg/L
asHC03
)
600
260
220
2,48
035
0
180
180
330*
380
341*
256*
160
350
350
340
Car
bona
te,
wh wat
total,
field
(mg/
L as
C03
)
0 0 0 0 0
__ 0 0 __ 0 0 0 0
Sulfate,
dis
solved
(mg/L
as SO
4 )
940
1,400
3,500
470
2,300
100
1,90
01,800
110
2,20
036
0
370
8243
250
5.5
360
14410
ION.9W.17.113
ION.9W.23.443
ION.9W.25.244
ION.9W.25.244 76-3 Well
ION.9W.25.400
330
200 69 60
440
380
160 29 35
390
930
410 94
130
164.
85.9
1,900
470
640
240
290
940
12
0
2,80
0
1,02
021
0240
4,000

Tab
le 9
.-Se
lect
ed w
ater
ana
lyse
s fr
om w
ells
and
spr
ings
in th
e A
com
a em
baym
ent a
rea
Con
tinu
ed
Local
identifier
ION. 9W. 6. 442
ION. 9W.
25.
000
Antonio Sedillo Grant
4N.3W.6.443
4N.3W.25.334 Coyote Sp
5N.3W.19.111
7N.4W.13.114
7N.4W.15.222 B
Major
7N.4W.29.421
8N.3W.20.211
ION. 8W.
28.
310
10N.8W.28.3143B McCartys
ION. 8W.
30.
244
76
-4 Well
ION.
9W. 17.
113
ION. 9W. 23. 443
ION. 9W.
25. 244
Chlo
ride,
dis
solved
(mg/L
as Cl
)
280 68
350
9,800
1,200
100 13
140
130 22
360 41 66 43 120
750
330 56 64
Fluo-
ride,
Bromide,
dis-
dis
solved
solved
(mg/L
(mg/
Las
F)
as Br)
1.0 __ 0.80
1.
32.
00.80
0.70
0.90
1.2
1.1
0.80 0.80
0.70 ::
::0.70 __
Sili
ca,
dis
solved
(mg/L
asSi02
)
41 31 25 24
20 15 11 20 19 33 21 19
__ 30
__ 34
Nitro
gen,
nitr
ate,
dis
solved
(mg/L
as N)
0.360
~ ~
0.97
0
4.30
0.050
1.90
0.00 0.70
0
__
Nitro
gen,
N02 +N03
,dis
solved
(mg/
Las N)
_. 1.10
13.0 0.00
0.110
0.250
__
Boron,
dis
solved
(ug/L
as B)
._ 700 160 510
390 200 __
_
Iron,
dis
solved
(ug/L
as Fe)
__ 170 70
2,800 50 30
<10 _ ~ _
ION.9W.25.244 76-3 Well
ION.9W.25.400
1,300
1.3
180.
320

Tab
le 9
. Sel
ecte
d w
ater
ana
lyse
s fro
m w
ells
and
spr
ings
in th
e A
com
a em
baym
ent a
rea
Con
tinue
d
Local
identifier
ION. 9W.
29.
132
5N.3W.34.200
6N.2W.31.400
7N.4E.23.123
8N.2W.24.131
Antonio Sedillo Grant
Antonio Sedillo Grant
ION. 8W. 32.
312
ION. 9W.
25.
324
15N. 10W. 13
. 1314
Sedillo Grant
Antonio Sedillo Grant
Dipping Vat Spring
ION. 9W.
23. 134
Antonio Sedillo Grant
8N.3W.10.222 Suwanee Spring
3N.5W.8.342
4N.5W.33.223
5N.5N.16.443
5N.5W.10.333
7N.4W.3.344
Station number
344031107084001
344201107050801
343926107100201
345420107003801
344830107040401
345201107050701
350304107423601
350349107442701
350157107512201
345028107014301
345312107052501
345549107062401
345556107054901
350452107454801
345412107035801
345629107075501
342943107230401
343208107215301
343915107215301
344004107213301
345122107144801
Site
GW
GW
GW
GWGW
GW
SP GWGW
GW
GW
SP SP SP GW
SP SP SP GW
GW
GWGW
GW
SP
Date
10-24-78 (B)
03-00-54
09-13-50
03-22-56
05-28-57
05-16-75
04-21-75
10-02-52
05-07-58
09-18-62
06-05-75
04-21-75
04-21-75
04-21-75
12-08-50
04-21-75
10-12-48
05-16-58
06-04-81
05-07-54
08-04-53
06-05-81
08-29-62
05-28-75
Geo
logic
unit
110AVMB
112SNTF
112SNTF
112SNTF
112SNTF
112SNTF
210MCDK
210MNCS
211DKOT
211GLLP
211MVRD
221BLFF
221BLFF
221BLFF
221ENRD
221MRSN
221TDLT
221TDLT
231CHNL
do.
do.
do.
do.
do.
Depth
of
well,
total
(fee
t) 80
80
373
140 ~
1,035
300 78
200
Spe
cific
con
duct
ance
(uS/
cm)
670
23,100
6,520
449
5,29
0
4,66
037,000
833
2,340
1,730
9,420
41,4
004,030
30,1
00 754
32,6
003,810
3,790
3,700
3,96
02,
370
2,40
02,250
7,95
0
PH
(sta
nd
ard
units)
7.60
7.70
7.70
7.30
7.70
8.60 7.30
8.80
8.30
7.30
7.90
8.30 7.10 7.70
7.70 7.30
7.10
Water
temper
ature
(deg
C)
14.0
15
.5
19.0
18.0
19.0
20.0 _ 16.5 16.0
24.0
16.5
16.5
17.0
18.0

Tab
le 9
.-Se
lect
ed w
ater
ana
lyse
s fro
m w
ells
and
spri
ngs
in th
e Aco
ma
emba
ymen
t are
a C
ontin
ued
to VO
Local
identifier
ION. 9W.
29.
132
5N.3W.34.200
6N.2W.31.400
7N.4E.23.123
8N.2W.24.131
Antonio Sedillo Grant
Antonio Sedillo Grant
ION. 8W.
32. 312
ION. 9W. 25.
324
15N. 10W. 13
. 13
14
Sedillo Grant
Antonio Sedillo Grant
Dipping Vat Spring
ION. 9W.
23. 134
Antonio Sedillo Grant
8N.3W.10.222 Suwanee Spring
3N.5W.8.342
4N.5W.33.223
5N.5N.16.443
5N.5W.10.333
7N.4W.3.344
Calcium,
dis
solved
(mg/L
as Ca
)
54 400
280
330
410
210 47
210 3.
1
9256
0270
260 22 570
260
260 72 120
140
Magne
sium
,dis
solved
(mg/L
as Mg)
1830
0120 140
110
110 23 950.90
3035
0100
130 9.
4
150
120 99 20 __ 180
160
Sodi
um,
dis
solved
(mg/L
as Na
)
54
520
10,000 400
2,200
11,000
560
7,400
8,300 900 __
230
210
700
Sodium +
potas
sium,
dis
solved
(mg/L
as Na
)
._
1,10
0 83830
110
270
_ -- -- 140
_ 500
560
440
240
Potas
sium
,dis
solved
(mg/
Las
K) 3.8
3428
0 2.0
33320 12
440
280 2.
0
5.5
9.0
43
Bicar
bona
te,
wh wat
total,
field
(mg/L
asHC03
)
230
1,23
0280
200
270
120
320
310
350
460
1,53
0230
1,780
320
2,900
230
220
512*
580
880
793*
1,00
0
Car
bona
te,
wh wat
total,
fiel
d(mg/L
asC03
)
..
0 0 0 0 0 0 018
0 0 0 0 0 0 0 0 0 0
Sulfate,
dis
solved
(mg/L
as S0
4 )
110
1,10
0 382,200
1,900
6,70
0170
960
440
2,600
8,900
1,50
05,100
120
6,10
01,500
1,500
1,600
2,000
780
740
510
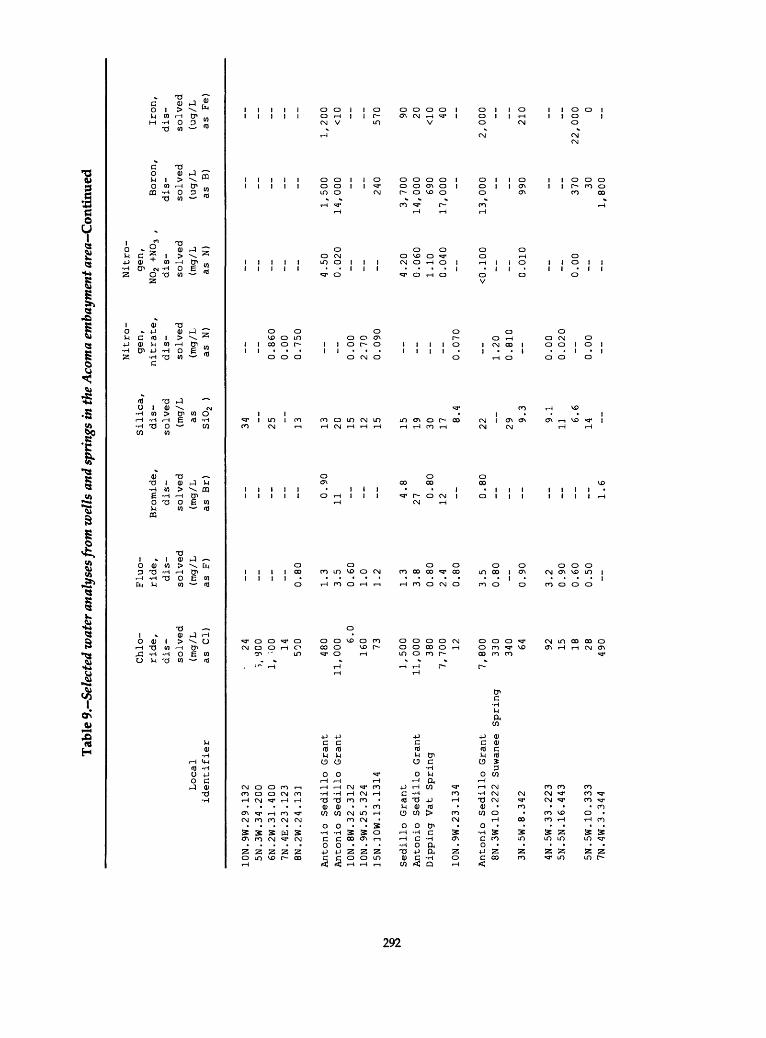
Tab
le 9
. Sel
ecte
d w
ater
ana
lyse
s fro
m w
ells
and
spri
ngs
in th
e A
com
a em
baym
ent a
rea
Con
tinu
ed
Local
identifier
ION.
9W.
29. 132
5N.3W.34.200
6N.2W.31.400
7N.4E.23.123
8N.2W.24.131
Antonio Sedillo Grant
Antonio Sedillo Grant
ION.
8W.
32.
312
ION.
9W.
25. 324
15N. 10W. 13
. 1314
Sedillo Grant
Antonio Sedillo Grant
Dipping Vat Spring
ION. 9W. 23. 134
Antonio Sedillo Grant
8N.3W.10.222 Suwanee Spring
3N.5W.8.342
4N.5W.33.223
5N.5N.16.443
5N.5W.10.333
7N.4W.3.344
Chlo
ride,
dis
solved
(mg/L
as Cl)
24
>, 300
1, -0
014
500
480
11,000 6.
016
0 73
1,500
11,000
380
7,700 12
7,800
330
340 64 92 15 18 28
490
Fluo-
ride,
dis
solved
(mg/
Las
F)
__ 0.80
1.3
3.5
0.60
1.0
1.2
1.3
3.8
0.80
2.4
0.80
3.5
0.80
0.90
3.2
0.90
0.60
0.50
Bromide,
dis
solved
(mg/
Las
Br)
__ 0.90
11 4.
8270.80
12 0.
80 __ ~ 1.6
Sili
ca,
dis
solved
(mg/L
asSi
02
)
34
25--
13 13 20 15 12 15 15 19 30 178.4
22
299.3
9.1
116.6
14
Nitro
gen,
nitrate,
dis
solved
(mg/
Las N)
__
0.860
0.00
0.750
__
0.00
2.70
0.090
__
0.070
__
1.20
0.810
0.00
0.020
0.00
Nitro
gen,
N02 +N
03
,dis
solved
(mg/L
as N)
__ 4.50
0.020
4.20
0.060
1.10
0.040
<0.100
-- 0.010
__ 0.00
Boron,
dis
solved
(ug/
Las
B)
__
1,500
14,000
240
3,700
14,000
690
17,000
13,000 990 _
370 30
1,80
0
Iron,
dis
solved
(ug/
Las Fe
)
__
1,200
<10
570 90 20
<10 40
2,000
210 _
22,000 0

Tab
le 9
.~Se
lect
ed w
ater
ana
lyse
s fro
m w
ells
and
spr
ings
in th
e A
com
a em
baym
ent a
rea
Con
tinue
d
NJ
«5
OJ
Local
identifier
7N.4W.11.431
7N.5W.28.113
7N.5W.36.333
8N.5W.17.213
9N.5W.12.442
9N.4W.14.000
9N.4W.16.324
9N.4W.18.300
9N.5W.12.442
Station number
Site
345038107133801
SP
SP
SP344833107223201
GW
344702107192601
GW
345531107230601
GW
350107107183701
GW
GWGW
GW
GW
GWGW
GWGW
GWGWGWGWGW
350031107134601
GW
350018107161201
GW
350017107182601
GW
350107107183701
GWGW
Date
09-04-41
06-04-57
05-28-75
05-28-75
06-09-81
06-12-75
05-13-63
05-15-63
09-19-63
09-20-63
09-21-63
09-23-63
10-01-63
10-03-63
10-07-63
10-25-63
10-26-63
10-26-63
11-10-64
11-10-64
04-21-59
05-01-59
01-16-59
05-13-63
05-15-63
Geo
logic
unit
231CHNL
do.
do.
do.
do.
do.
do.
do.
do.
do.
do.
do.
do.
do.
do.
do.
do.
do.
do.
do.
do.
do.
do.
do.
do.
Depth
of
well,
total
(fee
t) --
261 __ 46
110 __
1,670
__
1,670
1,720
1,720
60285 46
110
Spe
cific
con
duct
ance
(uS/
cm)
4,260
4,370
3,710
1,100
65,000
5,450
5,580
23,200
23,300
23,300
22,700
23,200
22,500
25,200
__
25,900
25,400
18,000
18,100
31,900
3,870
2,680
5,450
5,580
PH
(stand
ard
units)
6.70
6.90
7.20
__
7.50
7.70
7.30
7.00
7.10
6.70
6.77
6.60
6.80
__
7.30
6.47
6.70
6.80
__
7.50
7.70
Water
temper
ature
(deg
C)
16.5
15.5
16.0
18.0
19.0
18.5
26.0
18.0
21.0
19.0
29.0
34.0
__
28.5
28.5
31.5
_

Tab
le 9
.---S
elec
ted
wat
er a
naly
ses f
rom
wel
ls a
nd s
prin
gs in
the A
com
a em
baym
ent a
rea
Con
tinu
ed
7N.4W.11
7N.5W.28
7N.5W.36
8N.5W.17
9N.5W.12
9N.5W.12
9N.4W.14
9N.4W.16
9N.4W.18
9N.5W.12
Local
identifier
.431
.113
.333
.213
.442
.442
.000
.324
.300
.442
Calcium,
dis
solved
(mg/L
as Ca
)
640
650
580
110
510
450
460
470
240
320
320
Magne
sium,
dis
solved
(mg/L
as Mg)
180
180 140 40
300
360
460
460
450
330
340
Sodi
um,
dis
solved
(mg/L
as Na
)
300
300
220
100
12,000
5,600
5,600
6,000
4,100
Sodium +
potas-
Potas
sium,
sium
,dis-
dis
solved
solved
(mg/
L (mg/
Las
Na
) as K)
2627
015 176.
2
7.8
__
32
5,200
55
54
59
Bicar
bona
te,
wh wat
total,
field
(mg/L
asHC03
)
630
600
470
366*
410
410
1,30
01,500
1,700
1,60
01,
910
1,59
01,
360
1,320
1,77
01,
740 410
410
Car
bona
te,
wh wat
total,
field
(mg/L
asC03
)
0 0
0 __
0 0 0 0 0 0 0 0 0
__
0 0 0
__ 0 0
Sulfate,
dis
solved
(mg/L
as S0
4 )
2,00
01,
900
2,000
330 _
2,50
02,
600
4,80
04,800
4,700
4,300
4,300 __
4,200
4,20
04,300
2,50
02,
600

Tab
le ^
. Sel
ecte
d w
ater
ana
lyse
s fro
m w
ells
and
spr
ings
in th
e A
com
a em
baym
ent a
rea
Con
tinue
d
Local
identifier
7N.4W.11.431
7N.5W.28.113
7N.5W.36.333
8N.5W.17.213
9N.5W.12.442
9N.5W.12.442
9N.4W.14.000
9N.4W.16.324
9N.4W.18.300
9N.5W.12.442
Chlo
ride,
dis
solved
(mg/L
as Cl)
330
320
320
110 28
27,000
420
410
5,800
5,900
5,800 --
6,000 0.
606,
900
7,100
7,000
3,700
3,700
12,000
320 78
420
410
Fluo-
ride,
Bromide,
dis-
dis
solved
solved
(mg/L
(mg/L
as F)
as
Br)
1.0
1.4
1.0
2.3
0.40
1.3
45 __
3.0 __
1.6
1.8
2.9
3.5 __
Sili
ca,
dis
solved
(mg/L
asSi
02
)
20 25 8.
817 14
15
15 14 14
Nitro
gen,
nitrate,
dis
solved
(mg/L
as N)
__
0.180
0.050
0.140
0.020
0.070
0.110
Nitro
gen,
N02 +N
03
, Bo
ron,
dis-
dis
solved
solved
(mg/
L (ug/L
as N)
as B)
__
_ _
860
<0.100
750
0.030
380
2,800
__
2,600
__
__
3,50
04,600
__
Iron
,dis
solved
(ug/
Las Fe
)
_ 30250 ~
3,40
0
2,600 20

Tab
le 9
. Sel
ecte
d w
ater
ana
lyse
s fro
m w
ells
and
spri
ngs
in th
e A
com
a em
baym
ent a
rea
Con
tinue
d
to g
9N.5W.
Antonio
4N.4W.
6N.3W.
Antonio
10N.
9W.
5N.4
W.
5N.8
W.6N.5W.
6N.10W
7N.4
W.8N
.3W.
Local
identifier
12.442
Sedillo Grant
30.223
10.233
Sedillo Grant
25.3241
5.142
35.123
26.132
.7.1413
25.111
15.324
Station number
350107107183701
345032107052701
345108107051501
345140107045501
343258107173201
344543107082101
344808107052601
350352107442601
344128107165501
343715107391501
344311107202001
344545107560801
344845107130801
345503107082701
Site
GW
GW
GW
GWGW
GWGW
GWGWGW
GWGW
SP SP SP GWGW
SP GWGW
GW
GWGWGWGW
Date
09-19-63
09-20-63
09-21-63
09-23-63
10-01-63
10-03-63
10-07-63
10-25-63
10-26-63
10-26-63
11-10-64
11-10-64
04-22-75
04-22-75
04-22-75
12-08-54
10-22-57
00-00-41
07-10-86
06-09-81
12-15-86
08-29-62
11-26-86
05-19-81
09-05-85
Geo
logic
unit
231CHNL
do.
do.
do.
do.
do.
do.
do.
do.
do.
do.
do.
do.
do.
do.
310YESO
310YESO
310YESO
313SADG
do.
do.
do.
do.
do.
do.
Depth
of
well,
total
(feet)
1,67
0
1, 670
1,72
01,
720
__
2,901
630
2,019
623
2,783
150
1,250
Spe
cific
con
duct
ance
(uS/
cm)
23,200
23,300
23,300
22,700
23,200
22,500
25,200
25,900
25,400
18,0
0018
,100
36,8
0034
,100
36,500
2,74
04,
730
7,00
02,
200
2,800
4,63
08,
000
3,01
014
,300
PH
(sta
nd
ard
units)
7.30
7.00
7.10
6.70
6.77
6.60
6.80
7.30
6.47
6.70
6.80
8.30
7.70
6.90
7.00
7.20 6.27
7.00
6.18
6.90
6.44
6.90
6.2
Water
temper
ature
(deg
C)
26.0
18.0
21.0
19.0
29.0
34.0
28.5
28.5
31.5 13.5
14.0
13.5 __
30.0
53.0
19.0
41.0
20.5
34.0
16.0
22.5

Tab
le 9
.-Se
lect
ed w
ater
ana
lyse
s fro
m w
ells
and
spr
ings
in th
e A
com
a em
baym
ent a
rea-
Con
tinue
d
Local
identifier
9N.5W.12.442
Antonio Sedillo Grant
4N.4W.30.223
6N.3W.10.233
Antonio Sedillo Grant
ION.
9W.
25.
3241
5N.4W.5.142
5N.8W.35.123
6N.5W.26.132
6N. 10W. 7. 1413
7N.4W.25.111
8N.3W.15.324
Calcium,
dis
solved
(mg/
Las
Ca)
510 --
450 460
470
240
320
320
140
490
350
300
730
360
350
600
580
390
690
Magne
sium,
dis
solved
(mg/
Las Mg)
300
360
460
460
450
330
340
160
140
350
220
110
150 77
190
110
160
390
Sodi
um,
dis
solved
(mg/L
as Na)
5,600
5,600
6,000
4,100
9,400
9,100
9,300
1,10
0 21
220
430
1,60
0140
3,900
Sodium +
potas
sium,
dis
solved
(mg/L
as Na)
..
5,200
19460
Potas
sium
,dis
solved
(mg/L
as K)
32
55
54
59
320
260
260 _ 473.
5
16 27 756.
512
0
Bicar
bona
te,
wh wat
tota
l,field
(mg/
L as
HC03
)
1,30
01,500
1,700
1,60
01,910
1,590
1,360
1,320
1,770
1,74
01,
920
2,950
2,460 68
270
1,37
01,
320
280*
739*
410
1,646*
500
2,330
Car
bona
te,
wh wa
ttotal,
field
(mg/
L as
C03
)
0 0 0 0 0 0 0
0--
0 0 0 0 0 0 0 _
0
Sulfate,
dis
solved
(mg/
Las S0
4 )
4,800
4,800
4,700
4,300
4,30
0
4,200
4,200
4,30
0
6,20
05,600
6,20
0
1,800
2,600
6,700
2,00
01,
300
940
2,60
01,400
1,200
4,100

Tab
le 9
.~Se
lect
ed w
ater
ana
lyse
s fro
m w
ells
and
spri
ngs
in th
e A
com
a em
baym
ent a
rea
Con
tinue
d
Local
identifier
Antonio Sedillo Grant
4N.4W.30.223
6N.3W.10.233
Antonio Sedillo Grant
ION. 9W. 25. 3241
5N.4W.5.142
5N.8W.35.123
6N.5W.26.132
6N. 10
W. 7. 1413
7N.4W.25.111
8N.3W.15.324
Chlo
ride,
dis
solved
(mg/
Las Cl
)
5,800
5,900
5,800
6,000 0.
600
6, 900
7,100
7,000
3,700
3,700
10,000
9,000
10,000 35
300
8, 900
1,300 18
210
140
1, 600
140
3, 000
Fluo-
ride,
dis
solved
(mg/L
as F)
3.0 __
1.6
1.8 --
2.9
3.5
2.4
3.0
3.8
1.0
0.60
0.50
1.2
1.9
0.80
1.0
1.2
Bromide,
dis
solved
(mg/L
as Br)
__ __ --
256.2
24
3.0
0.55
4.2
5.0
Sili
ca,
dis
solved
(mg/L
asSiO2
)
14
15
15 14 14 32 23 22 10
24 16 219.
916 17 53
Nitro
gen,
nitrate,
dis
solved
(mg/L
as N)
0.05
0-- __
0.14
0
0.02
0 0.07
00.
110
0.050
-- --
0.050
--
Nitro
gen,
N02 +N
03
,dis
solved
(mg/
Las N)
__ -- __ -- ~
0.24
00.
100
0.10
0
-- --
<0.100
0.00
<0.100
<0.100
2.00
Boro
n,dis
solved
(ug/L
as B)
2,600 -- -- ~ _
3,500
4,600
14,000
13,000
14,000 __
3,200
110
610
1,40
05,500
510
8,500
Iron
,dis
solved
(ug/L
as Fe)
__ -- __
3,400
2,600 20 -- __ --
<10
<10 20 __
2,000
6,800
2,300 040
470
30,000

Tab
le 9
. Sel
ecte
d w
ater
ana
lyse
s fro
m w
ells
and
spr
ings
in th
e A
com
a em
baym
ent a
rea
Con
tinu
ed
Local
identifier
8N.3W.15.413
8N.6W.20.3334
8N.8W.25.4231
9N.5W.12.442
9N.6W.16.111
ION. 9W. 25.
3241
ION. 10W. 3. 423 Ojo del Gallo
ION. 10W. 26
. 331
Antonio Sedillo Grant
9N.9W.28.1344
Station number
345505107082201
345402107295701
345329107374001
350107107183701
350053107290101
350352107442601
350720107523201
350346107521201
344855107052201
344936107050601
345128107061401
345850107475401
Site
SP
GW
GWGWGW GW GW SP SP SP GWGWGW
GW
GWGW
GW
SP SP SP GW
GW
GW
GW
Date
11-29-63
11-18-86
12-06-86
09-05-85
09-05-85
11-17-86
07-10-86
07-12-46
06-06-84
09-05-85
06-15-55
06-07-57
05-15-58
06-26-62
08-17-63
08-19-63
10-13-64
05-16-75
04-22-75
04-21-75
09-21-84
10-04-84
03-10-86
09-21-84
Geo
logic
unit
313SADG
do.
do.
do.
do.
do.
do.
do.
do.
do.
do.
do.
do.
do.
do.
do.
do.
do.
do.
do.
313SADR
313SADR
313SADR
313SADR
Depth
ofwell,
total
(fee
t)
2,20
3 2,
650
2,650
2,90
1__ 21
6216
216
216
216
216
216
2,51
02,514
2,52
02,
510
Spe
cific
con
duct
ance
(uS/
cm)
4,450
3,300
14,3
0014
,300
5,50
07,000
1,070
1,49
0
1,430
1,100
1,32
01,110
1,140
1,150
1,150
1,180
37,000
34,300
8,530
1,300
1,350
1,28
01,
300
PH
(sta
nd
ard
units)
7.30
6.65
6.
456.
206.
20
6.42
6.27
7.10
17.0 7.20
7.60
7.40
7.20
7.40
7.30
7.40
8.30
7.80
7.60
6.90
7.05
6.75
6.90
Water
temper
ature
(deg
C)
20.0
33.0
38.0
27.0
27.0
34.5
53.0
16.0
14.5 6.90
17.0
16.0 17.0
17.0
17.0
21.5
11.5 41.5
41.5
27.0
41.5

Tab
le 9
. Sel
ecte
d w
ater
ana
lyse
s fro
m w
ells
and
spr
ings
in th
e A
com
a em
baym
ent a
rea-
Con
tinu
ed
Local
identifier
8N.3W.15.413
8N.6W.20.3334
8N.8W.25.4231
9N.5W.12.442
9N.6W.16.111
ION.
9W.
25.
3241
ION.
10W
. 3.
423 Ojo de
l Gallo
ION. 10W
. 26. 331
Antonio Sedillo Grant
9N.9W.28.1344
9N.9W.28.1344
Calcium,
dis
solved
(mg/L
as Ca)
680
450
670
200
200
540
730
110
150
130
110
130
120
120
340
390
540
140
140
140
140
Magne
sium,
dis
solved
(mg/L
as Mg)
180
100
110
160
160
130
110 41 47 44 42 32 __ 41 41
230
170
200 39 40 40 39
Sodi
um,
dis
solved
(mg/
Las
Na)
3,500
610
110
2,800
2,800
810
1,100
130
120 72 __ 75
9,500
8,600
1,300 88 91 88 88
Sodium +
potas-
Potas
sium,
sium,
dis-
dis
solved
solved
(mg/
L (m
g/L
as Na)
as K)
120 48 13 12 12 35 47
766.
6
6.2
75 >0 764.0
__
__
735.0
280
230 317.
47.
17.
17.4
Bicar
bona
te,
wh wa
t to
tal,
field
(mg/L
asHC03
)
2,390
267*
378*
1,690
1,69
0
533*
1,320
320
400
376
310
320
320
290
290
290
300
1,49
02,720
640
390
390*
418
390
Car
bonate,
wh wat
total,
field
(mg/L
asC0
3 )
0
0 __
0 0 0 0 0 0 0 0 0 0 ~
Sulfate,
dis
solved
(mg/
Las
S0
4 )
4,30
02,400
2,000
3,50
03,
500
3,200
2,000
270
400
340
250
250
260
250 _
260
270
7,40
05,900
2,800
290
290
300
290

Tab
le 9
, Sel
ecte
d w
ater
ana
lyse
s fro
m w
ells
and
spr
ings
in th
e A
com
a em
baym
ent a
rea
Con
tinu
ed
Local
identifier
8N.3W.15.413
8N.6W.20.3334
8N.8W.25.4231
9N.5W.12.442
9N.6W.16.111
ION.
9W.
25.
3241
ION.
10W
. 3.
423 Ojo Gallo
Antonio Sedillo Grant
9N.9W.28.1344
Chlo
ride,
dis
solved
(mg/L
as Cl)
2,800
180
110
2,100
2,100
250
1,300 44
110 80 60 56 63 78 79 77 80
10,0
009,
900
1,10
0 72 737072
Fluo-
ride,
dis
solved
(mg/L
as F)
2.3
3.4
1.6
2.7
2.7
2.9
0.60
0.70
0.50
0.50
0.80 0.60 __
0.60
0.60
2.2
2.7
1.3
0.70
0.70
0.70 0.70
Bromide,
dis
solved
(mg/
Las
Br
)
._ 0.34
0.27
1.4
1.4
0.34
3.0
0.25
__ 19 10
2.1
0.26
Sili
ca,
dis
solved
(mg/L
asSi02
)
11 15 16 42 42 15 24~ 18 17 21 23
21 20 23 27 21 18 181918
Nitro
gen,
nitrate,
dis
solved
(mg/L
as N)
0.16
0
1.20
0.61
00.630
0.610
0.77
0
0.68
00.700
0.810
__ ~ ~
Nitro
gen,
N02 +N03
,dis
solved
(mg/L
as N)
_.
<0.100
<0.100
<0.100
<0.100
0.
200
0.13
00.
600
0.02
0<0.100
<0.100
<0.100
<0.100
Boron,
dis
solved
(ug/L
as B)
__
1,20
043
03,
700
3,700
1,10
03,200 --
460
420
240
240 __
270
14,000
13,000
1,80
028
0270
280 280
Iron,
dis
solved
(ug/
Las
' Fe
)
5010,000
3,800
170
170
5,500
2,000
9
<3 10 __ 80<10
<10
720
320
8,200 720

Tab
le 9
.~Se
lect
ed w
ater
ana
lyse
s fro
m w
ells
and
spri
ngs
in th
e A
com
a em
baym
ent a
rea
Con
tinu
ed
9N 3N 6N 5N
Local
identifier
.9W. 28.
1344
.4W.9.223
.3W.35.341
.3W.29.4
Station number
345850107475401
343012107151501
344150107073501
344150107103301
343740107101801
Site GW
GWGW
SP SP SP SP
Date
10-04-84
03-10-86
04-20-55
05-01-57
04-19-62
05-16-75
08-17-41
Depth
of
Geo-
well
,logic
total
unit
(feet)
313SADR
2,514
313SADR
2,520
318ABOU
325MDER
325MDER
325MDER
326MGDL
Spe
cific
con
duct
ance
(uS/
cm)
1,350
1,280
2,500
26,700
26,000
pH
(sta
nd
ard
units)
7.05
6.
758.
006.
506.80
6.70
Water
temper
ature
(deg
C)
41.5
27.0 14.5
16.0
16.5 1.0
8

Tab
le 9
.-Se
lect
ed w
ater
ana
lyse
s fro
m w
ells
and
spr
ings
in th
e A
com
a em
baym
ent a
rea
Con
tinu
ed
Local
identifier
9N.9W.28.1344
3N.4W.9.223
6N.3W.35.341
5N.3W.29.4
Calcium,
dis
solved
(mg/
Las Ca)
140
140
820
890
760
290
Magne
sium
,dis
solved
(mg/L
as Mg
)
40 40
460
370
420
250
Sodi
um,
dis
solved
(mg/
Las
Na)
91 88
5, 600
5,400
11,000
Sodium +
potas
sium,
dis
solved
(mg/L
as Na
)
_.
885,800
__
Potas
sium
,dis
solved
(mg/L
as K) 7.1
7.1
100
100
230
Bicar
bona
te,
wh wa
tto
tal,
fiel
d(m
g/L
asHC03
)
390*
418 68
2,550
2,44
0
2,420
2,750
Car
bona
te,
wh wat
tota
l,field
(mg/L
asC0
3 )
0 0 0 0
Sulfate,
dis
solved
(mg/L
as SO
4 )
290
300
1,500
3,30
03,
200
3,10
04,
600
3

Tab
le 9
.--S
elec
ted
wat
er a
naly
ses f
rom
wel
ls a
nd sp
ring
s in
theA
com
a em
baym
ent a
rea
Con
clud
ed
Local
identifier
9N.9W.28.1344
3N.4W.9.223
6N.3W.35.341
5N.3W.29.4
Chlo
ride
,dis
solved
(mg/L
as Cl
)
73 70 197,900
7,800
7,300
13,0
00
Fluo-
ride,
dis
solved
(mg/
Las
F)
0.70
0.70
0.70
160 0.
90
0.70
1.6
Bromide,
dis
solved
(mg/L
as Br)
._ 0.26
~ 9.0
Sili
ca,
dis
solved
(mg/L
asSi02
)
18 19 25 16 16 156.0
Nitro
gen,
nitr
ate,
dis
solved
(mg/L
as N)
__
10.0 --
0.320
4.10
Nitro
gen,
N02 +N
03
,dis
solved
(mg/
Las N)
<0.1
00<0
.100
--
0.370
Boron,
dis
solved
(ug/L
as B)
270
280
4,10
0 --
Iron
,dis
solved
(ug/L
as Fe)
320
8,20
0
220
820


![Limestone, Chert, or Limestone? [2013225_fieldtrip]](https://static.fdocuments.net/doc/165x107/558421bfd8b42a86478b4731/limestone-chert-or-limestone-2013225fieldtrip.jpg)