Hydrogeological Investigation of the Mount Lofty …...Borehole water and formation characteristics...
48
Hydrogeological Investigation of the Mount Lofty Ranges, Progress Report 3: Borehole water and formation characteristics at the Scott Bottom research site, Scott Creek Catchment GLENN HARRINGTON Report DWLBC 2004/03
Transcript of Hydrogeological Investigation of the Mount Lofty …...Borehole water and formation characteristics...

Hydrogeological Investigation of the Mount Lofty Ranges, Progress Report 3: Borehole water and formation characteristics at the Scott Bottom research site, Scott Creek Catchment
GLENN HARRINGTON
Report DWLBC 2004/03

Groundwater Assessment Division Department of Water, Land and Biodiversity Conservation 25 Grenfell Street, Adelaide GPO Box 2834, Adelaide SA 5001 Telephone +61 8 8463 6946 Fax +61 8 8463 6999 Website www.dwlbc.sa.gov.au
Disclaimer Department of Water, Land and Biodiversity Conservation and its employees do not
warrant or make any representation regarding the use, or results of the use, of the
information contained herein as regards to its correctness, accuracy, reliability, currency
or otherwise. The Department of Water, Land and Biodiversity Conservation and its
employees expressly disclaims all liability or responsibility to any person using the
information or advice. © Department of Water, Land and Biodiversity 2004 This work is copyright. Apart from any use as permitted under the Copyright Act 1968 (Cwlth), no part may be reproduced by any process without prior written permission from the Department of Water, Land and Biodiversity Conservation. Requests and inquiries concerning reproduction and rights should be addressed to the Chief Executive Officer, Department of water, Land and Biodiversity Conservation, GPO Box 2834, Adelaide SA 5001
Hydrogeological Investigation of the Mount Lofty Ranges, Progress Report 3: Borehole water and formation characteristics at the Scott Bottom research site, Scott Creek Catchment i
Rep
ortD
WLB
C20
04/0
3
FOREWORD
South Australia’s natural resources are fundamental to the economic and social well-being of the State. One of the State’s most precious natural resources, water is a basic requirement of all living organisims and is one of the essential elements ensuring biological diversity of life at all levels. In pristine or undeveloped situations, the condition of water resources reflects the equilibrium between, rainfall, vegetation and other physical parameters. Development of these resources changes the natural balance and may cause degradation. If degradation is small, and the resource retains its utility, the community may assess these changes as being acceptable. However, significant stress will impact on the ability of the resource to continue to meet the needs of users and the environment. Understanding the cause and effect relationship between the various atresses imposed on the natural resources is paramount to developing effective management strategies. Reports of investigations into the availability and quality of water supplies throughout the State aim to build upon the existing knowledge base enabling the community to make informed decisions concerning the future management of the natural resources thus ensuring conservation of biological diversity.
Brian Harris Director, Knowledge and Information Division
Department of Water, Land and Biodiversity Conservation

Hydrogeological Investigation of the Mount Lofty Ranges, Progress Report 3: Borehole water and formation characteristics at the Scott Bottom research site, Scott Creek Catchment ii
Rep
ortD
WLB
C20
04/0
3
CONTENTS
FOREWORD ........................................................................................................................ I
SI UNITS COMMONLY USED WITHIN TEXT ...................................................................IV
ABSTRACT..........................................................................................................................1
1 INTRODUCTION .............................................................................................................2
2 FIELD METHODS AND WELL SELECTION...................................................................4
2.1 Borehole Geophysics................................................................................................4 2.2 Borehole Video Camera ...........................................................................................4 2.3 Water Quality Profiling ..............................................................................................4 2.4 Vertical Flow Distribution ..........................................................................................5
3 RESULTS AND DISCUSSION ........................................................................................6
3.1 Geophysical Measurements .....................................................................................6 3.2 Video footage............................................................................................................6 3.3 Water Quality ............................................................................................................7
3.3.1 SEASONAL VARIATIONS .............................................................................................. 7 3.3.2 IMPLICATIONS FOR SURFACE WATER-GROUNDWATER INTERACTIONS............ 9 3.3.3 EFFECTS OF ARTESIAN FLOW ON CHEMICAL PROFILES..................................... 11
3.4 Vertical Flow Distribution ........................................................................................11
4 SUMMARY ....................................................................................................................14
PN 57829...........................................................................................................................15
5 RECOMMENDATIONS AND FUTURE WORK .............................................................16
6 REFERENCES ..............................................................................................................17
7 APPENDIX A .................................................................................................................18
8 APPENDIX B .................................................................................................................24
9 APPENDIX C.................................................................................................................35
10 APPENDIX D...............................................................................................................39

Hydrogeological Investigation of the Mount Lofty Ranges, Progress Report 3: Borehole water and formation characteristics at the Scott Bottom research site, Scott Creek Catchment iii
Rep
ortD
WLB
C20
04/0
3
CONTENTS
LIST OF TABLES
Table 1. Approximate locations of all identifiable fractures in the 10 wells at Scott Bottom.............................................................................................................15
LIST OF FIGURES
Figure 1. Location of wells drilled during phase 1 and 2 at Scott Bottom.........................3 Figure 2. Salinity of Scott Creek at Scott Bottom Weir ...................................................10

Hydrogeological Investigation of the Mount Lofty Ranges, Progress Report 3: Borehole water and formation characteristics at the Scott Bottom research site, Scott Creek Catchment iv
Rep
ortD
WLB
C20
04/0
3
SI UNITS COMMONLY USED WITHIN TEXT Name of unit Symbol Definition in terms of
other metric units
Millimetre mm 10-3 m length Metre m length Kilometre km 103 m length Hectare ha 104 m2 area Microlitre µL 10-9 m3 volume Millilitre mL 10-6 m3 volume Litre L 10-3 m3 volume Kilolitre kL 1 m3 volume Megalitre ML 103 m3 volume Gigalitres GL 106 m3 volume Microgram µg 10-6 g mass Milligram mg 10-3 g mass Gram g mass Kilogram kg 103 g Mass
Abbreviations Commonly Used Within Text
Abbreviation Name Units of measure
TDS = Total Dissolved Solids (milligrams per litre) mg/L EC = Electrical Conductivity (micro Siemens per
centimetre) µS/cm
PH = Acidity δD = Hydrogen isotope composition o/oo
CFC = Chlorofluorocarbon (parts per trillion volume) pptv δ18O = Oxygen isotope composition o/oo 14C = Carbon-14 isotope (percent modern Carbon) pmC Ppm = Parts per million Ppb = Parts per billion

Hydrogeological Investigation of the Mount Lofty Ranges, Progress Report 3: Borehole water and formation characteristics at the Scott Bottom research site, Scott Creek Catchment 1
Rep
ortD
WLB
C20
04/0
3
ABSTRACT
This report presents the results of borehole geophysical testing, vertical profiling of water quality (salinity, temperature and pH) and borehole flow meter measurements at the Scott Bottom groundwater research site in the Mount Lofty Ranges. Each dataset provides constructive evidence for identifying the major water-bearing fractures in the ten boreholes. A tabulated list of the most significant fracture locations in each well is provided to facilitate future sampling and tracer tests at the site.

Hydrogeological Investigation of the Mount Lofty Ranges, Progress Report 3: Borehole water and formation characteristics at the Scott Bottom research site, Scott Creek Catchment 2
Rep
ortD
WLB
C20
04/0
3
1 INTRODUCTION
A research site was established at Scott Bottom in the Scott Creek Catchment during mid 2002 (James-Smith and Harrington, 2002) to assist with DWLBC’s ongoing hydrogeological investigations in the Mount Lofty Ranges (MLR). A total of nine wells were drilled at the site, straddling the main Scott Creek channel (Fig. 1). One additional well (PN 61149) was drilled during May 2003 to obtain continuous core from which fractures could be mapped between the ground surface and 99 m depth (Harrington et al., 2003). All of the wells will be used for natural and applied tracer tests to estimate groundwater recharge rates, flow velocities and discharge rates to the creek. All of these fluxes are principal components of the water budget, which needs to be developed for proper management of the resource. Before the tracer tests can be undertaken, details of the borehole water and formation characteristics (e.g. groundwater conductivity and flow distributions in the well, fracture spacings and orientations etc.) are required to ensure optimal design and positioning of the injection and/or sampling apparatus.
This report presents the results of borehole geophysical testing, vertical profiling of water quality (salinity, temperature and pH) and borehole flow meter measurements at the site. Whilst the latter of these two general types of measurements will most likely vary (both in magnitude and distribution) over the course of the project, it is important to fully document and interpret the initial observations prior to commencement of the tracer tests.

Hydrogeological Investigation of the Mount Lofty Ranges, Progress Report 3: Borehole water and formation characteristics at the Scott Bottom research site, Scott Creek Catchment 3
Rep
ortD
WLB
C20
04/0
3
INTRODUCTION Figure 1. Location of wells drilled during phase 1 and 2 at Scott Bottom

Hydrogeological Investigation of the Mount Lofty Ranges, Progress Report 3: Borehole water and formation characteristics at the Scott Bottom research site, Scott Creek Catchment 4
Rep
ortD
WLB
C20
04/0
3
2 FIELD METHODS AND WELL SELECTION
2.1 Borehole Geophysics The full suite of “standard” down-hole geophysical logs were performed by staff from the Geophysical Technical Services (GTS Glenside) branch of the Groundwater Group (DWLBC Knowledge and Information Division) during July 2002. These logs included gamma, neutron, spontaneous potential (SP), point resistivity (PR), density and calliper. However, only five (5) of the nine wells that were drilled during March-April 2002 could be logged with these tools due to adverse borehole completions or deteriorated conditions in the remaining four wells.
At the time of writing this report, the four wells PN 57814, 57829, 57831 and 58095 have not been logged for the following reasons: PN 57814 is completed with slotted PVC casing from 3.2 – 5.2 m below ground level and thus does not require logging; PN 57829 is located on a steep hillside where access is difficult, plus a down-the-hole hammer has resided in the bottom of the well since drilling; PN 57831 is a failed first attempt at a “control hole” for the site, which collapsed from ~40 m back to 13 m immediately after drilling (only 3 m open to the aquifer); PN 58095 is the second attempt at a “control hole”, which was drilled to 165 m, but it too has been blocked by a collapsed rock at approximately 65.7 m.
To add to the frustration of these collapsed “control holes”, the new diamond-cored well PN 61149 (May 2003) near PN 57831 and PN 58095 has also blocked off (~15.7 m) within two months of drilling. This has prevented not only the geophysical logging, but also routine sonde profiling of the well, acoustic logging to map fracture locations and orientations, bailer sampling and installation of the recently-purchased Solinst® multi-level sampling device.
2.2 Borehole Video Camera With the exception of the shallow, screened well (PN 57814) and the cored well (PN 61149), continuous visual images of each borehole were obtained from the water table to the maximum accessible depth (total drilled depth or depth at which obstructions were observed) using a downhole video camera.
2.3 Water Quality Profiling Borehole salinity measurements were made at the time of geophysical logging using a Hydrolab® tool in the five suitable wells. Profiles of electrical conductivity (EC), pH and temperature have also been measured in all ten boreholes at different times of the year (including May 2002, June 2002, October 2002, February 2003, October 2004) using a YSI® 600XL Sonde. Upon release of their caps, several wells were observed to be flowing during June 2002, including PN 57830, PN 57832 and PN 57833. These three wells were profiled with the Sonde at several different times during 6 June 2002 to observe changes in the EC profiles as the wells flowed.

Hydrogeological Investigation of the Mount Lofty Ranges, Progress Report 3: Borehole water and formation characteristics at the Scott Bottom research site, Scott Creek Catchment 5
Rep
ortD
WLB
C20
04/0
3
FIELD METHODS AND WELL SELECTION
2.4 Vertical Flow Distribution Six of the nine wells drilled during March-April 2002 have been tested for vertical flow rates at different “stations” (i.e. depths) using GTS Glenside’s electromagnetic flow meter with inflatable packer device. Again, obstructions in several boreholes meant that not all depths within the well could be accessed. The only wells in which these measurements have not been made are the two with short production zones (i.e. PN 57814 and PN 57831), PN 57829 due to its poor accessibility and the new, cored well PN 61149.

Hydrogeological Investigation of the Mount Lofty Ranges, Progress Report 3: Borehole water and formation characteristics at the Scott Bottom research site, Scott Creek Catchment 6
Rep
ortD
WLB
C20
04/0
3
3 RESULTS AND DISCUSSION
3.1 Geophysical Measurements Results of the geophysical logging and Hydrolab® salinity profiling are presented as composite diagrams in Appendix A. In general, the logs that were obviously most useful for identifying fractures were calliper, density and salinity, and to a lesser degree neutron. This trend may have been expected since natural gamma, SP and PR measurements are unlikely to be useful in what is essentially a single lithology of fractured, meta-sedimentary rock. What follows is a brief summary of the logs for each of the five wells:
PN 57830. The most striking features of these logs are the large positive and negative shifts in calliper separation and density counts (respectively) at depths of ~22 m and ~37 m, and possibly also at ~9 m. Coinciding with each of these locations are large, defined negative shifts in the neutron log, suggesting increased porosity. Whether the decreases in density and increases in porosity reflected at these locations is indicating a highly fractured zone or simply borehole collapse as a result of drilling cannot be determined at this stage. However, definite step-like increases in the salinity profile at the two deepest locations provide improved confidence that these features are important fractures.
PN 57832. Shifts in the calliper and density logs are far less pronounced in this well compared with the previous one. However the neutron signal does exhibit clearly defined lows at ~13.5 m, ~21 m, ~28 m, ~38 m, ~45 m and ~48 m, with the first two corresponding to positive calliper and negative density shifts. The only feature of the salinity log is an apparent step at around 49.5 m but this doesn’t coincide with any other logs.
PN 57833. Borehole collapse that has most likely resulted from drilling through major fractured zones is clearly evident in these logs at ~11 m, ~15 m, ~20 m, ~31 m and possibly 28.5 m. These findings are supported at least for the latter two locations by shifts in the salinity log.
PN 57835. Again, borehole collapse in fractured zones is evident in these logs at ~12.2 m, ~15 m, ~17.5 m, ~21.5 m and ~30.5 m. Minor salinity variations in profile only reflect the noise of the tool in this case.
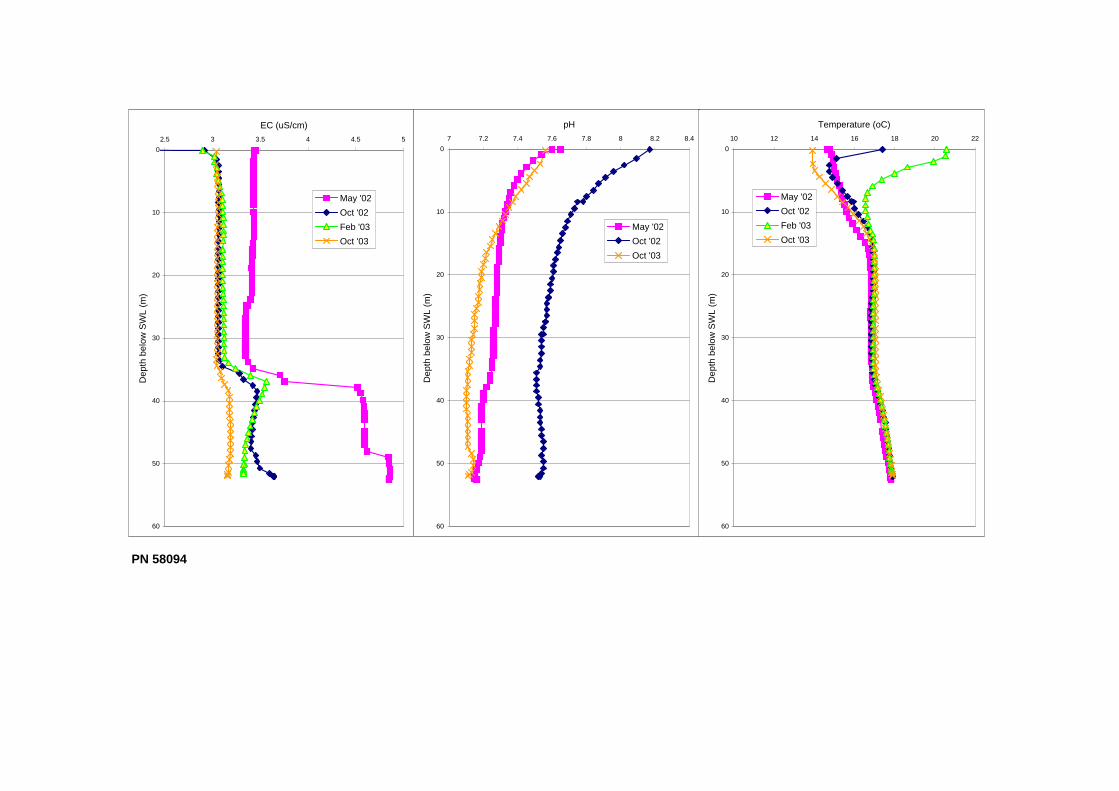
PN 58094. The most obvious fracture-related features in this well occur at ~14.2 m, ~17 m, ~19.5 m, ~23.2 m, ~34 m and ~37 m, with the salinity log providing supporting evidence for the latter three locations.
3.2 Video footage Down-hole camera footage of eight of the wells drilled in March-April 2002 (not PN 57814) provided the following observations:
PN 57829. Bottom of casing (BOC) at 11.90 m. Lots of quartz around 15 m, 28 m, 35.5 m and below 45.9 m. Iron oxide staining at 17.3 m, 17.6 m, 24.1 m and 32 m. Pyrite throughout. Possible fractures at approximately 18.3 m, 24.6 m, 29.6 m and 35.5 m. Suspended particles flowing up well above ~30 m and falling downwards below that depth. Down-the-hole hammer resting in bottom of hole (BOH) at ~56 m.

Hydrogeological Investigation of the Mount Lofty Ranges, Progress Report 3: Borehole water and formation characteristics at the Scott Bottom research site, Scott Creek Catchment 7
Rep
ortD
WLB
C20
04/0
3
RESULTS AND DISCUSSION
PN 57830. BOC at 7.75 m. Possible fracture at 9.1 m. Jagged hole from 21.5 to 23.2 m and 37.2 to 37.6 m. BOH at 52.97 m.
PN 57831. BOC at 8.9 m. Craggy at 11.6 m and 12.6 m. Rock obstructing hole at 12.8 m. BOH at 13 m.
PN 57832. BOC at 11.70 m. Possible fractures at 13.6 m and 37.3 to 37.6 m (vertical). Jagged hole from 13.9 to 14.2 m, 20.9 to 21.2 m and 28 to 28.2 m. BOH at 52.59 m.
PN 57833. BOC at 11.1 m. Jagged hole from 15.1 to 15.2 m, 19.9 to 20.7 m (especially between 20.1 to 20.7 m), 21.3 to 22.6 m, 24.8 to 27.5 m, 28.1 to 29.2 m and 31.1 to 31.3 m. Possible fractures at 22.9 m, 23.4 m, 30.8 m and 32.2 m. Numerous vertical quartz veins, including 31.7-32.2 m, 46.3-46.5 m and around 48.1 m. BOH at 52.61 m.
PN 57835. BOC (squashed in) at 11.1 m. Probable fractures at about 12.25 m, 14.85 m, 21.3 m, 22.8 m, 28.8 m and 30.9 m. Hole is quite jagged in the following zones: 11.75-12.25 m, 14.5-15.2 m, 17.3-17.7 m, 19.9 m, 21.3-21.5 m, 29.2-29.7 m, 28.7 m, 29.2 m, 29.9-30.1 m, 31.3 m, 31.6 m, 36.9 m, 38.5-39.5 m and 39.9 m to BOH at 40.32 m.
PN 58094. BOC at 11.0 m. Jagged hole from 13.9 to 15 m and 34.2 to 35.5 m. Possible fractures at about 14 m, 33.2 m, 33.7 m and 37.45 m. Quartz veins ubiquitous at all orientations, two vertical veins from 21.4 to 23.4 m and 23.8 to 40.7 m. Pyrite disseminated throughout most quartz, plus lots in siltstone below 40.9 m. BOH at 52.64 m.
PN 58095. BOC at 41 m. Possible fractures at about 41.6 m, 64 m, 64.4 m, 64.8 m and 65.3 m. Craggy appearance at 42.2 to 42.5 m, 43.3 m, 43.5 m, 46 m and 46.8 to 48.4 m. Significant quartz at 53.3 m and 58.1 m. Hole blocked partially by rock at 65.7 m.
3.3 Water Quality
3.3.1 SEASONAL VARIATIONS
Profiles of groundwater EC, pH and temperature in all ten wells at various times of the year are presented in Appendix B. A summary of the main features in each well now follows:
PN 57814 (SWL typically 1-2 m). Generally constant EC, pH and temperature with increasing depth in this relatively shallow, slotted PVC well. The only seasonal differences in the profiles are that (a) February temperatures were several degrees warmer than those in May and October (as one would expect), and (b) EC in October 2002 and February 2003 was about 400 EC units (ECU) fresher than in May 2002.
PN 57829 (capped artesian). The most obvious feature in these profiles is the large step-like increase in EC of about 200 ECU at around 36 m below SWL on all measurement occasions. These steps, which also coincide in this instance with a slight kick in the temperature profiles, most likely indicate the location of an active fracture (~ 35.5 m below ground level). Another less-pronounced EC step can be seen just less than 30 m below SWL in the February 2003 profile. The EC profile of October 2003 also

Hydrogeological Investigation of the Mount Lofty Ranges, Progress Report 3: Borehole water and formation characteristics at the Scott Bottom research site, Scott Creek Catchment 8
Rep
ortD
WLB
C20
04/0
3
RESULTS AND DISCUSSION
reveals steps at ~44 m and 53 m. As observed in the previous well, EC in May 2002 was systematically higher than at the other two times of measurement, at least above the main EC steps. The EC profile of February 2003 follows that of October 2002 until the main step, but then follows the more saline profile of May 2002 below that depth. This may suggest that the aquifer is somewhat compartmentalised and that after the relatively dry winter of 2002, only the uppermost portion of the aquifer was recharged. Unfortunately pH data could not be gathered in February 2003 to further test this hypothesis.
PN 57830 (capped artesian). EC steps, pH kinks and significant temperature deviations away from anything like a geothermal gradient all reflect the presence of active fractures in this well. The most likely locations of these fractures are somewhere between 22 and 25 m and 37 and 38 m below SWL. It is difficult to identify the exact locations of these fractures from the EC and T profiles because the significant artesian flow out of the well is dragging the profiles upwards as sonding time progresses. Again, EC in May 2002 is higher than that measured on the other two occasions above the main fracture at ~37 m (top of casing, TOC is about 0.365 m above ground level).
PN 57831 (SWL typically 1.5-2.5 m). While the EC profile appears to be quite variable, this is only due to the scale of the plot. EC, pH and T profiles are generally constant with depth. The only feature worthy of note is that the EC in May 2002 was slightly lower than that measured at the other times, which is different to the other wells discussed above, possibly due to the different location (Fig. 1).
PN 57832 (capped artesian). Features worthy of note in these profiles are the EC steps at about 18 m, 30 m and 45 m (February 2003). The EC profile of October 2003 is slightly more saline than on the two previous occasions, and the positions of the two main EC steps are several metres higher than observed during February 2003. This is most likely due to greater vertical displacement of the profiles by flow up the well during October 2003, which could be caused by higher flow rates and/or a longer period of time with the cap removed before sonding. Another slight step in the EC profile at ~25 m coincides with a cross-over in the temperature profiles of May 2002 and February 2003. Because this well is located near PN 57829 and PN 57830, the EC profile from May 2002 (which is virtually constant with depth) is again higher than that of February 2003.
PN 57833 (SWL typically 0.2-0.8 m). This well is located on the western side of Scott Creek near PN 57814 but is completed in the fractured rock aquifer (as are the next two wells to be discussed). Step-like increases in the EC profile are evident (particularly in May 2002) at approximately 32.5 m, 48 m and 52 m below SWL. Only the first of these features is reflected in the temperature profiles and none of them appear in the pH profiles. The pH profile of October 2002 does however reveal one very interesting feature: relatively constant pH of ~7.5 to a depth of around 16 m, followed by a step up in pH to ~7.7, then an asymptotic decrease in pH with depth back towards the shallower value of ~7.5. Whilst tool malfunction cannot be discounted for this observation, the shape of the trends in pH with depth suggests that the step at ~16 m most likely reflects the presence of an important fracture, albeit this is not evident in the EC nor temperature profiles.

Hydrogeological Investigation of the Mount Lofty Ranges, Progress Report 3: Borehole water and formation characteristics at the Scott Bottom research site, Scott Creek Catchment 9
Rep
ortD
WLB
C20
04/0
3
RESULTS AND DISCUSSION
PN 57835 (SWL typically 0-1.0 m). These profiles are relatively featureless, although the EC log of May 2002 possibly shows the location of one or more fractures between about 37 m and 40 m below SWL.
PN 58094 (SWL typically 0.1-1.0 m). EC steps at around 34 m, 37 m and 48 m below SWL are evident in the May 2002 profile and, to a lesser degree, in the other two profiles. Smooth kicks in the pH and temperature profiles can also be seen at around 37 m. The location and EC range of the probable fracture at ~37 m are very similar to those of the fracture identified in nearby well PN 57835 (less than 20 m to the north) at 37-40 m. This suggests that a fracture may be continuous between the two wells and that it is either approximately horizontal or has a strike which matches the well orientations (about N-S).
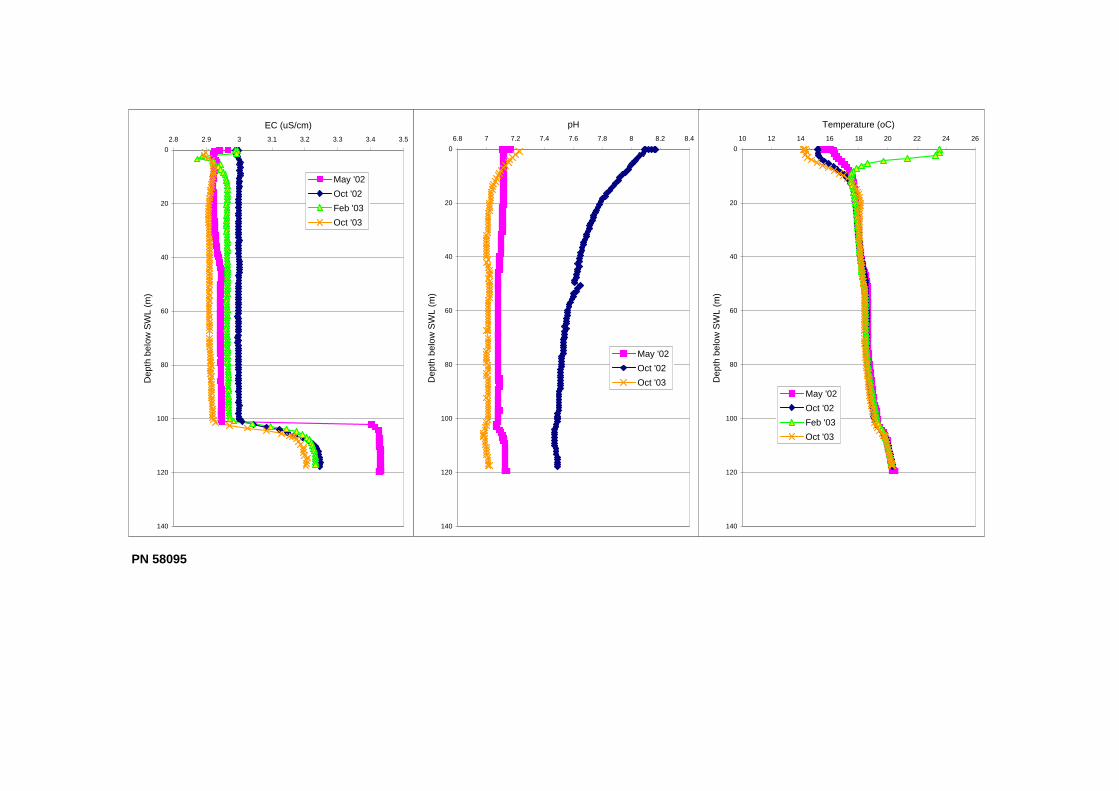
PN 58095 (SWL typically 0.2-0.6 m). Fortunately the obstruction seen at 65.7 m in this well (discussed above) did not prevent the sonde from penetrating below that depth. The most striking features of the profiles are an EC step at 101 m and a pH step at 50 m (deviations in the temperature profiles are also evident at both of these locations). Measurements beyond 120 m depth (to potentially 165 m) were not possible due to limitations with the length of the data cable.
Nine of the ten wells at this site were sonde profiled in each of May 2002, October 2002 and February 2003 (i.e. not PN 61149). Of these nine wells, only two (PN 58095 and PN 57831) returned EC profiles for May 2002 that were fresher (at least above the first major step) than those obtained in October 2002 and February 2003. This is most likely related to the distant location of these wells from the others, and hence different hydrogeological processes at the two locations within the Scott Bottom site.
PN 61149 (flowing artesian in October 2003). Sonde results for this well are very limited (and featureless) due to the obstruction at around 15.7 m. The slight pH kick of less than 0.1 unit corresponds with the location of the bottom of the casing.
3.3.2 IMPLICATIONS FOR SURFACE WATER-GROUNDWATER INTERACTIONS
The closest well to the eastern and western side of Scott Creek is PN 57832 and PN 57814 respectively. During times of low rainfall (i.e. summer) baseflow will contribute the majority of total creek discharge. If groundwater discharge to the creek is significant in this part of the catchment during summer, then the EC of the shallow groundwater close to the creek should approximate that of the creek at these times. Inspection of the EC profiles for all wells at Scott Bottom (particularly PN 57814 and PN 57832) shows EC values of greater than 2700 ECU for the entire well column at all times of the year, which is significantly higher (> 400 ECU) than the EC of the creek in summer for all years of record (Fig. 2). Therefore, it is inferred from these observations that baseflow out of Scott Creek catchment during summer is not sourced primarily from the Scott Bottom area. Furthermore, groundwater EC is generally much fresher in the middle and upper parts of this catchment (James-Smith and Harrington, 2002) thereby providing additional support for this finding.

Hydrogeological Investigation of the Mount Lofty Ranges, Progress Report 3: Borehole water and formation characteristics at the Scott Bottom research site, Scott Creek Catchment 10
Rep
ortD
WLB
C20
04/0
3
RESULTS AND DISCUSSION Figure 2. Salinity of Scott Creek at Scott Bottom Weir

Hydrogeological Investigation of the Mount Lofty Ranges, Progress Report 3: Borehole water and formation characteristics at the Scott Bottom research site, Scott Creek Catchment 11
Rep
ortD
WLB
C20
04/0
3
RESULTS AND DISCUSSION
3.3.3 EFFECTS OF ARTESIAN FLOW ON CHEMICAL PROFILES
Five of the wells at this site (PN 57829, 57830, 57832, 57833 and 57835) were observed to be flowing artesian once their sealed caps had been removed on 6 June 2002. In order to determine the difference in vertical flow distributions in the wells when they are shut-in compared with flowing, three of these wells were sonded at several different times after opening (App. C). These plots reveal varying degrees of change in the distribution of EC, pH and temperature in the well as time since opening increases.
Well PN 57830 shows almost no difference in the EC profiles measured at various times. The only zone in which slight deviations are observed is between about 23 m and 38 m below top of casing (TOC). This trend is reflected in the temperature and pH profiles, although the latter also demonstrates upward flow of water in the well from at least 23 m depth.
Well PN 57832 provides the most interesting results of the test, with upward flow in the well clearly evident from the temperature and EC profiles between 35-40 m depth and the surface. The EC profiles also indicate that relatively saline groundwater is entering the well at around 50 m once the cap is removed, and that it too travels up the well with increasing time. The pH profiles from this well are extremely difficult to interpret because the pH appears to be increasing throughout the well with increasing time.
Results from well PN 57833 are similar to those of PN 57830 in that the EC profile shows virtually no change with time. The temperature profiles below ~11 m remain unchanged, but above that depth they reveal upward flow in the well. The pH profiles also suggests upward flow in the well from about 20 m to the surface.
3.4 Vertical Flow Distribution At the time when borehole flow meter measurements were made at the site (i.e. November-December 2002) two of the six wells to be tested for vertical flow rates were flowing artesian after releasing their caps. In these instances, flow measurements were initially made on the free-flowing wells. The other four wells were also measured at this time. Approximately three weeks later, the two flowing wells were retested with a collar designed to reduce (and hopefully stop) flow at the well head. It is assumed that hydraulic conditions in the aquifer (and hence the well) did not change during this three week period. Results of the testing are presented in Appendix D, with positive and negative flows representing upward and downward respectively, and all depths are below TOC.
PN 57830 (flowing; TOC 0.365 m above ground level). Flow rates measured while this well was free-flowing ranged from 0 to 32.6 L/min. Below 40 m there was zero vertical flow in the well, but from that depth up to ~15 m flow rates progressively increased in the upward direction, with contributions from fractures clearly evident in the following zones: 35-40 m, 30-35 m, 25-30 m, 20-25 m (most significant) and 15-20 m. Between 10-15 m and 5-10 m upward flow rates progressively decreased, indicating probable loss of water into fractures through these zones.

Hydrogeological Investigation of the Mount Lofty Ranges, Progress Report 3: Borehole water and formation characteristics at the Scott Bottom research site, Scott Creek Catchment 12
Rep
ortD
WLB
C20
04/0
3
RESULTS AND DISCUSSION
Application of the restricting collar to well PN 57830 resulted in zero flow at the surface. As observed when the well was free-flowing, there was no vertical flow in the “shut-in” well below 40 m. However, between 25-40 m the shut-in flow was now downward at 3.4 to 4.9 L/min (cf. upward when free-flowing), before changing to significant upward flow (12.7 L/min) between 20-25 m. No change was observed in the flow rate between 15-20 m before it decreased gradually back to zero at 5 m (in the surface casing).
The main difference between these two flow profiles is the change in direction and magnitude of flow between 25-40 m. This finding coincides with the slight deviations that were observed in the EC, temperature and pH profiles across the same zone at different lengths of time after removing the well cap (Section 3.3.3 and App. C). The most significant increase in upward flow rate from both tests occurred between 20-25 m which corresponds to the negative shift in temperature profiles observed in this interval (App. B).
PN 57832 (flowing; TOC 0.117 m above ground level). The free-flowing test produced upward flows throughout the well ranging between 1.1-18.8 L/min. Increases in the flow rate caused by contributions of water from fractures were observed between 45-50 m and 40-45 m. Flow between 30-40 m was relatively constant (18.3-18.8 L/min) but decreased between 25-30 m. Flow was also constant (~ 17 L/min) above 25 m.
The restrictive collar could not stop flow from this well, but it did reduce the flow rate in the casing to ~1.6 L/min. In doing this, flow in the bottom 5 m of the well (i.e. 45-50 m) was now at a very low rate in the downward direction. The flow then switched to upwards above 45 m where it remained at 1.1-1.8 L/min up to the surface.
Again the main difference between the free-flowing and shut-in profiles was the reversal in direction of the flow in the deeper parts of the well. The change from low rates of downward flow between 45-50 m to higher rates of upward flow as a result of removing the well cap provides an explanation for the appearance of a saline bulge at the base of the EC profile (Section 3.3.3 and App. C).
PN 57833 (not flowing; TOC 0.07 m above ground level). All flow in this well was upward, with increasing flow rates (gaining water) between 25-30 m and 15-25 m, and decreasing flow rates (losing water) between 20-25 m and 10-15 m.
PN 57835 (not flowing; TOC 0.12 m above ground level). All flow was upwards at an approximately constant rate of ~34 L/min between 25-35 m, and a progressively decreasing rate (i.e. loss of water) in each of the following zones: 20-25 m, 16-20 m, 14-16 m and 10-14 m.
PN 58094 (not flowing; TOC 0.05 m above ground level). All flow was upward above 40 m depth (at which it was zero). Flow rates progressively increased up the well between 35-40 m, 30-35 m, 25-30 m and 20-25 m; then decreased between 15-20 m and 10-15 m. The greatest increase in flow rate across a 5 m interval of the well was between 35-40 m which corresponds to the large EC step observed in this interval (App. B). In addition, the greatest decrease in flow rate was observed between 15-20 m which may explain why the temperature profiles begin to deviate above this zone.

Hydrogeological Investigation of the Mount Lofty Ranges, Progress Report 3: Borehole water and formation characteristics at the Scott Bottom research site, Scott Creek Catchment 13
Rep
ortD
WLB
C20
04/0
3
RESULTS AND DISCUSSION
PN 58095 (not flowing; TOC 0.32 m above ground level). Vertical flow rates in this well are generally much lower than those in the other five measured wells. Whilst all of the flow in the production zone of this well (below ~43 m depth) is upward, the maximum rate of flow is ~1.9 L/min at 55 m and it decreases up the well to ~0.1 L/min near the bottom of the casing. More than 60% of this drop in flow rate is lost between 50-55 m which corresponds to the location of the pH step (App B).

Hydrogeological Investigation of the Mount Lofty Ranges, Progress Report 3: Borehole water and formation characteristics at the Scott Bottom research site, Scott Creek Catchment 14
Rep
ortD
WLB
C20
04/0
3
4 SUMMARY
Simultaneous interpretation of the datasets presented above enables a number of important fractures to be identified in each well. Table 1 provides a summary of all identifiable fracture locations determined from one or more of these datasets. While there are possibly other active fractures in each well that will require more specialised techniques to be located (e.g. acoustic scanning, applied tracer tests), Table 1 should serve as a guide for possible sampling sites and zones in which to focus future tests.

Hydrogeological Investigation of the Mount Lofty Ranges, Progress Report 3: Borehole water and formation characteristics at the Scott Bottom research site, Scott Creek Catchment 15
Rep
ortD
WLB
C20
04/0
3
SUMMARY
Table 1. Approximate locations of all identifiable fractures in the 10 wells at Scott Bottom
Numbers in bold reflect most active fractures. Depths are in metres below ground level. Letters denote source of evidence: G = geophysical logs (App. A), V = video, S = sonde (App. B) and F = borehole flow meter (App. D).
PN 57814 PN 57829 PN 57830 PN 57831 PN 57832 PN 57833 PN 57835 PN 58094 PN 58095 PN 61149
Wel
l com
plet
ed w
ith s
lotte
d PV
C
in A
lluvi
um
29.6 (VS) 35.5 (VS) 44 (S) 53 (S)
9.1 (GVF) 10-15 (F) 15-20 (F) 22 (GVSF) 25-30 (F) 30-35 (F) 37 (GVSF)
11.6 (V) 12.6 (V)
13.6 (GV) 18 (S) 21 (GV) 25 (SF) 28 (GVF) 30 (SF) 38 (GV) 45 (GSF) 48 (GF)
11 (GF) 15 (GVF) 16 (SF) 20 (GV) 22.9 (VF) 28.5 (GVF) 31 (GV) 32.2 (VSF) 48 (SF) 52 (SF)
12.25 (GVF) 14.85 (GVF) 17.5 (GVF) 21.3 (GVF) 22.8 (V) 28.8 (V) 30.5 (G) 30.9 (V) 37-40 (VSF)
14.2 (GVF) 17 (GF) 19.5 (GF) 23.2 (GF) 25-30 (F) 34 (GVSF) 37.45 (GVSF) 48 (S)
41.6 (V) 50.4 (SF) 64 (V) 64.4 (V)
64.8 (V) 65.3 (V) 101 (S)
Obstruction at 15.7 m

Hydrogeological Investigation of the Mount Lofty Ranges, Progress Report 3: Borehole water and formation characteristics at the Scott Bottom research site, Scott Creek Catchment 16
Rep
ortD
WLB
C20
04/0
3
5 RECOMMENDATIONS AND FUTURE WORK
Given that this site is one of the best instrumented research sites for determining recharge rates and groundwater flow patterns/rates in the Mount Lofty Ranges, the future program of work is almost endless. Besides a continuation of monitoring water levels and chemical profiles in the wells, forecasted field work at this site will include sampling of all wells for environmental chemistry and isotopes, applied tracer tests and installation of the multi-level sampling device into the cored well (PN 61149). The latter will enable simultaneous head measurements and sampling from numerous, discrete intervals of the well, as well as several hydraulic and chemical interference tests. However, before any of this work can be done, the two wells which have been obstructed by collapsed rocks (PN 58095 and PN 61149) should be cleaned out and have remedial works, and access to well PN 57829 should be improved.

Hydrogeological Investigation of the Mount Lofty Ranges, Progress Report 3: Borehole water and formation characteristics at the Scott Bottom research site, Scott Creek Catchment 17
Rep
ortD
WLB
C20
04/0
3
6 REFERENCES
James-Smith, J.M. and Harrington, G.A., 2002. Hydrogeological investigation of the Mount Lofty Ranges, Progress report 1: hydrogeology and drilling phase 1 for Scott Creek catchment. Report DWLBC 2002/17.

Hydrogeological Investigation of the Mount Lofty Ranges, Progress Report 3: Borehole water and formation characteristics at the Scott Bottom research site, Scott Creek Catchment 18
Rep
ortD
WLB
C20
04/0
3
7 APPENDIX A
GEOPHYSICAL LOGS

PN 57830
Gamma
0
10
20
30
40
50
0 50 100 150 200Neutron
0
10
20
30
40
50
0 500 1000 1500SP
0
10
20
30
40
50
-500 -300 -100 100 300 500PR
0
10
20
30
40
50
0 20 40 60 80 100 120Caliper
0
10
20
30
40
50
100 150 200 250Density
0
10
20
30
40
50
0 0.5 1 1.5 2 2.5 3Salinity (ppm)
0
10
20
30
40
50
1400 1500 1600 1700 1800

PN 57832
Gamma
0
1
2
3
4
5
6
7
8
9
10
11
12
13
14
15
16
17
18
19
20
21
22
23
24
25
26
27
28
29
30
31
32
33
34
35
36
37
38
39
40
41
42
43
44
45
46
47
48
49
50
51
52
53
54
55
0 50 100 150 200
Neutron
0
1
2
3
4
5
6
7
8
9
10
11
12
13
14
15
16
17
18
19
20
21
22
23
24
25
26
27
28
29
30
31
32
33
34
35
36
37
38
39
40
41
42
43
44
45
46
47
48
49
50
51
52
53
54
55
0 200 400 600 800 1000 1200
SP
0
1
2
3
4
5
6
7
8
9
10
11
12
13
14
15
16
17
18
19
20
21
22
23
24
25
26
27
28
29
30
31
32
33
34
35
36
37
38
39
40
41
42
43
44
45
46
47
48
49
50
51
52
53
54
55
-200 -150 -100 -50 0 50 100
PR
0
1
2
3
4
5
6
7
8
9
10
11
12
13
14
15
16
17
18
19
20
21
22
23
24
25
26
27
28
29
30
31
32
33
34
35
36
37
38
39
40
41
42
43
44
45
46
47
48
49
50
51
52
53
54
55
0 100 200 300 400 500 600
Caliper
0
1
2
3
4
5
6
7
8
9
10
11
12
13
14
15
16
17
18
19
20
21
22
23
24
25
26
27
28
29
30
31
32
33
34
35
36
37
38
39
40
41
42
43
44
45
46
47
48
49
50
51
52
53
54
55
100 110 120 130 140 150 160 170
Density
0
1
2
3
4
5
6
7
8
9
10
11
12
13
14
15
16
17
18
19
20
21
22
23
24
25
26
27
28
29
30
31
32
33
34
35
36
37
38
39
40
41
42
43
44
45
46
47
48
49
50
51
52
53
54
55
1 1.5 2 2.5
Salinity (ppm)
0
1
2
3
4
5
6
7
8
9
10
11
12
13
14
15
16
17
18
19
20
21
22
23
24
25
26
27
28
29
30
31
32
33
34
35
36
37
38
39
40
41
42
43
44
45
46
47
48
49
50
51
52
53
54
55
1450 1470 1490 1510 1530 1550

PN 57833
Gamma
0
1
2
3
4
5
6
7
8
9
10
11
12
13
14
15
16
17
18
19
20
21
22
23
24
25
26
27
28
29
30
31
32
33
34
35
36
37
38
39
40
41
42
43
44
45
46
47
48
49
50
0 50 100 150
Neutron
0
1
2
3
4
5
6
7
8
9
10
11
12
13
14
15
16
17
18
19
20
21
22
23
24
25
26
27
28
29
30
31
32
33
34
35
36
37
38
39
40
41
42
43
44
45
46
47
48
49
50
0 500 1000 1500
SP
0
1
2
3
4
5
6
7
8
9
10
11
12
13
14
15
16
17
18
19
20
21
22
23
24
25
26
27
28
29
30
31
32
33
34
35
36
37
38
39
40
41
42
43
44
45
46
47
48
49
50
-1000 -800 -600 -400 -200 0 200 400
PR
0
1
2
3
4
5
6
7
8
9
10
11
12
13
14
15
16
17
18
19
20
21
22
23
24
25
26
27
28
29
30
31
32
33
34
35
36
37
38
39
40
41
42
43
44
45
46
47
48
49
50
0 50 100 150 200 250
Caliper
0
1
2
3
4
5
6
7
8
9
10
11
12
13
14
15
16
17
18
19
20
21
22
23
24
25
26
27
28
29
30
31
32
33
34
35
36
37
38
39
40
41
42
43
44
45
46
47
48
49
50
100 120 140 160 180 200 220
Density
0
1
2
3
4
5
6
7
8
9
10
11
12
13
14
15
16
17
18
19
20
21
22
23
24
25
26
27
28
29
30
31
32
33
34
35
36
37
38
39
40
41
42
43
44
45
46
47
48
49
50
0 0.5 1 1.5 2 2.5 3
Salinity (ppm)
0
1
2
3
4
5
6
7
8
9
10
11
12
13
14
15
16
17
18
19
20
21
22
23
24
25
26
27
28
29
30
31
32
33
34
35
36
37
38
39
40
41
42
43
44
45
46
47
48
49
50
1600 1650 1700 1750 1800 1850 1900

PN 57835
Gamma
0
1
2
3
4
5
6
7
8
9
10
11
12
13
14
15
16
17
18
19
20
21
22
23
24
25
26
27
28
29
30
31
32
33
34
35
36
37
38
39
40
0 50 100 150
Neutron
0
1
2
3
4
5
6
7
8
9
10
11
12
13
14
15
16
17
18
19
20
21
22
23
24
25
26
27
28
29
30
31
32
33
34
35
36
37
38
39
40
0 200 400 600 800 1000 1200 1400
SP
0
1
2
3
4
5
6
7
8
9
10
11
12
13
14
15
16
17
18
19
20
21
22
23
24
25
26
27
28
29
30
31
32
33
34
35
36
37
38
39
40
-1000 -800 -600 -400 -200 0 200
PR
0
1
2
3
4
5
6
7
8
9
10
11
12
13
14
15
16
17
18
19
20
21
22
23
24
25
26
27
28
29
30
31
32
33
34
35
36
37
38
39
40
0 100 200 300 400 500 600 700
Caliper
0
1
2
3
4
5
6
7
8
9
10
11
12
13
14
15
16
17
18
19
20
21
22
23
24
25
26
27
28
29
30
31
32
33
34
35
36
37
38
39
40
100 120 140 160 180 200 220
Density
0
1
2
3
4
5
6
7
8
9
10
11
12
13
14
15
16
17
18
19
20
21
22
23
24
25
26
27
28
29
30
31
32
33
34
35
36
37
38
39
40
0 0.5 1 1.5 2 2.5
Salinity (ppm)
0
1
2
3
4
5
6
7
8
9
10
11
12
13
14
15
16
17
18
19
20
21
22
23
24
25
26
27
28
29
30
31
32
33
34
35
36
37
38
39
40
1.74 1.76 1.78 1.8 1.82 1.84 1.86 1.88

PN 58094
Gamma
0
1
2
3
4
5
6
7
8
9
10
11
12
13
14
15
16
17
18
19
20
21
22
23
24
25
26
27
28
29
30
31
32
33
34
35
36
37
38
39
40
41
42
43
44
45
46
47
48
49
50
51
52
53
54
55
0 50 100 150
Neutron
0
1
2
3
4
5
6
7
8
9
10
11
12
13
14
15
16
17
18
19
20
21
22
23
24
25
26
27
28
29
30
31
32
33
34
35
36
37
38
39
40
41
42
43
44
45
46
47
48
49
50
51
52
53
54
55
0 500 1000 1500
SP
0
1
2
3
4
5
6
7
8
9
10
11
12
13
14
15
16
17
18
19
20
21
22
23
24
25
26
27
28
29
30
31
32
33
34
35
36
37
38
39
40
41
42
43
44
45
46
47
48
49
50
51
52
53
54
55
-1000 -800 -600 -400 -200 0 200
PR
0
1
2
3
4
5
6
7
8
9
10
11
12
13
14
15
16
17
18
19
20
21
22
23
24
25
26
27
28
29
30
31
32
33
34
35
36
37
38
39
40
41
42
43
44
45
46
47
48
49
50
51
52
53
54
55
0 100 200 300 400 500 600 700
Caliper
0
1
2
3
4
5
6
7
8
9
10
11
12
13
14
15
16
17
18
19
20
21
22
23
24
25
26
27
28
29
30
31
32
33
34
35
36
37
38
39
40
41
42
43
44
45
46
47
48
49
50
51
52
53
54
55
100 120 140 160 180 200 220
Density
0
1
2
3
4
5
6
7
8
9
10
11
12
13
14
15
16
17
18
19
20
21
22
23
24
25
26
27
28
29
30
31
32
33
34
35
36
37
38
39
40
41
42
43
44
45
46
47
48
49
50
51
52
53
54
55
0 0.5 1 1.5 2 2.5 3
Salinity (ppm)
0
1
2
3
4
5
6
7
8
9
10
11
12
13
14
15
16
17
18
19
20
21
22
23
24
25
26
27
28
29
30
31
32
33
34
35
36
37
38
39
40
41
42
43
44
45
46
47
48
49
50
51
52
53
54
55
0 500 1000 1500 2000 2500

Hydrogeological Investigation of the Mount Lofty Ranges, Progress Report 3: Borehole water and formation characteristics at the Scott Bottom research site, Scott Creek Catchment 24
Rep
ortD
WLB
C20
04/0
3
8 APPENDIX B
SEASONAL SONDE RESULTS

PN 57814
0
0.5
1
1.5
2
2.5
3
3.5
4
4.5
5
2.8 2.9 3 3.1 3.2 3.3 3.4 3.5
EC (uS/cm)D
epth
bel
ow S
WL
(m)
May '02Oct '02Feb '03Oct '03
0
0.5
1
1.5
2
2.5
3
3.5
4
4.5
5
0 2 4 6 8 10 12
pH
Dep
th b
elow
SW
L (m
)
May '02Oct '02Oct '03
0
0.5
1
1.5
2
2.5
3
3.5
4
4.5
5
0 5 10 15 20 25
Temperature (oC)
Dep
th b
elow
SW
L (m
)
May '02Oct '02Feb '03Oct '03

PN 57829
0
10
20
30
40
50
60
2.6 2.7 2.8 2.9 3 3.1 3.2
EC (uS/cm)D
epth
bel
ow S
WL
(m)
May '02Oct '02Feb '03Oct '03
0
10
20
30
40
50
60
7 7.2 7.4 7.6 7.8 8 8.2
pH
Dep
th b
elow
SW
L (m
)
May '02Oct '02Oct '03
0
10
20
30
40
50
60
10 15 20 25
Temperature (oC)
Dep
th b
elow
SW
L (m
)
May '02Oct '02Feb '03Oct '03

PN 57830
0
10
20
30
40
50
60
2.5 2.7 2.9 3.1 3.3 3.5 3.7 3.9
EC (mS/cm)
Dep
th b
elow
SW
L (m
)
May '02Oct '02Feb '03Oct '03
0
10
20
30
40
50
60
7 7.2 7.4 7.6 7.8 8 8.2 8.4
pH
Dep
th b
elow
SW
L (m
)
May '02Oct '02Oct '03
0
10
20
30
40
50
60
16.8 17 17.2 17.4 17.6 17.8 18 18.2 18.4 18.6
Temperature (oC)
Dep
th b
elow
SW
L (m
)
May '02Oct '02Feb '03Oct '03

PN 57831
0
2
4
6
8
10
12
14
2.8 2.85 2.9 2.95 3 3.05 3.1
EC (mS/cm)
Dep
th b
elow
SW
L (m
)
May '02Oct '02Feb '03Oct '03
0
2
4
6
8
10
12
14
6.4 6.6 6.8 7 7.2 7.4 7.6
pH
Dep
th b
elow
SW
L (m
)
May '02Oct '02Oct '03
0
2
4
6
8
10
12
14
10 12 14 16 18 20 22
Temperature (oC)
Dep
th b
elow
SW
L (m
)
May '02Oct '02Feb '03Oct '03

PN 57832
0
10
20
30
40
50
60
2.8 2.85 2.9 2.95 3 3.05 3.1 3.15
EC (mS/cm)
Dep
th b
elow
SW
L (m
)
May '02Feb '03Oct '03
0
10
20
30
40
50
60
7.05 7.1 7.15 7.2 7.25 7.3 7.35 7.4
pH
Dep
th b
elow
SW
L (m
)
May '02Oct '03
0
10
20
30
40
50
60
16.5 17 17.5 18 18.5
Temperature (oC)
Dep
th b
elow
SW
L (m
)
May '02Feb '03Oct '03

PN 57833
0
10
20
30
40
50
60
2.5 3 3.5 4 4.5
EC (mS/cm)
Dep
th b
elow
SW
L (m
)
May '02Oct '02Feb '03Oct '03
0
10
20
30
40
50
60
7 7.2 7.4 7.6 7.8 8 8.2 8.4
pH
Dep
th b
elow
SW
L (m
) May '02Oct '02Oct '03
0
10
20
30
40
50
60
10 12 14 16 18 20 22
Temperature (oC)
Dep
th b
elow
SW
L (m
)
May '02Oct '02Feb '03Oct '03

PN 57835
0
5
10
15
20
25
30
35
40
45
2 2.5 3 3.5 4
EC (mS/cm)
Dep
th b
elow
SW
L (m
) May '02Oct '02Feb '03Oct '03
0
5
10
15
20
25
30
35
40
45
6.8 7 7.2 7.4 7.6 7.8 8 8.2 8.4 8.6
pH
Dep
th b
elow
SW
L (m
)
May '02Oct '02Oct '03
0
5
10
15
20
25
30
35
40
45
10 12 14 16 18 20 22
Temperature (oC)
Dep
th b
elow
SW
L (m
) May '02Oct '02Feb '03Oct '03
PN 58094
0
10
20
30
40
50
60
2.5 3 3.5 4 4.5 5
EC (uS/cm)
Dep
th b
elow
SW
L (m
)
May '02Oct '02Feb '03Oct '03
0
10
20
30
40
50
60
7 7.2 7.4 7.6 7.8 8 8.2 8.4
pH
Dep
th b
elow
SW
L (m
)
May '02Oct '02Oct '03
0
10
20
30
40
50
60
10 12 14 16 18 20 22
Temperature (oC)
Dep
th b
elow
SW
L (m
)
May '02Oct '02Feb '03Oct '03
PN 58095
0
20
40
60
80
100
120
140
2.8 2.9 3 3.1 3.2 3.3 3.4 3.5
EC (uS/cm)
Dep
th b
elow
SW
L (m
)
May '02Oct '02Feb '03Oct '03
0
20
40
60
80
100
120
140
6.8 7 7.2 7.4 7.6 7.8 8 8.2 8.4
pH
Dep
th b
elow
SW
L (m
)
May '02Oct '02Oct '03
0
20
40
60
80
100
120
140
10 12 14 16 18 20 22 24 26
Temperature (oC)
Dep
th b
elow
SW
L (m
)
May '02Oct '02Feb '03Oct '03

PN 61149 (October 2003)
0
2
4
6
8
10
12
14
16
18
2.9 2.92 2.94 2.96 2.98 3
EC (mS/cm)D
epth
(m b
elow
SW
L)0
2
4
6
8
10
12
14
16
18
7 7.02 7.04 7.06 7.08 7.1 7.12
pH
Dep
th (m
bel
ow S
WL)
0
2
4
6
8
10
12
14
16
18
17.6 17.8 18 18.2 18.4 18.6
Temperature (oC)
Dep
th (m
bel
ow S
WL)

Hydrogeological Investigation of the Mount Lofty Ranges, Progress Report 3: Borehole water and formation characteristics at the Scott Bottom research site, Scott Creek Catchment 35
Rep
ortD
WLB
C20
04/0
3
9 APPENDIX C
FLOWING-WELL SONDE RESULTS

PN 57830
0
10
20
30
40
50
60
2.5 2.7 2.9 3.1 3.3 3.5
20 days prior0 min20 min130 min
0
10
20
30
40
50
60
13 14 15 16 17 18 19
20 days prior0 min20 min130 min
0
10
20
30
40
50
60
7 7.2 7.4 7.6 7.8 8 8.2
20 days prior0 min20 min130 min

PN 57832
0
10
20
30
40
50
60
2.8 2.85 2.9 2.95 3 3.05
20 days prior0 min110 min200 min
0
10
20
30
40
50
60
12 14 16 18
20 days prior0 min110 min200 min
0
10
20
30
40
50
60
7 7.5 8 8.5
20 days prior0 min110 min200 min

PN 57833
0
10
20
30
40
50
60
3 3.5 4 4.5
20 days prior0 min30 min
0
10
20
30
40
50
60
12 14 16 18 20
20 days prior0 min30 min
0
10
20
30
40
50
60
7.2 7.4 7.6 7.8 8 8.2 8.4 8.6
20 days prior0 min30 min

Hydrogeological Investigation of the Mount Lofty Ranges, Progress Report 3: Borehole water and formation characteristics at the Scott Bottom research site, Scott Creek Catchment 39
Rep
ortD
WLB
C20
04/0
3
10 APPENDIX D
BOREHOLE FLOWMETER RESULTS

Hydrogeological Investigation of the Mount Lofty Ranges, Progress Report 3: Borehole water and formation characteristics at the Scott Bottom research site, Scott Creek Catchment 40
Rep
ortD
WLB
C20
04/0
3
PN 57830
0
10
20
30
40
50
60
-10 -5 0 5 10 15 20 25 30 35
Flow (L/min)D
epth
(m)
19/11/20029/12/2002
PN 57832
0
10
20
30
40
50
60
-5 0 5 10 15 20Flow (L/min)
Dep
th (m
)
19/11/20029/12/2002

Hydrogeological Investigation of the Mount Lofty Ranges, Progress Report 3: Borehole water and formation characteristics at the Scott Bottom research site, Scott Creek Catchment 41
Rep
ortD
WLB
C20
04/0
3
PN 57833
0
5
10
15
20
25
30
35
-2 0 2 4 6 8 10 12Flow (L/min)
Dep
th (m
)
18/11/2002
PN 57835
0
5
10
15
20
25
30
35
40
-5 0 5 10 15 20 25 30 35 40Flow (L/min)
Dep
th (m
)
18/11/2002

Hydrogeological Investigation of the Mount Lofty Ranges, Progress Report 3: Borehole water and formation characteristics at the Scott Bottom research site, Scott Creek Catchment 42
Rep
ortD
WLB
C20
04/0
3
PN 58094
0
5
10
15
20
25
30
35
40
45
-2 0 2 4 6 8 10Flow (L/min)
Dep
th (m
)
19/11/2002
PN 58095
0
10
20
30
40
50
60
70
-0.5 0 0.5 1 1.5 2Flow (L/min)
Dep
th (m
)
18/11/2002