HYDROGEN/DEUTERIUM EXCHANGE MASS ......HDX results in 3D structure and Heat map 240 1. Intact HDX...
1
TO DOWNLOAD A COPY OF THIS POSTER, VISIT WWW.WATERS.COM/POSTERS 3. HDX results in 3D structure and Heat map 1. Intact HDX OVERVIEW This study is to investigate the conformational changes in calcium binding protein, calmodulin, utilizing a Waters nanoACQUITY UPLC ® System with Hydrogen/Deuterium Exchange (HDX) Technology. INTRODUCTION Hydrogen/deuterium exchange mass spectrometry (HDX MS) has proven to be a useful analytical method for the study of protein dynamics and changes to protein conformation. The applications in HDX MS require a system that can perform rapid chromatographic separations at 0 °C and accurate mass measurements of deuterium labeled proteins and peptides with small quantities of material. Recent improvements in LC-MS have made HDX MS an indispensible tool for discovery and development of protein drugs. In this study, a nanoACQUITY UPLC System with dedicated cooled module (HDX manager) was used as a robust HDX MS platform for protein conformational analysis. In this system, online pepsin digestion was coupled to highly reproducible separation performed at low temperature. 1 High sequence coverage, up to 94% was obtained by the confident peptide identification. Precursor and fragment ions were acquired in a data-independent manner by alternating the collision energy between a low and elevated energy state on a Q-Tof Mass spectrometer (MS E ). We report a recent HDX MS study of conformational changes in important intracellular protein, calmodulin with calcium bound (holo) and without calcium (apo). METHODS Waters nanoACQUITY UPLC ® with HDX Technology Binary Solvent Manager (BSM): Eluent A: 0.1 % formic acid in water, Eluent B: 0.1 % formic acid in acetonitrile Auxiliary Solvent Manger (ASM): Eluent A: 0.05 % formic acid in water HDX manager : online digestion/desalting and separation at 0 °C Waters Xevo ® QTof MS ESI positive mode was used. Capillary/Cone: 3.0 kV/37 V, Source/ Desolvation temperature: 80 °C / 175 °C, Desolvation gas: 800 L/h Chromatography Peptides: The analytical column was an ACQUITY UPLC ® BEH C18 1.7 μm 1.0 x 100 mm. The trap column was an ACQUITY UPLC VanGuard ® Pre-column, BEH C18, 1.7 μm 2.1 x 5 mm. Intact Protein : The analytical column was an ACQUITY UPLC ® BEH C4 1.7 μm 2.1 x 50 mm. The desalting column was used a MassPREP Desalting cartridge column, 2.1 x 5 mm. On-line pepsin digestion : 2.1 x 30 mm pepsin column from Applied Biosystems was used. Protein preparation Calmodulin protein (CaM) from Sigma was prepared with calcium (Holo) and without calcium bound (apo). 2 Labeling solution was prepared with 20 mM HEPES in D 2 O at pH 7.07 with CaCl2 for holo and without CaCl 2 for Apo. The labeled protein was quenched after the timed incubation with 33 mM HCl to pH 2.5. HYDROGEN/DEUTERIUM EXCHANGE MASS SPECTROMETRY SYSTEM FOR INVESTIGATING CONFORMATIONAL CHANGES IN CALMODULIN PROTEIN UPON CALCIUM BINDING Joomi Ahn 1 , Michael Eggertson 1 , Martha Stapels 1 , Keith Fadgen 1 , Rebecca J. Rose 2, 3 , Ying Qing Yu 1 , Albert J. R. Heck 2, 3 , Jeffrey R. Mazzeo 1 1 Waters Corporation, 2 Biomolecular Mass Spectrometry and Proteomics Group, Bijvoet Center for Biomolecular Research and Utrecht Institute for Pharmaceutical Sciences, Utrecht University, Netherlands 3 Netherlands Proteomics Centre, Utrecht, Netherlands RESULTS & DISCUSSION CONCLUSIONS The nanoACQUITY UPLC System with HDX Technology was very useful as a robust HDX MS platform for studying protein conformation. Global and local conformation of CaM were analyzed. The peptide-level comparison revealed the location of conformational changes. No visible change and minor change were observed upon various conditions for stability experiments. This HDX information is useful to better understand biophysical properties of the biomolecules. References 1. Wales, et al. (2008) Anal. Chem., 80, 6815-6820 2. Zhu, et al. (2003) Biochem., 42, 15388-15397 3. www.hxms.com/mstools/ 4. www.hxms.com/HXExpress Acknowledgement Authors would like to thank Prof. John R. Engen and Dr. Tomas Wales for helpful input. Figure 6. Heat map of the entire CaM sequence for comparing HDX results. Two sets of colored bands of heat map represent the % deuterium uptake of CaM time course for apo CaM (top) and holo (bottom). Darker color represents less exchange. The highlighted region of the black box indicates the region with conformational change; different color trend was observed between apo and holo. The red circle represents no change. Figure 1. Workflow of HDX MS analysis for peptide level. Protein labeling and injection can be automated using Leap HDX automation manager (blue line). Digestion and separation can be done at 0 °C inside of a HDX manager. COOLED TO 0˚C OPTIONAL AUTOMATION Online Pepsin digestion pH 2.5 at 0 °C nanoACQUITY UPLC using 1.7 μm BEH column in fast separation ESI Q‐Tof MS Non‐labeled : PLGS Identity E (MS E ) Protein in H2O, pH 7 at 20 °C Protein labeling occurs Labelling quenched chemically and back‐exchange minimised Reduce pH to 2.5, temp to 0˚C Add 20‐fold excess D 2 O Local Analysis at Peptide Level Global Analysis at Intact Level Labeled : HDX Browser & HX‐Express Peptide Map HDX Result Figure 5. Deuterium uptake information represented in CaM apo and holo 3D structures in time course at 10s, 1m, 10m, 60m, 240m labeling. At 10 s labeling, the same region of CaM were compared in black circles for apo and holo. Because of no calcium bound in apo, increased deuterium incorporation was found. 0 10 20 30 40 50 60 70 80 Relative % deuterium uptake Figure 2. (A) HDX analyses presented in this study utilized Waters nanoACQUITY UPLC system with HDX technology. The system consists of HDX manager (top unit), nano binary solvent manager (middle), and nano auxiliary solvent manager (bottom unit). (B) Xevo QTof MS ESI-MS (C) ProteinLynx Global Server™ (PLGS) ver.2.4 with Identity E for accurate peptide identification. (A) 2.4 (C) (B) Figure 3(A) Intact protein analysis is shown for global HDX MS. Intact spectra of apo and holo CaM showed the mass shift from the control to each time point at charge state 10+. Apo CaM showed greater mass shift than the holo (red arrows) due to the conformational change. (A) m/z 1680 1700 1720 % 0 100 % 0 100 % 0 100 % 0 100 % 0 100 % 0 100 % 0 100 1692.3646 1716.0874 1692.4429 1716.2711 1691.4786 1715.3264 1690.4626 1714.1721 1688.0149 1711.8644 1685.9591 1679.9030 1703.7478 m/z 1680 1700 1720 % 0 100 % 0 100 % 0 100 % 0 100 % 0 100 % 0 100 % 0 100 1691.5048 1715.4052 1689.8114 1713.6997 1687.5203 1711.4712 1686.6616 1710.5801 1684.5024 1682.9686 1706.9659 1679.9291 240 m 60 m 10 m 5m 1m 10 s Control 0s Apo CaM Holo CaM Deuterium uptake of intact level 0 20 40 60 80 100 120 140 0 1 10 100 1000 Relative Deuterium (Da) Time (min) APO HOLO 36 Da increase at 1 min labeling 2. Peptide HDX Figure 4(A) Peptide analysis is shown for local HDX MS. The chromatograms of CaM peptides digested by online pepsin column was shown in left panel and The spectra for one of the peptides was shown in the right panel. The increased mass shift was seen from control (0s) to each time point (10s, 1m, 10m, 60m, and 240m) due to longer time exposure in deuterium labeling. (B) 94 % sequence coverage was achieved with many overlapping peptides. These peptides were identified by PLGS and the map was constructed 3 with common peptides exist both in apo and holo. (A) Spectra (B) (C) HDX Browser Peptide Map : 94 % coverage (D) 0 2 4 6 8 10 12 0.10 1.00 10.00 100.00 1000.00 Relative Deuterium Level (Da) Time (min) 128-140 APO HOLO 0 1 2 3 4 5 6 7 8 9 10 0.10 1.00 10.00 100.00 1000.00 Relative Deuterium Level (Da) Time (min) 128-138 APO HOLO 0 1 2 3 4 5 6 7 8 9 0.10 1.00 10.00 100.00 1000.00 Relative Deuterium Level (Da) Time (min) 37-47 APO HOLO 0 1 2 3 4 5 6 7 8 9 0.10 1.00 10.00 100.00 1000.00 Relative Deuterium Level (Da) Time (min) 35-45 APO HOLO YES No Has conformation changed? at [M+10H] 10+ Deuterium uptake of peptide level Time 3.00 4.00 5.00 6.00 7.00 8.00 % 0 100 3.00 4.00 5.00 6.00 7.00 8.00 % 0 100 3.00 4.00 5.00 6.00 7.00 8.00 % 0 100 3.00 4.00 5.00 6.00 7.00 8.00 % 0 100 3.00 4.00 5.00 6.00 7.00 8.00 % 0 100 3.00 4.00 5.00 6.00 7.00 8.00 % 0 100 Labeling time 240 m 60 m 10 m 1m 10 s 0s m/z 600 605 610 % 0 100 % 0 100 % 0 100 % 0 100 % 0 100 % 0 100 Chromatogram Figure 4(C) Waters HDX Browser software was used to link the labeled raw data with peptide information and to display them in m/z and time. This software significantly reduced the data processing time. (D) The deuterium uptake curves for apo and holo comparison in peptide level. Top curves (peptide 128-140 and 128-138) illustrate that there are distinct difference in deuterium uptake between apo and holo. This means that there are obvious conformational changes in these regions. The bottom curves for peptides 37-47 and 35-45 showed no change in deuterium uptake. HX-Express was used to measure the deuterium uptake. 4 10 sec 1 min 10 min 60 min control control ICFD.pdb 1PRW.pdb 36 % exchanged APO HOLO 6 % exchanged Apo Holo Apo Holo Apo Holo Apo Holo Change No Change Figure 3(B) The deuterium uptake curves in intact protein comparison is shown. The mass shift in y-axis was calculated from the deconvoluted intact mass. The global level conformational change was revealed by running fast intact HDX screening. (B)
Transcript of HYDROGEN/DEUTERIUM EXCHANGE MASS ......HDX results in 3D structure and Heat map 240 1. Intact HDX...
TO DOWNLOAD A COPY OF THIS POSTER, VISIT WWW.WATERS.COM/POSTERS
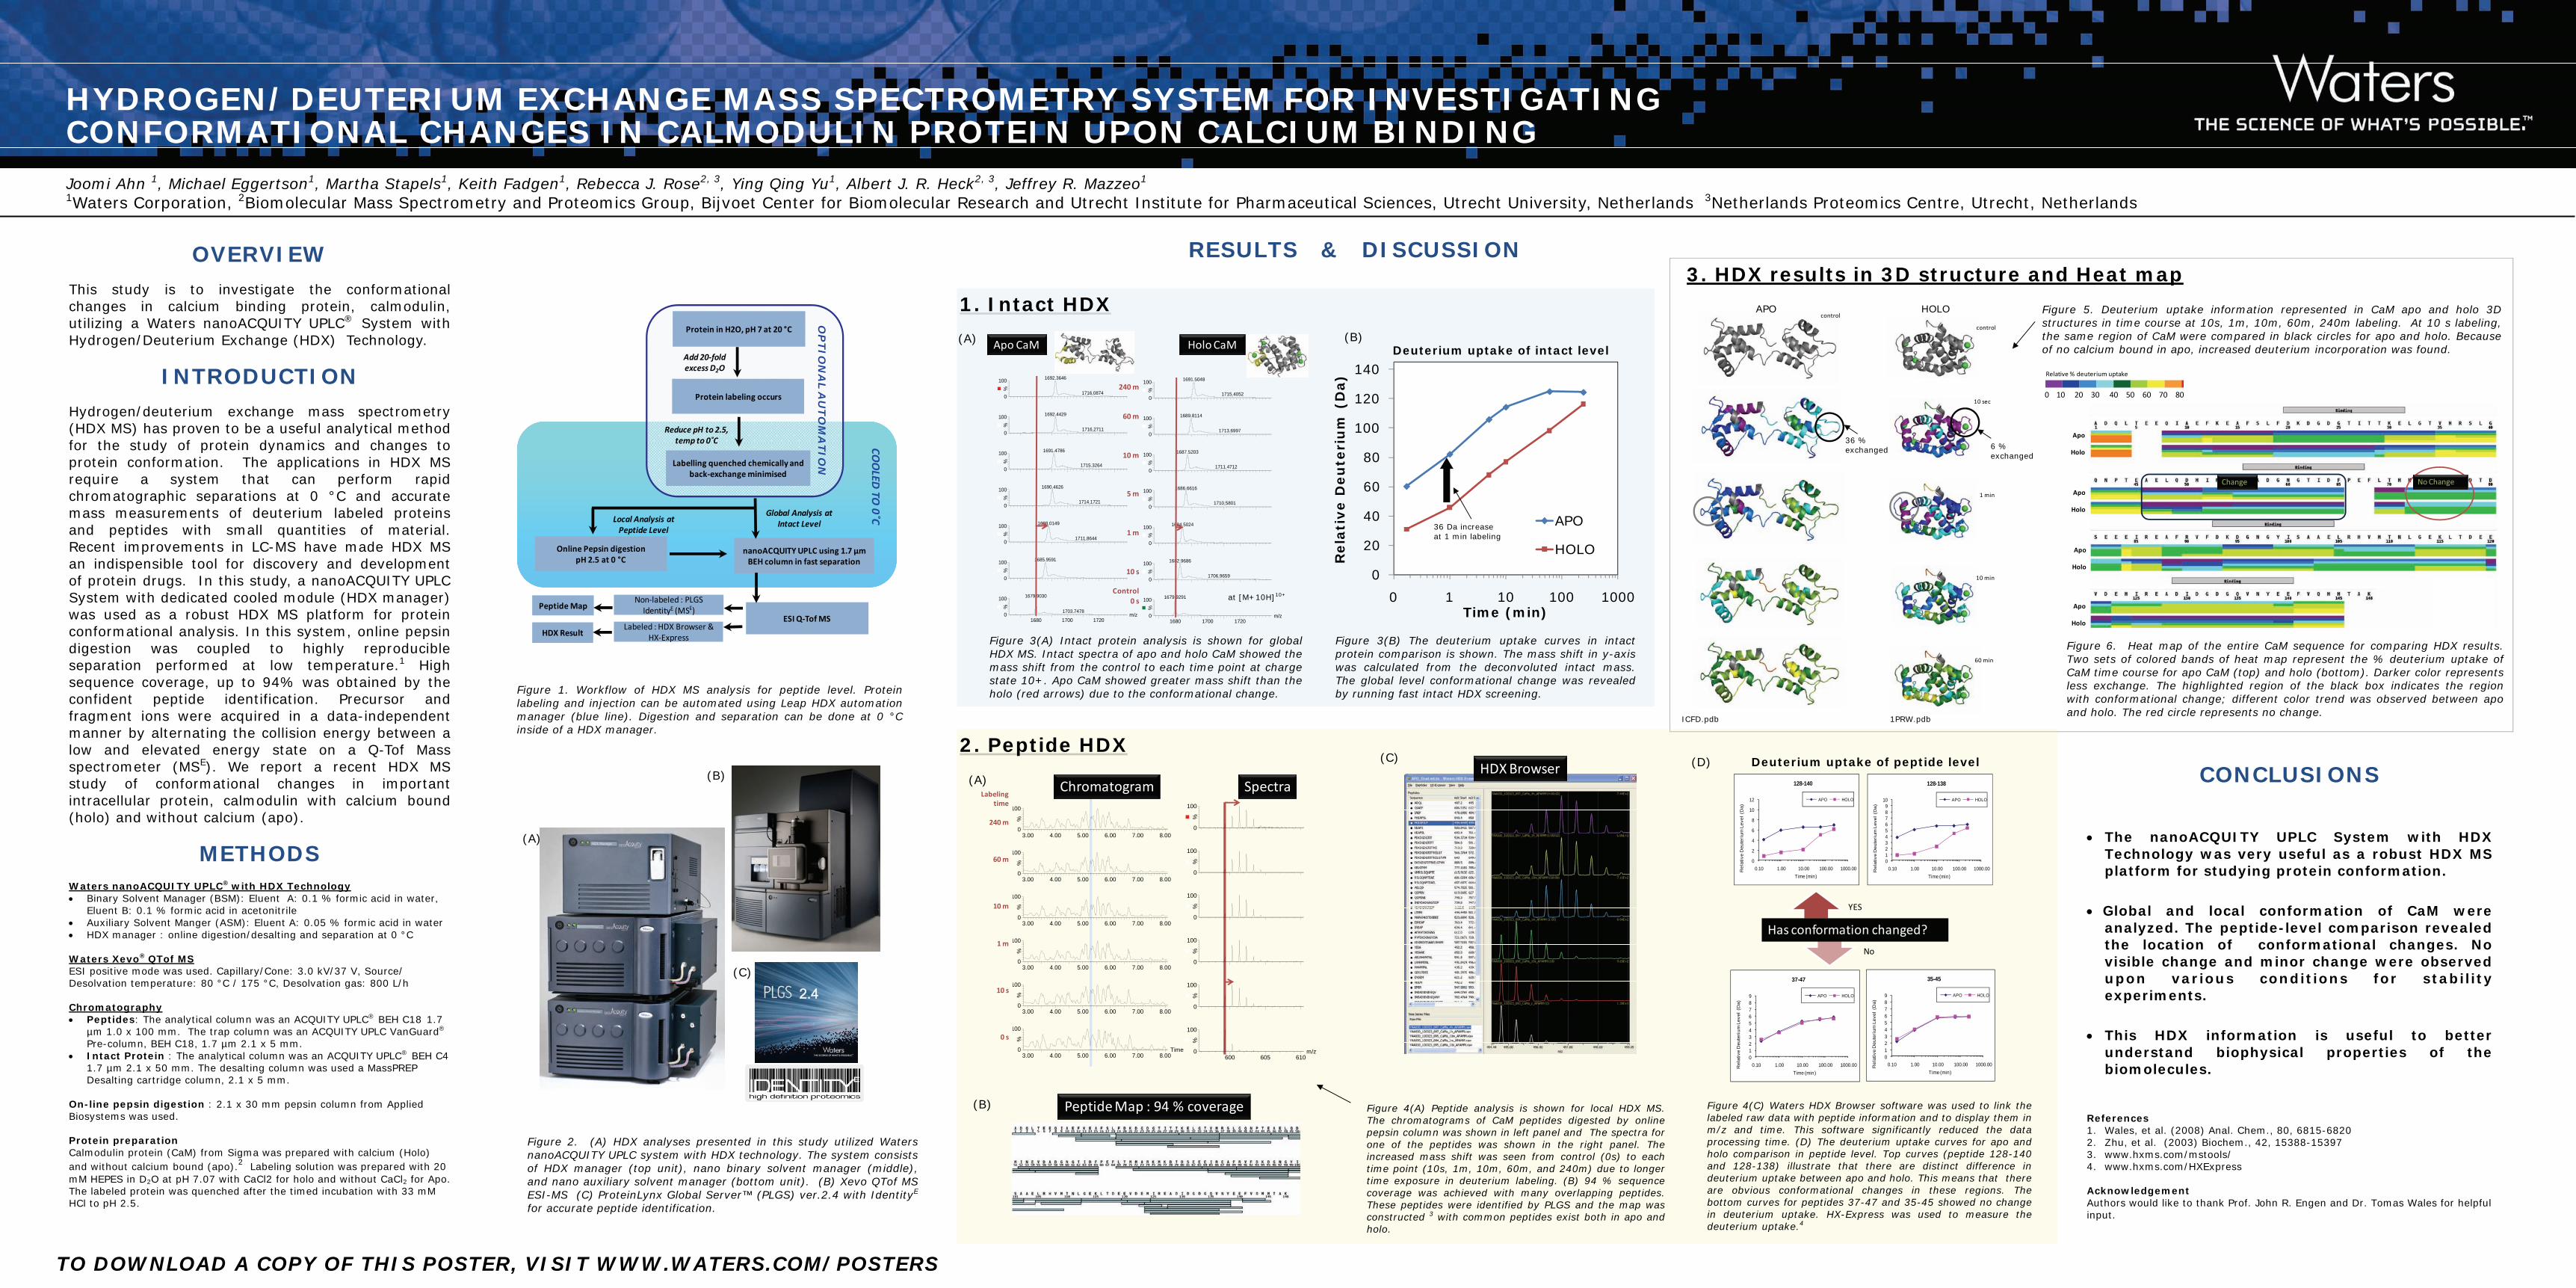
3. HDX results in 3D structure and Heat map
1. Intact HDX
OVERVIEW This study is to investigate the conformational changes in calcium binding protein, calmodulin, utilizing a Waters nanoACQUITY UPLC® System with Hydrogen/Deuterium Exchange (HDX) Technology.
INTRODUCTION Hydrogen/deuterium exchange mass spectrometry (HDX MS) has proven to be a useful analytical method for the study of protein dynamics and changes to protein conformation. The applications in HDX MS require a system that can perform rapid chromatographic separations at 0 °C and accurate mass measurements of deuterium labeled proteins and peptides with small quantities of material. Recent improvements in LC-MS have made HDX MS an indispensible tool for discovery and development of protein drugs. In this study, a nanoACQUITY UPLC System with dedicated cooled module (HDX manager) was used as a robust HDX MS platform for protein conformational analysis. In this system, online pepsin digestion was coupled to highly reproducible separation performed at low temperature.1 High sequence coverage, up to 94% was obtained by the confident peptide identification. Precursor and fragment ions were acquired in a data-independent manner by alternating the collision energy between a low and elevated energy state on a Q-Tof Mass spectrometer (MSE). We report a recent HDX MS study of conformational changes in important intracellular protein, calmodulin with calcium bound (holo) and without calcium (apo).
METHODS Waters nanoACQUITY UPLC® with HDX Technology Binary Solvent Manager (BSM): Eluent A: 0.1 % formic acid in water,
Eluent B: 0.1 % formic acid in acetonitrile Auxiliary Solvent Manger (ASM): Eluent A: 0.05 % formic acid in water HDX manager : online digestion/desalting and separation at 0 °C Waters Xevo® QTof MS ESI positive mode was used. Capillary/Cone: 3.0 kV/37 V, Source/Desolvation temperature: 80 °C / 175 °C, Desolvation gas: 800 L/h Chromatography Peptides: The analytical column was an ACQUITY UPLC® BEH C18 1.7
µm 1.0 x 100 mm. The trap column was an ACQUITY UPLC VanGuard® Pre-column, BEH C18, 1.7 µm 2.1 x 5 mm.
Intact Protein : The analytical column was an ACQUITY UPLC® BEH C4 1.7 µm 2.1 x 50 mm. The desalting column was used a MassPREP Desalting cartridge column, 2.1 x 5 mm.
On-line pepsin digestion : 2.1 x 30 mm pepsin column from Applied Biosystems was used. Protein preparation Calmodulin protein (CaM) from Sigma was prepared with calcium (Holo) and without calcium bound (apo).2 Labeling solution was prepared with 20 mM HEPES in D2O at pH 7.07 with CaCl2 for holo and without CaCl2 for Apo. The labeled protein was quenched after the timed incubation with 33 mM HCl to pH 2.5.
HYDROGEN/DEUTERIUM EXCHANGE MASS SPECTROMETRY SYSTEM FOR INVESTIGATING CONFORMATIONAL CHANGES IN CALMODULIN PROTEIN UPON CALCIUM BINDING Joomi Ahn 1, Michael Eggertson1, Martha Stapels1, Keith Fadgen1, Rebecca J. Rose2, 3, Ying Qing Yu1, Albert J. R. Heck2, 3, Jeffrey R. Mazzeo1 1Waters Corporation, 2Biomolecular Mass Spectrometry and Proteomics Group, Bijvoet Center for Biomolecular Research and Utrecht Institute for Pharmaceutical Sciences, Utrecht University, Netherlands 3Netherlands Proteomics Centre, Utrecht, Netherlands
RESULTS & DISCUSSION
CONCLUSIONS
The nanoACQUITY UPLC System with HDX
Technology was very useful as a robust HDX MS platform for studying protein conformation.
Global and local conformation of CaM were
analyzed. The peptide-level comparison revealed the location of conformational changes. No visible change and minor change were observed upon various conditions for stability experiments.
This HDX information is useful to better
understand biophysical properties of the biomolecules.
References 1. Wales, et al. (2008) Anal. Chem., 80, 6815-6820 2. Zhu, et al. (2003) Biochem., 42, 15388-15397 3. www.hxms.com/mstools/ 4. www.hxms.com/HXExpress Acknowledgement Authors would like to thank Prof. John R. Engen and Dr. Tomas Wales for helpful input.
Figure 6. Heat map of the entire CaM sequence for comparing HDX results. Two sets of colored bands of heat map represent the % deuterium uptake of CaM time course for apo CaM (top) and holo (bottom). Darker color represents less exchange. The highlighted region of the black box indicates the region with conformational change; different color trend was observed between apo and holo. The red circle represents no change.
Figure 1. Workflow of HDX MS analysis for peptide level. Protein labeling and injection can be automated using Leap HDX automation manager (blue line). Digestion and separation can be done at 0 °C inside of a HDX manager.
COOLED
TO 0˚C
OP
TIO
NA
L A
UT
OM
ATIO
N
Online Pepsin digestion pH 2.5 at 0 °C
nanoACQUITY UPLC using 1.7 µm BEH column in fast separation
ESI Q‐Tof MS
Non‐labeled : PLGS IdentityE (MSE)
Protein in H2O, pH 7 at 20 °C
Protein labeling occurs
Labelling quenched chemically and back‐exchange minimised
Reduce pH to 2.5, temp to 0˚C
Add 20‐fold excess D2O
Local Analysis at Peptide Level
Global Analysis at Intact Level
Labeled : HDX Browser & HX‐Express
Peptide Map
HDX Result
Figure 5. Deuterium uptake information represented in CaM apo and holo 3D structures in time course at 10s, 1m, 10m, 60m, 240m labeling. At 10 s labeling, the same region of CaM were compared in black circles for apo and holo. Because of no calcium bound in apo, increased deuterium incorporation was found.
0 10 20 30 40 50 60 70 80
Relative % deuterium uptake
Figure 2. (A) HDX analyses presented in this study utilized Waters nanoACQUITY UPLC system with HDX technology. The system consists of HDX manager (top unit), nano binary solvent manager (middle), and nano auxiliary solvent manager (bottom unit). (B) Xevo QTof MS ESI-MS (C) ProteinLynx Global Server™ (PLGS) ver.2.4 with IdentityE
for accurate peptide identification.
(A)
2.4 (C)
(B)
Figure 3(A) Intact protein analysis is shown for global HDX MS. Intact spectra of apo and holo CaM showed the mass shift from the control to each time point at charge state 10+. Apo CaM showed greater mass shift than the holo (red arrows) due to the conformational change.
(A)
m/z1680 1700 1720
%
0
100
%
0
100
%
0
100
%
0
100
%
0
100
%
0
100
%
0
100 1692.3646
1716.0874
1692.4429
1716.2711
1691.4786
1715.3264
1690.4626
1714.1721
1688.0149
1711.8644
1685.9591
1679.9030
1703.7478m/z
1680 1700 1720
%
0
100
%
0
100
%
0
100
%
0
100
%
0
100
%
0
100
%
0
100 1691.5048
1715.4052
1689.8114
1713.6997
1687.5203
1711.4712
1686.6616
1710.5801
1684.5024
1682.9686
1706.9659
1679.9291
240 m
60 m
10 m
5 m
1 m
10 s
Control0 s
Apo CaM HoloCaM Deuterium uptake of intact level
0
20
40
60
80
100
120
140
0 1 10 100 1000
Rela
tive D
eu
teri
um
(D
a)
Time (min)
APO
HOLO
36 Da increase at 1 min labeling
2. Peptide HDX
Figure 4(A) Peptide analysis is shown for local HDX MS. The chromatograms of CaM peptides digested by online pepsin column was shown in left panel and The spectra for one of the peptides was shown in the right panel. The increased mass shift was seen from control (0s) to each time point (10s, 1m, 10m, 60m, and 240m) due to longer time exposure in deuterium labeling. (B) 94 % sequence coverage was achieved with many overlapping peptides. These peptides were identified by PLGS and the map was constructed 3 with common peptides exist both in apo and holo.
(A) Spectra
(B)
(C) HDX Browser
Peptide Map : 94 % coverage
(D)
0
2
4
6
8
10
12
0.10 1.00 10.00 100.00 1000.00Rel
ativ
e D
eute
rium
Lev
el (
Da)
Time (min)
128-140
APO HOLO
0123456789
10
0.10 1.00 10.00 100.00 1000.00Rel
ativ
e D
eute
rium
Lev
el (
Da)
Time (min)
128-138
APO HOLO
0123456789
0.10 1.00 10.00 100.00 1000.00Rel
ativ
e D
eute
rium
Lev
el (
Da)
Time (min)
37-47
APO HOLO
0123456789
0.10 1.00 10.00 100.00 1000.00Rel
ativ
e D
eute
rium
Lev
el (
Da)
Time (min)
35-45
APO HOLO
YES
No
Has conformation changed?
at [M+10H]10+
Deuterium uptake of peptide level
Time3.00 4.00 5.00 6.00 7.00 8.00
%
0
100
3.00 4.00 5.00 6.00 7.00 8.00%
0
100
3.00 4.00 5.00 6.00 7.00 8.00
%
0
100
3.00 4.00 5.00 6.00 7.00 8.00
%
0
100
3.00 4.00 5.00 6.00 7.00 8.00
%
0
100
3.00 4.00 5.00 6.00 7.00 8.00
%
0
100
Labeling time
240 m
60 m
10 m
1 m
10 s
0 s
m/z600 605 610
%
0
100
%
0
100
%
0
100
%
0
100
%
0
100
%
0
100
Chromatogram
Figure 4(C) Waters HDX Browser software was used to link the labeled raw data with peptide information and to display them in m/z and time. This software significantly reduced the data processing time. (D) The deuterium uptake curves for apo and holo comparison in peptide level. Top curves (peptide 128-140 and 128-138) illustrate that there are distinct difference in deuterium uptake between apo and holo. This means that there are obvious conformational changes in these regions. The bottom curves for peptides 37-47 and 35-45 showed no change in deuterium uptake. HX-Express was used to measure the deuterium uptake.4
10 sec
1 min
10 min
60 min
control
control
ICFD.pdb 1PRW.pdb
36 % exchanged
APO HOLO
6 % exchanged
Apo
Holo
Apo
Holo
Apo
Holo
Apo
Holo
Change No Change
Figure 3(B) The deuterium uptake curves in intact protein comparison is shown. The mass shift in y-axis was calculated from the deconvoluted intact mass. The global level conformational change was revealed by running fast intact HDX screening.
(B)