HYDROGEN TECHNOLOGIES FOR A GREEN MOBILITY
24
© Fraunhofer HYDROGEN TECHNOLOGIES FOR A GREEN MOBILITY Ulf Groos Head of Department Fuel Cell Systems Fraunhofer Institute for Solar Energy Systems ISE Freiburg, Germany Deutsch Schweizer H2-Forum in Konstanz September 28 th , 2021 http://www.ise.fraunhofer.com http://www.h2-ise.com 1
Transcript of HYDROGEN TECHNOLOGIES FOR A GREEN MOBILITY

© Fraunhofer
HYDROGEN TECHNOLOGIES FOR A GREEN MOBILITY
Ulf Groos
Head of Department Fuel Cell Systems
Fraunhofer Institute for Solar Energy Systems ISEFreiburg, Germany
Deutsch Schweizer H2-Forum in Konstanz
September 28th, 2021
http://www.ise.fraunhofer.comhttp://www.h2-ise.com
1
© Fraunhofer
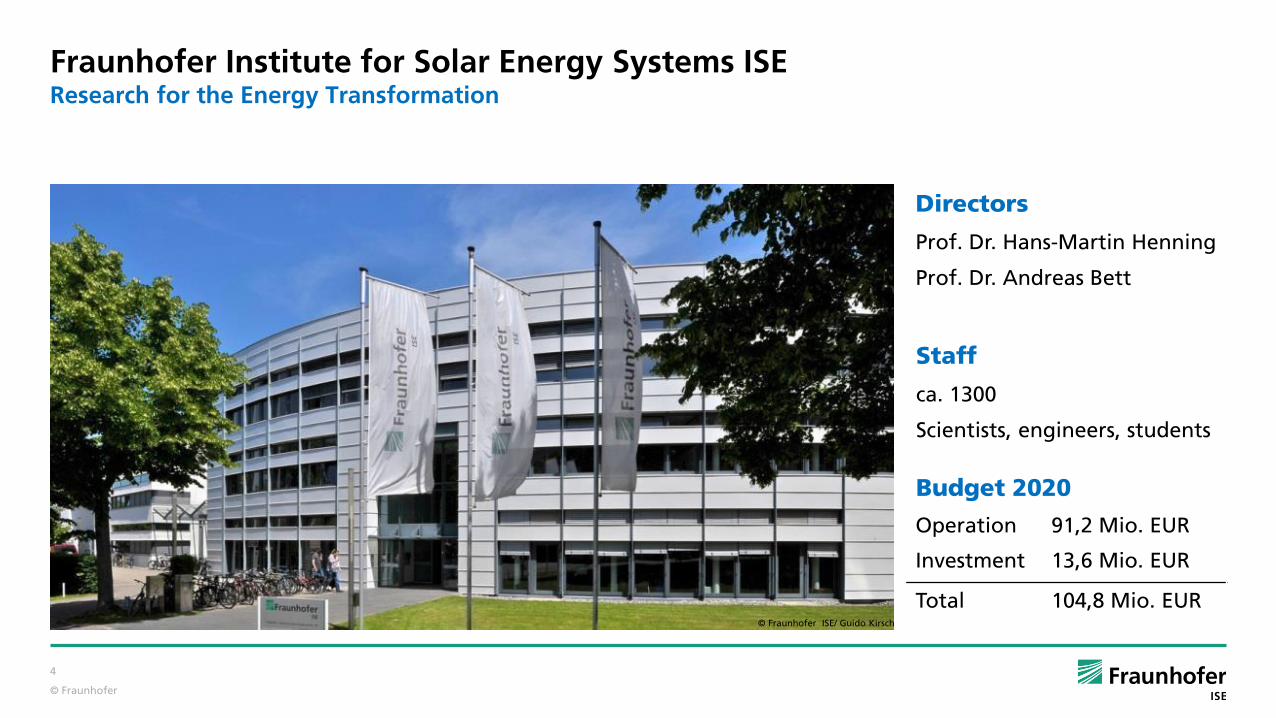
Fraunhofer Institute for Solar Energy Systems ISEResearch for the Energy Transformation
Budget 2020
©Fraunhofer ISE / Fotograf Guido Kirsch
Directors
Prof. Dr. Hans-Martin Henning
Prof. Dr. Andreas Bett
Staff
ca. 1300
Scientists, engineers, students
© Fraunhofer ISE/ Guido Kirsch
Operation 91,2 Mio. EUR
Investment 13,6 Mio. EUR
Total 104,8 Mio. EUR
4
© Fraunhofer
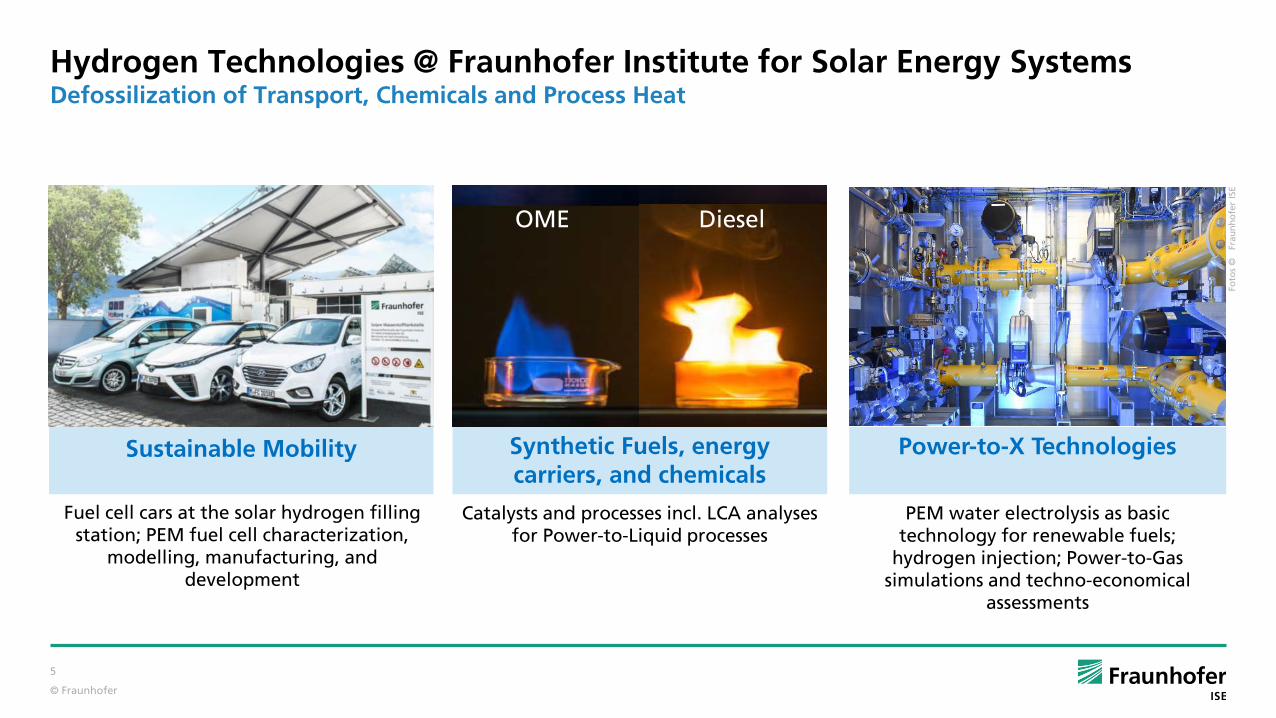
Sustainable Mobility
Hydrogen Technologies @ Fraunhofer Institute for Solar Energy SystemsDefossilization of Transport, Chemicals and Process Heat
Synthetic Fuels, energy carriers, and chemicals
DieselOME
Power-to-X Technologies
Foto
s ©
F
rau
nh
ofe
r IS
E
5
Fuel cell cars at the solar hydrogen filling station; PEM fuel cell characterization,
modelling, manufacturing, and development
Catalysts and processes incl. LCA analyses for Power-to-Liquid processes
PEM water electrolysis as basic technology for renewable fuels;
hydrogen injection; Power-to-Gas simulations and techno-economical
assessments
© Fraunhofer
Zero Emission Mobility Needs Zero Emission Energy
Renewable Energy = Hydrogen will be Traded Globally
Hydrogen Refuelling is Economically and Technically Reasonable
6
© Fraunhofer
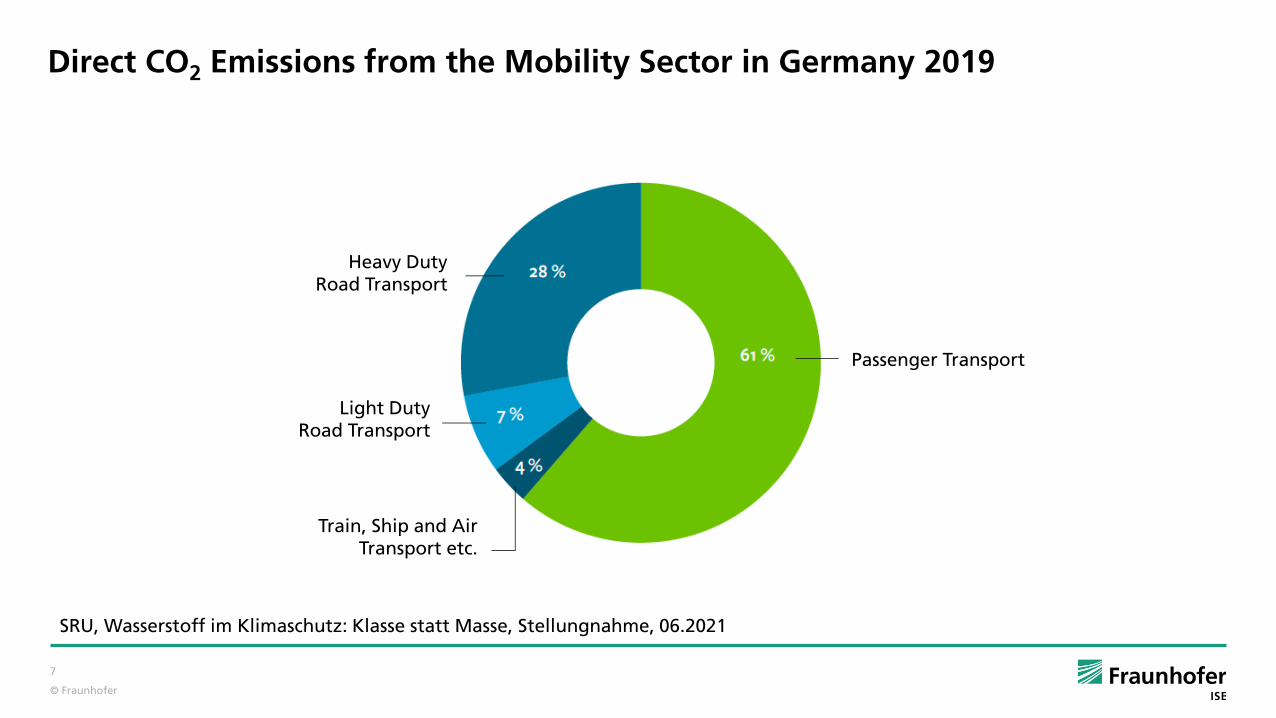
Direct CO2 Emissions from the Mobility Sector in Germany 2019
SRU, Wasserstoff im Klimaschutz: Klasse statt Masse, Stellungnahme, 06.2021
Heavy Duty Road Transport
Light Duty Road Transport
Train, Ship and Air Transport etc.
Passenger Transport
7
© Fraunhofer
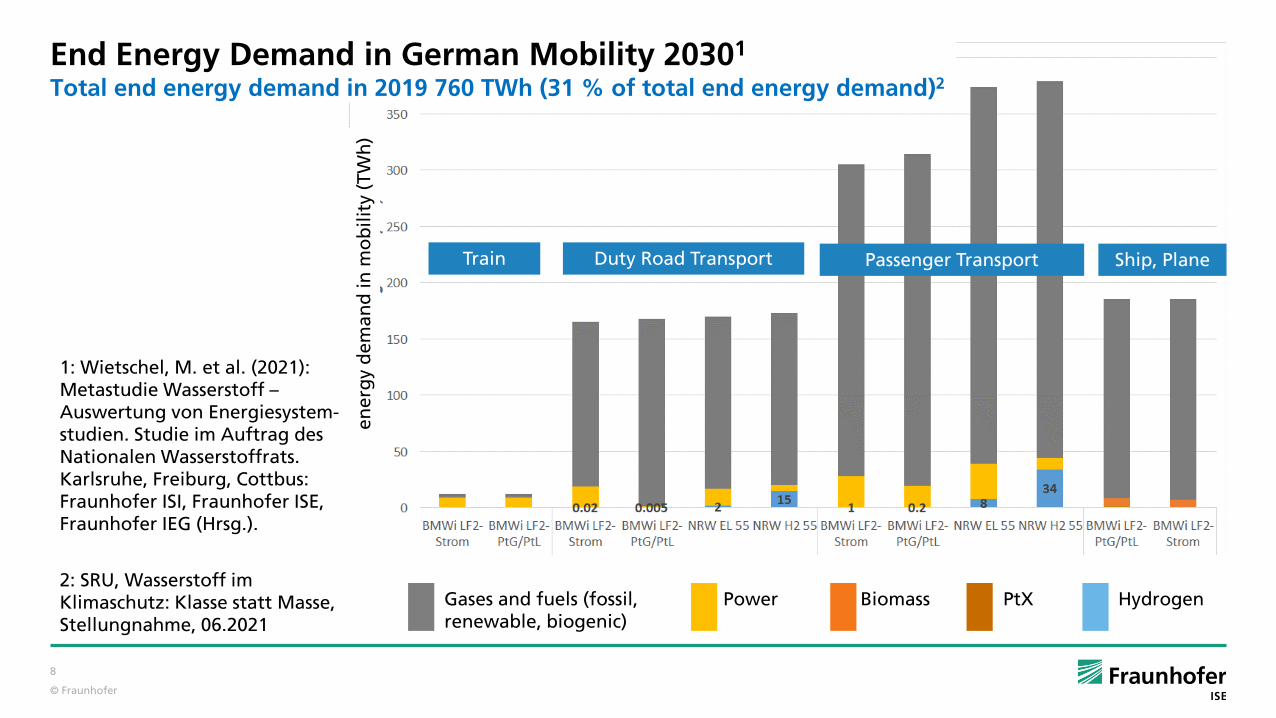
1: Wietschel, M. et al. (2021): Metastudie Wasserstoff –Auswertung von Energiesystem-studien. Studie im Auftrag des Nationalen Wasserstoffrats. Karlsruhe, Freiburg, Cottbus: Fraunhofer ISI, Fraunhofer ISE, Fraunhofer IEG (Hrsg.).
End Energy Demand in German Mobility 20301
Total end energy demand in 2019 760 TWh (31 % of total end energy demand)2
Train Duty Road Transport Passenger Transport Ship, Plane
2: SRU, Wasserstoff im Klimaschutz: Klasse statt Masse, Stellungnahme, 06.2021
8
ener
gy
dem
and
in m
ob
ility
(TW
h)
Gases and fuels (fossil, renewable, biogenic)
Power Biomass PtX Hydrogen
© Fraunhofer
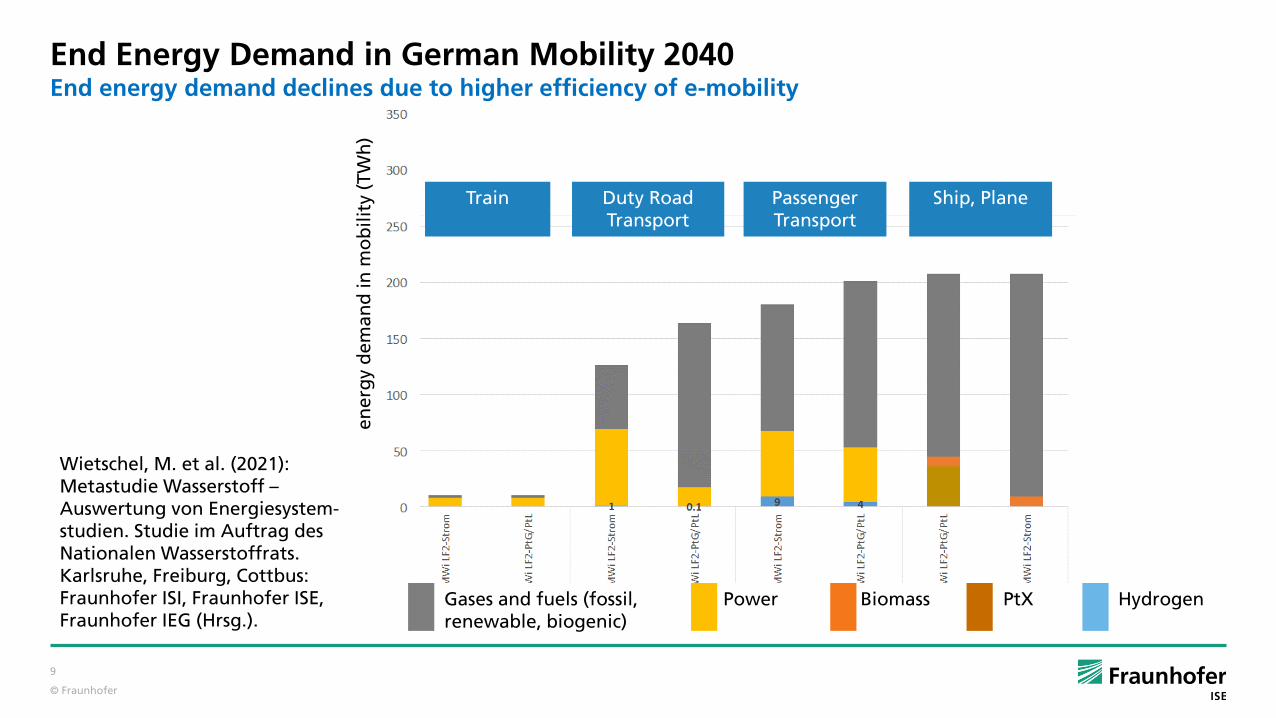
End Energy Demand in German Mobility 2040End energy demand declines due to higher efficiency of e-mobility
Wietschel, M. et al. (2021): Metastudie Wasserstoff –Auswertung von Energiesystem-studien. Studie im Auftrag des Nationalen Wasserstoffrats. Karlsruhe, Freiburg, Cottbus: Fraunhofer ISI, Fraunhofer ISE, Fraunhofer IEG (Hrsg.).
ener
gy
dem
and
in m
ob
ility
(TW
h)
Train Duty Road Transport
Passenger Transport
Ship, Plane
9
Gases and fuels (fossil, renewable, biogenic)
Power Biomass PtX Hydrogen
© Fraunhofer
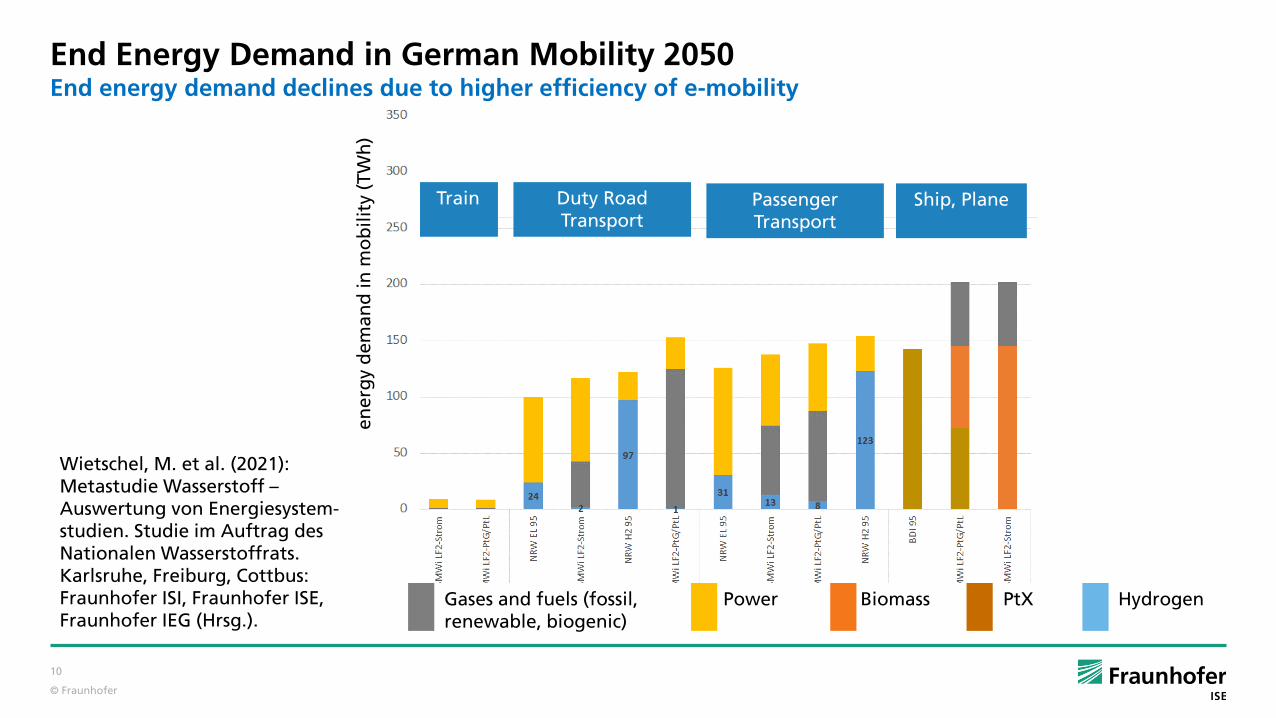
End Energy Demand in German Mobility 2050End energy demand declines due to higher efficiency of e-mobility
Wietschel, M. et al. (2021): Metastudie Wasserstoff –Auswertung von Energiesystem-studien. Studie im Auftrag des Nationalen Wasserstoffrats. Karlsruhe, Freiburg, Cottbus: Fraunhofer ISI, Fraunhofer ISE, Fraunhofer IEG (Hrsg.).
Gases and fuels (fossil, renewable, biogenic)
Power Biomass PtX Hydrogen
Train Duty Road Transport
Passenger Transport
Ship, Plane
10
ener
gy
dem
and
in m
ob
ility
(TW
h)
© Fraunhofer
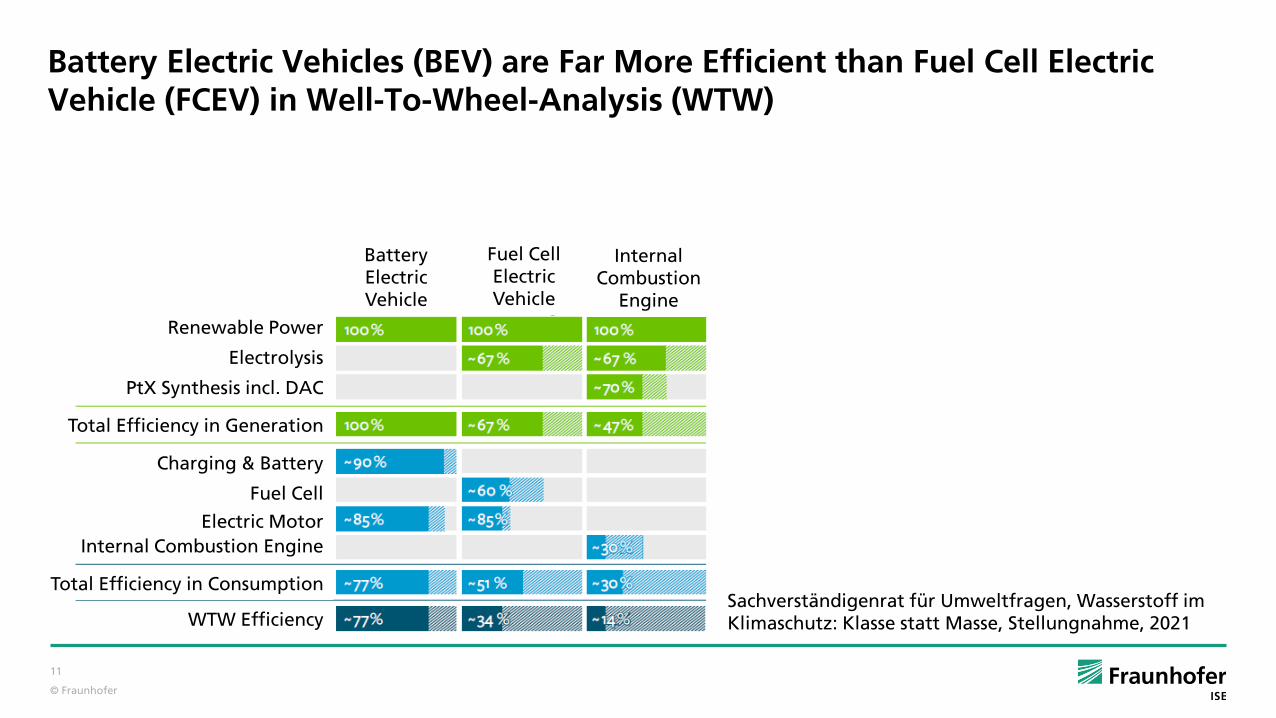
Battery Electric Vehicles (BEV) are Far More Efficient than Fuel Cell Electric Vehicle (FCEV) in Well-To-Wheel-Analysis (WTW)
Sachverständigenrat für Umweltfragen, Wasserstoff im Klimaschutz: Klasse statt Masse, Stellungnahme, 2021
Renewable Power
Electrolysis
PtX Synthesis incl. DAC
Total Efficiency in Generation
Charging & Battery
Fuel Cell
Electric MotorInternal Combustion Engine
Total Efficiency in Consumption
WTW Efficiency
11
BatteryElectric Vehicle
Fuel CellElectric Vehicle
Internal Combustion
Engine

© Fraunhofer
Green House Gas Emissions of BEV and FCEV are comparableRenewable energy supply is key
ICCT, A global comparison of the life-cycle greenhouse gas emissions of combustion engine and electric passenger cars, 2021
Life-cycle GHG emissions of 2021 lower medium car segment in Europe (BEV 45 kWh battery, FCEV 5 kg H2).
12

© Fraunhofer
Fraunhofer ISE, Wege zu einem klimaneutralen Energiesystem, Update, 2020
Power consumption 2019: 577 TWhel
Power consumption 2030: 700 – 780 TWhel
End energy demand for mobility: 500 - 740 TWh2
Power consumption 2050: 1.250 – 1.570 TWhel
End energy demand for mobility: 200 - 650 TWh2
Energy import necessary:
2030: 40 – 80 TWhel
2050: 140 – 300 TWhel
343 GWel
115 GWel
746 GWel
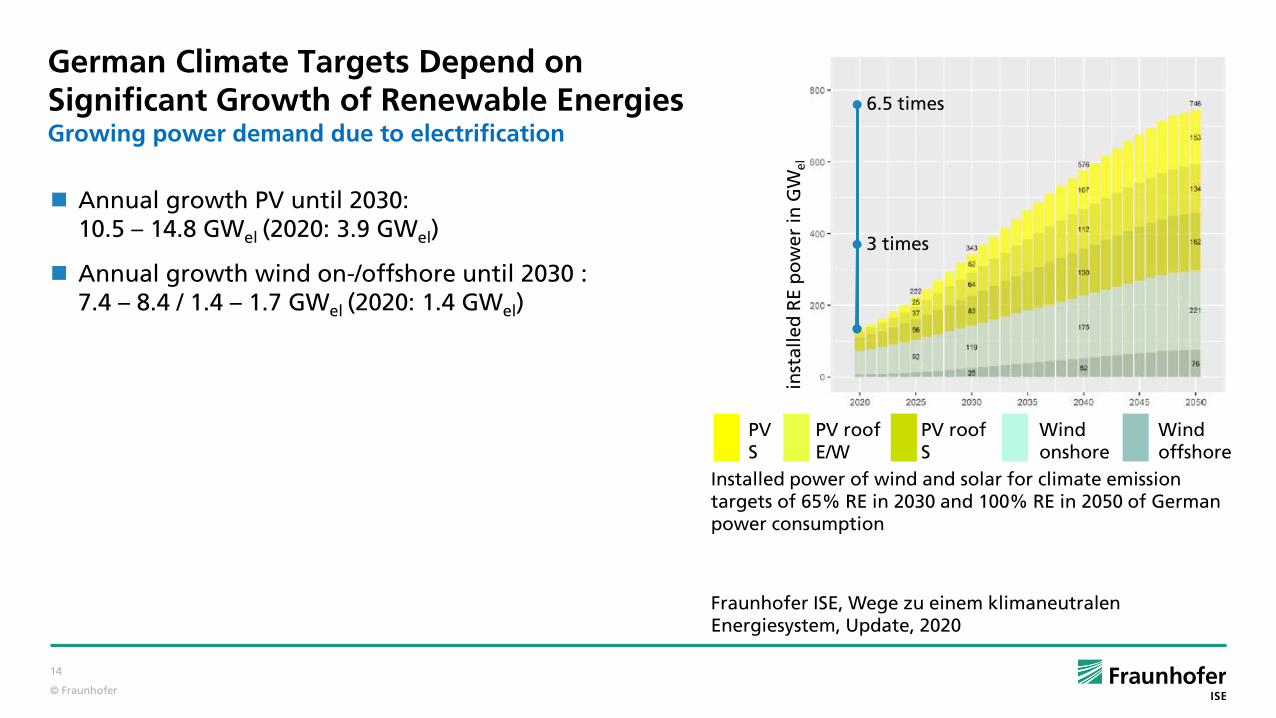
German Climate Targets Depend on Significant Growth of Renewable EnergiesGrowing power demand due to electrification
Installed power of wind and solar for climate emissiontargets of 65% RE in 2030 and 100% RE in 2050 of German power consumption
PVS
PV roofE/W
PV roofS
Wind onshore
Wind offshore
inst
alle
dR
E p
ow
er in
GW
el
2: Wietschel, M. et al. (2021): Metastudie Wasserstoff –Auswertung von Energiesystemstudien. Studie im Auftrag des Nationalen Wasserstoffrats. Karlsruhe, Freiburg, Cottbus: Fraunhofer ISI, Fraunhofer ISE, Fraunhofer IEG (Hrsg.).
13
© Fraunhofer
Annual growth PV until 2030: 10.5 – 14.8 GWel (2020: 3.9 GWel)
Annual growth wind on-/offshore until 2030 :7.4 – 8.4 / 1.4 – 1.7 GWel (2020: 1.4 GWel)
German Climate Targets Depend on Significant Growth of Renewable EnergiesGrowing power demand due to electrification
Installed power of wind and solar for climate emissiontargets of 65% RE in 2030 and 100% RE in 2050 of German power consumption
PVS
PV roofE/W
PV roofS
Wind onshore
Wind offshore
inst
alle
dR
E p
ow
er in
GW
el
6.5 times
3 times
14
Fraunhofer ISE, Wege zu einem klimaneutralen Energiesystem, Update, 2020

© Fraunhofer
Fraunhofer ISE, Wege zu einem klimaneutralen Energiesystem, Update, 2020
Our German Power Demand is Significantly Based on Household and IndustryPower supply for these sectors is mandatory
household, business
industry
heat pumps
electric heating
transport
electrolysis
methanization
power-to-fuel
others
2020 2030 2040 2050
Pow
er U
sag
e(T
Wh
el)
15
© Fraunhofer
Zero Emission Mobility Needs Zero Emission Energy
Renewable Energy = Hydrogen will be Traded Globally
Hydrogen Refuelling is Economically and Technically Reasonable
16

© Fraunhofer
Global Hydrogen Generation Costs
IEA, The Future of Hydrogen, Seizing today‘s opportunities, Report prepared by the IEA for the G20, Japan, 2019
17
© Fraunhofer
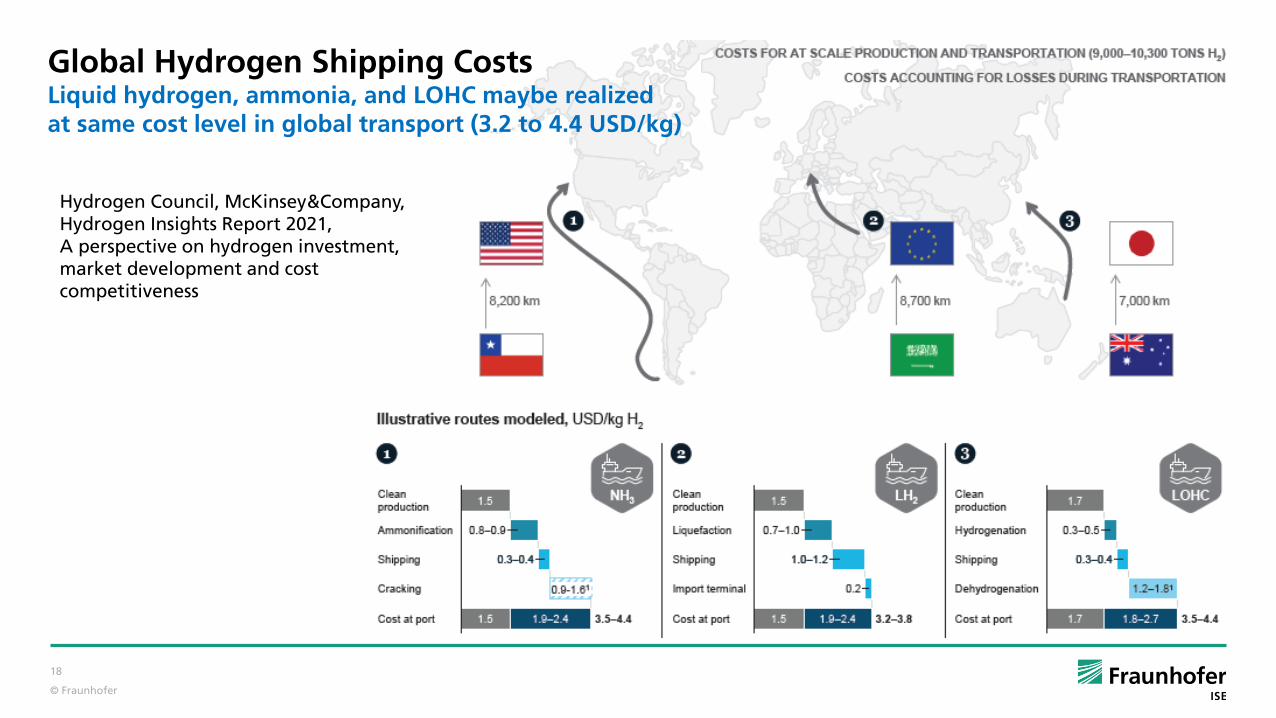
Global Hydrogen Shipping CostsLiquid hydrogen, ammonia, and LOHC maybe realized at same cost level in global transport (3.2 to 4.4 USD/kg)
Hydrogen Council, McKinsey&Company, Hydrogen Insights Report 2021, A perspective on hydrogen investment, market development and cost competitiveness
18
© Fraunhofer
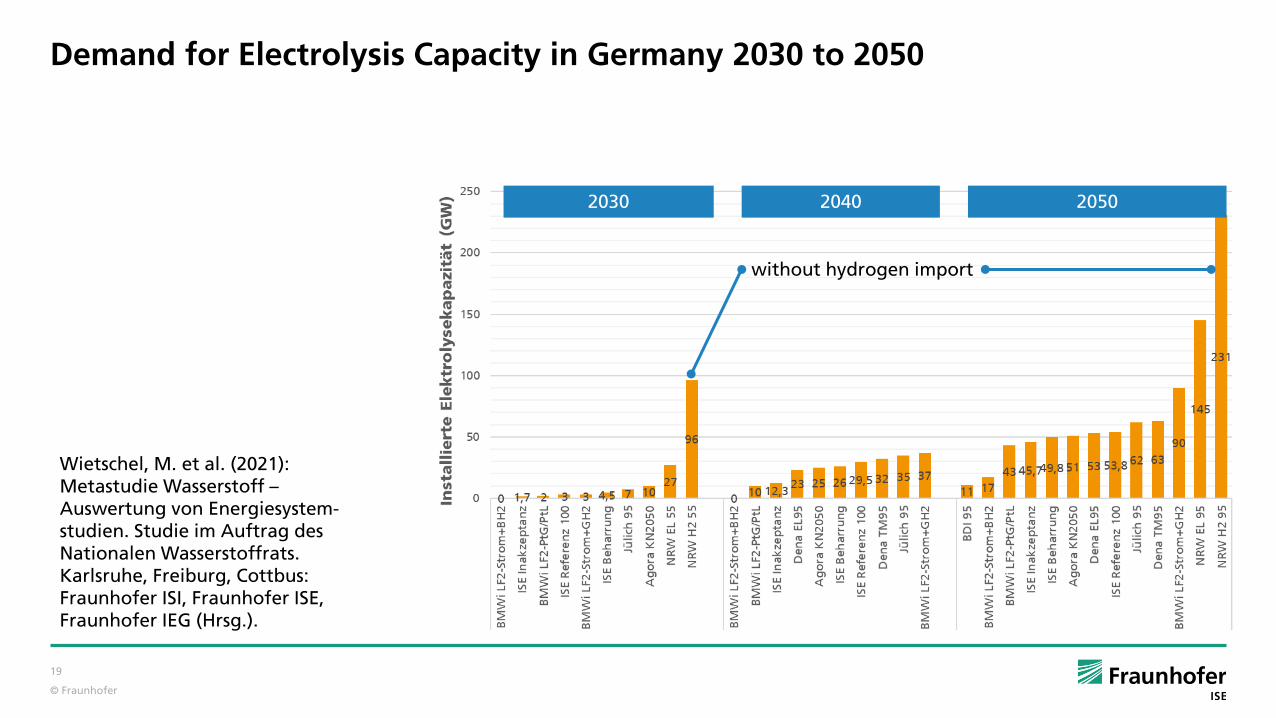
Demand for Electrolysis Capacity in Germany 2030 to 2050
Wietschel, M. et al. (2021): Metastudie Wasserstoff –Auswertung von Energiesystem-studien. Studie im Auftrag des Nationalen Wasserstoffrats. Karlsruhe, Freiburg, Cottbus: Fraunhofer ISI, Fraunhofer ISE, Fraunhofer IEG (Hrsg.).
2030 2040 2050
without hydrogen import
19
© Fraunhofer
Zero Emission Mobility Needs Zero Emission Energy
Renewable Energy = Hydrogen will be Traded Globally
Hydrogen Refuelling is Economically and Technically Reasonable
20
© Fraunhofer
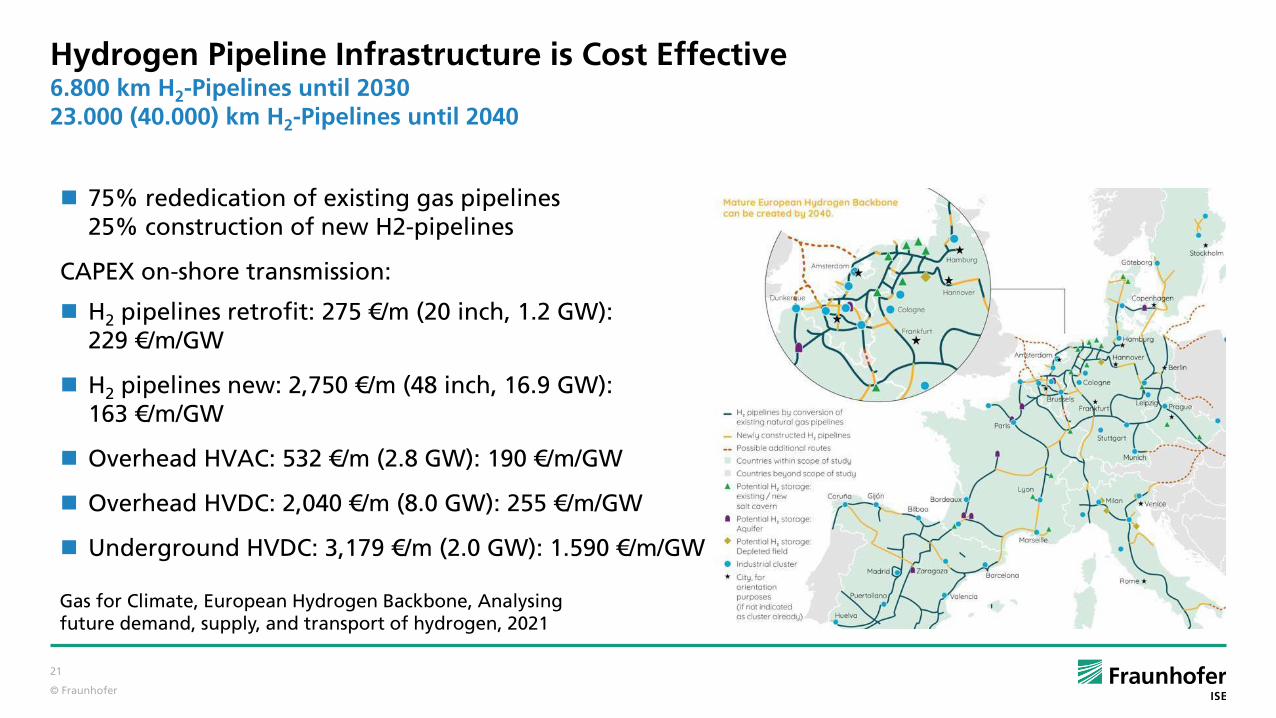
75% rededication of existing gas pipelines25% construction of new H2-pipelines
CAPEX on-shore transmission:
H2 pipelines retrofit: 275 €/m (20 inch, 1.2 GW):229 €/m/GW
H2 pipelines new: 2,750 €/m (48 inch, 16.9 GW):163 €/m/GW
Overhead HVAC: 532 €/m (2.8 GW): 190 €/m/GW
Overhead HVDC: 2,040 €/m (8.0 GW): 255 €/m/GW
Underground HVDC: 3,179 €/m (2.0 GW): 1.590 €/m/GW
Hydrogen Pipeline Infrastructure is Cost Effective6.800 km H2-Pipelines until 203023.000 (40.000) km H2-Pipelines until 2040
Gas for Climate, European Hydrogen Backbone, Analysingfuture demand, supply, and transport of hydrogen, 2021
21

© Fraunhofer
BEV: Most Important Use Case for Charging is Urban Street
Nationale Leitstelle Ladeinfrastruktur, Ladeinfrastruktur nach 2025/2030: Szenarien für den Markthochlauf, Studie im Auftrag des BMVI, 2020
public streets
single homes
multi family homes
Parking @ work
customer parking
Parking in Freiburg, photo Ulf Groos
22
© Fraunhofer
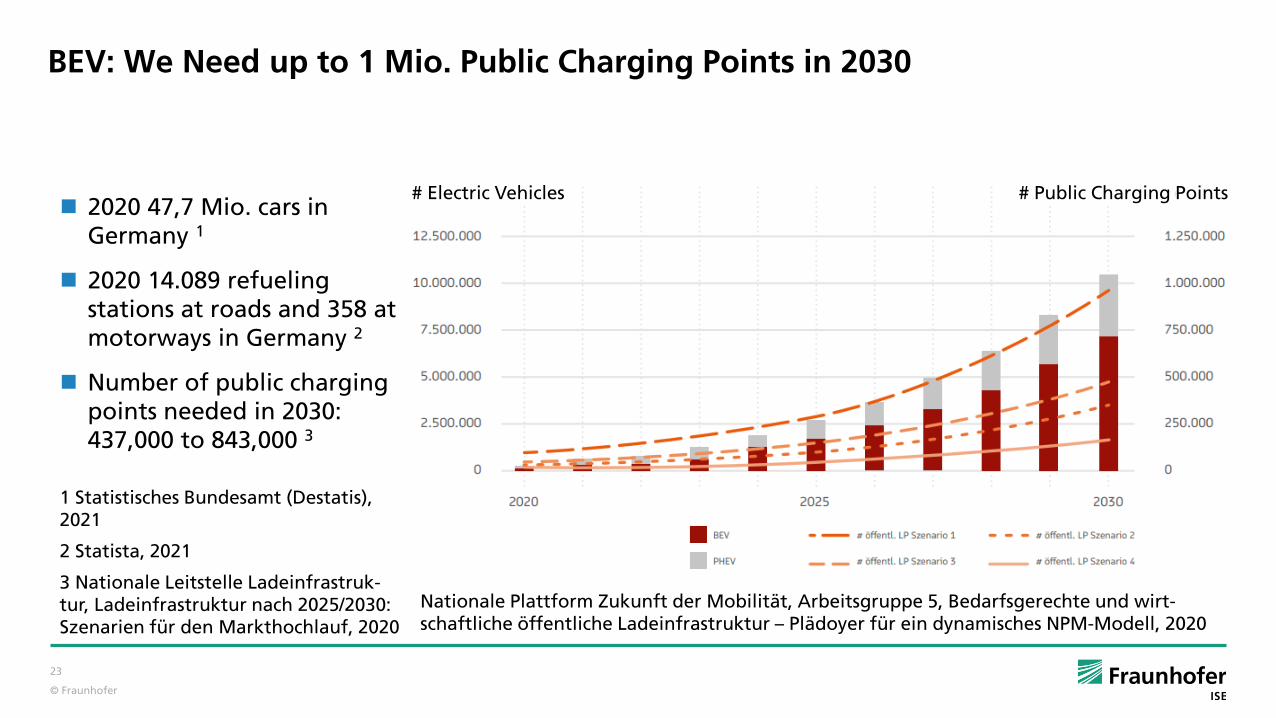
BEV: We Need up to 1 Mio. Public Charging Points in 2030
Nationale Plattform Zukunft der Mobilität, Arbeitsgruppe 5, Bedarfsgerechte und wirt-schaftliche öffentliche Ladeinfrastruktur – Plädoyer für ein dynamisches NPM-Modell, 2020
2020 47,7 Mio. cars in Germany 1
2020 14.089 refuelingstations at roads and 358 at motorways in Germany 2
Number of public chargingpoints needed in 2030: 437,000 to 843,000 3
23
# Electric Vehicles # Public Charging Points
1 Statistisches Bundesamt (Destatis), 2021
2 Statista, 2021
3 Nationale Leitstelle Ladeinfrastruk-tur, Ladeinfrastruktur nach 2025/2030: Szenarien für den Markthochlauf, 2020
© Fraunhofer
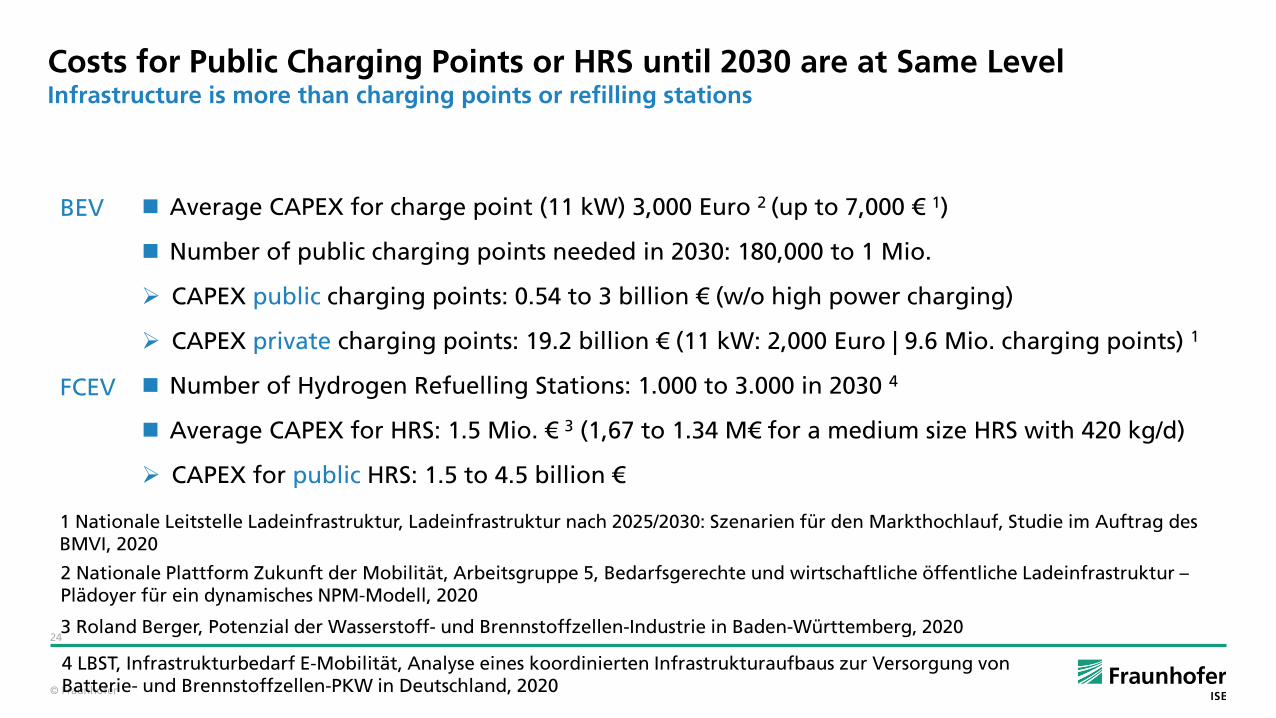
Costs for Public Charging Points or HRS until 2030 are at Same LevelInfrastructure is more than charging points or refilling stations
Average CAPEX for charge point (11 kW) 3,000 Euro 2 (up to 7,000 € 1)
Number of public charging points needed in 2030: 180,000 to 1 Mio.
CAPEX public charging points: 0.54 to 3 billion € (w/o high power charging)
CAPEX private charging points: 19.2 billion € (11 kW: 2,000 Euro | 9.6 Mio. charging points) 1
Number of Hydrogen Refuelling Stations: 1.000 to 3.000 in 2030 4
Average CAPEX for HRS: 1.5 Mio. € 3 (1,67 to 1.34 M€ for a medium size HRS with 420 kg/d)
CAPEX for public HRS: 1.5 to 4.5 billion €
1 Nationale Leitstelle Ladeinfrastruktur, Ladeinfrastruktur nach 2025/2030: Szenarien für den Markthochlauf, Studie im Auftrag des BMVI, 2020
2 Nationale Plattform Zukunft der Mobilität, Arbeitsgruppe 5, Bedarfsgerechte und wirtschaftliche öffentliche Ladeinfrastruktur –Plädoyer für ein dynamisches NPM-Modell, 2020
3 Roland Berger, Potenzial der Wasserstoff- und Brennstoffzellen-Industrie in Baden-Württemberg, 202024
BEV
FCEV
4 LBST, Infrastrukturbedarf E-Mobilität, Analyse eines koordinierten Infrastrukturaufbaus zur Versorgung von Batterie- und Brennstoffzellen-PKW in Deutschland, 2020

© Fraunhofer
Key Messages
Zero emission mobility needs Renewable Energy
Renewable Energy will be traded globally via hydrogen (carriers)
Hydrogen infrastructure is economically and technically reasonable
Hydrogen refuelling of FCEV will supplement recharging of BEV
25
© Fraunhofer
Thank You for Very Much for Your Attention!
Foto
© F
rau
nh
ofe
r IS
E
Fraunhofer Institute for Solar Energy Systems ISE, www.h2-ise.com