Hydrogen Sulfide Odor Control Program Cost Reduction through Dosing and Monitoring ... ·...
20
Hydrogen Sulfide Odor Control Program Cost Reduction through Dosing and Monitoring Automation John Macpherson 1* , Steven Porter 2 , Thomas Alford 2 , Greg Tomlinson 1 1 Evoqua Water Technologies, Sarasota, Florida 2 Henrico County, Virginia * Email: [email protected] ABSTRACT Henrico County, Virginia (The County) utilizes multiple chemical technologies in the sewage collection system in order to control hydrogen sulfide concentrations at key points within the system. The county has strict compliance limits for hydrogen sulfide and was facing growing costs, spending in excess of $1.8 million dollars in 2010. The county decided to utilize programmable chemical dosing controllers and real-time hydrogen sulfide reporting to manage its odor control program costs. Evoqua Water Technologies installed programmable advanced dosing controllers at 14 dosing sites, and deployed cellular-modem enabled hydrogen sulfide data loggers at 11 compliance points. The primary objective of the hydrogen sulfide control program was to control hydrogen sulfide to compliance limits while reducing program costs. This paper reviews the effectiveness of the program against these primary and other secondary objectives. KEYWORDS: hydrogen sulfide, odor control, cost savings, dosing, monitoring, compliance, automation INTRODUCTION It is well-documented that hydrogen sulfide is generated when untreated wastewater is collected and septic conditions are allowed to occur. Hydrogen sulfide presents health risks to personnel and can deteriorate infrastructure, particularly in the presence of moisture, as is the case in sewage collection systems. (U.S. EPA, 1974) To gain control over the odor and corrosion problems caused by the presence of hydrogen sulfide, the county utilizes multiple wet-chemical technologies to minimize hydrogen sulfide concentrations within the collection system. Henrico County Virginia is located in central Virginia, and borders Richmond Virginia to the north and east. The wastewater system serving Henrico County includes a Water Reclamation Facility (WRF) with a capacity to treat 75 million gallons per day (mgd) of wastewater. The system also includes a conveyance system comprised of approximately 1,460 miles of sewer pipelines and 24 sewage-pumping stations. Henrico County has significant hydrogen sulfide generating force-mains that produce an average of 2,552 lbs of hydrogen sulfide per day. The county has a long history of odor control challenges and has worked for over a decade in an effort to gain control of odor and corrosion challenges within the collection system. Prior to the deployment of advanced dosing controllers in 2010, the county fed up to an annual average of 2,270 gallons/day of odor and corrosion control chemicals at a cost of $1.86 million dollars.
-
Upload
phamnguyet -
Category
Documents
-
view
215 -
download
0
Transcript of Hydrogen Sulfide Odor Control Program Cost Reduction through Dosing and Monitoring ... ·...

Hydrogen Sulfide Odor Control Program Cost Reduction through Dosing and Monitoring Automation John Macpherson1*, Steven Porter2, Thomas Alford2, Greg Tomlinson1 1 Evoqua Water Technologies, Sarasota, Florida 2 Henrico County, Virginia * Email: [email protected] ABSTRACT Henrico County, Virginia (The County) utilizes multiple chemical technologies in the sewage collection system in order to control hydrogen sulfide concentrations at key points within the system. The county has strict compliance limits for hydrogen sulfide and was facing growing costs, spending in excess of $1.8 million dollars in 2010. The county decided to utilize programmable chemical dosing controllers and real-time hydrogen sulfide reporting to manage its odor control program costs. Evoqua Water Technologies installed programmable advanced dosing controllers at 14 dosing sites, and deployed cellular-modem enabled hydrogen sulfide data loggers at 11 compliance points. The primary objective of the hydrogen sulfide control program was to control hydrogen sulfide to compliance limits while reducing program costs. This paper reviews the effectiveness of the program against these primary and other secondary objectives.
KEYWORDS: hydrogen sulfide, odor control, cost savings, dosing, monitoring, compliance, automation INTRODUCTION It is well-documented that hydrogen sulfide is generated when untreated wastewater is collected and septic conditions are allowed to occur. Hydrogen sulfide presents health risks to personnel and can deteriorate infrastructure, particularly in the presence of moisture, as is the case in sewage collection systems. (U.S. EPA, 1974) To gain control over the odor and corrosion problems caused by the presence of hydrogen sulfide, the county utilizes multiple wet-chemical technologies to minimize hydrogen sulfide concentrations within the collection system.
Henrico County Virginia is located in central Virginia, and borders Richmond Virginia to the north and east. The wastewater system serving Henrico County includes a Water Reclamation Facility (WRF) with a capacity to treat 75 million gallons per day (mgd) of wastewater. The system also includes a conveyance system comprised of approximately 1,460 miles of sewer pipelines and 24 sewage-pumping stations. Henrico County has significant hydrogen sulfide generating force-mains that produce an average of 2,552 lbs of hydrogen sulfide per day.
The county has a long history of odor control challenges and has worked for over a decade in an effort to gain control of odor and corrosion challenges within the collection system. Prior to the deployment of advanced dosing controllers in 2010, the county fed up to an annual average of 2,270 gallons/day of odor and corrosion control chemicals at a cost of $1.86 million dollars.

In January of 2010 Henrico County issued RFP #09-8757-12CS for sanitary sewer odor and corrosion control. The successful offeror would be required to supply complete turnkey services: to supply, operate, monitor, and maintain chemical dosing systems to cost effectively control hydrogen sulfide to specified limits (vapor and dissolved) at key control points within the wastewater collection and conveyance system for the Henrico County Department of Public Utilities.
Evoqua Water Technologies responded to the Henrico County RFP with a proposal for fully automating the odor control program. The objectives for the upgraded odor and corrosion control program were:
Maintain hydrogen sulfide at or below compliance levels while reducing program costs. Utilize advanced dosing controllers to continuously optimize chemical feed rates at all
dosing sites. Improve response time to non-compliant hydrogen sulfide concentrations through the use
of real-time hydrogen sulfide reporting with cellular modem enabled hydrogen sulfide data-loggers.
Reduce the man-hours necessary to perform dose rate and system configuration changes through the use of internet-based cellular communication with the advanced dosing controllers.
Provide the county with odor and corrosion control program transparency through cellular internet based monitoring and control.
METHODOLOGY
Hydrogen Sulfide Formation in Collection Systems The root cause of hydrogen sulfide formation in force mains is due to the presence of sulfates and sulfate reducing bacteria (SRBs), both of which are naturally occurring in municipal collection system waste streams (Joyce, 2001). Additionally, the presence of BOD and the low solubility of oxygen at the temperatures typically found in waste water collection systems, further contribute to sulfide formation. Lastly, lengthy force mains with long detention times contribute greatly to anaerobic conditions and predictable hydrogen sulfide formation. The formation of sulfide in wastewater collection systems is governed by a series of complex, inter-related processes (Pomeroy and Parkhurst, 1977). Sulfide is generated through the consumption of organic matter (BOD) by anaerobic SRBs with naturally-occurring sulfate functioning as the terminal electron acceptor. This process occurs in the slime layer (biofilm) present in the sewer and covering that portion of the sewer wall that is typically submerged. The process of diffusion dictates that dissolved substances move from areas of high concentration to areas of low concentration, seeking equilibrium, and move through the slime layer into the bulk wastewater flow. If conditions are aerobic, sulfide will be readily oxidized by chemical or biological processes. Under anaerobic conditions, sulfide will enter the wastewater stream as described above, where it will react with any metals present to form insoluble metallic sulfides or will be emitted as hydrogen sulfide gas.

Hydrogen Sulfide Corrosion in Collection Systems Corrosion of concrete aggregate and ferrous metals in collection systems is a problem that can lead to failure of municipal sewer systems prior their estimated life expectancy. At a minimum this creates significant increased overall expenses for the municipality, and can potentially create a hazard to the public health. Corrosion is caused when hydrogen sulfide leaves the liquid phase and enters the vapor phase. Hydrogen sulfide exists in solution as a dissolved gas, which is easily volatilized by turbulence in the wastewater stream, particularly at the pH levels typically found in domestic sewers. Once hydrogen sulfide is airborne it reacts with oxygen present in the headspace, and forms sulfuric acid (Boone, A.G., 1995). Henrico County Collection System A diagram of the Henrico County collection system with chemical feed locations is shown in Figure 1. In addition to feeding odor and corrosion control chemicals, Henrico County monitors the collection system for signs of corrosion through the use of CCTV inspections and other methods. This figure is presented courtesy of Greely and Hansen.
Figure 1 – Henrico County Virginia Collection System Henrico County, Virginia has significant sulfide-generating force mains. These force mains and the estimated sulfide produced can be found in Table 1.
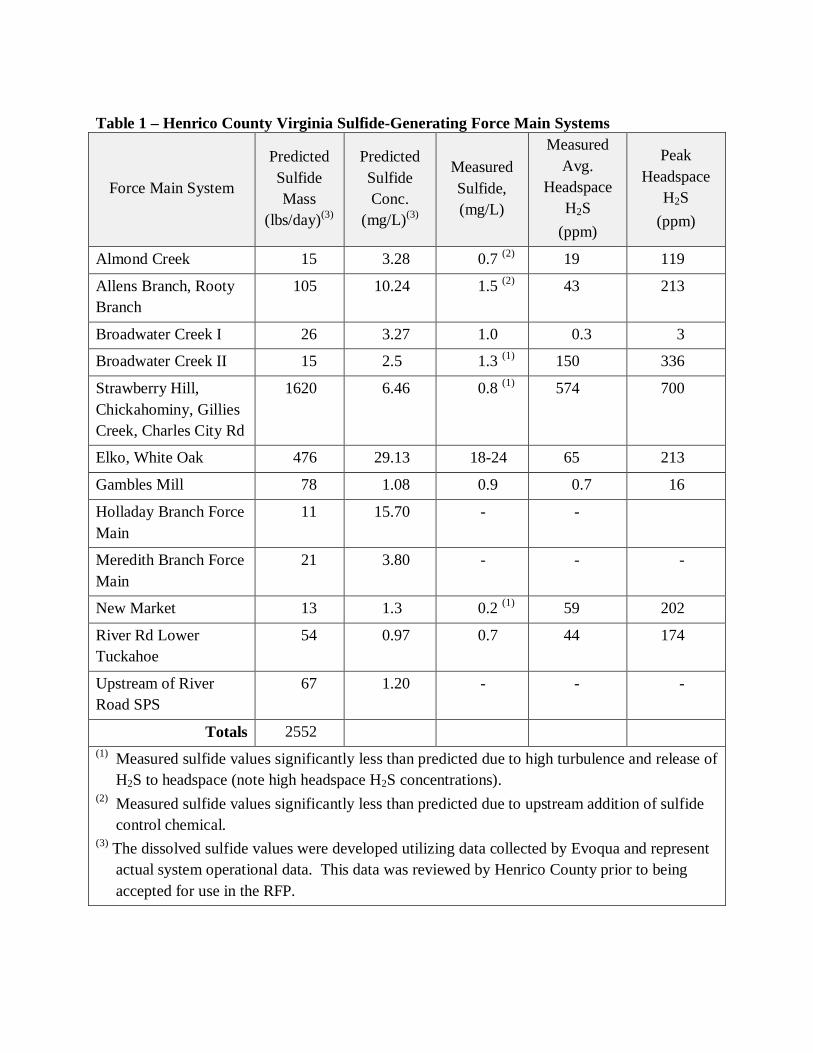
Table 1 – Henrico County Virginia Sulfide-Generating Force Main Systems
Force Main System
Predicted Sulfide Mass
(lbs/day)(3)
Predicted Sulfide Conc.
(mg/L)(3)
Measured Sulfide, (mg/L)
Measured Avg.
Headspace H2S
(ppm)
Peak Headspace
H2S (ppm)
Almond Creek 15 3.28 0.7 (2) 19 119
Allens Branch, Rooty Branch
105 10.24 1.5 (2) 43 213
Broadwater Creek I 26 3.27 1.0 0.3 3
Broadwater Creek II 15 2.5 1.3 (1) 150 336
Strawberry Hill, Chickahominy, Gillies Creek, Charles City Rd
1620 6.46 0.8 (1) 574 700
Elko, White Oak 476 29.13 18-24 65 213
Gambles Mill 78 1.08 0.9 0.7 16
Holladay Branch Force Main
11 15.70 - -
Meredith Branch Force Main
21 3.80 - - -
New Market 13 1.3 0.2 (1) 59 202
River Rd Lower Tuckahoe
54 0.97 0.7 44 174
Upstream of River Road SPS
67 1.20 - - -
Totals 2552 (1) Measured sulfide values significantly less than predicted due to high turbulence and release of
H2S to headspace (note high headspace H2S concentrations). (2) Measured sulfide values significantly less than predicted due to upstream addition of sulfide
control chemical. (3) The dissolved sulfide values were developed utilizing data collected by Evoqua and represent
actual system operational data. This data was reviewed by Henrico County prior to being accepted for use in the RFP.

Henrico County pump station maximum and average flow data, along with the corresponding force main length and diameter can be found in Table 2. Table 2 – Henrico County Pump Station and Force Main Parameters
Pumping Station Maximum Pumping
Capacity (mgd)
Average Sewage Flow (mgd)
Force Main Diameter (inches)
Force Main Length (feet)
ACCA 0.8 0.11 8 400 Almond Creek 2.7 0.64 12 8,170 Allens Branch 7.0 1.40 24 18,860
Bottoms Bridge 2.4 0.01 12 2,500 Broadwater
Creek 1 6.6 1.38 20 7,000
Broadwater Creek II 4.4 0.76 20 4,060
Charles City Rd 2.5 0.40 12 520 Chickahominy 2.5 0.37 12 570
Elko 12.0 0.06 30 34,600 Four Mile Creek 1.0 0.01 12 100
Gambles Mill 27.9 10.84 36 30
3,910 5,560
Goochland 13.0 1.49 48 45,835 Gillies Creek 12.3 5.06 24 18,020
Holladay Branch 2.0 0.15 6 6,800 Keeton Rd 0.1 0.02 4 560 Mayfield 0.3 0.08 12 300
Meredith Branch Wet Well 2.9 0.62 6 240
Meredith Branch Force Main 10.5 1.86 20 6,400
New Market 6.6 0.76 16 4,530 Poplar Springs 2.6 0.01 12 300
River Road 25.0 8.38 30 6,950 Rooty Branch 3.5 0.46 16 10,070
Strawberry Hill 83.0 29.58 60 38,220 Virginia Center 2.0 0.27 12 1,310 Willow Lawn 0.5 0.02 10 200
White Oak 11.8 1.77 30 11,730 Hydrogen sulfide compliance limits for both vapor phase and dissolved hydrogen sulfide are presented in Table 3.

Table 3 – Henrico County Program Compliance and Treatment Requirements
Feed Site Compliance Point Compliance
Requirements Vapor Phase (ppm)
Compliance Requirements Liquid Phase
(mg/L)
Allens Branch Gatwick Manhole 30 minute Peak – 2.0 Daily Average – 0.5
Monthly Average – 0.1
Monthly Average < 0.2
Almond Creek New Market Manhole
30 Minute Peak – 2.0 Monthly Average – 1.0
Monthly Average < 0.2
Bottoms Bridge Bottoms Bridge Manhole
30 Minute Peak – 2.0 Monthly Average – 1.0
Monthly Average < 0.2
Broadwater I Williamsburg Road Manhole
30 Minute Peak – 2.0 Monthly Average – 1.0
Monthly Average < 0.2
Broadwater II Broadwater II Manhole
30 Minute Peak – 2.0 Monthly Average – 1.0
Monthly Average < 0.2
Elko Eastern County FM Outfall at WRF
30 Minute Peak – 300 Monthly Average – 60
Monthly Average < 4.0
Gambles Mill Keystone Manhole 30 minute Peak – 2.0 Daily Average – 0.5
Monthly Average – 0.1
Monthly Average < 0.2
Holladay Branch Mill Place Manhole 30 Minute Peak – 2.0 Monthly Average – 1.0
Monthly Average < 0.2
Meredith Branch FM Gatwick Manhole 30 minute Peak – 2.0 Daily Average – 0.5
Monthly Average – 0.1
Monthly Average < 0.2
Meredith Branch WW Gatwick Manhole 30 minute Peak – 2.0 Daily Average – 0.5
Monthly Average – 0.1
Monthly Average < 0.2
River Road River Road Manhole 30 Minute Peak – 2.0 Monthly Average – 1.0
Monthly Average < 0.2
Strawberry Fort Lee Odor Control Facility
30 Minute Peak – 300 Monthly Average – 70
Monthly Average < 3.0
White Oak Eastern County FM Outfall at WRF
30 Minute Peak – 100 Monthly Average – 50
Monthly Average < 4.0
WRF - ECFM Eastern County FM Outfall at WRF
30 Minute Peak – 300 Monthly Average – 60
Monthly Average < 4.0
All Upstream Water Reclamation Facility (WRF)
30 Minute Peak – 100 Monthly Average – 15
Monthly Average < 0.2
The compliance limits in Table 3 were developed by Henrico County with the goal of reducing corrosion from hydrogen sulfide to the minimum amount possible while avoiding a gross overfeed of treatment chemicals.

Liquid phase grab-sample data is collected, analyzed, and reported on a once-weekly basis for all 11 compliance locations within Henrico County. When a grab sample is collected, the following parameters are tested utilizing the method indicated below:
Total Sulfide: Standard Methods 4500-S2 D – methylene blue. Dissolved Sulfide: Standard Methods 4500-S2 D – using pre-flocculation to remove
insoluble sulfides. pH: Combination glass electrode. Temperature: using NIST calibrated thermometer. Total iron: Standard Methods 3500-Fe D. – phenanthroline (Hach colorimeter). Ferrous iron: Standard Methods 3500-Fe without hydroxylamine reduction step. Residual hydrogen peroxide: DPD redox test strips Residual nitrate: no specific test method required. Residual nitrate testing is not
specifically called for by Henrico County but is collected at applicable compliance points as part of routine sampling.
Advanced Dosing Controllers Advanced dosing controllers were installed at each of the chemical feed sites listed in Table 3. These advanced dosing controllers are designed to be used for liquid phase odor control dosing and are built solely for this purpose. These controllers are able to dose odor control product on a curve rather than a fixed rate, allowing a dosing profile that matches the hydrogen sulfide being generated during typical diurnal flow patterns.
As show in Figure 2, both single pump as well as two-pump, two-timer dosing systems are capable of controlling hydrogen sulfide with varying degrees of efficiency. The area between the curve and the dose line represents overfeed of odor control chemicals. The figure below shows the relationship between the three methods of dosing to achieve the same level of odor control.
SamplingCompliance data is collected, analyzed, and reported on a daily basis, including weekends.Vapor phase hydrogen sulfide data is collected on a continuous basis and is reported daily foreach of the 11 Henrico County compliance locations. The source for all vapor phase hydrogensulfide data is the data-logging instruments deployed at each compliance point. App-Tek OdaLog instruments (now branded as Vaporlink under Evoqua) or approved equal are used to determine hydrogen sulfide concentrations per the Henrico County RFP.

Figure 2 – Dosing Technology Comparison
Advanced dosing controllers incorporate multiple features, providing flexibility and cost-savings for liquid phase odor control chemical dosing. These features include, but are not limited to:
A 24-point curve for each day of the week as the dosing profile. These points are interpolated by the PLC, resulting in a smooth chemical dose curve. The dosing pumps can be constant speed pumps, 4-20 mA input, or VFD driven. In the case of fixed speed pumps, the dosing curve is achieved by the system calculating the percentage of each minute that the pump should be on and turning it off for the remainder of each minute. This dosing curve is determined on a site-by-site basis and is verified by placing a hydrogen sulfide data-logging monitor at the control point and sampling for residual treatment chemicals.
Dose-to-Demand. The advanced dosing controllers are capable of receiving a 4-20 mA input signal from a pump station flow-meter. A specific volume of treatment chemical is then fed per million gallons of wastewater flow.
Automatic Temperature Compensation. Wastewater temperature has a profound effect on bacterial populations and consequently, H2S generation and the quantity of treatment chemical that it is necessary to dose (Tchobanoglous 2003). The advanced dosing controllers allow for a temperature device to be incorporated into the control system and a temperature adjustment factor, calculated using the EPA’s standard method, can be applied to the dosing curve (U.S. EPA 1985)
Daily and Global Factors. It is possible to utilize a single factor to adjust chemical dose rates on a daily and/or global basis, rather than having to change all 24 setpoints for any
0
100
200
300
400
500
600
700
800
Dos
ing
Rat
e (m
L/m
in)
Time of Day
Dosing Technology Comparison
Constant Dose 2 Pump/2 Timer Advanced Dosing Controller
Pump #1 On Pump #2 On
Pumps #1 and #2 On
Pumps #1 and #2 under advanced dosing control Constant Dose = 274 gpd
2 Pump/2 Timer = 179 gpdAdvanced Dosing Controller = 138 gpd
One Pump Only
given day. Additionally, it is possible to alter the feed for any day or days of the week by entering a daily adjustment factor, in addition to, or in place of, the global adjustment factor.
Rain Curves. In collection systems that have significant infiltration and inflow, (I&I) hydrogen sulfide loading typically drops due to reduced BOD and shorter retention times. It is possible to automate a chemical dose reduction through the use of an analog input signal and the flow-logging capabilities of the advanced dosing controller. Rain curve setpoints are programmed into the controller; when instantaneous flow exceeds average flow by a pre-determined volume and time period, chemical feed rates are automatically reduced or can be shut down entirely. When the I&I event ceases and flow drops below the rain curve set-point, the rain curves are deactivated and normal dosing resumes. Rain curves can be either static or a percentage of flow.
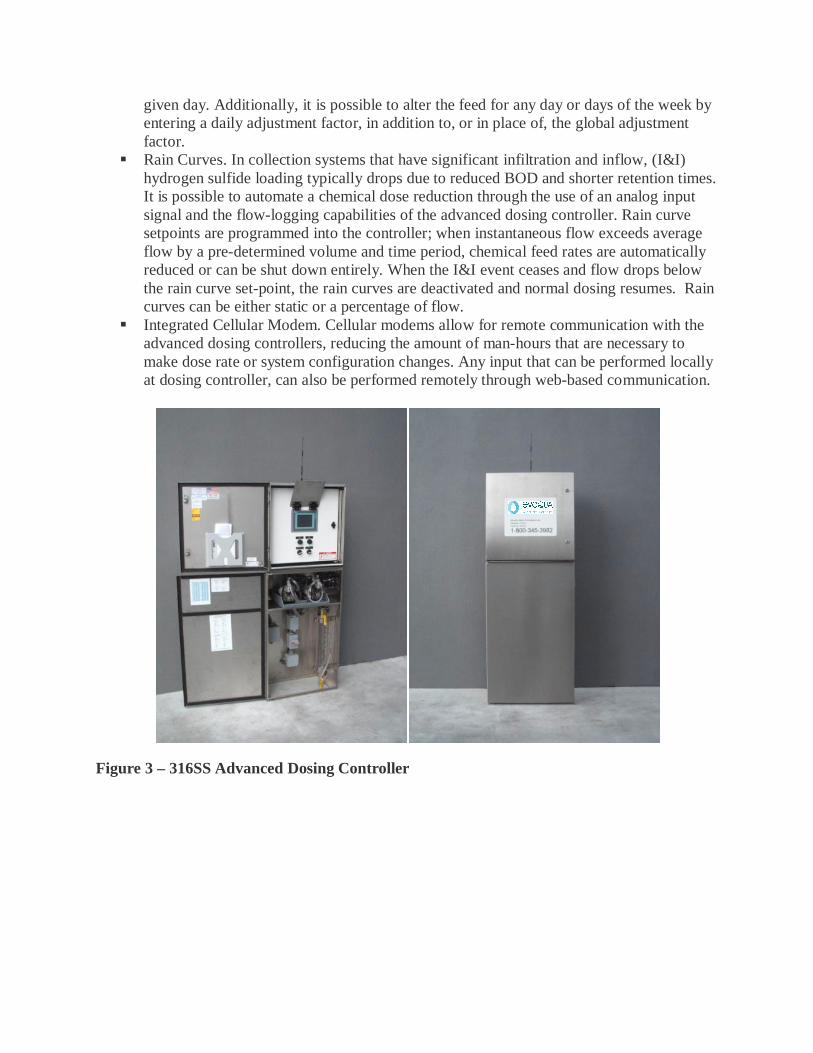
Integrated Cellular Modem. Cellular modems allow for remote communication with the advanced dosing controllers, reducing the amount of man-hours that are necessary to make dose rate or system configuration changes. Any input that can be performed locally at dosing controller, can also be performed remotely through web-based communication.
Figure 3 – 316SS Advanced Dosing Controller

Figure 4 – Polyethylene Advanced Dosing System
Internet-Enabled Hydrogen Sulfide Data-Loggers In order to monitor hydrogen sulfide concentrations at the 11 compliance points within Henrico County, hydrogen sulfide data-logging instruments with an integrated cellular modem were deployed at each compliance location. These modem-enabled data-loggers report hydrogen sulfide concentration data to a website in real-time. The benefits of this system include:
A reduction in manpower necessary for data retrieval. Allows the customer to verify performance of both odor control chemicals and chemical
feed equipment. Communicates hydrogen-sulfide concentrations in real-time, allowing for reduced
response time to hydrogen sulfide compliance-limit violations. Provides alarm notifications to key personnel in the event of a non-compliance event.

Figure 5 – Internet-Enabled Hydrogen Sulfide Data-Logger Web Based Interface Link2Site is a cellular-internet based monitoring and control solution that utilizes cellular networks to provide a reliable, secure, low-cost monitoring and control system. This system provides a single point to fully monitor the chemical feed equipment, change chemical dose rates, download historical data (tank inventory, sewage flow, chemical dose, H2S) and request instantaneous system updates from the website. This technology offers customers, administrators, and operators the following benefits:
The ability to track chemical deliveries. The ability to monitor odor control chemical tank levels Adjust chemical feed rates on chemical feed systems, View historical trending data (tank levels, chemical dose, sewage flow etc) for the life of
the system. Immediate notification of alarms via email, pager, text message, telephone call, or an
combination of the notification methods. Advanced callout scheduling functionality ensures that the appropriate person is called in the event of a system alarm.
marissa.covell
Stamp
marissa.covell
Text Box

Figure 6 – Cellular Interned Based Monitoring and Control System Figure 7 shows hydrogen sulfide data over a week-long period at the Mill Place manhole compliance point. This data is kept permanently and is available at any time on the web-based user interface for any monitored location.
Figure 7 – Web Interface: Hydrogen Sulfide Concentration

Figure 8 – Web Interface: Customer Site Status
Figure 8 shows the customer site status for each of the chemical dosing sites at Henrico County. This page provides a quick overview of all a customer’s chemical dosing sites, with more detailed site information is available by clicking on the appropriate site link.

Figure 9 – Web Interface: Site Inventory and Dosing Trends
Figure 9 provides an example of some of the trending data that is available on the web-based interface. This graph shows chemical inventory, raw dose, and adjusted dose. Like all other data, this is available at any time and for any time period since the site was brought on line. Any measurable system parameter is available for graphical display.
Figure 10 – Web Interface: Daily and Global Dose Adjustment Factors
Figure 10 shows the global and daily dose adjustment factors. A change to the dose can be made simply by changing the dose percentage and clicking on the ‘commit’ button.

Figure 11 – Web Interface: Alarm Notification Tree
Figure 11 details the alarm notification tree, and designates key personnel to be notified in the event of a site alarm.

Figure 12 – Web Interface: Site Dose Curve
Figure 12 displays the entire hourly dose curve. Changes can be made to any or all hourly parameters and uploaded to the advanced dosing controller by clicking on the ‘upload’ button.
Dose Rate Optimization Daily reporting and optimization are part of the odor control program at Henrico County. Daily reports are submitted that provide atmospheric hydrogen sulfide concentrations for all 11 compliance points within Henrico County. As part of this activity, chemical dose rates and hydrogen sulfide concentration data are analyzed and dose rate changes are made by the supplier if necessary. If hydrogen sulfide levels have been stable at the appropriate compliance location for several days, a reduction in dose rate will be made. Dose rate increases are made when the first indication of hydrogen sulfide is present at the compliance location. Dose rate changes are subjective in nature, and operator experience plays a key role. Typically dose rate changes are small, usually 1-2%. Larger changes are made in the event significant peaks occur, and can be made pro-actively when planned flow diversions occur.

RESULTS
The fully automated odor control program at Henrico County has been highly successful in meeting compliance goals, reducing cost to Henrico County, and reducing man-hour cost to Evoqua Water Technologies. Key results are summarized below. Cost Savings The automated odor control program at Henrico County has been fully operational since June 2011. The County’s fiscal year begins in June and ends in May.
Fiscal Year Program Cost Savings % Savings 2010 - 2011 $1,779,459 - - 2011 - 2012 $1,372,459 $406,942 22.7 2012 - 2013 $1,416,500 $362,901 20.4
This savings during fiscal year 2011 – 2012 represents a decrease of $439,051 when compared to the $1,811,510 spent in calendar year 2009, which was the basis of the RFP. This represents a savings of 24.2%. Compliance Record Henrico County allows three non-compliant events at each site per month. After the third violation, a penalty is imposed for each non-compliance event. During the time period beginning June 2011 and ending May 2012, Evoqua has incurred a total of three fines for non-compliance*. Table 4 below summarizes the odor control program’s compliance record. Table 4 – Program Compliance Summary
Total Number of Compliance Events Possible 15 sites x 365 days = 5,475 events
Total Days in Compliance 5,398 Percentage of total events in Compliance 98.6% Total # of Penalties by Henrico County 3
Efficiency of Advanced Dosing Controllers Advanced dosing controllers have been installed at all chemical dosing sites in Henrico County. Over the time period beginning June 2011 and ending in May 2012, total chemical volume used is down from 725,266 gallons to 550,979 gallons. This represents a total reduction in chemical volume of 24.0%. Table 5 details chemical use by month during 2011 and 2012.

Table 5 – Total Chemical Use by Month
Total Chemical Volume Month 2011 2012 July 90,656 67,571
August 133,499 88,854 September 74,425 66,085
October 80,826 64,526 November 64,973 47,463
January 60,940 60,367 February 71,183 45,451 March 39,872 13,855 April 26,595 25,483 May 30,882 28,301 June 51,465 43,013
Total 725,266 550,979
Reduced Labor Hours Utilizing cellular modem communications with the advanced dosing controllers has reduced man-hours necessary to administer the full service odor control program. It is no longer necessary to send a technician to the dosing site to implement a dosing system change. Evoqua’s internal labor tracking system shows a steady reduction in weekly labor hours from July 2011 to through May 2012. Table 6 show the number of hours spent per week charged to Henrico County by the local field service technicians. Table 6 – Labor Hours per Week
Month Labor Hours / Week (1)
August 2011 93.3 September 2011 39.4
October 2011 38.6 November 2011 56.0 December 2011 25.8 January 2012 34.0 February 2012 29.5 March 2012 29.0 April 2012 30.5 May 2012 27.7
(1) Data from June 2011 and July 2011 is not present in this table as Evoqua had transitioned to a new enterprise resource management program and it was not possible to gather data for this time period.

Response Time Internet enabled real-time hydrogen sulfide monitoring has resulted in improved service to Henrico County, allowing Evoqua to respond immediately to alarms and any corresponding dose-rate or system changes, which in turn decreases non-compliance events. Quantitatively it is challenging to provide a number to this objective; qualitatively it is straightforward. Prior to automation, any system change required a technician to be manually notified of an upset condition, and then drive to the site to make the indicated change. Utilizing the alarm notification system provided by the web interface, a technician is notified immediately of an alarm condition and a system change can be made as soon as internet access is available. The web-based user interface has allowed Henrico County to have full access to program information including: compliance monitoring, odor control chemical feed rates, chemical deliveries, access to data for analysis, and overall program performance. As mentioned above, electronic notification of an upset condition is immediate. Notification trees can be structured such that the client is part of the notification alert. System data and program performance is available at all times to both Henrico County and Evoqua, allowing for complete program transparency. CONCLUSIONS The automated odor control program at Henrico County has been successful in meeting the objectives as described in this paper. The key conclusions are summarized below:
Evoqua has been able to meet Henrico County’s stated compliance goals while reducing odor and corrosion program costs up to 24%.
Advanced dosing controllers were deployed at all chemical dosing sites and have been able to reduce total chemical volume fed by 24%
Cellular modem and web-based communication with the advanced dosing controllers has reduced the man-hours necessary for Evoqua to administrate the program.
Internet-enabled, real-time, hydrogen sulfide data logging monitors have resulted in improved service to Henrico County. Changes to dose rates and system configurations can now be made in a matter of minutes, as opposed to deploying a technician to a chemical feed site.
Web-base odor and corrosion control program monitoring has been made available to Henrico County, and provides full-access to all program data and trends. This allows the county to be fully aware of the state of the program at all times.
REFERENCES Boone, A.G. (1995) Septicity in Sewers: causes, consequences, and containment, Water Science
and Technology Vol. 31 No. 7 pp 237-253, IWA Publishing Joyce, J. (2001) An Overview of Methods and Approaches for Estimating and Solving Odor and
Corrosion Problems in Collection Systems, Water Environment Federation: Odor and Corrosion Prediction and Control in Collection Systems and Wastewater Treatment Plants, pp. 4-6

Pomeroy, R.D.; Parkhurst, J.D. (1977) The forecasting of sulfide build-up rates in sewers. Prog. Water Technology, 9, pp 621-628.
Tchobanoglous, George (2003) Wastewater Engineering: Treatment and Reuse, Fourth Edition. Metcalf and Eddy, Inc., McGraw-Hill; New York.
U.S. Environmental Protection Agency (1974) Process Design Manual for Sulfide Control in Sanitary Sewerage Systems; EPA-625/1-74-005; Washington, D.C.
U.S. Environmental Protection Agency (1985e) Odor and Corrosion Control in Sanitary Sewerage Systems and Treatment Plants, Design Manual, EPA-625/1-85-018, U.S. Environmental Protection Agency, Washington