
Hydrogen in Transportation Applications - DRI Desert Research

Hydrogen in Transportation Applications
Amber Broch
OVERVIEW
Project background and descriptionInvestigation of codes and standards for hydrogen and CNG for fueling facilities, testing facilities, storage and infrastructure. ADVISOR modeling softwareCNG and HCNG vehicle performance and emissions testing.Next Steps

H2 Transportation Project Description
Funded by NREL through the NSWEP Program.Investigate practical aspects of hydrogen production, storage and use in transportation applications.
– Infrastructure assessmentsInvestigate performance and emissions tradeoffs of CNG and HCNG.Collaborate with NREL to contribute data to technical data archive, update vehicle modeling tool. Collaborate with Washoe County Regional Transportation Commission (RTC) in their efforts to deploy hydrogen fueled fleet. Coordinate with NSWEP DRI REC project.

Partners/ Collaborators
Washoe County Regional Transportation Commission (RTC)– Vehicles– Fuel (CNG)– Maintenance and Support
Collier Technologies– HCNG conversion– Testing support and data analysis
Jones West Ford– Use of chassis dynamometer– Maintenance

Infrastructure Assessment
Infrastructure assessment for location of H2 production, fueling or vehicle testing facility at DRI-REC
– Permitting requirements– Codes and Standards– Station layout and suggested design
Assessment of feasibility of various hydrogen production approaches at DRI-REC.Cost assessment and additional requirements for indoor testing facility.

Vehicle Description
RTC donated two vehicles from their retired Paratransit fleet.1998 Ford E-350 5.4L V8 ICE CNG, after-market conversion.3,600 psi, 5 tanks store about 100 nominal gallons ~ 100-180 miles.Wheelchair lift requires additional 200 Amp alternator and 12 V battery.250,000 + miles.
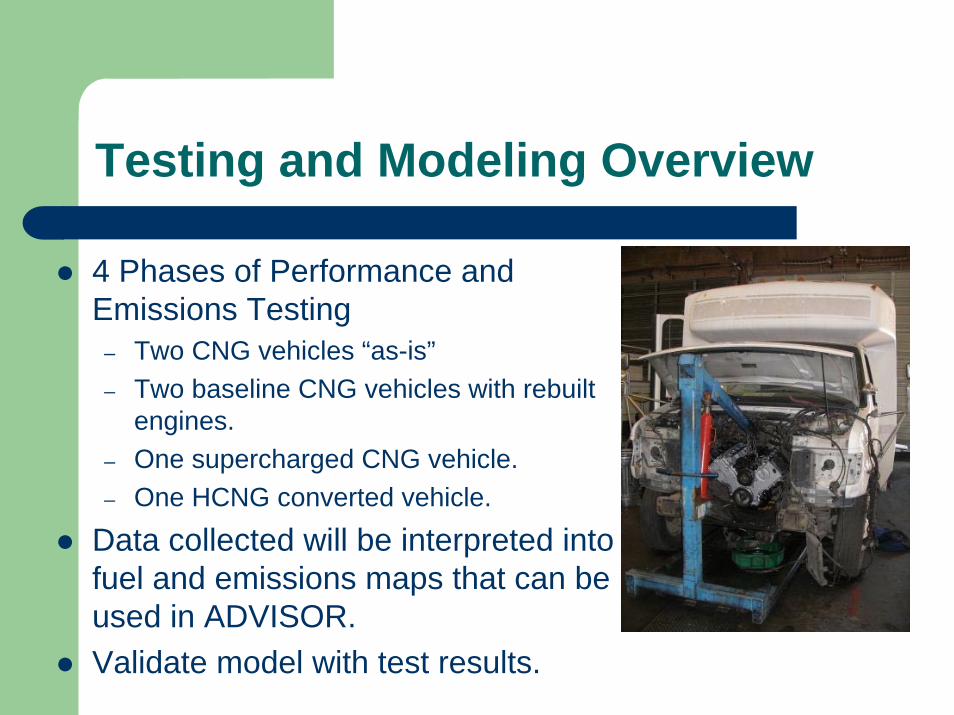
Testing and Modeling Overview
4 Phases of Performance and Emissions Testing
– Two CNG vehicles “as-is”– Two baseline CNG vehicles with rebuilt
engines.– One supercharged CNG vehicle.– One HCNG converted vehicle.
Data collected will be interpreted into fuel and emissions maps that can be used in ADVISOR. Validate model with test results.
HCNG Conversion
Collier TechnologiesHCNG– 30% Hydrogen by volumeSupercharger w/ EGR, timingEmissions benefits, performance drawbacks.

ADvanced VehIcle SimulatORDeveloped by NREL using MatLab and Simulink, licensed by AVLUses inputs on vehicle geometry, performance, emissions, and environmental characteristics to model on different drive cycles. Includes data on variety of vehicle platforms.Allows user to create required data files.
Vehicle Modeling in ADVISOR
0.1 0.15 0.20.25
0.3
0.35
Vehicle Modeling
Preliminary CNG and HCNG modeling.– No data specific for 5.4L CNG– No data for HCNG– Data from an 8.1 L CNG/ HCNG converted engine was
input and used.
Update model with performance and emissions data from testing of both CNG and HCNG.
– Fuel consumption/ efficiency maps– Emissions maps

Vehicle Testing
Four phases of testing– Baseline testing of CNG vehicles prior to
installation of rebuilt engines– CNG testing both vehicles with rebuilt engines– Supercharged CNG testing—one vehicle– HCNG testing– one vehicle
Chassis dynamometer testing– IM240 drive cycle– Steady point tests to develop maps– Maximum power curve testing.
Road testing –0-55 mph performance testing.

Testing Equipment
AutoEnginuityOBDII Scanner
– Vehicle Speed– Engine Speed– Mass Air Flow– Throttle Position
5 Gas Analyzer– CO2
– CO– O2
– NOx
– HC– Lambda– RPM– Exhaust Temp
Dynamometer Software
– Engine RPM (via tach.)
– Horsepower (from rollers)
– Vehicle speed (roller speed)
Results To-Date
Testing of baseline CNG vehicle.Testing of supercharged CNG vehicle.Conversion to HCNG.
Next Steps
Testing of HCNG vehicle. Developing engine and emissions map to update ADVISOR modelModeling hybrid vehicles.
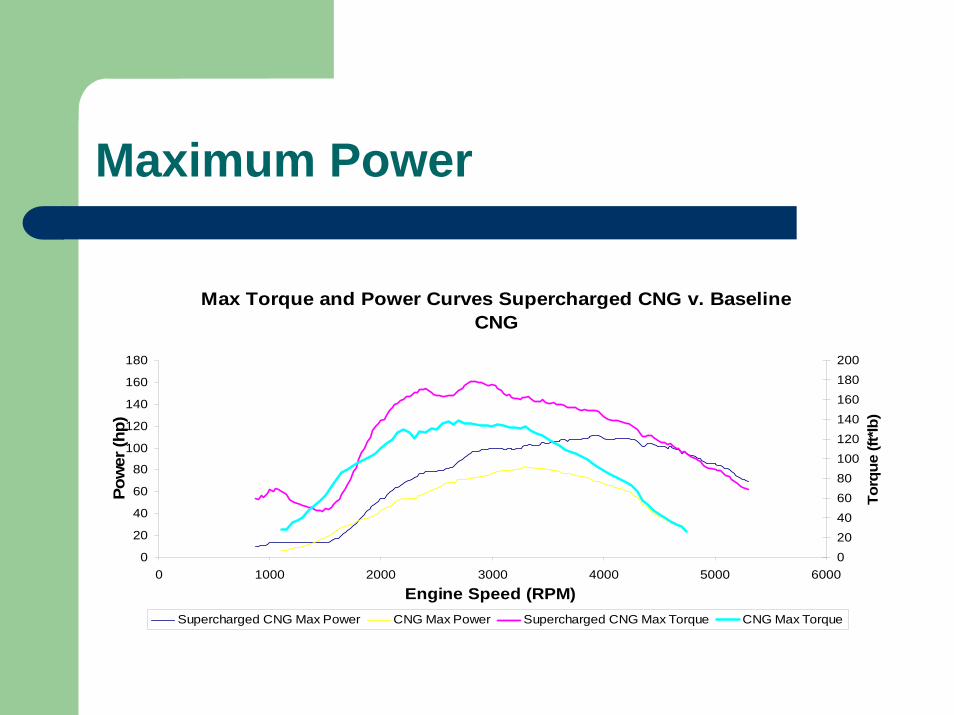
Maximum Power
Max Torque and Power Curves Supercharged CNG v. Baseline CNG
0
20
40
60
80
100
120
140
160
180
0 1000 2000 3000 4000 5000 6000
Engine Speed (RPM)
Pow
er (h
p)
020406080100120140160180200
Torq
ue (f
t*lb)
Supercharged CNG Max Power CNG Max Power Supercharged CNG Max Torque CNG Max Torque
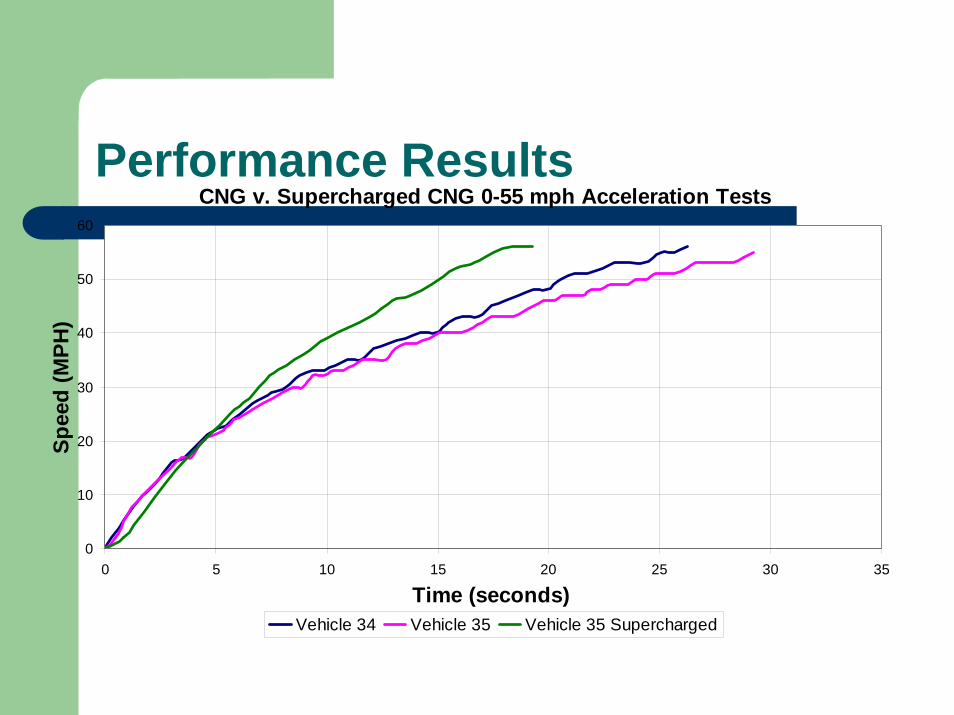
Performance ResultsCNG v. Supercharged CNG 0-55 mph Acceleration Tests
0
10
20
30
40
50
60
0 5 10 15 20 25 30 35
Time (seconds)
Spee
d (M
PH)
Vehicle 34 Vehicle 35 Vehicle 35 Supercharged
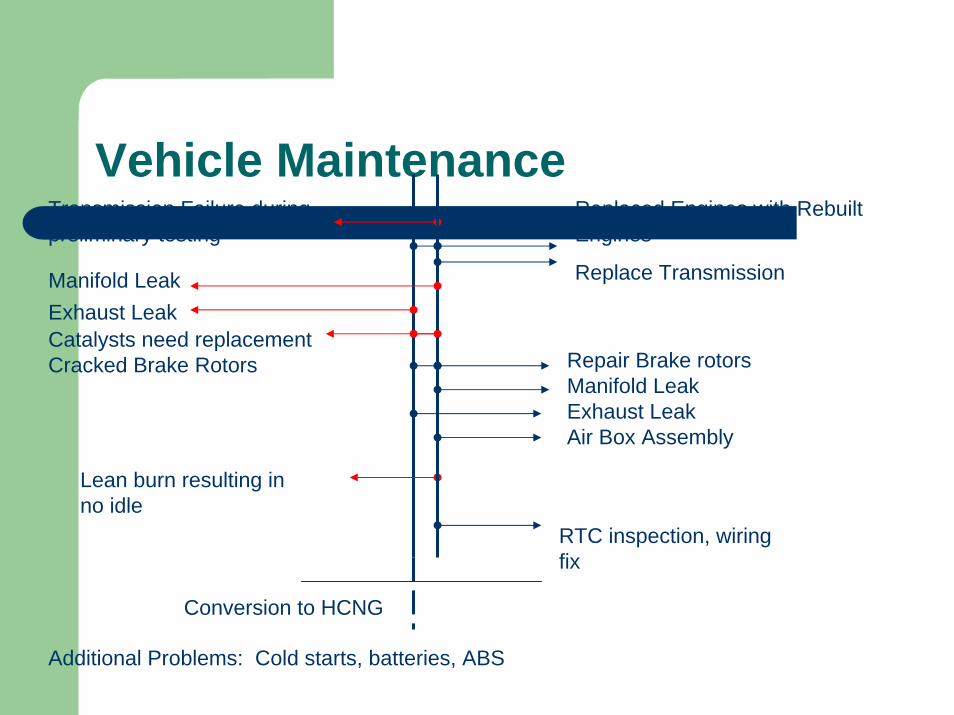
Vehicle MaintenanceTransmission Failure during preliminary testing
Replaced Engines with Rebuilt Engines
Catalysts need replacementCracked Brake Rotors Repair Brake rotors
Manifold LeakExhaust LeakAir Box Assembly
Lean burn resulting in no idle
RTC inspection, wiring fix
Replace TransmissionManifold LeakExhaust Leak
Additional Problems: Cold starts, batteries, ABS
Conversion to HCNG