Hydrogen embrittlement of a bimaterial - University of … embrittlement of a bimaterial...
24
Hydrogen embrittlement of a bimaterial C. Ayas, N.A. Fleck, V.S. Deshpande ∗ Department of Engineering, Cambridge University, Trumpington Street, Cambridge CB2 1PZ, UK. Abstract Commonly, within the energy industry, the corrosion resistance of pressure vessel steels is increased by the addition of an overlay coating comprising a nickel-based alloy or a stainless steel. However, the interface between the two alloys is prone to hydrogen-assisted cracking, due to for example carbide precipitation near the interface. In the present study, the sensitivity of the tensile strength of the interface to hydrogen concentration is measured for both notched and un-notched specimens made from the overlay welding of 690 nickel alloy on a low alloy steel A533B. An elastic-plastic finite element analysis is used to determine the stress and strain state near the notch root, and thereby to calculate the local distribution of hydrogen within the lat- tice and at traps. The observed strength of the notched specimens is best rationalised by assuming that the local cohesive strength of the interface is a function of the lattice hydrogen concentration, with a negligible influence of the trapped hydrogen. The scatter in specimen strength, and the relative strength of the notched and un-notched specimens, are adequately described by Weibull statistics, with a low value of Weibull modulus equal to 3.4. Keywords: Failure, hydrogen, diffusion, size effects. 1. Introduction Weld cladding is the deposition of a relatively thick (3 mm or more) metal layer onto a metallic substrate in order to improve the corrosion or wear resistance of the material. It is widely used in nuclear and steam power plants, petrochemical applications and in pipelines (Rao et al., 2011). An ∗ Corresponding author E-mail address: [email protected] Preprint submitted to Mechanics of Materials November 4, 2013 Manuscript Click here to view linked References
Transcript of Hydrogen embrittlement of a bimaterial - University of … embrittlement of a bimaterial...
Hydrogen embrittlement of a bimaterial
C. Ayas, N.A. Fleck, V.S. Deshpande∗
Department of Engineering, Cambridge University, Trumpington Street, Cambridge CB21PZ, UK.
Abstract
Commonly, within the energy industry, the corrosion resistance of pressurevessel steels is increased by the addition of an overlay coating comprising anickel-based alloy or a stainless steel. However, the interface between thetwo alloys is prone to hydrogen-assisted cracking, due to for example carbideprecipitation near the interface. In the present study, the sensitivity of thetensile strength of the interface to hydrogen concentration is measured forboth notched and un-notched specimens made from the overlay welding of690 nickel alloy on a low alloy steel A533B. An elastic-plastic finite elementanalysis is used to determine the stress and strain state near the notch root,and thereby to calculate the local distribution of hydrogen within the lat-tice and at traps. The observed strength of the notched specimens is bestrationalised by assuming that the local cohesive strength of the interface isa function of the lattice hydrogen concentration, with a negligible influenceof the trapped hydrogen. The scatter in specimen strength, and the relativestrength of the notched and un-notched specimens, are adequately describedby Weibull statistics, with a low value of Weibull modulus equal to 3.4.
Keywords: Failure, hydrogen, diffusion, size effects.
1. Introduction
Weld cladding is the deposition of a relatively thick (3 mm or more)metal layer onto a metallic substrate in order to improve the corrosion orwear resistance of the material. It is widely used in nuclear and steam powerplants, petrochemical applications and in pipelines (Rao et al., 2011). An
∗Corresponding author E-mail address: [email protected]
Preprint submitted to Mechanics of Materials November 4, 2013
ManuscriptClick here to view linked References
example is the overlay of stainless steel on the surface of a low alloy steel forimproved corrosion resistance.
Usually, the clad and the base material are metals of dissimilar compo-sition and properties, and it is challenging to produce a dissimilar weldinginterface that is of sufficient strength and ductility that the component willnot fail from the weld (Satyanarayana et al., 2005). Intermetallic compoundsmay form at the weld interface between the dissimilar metals that deteriorateductility, or increase susceptibility to corrosion or hydrogen embrittlement(Sireesha et al., 2000). The weld strength can also be significantly degradedby the presence of residual stress. For example, Lee and Chang (2012) havepresented a three-dimensional FE simulation of bimaterial welding to iden-tify the temperature and residual stress fields in butt-welded joints betweenplain carbon steels and stainless steels.
Hydrogen embrittlement is a recognised threat for welded joints since hy-drogen take-up can arise during the welding operation. Recently, Blach et al.(2011) have investigated the influence of hydrogen charging upon the roomtemperature tensile properties and fracture behaviour of dissimilar weldedjoints. They conjectured that hydrogen charging has a detrimental effectupon the strength of a ferritic/ferritic weld, but only a small influence on thestrength of a ferritic/austenitic weld.
In our previous work (Ayas et al., 2013) we investigated the hydrogenembrittlement of monolithic, high strength low alloy AISI 4135 steel; weconcluded that strength of notched and un-notched specimens correlate withthe concentration of lattice (diffusible) hydrogen while the trapped hydrogenat dislocations, grain boundaries and carbides have a negligible effect on thefailure strength. A fracture locus for notched specimens was established interms of peak maximum principal stress versus concentration of diffusiblehydrogen. A similar fracture locus, but displaced to lower strength levels,was obtained for un-notched specimens. Weibull theory was used to accountfor the reduction in strength with increasing stressed-volume.
In the current paper, we measure and analyse the loss in strength of adissimilar weld, comprising 690 Nickel alloy and A533B low alloy steel (LAS)for pressure vessel applications, due to dissolved hydrogen. A failure locusin terms of strength versus hydrogen content is constructed for both notchedand un-notched specimens, and Weibull theory is invoked in order to accountfor the observed statistical scatter in strength and for an observed size effect.
2
2. A brief summary of Oriani theory
We begin our study by summarising the relative distribution of hydrogenin the lattice and at traps, in accordance with Oriani’s theory (Oriani, 1970;Sofronis and McMeeking, 1989). Hydrogen is stored either at normal inter-stitial lattice sites (NILS) or is trapped at micro-structural defects such asdislocations, grain boundaries, interfaces and carbides. The concentration ofhydrogen at NILS, also called the lattice hydrogen concentration, is given by
CL = θLβNL, (1)
where θL is the fraction of occupied interstitial lattice sites, β is the numberof NILS per lattice atom and NL is the number of lattice atoms per unitvolume. Similarly, the concentration of hydrogen trapped at any given siteis
CT = θTαNT , (2)
where θT is the fraction of occupied trapping sites, α is the number of atomsites per trap and NT is the number of traps per unit volume. Oriani’sequation relates the equilibrium value of occupancy ratio of sites, in termsof an equilibrium constant K, as
θT1− θT
= KθL
1− θL. (3)
In turn, K is related to the the trap binding energy ΔH , the gas constantR = 8.314 J/(mol K) and the absolute temperature T according to
K = exp
(−ΔH
RT
). (4)
Upon examining Eq. (4) we recognise that the value of θT is much more sen-sitive to ΔH than to θL since the equilibrium constant K has an exponentialdependence upon ΔH .
2.1. Dislocation traps
Now consider dislocation traps. The concentration of hydrogen C(d)T
trapped at dislocation cores is given by Eq. (2), with α = 1, and θT given byEqs. (3) and (4). However, the number of dislocation traps per unit volume
N(d)T increases with the von Mises plastic strain εp in contrast to the fixed
3
number of carbide traps N(c)T and grain boundary traps N
(gb)T . Following
Novak et al. (2010) we can relate N(d)T to the dislocation density ρd and to
the lattice parameter a of the crystal structure of host atoms according to
N(d)T =
√2ρd/a. (5)
In turn, ρd scales with εp according to
ρd =
ρ0 + kεp εp ≤ 0.5
1016m−2 εp > 0.5(6)
where ρ0 = 1010 m−2 is the dislocation density of the material at zero plas-tic strain and k = 2 × 10¹⁶ m−2 (Novak et al., 2010). The set of equations
(1-6) gives the concentration of hydrogen C(d)T that is trapped at disloca-
tions. In order to specify the value of C(d)T , the values of (εp, CL) and the
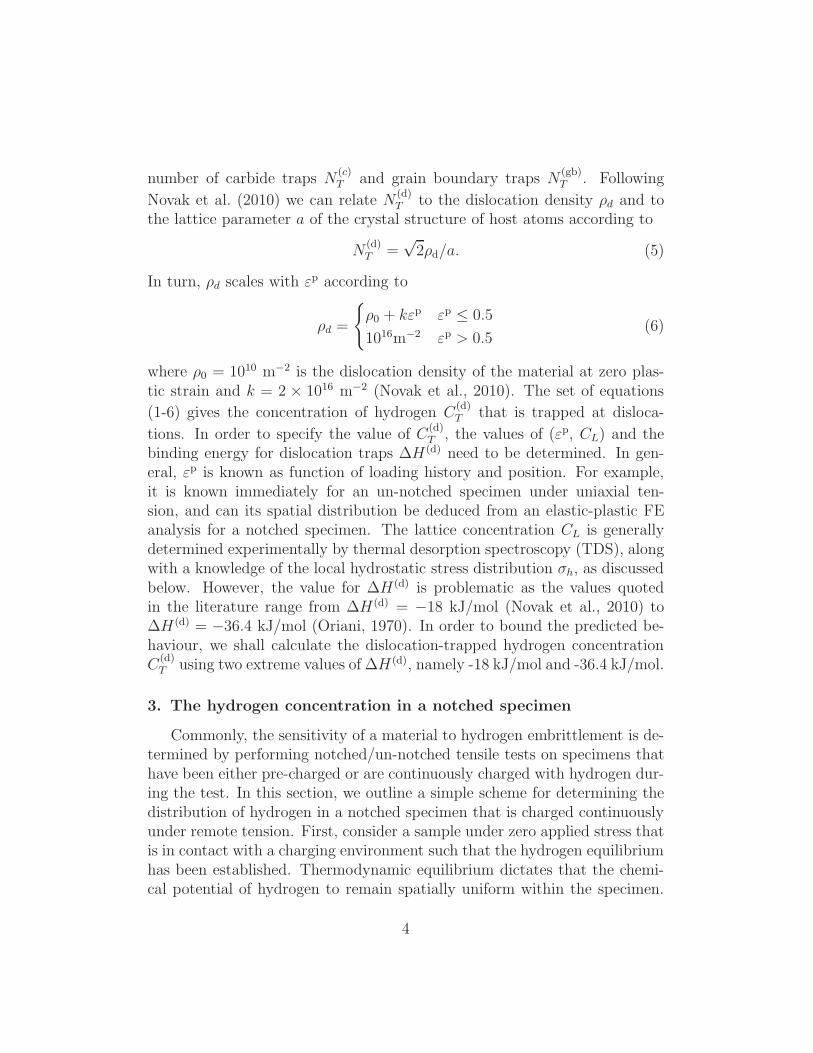
binding energy for dislocation traps ΔH (d) need to be determined. In gen-eral, εp is known as function of loading history and position. For example,it is known immediately for an un-notched specimen under uniaxial ten-sion, and can its spatial distribution be deduced from an elastic-plastic FEanalysis for a notched specimen. The lattice concentration CL is generallydetermined experimentally by thermal desorption spectroscopy (TDS), alongwith a knowledge of the local hydrostatic stress distribution σh, as discussedbelow. However, the value for ΔH (d) is problematic as the values quotedin the literature range from ΔH(d) = −18 kJ/mol (Novak et al., 2010) toΔH(d) = −36.4 kJ/mol (Oriani, 1970). In order to bound the predicted be-haviour, we shall calculate the dislocation-trapped hydrogen concentrationC
(d)T using two extreme values of ΔH(d), namely -18 kJ/mol and -36.4 kJ/mol.
3. The hydrogen concentration in a notched specimen
Commonly, the sensitivity of a material to hydrogen embrittlement is de-termined by performing notched/un-notched tensile tests on specimens thathave been either pre-charged or are continuously charged with hydrogen dur-ing the test. In this section, we outline a simple scheme for determining thedistribution of hydrogen in a notched specimen that is charged continuouslyunder remote tension. First, consider a sample under zero applied stress thatis in contact with a charging environment such that the hydrogen equilibriumhas been established. Thermodynamic equilibrium dictates that the chemi-cal potential of hydrogen to remain spatially uniform within the specimen.
4
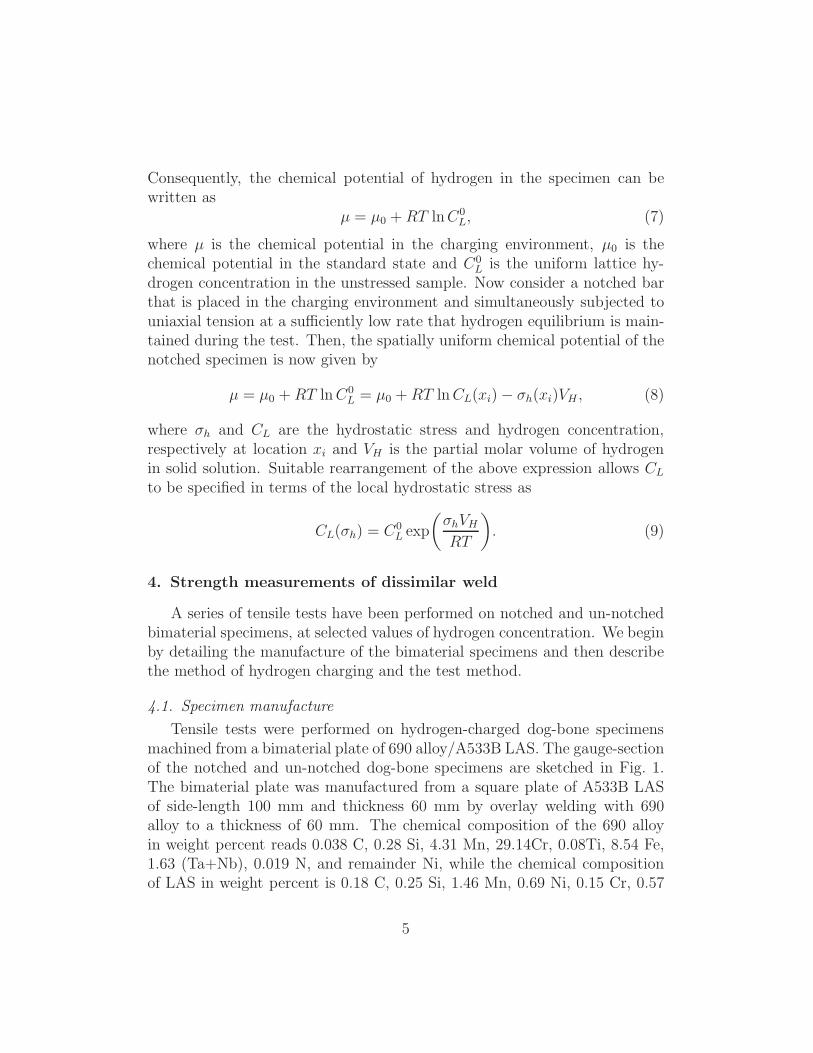
Consequently, the chemical potential of hydrogen in the specimen can bewritten as
μ = μ0 +RT lnC0L, (7)
where μ is the chemical potential in the charging environment, μ0 is thechemical potential in the standard state and C0
L is the uniform lattice hy-drogen concentration in the unstressed sample. Now consider a notched barthat is placed in the charging environment and simultaneously subjected touniaxial tension at a sufficiently low rate that hydrogen equilibrium is main-tained during the test. Then, the spatially uniform chemical potential of thenotched specimen is now given by
μ = μ0 +RT lnC0L = μ0 +RT lnCL(xi)− σh(xi)VH , (8)
where σh and CL are the hydrostatic stress and hydrogen concentration,respectively at location xi and VH is the partial molar volume of hydrogenin solid solution. Suitable rearrangement of the above expression allows CL
to be specified in terms of the local hydrostatic stress as
CL(σh) = C0L exp
(σhVH
RT
). (9)
4. Strength measurements of dissimilar weld
A series of tensile tests have been performed on notched and un-notchedbimaterial specimens, at selected values of hydrogen concentration. We beginby detailing the manufacture of the bimaterial specimens and then describethe method of hydrogen charging and the test method.
4.1. Specimen manufacture
Tensile tests were performed on hydrogen-charged dog-bone specimensmachined from a bimaterial plate of 690 alloy/A533B LAS. The gauge-sectionof the notched and un-notched dog-bone specimens are sketched in Fig. 1.The bimaterial plate was manufactured from a square plate of A533B LASof side-length 100 mm and thickness 60 mm by overlay welding with 690alloy to a thickness of 60 mm. The chemical composition of the 690 alloyin weight percent reads 0.038 C, 0.28 Si, 4.31 Mn, 29.14Cr, 0.08Ti, 8.54 Fe,1.63 (Ta+Nb), 0.019 N, and remainder Ni, while the chemical compositionof LAS in weight percent is 0.18 C, 0.25 Si, 1.46 Mn, 0.69 Ni, 0.15 Cr, 0.57
5
Mo, and remainder Fe. Prior to the overlay welding operation, the LASwas austenitized at 880C for 185 minutes, and water-quenched to roomtemperature, tempered at 645C for 380 minutes in order to achieve temperedmartensite.
The bimaterial was produced by shielded, metal arc welding of 690 alloyrods, of diameter 4 mm, onto the LAS using a current of 140 A, voltage of21 V and a welding speed of 2.7 mm s−1. Subsequently, a post-weld heattreatment was applied by heating up the bimaterial to 615C for 5 hours.
4.2. Calibration of charging conditions for hydrogen
The dog-bone specimens were immersed in a range of aqueous environ-ments, and a prescribed current density was impressed in order to achievean equilibrium concentration of hydrogen, see Table 1. The hydrogen con-centration C0
L is measured by the standard technique of Thermal DesorptionSpectroscopy (TDS), and is briefly summarised as follows. Test plates ofLAS, of dimension 10 mm × 5 mm × 1 mm, were charged for 24 hoursusing each of the charging conditions listed in Table 1. This time is ade-quate to give an equilibrium concentration of hydrogen, in view of the factthat the room temperature diffusion constant for hydrogen within LAS isD = 8.75 × 10⁻¹¹ m2 s−1. The TDS measurement consists of heating thetest plate at 100C/hour from room temperature to 600C and recording thehydrogen desorption rate as a function of time (or equivalently temperature)via mass spectroscopy. It is assumed that the diffusible/lattice hydrogen isdesorbed up to a temperature of 250C, and consequently the value of C0
L istaken to be the area under the curve of desorption rate versus time up to atemperature of 250C. (At higher temperatures, the hydrogen desorbs fromthe strong traps, such as grain and carbides).
4.3. Test Method
The bimaterial dog-bone specimens, of gauge section shown in Fig. 1, werepre-charged for 24 hours using the environments listed in Table 1. Duringthis pre-treatment, the specimens were held under fixed load such that thenet section stress σnet was 20MPa. After the pre-treatment, the imposedhydrogen environment was maintained and σnet was increased according tothe prescription as sketched in Fig. 2:
(i) immediate increase to 100 MPa, then(ii) increment σnet by 1.20 MPa every 900 s until failure occurs. Thus, the
average loading rate is 1.3 kPa s−1.
6

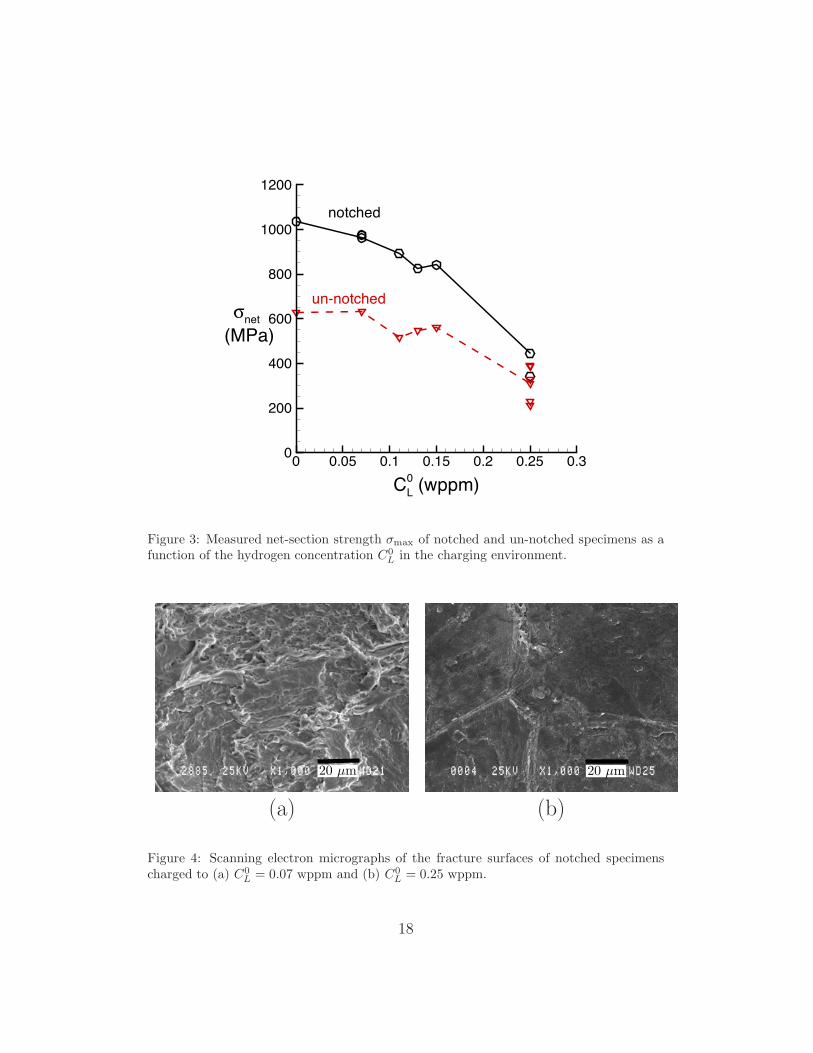
4.4. Measured tensile strength as a function of hydrogen content
The maximum net section stress (i.e. the failure stress) σmax is plottedas a function of lattice hydrogen concentration C0
L in Fig. 3 for both theun-notched and notched specimens. For both geometries the following qual-itative behaviour is observed. At C0
L below about 0.1 wppm, σmax is almostindependent of C0
L and has little scatter in value. In contrast, at C0L above
0.1 wppm, σmax drops with increasing C0L and displays significant scatter.
This is suggestive of a switch in failure mechanism. To investigate this, thefracture surfaces of the specimens were examined in the optical and scanningelectron microscope (SEM).
Consider first the notched specimens. Failure was always along the weldinterface; micro-void coalescence occurred at C0
L below about 0.1 wppm,whereas brittle, inter-granular failure occurred at higher values of C0
L, com-pare the SEM image in Fig. 4a forC0
L = 0.07 wppm with that shown in Fig. 4bfor C0
L = 0.25 wppm. Second, consider the un-notched specimens. The frac-ture surface of the severely charged specimens, at C0
L above 0.1 wppm, isagain by brittle, inter-granular fracture along the weld interface. In contrast,at C0
L below 0.1 wppm, necking occurs within the softer 690 alloy at a lo-cation away from the weld line; a cup and cone failure was observed withmicro-void coalescence evident in the central cup. In broad terms, we con-clude that the presence of low concentrations of hydrogen has only a verymild influence on the ductile failure of the notched and un-notched speci-mens, whereas a higher concentration of hydrogen significantly degrades thecleavage strength of the weld. This interpretation is made more precise by afinite element study, as reported in the following section.
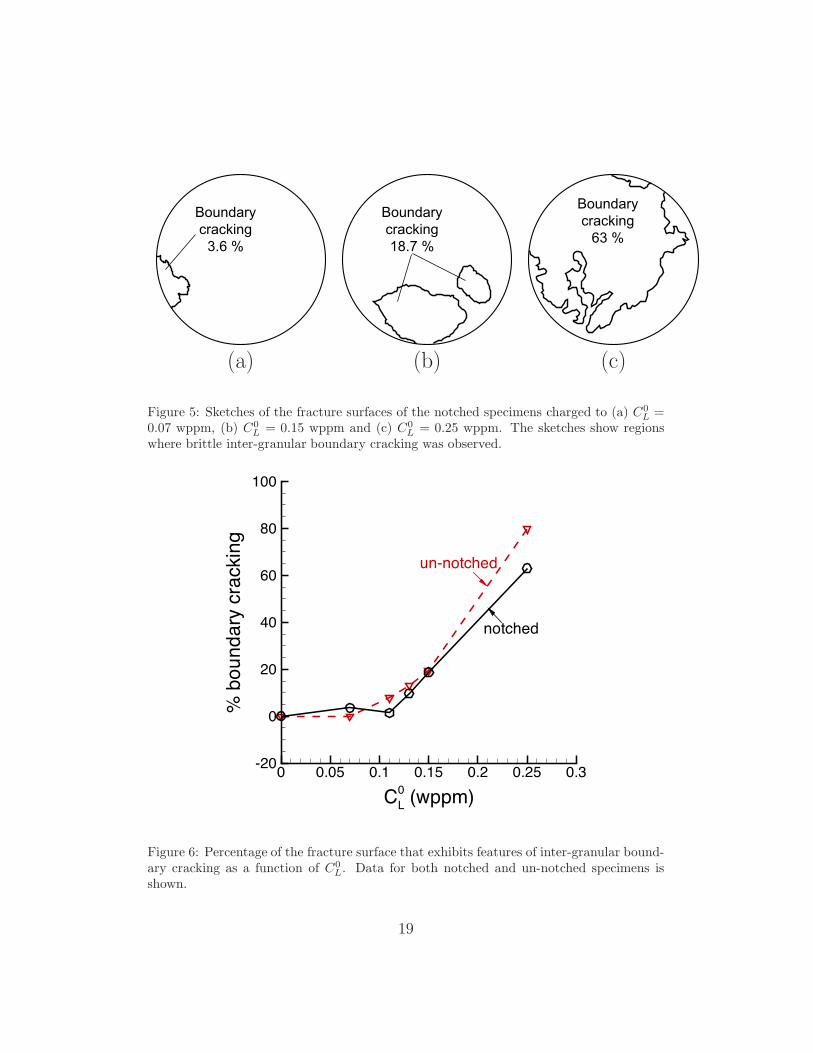
Additional insight into the competition between cleavage and ductile frac-ture is obtained by measuring with the SEM the area fraction of fracture sur-face that exhibits brittle, inter-granular cracking. Representative sketches ofthe failed cross-section of the notched specimens are given in Fig. 5 for se-lected values of hydrogen concentration, and a plot of the area fraction ofcleavage fracture versus C0
L is given in Fig. 6 for both notched and un-notchedspecimens. The dependence of area fraction of cleavage upon C0
L is very sim-ilar for both geometries, and a clear transition in response from cleavage tomicro-void coalescence is noted at C0
L equal to 0.1. This characteristic re-sponse of area fraction of cleavage versus C0
L has direct practical benefit in afailure investigation: it gives guidance upon the hydrogen content within afailed specimen or structure.
7
5. Establishment of a failure criterion
We proceed to establish a failure criterion for the notched (and un-notched) specimens in the presence of hydrogen. Our overall goal is to gen-erate a unique failure locus in terms of local tensile stress σ22 versus localhydrogen concentration at the weld interface, and thereby rationalise thedata shown in Fig. 3. But there is choice in the type of hydrogen concentra-tion that dictates the strength: the degradation in strength may arise fromthe lattice concentration CL, from the concentration at traps such as disloca-tions C
(d)T , grain boundaries C
(gb)T , or carbides C
(c)T , or by some combination
of the above.First, consider the hydrogen concentration at grain boundary and carbide
traps. Upon invoking Eqs. (1-4) we find that the carbide and grain boundary
traps are both fully saturated i.e. θ(gb)T ≈ 1 and θ
(c)T ≈ 1, for the range of C0
L
values in our experiments1. We conclude that carbide and grain boundarytraps at the bimaterial interface do not lead to the observed major drop instrength σmax upon increasing C0
L, recall Fig. 3. The lattice hydrogen andhydrogen trapped at dislocations are however potential sources of hydrogenembrittlement. Consequently, in the remainder of this paper we shall assesthe relative significance of lattice hydrogen and dislocation traps in degradingthe strength of the bimaterial interface.
5.1. Finite element analysis
In order to determine a failure locus for a bimaterial interface, in termsof local tensile stress σ22 versus any choice of local hydrogen concentra-tion, a knowledge of σ22 and of the local hydrogen concentration is required.The local lattice hydrogen concentration CL depends upon the local hydro-static stress in accordance with Eq. (9), while C
(d)T follows from Eqs. (2-6),
where the von-Mises plastic strain is taken as an input. We employ, anaxi-symmetric, elastic-plastic FE model in order to calculate the stress andstrain distribution of the notched specimens at failure, see Fig. 1a. The FEmesh consists of 1461 bilinear quadrilateral elements, and the mesh densityis increased in the vicinity of the notch in order to determine accurately thestress and strain state at the notch root. Both elastic and plastic response
1In Eqs. (1-4) we assumed that β = 6 and NL = 8.46×1028 m−3 for BCC iron (Sofronisand McMeeking, 1989) and the trap binding energies for grain boundaries and carbidesare ΔH(gb) = −48 kJ/mol and ΔH(c) = −72 kJ/mol (Novak et al., 2010), respectively.
8
for 690 alloy and LAS are defined by separate uniaxial tensile stress versusstrain curves measured from un-notched monolithic specimens tested in air.The FE analysis assumes of J2 flow theory, with isotropic hardening. Theexperimentally measured uniaxial stress versus strain curves were idealisedas
σ =
Eε ε ≤ σy/E
σy + hεp ε > σy/E(10)
where E is the Young’s modulus, ε is the total strain, σy is the yield strengthand h is the plastic hardening rate. The value of parameters that characterisethe mechanical response of 690 alloy and LAS are tabulated in Table. 2.We assume that the hardening rate h remains the same upon exposure tohydrogen in LAS and 690 alloy. In support of this assumption, we note thatWang et al. (2005) found hydrogen charging did not change the shape ofthe stress-strain curves of AISI-4135 high strength low alloy steel but onlyreduced the ductility due to the switch in failure mechanism.
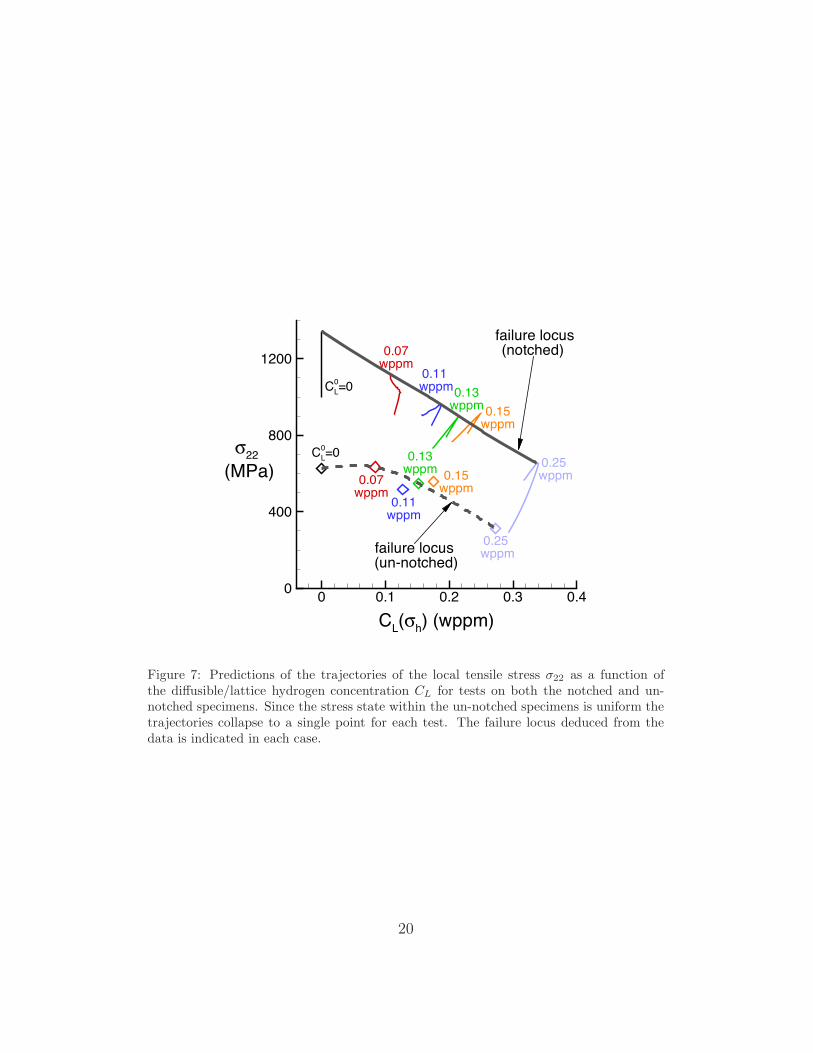
5.2. Failure locus
In order to assess the roles of CL and C(d)T hydrogen embrittlement we
begin by attempting to construct a unique failure locus of σ22 versus CL
from the measured data. In a similar manner we shall assess whether theexperimental data suggests a unique failure locus of σ22 versus C
(d)T . Our
strategy of seeking a failure locus follows that of Wang et al. (2005) and Ayaset al. (2013), and can be outlined as follows. Consider a notched specimenwhich has been charged to a selected value of C0
L. The stress distributionσ22(x1) along the net section is determined by elasto-plastic FE analysis, atan overall net-section stress level given by the observed value of σmax. Inaddition, the hydrostatic stress distribution σh(x1) is deduced from the FEanalysis. For the un-notched specimens the stress state is uniform prior toany necking and σ22 = σnet. We proceed to calculate the distribution ofCL(σh) as a function of position from Eq. (9) with T = 298K and VH =2.1× 10⁻⁶ m3/mol: in all the tests, the test time exceeded the diffusion timeof lattice hydrogen in LAS which justifies the use of Eq. (9). Then we plottrajectories of σ22 versus CL by treating position as an intrinsic variable,for any prescribed value of C0
L in the notched tests, see Fig. 7. For theun-notched specimens, the hydrostatic stress is uniform, and so we obtainuniform distributions of σ22 = σnet and CL(x1) from Eq. (9). Consequently,failure of un-notched specimens are represented by points in σ22 versus CL
9
space, see Fig. 7. A failure locus can be constructed in σ22 versus CL(σh)space by drawing an outer envelope to the individual trajectories for notchedspecimens. In similar fashion, a failure locus for the un-notched specimens isconstructed by connecting the points which represent the failure state of un-notched specimens in σ22 versus CL space. We observe from this procedurethat the locus for the un-notched specimens lies significantly below thatdeduced for the notched specimens. A pronounced size effect is evident andthis will be explained further below.
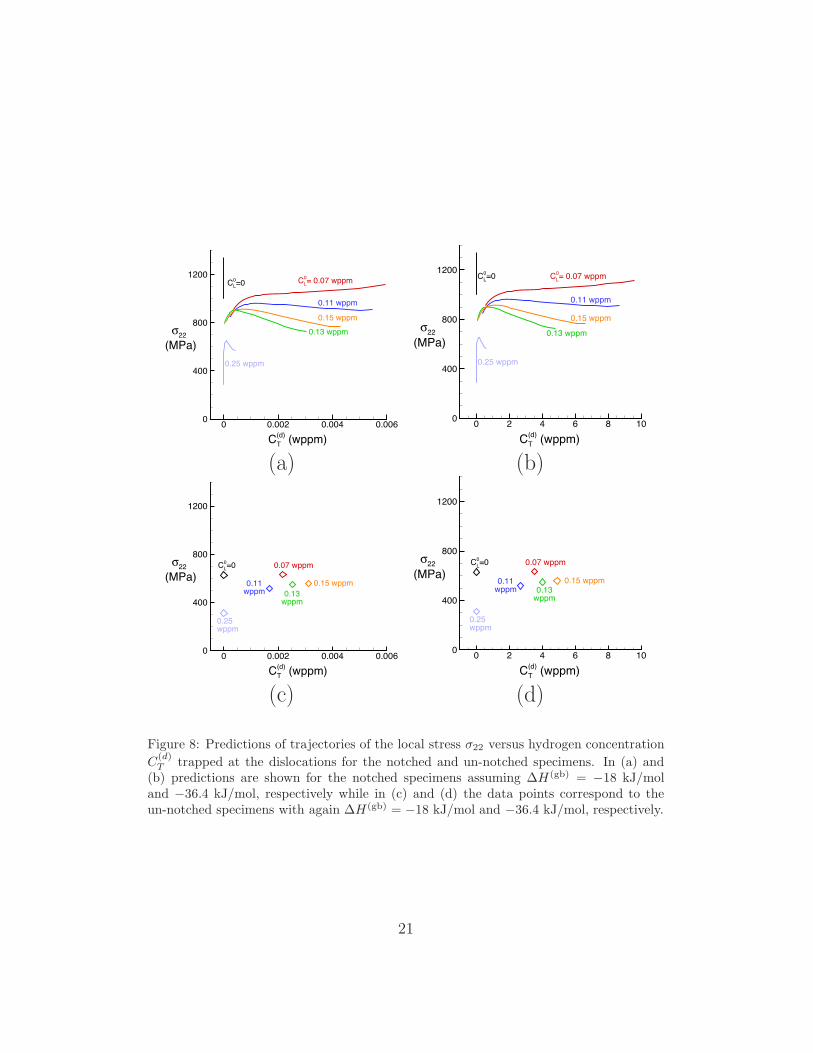
A similar construction has been attempted for the case of trapped hy-drogen: σ22 is plotted versus C
(d)T for each notched and un-notched sample
at failure in Fig. 8. The distribution C(d)T (x1) is calculated from Eq. (2-6),
by making use of the known distribution of εp(x1) and the lattice parametera = 0.287 nm. Note that the plastic strain εp is deduced from the FE anal-ysis for the notched samples while it is given immediately from Eq.(10) forthe un-notched specimens.
We have considered two extreme values of dislocation trap binding energyin order to bound the behaviour. In Fig. 8a and Fig. 8c the results are pre-sented for the choice ΔH(gb) = −18 kJ/mol for notched and un-notched spec-imens, respectively while in in Fig. 8b and Fig. 8d, ΔH (gb) = −36.4 kJ/mol isassumed for notched and un-notched specimens, respectively. Upon plottingσ22 at failure against C
(d)T for the prescribed values of C0
L, we obtain failuretrajectories for the notched specimens at different hydrogen concentrationsC0
L; see Fig. 8a and Fig. 8b. Now consider the un-notched specimens. The
data points in Fig. 8c and Fig. 8d represent the values of (σ22 = σmax, C(d)T )
at failure since εp and σ22 are uniform.First, observe that the choice of ΔH(gb) does not change the relative
location of trajectories in the notched tests, and data-points in un-notchedtests. An outer failure envelope of trajectories (for the notched specimens)
cannot be identified in σ22 versus C(d)T space in Figs. 8a and 8b. Likewise,
the relative positioning of the data-points in Figs. 8c and 8b does not allowfor the construction of a unique failure locus. We conclude that the data canonly be rationalised in terms of a failure locus in σ22 versus CL space.
6. Weakest link statistics
It remains to explore possible reasons for the weaker response of the un-notched specimens compared to the notched ones, recall Fig. 7. When C0
L
exceeds 0.1 wppm, hydrogen induces brittle inter-granular failure. For such
10
brittle solids, failure initiates from the largest inherent flaw, and probabilityof having large flaws increases with the size of stressed volume. Weakest linktheories of strength, such as Weibull theory, attempt to account for such sizeeffects. Moreover, introducing the concept of failure probability as opposedto a deterministic failure criterion also explains the scatter observed in thestrength measurements. Here, we proceed to make use of Weibull statisticsin an attempt to
(i) to rationalise the scatter in measured σnet data, and
(ii) bring into alignment the notched and un-notched strength strength dataof bimaterials as reported above.
6.1. Analysis of scatter in strength
In order to to rationalise the scatter in strength, we performed six ten-sile tests on identical un-notched specimens, all of which were continuouslycharged to C0
L = 0.25 wppm during the test, see Fig. 3. Although the numberof repeated tests is insufficient for a rigorous statistical analysis, we never-theless proceed to calculate the parameters of Weibull distribution from thisbatch of tests. We define the survival probability for each specimen as
Ps =n
N + 1(11)
where n is the rank a given specimen upon ordering the specimens in adescending order of σnet while N = 6 is the total number of un-notched spec-imens. Recall that the probability of survival Ps for a component of volumeV can be estimated from the distribution of maximum tensile principal stressσ22(xi)
2 for the uniaxial loading imposed, according to the Weibull relation
Ps(σij , V ) = exp
− 1
V0
∫V
(σ22
σ0
)m
dV
. (12)
Here, the Weibull modulus m gives the variability of strength whereas σ0 isa measure of average strength for a volume V equal to a reference volumeV0. We calibrate the Weibull model by taking V0 to be the volume of the
2For all the cases analysed here the maximum principal stress is approximately equalto σ22.
11
un-notched specimens for which case the Weibull relation Eq. (12) reducesto
Ps = exp
−(σmax
σ0
)m. (13)
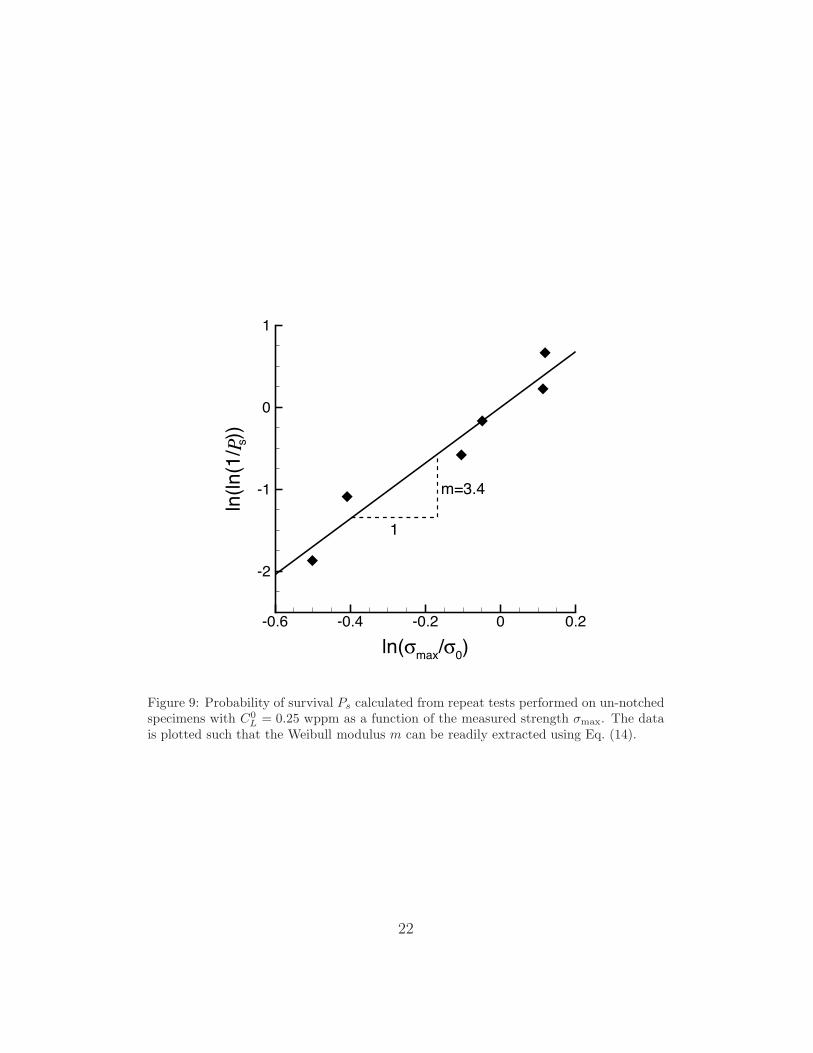
We emphasise that Eq. (13) gives the distribution in strength for a largepopulation of nominally identical tensile specimens, subjected to identicalcharging conditions. Now in order to find the values of m and σ0 we take thenatural logarithm of both sides twice in Eq. (13) and obtain
ln
[ln
(1
Ps
)]= m ln
(σmax
σ0
). (14)
The data from the six repeat tests is plotted in Fig. 9 and a best fit to thedata suggests that m = 3.4 and σ0 equals 346 MPa.
6.2. Prediction of the size effect
In the previous section we extracted the parameters associated with theWeibull distribution of strength by correlation with the scatter in repeattests. Here, we make use of Weibull theory to reconcile the notched andun-notched strengths at C0
L > 0.1 wppm. We proceed by modifying Weibulltheory to account for the fact that failure occurs from flaws on the interfacebetween LAS and 690 alloy; consequently, the probability of failure is a func-tion of stressed area rather than stressed volume. The survival probabilityof notched bimaterial specimen with a cross-sectional area A becomes
Ps(A) = exp
1
A0
∫A
−(σ22(xi)
σ0(xi)
)m
dA
, (15)
where A0 is taken to be the cross sectional area of the un-notched bars, andσ22(xi) is the tensile stress at any location xi on the interface. It is worthemphasising here that the representative strength σ0(xi) is dependent uponlocal hydrogen concentration and so can vary with position xi.
Equation (15) is valid for a perfectly flat weld interface but in reality theinterface is wavy, see Fig. 10, and so some further modification is neededto the theory. Much of the interface is located either above or below thenet-section of the notched specimen in a random manner, as illustrated inFig. 10a. It is only the fraction of the net-section on which the interface
12
resides that is prone to failure. In order to account for this reduction in areafraction that is prone to failure, we modify Eq. (15) to the form
Ps(A) = exp
1
A0
∫A
−(σ22(xi)
σ0(xi)
)m
fdA
, (16)
where f represents the fraction of the net section of the specimen that isintersected by the wavy interface. Our aim is to determine the value of fthat reconciles the notched and un-notched data.
To achieve this we need to know values of m and σ0 as a function of CL
to use in Eq. (16). This is done as follows using the un-notched. data. Weassume m = 3.4 as deduced from the scatter in the un-notched strength, seesection 6.1 and extract the dependence σ0(CL) as follows. The data fromthe un-notched (and notched) tests are too limited to perform a full Weibullanalysis, and so we arbitrarily choose a survival probability of Ps = 0.1 atfailure for all tests3. Now make use of Eq. (16) for the un-notched tests andtake f ≡ 1 since the interface is uniformly stressed. With A0 equal to thenet-section area, and σ22 = σmax, Eq. (16) reduces to
Ps = exp
−(σmax
σ0
)m. (17)
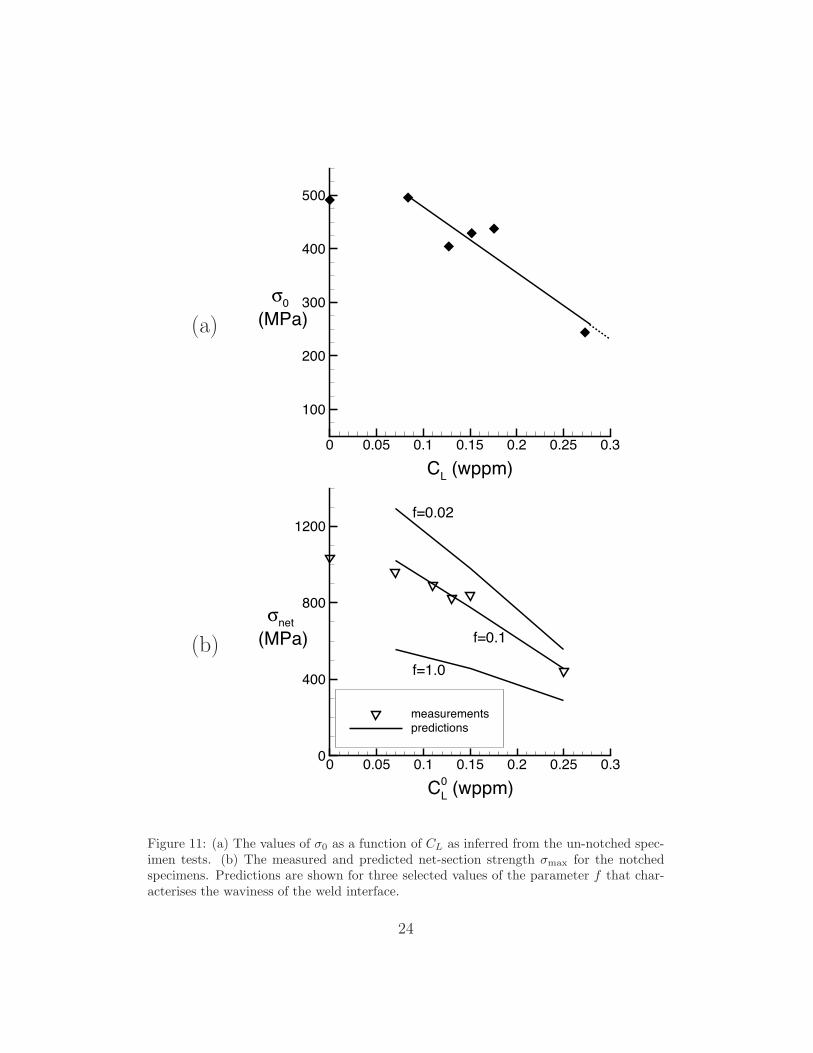
The data plotted in Fig. 3 gives σmax as a function of C0L, and Eq. (17) gives
directly σ0 as a function of C0L. But we seek σ0 as a function of the lattice
hydrogen concentration CL. To do so we invoke Eq.(9) with σh = σmax/3.The resulting calibration is given in Fig. 11a.
The final step is to use Eq. (16) to calculate σmax for the notched speci-mens as a function of C0
L for selected values of f as follows. Choose a value ofC0
L corresponding to a particular test on a notched specimen. Then, performa finite element analysis to obtain σ22(xi) and σh(xi) on the net-section, at aprescribed value of σmax. The corresponding distribution CL(xi) is obtainedfrom Eq.(9), by making use of σh(xi). The value of Ps is determined viaEq. (16), making use of σ0(CL) from Fig. 11a and the selected value of f .We iterate with the value of σmax until we obtain Ps = 0.1, to within anaccuracy of 1 %. The above procedure is repeated for other values of C0
L
(corresponding to the notched tests), and the predictions of σmax versus C0L
3A side check reveals that our subsequent conclusions are relatively insensitive to thischoice of Ps.
13
are plotted in Fig. 11b. The predictions are brought into agreement with themeasurements by assuming f = 0.1.
7. Conclusions
We have explored the degradation in failure strength due to the presenceof hydrogen for a weld interface between 690 alloy and A533B low alloyssteel. A negligible degree of embrittlement is observed when C0
L < 0.1 andthe bimaterial fails by micro-void coalescence. In contrast, upon chargingthe specimens to higher levels of hydrogen a significant drop in strengthis observed and the fracture surface exhibits predominantly inter-granularcracking. A failure locus has been determined for notched and un-notchedspecimens using the axes of lattice hydrogen concentration and maximumprinciple stress. The role of trapped hydrogen appears to be negligible indictating the fracture strength.
Significant scatter in the strength is observed for severely charged speci-mens and this has been rationalised by appealing to Weibull theory with aWeibull modulus of m = 3.4. Moreover, this same value of Weibull modulusreconciles the relative strength of notched and un-notched specimens by tak-ing into account a stressed volume effect and the wavy nature of the weldinginterface. This value of m is much smaller than the value of m = 30 found ina previous study for a monolithic high strength steel (Ayas et al., 2013). Animmediate implication is the anticipation of a sharp drop of strength for largestructural bimaterial components that are exposed to a hydrogen concentra-tion above a threshold value. Since hydrogen absorption during the weldingoperation is a common phenomenon, a subsequent post weld heat treatmentis a viable precaution to remove the hydrogen, as done in industrial practice.
Acknowledgements
The authors wish to acknowledge Hiroshi Kanasaki, Naoki Ogawa andYasuhiro Iwamura for their valuable comments and the Mitsubishi HeavyMetal Industries for the financial support.
References
Ayas, C., Deshpande, V. S., Fleck, N. A., 2013. A fracture criterion forthe notch strength of high strength steels in the presence of hydrogen, toappear in Journal of the Mechanics and Physics of Solids .
14
Blach, J., Falat, L., Sevc, P., 2011. The influence of hydrogen charging onthe notch tensile properties and fracture behaviour of dissimilar weld jointsof advanced crmov and crnimo creep-resistant steels. Engineering FailureAnalysis 18 (1), 485 – 491.
Lee, C.-H., Chang, K.-H., 2012. Temperature fields and residual stress distri-butions in dissimilar steel butt welds between carbon and stainless steels.Applied Thermal Engineering 4546 (0), 33 – 41.
Novak, P., Yuan, R., Somerday, B. P., Sofronis, P., Ritchie, R. O., 2010. Astatistical, physical-based, micro-mechanical model of hydrogen-inducedintergranular fracture in steel. Journal of the Mechanics and Physics ofSolids 58 (2), 206 – 226.
Oriani, R. A., 1970. The diffusion and trapping of hydrogen in steel. ActaMetallurgica 18 (1), 147 – 157.
Rao, N. V., Reddy, G. M., Nagarjuna, S., 2011. Weld overlay cladding ofhigh strength low alloy steel with austenitic stainless steel structure andproperties. Materials and Design 32 (4), 2496 – 2506.
Satyanarayana, V. V., Reddy, G. M., Mohandas, T., 2005. Dissimilar metalfriction welding of austeniticferritic stainless steels. Journal of MaterialsProcessing Technology 160 (2), 128 – 137.
Sireesha, M., Shankar, V., Albert, S. K., Sundaresan, S., 2000. Microstruc-tural features of dissimilar welds between 316ln austenitic stainless steeland alloy 800. Materials Science and Engineering: A 292 (1), 74 – 82.
Sofronis, P., McMeeking, R. M., 1989. Numerical analysis of hydrogen trans-port near a blunting crack tip. Journal of the Mechanics and Physics ofSolids 37 (3), 317 – 350.
Wang, M., Akiyama, E., Tsuzaki, K., 2005. Effect of hydrogen and stressconcentration on the notch tensile strength of aisi 4135 steel. MaterialsScience and Engineering A 398 (1-2), 37 – 46.
15

Table 1: Charging conditions employed in this study in terms of the charging environ-ment and the applied current density J . The environmental hydrogen concentration C0
L
corresponding to each of these charging conditions is also indicated in the table.
Charging environment J (mA/cm2) C0L (wppm)
air - 01/3M H3BO3 +1/30M KCl 0 0.071/3M H3BO3+1/30M KCl 2 0.111/3M H3BO3+1/30M KCl 4 0.131/3M H3BO3+1/30M KCl 10 0.15
1/3M H3BO3+1/30M KCl+1/100M Thiourea 10 0.25
Table 2: Material constants of Eq. (10) for the LAS and 690 alloy.
Material E (GPa) σy (MPa) h (MPa) ν
LAS 210 532 2517 0.3690 alloy 209 397 2533 0.3
16
690
LAS30
mm
7 mm
4 mm
C.L.
690
LAS
30 m
m
4 mm
C.L.
(a) (b)
Figure 1: Sketch of the gauge sections of the (a) notched and (b) un-notched specimensused in this study. The boundary conditions applied in the FE analysis of these specimensare also indicated.
Figure 2: The loading history in terms of the tensile stress σnet versus time that he tensilespecimens are subjected to in the charging environment.
17
CL0 (wppm)
0 0.05 0.1 0.15 0.2 0.25 0.30
200
400
600
800
1000
1200
notched
un-notchedσnet
(MPa)
Figure 3: Measured net-section strength σmax of notched and un-notched specimens as afunction of the hydrogen concentration C0
L in the charging environment.
(a) (b)
Figure 4: Scanning electron micrographs of the fracture surfaces of notched specimenscharged to (a) C0
L = 0.07 wppm and (b) C0L = 0.25 wppm.
18
Boundarycracking
3.6 %
Boundarycracking18.7 %
Boundarycracking
63 %
(a) (b) (c)
Figure 5: Sketches of the fracture surfaces of the notched specimens charged to (a) C0L =
0.07 wppm, (b) C0L = 0.15 wppm and (c) C0
L = 0.25 wppm. The sketches show regionswhere brittle inter-granular boundary cracking was observed.
CL0 (wppm)
% b
ound
ary
crac
king
0 0.05 0.1 0.15 0.2 0.25 0.3-20
0
20
40
60
80
100
notched
un-notched
Figure 6: Percentage of the fracture surface that exhibits features of inter-granular bound-ary cracking as a function of C0
L. Data for both notched and un-notched specimens isshown.
19
CL(σh) (wppm)0 0.1 0.2 0.3 0.4
0
400
800
1200
failure locus (notched)
failure locus (un-notched)
0.25 wppm
σ22
(MPa)
CL0=0
0.07wppm
0.11 wppm0.13
wppm
0.15wppm
CL0=0
0.07wppm
0.11wppm
0.13wppm
0.15wppm
0.25 wppm
Figure 7: Predictions of the trajectories of the local tensile stress σ22 as a function ofthe diffusible/lattice hydrogen concentration CL for tests on both the notched and un-notched specimens. Since the stress state within the un-notched specimens is uniform thetrajectories collapse to a single point for each test. The failure locus deduced from thedata is indicated in each case.
20
CT(d) (wppm)
0 0.002 0.004 0.0060
400
800
1200CL
0= 0.07 wppm
0.15 wppm
0.11 wppm
0.13 wppm
0.25 wppm
σ22
(MPa)
CL0=0
CT(d) (wppm)
0 2 4 6 8 100
400
800
1200CL
0= 0.07 wppm
0.15 wppm
0.11 wppm
0.13 wppm
0.25 wppm
σ22
(MPa)
CL0=0
(a) (b)
CT(d) (wppm)
0 0.002 0.004 0.0060
400
800
1200
CL0=0
0.15 wppm0.11wppm 0.13
wppm
0.25 wppm
σ22
(MPa)0.07 wppm
CT(d) (wppm)
0 2 4 6 8 100
400
800
1200
CL0=0
0.15 wppm0.11wppm 0.13
wppm
0.25 wppm
σ22
(MPa)0.07 wppm
(c) (d)
Figure 8: Predictions of trajectories of the local stress σ22 versus hydrogen concentration
C(d)T trapped at the dislocations for the notched and un-notched specimens. In (a) and
(b) predictions are shown for the notched specimens assuming ΔH(gb) = −18 kJ/moland −36.4 kJ/mol, respectively while in (c) and (d) the data points correspond to theun-notched specimens with again ΔH(gb) = −18 kJ/mol and −36.4 kJ/mol, respectively.
21
ln(σmax/σ0)
ln(ln
(1/ s)
)
-0.6 -0.4 -0.2 0 0.2
-2
-1
0
1
1
P
m=3.4
Figure 9: Probability of survival Ps calculated from repeat tests performed on un-notchedspecimens with C0
L = 0.25 wppm as a function of the measured strength σmax. The datais plotted such that the Weibull modulus m can be readily extracted using Eq. (14).
22
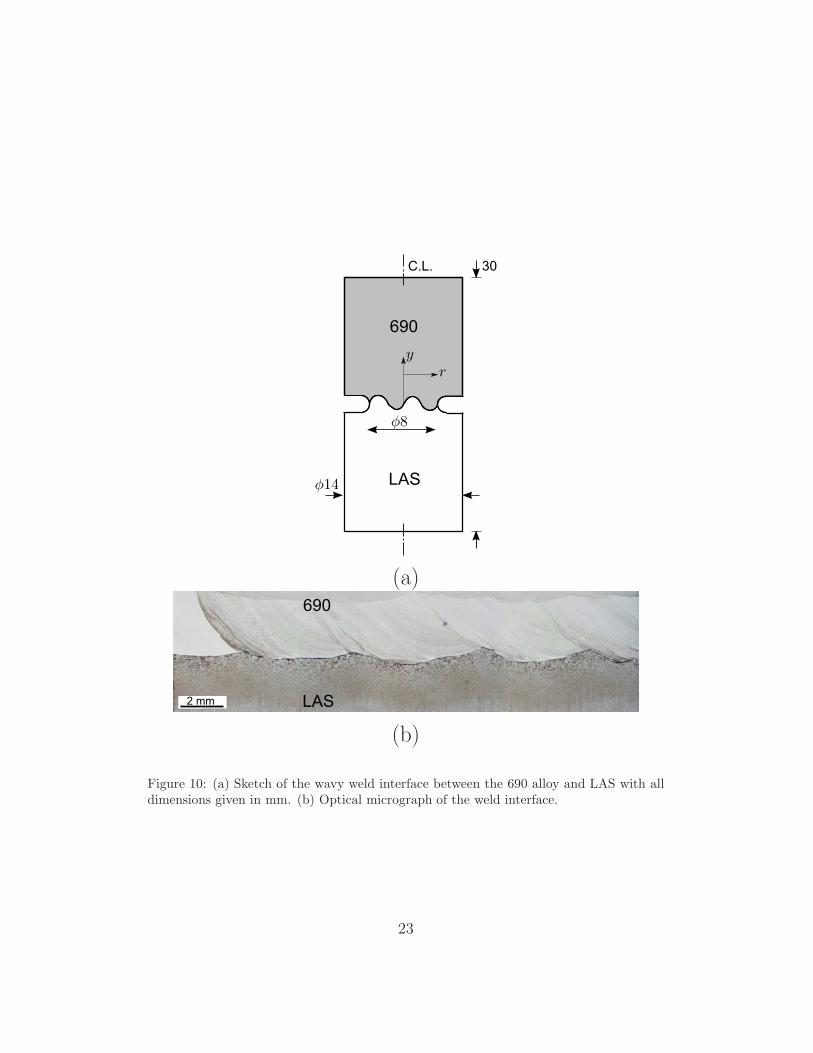
LAS
690
30C.L.
(a)690
LAS2 mm
(b)
Figure 10: (a) Sketch of the wavy weld interface between the 690 alloy and LAS with alldimensions given in mm. (b) Optical micrograph of the weld interface.
23
(a)
CL (wppm)0 0.05 0.1 0.15 0.2 0.25 0.3
100
200
300
400
500
σ0
(MPa)
(b)
CL0 (wppm)
0 0.05 0.1 0.15 0.2 0.25 0.30
400
800
1200
measurementspredictions
f=0.02
σnet
(MPa) f=0.1
f=1.0
Figure 11: (a) The values of σ0 as a function of CL as inferred from the un-notched spec-imen tests. (b) The measured and predicted net-section strength σmax for the notchedspecimens. Predictions are shown for three selected values of the parameter f that char-acterises the waviness of the weld interface.
24