HYDRODYNAMIC STUDY OF TAPERED FLUIDIZED...
88
HYDRODYNAMIC STUDY OF TAPERED FLUIDIZED BED A THESIS SUBMITTED IN PARTIAL FULFILLMENT OF THE REQUIREMENTS FOR THE DEGREE OF Master of Technology in Chemical Engineering By K.GOBORDHAN PATRO Department of Chemical Engineering National Institute of Technology Rourkela 2007
Transcript of HYDRODYNAMIC STUDY OF TAPERED FLUIDIZED...

HYDRODYNAMIC STUDY OF TAPERED FLUIDIZED BED A THESIS SUBMITTED IN PARTIAL FULFILLMENT OF THE REQUIREMENTS FOR THE DEGREE OF
Master of Technology in Chemical Engineering
By
K.GOBORDHAN PATRO
Department of Chemical Engineering National Institute of Technology
Rourkela 2007

HYDRODYNAMIC STUDY OF TAPERED FLUIDIZED BED A THESIS SUBMITTED IN PARTIAL FULFILLMENT OF THE REQUIREMENTS FOR THE DEGREE OF
Master of Technology in Chemical Engineering
By
K.GOBORDHAN PATRO
Under the guidance of
Prof. (Dr.) K.C.BISWAL
Department of Chemical Engineering National Institute of Technology
Rourkela 2007

NATIONAL INSTITUTE OF TECHNOLOGY ROURKELA
CERTIFICATE
This is to certify that the thesis entitled, “HYDRODYNAMIC STUDY OF TAPERED BED”
submitted by Sri K.GOBORDHAN PATRO in partial fulfillment of the award of Master of
Technology Degree in CHEMICAL Engineering with specialization in “Coal Chemical &
Fertilizers” at the National Institute of Technology, Rourkela (Deemed University) is an authentic
work carried out by him under my supervision and guidance. To the best of my knowledge, the
matter embodied in the thesis has not been submitted to any other University/Institute for the
award of any Degree or Diploma.
Date Prof. (Dr.) K.C.BISWAL
Dept.of Chemical Engg.
National Institute of Technology
Rourkela-769008
i

ACKNOWLEDGEMENT
I express my sincere gratitude to my guide, Dr. K.C. Biswal, Prof. of the Department of
Chemical Engg. , National Institute of Technology, Rourkela for giving me this great opportunity
to work under his kind support, guidance and constructive criticism in the completion of my
project .
I offer my deepest appreciation for people who assisted me in the experiments, And I would like
to thank to all those who are directly or indirectly supported me in carrying out this thesis work
successfully.
K.Gobordhan Patro
ii

CONTENTS
Page No.
ABSTRACT v
LIST OF FIGURES vii
LIST OF TABLES ix
1)INTRODUCTION 1
1.1 introduction to conical bed 2
1.2 variables affecting the quality of fluidization 4
1.3 structure of conical bed 5
1.4 the phenomenon of fluidization 6
1.5 experimental phenomena 7
2) LITERATURE REVIEW 9
2.1 literature review 10
3) EXPERIMENTAL DETAILS 16
3.1 experimental set up 17
3.2 constituents of experimental setup 18
3.3 apparatus 20
3.4 procedure 21
4)THEORETICAL SECTION 22
4.1 Equation for total pressure drop in a fixed bed 23
4.2 Condition for point A 25
4.3 Condition for point B 26
5)EXPERIMENTAL OBSERVATIONS 27
5.1 effect of cone angle 28
5.2 effect of stagnant height 29
5.3 local characteristics 30
iii

6)PREVIOUSLY DEVELOPED CORRELATIONS 31
6.1 for conventional beds 32
6.2 for tapered beds 34
7)DEVELOPMENT OF MODELS 37
7.1 development of models 38
8) INTRODUCTION TO COMPUTAIONAL FLUIDDYNAMICS (CFD) 39
8.1 Introduction to CFD 40
8.2 What is CFD (Computational Fluid Dynamics) 41
8.3 Advantages of CFD 42
8.4 Uses of CFD 42
8.5 Working Principle 42
8.6 CFD Goals 43
8.7 Current Industrial Applications 43
9) MODELING & SIMULATION OF CONICAL BED 44
9.1 Working Procedure 45
10) RESULTS AND DISCUSSION 49
11) CONCLUSION 51
12) NOMENCLATURE 53
13) GRAPHS 55
14) TABLES 69
15) REFERENCES 74
iv

ABSTRACT
Hydrodynamic characteristics of fluidization in conical or tapered beds differ from
those in columnar beds due to the variation of superficial velocity in the axial direction of the
beds. In the former, fixed and fluidized regions could coexist and the sharp peaking of the
pressure drop could occur, thereby giving rise to a remarkable pressure drop-flow rate hysteresis
loop at incipient fluidization. To explore these unique properties, a series of experiments was
carried out in gas-solid tapered fluidized beds with various tapering angles. Detailed visual
observations of fluid and Particle behavior and measurements of the pressure drops have led to
the identification of five flow regimes. The tapering angle of the beds has been found to
dramatically affect the beds' behavior. Other hydrodynamic characteristics determined
experimentally included the maximum pressure drop, minimum velocity of partial fluidization
and minimum velocity of full fluidization. Models have been proposed to quantify the
hydrodynamic characteristics of gas-solid tapered fluidized beds. The results predicted by the
models compare favorably with experimental data. Naturally, the models are applicable to gas-
solid columnar fluidized beds corresponding to the tapered beds with a tapering angle of zero.
Fluidization operations in cylindrical columns are extensively used in process industries. But, in
a number of these operations, the particles are generally not of uniform size or there may be
reduction in size due to chemical reactions like combustion or gasification, or attrition. In
cylindrical beds, the particle size reduction results in entrainment, limitation of operating
velocity in addition to the other demerits like slugging, non-uniform fluidization generally
associated with such beds. These disadvantages are overcome by use of tapered beds to conduct
fluidization operation. This is due to conduct fluidization operation. This is due to the gradual
reductions of superficial velocity of the fluid because of increase in cross sectional area with
height. However, in general the particles are not of uniform size in the feed itself and also there
may be particle size reduction during operation in fluidized beds. Hence,the study of
hydrodynamic characteristics of such beds is essential in the operation of such beds.
v

Based on dimensional analysis, correlations have been developed with the system parameters
viz., geometry of tapered bed, particle diameter, static bed height, density of solid and gas and
superficial velocity of the fluidizing medium.
Correlations have been developed for some characteristics specially,
critical fluidization velocities and maximum bed pressure drops of gas – solid
tapered fluidized bed of binary mixture of regular particles. Experimental values of
critical fluidization velocities and maximum bed pressure drops have been
compared with the developed correlations.
vi

LIST OF FIGURES Page No.
1)Structure of conical bed 5
2)Effect of superficial gas velocity on total pressure drop 8
3)schematic diagram of experimental setup 17
4)effect of cone angles of fluidization in conical bed 28
5)Effect of stagnant bed height of the conical bed on fluidization 29
6)pressure drop at different position along the bed height 29
7)Contours of Solid(iron) Fraction for Bed height =5.6 cm (Particle Size = 0.00158 m) at
different flowrates after 1 second 48
8)Effect of superficial gas velocity on pressure drop of GB1+GB2 mixture (stagnant bed height
=0.14m, tapered angler =9.520) 55
9)Comparison of critical fluidization velocity (predicted) with experimental results 56
10)Comparison of maximum pressure drop (predicted) with experimental results (tapered angle
= 4.610) 57
11)Comparison of maximum pressure drop (predicted) with experimental results (tapered angle
= 7.470) 58
12)Comparison of maximum pressure drop (predicted) with experimental results (tapered angle
= 9.520) 59
13) Effect of superficial gas velocity on pressure drop of C1+C2 mixture (stagnant
height =0.185m, tapered angle = 9.520) 60
14) Comparison of critical fluidization velocity (calculated) with experimental results (Particle
mixture = 50%+50%; All tapered angle) 61
vii

15) Comparison of maximum pressure drop (predicted) with experimental results (tapered angle
= 4.610 ; Particle mixture = 50% +50 62
16) Comparison of maximum pressure drop (predicted) with experimental results
(tapered angle = 7.470 ; Particle mixture = 50% +50%) 63
17) Comparison of maximum pressure drop (predicted) with experimental results
(tapered angle = 9.520 ; Particle mixture = 50% +50 64
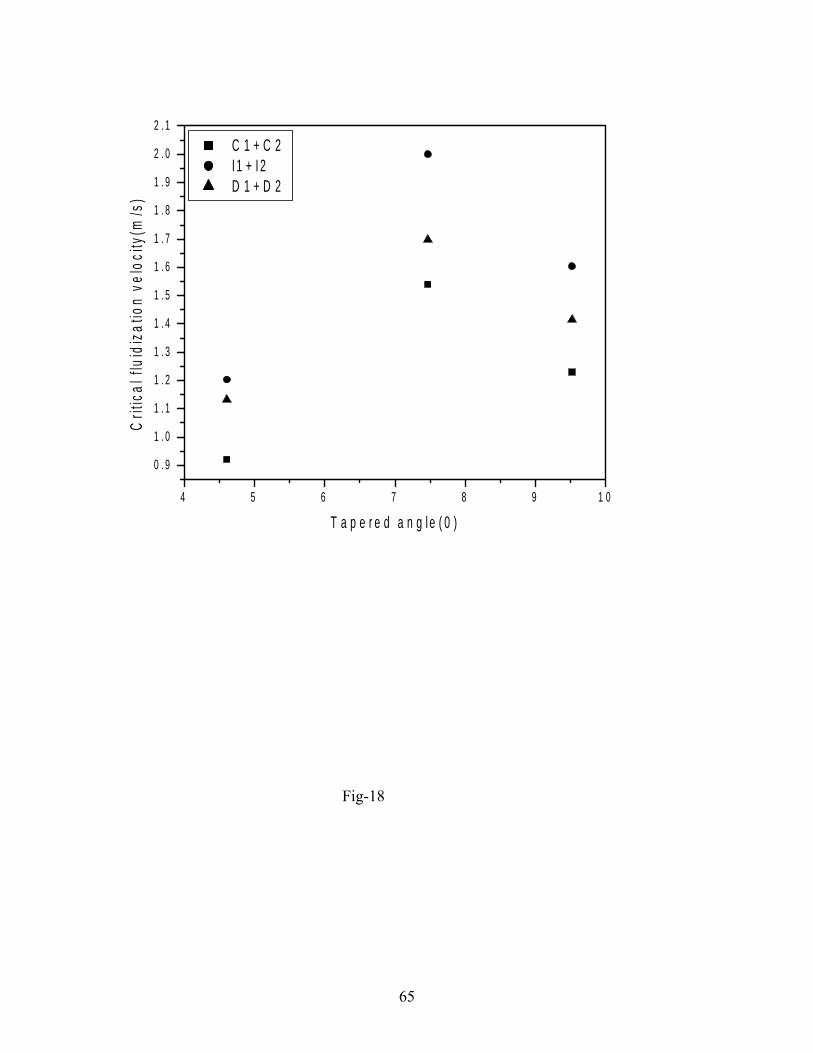
18) Effect of tapered angle on minimum fluidization velocity (Particle mixture = 50% +50%)65
19) Effect of mean density of the binary mixture on critical fluidization velocity
(particle = C1+C2; I1+I2; D1+D2; composition =50%+50%) 66
20) Effect of initial static bed height on maximum pressure drop (Particle = I1+I2; Tapered angle
= 4.610) 67
21) Effect of composition of smaller particles (particle =I1+I2) 68
viii

LIST OF TABLES
PageNo.
Table-1.A) Dimensions of the tapered column 69
Table-1.B) Properties of the particles 69
Table-2) Comparison of critical fluidization velocity with experimental results in
absolute error (%),of regular particle. 70
Table-3) Comparison of maximum pressure drop with experimental results in
absolute error (%),of regular particles. 71
Table-4) Comparison of critical fluidization velocity with experimental results in
absolute error (%),of irregular particles. 72
Table-5) Comparison of maximum pressure drop with experimental results in
absolute error (%),of irregular particles. 73
ix

CHAPTER 1
INTRODUCTION
1

INTRODUCTION TO TAPERED BED
Fluidization is the operation by which fine solids are transformed into a fluid like state through contact
with a gas or solid. This method of contacting has a number of unusual characteristics, and fluidization
engineering is concerned with efforts to take advantage of this behavior & put it to good use.
The ease with which particles fluidize and the range of operating conditions which sustain fluidization
vary greatly among gas-solid systems. Whether the solids are free flowing or not, whether they are liable
to agglomerate, static charges, vessel geometry, gas inlet arrangement, and other factors affect the
fluidization characteristics of a system.
Conical fluidized bed is very much useful for the fluidization of wide distribution of particles, since the
cross sectional area is enlarged along the bed height from the bottom to the top, therefore the velocity of
the fluidizing medium is relatively high at the bottom, ensuring fluidization of the large particles and
relatively low at the top, preventing entrainment of the small particles.
Since the velocity of fluidizing medium at the bottom is fairly high, this gives rise to low particle
concentration, thus resulting in low reaction rate and reduced rate of heat release. Therefore the
generation of high temperature zone near the distributor can be prevented.
Due to the existence of a gas velocity gradient along the height of a conical bed, it has some favorable
special hydrodynamic characteristics. The conical bed has been widely applied in many industrial
processes such as
[1] Biological treatment of waste-water,
[2] Immobilized biofilm reaction,
[3] Incineration of waste-materials,
[4] Coating of nuclear fuel particles,
[5] Crystallization, roasting of sulfide ores,
[6] Coal gasification and liquefaction,
[7] Catalytic polymerization,
[8] Fluidized contactor for sawdust and mixtures of wood residues and
[9] Fluidization of cohesive powder.
2

The study of the hydrodynamic characteristics of fluidization of conical beds is focused on two fields:
(1) liquid–solid systems and
(2) gas–solid systems.
For liquid–solid systems, the hydrodynamic characteristics of fluidization of conical beds, i.e. the fixed
bed, partially fluidized bed and fully fluidized bed regimes, have been described by Kwauk [6] according
to his theory of bubble less fluidization. Peng and Fan [1] systematically discussed the conditions for the
transition of the flow regimes: when the buoyancy force exerted on the entire particle bed by fluid
flowing upward is less than the effective gravitational force of the particle bed, the particles in the bed
remain static, and this is the fixed bed regime.
When the particle weight in the top layer of the conical bed is equal to or less than the drag force by fluid
flowing upward, the fully fluidized bed regime occurs. Between these two cases, the flow regime is called
a partially fluidized bed regime. However, it is not easy to predict the characteristics of fluidization for
the partially fluidized bed regime theoretically [1]. All these studies are based on the idealized fluidization
defined by Kwauk [6], i.e. according to the following assumptions:
The radial distribution of the fluid at any cross-section of the conical bed is uniform;
There is no back mixing for the fluid phase;
The frictional force between wall and particles is neglected.
For gas–solid systems in conical spouted beds, Olazar et al. [2] observed five flow regimes: fixed bed,
partially fluidized bed, spouted bed, transition regime from spouted bed to jet spouted bed and jet spouted
bed. The hydrodynamic characteristics for these five regimes are presented by empirical correlations [3].
The difficulty in predicting the hydrodynamics of fluidization from the theory of Peng and Fan possibly
lies in the fact that the inlet diameter for the conical spouted bed is less than that of the bed bottom. The
same approach by Peng and Fan [1] has been adopted by Gelperin et al. [4] and Nishi [5] for the incipient
fluidization of gas–solid conical beds. However, they did not involve the other characteristics of
fluidization in gas–solid conical beds.
3

The characteristics of fluidization in three flow regimes, namely fixed bed, partially fluidized bed and
fully fluidized bed, are investigated using a conical bed with three different cone angles and a Geldart-D
powder. The purpose is to:
Determination of the flow regimes for gas–solid conical fluidized beds;
Discussion of the idealized conditions of Peng and Fan [1];
Discussion of the application of the correlations and
Discussion of the local characteristics of fluidization.
VARIABLES AFFECTING THE QUALITY OF FLUIDIZATION
Some of the variables affecting the quality of fluidization are:
Fluid inlet: It must be designed in such a way that the fluid entering the bed is well
distributed.
Fluid flow rate: It should be high enough to keep the solids in suspension but it
should not be so high that the fluid channeling occurs.
Bed height: With other variables remaining constant, the greater the bed height, the
more difficult it is to obtain good fluidization.
Particle size: It is easier to maintain fluidization quality with particles having a
wide range than with particles of uniform size.
Gas, Liquid and solid densities: The closer the relative densities of the gas, liquid
and the solid, the easier are to maintain smooth fluidization.
Bed internals: In commercial fluidizers internals are provided to perform the
following functions.
• To prevent the growth of bubble sizes
• To prevent lateral movement of fluid and solids.
• To prevent slug formation
• To prevent elutriation of fine particles
4

STRUCTURE OF TAPERED BED
Fig-1.1
5

THE PHENOMENON OF FLUIDIZATION:
On passing fluid (gas or solid) upward through a bed of fine particles, at a low flow rate fluid
merely percolates through the void spaces between stationary particles. This is a fixed bed. With
an increase in flow rate, particles move apart and a few are seen to vibrate and move about in
restricted regions. This is the expanded bed.
At a still higher velocity, the pressure drop through the bed increases. At a certain velocity the
pressure drop through the bed reaches the maximum and a point is reached when the particles are
all just suspended in the upward flowing gas or liquid. At this moment, the particles at the
bottom of the bed begin to fluidize, thereafter the condition of fluidization will extend from the
bottom to the top and the pressure drop will decline fairly sharply.
Evidently, fluidization is initiated when the force exerted between a particle and fluidizing
medium counterbalances the effective weight of the particle, the vertical component of the
compressive force between the adjacent particles disappears, and the pressure drop through any
section of the bed about equals the weight of fluid and particles in that section. The bed is
considered to be just fluidized and referred to as an incipiently fluidized bed or a bed at
minimum fluidization. Under the assumption that friction is negligible between the particles and
the bed walls, also it is assumed that the lateral velocity of fluid is relatively small and can be
neglected and the vertical velocity of the fluid is uniformly distributed on the cross sectional
area.
Gas –solid systems generally behave in quite different manner. With an increase in flow rate
beyond minimum fluidization, large instabilities with bubbling and channeling of gas are
observed. At higher flow rates agitation becomes more violent and the movement of solids
becomes vigorous. In addition, the bed does not expand much beyond its volume at minimum
fluidization. Such a bed is called an aggregative fluidized bed, a heterogeneous fluidized bed, a
bubbling fluidized bed, or simply a gas fluidized bed.
6

EXPERIMENTAL PHENOMENA
Flow regimes
A typical diagram of the hydrodynamic characteristics of the conical bed is shown in Fig.1.2
with the increase of superficial gas velocity, Ug0, the total pressure drop, ∆Pt, varies along the
line of O→A→B→C.
In the different stages, the hydrodynamic characteristics of fluidization of the conical bed are as
follows:
1. O→A stage: because Ug0 is relatively low, the stagnant height of the particle bed remains
unchanged as at the beginning. The total pressure drop, ∆Pt, increases up to the maximum point,
∆Pmax, i.e. point A as shown in Fig.2. This phenomenon is the same as that observed for liquid–
solid tapered beds by Peng and Fan [1], and the flow regime is also termed the fixed bed regime.
The superficial gas velocity, to which point A in Fig1.2 corresponds, is called the minimum
fluidized velocity, Umf.
A→.B stage: When Ug0 is higher than Umf as shown In Fig.2 ∆Pt decreases with the increase
of Ug0, and it is observed that the stagnant height of the conical bed does not change. The same
phenomenon is also observed for gas–solid systems by Olazar et al. [2] and for liquid–solid
systems by Peng and Fan [1]. Here, the flow regime is named a partially fluidized bed. When
Ug0 reaches Ums in Fig.1.2, the characteristics of total pressure drop are different from those
in the above two stages.
B→C stage: if Ug0 is greater than Ums, ∆Pt stays nearly constant as shown in below Fig. In
this stage, it is observed that slugging fluidization, bubble fluidization and spouting fluidization
occur for the conical bed with cone angles of 4.61, 7.47 and 9.52°, respectively. In this stage, the
characteristics of fluidization of the gas–solid conical bed are different from that of liquid–solid
ones as reported by Peng and Fan [1]. Depending on the cone angle, the flow regime is called a
slugging or spouting fluidization regime.
7

Reversing the fluidization process, the fluidized bed is defluidized by decreasing the superficial
gas velocity. The same regimes are observed in below Fig1.2.
Fig.1.2 Effect of superficial gas velocity on total pressure drop
8

CHAPTER 2
LITERATURE REVIEW
9

LITERATURE REVIEW
Most of the gas–solid fluidization behavior studies that have been reported are for
straight cylindrical or columnar fluidized beds, although a considerable proportion of the
fluidized beds have inclined walls or have a tapered bottom section. A velocity gradient exists in
the axial direction, leading to unique hydrodynamic characteristics. Due to this characteristic,
tapered fluidized beds have found wide applicability in many industrial processes such as, waste
water treatment, immobilized biofilm reaction, incineration of waste materials, coating nuclear
fuel particles, crystallization, coal gasification and liquefaction and roasting sulfide ores, food
processing,etc.Tapered fluidized beds are useful for fluidization of materials with a wide particle
size distribution, as well as for exothermic reactions. They can be operated smoothly without any
instability,i.e. with less pressure fluctuations and also for extensive particle mixing. In spite of its
advantages and usefulness, not much work has been reported in literature for understanding
certain important characteristics, especially minimum fluidization velocity and maximum
pressure drop. Studies have been reported by researchers to determine the factors affecting
minimum fluidization velocity and maximum pressure drop. But some of these results are limited
to regular particles only. Some of the previous investigations include fixed bed pressure drop
calculations, flow regimes, incipient condition of fluidization, voidage distribution and bed
expansion calculations and development of a model for maximum pressure drop at incipient
fluidization condition of a tapered fluidized bed. The model developed by Shi et al.[7] is based
on Ergun’s equation and neglects friction between the particles and the wall.Biswal et al.[8,9]
developed theoretical models, for minimum fluidization velocity and pressure drop in a packed
bed of spherical particles for gas–solid systems in conical vessels. Due to the angled walls,
random and unrestricted particle movement occurs in a tapered bed with reduced
backmixing.Olazer et al.[3] compared their experimental results with that calculated using the
models developed by Gelperin etal.[4] and Gorshtein and Mukhlenov[10] for maximum pressure
drop and found that the predictions were not very accurate. They therefore proposed a modified
equation for calculation of maximum pressure drop. Later, Peng and Fan[1] made an in-depth
study of the hydrodynamic characteristics of solid–liquid fluidization in a tapered bed and
derived theoretical models for the prediction of minimum fluidization velocity and maximum
pressure drop, based on the dynamic balance of forces exerted on the particle. The experiments
were however carried out for spherical particles only. Jing et al[11]. and Shan et al.[12]
10

developed models for gas–solid conical fluidized beds for spherical coarse and fine particles
based on the Peng and Fan models but neglected the pressure drop due to the kinetic change in
the bed. Depypere et al. [13] have carried out studies in a tapered fluidized bed reactor and
proposed empirical models for determination of expanded bed height by using static pressure and
wall surface temperature measurements.
Levey et al [1960] have successfully used tapered beds in chemical reactions Peng and Fan
[1997] have mentioned that the beds could be used for biochemical reactions and roasting of
sulfide ores. Kumar et al [1981] and Yogesh Chandra and Jagannath Rao[1981] have
investigated the hydro dynamics of gas -solid fluidization in tapered vessels using single size
particles.
Tapered fluidized beds have many attractive features, among which are their capabilities for
handling particles with different sizes and properties ( Scott and Hancher, 1976; Ishii et al.,
1977) and for achieving extensive particle mixing ( Babu et al., 1973), These beds have been
widely applied in various processes including biological treatment of wastewater, immobilized
biofilm reaction, incineration of waste materials, coating nuclear fuel particles, crystallization,
coal gasification and liquefaction, and roasting sulfide ores. Interestingly, industrial fluidized
beds are, more often than not, fabricated with tapered sections at the bottom.
Nevertheless, fundamental understanding of the behavior of tapered fluidized beds appears to lag
far behind their applications. Some of the previous investigations include studies on pressure
drop of fixed and fluidized beds in tapered vessels (Koloini and Farkas, 1973; Biswal et al.,
1984), flow regimes, incipient condition of fluidization,voidage distribution and bed expansion
(Hsu, 1978), and particle mixing (Ridgway, 1965; Maruyama and Sato, (199l).
A fluidized bed is formed when the particles in the bed are in dynamic equilibrium; the fluid
drag force and the buoyancy force are exerted in the upward direction against the gravitational
force, which pulls the particles downward ( Wilhelm and Kwauk, 1948; Davidson and Harrison,
1971). This drag force is constant at any position of a columnar bed of uniform particles;
11

however, it decreases in the upward direction in a tapered bed accompanied by the reduction in
the superficial velocity of the fluid.
Thus, the particles at the lower part of the bed will first be fluidized upon an increase in the flow
rate: in contrast, those at the upper part of the bed remain static. This phenomenon of partial
fluidization is peculiar to the tapered fluidized bed. Relatively little has appeared in the open
literature on hydrodynamic characteristics of tapered fluidized beds; the majority of what has
been published deals with flow regimes and incipient condition of fluidization. Toyohara and
Kawamura (1989) have reported the flow regime of partial fluidization in a gas solid tapered bed.
Descriptions have been given in Kwauk's monograph (1993) on the change of the flow regime in
a gas-solid tapered bed.
The incipient condition of fluidization in a tapered bed can be predicted based on the dynamic
balance of forces exerted on the particle bed. This approach was adopted by Gelperin et al.
(1960) and Nishi (1979) for gas-solid tapered beds, and Shi et al. (1984) for liquid-solid tapered
beds. Nevertheless, none of these works took into account the phenomenon of partial fluidization
in predicting the incipient condition of fluidization and the concomitant, maximum pressure
drop.
Fluidization in tapered beds have found wide applicability in many industrial processes such as,
waste water treatment (Scott and Hancher, 1976), coating of nuclear fuel particles,
crystallization, coal gasification and liquification and roasting of sulfide ores (Peng and Fan,
1997), coating of food powder particles (Depypere et al., 2005), etc. Tapered fluidized beds are
useful for fluidization of materials with wide particle size distribution and also for exothermic
reactions. It can be operated smoothly without any instability i.e. with less pressure fluctuations
(Ridgway, 1965) and also for extensive particle mixing (Babu et al. 1973, Maruyama and Sato,
1991). Various techniques including introduction of baffles, operation in multistage unit and
imparting vibrations have been advocated from time to time to tackle slugging problem in
conventional bed. Introduction of tapered bed instead of a conventional cylindrical one is an
alternative technique in gas-solid fluidization to tackle such problem. Better solid fluid mixing
and improved quality of fluidization can be achieved in a tapered bed. The gradual decrease in
superficial fluid mass velocity due to increase in the cross-sectional area in the upward direction
12
necessitates the use of continuously decreasing size particles for smooth and stable operation of
such a fluidizer. Due to angled wall, random and unrestricted particle movement occurs in
tapered bed thereby reducing back mixing (Singh et al, 1992). Although some information for
liquid-solid system in tapered bed is available, very little work related to gas-solid fluidization in
tapered bed is available. In spite of its advantages and usefulness not much work has been
reported in literature for understanding certain important characteristics, especially fluctuation
ratio of the bed. Some of the previous investigations include fixed bed pressure drop calculations
(Koloini and Farkas, 1973), flow regimes, incipient condition of fluidization, voidage
distribution and bed expansion calculations (Hsu et al, 1978).
Biswal et al. (1982, 1984, and 1985) developed correlations for fluctuation
ratio in a packed bed for spherical and non-spherical particles for gas-solid system in conical
vessels but have not included the effect of density of solid and the fluidizing medium. Maruyama
and Koyanagi (1993) have proposed analytical methods to predict the bed expansion and
pressure drop in tapered fluidized bed. Depypere et al (2005) have carried out studies in a
tapered fluidized bed reactor and proposed a model for expanded bed height by the use of static
pressure and wall surface temperature measurement.
Fluidization operations in cylindrical column are extensively used in process industries. But, in
a number of these operations, the particles are generally not of uniform size or there may be
reduction in size due to chemical reactions like combustion or gasification, or attrition. In
cylindrical beds, the particle size reduction results in entrainment, limitation of operating
velocity in addition to the other demerits like slugging, non-uniform fluidization generally
associated with such beds. These disadvantages are overcome by use of tapered beds to conduct
fluidization. This is due to the gradual reduction of superficial velocity of the fluid because of
increase in cross sectional area with height. Tapered fluidized beds have found wide applicability
in many industrial processes such as biological treatment of waste water, immobilized biofilm
reaction, incineration of waste materials, coating nuclear fuel particles, crystallization, coal
gasification and liquefaction and roasting sulfide ores, and food processing .These beds are also
useful for fluidization of materials with wide particle size distribution and also for exothermic
reactions.Tapered bed can also reduce back mixing of particles.
13

Some of the previous investigations include development of a model for maximum
pressure drop at incipient fluidization condition of a tapered fluidized bed. Biswal et al.
developed an analytical expression for critical fluidization velocity and pressure drop in a packed
bed of spherical particles for gas-solid system in conical vessels. Olazer et al.proposed a
correlation for calculation of maximum pressure drop in conical spouted bed. Later, Peng and
Fan made an in-depth study of the hydrodynamic characteristics of solid-liquid fluidization in
tapered bed and derived a theoretical model based on dynamic balance of forces exerted on the
particle for the prediction of critical fluidization velocity and maximum pressure drop. Jing et al.
and Shan et al. developed a model for gas-solid conical fluidized bed for spherical course and
fine particles respectively based on Peng and Fan model but neglected the pressure drop due to
kinetic change in the bed. But all of these works were for single type particles and uniform size
particles in tapered or conical bed.
There have been a lot of investigations about hydrodynamic characteristics of binary mixture of
particles in conventional (cylindrical) fluidized bed. There is also an investigation for
multicomponent systems in cylindrical bed.
However, in general the particle are not of uniform size in the feed itself and also there may be
particle size reduction during operation in fluidized beds, which can cause high elutriation loss,
defluidization, segregation in size, inhomogeneous residence time in the bed. There have been no
detailed studies so far in literature regarding this aspect. Very few works are reported in the
literature for hydrodynamic characteristics of binary mixtures in conical beds. Hence, the study
of certain important characteristics of tapered beds is essential in the operation of the beds.
The flow of fluids of single phase has occupied the attention of scientists and engineers
for many years. The equations for the motion and thermal properties of single phase fluids are
well-accepted and closed form solutions for specific cases are well-documented. The state of the
art for multiphase flows is considerably more primitive in that the correct formulation of the
governing equations is still under debate. For this reason, the study of multiphase flows
represents a challenging and potentially fruitful area of endeavor. Hence there has been an
increased research activity in the experimental and numerical study of multiphase flows.
14

Multiphase flows can be broadly classified into four groups; gas-liquid, gas-solid, liquid-solid
and three-phase flows. Gas-solid flows are usually considered to be a gas flow with suspended
solid particles. This category includes pneumatic transport, bubbling/circulating fluidized beds
and many others. In addition, there is also a great deal of industrial interest in pure granular
flows in industrial equipment such as mixers, hoppers, ball mills, and chutes.
It has been estimated that approximately $61 billion in the U.S. chemical industry is
linked to particle technology. In particular, gas-solid transport is crucial in a variety of
industrially important applications, ranging from fluidized-bed reactors and dryers to pneumatic
conveyors and classifiers to spray dryers and coaters. In many instances the cohesive nature of a
powder sample is a prime factor contributing to difficulties in proper plant operation where
powder flow ability may cause, for example, channeling and defluidization in combustion/feeder
systems. The Rand Corporation conducted a six-year study of 40 solids processing plants in the
U.S. and Canada. Their study revealed that almost 80% of these plants experienced solids
handling problems. Hence, the problems arising due to the cohesive nature of powders concern a
diverse range of industries.
Despite recent advances, an understanding of the flow and characterization of cohesive
gas-solid owe remains poor. Therefore, it was felt necessary to develop a generalized correlation
for the calculation of minimum fluidization velocity and maximum pressure drop in a tapered
fluidized bed, which are the two important characteristics of fluidization for regular and irregular
particles. In this study an empirical dimensionless correlation has been developed for predicting
the minimum fluidization velocity and maximum pressure drop for regular and irregular particles
of gas–solid systems taking into account all the parameters, i.e., particle diameter, particle
density, tapered angle, porosity and sphericity. The correlation for pressure drop however also
depends upon the bed height. The applicability of the new model has been compared to that of
existing models from literature.
15

CHAPTER 3
EXPERIMENTAL DETAILS
16
EXPERIMENTAL SET UP
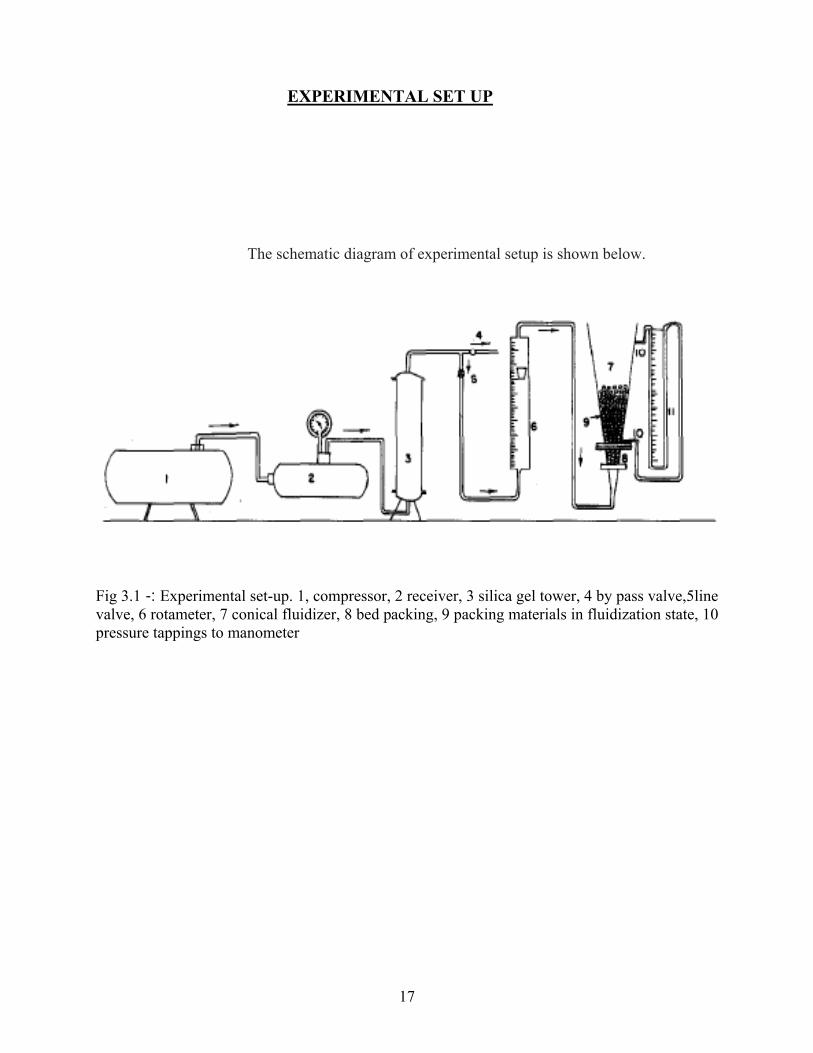
The schematic diagram of experimental setup is shown below.
Fig 3.1 -: Experimental set-up. 1, compressor, 2 receiver, 3 silica gel tower, 4 by pass valve,5line valve, 6 rotameter, 7 conical fluidizer, 8 bed packing, 9 packing materials in fluidization state, 10 pressure tappings to manometer
17
CONSTITUENTS OF EXPERIMENTAL SETUP:
The experimental set up consists of the following parts
Air Compressor
It is multistage air compressor of sufficient capacity.
Air Accumulator
It is horizontal cylinder used for storing the compressed air from compressor. There is one G.I.
pipe inlet to the accumulator and one by-pass from one end of the cylinder. The exit line also at
G.I line taken from the central port of the cylinder. The purpose for using air accumulator in the
line is to dampen the pressure fluctuations. The accumulator is fitted with a pressure gauge; the
operating pressure in the cylinder is kept at 20psig.
Silica-Gel Column
A silica gel column is provided in the line immediately after the air accumulator to arrest the
moisture carried by air from the accumulator.
Pressure Gauge
A pressure gauge in the required range (1-50psig.)is fitted in the line for measuring the working
pressure.
Rotameter
Rotameter is used for the measurement of flow rate of air. Two rotameters, one for the lower
range (0-20 m3/hr) and the other for the higher range (20-120 m3/hr) were used to measure the air
flow rates.
18

Air Distributor
This is an important comment of the experimental setup. It is perforated plate made up of G.I
sheet. The pores of 0.5cm diameter are randomly placed in the sheet. The distributor is an
integral part of calming section where it is followed by a conical section. The inside hollow
space of the distributor filled with glass beads of 1.5cm outer diameter, for uniform air
distribution.
Conical Fluidizer
The fluidizers consists of transport Perspex column with one end fixed to flange. The flange has
6bolt holes of 1.2cm. diameter. Two pressure tapings are provided for noting the bed pressure
drop. A screen is provided in the lower flange of the fluidizer and the conical air distributor.
Quick Opening Valve and Control Valve
A globe valve of 1.25cm inner diameter attached to next to the pressure gauge for sudden release
of the line pressure. A gate valve of 15mm inner diameter is provided in the line to control the
airflow to the bed.
Manometer Panel Board
One set of manometer is arranged in this panel board to measure the pressure drop. Carbon
tetrachloride is used as manomertic liquid .
19

APPARATUS
A schematic diagram of the experimental set-up is shown in Figure3.1.The tapered columns were
made of Perspex sheets to allow visual observation with different tapered angles. The inlet
diameters were 48mm, 42mm and 50mm where as the outlet diameters were 132mm, 174 mm
and 212 mm respectively. The reactor heights were 520 mm, 504 mm and 483 mm respectively.
A 60 mesh screen at the bottom served as the support as well as the distributor. The calming
section of the bed was filled with glass beads for uniform distribution of fluid. Two pressure
taps, one at the entrance and the other at the exit section of the bed were provided to record the
pressure drops. Pressure drop was measured by manometer, which was one meter long. Carbon
tetrachloride (density=1594 kg m-3) was used as the manometric fluid. Air at a temperature of 28 0C ( fρ =1.17 kg m-3 and fµ =1.8*10-5 kg m-1 s-1) used as the fluidizing medium was passed
through a receiver and a silica gel tower to dry and control the air flow before being sent through
the tapered column. Two rotameters, one for the lower range (0-20 m3/hr) and the other for the
higher range (20-120 m3/hr) were used to measure the air flow rates.
20

PROCEDURE
The experiments were carried out in tapered column having tapered angles of 4.61°, 7.47° and
9.52°. Five type of materials such as glass beads (spherical particles having density of 2600
kg/m3), sago (white colored spherical cereal having density of 1303 kg/m3), coal (irregular
particles having density of 1600 kg/m3), iron (irregular particles having density of 4400 kg/m3)
and dolomite (irregular particles having density of 2800 kg/m3), were used for the investigation.
All experimental runs were performed at a temperature of around 303 K and under 101.325 kPa
pressures. The diameter of the particles was determined by sieving technique. The density of the
particles was obtained by dividing the weight of the particles by the displaced water volume
when the particles were placed into a cylindrical column filled with water.
A weighed amount of material was charged to the bed and air passed through it for
about five minutes till the system was stable. The initial stagnant bed height was recorded. Then
the velocity of the air was increased incrementally allowing sufficient time to reach a steady
state. The rotameter and manometer readings were noted for each increment in flow rate and the
pressure drop and superficial velocity calculated. Air flow rate was gradually increased and the
corresponding bed pressure drops were measured. When the minimum fluidization was attained,
the expanded static bed height was also measured. As the bed fluctuates between two limits of
gas-solid fluidization, heights of the upper and the lower surfaces of the fluctuating bed were
measured for each fluid velocity higher than the minimum fluidization velocity.
21

CHAPTER 4
THEORETICAL SECTION
22

THEORETICAL SECTION Equation for total pressure drop in a fixed bed According to the conclusions reached in Refs. [1, 6], the gas velocity distribution in the cross-
section of the conical bed is uniform. Therefore, in the fixed bed regime, Ergun’s equation is
adopted for calculating the pressure drop.
If the voidage remains uniform with bed height, the gas velocity, Ug, in the conical bed, is given
as
By substituting Eq. (B2) into Eq. (B1), Ergun’s equation becomes
23

By integrating along the bed height, the pressure drop is
Where ,
by considering Ǿs=1 in this experiment, Eq. (B4) reads
24

Condition for point A According to the conclusion drawn by Peng and Fan [1], the buoyancy force exerted on the
entire particle bed by fluid flowing upwards equals the effective gravitational force of all
particles in the bed at point A in Fig.1.2, i.e.
In the fixed bed regime, the total pressure drop can be calculated by Ergun’s equation as follows
In the layer with radius r, the buoyancy force exerted on the particles by the fluid is
Integration of Eq. (C3) along the height of the conical bed gives
At the same time, the effective weight of particles in the layer is
Integration of Eq. (C5) along the height of the conical bed gives
According to Eq. (C1), the following equation is obtained for calculating the minimum
fluidization velocity, Umf
25

The total pressure drop, ∆Pt, is also calculated by substituting Umf into Eq. (B5).
Condition for point B
According to the conclusion drawn by Peng and Fan [1], the fully fluidized bed occurs when the
buoyancy force exerted on the particles in the top layer by fluid
flowing upwards equals the effective gravitational force in the layer at point B in Fig. A1.2, i.e.
By combing Eq. (C3) with Eq. (C5), the following equation is derived
The spouting velocity is calculated by solving Eq. (D2). Here, according to the definition of
fluidization, the pressure gradient, dPt/dh, should be equal to Psg.
26

CHAPTER 5
EXPERIMENTAL OBSERVATIONS
27

EFFECT OF CONE ANGLE The fig.5.1 shows the effect of the cone angle of the conical bed on flow regimes, where the bed
cone angles are 4.61, 7.47 and 9.52° and the stagnant height of the conical bed is 0.195 m. It can
be seen from Fig.4 that there are three regimes for different cone angles, but the maximum
pressure drop, ∆Pmax, the minimum fluidization velocity, Umf, the spouting pressure drop,
∆Psp, and the spouting velocity, Ums, increase with the increase of cone angle. When Ug0
exceeds Ums, it is observed that for a cone angle of 4.61°, fluidization suddenly occurs and that
pulsing slugging follows directly, while for a cone angle of 7.47°, only bubble fluidization
happens. For the cone angle of 9.52°, only the particles in the center of the conical bed flow
upward and form a ‘fountain’, but the particles near the wall flow downward. Therefore, the
motion of particles for the conical bed with a cone angle of 9.52° seems to be similar to
conventional spouting
fig.5.1 effect of cone angles of fluidization in conical bed
28

Fig.5.2 Effect of stagnant bed height of the conical bed on fluidization
EFFECT OF STAGNANT HEIGHT
The above fig shows the effect of the stagnant height of the conical bed on flow regime in the
case of a bed cone angle of 4.6°. It can be seen from Fig. 5.2 that there are three regimes, and the
values of ∆Pmax, Umf, ∆Psp, and Ums increase with increasing stagnant bed height.
Fig.5.3 pressure drop at different position along the bed height
29

LOCAL CHARACTERISTICS The above fig., shows the local pressure drop along the height of the conical bed wall with
increasing Ug0 when the cone angle and stagnant height are 9.52° and 0.23 m, respectively. It
can be seen that the profile of local pressure drop shows the same tendency as that of the total
pressure drop with increasing Ug0. By moving to a higher position in the bed, the local pressure
drop decreases because the cross-sectional area increases, but the local minimum fluidization
velocity, Umfl, to which the maximum local pressure drop corresponds, increases as shown in
above Fig5.3. It is also seen that the local spouting velocity, Umsl, does not change with
variation in the bed height. From the above experimental results of local pressure drop versus
Ug0, it is concluded that when Ug0 is less than Ums, the particles in the upper section of the bed
are not fluidized and the particles above restrict the bed expansion in the lower section. In this
case the conical bed is in the partial fluidization regime. When Ug0 is greater than Ums, the
condition of non-fluidization disappears.
30

CHAPTER 6
PREVIOUSLY DEVELOPED CORRELATIONS
31

FOR CONVENTIONAL BEDS
Developed correlations For Fluctuation Ratio (For Irregular Particle Mixture) are:
(1) Un-Promoted Bed
⎥⎥
⎦
⎤
⎢⎢
⎣
⎡
⎟⎟⎠
⎞⎜⎜⎝
⎛ −⎟⎟⎠
⎞⎜⎜⎝
⎛⎟⎠⎞
⎜⎝⎛
⎟⎠⎞
⎜⎝⎛=
−− 1036.102.01035.000812.0
6.4mf
mf
f
s
UUU
HsDc
Dcdpr
ρρ
(2) Disc Promoted Bed without Stirring Effect
⎥⎥⎦
⎤
⎢⎢⎣
⎡⎟⎟⎠
⎞⎜⎜⎝
⎛ −⎟⎟⎠
⎞⎜⎜⎝
⎛ρρ
⎟⎠⎞
⎜⎝⎛
⎟⎠⎞
⎜⎝⎛=
−− 215.1
mf
mf0346.0
f
s0846.00323.0
UUU
HsDc
Dedp3.4r
(3)Rod Promoted Bed without Stirring Effect
⎥⎥⎦
⎤
⎢⎢⎣
⎡⎟⎟⎠
⎞⎜⎜⎝
⎛ −⎟⎟⎠
⎞⎜⎜⎝
⎛ρρ
⎟⎠⎞
⎜⎝⎛
⎟⎠⎞
⎜⎝⎛=
−− 061.1
mf
mf2826.0
f
s072.0003.0
UUU
HsDc
Dedp97.2r
(4)Disc Promoted Bed with Stirring Effect
⎥⎥⎦
⎤
⎢⎢⎣
⎡⎟⎟⎠
⎞⎜⎜⎝
⎛ −⎟⎟⎠
⎞⎜⎜⎝
⎛ρρ
⎟⎠⎞
⎜⎝⎛
⎟⎠⎞
⎜⎝⎛=
−− 312.1
mf
mf24.0
f
s414.0106.0
UUU
HsDc
Dedp22.2r
(5)Rod Promoted Bed with Stirring Effect
⎥⎥
⎦
⎤
⎢⎢
⎣
⎡
⎟⎟⎠
⎞⎜⎜⎝
⎛ −⎟⎟⎠
⎞⎜⎜⎝
⎛⎟⎠⎞
⎜⎝⎛
⎟⎠⎞
⎜⎝⎛=
− 08.1366.01589.002.0
82.2mf
mf
f
s
UUU
HsDc
Dedpr
ρρ
32

Developed correlations For Expansion Ratio are:
(6)Un-Promoted Bed
⎥⎥⎦
⎤
⎢⎢⎣
⎡⎟⎟⎠
⎞⎜⎜⎝
⎛ −⎟⎟⎠
⎞⎜⎜⎝
⎛ρρ
⎟⎠⎞
⎜⎝⎛
⎟⎠⎞
⎜⎝⎛=
−−− 89.0
mf
mf702.0
f
s056.00155.0
UUU
HsDc
Dcdp34.2R
(7)Disc Promoted Bed without Stirring Effect
⎥⎥⎦
⎤
⎢⎢⎣
⎡⎟⎟⎠
⎞⎜⎜⎝
⎛ −⎟⎟⎠
⎞⎜⎜⎝
⎛ρρ
⎟⎠⎞
⎜⎝⎛
⎟⎠⎞
⎜⎝⎛=
− 756.0
mf
mf02.0
f
s2773.00337.0
UUU
HsDc
Dedp45.1R
(8)Rod Promoted Bed without Stirring Effect
⎥⎥⎦
⎤
⎢⎢⎣
⎡⎟⎟⎠
⎞⎜⎜⎝
⎛ −⎟⎟⎠
⎞⎜⎜⎝
⎛ρρ
⎟⎠⎞
⎜⎝⎛
⎟⎠⎞
⎜⎝⎛=
− 077.1
mf
mf0223.0
f
s4064.0036.0
UUU
HsDc
Dedp274.1R
(9)Disc Promoted Bed with Stirring Effect
⎥⎥⎦
⎤
⎢⎢⎣
⎡⎟⎟⎠
⎞⎜⎜⎝
⎛ −⎟⎟⎠
⎞⎜⎜⎝
⎛ρρ
⎟⎠⎞
⎜⎝⎛
⎟⎠⎞
⎜⎝⎛=
− 96.0
mf
mf
589.0
f
s153.00682.0
UUU
HsDc
Dedp5.1R
(10) Rod Promoted Bed with Stirring Effect
⎥⎥⎦
⎤
⎢⎢⎣
⎡⎟⎟⎠
⎞⎜⎜⎝
⎛ −⎟⎟⎠
⎞⎜⎜⎝
⎛ρρ
⎟⎠⎞
⎜⎝⎛
⎟⎠⎞
⎜⎝⎛=
− 088.1
mf
mf677.0
f
s0125.0011.0
UUU
HsDc
Dedp49.1R
33

FOR TAPERED BEDS
Some of the well known correlations available for predicting the minimum fluidization velocity
(Umf) and maximum pressure drop (_Pmax) for tapered beds are those by Peng and Fan [1] and
Jing et al. [11]. Peng and Fan [1] developed a model for estimating minimum fluidization
velocity and maximum pressure drop for solid–liquid system and spherical particles based on the
dynamic balance of forces exerted on the particle. The correlation reported by them for minimum
fluidization velocity is given in Eq. (1).
(1)
The equation for pressure drop has been developed from Ergun’s equation, which also includes
the pressure drop due to a kinetic energy change in the bed:
(2)
Jing et al. [11] developed a model based on Ergun’s equation for pressure drop calculation but
neglecting the pressure drop due to the kinetic energy change in the bed. The equation proposed
by them for nearly spherical particles is
(3)
34

Recently, Sau et.al. (2007) developed a correlation for maximum pressure drop in gas–solid
(4)
tapered fluidized beds
(5)
n the basis of Ergun’s equation and Baskakov and Gelperm’s modification [4] forcone
O
geometry, a packed bed pressure drop equation for conical beds was developed by
Biswal.et.al.(1984), for gas-solid systems,
(6)
nset of fluidization, at the o
(7)
35

A correlation for fluctuation ratio in conical vessels for regular particle has been developed by
Biswal et al (1984) using dimensional analysis approach based on four dimensionless groups
neglecting the effect of density of gas and solid particles. The correlation reported by Biswal et
al (1984) for fluctuation ratio of regular particle is given in equation (8) and for irregular particle
is in equation (9).In equation (9) the effect of top diameter has also been neglected.
0.170.16 0.24 0.14d G GD h− − ⎛ ⎞−⎛ ⎞ ⎛ ⎞ ⎛ ⎞
0 0
3.168 p f mfc s
s mf
rh D D G
= ⎜ ⎟⎜ ⎟ ⎜ ⎟ ⎜ ⎟ ⎜ ⎟⎝ ⎠ ⎝ ⎠ ⎝ ⎠ ⎝ ⎠ (8)
0.32 0.150.83 0.27
0
9.48 p f mfc s
s mf
d G GDrh D G
ρρ
−− ⎛ ⎞ ⎛−⎛ ⎞ ⎛ ⎞= ⎜ ⎟ ⎜⎜ ⎟ ⎜ ⎟ ⎜ ⎟ ⎜⎝ ⎠ ⎝ ⎠ ⎝ ⎠ ⎝ f
⎞⎟⎟⎠
(9)
Semi-empirical correlation for ums is given by
Bi et al. [17] as follows:
(10)
Where
For the conventional spouting bed, an empirical correlation
was given by Mathur and Gishler as:
(11)
the value of ums is based on the cross-
sectional area at the bottom of the fluidized bed.
36

CHAPTER 7
DEVELOPMENT OF MODELS
37

DEVELOPMENT OF MODELS
Based on the experimental data obtained in the present study for different mixture of
materials, correlations have been obtained by carrying out dimensionless analysis and estimating
the constant coefficients by non-linear regression. In our correlations we have included the effect
of tapered angle which is the most important parameter in tapered bed hydrodynamics. The
proposed correlations consists of experimental systems corresponding to a wide range of
geometric factors of the bed (tapered angle, gas inlet diameter) and a wide range of experimental
conditions (particle size, particle density, stagnant bed height). The dimensionless correlation for
(mixture of regular particles) critical fluidization velocity is given in equation (1) and for
maximum pressure drop is in equation (2).
( ) ( )0.3154 1.1854
0.1969 0.0585
0
Re 16.364 mc
f
dpAr SinD
ρ αρ
⎛ ⎞ ⎛ ⎞∆= ⎜ ⎟ ⎜ ⎟⎜ ⎟ ⎝ ⎠⎝ ⎠
(1)
0.23370.1493 0.3826max
0
0.081( ) ( )s
sm s
P HAr Sing H D
αρ
−⎛ ⎞∆
= ⎜ ⎟⎝ ⎠
(2)
In order to develop correlations for binary systems, it is necessary to define the particle
diameter and the density of the binary systems. In this study, they are defined as in Goossens et
al. [23].
1 l h
sm sl s
w w
hρ ρ ρ= + (3)
1 l
m sm l sl h sh
w wdp dp dp
h
ρ ρ ρ= + (4)
The dimensionless correlation for critical fluidization velocity of mixture of irregular particles is
given in equation (5) and for maximum pressure drop is in equation (6).
( ) ( )0.3057 1.562
0.1272 0.1919
0
Re 301.416 mc
f
dpAr SinD
ρ αρ
⎛ ⎞ ⎛ ⎞∆= ⎜ ⎟ ⎜ ⎟⎜ ⎟ ⎝ ⎠⎝ ⎠
(5)
( )0.2273
0.29470.2009max
0
0.0204( ) s
sm s
P HAr SingH D
αρ
−⎛ ⎞∆
= ⎜ ⎟⎝ ⎠
(6)
38

CHAPTER 8
INTRODUCTION TO COMPUTAIONAL
FLUID DYNAMICS (CFD)
39

8.1 INTRODUCTION TO CFD
The flow of fluids of single phase has occupied the attention of scientists and engineers for many
years. The equations for the motion and thermal properties of single phase fluids are well
accepted and closed form solutions for specific cases are well documented. The state of the art
for multi phase flows is considerably more primitive in that the correct formulation of the
governing equations is still under debate. For this reason the study of multiphase flows
represents a challenging and potentially fruitful area of endeavor. Hence there has been an
increased research activity in the experimental and numerical study of multi phase flows. Multi
phase flows can be broadly classified into four groups; gas-liquid, gas-solid, liquid-solid and
three phase flows. Gas-solid flows are usually considered to be a gas flow with suspended solid
particles. This category includes pneumatic transport, bubbling/circulating fluidized beds and
many others. In addition, there is also great deal of industrial interest in pure granular flows in
equipment such as mixers ball mills and hoppers.
Various research groups to understand the gas- solid flow dynamics are conducting
theoretical experimental and numerical studies. Hydrodynamics modeling of gas – solid flows
has been undertaken in one form or another for over forty years now. Fluidized beds are widely
used in the chemical industries. They facilitate a large variety of operations ranging from coal
gasification , coating metals objects with plastics drying of solids adsorption synthesis reactions,
cracking of hydrocarbons and mixing etc. This variety of processes results in a large variety of
fluidized bed reactors . In gas solid contact systems, gas bubble coalesces and grows as they rise
and in a deep enough bed of small diameter they may eventually become large enough to spread
across the vessel. The compelling advantage of the fluidized beds such as the smooth and liquid
like flow of particles allows a continuous automatically controlled operation with easy handling
and rapid mixing solids etc. of small economy fluidized as contacting has been responsible for its
successful use in industrial operations but such success depends on understanding and
overcoming its disadvantages. Currently here are two approaches for the numerical calculation of
multiphase flows, the Euler- Lagrange approach and the Euler Euler approach.
In the Euler- Lagrange, the fluid phase is treated as a continuum by solving the time averaged
Navier stokes equation, while the dispersed phase is solved by tracking a large number of
particles (or bubbles, droplets) through the calculated flow field. The dispersed phase can
40

exchange momentum, mass and energy with the fluid phase. A fundamental assumption made in
this approach is that the dispersed second occupies a lower volume fraction.
In the euler-euler approaches, the different phase are treated mathematically as inter penetrating
continua. Since the volume of a phase cannot be occupied by another phase, the concept of the
phase volume fraction is introduced. These volume fractions are assumed to be continuous
fraction of time and space and their sum is equal to 1. For granular flows, such as flow in rising
fluidized bed and other suspension systems, the eulerian multiphase model is always the first
choice and also for simulations in this research.
Assumptions 1) No mass transfer between the gas phase and solid phase.
2) External body force, lift force as well as virtual mass force are ignored.
3) Pressure gradient at fully fluidized condition is constant.
4) Density of each phase is constant.
8.2 What is CFD (Computational Fluid Dynamics)
CFD is predicting what will happen, quantitatively, when fluid flows, often with the
complication of
• Simultaneous flow of heat
• Mass transfer(e.g. )
• Phase change(e.g. melting, freezing)
• Chemical reactions(e.g. combustion)
• Mechanical movement( e.g. piston ,fans)
• Stress & displacement
41

8.2.1 Advantages of CFD
1. Able to model physical fluid phenomenon that cannot easily be simulated or measured
with a physical experiment. e.g. weather system.
2. Able to model & investigate physical fluid systems more cost effectively and more
rapidly than with experimental procedures. e.g. hypersonic aerospace vehicle.
8.2.2 Uses of CFD
1. Chemical engg. : to maintain yield from reactor and processing
equipments.
2. Civil engg. : in creation of dams and aquaducts on quality and
quantity of water supply
3. Mechanical engg. : in design of pumps
4. Electrical engg. : in power plant design to attain maximum efficiency
5. Aeronautical engg. : in design of aircrafts
8.2.3 Working Principle
1. CFD first builds a computational model that represent a system or a device and
that you want to study.
2. The geometry of interest is then divided or discreted into a number of
computational cells called grids or mesh.
Discretization is the method of approximating the different equations by a system of
algebraic equations for the variables at some set of discrete locations in space and
time. The discrete locations are referred to as grids or mesh
3. The governing equation such as Navier stokes equation ,continuity equation and energy
equations etc are discretized at each grid point using numerical analysis
Finite difference method,
Finite element method,
Finite volume method
4. The discretized algebra equations are then solved at each grid points by iterative
means until a converged solution is obtained.
42

5. The values at other point are determined by interpolating the values between the grid points. 8.3 CFD Goals: CFD can assist the design and optimization of new and existing processes and products.
CFD can also be used for reducing energy costs, improving environmental performance and
increasing productivity and profit margins. There are many potential applications of CFD in
chemical processes where predicting the characteristics of fluid flow are important. A concerned
effort by industry in partnership with government and academia is needed to make similar
advances in CFD possible for the chemical and other low temperature process industries.
8.4 Current Industrial Applications: CFD is routinely used today in a wide variety of disciplines and industries, including
aerospace, automotive, power generation, chemical manufacturing, polymer processing,
petroleum exploration, medical research, meteorology and astrophysics. The use of CFD in the
process industry has led to reduction in the cost of product and process development and
optimization activities ( by reducing down time), reduce the need for physical experimentation,
shortened time to market, improved design reliability, increased conversions and yields and
facilitated the resolution of environmental, health and right to operate issues . It follows that the
economic benefit of using CFD has been substantial, although detailed economic analysis are
rarely reported.CFD has an enormous potential impact on industry because the solution of
equations of motion provides everything that is meaningful to know about the domain. For
example, chemical engineers commonly make assumptions about the fluid mechanics in process
units and piping that lead to great simplifications in the equations of motion. An agitated
chemical reactor may be designed on the assumption that the material in the vessel is perfectly
mixed, when, in reality, it is probably not perfectly mixed. Consequently, the fluid mechanics
may limit the reaction rather than the reaction kinetics and the design may be inadequate. CFD
allows one to stimulate the reactor without making any assumptions about the macroscopic flow
pattern and thus to design the vessel properly the first time.
43

CHAPTER 9
MODELING & SIMULATION OF CONICAL BED
44
9.1 WORKING PROCEDURE
9.1.1 Gambit (CFD Preprocessor) It is a software package designed to help analyst and designers build and mesh models for CFD
and other scientific applications.
The Gambit graphical user interface makes the basic steps of:
1. Building.
2. Meshing,
3. Assigning zones type to a model
Gambit has following advantages:
1. Ease of use: It is user friendly
2. CAD/CAE Integration: Gambit can import geometry from any CAD/CAE
software
3. Fast Modeling: It provides a concise and powerful set of solid modeling based
geometry tools
4. CAD cleanup: Gambit’s semiautomatic cleanup tools can be used to repair and
prepare the geometry for high quality meshing.
5. Intelligent Meshing: Different CFD problems require different mesh types.
Gambit provides a wide variety of meshing tools.
Step 1 : Building the geometry
There are two approaches to build the geometry
Top Down
Bottom Up
45

Top Down : construct the geometry by creating volumes ( bricks,
cylinder etc ) and then multiplying them through boolean operation.
Bottom Up : create vertices, then creating edges from vertices, then connect the edges to
create faces and then connect the faces to create volume.
Step 2: Meshing the model
Meshing can be done in different ways:
Triangular, quadrilateral, hexahedral, tetrahedral, prism etc.
Structured and unstructured mesh.
Step 3: Specifying zones type
Zone type specification defines the physical and operational characteristics of the model at its
boundaries and within specific region of its domain. There are two classes of zone type
specification
Boundary type
continuum type
Boundary type -:
In this type specifications, such as well, vent or inlet, define the characteristics of the model at its
external or internal boundaries.
Continuum type -:
In this type specification, such as fluid or solid, define the characteristics of the model within
specified regions of its domain. e.g. if you assign a fluid continuum type specification to a
volume entity, the model is defined such that equations of momentum, continuity and species
transport apply at mesh nodes or cells that exist within the volume. Conversely if you assign a
solid continuum type specification to a volume entity, only the energy and species transport
equations (without convection) apply at the mesh nodes or cells that exist within the volume.
46

Fluid zone = group of cells for which all active equations are solved.
Solid zone = group of cells for which only heat conduction problem solved.
No flow equations solved.
9.1.2Solver
Steps Involved in FLUENT
1) Launch Fluent and select solver 2D
2) Read the case file .
3) Define Models (Solver Properties)
a) Select segregated,2D, implicit,1st order , unsteady , absolute, cell based,
Superficial Velocity from Solver.
b) Enable the Eulerian multiphase model with 2 phases.
c) Select the laminar model.
d) Define the operating conditions, turn on the gravity and set the
gravitational acceleration in the negative y direction, also give the
reference pressure location.
4) Define Materials
a) Select air as the primary phase and specify its density.
b) Define a new fluid material( the glass beads) for the granular phase and
specify its density.
5) Define Phases
a) Specify air as the primary phase
b) Specify glass beads or any solids as the secondary phase, select granular
model and specify the diameter and volume fraction of solids, Select the
interphase interaction .
6) Boundary condition declaration
a) Set conditions at velocity inlet with specifying the velocity magnitude at
b) inlet for primary phase and for secondary phase keep the default value
zero for velocity magnitude.
c) Set the boundary conditions for the pressure outlet for mixture and both
47

phases.
d) Set the conditions for the wall for mixture and both phases.
7) Solution parameter setting
a) Set the under relaxation factor for pressure, momentum and volume
fraction of solids.
b) Enable the plotting of residuals during the calculation.
c) Initialize the solution.
d) Define an adaption register for the lower half of the fluidized bed.
e) Set a time step size and number of time steps for iteration, save the case
and data files.
9.1.3Post Processing
1) Select phase and volume fraction of the solids in the contours, we can see the
contours of solids at each instant.
2) Similar step is followed for displaying contours of static pressure of mixture.
Flowrate in 8 10 12 14 m3/hr Fig 7)-: Contours of Solid(iron) Fraction for Bed height =5.6 cm (Particle Size = 0.00158 m) at different flowrates after 1 second
48

CHAPTER 10
RESULTS AND DISCUSSION
49

RESULTS AND DISCUSSION
The hydrodynamic behavior of fluidization in tapered beds is best described by the plot of
pressure drop across the bed versus superficial velocity of the fluid at the entrance. Such a plot is
shown in Figure 8. From point A to point B, the pressure drop increases with the increase of
superficial gas velocity. The transition from fixed bed to partially fluidized bed occurs at point B.
From point B, the pressure drop decreases with the increase of superficial gas velocity and from
point C it remains constant. Point B to point C is called partially fluidized bed and thereafter it is
called fully fluidized bed. The hydrodynamic characteristics associated with the phenomenon are
critical fluidization velocity, maximum pressure drop, critical velocity for full fluidization,
pressure drop at full fluidization, maximum velocity for full defluidization and hysteresis.The
details and the significance of each of the characteristics is explained by Peng and Fan [1].The
velocity at point B is called critical fluidization velocity or minimum velocity for partial
fluidization. At this point the pressure drop was maximum.
The critical fluidization velocity and maximum pressure drop were calculated using equation
(1) and (2) respectively for binary mixture of regular particles and using equation (3) and (4)
respectively for homogeneous binary mixture of irregular particles in gas-solid system and
compared with experimental data.
The predicted critical fluidization velocity and maximum pressure drop with experimental
results are shown in figure 9 and figure 10, 11, 12 respectively for regular particles and
figure14,15,16,17 respectively for irregular particles .The average absolute percentage errors for
critical fluidization velocity and maximum pressure drop is within 10%. All figures show good
agreement between the predicted values and the experimental data. Comparison of critical
fluidization velocity and maximum bed pressure drop with experimental results in absolute error
(%) are shown in Table 2, 3 and 4, 5. It was also experimentally seen that the Uc was not a
function of stagnant bed height in tapered bed. This phenomenon was also observed by
Povrenovic et al. [24] and Caicedo et al. [25].The critical fluidization velocity of homogeneous
binary mixture of irregular particles is strongly dependent upon the ratio of 0
mdpD
⎛ ⎞⎜⎝ ⎠
⎟ compared to
other parameters whereas the maximum pressure drop is strongly dependent upon bed aspect
ratio0
sHD
⎛ ⎞⎜ ⎟⎝ ⎠
.This can also seen in Table4 and 5.
50

CHAPTER 11
CONCLUSION
51

CONCLUSION
The hydrodynamic features of the tapered fluidized bed are very different from those of the
columnar fluidized bed; therefore, the known relations for the columnar bed cannot be used in
calculating those for the tapered bed. Correlations have been developed for the calculation of
critical fluidization velocity and maximum bed pressure drop for binary mixture of regular and
irregular particles in gas-solid system in tapered beds. The experimental values for gas-solid
systems in tapered beds were found to fit well with the proposed correlations. This indicates that
the proposed correlations is valid and are of practical use. Though the average absolute
percentage errors are within 10%, but some cases (table 2 and table 3) the absolute errors are
slightly high. This needs more work to improve upon the correlations and to minimize the errors.
The proposed correlations could find practical utility in designing and operation of tapered
fluidized beds for various gas- solid systems.
52

NOMENCLATURE
D0 bottom diameter of tapered bed, m.
D1 top diameter of tapered bed, m.
Dc mean diameter of cone, m
dp particle diameter, m.
hs initial static height of the particle bed, m.
U superficial velocity of the fluidizing fluid, m/s.
Umf minimum fluidization velocity based on bottom diameter of the bed, m/sec.
fG mass velocity of fluid at fluidization condition, kg/m-hr
mfG mass velocity of fluid at minimum fluidization condition, kg/m-hr
r fluctuation ratio, dimensionless
g gravity ,ms-2
dpm particle diameter of binary mixture ,m
dpl diameter of light particle , m
dph diameter of heavy particle , m
Hs initial stagnant height of the particle bed, m
ρ∆ sm fρ ρ−
Uc critical fluidization velocity based on the diameter of
entrance of the bed ,ms-1
∆Pmax maximum pressure drop through the particle bed (Pa)
Ar Archimedes number, (= 3 2 / 2pm sm fgd ρ µ )
Rec Reynolds number at Uc, (= /m c f fdp U ρ µ )
lw weight fraction of light (or small) particle
hw weight fraction of heavy (or big) particle
Greek letters
ρf fluid density, kg/m3
α tapered angle, deg
53

µf fluid viscosity, kg m-1 s-1
ρsm density of binary mixture, kg m-3
ρsl density of light(small) particle, kg m-3
ρs solid density, kg/m3
ρsh density of heavy(big) particle, kg m-3
Subscript
exp. experimental value
GB1 glass bead of size 2608 µ m
GB2 glass bead of size 2215 µ m
S1 sago of size 2608 µ m
S2 sago of size 2215 µ m
C1 coal of size 1718 µ m
C2 coal of size 1303 µ m
I1 iron ore of size 1718 µ m
I2 iron ore of size 1303 µ m
D1 dolomite of size 1718 µ m
D2 dolomite of size 1303 µ m
54

0 1 2 3 4 5 60
2 0 0
4 0 0
6 0 0
8 0 0
1 0 0 0
1 2 0 0
1 4 0 0
A
C
Pre
ssur
e dr
op(P
a)
S u p e r f i c i a l g a s v e l o c i t y , m / s
B
Figure-8.
55

0 . 0 0 . 5 1 . 0 1 . 5 2 . 0 2 . 5 3 . 00 . 0
0 . 5
1 . 0
1 . 5
2 . 0
2 . 5
3 . 0
UC(p
redi
cted
),m/s
U c ( e x p ) , m / s
G B 1 + G B 2 S 1 + S 2 G B 1 + S 1
Figure-9.
56

0 2 0 0 4 0 0 6 0 0 8 0 0 1 0 0 0 1 2 0 0 1 4 0 0 1 6 0 0 1 8 0 0 2 0 0 0 2 2 0 00
2 0 0
4 0 0
6 0 0
8 0 0
1 0 0 0
1 2 0 0
1 4 0 0
1 6 0 0
1 8 0 0
2 0 0 0
2 2 0 0
max
imum
pre
ssur
e dr
op(p
redi
cted
),Pa
m a x im u m p r e s s u r e d r o p ( e x p . ) , P a
G B 1 + G B 2 S 1 + S 2 G B 1 + S 1
Figure 10.
57

0 3 0 0 6 0 0 9 0 0 1 2 0 0 1 5 0 0 1 8 0 0 2 1 0 0 2 4 0 0 2 7 0 0 3 0 0 00
3 0 0
6 0 0
9 0 0
1 2 0 0
1 5 0 0
1 8 0 0
2 1 0 0
2 4 0 0
2 7 0 0
3 0 0 0
max
imum
pre
ssur
e dr
op(p
redi
cted
),Pa
m a x im u m p r e s s u r e d r o p ( e x p . ) , P a
G B 1 + G B 2 S 1 + S 2 G B 1 + S 1
Figure 11.
58

0 5 0 0 1 0 0 0 1 5 0 0 2 0 0 0 2 5 0 0 3 0 0 00
5 0 0
1 0 0 0
1 5 0 0
2 0 0 0
2 5 0 0
3 0 0 0
max
imum
pre
ssur
e dr
op(p
redi
cted
),Pa
m a x im u m p r e s s u r e d r o p ( e x p . ) , P a
G B 1 + G B 2 S 1 + S 2 G B 1 + S 1
Figure 12.
59

0 . 0 0 . 5 1 . 0 1 . 5 2 . 0 2 . 5 3 . 00
2 0 0
4 0 0
6 0 0
8 0 0
1 0 0 0
1 2 0 0
C
A
Pre
ssur
e dr
op(P
a)
S u p e r f i c i a l g a s v e l o c i t y ( m / s )
B
Figure-13.
60

0 . 0 0 . 2 0 . 4 0 . 6 0 . 8 1 . 0 1 . 2 1 . 4 1 . 6 1 . 8 2 . 0 2 . 2 2 . 40 . 0
0 . 2
0 . 4
0 . 6
0 . 8
1 . 0
1 . 2
1 . 4
1 . 6
1 . 8
2 . 0
2 . 2
2 . 4
Crit
ical
flui
diza
tion
velo
city
(pre
dict
ed),m
/s
C r i t i c a l f l u i d i z a t i o n v e l o c i t y ( e x p . ) , m / s
C 1 + C 2 I 1 + I 2 D 1 + D 2
Figure-14.
61

0 5 0 0 1 0 0 0 1 5 0 0 2 0 0 0 2 5 0 0 3 0 0 00
5 0 0
1 0 0 0
1 5 0 0
2 0 0 0
2 5 0 0
3 0 0 0
max
imum
pre
ssur
e dr
op(p
redi
cted
),Pa
m a x im u m p r e s s u r e d r o p ( e x p . ) , P a
C 1 + C 2 I 1 + I 2 D 1 + D 2
Figure-15
62

0 5 0 0 1 0 0 0 1 5 0 0 2 0 0 0 2 5 0 0 3 0 0 0 3 5 0 00
5 0 0
1 0 0 0
1 5 0 0
2 0 0 0
2 5 0 0
3 0 0 0
3 5 0 0
max
imum
pre
ssur
e dr
op(p
redi
cted
),Pa
m a x im u m p r e s s u r e d r o p ( e x p . ) , P a
C 1 + C 2 I 1 + I 2 D 1 + D 2
Figure-16
63

0 5 0 0 1 0 0 0 1 5 0 0 2 0 0 0 2 5 0 0 3 0 0 0 3 5 0 00
5 0 0
1 0 0 0
1 5 0 0
2 0 0 0
2 5 0 0
3 0 0 0
3 5 0 0
max
imum
pre
ssur
e dr
op(p
redi
cted
),Pa
m a x im u m p r e s s u r e d r o p ( e x p . ) , P a
C 1 + C 2 I 1 + I 2 D 1 + D 2
Figure-17
64
4 5 6 7 8 9 1 0
0 . 9
1 . 0
1 . 1
1 . 2
1 . 3
1 . 4
1 . 5
1 . 6
1 . 7
1 . 8
1 . 9
2 . 0
2 . 1
Crit
ical
flui
diza
tion
velo
city
(m/s
)
T a p e r e d a n g l e ( 0 )
C 1 + C 2 I 1 + I 2 D 1 + D 2
Fig-18
65

1 5 0 0 2 0 0 0 2 5 0 0 3 0 0 0 3 5 0 0 4 0 0 0 4 5 0 0
0 . 9
1 . 0
1 . 1
1 . 2
1 . 3
1 . 4
1 . 5
1 . 6
Crit
ical
flui
diza
tion
velo
city
(m/s
)
M e a n d e n s i t y o f t h e b i n a r y m i x t u r e ( k g / m 3 )
Figure 19
66

0 . 0 8 0 0 . 0 8 5 0 . 0 9 0 0 . 0 9 5 0 . 1 0 0 0 . 1 0 5
2 3 0 0
2 4 0 0
2 5 0 0
2 6 0 0
2 7 0 0
2 8 0 0
Max
imum
pre
ssur
e dr
op(P
a)
I n i t i a l s t a t i c b e d h e i g h t ( m )
Figure -20
67

0 2 0 4 0 6 0 8 0 1 0 0
1 . 5
2 . 0
2 . 5
Crit
ical
flui
diza
tion
velo
city
(m/s
)
% o f s m a l l e r p a r t i c l e s
T a p e r e d a n g le = 4 . 6 1 0
T a p e r e d a n g le = 7 . 4 7 0
T a p e r e d a n g le = 9 . 5 2 0
Figure -21
68
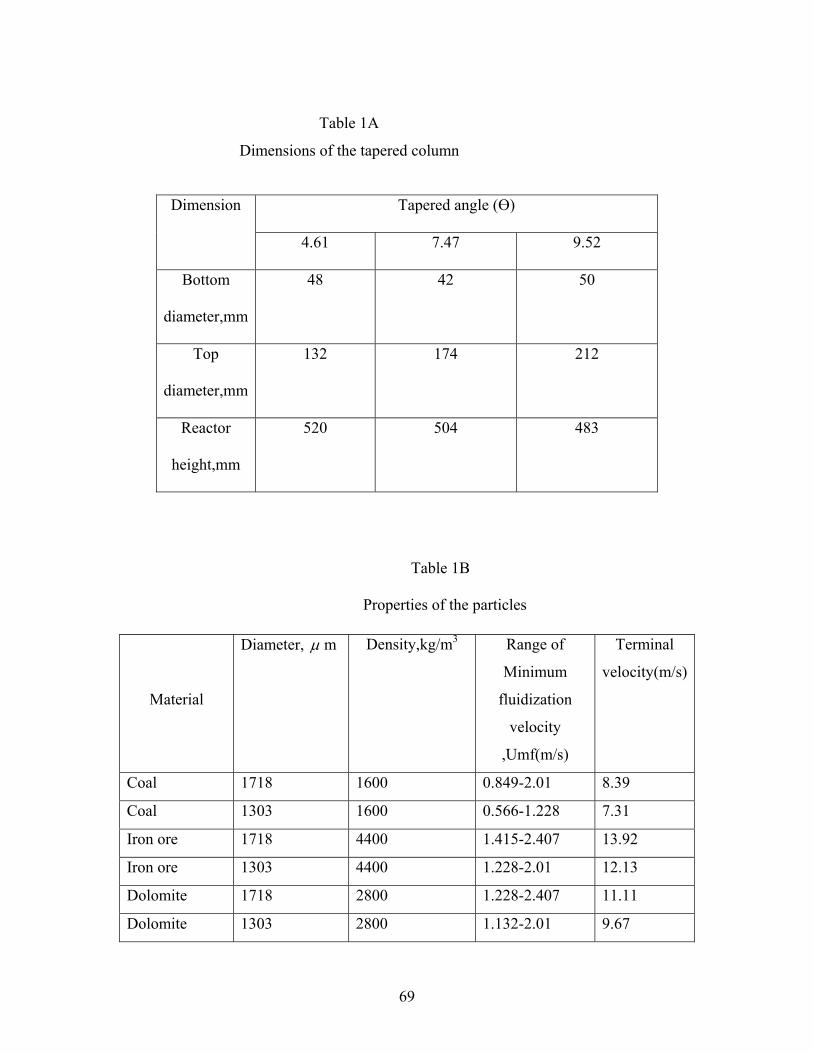
Table 1A
Dimensions of the tapered column
Tapered angle (Ө) Dimension
4.61 7.47 9.52
Bottom
diameter,mm
48 42 50
Top
diameter,mm
132 174 212
Reactor
height,mm
520 504 483
Table 1B
Properties of the particles
Material
Diameter, µ m
Density,kg/m3 Range of
Minimum
fluidization
velocity
,Umf(m/s)
Terminal
velocity(m/s)
Coal 1718 1600 0.849-2.01 8.39
Coal 1303 1600 0.566-1.228 7.31
Iron ore 1718 4400 1.415-2.407 13.92
Iron ore 1303 4400 1.228-2.01 12.13
Dolomite 1718 2800 1.228-2.407 11.11
Dolomite 1303 2800 1.132-2.01 9.67
69

Table 2
Comparison of critical fluidization velocity with experimental results in absolute error (%)
Materials Composition
(weight %)
Hs(m) α (deg) Uc(exp.),m/s
Uc(predicted value),m/s
absolute
error (%)
0.096 4.61 1.84 2.139 16.25 0.11 4.61 1.84 2.139 16.25
GB1+GB2
50+50 0.121 4.61 1.84 2.139 16.25 0.072 4.61 1.23 1.31 6.50 0.103 4.61 1.23 1.31 6.50
S1+S2
0.131 4.61 1.23 1.31 6.50 0.105 7.47 2.41 2.578 6.97 0.125 7.47 2.41 2.578 6.97
GB1+GB2
50+50
0.143 7.47 2.41 2.578 6.97 0.098 7.47 1.604 1.579 1.56 0.116 7.47 1.604 1.579 1.56
S1+S2
50+50 0.132 7.47 1.604 1.579 1.56
0.11 9.52 1.981 2.126 7.32 0.125 9.52 1.981 2.126 7.32
GB1+GB2
50+50
0.14 9.52 1.981 2.126 7.32 0.105 9.52 1.132 1.302 15.02 0.135 9.52 1.132 1.302 15.02
S1+S2
50+50 0.16 9.52 1.132 1.302 15.02
0.06 4.61 1.84 1.716 6.74 0.09 4.61 1.84 1.716 6.74
50+50
0.118 4.61 1.84 1.716 6.74 0.086 7.47 2.41 2.068 14.19 0.107 7.47 2.41 2.068 14.19
50+50
0.126 7.47 2.41 2.068 14.19 0.095 9.52 1.981 1.705 13.93 0.123 9.52 1.981 1.705 13.93
GB1+S1
50+50
0.141 9.52 1.981 1.705 13.93
70

Table 3
Comparison of maximum pressure drop with experimental results in absolute error (%)
Materials Composition (weight
%)
Hs(m) α (deg) ∆ Pmax (exp.),P
a
∆ Pmax (predicted value),Pa
absolute error (%)
0.096 4.61 1515.26 1650.42 8.92 0.11 4.61 1905.79 1831.89 3.88
GB1+GB2
50+50
0.121 4.61 2108.86 1970.69 6.55 0.072 4.61 570.18 539.80 5.33 0.103 4.61 593.6 710.23 19.65
S1+S2
50+50
0.131 4.61 796.68 853.94 7.19 0.105 7.47 2015.14 2063.18 2.38 0.125 7.47 2671.23 2358.10 11.72
GB1+GB2
50+50
0.143 7.47 2874.44 2614.17 9.05 0.098 7.47 843.54 797.92 5.41 0.116 7.47 890.41 907.49 1.92
S1+S2
50+50
0.132 7.47 1312.18 1002.49 23.60 0.11 9.52 2725.24 2439.66 10.48 0.125 9.52 2872.44 2690.75 6.33
GB1+GB2
50+50
0.14 9.52 3025.32 2934.87 2.99 0.105 9.52 908.73 959.91 5.63 0.135 9.52 1112.35 1163.77 4.62
S1+S2
50+50
0.16 9.52 1350.87 1325.59 1.87 0.06 4.61 656.09 707.86 7.89 0.09 4.61 952.89 965.79 1.35 0.118 4.61 1030.99 1189.59 15.38 0.086 7.47 1077.86 1088.62 0.99 0.107 7.47 1405.15 1287.02 8.41 0.126 7.47 1437.15 1458.76 1.50 0.095 9.52 1015.38 1340.63 32.03 0.123 9.52 1351.23 1634.08 20.93
GB1+S1
50+50
0.141 9.52 1890.17 1814.37 4.01
71

Table 4
Comparison of critical fluidization velocity with experimental results in absolute error (%)
materials composition (weight %)
Hs(m) α (deg) Uc(exp) Uc(predicted value)
absolute error (%)
0.095 4.61 0.921 0.897 2.61 0.13 4.61 0.921 0.897 2.61
C1+C2
50+50
0.16 4.61 0.921 0.897 2.61 0.083 4.61 1.54 1.581 2.66 0.096 4.61 1.54 1.581 2.66
I1+I2
50+50
0.105 4.61 1.54 1.581 2.66 0.08 4.61 1.23 1.338 8.78 0.095 4.61 1.23 1.338 8.78
D1+D2
50+50
0.107 4.61 1.23 1.338 8.78 0.127 7.47 1.203 1.213 0.83 0.152 7.47 1.203 1.213 0.83
C1+C2
50+50
0.17 7.47 1.203 1.213 0.83 0.104 7.47 2.41 2.138 11.29 0.112 7.47 2.41 2.138 11.29
I1+I2
50+50
0.118 7.47 2.41 2.138 11.29 0.11 7.47 1.604 1.809 12.78 0.122 7.47 1.604 1.809 12.78
D1+D2
50+50
0.129 7.47 1.604 1.809 12.78 0.13 9.52 1.132 0.967 14.58 0.161 9.52 1.132 0.967 14.58
C1+C2
50+50
0.185 9.52 1.132 0.967 14.58 0.090 9.52 1.698 1.705 0.41 0.095 9.52 1.698 1.705 0.41
I1+I2
50+50
0.105 9.52 1.698 1.705 0.41 0.11 9.52 1.415 1.443 1.98 0.13 9.52 1.415 1.443 1.98
D1+D2
50+50
0.142 9.52 1.415 1.443 1.98
72

Table 5
Comparison of maximum pressure drop with experimental results in absolute error (%)
materials Composition (weight
%)
Hs(m) α (deg) ∆ Pmax (exp)
∆ Pmax (predicted
value)
absolute error (%)
0.095 4.61 546.74 602.43 10.18 0.13 4.61 702.95 767.65 9.2
C1+C2
50+50
0.16 4.61 874.79 901.24 3.02 0.083 4.61 2308.58 2241.02 2.93 0.096 4.61 2506.32 2507.69 0.05
I1+I2
50+50
0.105 4.61 2745.25 2687.49 2.10 0.08 4.61 1124.73 1221.45 8.59 0.095 4.61 1437.15 1394.91 2.94
D1+D2
50+50
0.107 4.61 1780.82 1529.19 14.13 0.127 7.47 718.58 843.89 17.44 0.152 7.47 874.79 969.58 10.84
C1+C2
50+50
0.17 7.47 1132.54 1057.16 6.65 0.104 7.47 2765.54 2986.02 7.97 0.112 7.47 2896.51 3161.99 9.17
I1+I2
50+50
0.118 7.47 3075.42 3292.11 7.05 0.11 7.47 1905.79 1748.64 8.25 0.122 7.47 1976.08 1894.29 4.14
D1+D2
50+50
0.129 7.47 2147.92 1977.73 7.92 0.13 9.52 921.65 959.05 4.06 0.161 9.52 1062.24 1131.39 6.51
C1+C2
50+50
0.185 9.52 1195.02 1259.63 5.41 0.090 9.52 2865.12 2980.57 4.03 0.095 9.52 2958.54 3107.73 5.04
I1+I2
50+50
0.105 9.52 3125.28 3357.59 7.43 0.11 9.52 1968.27 1951.75 0.84 0.13 9.52 2530.63 2220.67 12.25
D1+D2
50+50
0.142 9.52 3030.51 2377.46 21.55
73

REFERENCES
[1] Y.Peng, L.T.Fan, Hydrodynamic characteristics of fluidization in liquid-solid tapered beds,
Chemical Engineering Science 52 (14) (1997) 2277 – 2290.
[2] M. Olazar, M.J. San Jose, A.T.J. Aguayo, M. Arandes, J.Bilbao, Ind. Eng. Chem. Res. 31
(1992) 1784–1792.
[3]M.Olazer, M.J.San Jose, A.T.Aguayo, J.M.Arandes, J.Bilbao, Pressure drop in conical
spouted beds, The Chemical Engineering Journal 51 (1993) 53 – 60.
[4] N.I. Gelperin, E.N. Einstein, E.N. Gelperin, S.D. Lvova, Khim.I Tekin. Topl. I Masel. 5 (8)
(1960) 51.
[5] Y. Nishi, Kagaku kogaku Ronbunshu 5 (1979) 202–204.
[6] M. Kwauk, Fluidization 1993 91–100, Science and Press, NewYork.
[7] Y.F. Shi, Y.S. Yu, L.T. Fan, Incipient fluidization condition for a tapered fluidized bed, Ind.
Eng. Chem. Fundam. 23 (1984) 484–489.
[8] K.C. Biswal, T. Bhowmik, G.K. Roy, Prediction of minimum fluidization velocity for gas–
solid fluidization of regular particles in conical vessels, Chem. Eng. J. 30 (1985) 57–62.
[9] K.C. Biswal, T. Bhowmik, G.K. Roy, Prediction of pressure drop for a conical fixed bed of
spherical particles in gas–solid systems, Chem. Eng. J. 29 (1984) 47–50.
[10] A.E. Gorshtein, I.P. Mukhlenov, Hydraulic resistance of a fluidized bed in a cyclone
without a grate. II. Critical gas rate corresponding to the beginning of a jet formation, Zh. Prikl.
Khim. (Leningrad) 37 (1964) 1887–1893.
[11] S. Jing, Q. Hu, J.Wang, Y. Jin, Fluidization of coarse particles in gas–solid conical beds,
Chem. Eng. Process. 39 (2000) 379–387.
12] J. Shan, C. Guobin, M.Fan, B.Yu, W. Jingfu, J. Yong, Fluidization of fine particles in conical
beds, Powder Technology 118 (2001) 271 – 274.
[13]F.Depypere, J.G.Pieters, K.Dewettinck, Expanded bed height determination in a tapered
fluidized bed reactor, Journal of Food Engineering 67 (2005) 353 – 359.
[14] H.G.Kim, I.O.Lee, U.C.Chung and Y.H.Kim, Fluidization characteristics of iron ore fines of
wide size distribution in a cold tapered gas-solid fluidized bed, ISIJ International 40(2000)16-22.
[15] S.Chiba,T.Chiba,A.W.Nienow and H.Kobayashi, The critical fluidization velocity, bed
expansion and pressure-drop profiles of binary particle mixtures, Powder
Technology,22(1979)255-269.
74

[16] K.Noda, S.Uchida, T.Makino and H.Kamo, Critical fluidization velocity of binary particles
with large size ratio, Powder Technology, 46(1986) 149-154.
[17] D.Bai, Y.Masuda, N.Nakagawa and K.Kato, Hydrodynamic behavior of a binary solids
fluidized bed, Journal of Chemical Engineering of Japan, 29(1996) 211-216.
[18] V.Thonglimp, N.Hiquily and C.Laguerie, Vitesse minimale de fluidization et expansion des
couches de mélanges de particules solids fluidisees par un gaz, Powder Technology 39(1984)
223-239.
[19] J.Rincon, J.Guardiola, A.Romero and G.Ramos, Predicting the critical fluidization velocity
of multicomponent systems, Journal of Chemical Engineering of Japan, 27(1994)177-181.
[20] R.Deiva Venkatesh, J.Chaouki, D.Klvana, Fluidization of cryogel in a conical column,
Powder technology 89(1996) 179-186.
[21] M.Olazer,R.Aguado,M.J.San Jose,S.Alvarez,J.Bilbao, Critical spouting velocity for the
pyrolysis of scrap tyres with sand in conical beds, Powder Technology,165(2006) 128-132.
[22] J.Li, B.Yang, G.Cheng, Affinity adsorption and hydrodynamic behavior in a tapered-bed of
upward flow, Biochemical Engineering Journal 15(2003) 185-192.
[23] W.R.A.Goossens, G.L.Dumont, G.L., Spaepen, Fluidization of binary mixtures in the
laminar flow region, Chem.Eng.Prog.Symp.Ser. 67(1971) 38-45.
[24] D.S.Povrenovic, D.E.Hadzismajlovic, Z.B.Grbavcic, D.V.Vukovic, Critical fluid flow rate,
pressure drop and stability of a conical spouted Bed, The Canadian Journal of Chemical
Engineering 70 (1992) 216 – 222.
[25] G.R.Caicedo, M.G.Ruiz, J.J.P.Marques, J.G.Soler, Critical fluidization velocities for gas-
solid 2D beds, Chemical Engineering and Processing 41 (2002) 761 – 764.
[26] Babu, S. P., Leipsiger, S., Lee, B. S., Weil, S. A. (1973), ‘Solids mixing in batch operated
tapered bed and non- tapered gas fluidized beds’. Fluidized Bed Fundam. Appl. AIChE
Symp.Ser.69, 49-57.
[27] Biswal K.C., Sahu, S., Roy, G. K. (1982), ‘Prediction of fluctuation ratio for gas solid
fluidization of regular particles in conical vessels’, The Chemical Engineering Journal, 23, 97-
100.
[28] Biswal.K.C, Samal, B. B., Roy, G. K. (1984), ‘Dynamics of gas-solid fluidization of
regular particles in conical vessels’, The Journal the IE (India), Vol. 65, CH-1, 15 -17.
75

[29] Biswal K.C. and Roy, G. K. (1985), ‘Prediction of fluctuation ratio for gas-solid
fluidizations of irregular particles in conical vessels’. The Journal of the IE (India), Vol. 65, CH-
2, 57-62.
[30] Hsu H. W., (1978), ‘Characteristics of tapered fluidized reactors; two–phase systems’.
Biotechnology Bioengineers’ Symposium, 8, 1 – 11.
[31] Koloini T. and Farkas E. J. (1973), ‘Fixed bed pressure drops a liquid fluidization in
tapered or conical vessels’. Canadian Journal of Chemical Engineering, 51, 499-502.
[32] Maruyama T.and Koyanagi T (1993). ‘Fluidization in tapered vessels’. The Chemical
Engineering Journal.51, 121-128.
[33] C.D. Scott, C.W. Hancher, Use of a tapered fluidized bed as a continuous bioreactor,
Biotechnol. Bioeng. 18 (1976) 1393–1403.
[34] K. Ridgway, The tapered fluidized bed—a new processing tool, Chem. Process. Eng. 6
(1965) 317–321.
[35] S.P. Babu, S. Leipsiger, B.S. Lee, S.A.Weil, Solids mixing in batch operated tapered bed
and non-tapered gas fluidized beds, Fluidized Bed Fundam.Appl. AIChE, Symp. Ser. 69 (1973)
49–57.
[36] T. Maruyama, H. Sato, Liquid fluidization in conical vessels, Chem. Eng.J. 46 (1991) 15–
21.
[37] T. Koloini, E.J. Farkas, Fixed bed pressure drop of a liquid fluidization in tapered or conical
vessels, Can. J. Chem. Eng. 51 (1973) 499–502.
[38] Y.F. Shi, Y.S. Yu, L.T. Fan, Incipient fluidization condition for a tapered fluidized bed,
Ind. Eng. Chem. Fundam. 23 (1984) 484–489.
[39] K.C. Biswal, T. Bhowmik, G.K. Roy, Prediction of minimum fluidization velocity for gas–
solid fluidization of regular particles in conical vessels, Chem. Eng. J. 30 (1985) 57–62.
[40] K.C. Biswal, T. Bhowmik, G.K. Roy, Prediction of pressure drop for a conical fixed bed of
spherical particles in gas–solid systems, Chem. Eng.
J. 29 (1984) 47–50.
[41] R.K. Singh, A. Suryanarayana, G.K. Roy, Prediction of minimum velocity and minimum
bed pressure drop for gas–solid fluidization in conical conduits, Can. J. Chem. Eng. 70 (1992)
185–189.
[42] J. Shan, C. Guobin, M. Fan, B. Yu,W. Jingfu, J. Yong, Fluidization of fine
particles in conical beds, Powder Technol. 118 (2001) 271–274.
76

[43] G. Narsimhan, On generalized expression for prediction of minimum fluidization velocity,
AIChE J. 11 (1965) 550–554.
[44] J. Li, B. Yang, G. Cheng, Affinity adsorption and hydrodynamic behavior in a tapered-bed
of upward flow, Biochem. Eng. J. 15 (2003) 185–192.
[45] D.S. Povrenovic, D.E. Hadzismajlovic, Z.B. Grbavcic, D.V. Vukovic, Minimum fluid flow
rate, pressure drop and stability of a conical spouted bed, Can. J. Chem. Eng. 70 (1992) 216–222.
[46] G.R. Caicedo, M.G. Ruiz, J.J.P. Marqu´es, J.G. Soler, Minimum fluidization velocities for
gas–solid 2D beds, Chem. Eng. Process. 41 (2002) 761–764.
[47] Fluent Inc.,”Fluent 6.1 UDF Manual”(2003a)
[48] Fluent Inc.,”Fluent 6.1 user guide”(2003b)
77


![Application of a Twin-plane Electrical Capacitance ... · hydrodynamic characteristics in gas-solids fluidized beds. Wang et al. [6] imaged gas bubble shape, length and coalescence](https://static.fdocuments.net/doc/165x107/5e812111a364ac5d941d8e74/application-of-a-twin-plane-electrical-capacitance-hydrodynamic-characteristics.jpg)