Hydro-chemical analysis and evaluation of groundwater ... · Hydro-chemical analysis and evaluation...
11
INTERNATIONAL JOURNAL OF ENVIRONMENTAL SCIENCES Volume 3, No 2, 2012 © Copyright by the authors - Licensee IPA- Under Creative Commons license 3.0 Research article ISSN 0976 – 4402 Received on August 2012 Published on September 2012 756 Hydro-chemical analysis and evaluation of groundwater quality for irrigation in Karnal district of Haryana state, India Vikas Tomar, Kamra S.K, Kumar S, Kumar Ajay, Vishal Khajuria Central Soil Salinity Research Institute, Karnal- 132001 (Haryana) [email protected] doi:10.6088/ijes.2012030132002 ABSTRACT Karnal district (Latitude: 29 0 25’05”- 29 0 59’20” N and Longitude: 76 0 27’40” - 77 0 13’08” E) falls in the north-east part of the Haryana State. The river Yamuna, which marks the eastern boundary of the Haryana State as well as Karnal district, provides the major drainage in the area. About 70% of the net irrigated area is covered through ground water, with rice- wheat being the major crop rotation. The district is characterized by semiarid climate and is a part of Indo- Gangetic alluvial plains which contribute a large share of food grains to national buffer stock. The overexploitation of hitherto fresh groundwater in the district is leading to not only alarming decline in watertable but also deterioration in quality in certain pockets. The current average water table depth in the district is about 20 m and deep submersible tubewells at 50- 100 m depth have replaced the centrifugal pumps in almost entire district. Water samples were collected from 67 locations during pre and post-monsoon seasons of the year 2011, and were subjected to analysis for chemical characteristics. The type of water that predominates in the study area was of sodium-calcium bicarbonate and magnesium bicarbonate type during pre and post-monsoon seasons of the year 2011 respectively, based on hydro-chemical facies. Based on chemical analysis, the pre and post monsoon water samples were classified as per different standard irrigation criteria to study the chemical changes resulting due to rain and natural recharge. Keywords: Groundwater, chemical characters, chemical classification, SAR, RSC, USSL diagram. 1. Introduction Water quality analysis is one of the most important aspects in groundwater studies. Determination of physico-chemical characteristics of water is essential for assessing the suitability of water for various purposes like drinking, domestic, industrial and irrigation. The groundwater quality may also vary with seasonal changes and is primarily governed by the extent and composition of dissolved solids. Water quality is influenced by natural and anthropogenic effects including local climate, geology and irrigation practices. A number of techniques and methods have been developed to interpret the chemical data. Zaporozee (1972) has summarized the various modes of data representation and has discussed their possible uses. Presentation of chemical analysis in graphical form makes understanding of complex groundwater system simpler and quicker. Methods of representing the chemistry of water like Collin’s bar diagram, radiating vectors of Maucha (1940), and parallel and horizontal axes of Stiff(1940), have been used in many parts of the world to show the proportion of ionic concentration in individual samples. Subramanian (1994) followed a series of methods to interpret and classify the chemistry of groundwater in hard rock, including coastal zones in the southern parts of India.
Transcript of Hydro-chemical analysis and evaluation of groundwater ... · Hydro-chemical analysis and evaluation...

INTERNATIONAL JOURNAL OF ENVIRONMENTAL SCIENCES Volume 3, No 2, 2012
© Copyright by the authors - Licensee IPA- Under Creative Commons license 3.0
Research article ISSN 0976 – 4402
Received on August 2012 Published on September 2012 756
Hydro-chemical analysis and evaluation of groundwater quality for
irrigation in Karnal district of Haryana state, India Vikas Tomar, Kamra S.K, Kumar S, Kumar Ajay, Vishal Khajuria
Central Soil Salinity Research Institute, Karnal- 132001 (Haryana)
doi:10.6088/ijes.2012030132002
ABSTRACT
Karnal district (Latitude: 29025’05”- 29
059’20” N and Longitude: 76
027’40” - 77
013’08” E)
falls in the north-east part of the Haryana State. The river Yamuna, which marks the eastern
boundary of the Haryana State as well as Karnal district, provides the major drainage in the
area. About 70% of the net irrigated area is covered through ground water, with rice- wheat
being the major crop rotation. The district is characterized by semiarid climate and is a part of
Indo- Gangetic alluvial plains which contribute a large share of food grains to national buffer
stock. The overexploitation of hitherto fresh groundwater in the district is leading to not only
alarming decline in watertable but also deterioration in quality in certain pockets. The current
average water table depth in the district is about 20 m and deep submersible tubewells at 50-
100 m depth have replaced the centrifugal pumps in almost entire district. Water samples
were collected from 67 locations during pre and post-monsoon seasons of the year 2011, and
were subjected to analysis for chemical characteristics. The type of water that predominates
in the study area was of sodium-calcium bicarbonate and magnesium bicarbonate type during
pre and post-monsoon seasons of the year 2011 respectively, based on hydro-chemical facies.
Based on chemical analysis, the pre and post monsoon water samples were classified as per
different standard irrigation criteria to study the chemical changes resulting due to rain and
natural recharge.
Keywords: Groundwater, chemical characters, chemical classification, SAR, RSC, USSL
diagram.
1. Introduction
Water quality analysis is one of the most important aspects in groundwater studies.
Determination of physico-chemical characteristics of water is essential for assessing the
suitability of water for various purposes like drinking, domestic, industrial and irrigation. The
groundwater quality may also vary with seasonal changes and is primarily governed by the
extent and composition of dissolved solids. Water quality is influenced by natural and
anthropogenic effects including local climate, geology and irrigation practices. A number of
techniques and methods have been developed to interpret the chemical data. Zaporozee
(1972) has summarized the various modes of data representation and has discussed their
possible uses. Presentation of chemical analysis in graphical form makes understanding of
complex groundwater system simpler and quicker. Methods of representing the chemistry of
water like Collin’s bar diagram, radiating vectors of Maucha (1940), and parallel and
horizontal axes of Stiff(1940), have been used in many parts of the world to show the
proportion of ionic concentration in individual samples. Subramanian (1994) followed a
series of methods to interpret and classify the chemistry of groundwater in hard rock,
including coastal zones in the southern parts of India.

Hydro-chemical analysis and evaluation of groundwater quality for irrigation in Karnal district of Haryana
state, India
Vikas Tomar, Kamra. S.K, Kumar. S, Kumar Ajay, Khajuria Vishal International Journal of Environmental Sciences Volume 3 No.2, 2012
757
In India about 50 per cent of the total cultivated area under irrigation is dependent upon
groundwater and of this, about sixty per cent of irrigated food production depends on
groundwater wells (Shah et al., 2000; CWC, 2000). In the present study, the area, i.e. Karnal
District of Haryana state also uses mostly groundwater through shallow tube wells. Ground
water contributes 95 % of the total need for agriculture. CGWB (2007) reported that chemical
analysis of water samples from shallow aquifers indicates that ground water is alkaline in
nature and is moderately saline. The ground water is mixed Cation-HCO3 type. The stage of
ground water development for the district is 137% and all the six blocks fall in over-exploited
categories. That means that the ground water is under stress and the ground water level is
declining. There is no scope for further ground water development. Only measures should be
taken to reduce on the dependence on ground water and to enhance the ground water
resources. Though some discrete, hydro chemical data are available for the region,
comprehensive seasonal variation of groundwater quality has never been studied so far. In
this paper an attempt has been made to study the affect of monsoon on groundwater quality
for irrigation.
2. Materials and method
2.1 Study area
Karnal is located in the northwestern corner of Haryana state between North latitudes
29025’05” and 29
059’20” and East longitudes 76
027’40” and 77
013’08” covering an area of
2520 sq.km. The district covers 5.69% area of the state. The district is one of the most
densely populated districts of the state. The total population of the district as per 2001 census
is 12, 74,183. The population density is 506 persons per sq.km against the State average of
478 persons per sq.km. The district falls in the Upper Yamuna Basin. The river Yamuna
which marks the eastern boundary of the Haryana State as well as Karnal district provides the
major drainage in the area. Irrigation in the district is done by surface water as well as ground
water. 70% of the net irrigated area is covered through ground water
Figure 1: Study area
2.2 Collection of water samples
Groundwater samples were collected from 67 tubewells located in different parts of the
district during pre-monsoon (May/June 2011) and post-monsoon (October/November 2011)
period. The collected water samples were transferred into precleaned polythene container for

Hydro-chemical analysis and evaluation of groundwater quality for irrigation in Karnal district of Haryana
state, India
Vikas Tomar, Kamra. S.K, Kumar. S, Kumar Ajay, Khajuria Vishal International Journal of Environmental Sciences Volume 3 No.2, 2012
758
analysis of chemical characters. Chemical analyses were carried out using the standard
procedures (APHA-2002). Each of ground water samples were analyzed for pH, electrical
conductivity (EC), major cations and major anions. Among variable parameters, pH and EC
were measured immediately by using portable meters (Eutech, ECTestr11+). Total hardness
and calcium were determined by ethylenediaminetetraacetic acid titimetric method.
Magnesium was estimated as difference in Total Hardness and Calcium. Total alkalinity,
carbonate and bicarbonate and chloride were estimated by using titimetric method. Sodium
and Potassium were estimated by flame photometer.Sulphate was estimated by gravimetric
method. Total dissolved solids, RSC, % Sodium, SAR were determined by calculation. The
analytical data was used to classify the utilitarian purpose of water and for ascertaining
various factors on which the chemical characteristics of water depend. In this paper Piper,
Back and Hanshaw, Wilcox, Eaton, Todd and USSL (US Salinity Laboratory) classification
have been used to characterize the hydrochemical characteristics of groundwater of Karnal
District.
Figure 2: Sampling location Map
2.3 Piper diagram
The Piper-Hill diagram (1953) is used to infer hydro-geochemical facies. These plots include
two triangles, one for plotting cations and the other for plotting anions (figure 3). The cations
and anion fields are combined to show a single point in a diamond-shaped field, from which
inference is drawn on the basis of hydro-geochemical facies concept. These tri-linear
diagrams are useful in bringing out chemical relationships among groundwater samples in
more definite terms rather than with other possible plotting methods. Chemical data of
representative samples from the study area is presented by plotting them on a Piper-tri-linear
diagram for pre-and post-monsoon (figures 4 and 5).These diagrams reveal the analogies,
dissimilarities and different types of waters in the study area. The concept of hydrochemical
facies was developed to understand and identify the water composition in different classes.
Facies are recognizable parts of different characters belonging to any genetically related
system. Hydrochemical facies are distinct zones that possess action and anion concentration
categories. To define composition class, Back and co-workers (1965) suggested subdivisions
of the tri-linear diagram (figure 3). The interpretation of distinct facies from the 0 to 10% and

Hydro-chemical analysis and evaluation of groundwater quality for irrigation in Karnal district of Haryana
state, India
Vikas Tomar, Kamra. S.K, Kumar. S, Kumar Ajay, Khajuria Vishal International Journal of Environmental Sciences Volume 3 No.2, 2012
759
90 to 100% domains on the diamond shaped cation to anion graph is more helpful than using
equal 25% increments. It clearly explains the variations or domination of cation and anion
concentrations during pre-monsoon and post-monsoon.
Legend
A- Calcium type,B-No Dominant type,C- Magnesium type,D- Sodium and potassium
type,E- Bicarbonate type,F- Sulphate type,G- Chloride type
Figure 3: Classification diagram for anion and cation facies in the form of major-ion
percentages (Piper, 1953; Back and Hanshaw, 1965; Sadashivaiah et al., 2008)
Wilcox (1995) classified groundwater for irrigation purposes based on per cent sodium and
Electrical conductivity. Eaton (1950) recommended the concentration of residual sodium
carbonate to determine the suitability of water for irrigation purposes. The US Salinity
Laboratory of the Department of Agriculture adopted certain techniques based on which the
suitability of water for agriculture is explained. The sodium in irrigation waters is usually
denoted as per cent sodium and can be determined using the following formula.
% Na = (Na+) X 100/ (Ca
2+ + Mg
2+ + Na
+ + K
+)
Where the quantities of Ca2+
Mg2+
Na+ and K
+ are expressed in milliequivalents per litre
(meq/l). In waters having high concentration of bicarbonate, there is tendency for calcium
and magnesium to precipitate as the water in the soil becomes more concentrated. As a result,
the relative proportion of sodium in the water is increased in the form of sodium carbonate.
RSC is calculated using the following equation.

Hydro-chemical analysis and evaluation of groundwater quality for irrigation in Karnal district of Haryana
state, India
Vikas Tomar, Kamra. S.K, Kumar. S, Kumar Ajay, Khajuria Vishal International Journal of Environmental Sciences Volume 3 No.2, 2012
760
RSC = (HCO3- + CO3
2-) – (Ca
2+ + Mg
2+)
Where all ionic concentrations are expressed in equivalent per mole
According to the US Department of Agriculture, water having more than 2.5 epm of RSC is
not suitable for irrigation purposes.
The most important characteristics of irrigation water in determining its quality are: (i) Total
concentration of soluble salts; ii) Relative proportion of sodium to other principal cations;
(iii) Concentration of boron or other element that may be toxic, and (iv) Under some
condition, bicarbonate concentration as related to the concentration of calcium plus
magnesium. These have been termed as the salinity hazard, sodium hazard, boron hazard and
bicarbonate hazard. In the past, the sodium hazard has been expressed as per cent sodium of
total cations. A better measure of the sodium hazard for irrigation is the SAR which is used to
express reactions with the soil.
SAR is computed as
Where all ionic concentrations are expressed in equivalent per mole.
For the purpose of diagnosis and classification, the total concentration of soluble salts
(salinity hazard) in irrigation water can be expressed in terms of specific
conductance.Thematic maps of Electrical Conductivity (EC) and Residual Sodium Carbonate
(RSC) were created for both Pre-monsoon and Post-monsoon seasons using Arc GIS 10.0
software.
3. Results and discussion
Piper diagrams are an example of water quality diagrams which are probably the most
frequently used today. The subdivisions of the trilinear or piper diagram depict that Na-Ca-
HCO3 type of water was dominated during pre-monsoon. The percentage of samples falling
under NaCa-HCO3 type of water was 45% in pre-monsoon season(Table 1). Mg-HCO3 type
of water was predominated during post-monsoon with 57% water samples. For anion
concentration, HCO3-type of water was predominated in pre-monsoon with 83.6% samples
while in post monsoon season 94% samples were of HCO3–type water. The appreciable
change in the hydro-chemical facies was noticed during the study period (pre- and post-
monsoon), which was might be due to the leaching of alkali salts through
precipitation.Thussu (2004) reported that in Karnal, the water in general is Ca-Mg- HCO3
type. The changes in chemical composition have taken place along the present day palaeo-
bank of Yamuna river and Chautang nala. Primary saline water with conspicuous primary
salinity occurs at Jalmana, while the water with secondary salinity occurs at Kinana. Changes
have taken place in the waters, which were CaMg HCO3 to Na-Ca-HCO3 type at Assand, and
to NaHCO3 at Nisang; NaHCO3 to mixed to NaCI at Munak and mixed to CaMgHCO3 at
Shahpur. The geology of Karnal district is alluvium in nature having appreciable content of
sand in underground layers and water is generally found in the sandy zone.

Hydro-chemical analysis and evaluation of groundwater quality for irrigation in Karnal district of Haryana
state, India
Vikas Tomar, Kamra. S.K, Kumar. S, Kumar Ajay, Khajuria Vishal International Journal of Environmental Sciences Volume 3 No.2, 2012
761
Table 1: Characterization of groundwater of Karnal District of Haryana on the basis of Piper
tri-linear diagram
Subdivision of
the diamond
Characteristics of corresponding
subdivisions of diamond-shaped
fields
Percentage of samples
in this category
Pre-Monsoon Post-Monsoon
1 Alkaline earth (Ca+Mg) Exceed
alkalies (Na+K)
37.3 58.2
2 Alaklies exceeds alkaline earths 62.7 41.8
3 Weak acids (C03+HCO3) exceed
Strong acids (SO4+Cl)
83.6 91
4 Strong acids exceeds weak acids 16.4 9
5 Magnesium bicarbonate type 40.3 56.7
6 Calcium-chloride Type - -
7 Sodium-chloride Type 13.4 6
8 Sodium-Bicarbonate Type 1.5 1.5
9 Sodium calcium-Bicarbonate type 44.8 35.8
10 Calcium Magnesium-Chloride Type - -
Figure 4: Post-monsoon Groundwater Samples Plotted in Piper-Trilinear diagram

Hydro-chemical analysis and evaluation of groundwater quality for irrigation in Karnal district of Haryana
state, India
Vikas Tomar, Kamra. S.K, Kumar. S, Kumar Ajay, Khajuria Vishal International Journal of Environmental Sciences Volume 3 No.2, 2012
762
Figure 5: Pre-monsoon Groundwater Samples Plotted in Piper-Trilinear diagram
The classification of groundwater samples with respect to per cent sodium is shown in Table
2. It is observed that about 89.6% of samples fall under permissible to doubtful category
during premonsoon while 85.1% samples are reported in this category during post- monsoon.
Similarly, 7.5% and 4.5% samples fall under unsuitable category during pre and post
monsoon season respectively.
Table 2: Sodium percent water class
Sodium (%) Water class Pre-monsoon Samples Post-monsoon samples
<20 Excellent - -
20-40 Good 38.98-39.17 (2 samples) 21.54-38.89 (7 samples)
40-60 Permissible 40.32-59.22 (35 samples) 40.55-59.80 (42 samples)
60-80 Doubtful 60.16-77.50 (25 samples) 61.55-76.66 (15 samples)
>80 Unsuitable 81.83-88.07 (5 samples) 80.37-87.18 ( 3 samples)
Groundwater of the study area is classified on the basis of RSC and the results are presented
in Table 3 for both pre- and post-monsoon seasons. Based on RSC values, water can be
classified as good (<1.25mEq/l), marginally suitable (1.25-2.5mEq/l), and unsuitable
(>2.5mEq/l).During Pre monsoon season it is observed that 13.4% samples are of good
quality,19.4 % of samples are of marginal suitable and 67% samples are unsuitable for
irrigation use.
Table 3: Groundwater quality based on RSC (Residual sodium carbonate)
RSC (epm) Remark on quality Pre-monsoon samples Post-monsoon samples
<1.25 Good 0.01-1.04 (9 samples) 0.01-1.22 (18
samples)
1.25-2.5 Doubtful 1.53-2.48 (13samples) 1.40-2.43 (23 samples)
>2.5 Unsuitable 2.52-6.92 (45samples) 2.59-7.35 (26 samples)
Hydro-chemical analysis and evaluation of groundwater quality for irrigation in Karnal district of Haryana
state, India
Vikas Tomar, Kamra. S.K, Kumar. S, Kumar Ajay, Khajuria Vishal International Journal of Environmental Sciences Volume 3 No.2, 2012
763
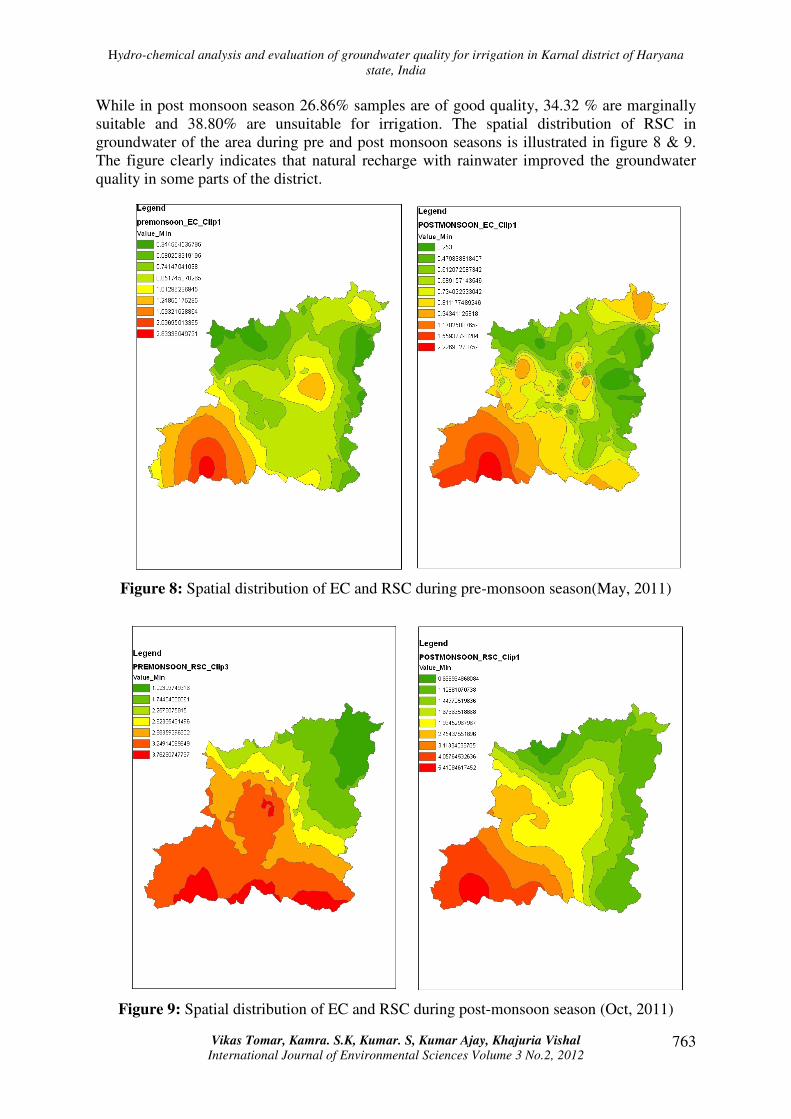
While in post monsoon season 26.86% samples are of good quality, 34.32 % are marginally
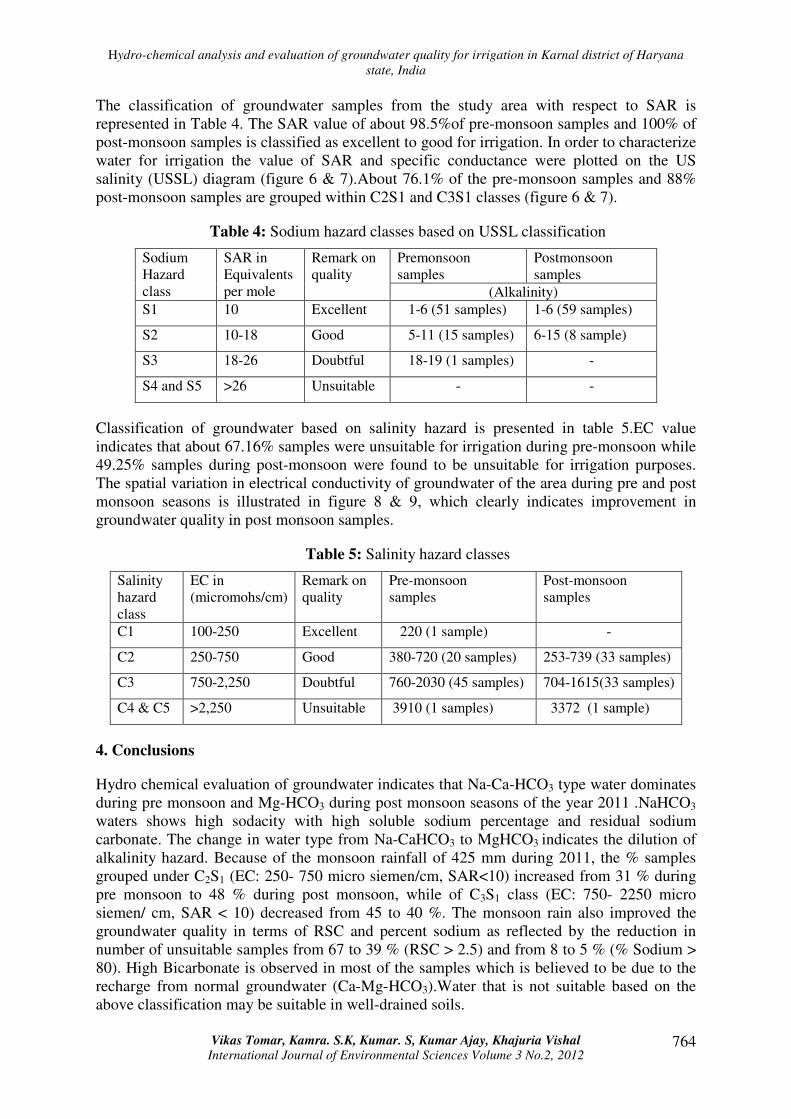
suitable and 38.80% are unsuitable for irrigation. The spatial distribution of RSC in
groundwater of the area during pre and post monsoon seasons is illustrated in figure 8 & 9.
The figure clearly indicates that natural recharge with rainwater improved the groundwater
quality in some parts of the district.
Figure 8: Spatial distribution of EC and RSC during pre-monsoon season(May, 2011)
Figure 9: Spatial distribution of EC and RSC during post-monsoon season (Oct, 2011)
Hydro-chemical analysis and evaluation of groundwater quality for irrigation in Karnal district of Haryana
state, India
Vikas Tomar, Kamra. S.K, Kumar. S, Kumar Ajay, Khajuria Vishal International Journal of Environmental Sciences Volume 3 No.2, 2012
764
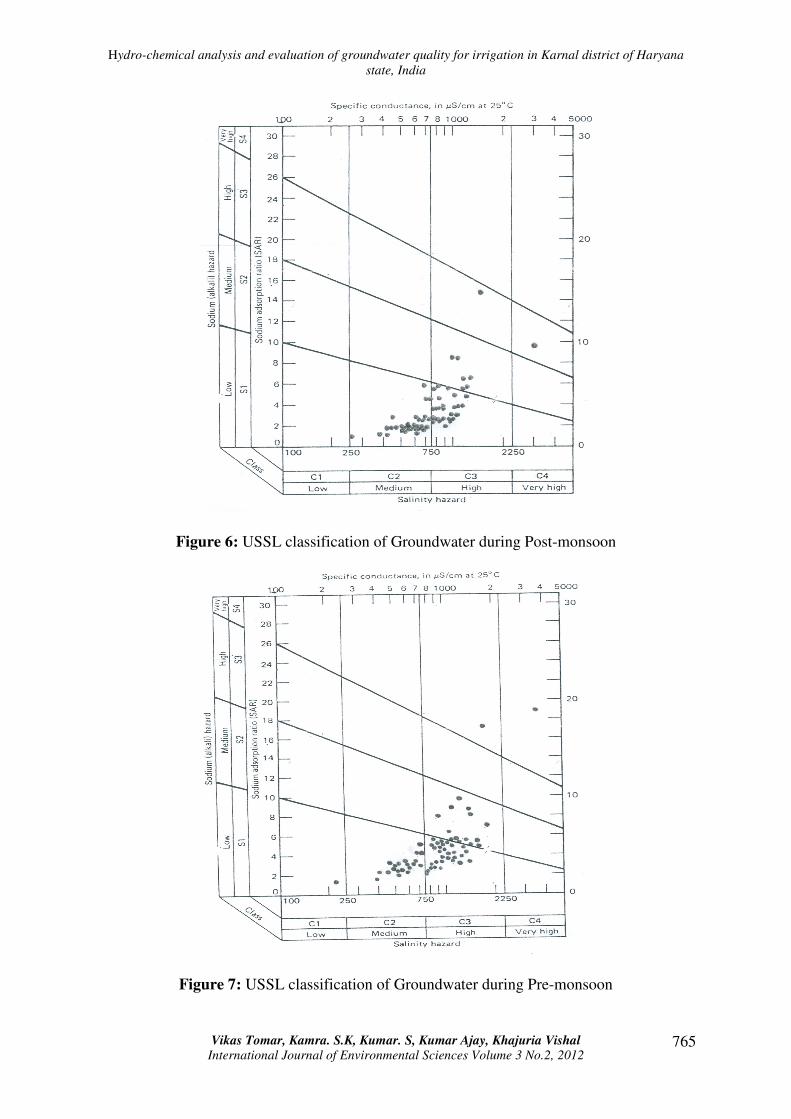
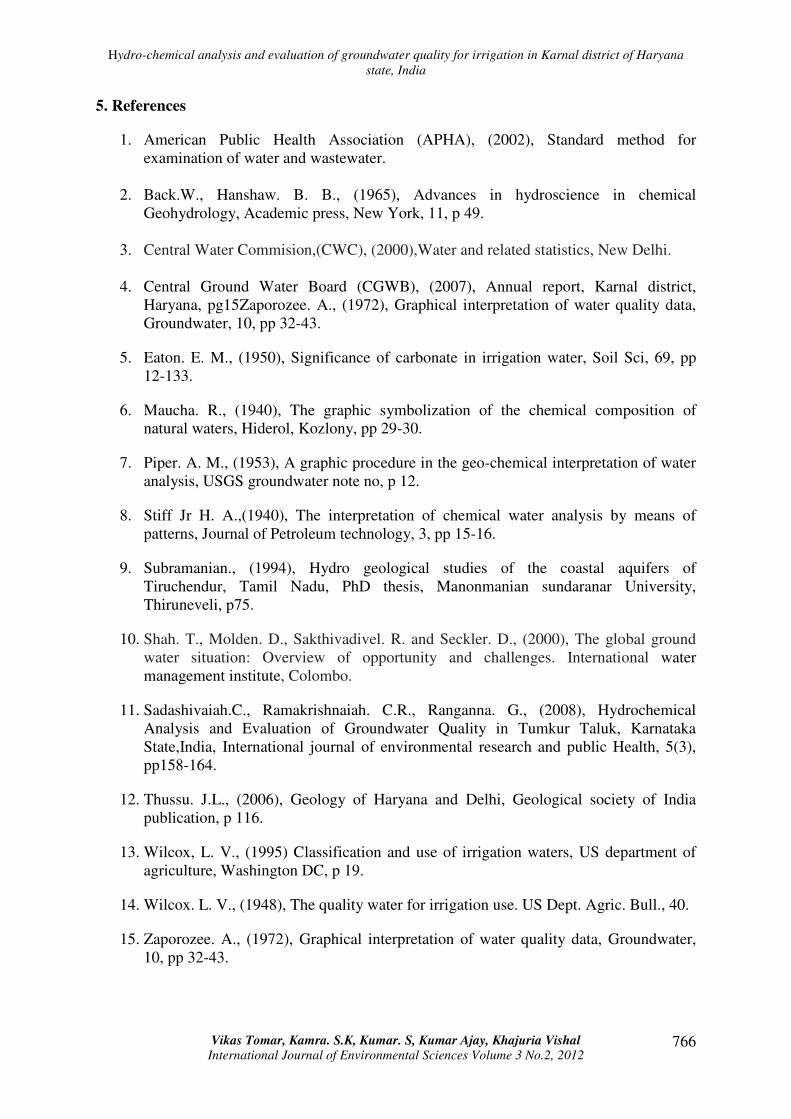
The classification of groundwater samples from the study area with respect to SAR is
represented in Table 4. The SAR value of about 98.5%of pre-monsoon samples and 100% of
post-monsoon samples is classified as excellent to good for irrigation. In order to characterize
water for irrigation the value of SAR and specific conductance were plotted on the US
salinity (USSL) diagram (figure 6 & 7).About 76.1% of the pre-monsoon samples and 88%
post-monsoon samples are grouped within C2S1 and C3S1 classes (figure 6 & 7).
Table 4: Sodium hazard classes based on USSL classification
Sodium
Hazard
class
SAR in
Equivalents
per mole
Remark on
quality
Premonsoon
samples
Postmonsoon
samples
(Alkalinity)
S1 10 Excellent 1-6 (51 samples) 1-6 (59 samples)
S2 10-18 Good 5-11 (15 samples) 6-15 (8 sample)
S3 18-26 Doubtful 18-19 (1 samples) -
S4 and S5 >26 Unsuitable - -
Classification of groundwater based on salinity hazard is presented in table 5.EC value
indicates that about 67.16% samples were unsuitable for irrigation during pre-monsoon while
49.25% samples during post-monsoon were found to be unsuitable for irrigation purposes.
The spatial variation in electrical conductivity of groundwater of the area during pre and post
monsoon seasons is illustrated in figure 8 & 9, which clearly indicates improvement in
groundwater quality in post monsoon samples.
Table 5: Salinity hazard classes
Salinity
hazard
class
EC in
(micromohs/cm)
Remark on
quality
Pre-monsoon
samples
Post-monsoon
samples
C1 100-250 Excellent 220 (1 sample) -
C2 250-750 Good 380-720 (20 samples) 253-739 (33 samples)
C3 750-2,250 Doubtful 760-2030 (45 samples) 704-1615(33 samples)
C4 & C5 >2,250 Unsuitable 3910 (1 samples) 3372 (1 sample)
4. Conclusions
Hydro chemical evaluation of groundwater indicates that Na-Ca-HCO3 type water dominates
during pre monsoon and Mg-HCO3 during post monsoon seasons of the year 2011 .NaHCO3
waters shows high sodacity with high soluble sodium percentage and residual sodium
carbonate. The change in water type from Na-CaHCO3 to MgHCO3 indicates the dilution of
alkalinity hazard. Because of the monsoon rainfall of 425 mm during 2011, the % samples
grouped under C2S1 (EC: 250- 750 micro siemen/cm, SAR<10) increased from 31 % during
pre monsoon to 48 % during post monsoon, while of C3S1 class (EC: 750- 2250 micro
siemen/ cm, SAR < 10) decreased from 45 to 40 %. The monsoon rain also improved the
groundwater quality in terms of RSC and percent sodium as reflected by the reduction in
number of unsuitable samples from 67 to 39 % (RSC > 2.5) and from 8 to 5 % (% Sodium >
80). High Bicarbonate is observed in most of the samples which is believed to be due to the
recharge from normal groundwater (Ca-Mg-HCO3).Water that is not suitable based on the
above classification may be suitable in well-drained soils.
Hydro-chemical analysis and evaluation of groundwater quality for irrigation in Karnal district of Haryana
state, India
Vikas Tomar, Kamra. S.K, Kumar. S, Kumar Ajay, Khajuria Vishal International Journal of Environmental Sciences Volume 3 No.2, 2012
765
Figure 6: USSL classification of Groundwater during Post-monsoon
Figure 7: USSL classification of Groundwater during Pre-monsoon
Hydro-chemical analysis and evaluation of groundwater quality for irrigation in Karnal district of Haryana
state, India
Vikas Tomar, Kamra. S.K, Kumar. S, Kumar Ajay, Khajuria Vishal International Journal of Environmental Sciences Volume 3 No.2, 2012
766
5. References
1. American Public Health Association (APHA), (2002), Standard method for
examination of water and wastewater.
2. Back.W., Hanshaw. B. B., (1965), Advances in hydroscience in chemical
Geohydrology, Academic press, New York, 11, p 49.
3. Central Water Commision,(CWC), (2000),Water and related statistics, New Delhi.
4. Central Ground Water Board (CGWB), (2007), Annual report, Karnal district,
Haryana, pg15Zaporozee. A., (1972), Graphical interpretation of water quality data,
Groundwater, 10, pp 32-43.
5. Eaton. E. M., (1950), Significance of carbonate in irrigation water, Soil Sci, 69, pp
12-133.
6. Maucha. R., (1940), The graphic symbolization of the chemical composition of
natural waters, Hiderol, Kozlony, pp 29-30.
7. Piper. A. M., (1953), A graphic procedure in the geo-chemical interpretation of water
analysis, USGS groundwater note no, p 12.
8. Stiff Jr H. A.,(1940), The interpretation of chemical water analysis by means of
patterns, Journal of Petroleum technology, 3, pp 15-16.
9. Subramanian., (1994), Hydro geological studies of the coastal aquifers of
Tiruchendur, Tamil Nadu, PhD thesis, Manonmanian sundaranar University,
Thiruneveli, p75.
10. Shah. T., Molden. D., Sakthivadivel. R. and Seckler. D., (2000), The global ground
water situation: Overview of opportunity and challenges. International water
management institute, Colombo.
11. Sadashivaiah.C., Ramakrishnaiah. C.R., Ranganna. G., (2008), Hydrochemical
Analysis and Evaluation of Groundwater Quality in Tumkur Taluk, Karnataka
State,India, International journal of environmental research and public Health, 5(3),
pp158-164.
12. Thussu. J.L., (2006), Geology of Haryana and Delhi, Geological society of India
publication, p 116.
13. Wilcox, L. V., (1995) Classification and use of irrigation waters, US department of
agriculture, Washington DC, p 19.
14. Wilcox. L. V., (1948), The quality water for irrigation use. US Dept. Agric. Bull., 40.
15. Zaporozee. A., (1972), Graphical interpretation of water quality data, Groundwater,
10, pp 32-43.