
Hydrazine substitutes for use as oxygen scavengers in the ...
74
Hydrazine substitutes for use as oxygen scavengers in the secondary circuits of pressurized water reactors Frej Lindfors School of Chemical Engineering Thesis submitted for examination for the degree of Master of Science in Technology. Espoo 8.1.2020 Supervisor D.Sc. (Tech.) Jari Aromaa Advisor M.Sc. (Tech.) Konsta Sipilä
Transcript of Hydrazine substitutes for use as oxygen scavengers in the ...

Hydrazine substitutes for use asoxygen scavengers in thesecondary circuits of pressurizedwater reactors
Frej Lindfors
School of Chemical Engineering
Thesis submitted for examination for the degree of Master ofScience in Technology.Espoo 8.1.2020
Supervisor
D.Sc. (Tech.) Jari Aromaa
Advisor
M.Sc. (Tech.) Konsta Sipilä

Copyright c⃝ 2020 Frej Lindfors
Aalto University, P.O. BOX 11000, 00076 AALTOwww.aalto.fi
Abstract of the master’s thesis
Author Frej LindforsTitle Hydrazine substitutes for use as oxygen scavengers in the secondary circuits of
pressurized water reactorsDegree programme Chemical, Biochemical and Materials EngineeringMajor Functional Materials Code of major CHEM3025Supervisor D.Sc. (Tech.) Jari AromaaAdvisor M.Sc. (Tech.) Konsta SipiläDate 8.1.2020 Number of pages 59+8 Language EnglishAbstractProper chemical treatment of the secondary water is vital for the safety and perfor-mance of pressurized water reactors (PWR) and has conventionally incorporatedhydrazine as an oxygen scavenger. Oxygen scavengers consume dissolved oxygen andthereby mitigate corrosion and other degradation mechanisms of structural materialsfound in the PWR secondary circuits. However, since hydrazine has been classified aspossibly carcinogenic, the use of hydrazine within the EU may become restricted inthe near future. This has stressed the need for an appropriate substitute to hydrazine.
The aim of this thesis is to evaluate the feasibility of the two hydrazine substituteserythorbic acid and diethylhydroxylamine for use as oxygen scavengers in PWRsecondary circuits. For this purpose, the hydrazine substitutes were evaluatedwith respect to their effectiveness to consume oxygen and their ability to protectcarbon steel from corrosion in an experimental setting resembling the environmentof Loviisa WWER-440 secondary circuits. The experiments relied on electrochemicalmeasurement techniques including chronopotentiometry, linear polarization resistanceand electrochemical impedance spectroscopy.
The results show that erythorbic acid consumed oxygen as quickly and effec-tively, and in some measurements even more efficiently than hydrazine, whereasdiethylhydroxylamine reduced the oxygen content at rates of approximately onethird of hydrazine. In addition, the results indicated that all three oxygen scavengerstemporarily increase the corrosion rate of carbon steel to comparable extents whenadministered at high concentration ratios (C/CO2 values greater than 8).
The results suggest that erythorbic acid and diethylhydroxylamine can offer safeapproaches for chemical treatment of PWR secondary waters, provided that anysecondary effects of the substances can be accounted for. These secondary effectsinclude the generation of carbon dioxide and various decomposition products thatmay acidify the secondary waters and increase the electrolytic conductivity.Keywords Hydrazine, erythorbic acid, diethylhydroxylamine, oxygen scavengers,
corrosion inhibitors, PWR, secondary circuit, WWER

Aalto-universitetet, PB 11000, 00076 AALTOwww.aalto.fi
Sammandrag av diplomarbetet
Författare Frej LindforsTitel Ersättande ämnen till hydrazin för använding som avluftningsmedel i
tryckvattenreaktorers sekundärkretsUtbildningsprogram Kemi-, bio- och materialteknikHuvudämne Funktionella material Huvudämnets kod CHEM3025Övervakare TkD Jari AromaaHandledare DI Konsta SipiläDatum 8.1.2020 Sidantal 59+8 Språk EngelskaSammandragDen kemiska behandlingen av sekundärvattnet i tryckvattenreaktorer är väsentlig förgod reaktorsäkerhet och termodynamisk prestanda och har konventionellt inbegripitanvändandet av hydrazin som ett avluftningsmedel. Avluftningsmedlet förbrukari vattnet upplöst syre och lindrar därmed korrosion och andra former av nedbryt-ningsprocesser av byggnadsmaterial i tryckvattenreaktorns sekundärkrets. Dock kananvändandet av hydrazin som avluftningsmedel inom en snar framtid begränsas inomEU eftersom hydrazin kan vara cancerframkallande, vilket har lett till ett ökat behovav ersättande avluftningsmedel för hydrazin.
Avhandlingens mål är att utvärdera användandet av substanserna isoaskorbinsyraoch dietylhydroxylamin som avluftningsmedel i tryckvattenreaktorns sekundärkrets.I detta syfte utvärderades substanserna med hänsyn till deras effektivitet att förbukasyre och förmåga att skydda kolstål från korrosion i experiment vars förhållandenefterliknar sekundärkretsen i Lovisa kärnkraftverks tryckvattenreaktor av typenVVER-440. Experimenten bestod av elektrokemiska mätningar i form av kronopo-tentiometri, linjär polarisationsresistans och elektrokemisk impedansspektroskopi.
Resultaten visar att isoaskorbinsyra förbrukar syre lika snabbt och effektivt, och ivissa mätningar även mer effektivt än hydrazin medan dietylhydroxylamin förbrukarsyre med en hastighet som motsvarar en tredjedel av hydrazins. Därtill visar resultatenatt samtliga avluftningsmedel tillfälligt ökar korrosionshastigheten för kolstål i jäm-förbar utsträckning när de tillfördes i stora överskott (när koncentrationsförhållandetC/CO2 var 8 eller större).
Därmed tyder resultaten på att isoaskorbinsyra och dietylhydroxylamin kan er-sätta hydrazin som avluftningsmedel i tryckvattenreaktorers sekundärkrets, underförutsättningen att hänsyn fästs vid eventuella indirekta effekter av de nya sub-stanserna. Dessa indirekta effekter innefattar bildandet av koldioxid och diversenedbrytningsprodukter som kan sänka sekundärvattnets pH och öka dess elektroly-tiska konduktivitet.Nyckelord hydrazin, isoaskorbinsyra, dietylhydroxylamin, antioxidant,
korrosionsinhibitor, tryckvattenreaktor, sekundärkrets, VVER-reaktor

iii
AcknowledgementsThis thesis was carried out in the facilities of VTT Technical Research Centre ofFinland between August and December 2019. The thesis has been part of theVTT project “Extended lifetime of structural materials through improved waterchemistry” ELMO, which has received funding as part of the Finnish national researchprogramme on the safety of nuclear power plants SAFIR2022. The support from theVTT organization and the SAFIR2022 programme including its financiers has beenacknowledged.
I would like to thank Konsta Sipilä for his active involvement as an advisorand whom I could bounce off ideas for the thesis. In addition, I want to thank mysupervisor Jari Aromaa for sharing his expertise in electrochemistry, for proof-readingthe thesis and inspecting the balancing of the chemical equations.
Gratitude is due to Tiina Ikäläinen and Timo Saario, who have together withKonsta tested the experimental methodology, introduced me to the experimentalsetup and provided entertainment during lab sessions and coffee breaks. A specialexpression of gratitude is directed to Timo for his support on the intepretation ofresults and for introducing me to Tibetan throat singing.
The support of Prof. Martin Bojinov on the experimental sensor calculus wassincerely endorsed. I acknowledge the help of Johanna Lukin for preparing thecharacterization samples and carrying out the SEM and EDS characterization. Thanksare also due to Aki Toivonen and Pasi Väisänen for promptly rebooting the automationsystem whenever it decided to malfunction.
Finally, I want to thank my family, friends and significant other for putting upwith me and supporting me throughout the thesis.
Otaniemi, 8.1.2020
Frej Lindfors

iv
ContentsAbstract i
Abstract (in Swedish) ii
Acknowledgements iii
Contents iv
1 Introduction 1
2 The corrosion environment in NPP secondary circuits 32.1 Pressurized water reactors . . . . . . . . . . . . . . . . . . . . . . . . 32.2 Secondary water chemistry . . . . . . . . . . . . . . . . . . . . . . . . 42.3 WWER steam generator . . . . . . . . . . . . . . . . . . . . . . . . . 5
3 Corrosion fundamentals 73.1 Metallic corrosion . . . . . . . . . . . . . . . . . . . . . . . . . . . . . 73.2 Thermodynamics of corrosion . . . . . . . . . . . . . . . . . . . . . . 103.3 Corrosion rate . . . . . . . . . . . . . . . . . . . . . . . . . . . . . . . 12
4 Secondary circuit corrosion and its mitigation 154.1 Flow assisted corrosion of carbon steel . . . . . . . . . . . . . . . . . 154.2 Degradation of steam generator tubes . . . . . . . . . . . . . . . . . . 174.3 Hydrazine as oxygen scavenger and corrosion inhibitor . . . . . . . . 194.4 Alternatives to hydrazine in oxygen scavenging . . . . . . . . . . . . . 21
5 Electrochemical techniques 255.1 Electrochemical cells . . . . . . . . . . . . . . . . . . . . . . . . . . . 255.2 Electrochemical oxygen sensors . . . . . . . . . . . . . . . . . . . . . 275.3 Linear polarization resistance . . . . . . . . . . . . . . . . . . . . . . 295.4 Electrochemical impedance spectroscopy . . . . . . . . . . . . . . . . 31
6 Experimental 366.1 Equipment and materials . . . . . . . . . . . . . . . . . . . . . . . . . 366.2 Oxygen reduction kinetics . . . . . . . . . . . . . . . . . . . . . . . . 376.3 Electrochemical measurements of carbon steel . . . . . . . . . . . . . 38
7 Results and discussion 397.1 Oxygen reduction kinetics . . . . . . . . . . . . . . . . . . . . . . . . 397.2 Electrochemical measurements of carbon steel . . . . . . . . . . . . . 44
8 Conclusions 50
References 51

v
Appendices 60A Experimental sensor calculus . . . . . . . . . . . . . . . . . . . . . . . 60B Pump rate correction . . . . . . . . . . . . . . . . . . . . . . . . . . . 62C Injection tests with blank solutions . . . . . . . . . . . . . . . . . . . 63D Characterization of the iron oxides . . . . . . . . . . . . . . . . . . . 65E The effect of OSs on the electrolytic conductivity . . . . . . . . . . . 67

1
1 IntroductionA significant part of Finland’s environmental strategy for reducing carbon emissionsrelies on nuclear energy to meet a larger share of the power demand [1, p. 71].Currently, four nuclear reactors operate in Finland: two boiling water reactors(BWR) in Olkiluoto and two WWER pressurized water reactors in Loviisa, whichconjointly produce roughly 25% of the annual power supply [2]. It is estimated thatthis share will increase to 40% by 2030 [1, p. 78] as two new nuclear reactors arecommissioned. Unit 3 of the Olkiluoto plant (OL3) and Unit 1 of the Hanhikivi powerplant (HK1) are scheduled to begin energy production in 2020 [3] and in 2028 [4],respectively. As the nuclear power capacity increases, the use of fossil fuels will bephased out, as Finland aims to become coal-independent by 2030 [1, p. 34].
To ensure that nuclear power can fulfill the role of coal and other fossil fuels, itis important that the future operation and safety of the existing nuclear reactorsat Olkiluoto and Loviisa is assured. These reactors were commissioned between1977 and 1982 but were originally planned to operate only until the end of 2007(Loviisa) [5, p. 2] and 2018 (Olkiluoto) [6, p. 3]. Nevertheless, the reactors have beengranted extended operating licenses until 2030 for Loviisa [5, p. 10] and 2038 forOlkiluoto [6, p. 16], provided that the plants meet the safety guidelines set by theRadiation and Nuclear Safety Authority (STUK). STUK monitors the operation ofthe power plants through periodic safety reviews, in which the authority extensivelyassesses the nuclear safety of the nuclear power plants (NPP).
In the latest safety review [7], STUK found the Loviisa power plant to be compliantwith nuclear safety regulations. However, the review raised concern about the useof the chemical substance hydrazine for controlling the water chemistry in Loviisasecondary coolant circuits [7, p. 40]. This is a common practice for pressurized waterreactors (PWR), where hydrazine is introduced into the secondary coolant circuits tomaintain a low content of dissolved oxygen, thereby mitigating corrosion and othermaterial degradation mechanisms [8]. However, the use of hydrazine may becomerestricted in the near future under European legislation [9], as hydrazine may becarcinogenic [10]. Moreover, hydrazine is known to be hazardous to the environmentand its use should thus be avoided [11]. Therefore, it is important for both safetyand environmental reasons that a safe substitute for hydrazine be secured in order tomanage the secondary circuit water chemistry of nuclear pressurized water reactors,not only in the two Loviisa units but also in OL3 and HK1.
Although several promising hydrazine substitutes have been proposed, findinga qualified substitute has proved to be challenging [12]. One of the challengeslies in hydrazine being a very versatile chemical that carries out several corrosionpreventative functions. Hydrazine simultaneously removes dissolved oxygen (i.e., itacts as an oxygen scavenger), helps to form protective oxides on metal surfaces (i.e.,it acts as a passivator), and its decomposition products maintain appropriate pHlevels [13]. So far, few reported alternatives to hydrazine have been able to fulfill allthree functions, and none has done so adequately [12].
One suggested approach for fulfilling these three functions is to combine multiplesubstitutes that collectively provide the properties of hydrazine [14]. However, to

2
determine the feasibility of such an approach, it would have to be comprehensivelyvalidated through experimental testing. In particular, the substitutes that are tofulfil the role as oxygen scavengers must be tested with respect to their overall impacton the coolant chemistry, their compatibility with coexisting materials, and theireffectiveness in removing dissolved oxygen. These tests should ideally be carried outunder conditions resembling those present in the coolant circuits of an operatingnuclear reactor.
The aim of this thesis is to evaluate the feasibility of two hydrazine substitutesfor use as oxygen scavengers in pressurized water reactors. In order to comparethe oxygen reduction kinetics of the two hydrazine substitutes, a high temperaturewater loop experiment is devised resembling the environment of Loviisa secondarycircuits. Under these conditions and oxygen contents adjusted to approximately100 ppb and 10 ppm, hydrazine and the two hydrazine substitutes are administeredat varying concentrations into the water loop. The effectiveness of the oxygenscavengers in reducing oxygen were deduced using two methods for measuring oxygenconcentration. In addition, the electrochemical properties of a carbon steel (22K)commonly found in Loviisa secondary circuits are monitored during administrationof scavengers using two electrochemical techniques: linear polarization resistance(LPR) and electrochemical impedance spectroscopy (EIS).
Accordingly, this thesis is limited to benchmarking the oxygen reduction kineticsof the two studied oxygen scavengers. In addition, the thesis is limited to depictingthe electrochemical properties of only one of the many structural materials in thecoolant circuits of nuclear pressurized water reactors that may interact with theoxygen scavengers. Nevertheless, the final outcome of this thesis provides estimateson the effectiveness of the hydrazine substitutes as oxygen scavengers at elevatedtemperatures. These results can be seen as an important step in the direction ofreplacing hydrazine in pressurized water reactors.
The thesis is divided into eight chapters. Chapter 2 introduces the reader to thenuclear reactors as an environment where corrosion can take place. Chapter 3 reviewsthe literature on fundamental concepts of corrosion, and Chapter 4 applies these tothe secondary circuit of nuclear PWR. Chapter 4 reviews the use of hydrazine as anoxygen scavenger and plausible substitutes to hydrazine for use as oxygen scavengers.Chapter 5 assesses the applicability of the measurement techniques utilized in thethesis experiments. Chapter 6 describes the experiments, while Chapter 7 summarizesand discusses the results obtained from the experiments. Finally, Chapter 8 concludesthe thesis by presenting the main findings and suggesting future work.

3
2 The corrosion environment in NPP secondarycircuits
This chapter outlines the operating principle of a nuclear power plant (NPP) togetherwith the power plant structure and the key components of PWRs. By doing so, thechapter introduces the reader to concepts, vocabulary and abbreviations that willbe used throughout the thesis. More importantly, the chapter defines the corrosionenvironment of the secondary circuit in terms of water chemistry, present materialsand physical conditions. Furthermore, the chapter highlights the structure of thesteam generator (SG) since it is a component considered particularly susceptible tocorrosion. The actual corrosion mechanisms are detailed in Chapter 4.
2.1 Pressurized water reactorsA commercial NPP is a thermal power station that converts energy from controllednuclear fission reactions into electricity. In general, the energy from these controllednuclear reactions are transferred as heat via a coolant (commonly water) to producesteam that ultimately drives a turbine generator [15, Ch. 3]. The general layoutsof NPPs are quite similar but vary with respect to their components and reactorconcepts.
Nuclear reactors can be classified based on reactor medium into gas-cooled andwater-cooled reactor types [16, p. 634]. Water-cooled reactors constitute over 95%of the conventional reactors used for power production [17, p. 74]. The water-cooled reactors can further be sub-classified into two types: light water and heavywater reactors, which use ’normal’ and deuterium oxide 2H2O waters as coolingmediums, respectively. For every power producing reactor using heavy water, thereare approximately eight reactors using light water [17, p. 74].
Nuclear reactors cooled by light water are classified into two main concepts:boiling water reactors (BWR) and pressurized water reactors (PWR) [18, p. 3].One of the main distinction between the two is that boiling occurs at the core ina BWR while in a PWR, water is turned into steam in a separate heat exchangeror so-called steam generator (SG) [18, p. 7]. As of December 2016, the BWR andPWR concepts represented 20.8% and 75.4% of the 448 operating nuclear reactors,respectively [17, p. 74]. The Olkiluoto reactors 1 and 2 are BWRs while the Loviisareactors are PWRs. The Loviisa reactors are PWRs of former Soviet WWER-440designs (WWER stands for ’water water energetic reactor’ [19, p. 23] or ’water-cooled and water-moderated energy reactor’ while 440 refers to the original 440 MWelectrical design output). Some writers prefer the use of VVER before WWER,whereas this thesis will henceforth use explicitly WWER.
The operating principle of the PWR relies on three coolant circuits as shown inFigure 1.1. The coolant in the primary circuit, which is kept under approximately15 MPa pressure for the water to remain as liquid at high temperatures, absorbsheat from the reactor core [20]. The primary coolant passes through the steamgenerator and transfers heat to the secondary circuit which operates at a lower,roughly 7 MPa, pressure [18, p. 5]. The transferred heat causes the secondary circuit

4
water to boil into steam, which is subsequently dried and fed to the steam turbinegenerator where electricity is produced. As the secondary circuit steam passes theturbines, the tertiary circuit condenses the steam back into water, commonly referredto as “feedwater”, which is pumped back to the steam generator and thereby closesthe secondary circuit cycle [18, p. 5]. Since hydrazine is associated with the waterchemistry of the secondary circuit, the discussion will henceforth be limited to thesecondary circuit.
Figure 1: Schematic of a PWR nuclear power plant with highlighted cooling circuits.Image adapted from [21]
2.2 Secondary water chemistryThe secondary circuits of the Loviisa WWER-440 reactors are quite extensive andincorporate a series of structural materials. Out of these, the most abundant materialsincluded carbon steel (in the steam and feedwater pipes), stainless steel (in thepreheater and steam generator tubes) and high-alloyed stainless steel (in the condensertubes) [22]. At the time of writing this, the last components made of copper shouldhave been removed from Loviisa secondary circuits [7, p. 40].
The conditions that these materials face vary considerably between differentsections of the circuit considering that both water and steam phases are present. Forinstance, the temperature and pressure of the water phase range from 24 to 225 Cand 24.1 to 60 bar between the condenser exit and the entry to the steam generator,respectively [23]. Under these conditions, the fast-flowing water and steam placestress on the structural materials which may result in their degradation in the formof wear and corrosion.
In order to reduce the risk of corrosion, the water chemistry of the secondary circuitis constantly monitored and adjusted to values shown in Table 1. The feedwateris kept alkaline at a pH value of 9.6 using ammonia, and hydrazine is injected to

5
maintain low levels of dissolved oxygen. The feedwater also contains trace amountsof impurities such as chloride Cl– and sodium ions Na+. Furthermore, the watercan be assumed to contain dissolved ions from metals such as Fe, Cr, Ni and Cu inconcentrations on the order of ppb originating from corrosion of various parts of thesecondary circuit.
Table 1: Secondary circuit feedwater chemistry in terms of species concentration(weight-pbb or μg/l) and physical quantities [22, 24, 25].
Species or quantity Feedwater UnitNH3 (ammonia) 500 ppbN2H4 (hydrazine) 2-20 ppbCl– <50 ppbNa+ < 5 ppbO2 (dissolved oxygen) < 1 ppbAcidity, pH25C C 9.6Conductivity 10 μS/cm
Although the water chemistry is controlled properly, the PWR secondary circuitcontains a collection of structural materials that may be prone to corrode [26]. Theseinclude carbon steels, low-alloy steels, stainless steels and nickel based alloys [26].In case of Loviisa and other WWER-440 reactors, the materials that have been themost prominent to degrade include [27, p. 10] carbon steels in the feedwater andsteam pipes and stainless steels in the steam generators. The corrosion mechanismsof either material are outlined in sections 4.1 and 4.2. In order to understand thecorrosion process of stainless steel in the steam generator, the following section willdescribe the characteristics of the WWER steam generator.
2.3 WWER steam generatorThe NPP component which is considered the most sensitive to corrosion is thesteam generator (SG) [28, p. 126]. The SG component that is the most susceptibleto fail in WWERs and other types of PWRs are the SG heat exchange tubes,which have historically failed mainly due to stress corrosion cracking (SCC) [16,p. 648]. Moreover, the replacement of the WWER-440 SG can be very expensiveand challenging, which is why it is considered the most critical component for thelifetime extensions of WWER NPPs [16, p. 648]. The corrosion-sensitive natureof the SG can be attributed to its combination of materials and complex internalstructure paired with the challenging conditions present inside of it. These aspectsare necessary to depict in order to understand the associated corrosion processes.
Characteristic for WWER-440 reactors are six primary circuits with one horizontalPGV-440 steam generator each [18, p. 8]. The PGV-440 steam generators, which areconceptually very similar to the PGV-1000 steam generator shown in Figure 2, areshell-and tube heat exchangers in which the primary coolant flows through the tubesand the secondary coolant resides outside the tubes. The inlet temperatures of theprimary and secondary waters are 297 C [19, p. 108] and 228 C [24], respectively.

6
Figure 2: The WWER steam generator PGV-1000 with internal components. Imagemodified from [16, p. 644]
The 16 mm diameter heat exchange tubes, 5536 in total [19, p. 108], form u-bends between the primary coolant entry and exit (hot and cold collector, shown inFigure 2). The tubes and collectors are made from titanium stabilized austeniticstainless steel 08Ch18N10T [19, p. 108] with 18% Cr and 10% Ni content [16, p. 643].The tubes are arranged in line and evenly spaced by 30 mm carbon steel (grade 22K)support plates in vertical direction and carbon steel wave plates (presumably also22K) in the horizontal direction [19, p. 107].
The 3.2 m diameter and 11.6 m long SG body consists of 22K carbon steel andholds the secondary coolant [19, p. 108]. The secondary coolant evaporates intosteam at a rate on the order of 100 l/s [19, p. 108] and make-up water is distributedat the center of the steam generator through the feedwater pipe. The feedwaterpipes were originally carbon steel 22K [19, p. 109] but were later replaced in someLoviisa steam generators by stainless steel designs [29]. Under operating conditions,the water level is kept above the tube bundle at a constant height of approximately2.12 m [30, p. 109]. Since water is constantly evaporating, the concentration ofdissolved impurities increases in the SG that precipitate as solids which sedimenton the bottom of the SG. Therefore, the SG is equipped with ’blowdown valves’through which the sedimentary sludge is flushed out at periodic intervals [16, p. 643].
This chapter has introduced the corrosion environment of the PWR secondarycircuit and the steam generator. The following chapter will outline the corrosionprocesses taking place in the secondary circuit from a theoretical perspective whileChapter 4 depicts commonly observed corrosion forms for carbon steels and stainlesssteels.

7
3 Corrosion fundamentalsIn order to understand the corrosion mechanisms that the use of hydrazine aimsto mitigate, it is first necessary to understand the main fundamental concepts ofmetallic corrosion. This chapter reviews corrosion of metals from the literature byemphasizing main concepts of thermodynamics and kinetics with respect to themetal-solution interface.
3.1 Metallic corrosionMetallic corrosion has been described [31, p. 1] as a natural process by which a metaldestructively reacts with its environment so that the metal returns into its oxidizedform and the properties of the metal deteriorate. In general, these corrosion reactionsoccur through electrochemical half-cell reactions as opposed to the metal interactiondirectly with the environment through chemical reactions [31, p. 15].
The electrochemical corrosion process occurring in an aqueous solution comprisesof an anodic reaction coupled to one or more cathodic reactions [32, p. 77]. Theanodic reaction involves the dissolution of the solid metal as a metal ion and therelease of electrons (i.e., the anodic reaction is an oxidation reaction). For an anodicreaction to be scientifically defined as a corrosion reaction, it must include bothmass and electron transfer across a metal and solution interface [31, p. 16]. Theanodic reactions for iron [31, p. 18] are shown in equations (1) and (2) and since theyinvolve both mass and electron transfer (metal ion dissolution and electron release,respectively) they can be considered as valid corrosion reactions.
Fe(s) −−→ Fe2+(aq) + 2 e− (1)Fe2+ −−→ Fe3+(aq) + e− (2)
In the cathodic reaction, a given species captures the electrons from the anodicreaction and thereby undergoes reduction [31, p. 16] (i.e., the cathodic reactionis a reduction reaction). In neutral and alkaline solutions, the cathodic reactionis commonly depicted to be that of dissolved oxygen as in [31, p. 177], shown inequation (3), but another plausible cathodic reaction under the conditions of thesecondary circuit could be the reduction of water [31, p. 102], shown in equation (4).However, neither reaction can be considered a corrosion reaction as defined in [31,p. 16], since they do not involve mass transfer across the metal-solution interface.Nevertheless, since the oxygen from the resulting hydroxide OH– is consumed insubsequent reactions to form metal oxide, and thus integrating in the metal andcrossing the metal-solution interface, the reactions can be considered indirect corrosionreactions.
O2(g) + 2 H2O(l) + 4 e− −−→ 4 OH− (3)2 H2O + 2 e− −−→ H2(g) + 2 OH− (4)
8
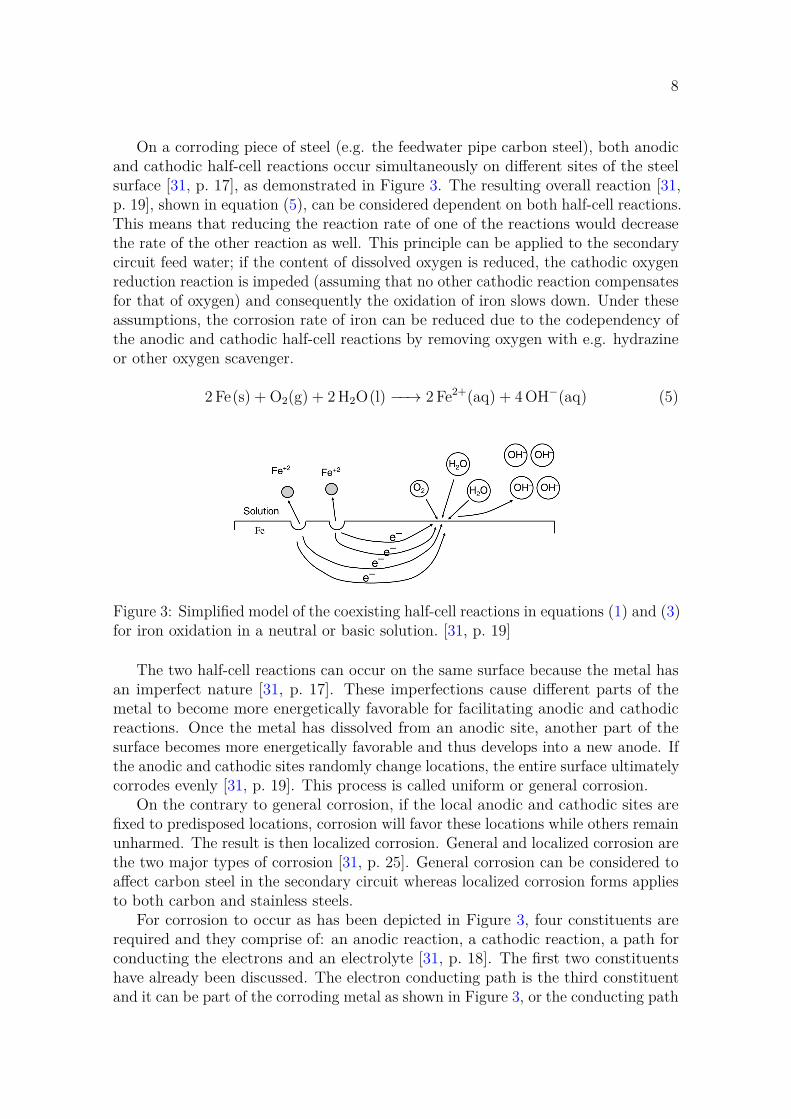
On a corroding piece of steel (e.g. the feedwater pipe carbon steel), both anodicand cathodic half-cell reactions occur simultaneously on different sites of the steelsurface [31, p. 17], as demonstrated in Figure 3. The resulting overall reaction [31,p. 19], shown in equation (5), can be considered dependent on both half-cell reactions.This means that reducing the reaction rate of one of the reactions would decreasethe rate of the other reaction as well. This principle can be applied to the secondarycircuit feed water; if the content of dissolved oxygen is reduced, the cathodic oxygenreduction reaction is impeded (assuming that no other cathodic reaction compensatesfor that of oxygen) and consequently the oxidation of iron slows down. Under theseassumptions, the corrosion rate of iron can be reduced due to the codependency ofthe anodic and cathodic half-cell reactions by removing oxygen with e.g. hydrazineor other oxygen scavenger.
2 Fe(s) + O2(g) + 2 H2O(l) −−→ 2 Fe2+(aq) + 4 OH−(aq) (5)
Figure 3: Simplified model of the coexisting half-cell reactions in equations (1) and (3)for iron oxidation in a neutral or basic solution. [31, p. 19]
The two half-cell reactions can occur on the same surface because the metal hasan imperfect nature [31, p. 17]. These imperfections cause different parts of themetal to become more energetically favorable for facilitating anodic and cathodicreactions. Once the metal has dissolved from an anodic site, another part of thesurface becomes more energetically favorable and thus develops into a new anode. Ifthe anodic and cathodic sites randomly change locations, the entire surface ultimatelycorrodes evenly [31, p. 19]. This process is called uniform or general corrosion.
On the contrary to general corrosion, if the local anodic and cathodic sites arefixed to predisposed locations, corrosion will favor these locations while others remainunharmed. The result is then localized corrosion. General and localized corrosion arethe two major types of corrosion [31, p. 25]. General corrosion can be considered toaffect carbon steel in the secondary circuit whereas localized corrosion forms appliesto both carbon and stainless steels.
For corrosion to occur as has been depicted in Figure 3, four constituents arerequired and they comprise of: an anodic reaction, a cathodic reaction, a path forconducting the electrons and an electrolyte [31, p. 18]. The first two constituentshave already been discussed. The electron conducting path is the third constituentand it can be part of the corroding metal as shown in Figure 3, or the conducting path

9
can be in the form of wires as utilized in the electrochemical techniques discussed inChapter 5. The fourth constituent is the electrolyte which is a solution capable ofconducting a current as it contains charged species [31, p. 33]. These four constituentsfacilitate corrosion reactions over a solution-metal interface, the characteristics ofwhich can be considered to determine the likelihood of aggressive corrosion to occurand the rate at which the corrosion progresses. Therefore, this interface is oftenthe object of interest in corrosion studies in order to understand and describe theunderlying corrosion mechanisms. This interface is described next and later onapplied to the corrosion environment of the Loviisa secondary circuit.
In the Loviisa secondary circuits, the feedwater acts as the electrolyte and it isan alkaline solution with a pH adjusted by ammonia to approximately 9.6. As theelectrolyte meets a metal, the various chemical species in the electrolyte interact withthe metal surface and some of them may adsorb as a layer onto it. If charged speciesof either negative or positive sign are preferentially adsorbed, a structure of twolayers of oppositely charged species is formed at the metal surface. This structureis described as a double layer or electrical double layer (EDL) which gives rise toan electrochemical potential (i.e., the corrosion potential) over the metal-solutioninterface. The EDL has been simulated using several models, out of which theBockris-Devanathan-Müller (BDM) model, shown in Figure 4, is considered to bethe most sophisticated [31, p. 42].
Figure 4: The electrical double layer and its absolute potential E (V) over themetal-solution interface. The abbreviations IHP and OHP represents the inner andouter Helmholtz planes, respectively. GC stands for Guoy-Chapman. The image wasreproduced from [31, p. 42].

10
The EDL as depicted in the BDM model comprise of three components: theGuoy-Chapman diffusion layer, the outer Helmholtz plane (OHP), and the innerHelmholtz plane (IHP). The three layers differ in composition of charged speciesand therefore contribute to varying extent to the electrochemical potential overthe metal-solution interface [31, p. 43], as shown in Figure 4. The electrochemicalpotential can be determined against a reference electrode and it can be consideredto serve as a thermodynamic measure of the metal-solution interface. The followingsection describes how the electrochemical potential and the thermodynamics of themetal-solution interface may determine the corrosion behavior of a metal.
3.2 Thermodynamics of corrosionDepending on the thermodynamic conditions of the metal and its environment,the metal may either corrode (i.e., dissolve indefinitely), be immune to corrosion(i.e., remain in its solid state), or the corrosion products may form oxide layersthat ‘passivate’ the underlying metal surface and thus reduce the corrosion ratesto acceptable levels. With respect to iron, these three scenarios are presented inFigure 5 as regions of aqueous solution acidity (pH) and electrochemical potential(E) of the environment in so-called Pourbaix diagrams [31, p. 95]. The Pourbaixdiagrams show that iron corrodes indefinitely in acidic and very alkaline solutions inthe regions marked by ions Fe2+, Fe3+ and HFeO2
– . In contrast, iron stays immunewithin the region marked by Fe (solid iron) and passivates in the regions marked byiron oxides Fe3O4 (magnetite) and Fe2O3 (hematite).
Figure 5: Pourbaix diagrams for iron at temperatures A) 25 C and B) 200 C. Theenvironment of the secondary circuit is highlighted by blue fields (pH25 around 9.7and 6.5, for A and B, respectively). Under these conditions, the iron oxides magnetite(Fe3O4) and hematite (Fe2O3) can be considered thermodynamically stable. Theunmarked region in B between Fe, HFeO2
– and Fe3O4 are due to the uncertainty in∆G calculations with respect to temperature. The diagrams were adapted from [31,p. 113].

11
For this thesis, it is useful to know which forms of iron are thermodynamicallystable under the conditions of the WWER secondary circuit. An acceptable acidityof the secondary circuit feedwater is generally considered to be approximately pH25C9.5 to 9.7 [16, p. 760]. Consequently, when the feedwater is heated to 228 C, thepH228C was estimated to 6.5 (calculated with MULTEQ software). These pH valuesare highlighted in Figure 5 by blue fields. The blue fields are limited in terms ofpotential by the water stability window between the dashed lines “a” and “b”. Asshown in Figure 5, either passivating oxide magnetite (Fe3O4) or hematite (Fe2O3) arethermodynamically stable in the secondary circuit, depending on the electrochemicalpotential.
The passive oxide film grown on carbon steel under secondary circuit conditionshas been previously characterized [33] as a magnetite (Fe3O4) bi-layer film consistingof a uniform and protective inner layer and a porous, non-protective outer layer ofirregularly distributed particles, as shown in Figure 6. The presence of magnetitein the passive film has been confirmed with XRD and FTIR analyses, which werealso able to identify maghemite (γ-Fe2O3) [34, 35] and tiny amounts of lepidocrocite(γ-FeOOH) [35]. Although the studies did not specify the locations of the differentoxide phases in the passive film, the observations can be considered to correspondwith the Bilayer model [36, p. 787] embedded in Figure 6B, which in general termsdescribes the passive film of iron as a bilayer composed of an inner and outer layerof Fe3O4 and γ-Fe2O3, respectively.
Figure 6: A) Surface and B) cross-section SEM images of low alloy steel (LAS) witha 290 nm thick oxide film. The outer layer is abundant in particles and has a porousstructure, whereas the inner layer is compact. B contains also the correspondingBilayer model. SEM images from [24] and the bilayer model was reproduced from [31,p. 225].
The oxide layers have been described by investigators to grow via several mech-anisms. These include solid-state and diffusion [37], metal dissolution and oxideprecipitation [38] or a combination of both mechanisms in which the inner and outerlayers are formed by a solid-state and precipitation processes, respectively [39]. Sincethe formed iron oxides allocate a larger volume than the dissolved metal (Pilling-
12
Bedworth ratios of 2.14 and 2.10 for Fe2O3 and Fe3O4, respectively [31, p. 236]),part of the oxide can be thought to form at the metal-oxide interface and part at theoxide-solution interface. Another consideration is that the inner part of the film ismore compact and therefore more probable to grow via a solid-state mechanism, whilethe outer porous layer can be reasoned to form via a dissolution and precipitationmechanism as described in [40]. In general, the thickness of the resulting oxide hasbeen estimated to range from 0.1 μm to 1.5 μm depending on the temperature, pHand the electrochemical potential as well as the time the metal has been exposed [34].
The characteristics of the passivating oxide are important since they may dominatethe rate at which corrosion reactions occur. The following section will describe thecorrosion rate and how it is affected by the presence of a passivating iron oxide atthe metal-solution interface.
3.3 Corrosion rateThe rate at which the corrosion reactions proceed is commonly called corrosion rate.Since the corrosion reaction can be considered a process with many reaction steps,its overall rate is dictated by the slowest reaction step, which is commonly referredto as the rate-determining or rate-limiting step [41, p. 77]. The rate-limiting step ofan electrochemical reaction is in general defined [42, p 12] as either (i) the kineticsof electron transfer reactions, adsorption reactions or preceding chemical reactions,or (ii) the mass transfer of reagents to and from the electrode surface. That is, theslowest step of an electrochemical corrosion reaction can either be a reaction step(the one with the largest free energy barrier ΔG as defined by the absolute reactionrate theory [31, p. 132]) or the transportation of reagents to and from the reactionsites. If the kinetics of the reactions are fast, then the reaction is most likely limitedby mass transfer. Mass transfer may occur through three modes: diffusion (reagentsmove down a concentration gradient), migration (charged species are forced intomovement by an electric field) and convection (reagents move due to stirring or flowof the solution) [42, p. 17].
In case of steel covered by a passive oxide film, the electrochemical reactions canbe considered to occur at either side of the oxide film so that the anodic reactionsoccur at the metal-oxide interface while the cathodic reactions take place at theoxide-solution interface. This spatial separation of the electrochemical reactionsmeans that mass transfer occurs in both the solution and inside the oxide film. In thesolution, the mass transfer is presumably a combination of diffusion and convectionmodes while migration can be considered negligible due to the absence of electricfields. In the oxide film, the main mass transfer modes are migration and diffusion,as shown in Figure 7, since solid material cannot facilitate convection. It is safe toassume that the mass transfer through the oxide film is much slower than in thesolution since the film is a solid material. If the corrosion rate is limited by masstransfer, the rate-limiting step can therefore be tied to the mass transfer propertiesof the oxide film.
The mass transfer of reagents through the film, which is shown in Figure 7, includethe outward movement of metal species (Fe2+ and Fe3+ cations) and the inward

13
Figure 7: The corrosion interface of a passivated steel including both the BDM modelof the electrical double layer and the Bilayer model of the passive film structure. Theschematic characterizes the mass transfer modes of iron and oxygen species accordingto the point defect model as described in [40].
movement of oxygen. The metal can be considered to move via both diffusion andmigration modes through local defects in the oxide film as assumed in the point defectmodel [40]. To specify, the metal has been described [40] to move through the oxidefilm in part as interstitial cations (Fe2+, from equation (1)) and in part as latticepoint cations (Fe3+ or iron (III), from equation (2)). The outward movement ofFe3+ occurs by solid diffusion driven by the dissolution of Fe3+ at the oxide-solutioninterface and the formation of Fe3+ vacancies. The Fe3+ vacancies are filled withadjacent Fe3+ cations which creates a net inward movement of the vacancies (and acorresponding net outward movement of the Fe3+ cations). As the vacancies reachthe metal-oxide interface, they are filled with new Fe3+ ions from the oxidationreaction of iron.
The inward movement of oxygen has been attributed [40] to the presence ofoxygen vacancies, which are formed as a byproduct of the iron oxidation reactionsfrom iron to iron (III). The oxygen vacancies move outward by solid diffusion andconsequently, oxygen moves inward. As the oxygen vacancies reach the oxide-solutioninterface, they react with adsorbed water and are filled with oxygen atoms [40].This movement of oxygen through the film allows for oxide film growth at boththe metal-oxide and oxide-solution interfaces as described in Section 3.2. As theoxide film grows in thickness, the corrosion reactions can be assumed to proceed at

14
declining reaction rates [32, p. 89] since the flux from diffusion decreases with anincrease in layer thickness according to the Nernst-Planck equation [42, p. 17].
Although mass transfer is limited through the oxide film, the film conductselectrons reasonably well as magnetite has been acknowledged to have n-type semi-conducting properties [43]. The transfer of electrons at the metal-oxide and theoxide-solution interfaces in the electrochemical reactions creates a Faradaic current.This current can be characterized as a function of the electrochemical potentialover the metal-oxide-solution interface through various electrochemical techniques toexperimentally determine the corrosion rate of the system. Correspondingly, otherelectrochemical techniques can be employed to characterize other properties of thecorrosion interface and to deduce the rate-limiting step of the corrosion process. Twosuch electrochemical techniques: linear polarization resistance (LPR) and electro-chemical impedance spectroscopy (EIS) are employed in this study and are reviewedin Chapter 5.
This chapter has reviewed some of the most fundamental concepts of metalliccorrosion relevant for the conditions of the secondary circuit in terms of electrochem-istry, thermodynamics and reaction kinetics. In the following chapter, these conceptsare applied as the chapter reviews the corrosion forms of carbon steel and stainlesssteel PWR components from the literature. In addition, some of the concepts andmodels included in this chapter will be applied in Chapter 5.

15
4 Secondary circuit corrosion and its mitigationIn the secondary circuit of PWRs, the water chemistry affects the degradation rateof pipelines and other physical barriers that separate radioactive species from thesurroundings. Therefore, proper water chemistry in the secondary circuit is anessential part of nuclear safety and has conventionally incorporated hydrazine as anoxygen scavenger. In order to evaluate the feasibility of substitutes for hydrazine, itis important to understand the corrosion forms that the use of hydrazine aims tomitigate.
This chapter presents two materials particularly susceptible to corrosion in thePWR secondary circuit and their associated corrosion mechanisms. Furthermore, thechapter identifies the effect of oxygen on these corrosion mechanisms and presentsmethods for controlling these corrosion phenomena using an oxygen scavenger suchas hydrazine. Finally, the chapter concludes by introducing hydrazine substitutes,including two such compounds selected for experimental evaluation.
4.1 Flow assisted corrosion of carbon steelAs mentioned in Chapter 2.2, the structural components most susceptible to corrosionin the WWER secondary circuit include carbon and stainless steels. The corrosionprocesses of these materials can be considered as interlinked. First, the carbonsteel in the feedwater pipes dissolves through general or flow assisted corrosion(FAC) [26]. Thereafter, the dissolved corrosion products are transported to the steamgenerator where they deposit on various SG components through a process frequentlydescribed as fouling [26, 44, 45]. Fouling decreases the thermal performance of thesteam generator and can facilitate local corrosion forms, including pitting and stresscorrosion cracking (SCC). This section reviews the FAC mechanism of carbon steelfrom the literature while the following section describes the consequences of foulingon the SG components.
Dissolution of carbon steel piping through flow-assisted corrosion (FAC, which isalso called flow accelerated corrosion) has been suggested as the most significant issuein PWRs [26]. FAC can be described as the dissolution of the normally protectiveoxide film under conditions of fast flowing water or steam. As the protective oxidereduces in thickness, the underlying metal oxidizes at increasing rates. However,FAC is sometimes used as a synonym to erosion corrosion, which is a commonmisconception [46, p. 5]. FAC differs from erosion-corrosion in that it excludesthe mechanical wear mechanisms of cavitation and the impingement of bubblesand particles [46, p. 5]. Instead of comparing FAC to erosion-corrosion, FAC canbe considered as an extension of general corrosion assisted by convective diffusionprocesses provided by the flow of water or steam [46, p. 5].
The rate of FAC under secondary circuit conditions has been found to dependon five factors: temperature, pH, material composition, hydrodynamics and thecorrosion potential of the metal [46, p. 3]. With respect to temperature, FAC ofcarbon steel in fossil power plants has generally occurred between temperatures of120 C to 280 C [47, p. 88]. The rate of FAC has in these cases been measured

16
to peak at a certain temperature, such as 150 C [47, p. 88] as the increase oftemperature allows for faster mass transfer but also reduces the solubility of ironoxides [46, p. 21] and the rate of FAC can be expected to peak when the sum ofthese two factors reaches a maximum value.
Regarding the solution pH, the FAC rate increases with reducing values of solutionpH as the solubility of iron oxides increases with reducing values of pH [48, p. 81].
Although carbon steel is susceptible to FAC, stainless steels are not. Thisdemonstrates that the material composition affects the rate of FAC. Alloyingelements, including chromium, have shown to significantly reduce FAC rates whenpresent in concentrations on the order of 1% or higher [48, p. 81]. The reduced rate ofFAC for alloys containing chromium has been attributed to the iron oxide containingchromium having a much lower solubility than oxides containing no chromium [46,p. 24].
The rate of FAC is affected also by hydrodynamical factors, by which the rateincreases with flow velocity, turbulence and surface roughness since they provide forbetter mass transfer via convectional transport [46, p. 26] and increase the mechanicalstresses.
The most influential factor on the rate of FAC in the secondary circuit has beenrecognized to be the electrochemical potential (ECP), which is directly affectedby the presence of oxidising and reducing species including dissolved oxygen andhydrazine [46, p. 14]. As shown by [49, p. 128], the electrochemical potential increaseswith oxygen content and FAC rates are generally lower in the presence of more than 5ppb oxygen and oxidising conditions of ECP values greater than -0.3V (vs. standardhydrogen electrode, SHE) [50]. The lower rates of FAC in the presence of oxygen hasbeen attributed to an oxide structure abundant in hematite (Fe2O3) and iron oxidehydroxide (FeOOH) that provides for a lower overall oxide solubility than an oxideonly consisting of magnetite (Fe3O4) [46, p. 17], which is formed under reducing anddeoxygenated conditions as shown in the Pourbaix diagrams in Figure 5.
FAC has previously caused issues in the Loviisa secondary circuits. The casesof FAC wall thinning have been concentrated to pipe fittings and welds found inflanges, T-pieces, elbows and reducers in both the steam and water phase partsof the circuits [22, p. 77]. In the most severe cases of FAC, the turbulent flowof steam and water combined with insufficient chromium content in the steel wasbelieved to have accelerated the wall thinning [22, p. 77]. An example is the FACdamages of T-connections and nozzles of the steam generator feedwater distributionpipes which prompted the replacement of the entire distribution pipe in many steamgenerators [29]. At the time of the above-mentioned FAC issues (up until 1994 [51]),the acidity of the secondary water was held at neutral (i.e., pH25C of approximately 7)and involved no chemical additives. Currently, FAC seems to be under control inLoviisa secondary circuits as the acidity of the secondary coolant is adjusted to highervalues of pH (as detailed in Section 2.2), and the components most vulnerable toFAC have been replaced by more corrosion resistant materials [22].
Even though carbon steel components may not be subjected to FAC, which isgenerally considered the main cause for release of corrosion products to the feedwatersystem [34], general corrosion of carbon steel and other structural materials continues

17
to take place and produces low concentration of metal species in the secondarycircuit [52, p. 1]. These corrosion products, which can be in the form of dissolvedions or dispersed particles [26], are transported downstream with the feedwater andreach eventually the steam generators, where they accumulate in concentration andsubsequently precipitate or deposit. The following section depicts the depositionof these corrosion products and the accumulation of impurities within them, whichhas been the major cause for various degradation issues in the steam generators [45,p. 17].
4.2 Degradation of steam generator tubesThe environment and the challenging conditions inside the steam generator (Sec-tion 2.3) can result in the degradation of SG materials through various forms ofcorrosion including FAC of the carbon steel (e.g., of the shell and tube supportplates TSP), stress corrosion cracking (SCC) of the stainless steel heat exchangetubes, and clogging of the spaces between the TSPs and the tubes [44]. However,other causes and forms of corrosion of SG components has been reported in variousreviews [27, 53, 44, 26, 16], which emphasizes that the mode of corrosion can varygreatly between different types of SGs depending on the SG materials, the materialsin other components of the secondary circuit, and the methods for controlling thesecondary circuit water chemistry.
The degradation forms that are most essential for this thesis are those that theuse of hydrazine as an oxygen scavenger aims to mitigate. These are mainly pitting,stress corrosion cracking (SCC) and denting of the SG heat exchange tubes [54], asthe presence of oxygen can be associated with an increased risk of all these threecorrosion forms.
Pitting is a localized form of corrosion that involves aggressive anions, such aschloride ions Cl– , that break down the passive oxide film which allows for anodicdissolution of the metal [31, p. 277]. The passive film on stainless steel, such astitanium stabilized austenitic stainless steel 08Ch18N10T, is similar to that of carbonsteel (Figure 6) except for that part of the iron in the oxide has been replacedby chromium and nickel atoms, thus producing a mixed oxide of general structureCrxNiyFe3–x –yO4 [16, p. 650].
Corrosion pitting of metal initiates once the potentials reach critical values, orthe so-called pitting potential [31, p. 278], which for stainless steels are typically inthe range of 0.3 to 0.5 V in 0.1M NaCl at room temperature [55]. Since the pittingpotential is inversely dependent on the concentration of chloride, as demonstratedin [56], the risk of pitting is decreased the lower the chloride concentration. Cor-respondingly, the electrochemical potential of a metal increases with the oxygencontent, as demonstrated by [49, p. 128], and the presence of dissolved oxygen maythus increase the risk of potentials approaching the pitting potential.
In case of the secondary circuit, which has very low concentrations of chloride andoxygen as shown in Table 1 (i.e., less than 50 ppb and practically null, respectively),the risk of pitting corrosion is by no means alarming. However, undesired ingress ofair may result in transient states during which an increased concentration of dissolved

18
oxygen may reside in the SGs. Moreover, chloride and other non-volatile corrosivecompounds may concentrate in flow-restricted locations of the SG where continuousboiling occurs, such as the crevices between the SG tubes and TSPs [57].
The corrosion products from the feedwater and condensate systems form depositson top of the stainless steel mixed oxide film through particulate and crystallizationfouling [58]. As the water evaporates into steam at the proximity of these deposits,corrosive impurities concentrate inside the deposits [53]. These impurities may alterthe pH beneath the deposits into regions where the oxide layer is no longer stable orthey may promote corrosion through other mechanisms.
Impurities that are considered to promote pitting and other forms of corrosioninclude oxygen [53, 54] (from either deliberate on non-deliberate ingress of air inthe secondary circuit), sodium [54] and chloride [16, 26, 53, 54] (which may remainunfiltered from e.g. a leaking ion exchanger), sulfate [26, 16, 54] (from e.g. ionexchange resins), lead [54] (which may dissolve as it is an impurity found in mostmetals) and copper [53, 54] (from heat exchange tubes in the condensers or preheaters).Once corrosion pits have formed, they propagate autocatalytically and can act asinitiation sites for stress corrosion cracking [31, p. 277].
Stress corrosion cracking (SCC) is a mechanically assisted form of corrosionthat ultimately yields in macroscopic ruptures due to a combination of a corrosiveenvironment and mechanical stress [31, p. 315]. The stress corrosion crack mayinitiate from a corrosion pit as the stresses from an external load are intensified atthe pit bottom [31, p. 321]. The crack then propagates through the metal by theaction of an external load, which may be assisted by hydrogen embrittlement, as theenvironment in the crack may allow the generation of hydrogen ions [31, p. 231]. InWWERs, stress corrosion cracking of the SG tubes have been determined [27, p. 4]to have primarily initiated from the secondary side beneath deposits of corrosionproducts and have been found to propagate both intergranularly or transgranularly(IGSCC and TGSCC, respectively) [16, p. 647].
The locations for which SCC and pitting corrosion have occurred in WWER SGshave been in the crevices between the tubes and carbon steel tube support plates(TSP) but also on tube spans where there are no adjacent metals [27]. At the TSP,the build-up of corrosion products can fill the entire crevice which can result in themechanical deformation of the SG tubes, commonly referred to as denting [59]. Thatis, denting is not a corrosion form, but a result of corrosion and build-up of corrosionproducts. For denting to occur, both oxidizing and acidic conditions are required, ofwhich the oxidizing conditions are provided by the presence of oxygen and copper inthe deposits [45, p. 15].
The degradation issues of WWER-440 SG tubes have been less extensive comparedto early PWR counterparts in western countries. Up until 2007, some 300 WesternPWR SGs had been replaced due to corrosion damage of the heat exchanger tubes [60]whereas not a single WWER-440 SG has been in need of replacement [61]. Themain reason for the wast degradation issues of SGs in western countries has beenattributed [45, p. 60] to the use of the mill annealed nickel based Inconel Alloy 600,which was found particularly sensitive to the corrosion mechanisms described above.
To summarize, the effect of removing oxygen on the SG degradation mechanisms

19
can be considered to be the following. With regards to pitting, the absence of oxygenensures that the potential does not reach the critical pitting potential and pitting canthus not initiate. Due to the absence of corrosion pits, the removal of oxygen alsoreduces the risk of SCC whose cracks commonly initiate from sites within corrosionpits. In addition, a low oxygen content reduces the risk of denting but the mechanismthrough which this occurs was not identified from literature. However, the removalof oxygen can be considered to mitigate denting by either reducing the rates of TSPcarbon steel dissolution or the precipitation and attachment of corrosion products atthe deposits, or both.
This section has reviewed three major degradation routes of SG tubes that theuse of hydrazine as an oxygen scavenger aims to mitigate: pitting, SCC and denting.The following section reviews the properties of hydrazine and substitutes of hydrazineas oxygen scavengers and inhibitors in the secondary circuit.
4.3 Hydrazine as oxygen scavenger and corrosion inhibitorThis section describes hydrazine and the following section describes two hydrazinesubstitutes with respect to their corrosion inhibiting properties and in particular,their ability to remove dissolved oxygen from aqueous solutions.
Hydrazine (chemical formula N2H4, CAS number 302-01-2, EC number 206-114-9) is an inorganic compound which as of 2011 has been labelled by the EuropeanChemical Agency as a substance of very high concern since it may be carcinogenic [62,p. 7]. Within the EU, the main use of hydrazine (which amounts to approximately80% of the annual consumption) include polymer production and other forms ofchemical synthesis, in which hydrazine acts as a precursor or reagent [62, p. 17].The second largest application within the EU (which amount to about 20%) includechemical refining, metal reduction and corrosion inhibitors [62, p. 17].
Hydrazine is used as a corrosion inhibitor under boiler and steam generatorconditions as it reduces the corrosion rates of metals through three reactions asdescribed by [13]. The first reaction is that with oxygen, which produces nitrogenand water, shown in equation (6). The removal of oxygen prevents corrosion asdiscussed in Section 4.2. Although the reaction has a theoretical ratio of 1 betweenhydrazine and oxygen, the amount of introduced hydrazine needs to be 2-3 timesthat of oxygen in order to remove oxygen entirely [13, p. 15].
N2H4(aq) + O2(g) −−→ N2(g) + 2 H2O(l) (6)
The reaction rate of oxygen with hydrazine has been estimated [63] as a quasi-first order reaction, as shown in equation (7), with reaction orders of 1 and 0.5for hydrazine and oxygen, respectively. These reaction orders can be consideredindicative as other investigators have reported reaction orders of 0.5 [64, 65] forhydrazine, and 0.5 [64] or 1 [65] for oxygen, depending on the nature of the metalsurfaces facilitating the reactions.
−dCN2H4
dt= −dCO2
dt= kCN2H4C0.5
O2 (7)

20
where:
Ci = concentration of species ik = rate constant
The rate constant k in equation (7) has been demonstrated [63] to be temperaturedependent according to the Arrhenius expression shown in equation (8).
k = k0exp(
− Ea
RT
)(8)
where:
k = rate constantk0 = frequence factorEa = activation energy, 51.8±0.4 kJmol−1 for carbon steel [63]R = gas constant, 8.314 Jmol−1K−1
T = absolute temperature in K
The second reaction, by which hydrazine reduces corrosion rates [13, p. 3], isthe thermal decomposition of hydrazine, which produces ammonia and nitrogen asshown in equation (9). Compared to the oxygen scavenging reaction in equation (6),this reaction occurs much slower and can in the presence of oxygen be considerednegligible under Loviisa secondary circuit conditions since the reaction rate constantfor oxygen scavenging is approximately 260 times that of the thermal decomposition(calculated using estimates from [63] and [64] at 228 C on carbon steel). Nevertheless,when no oxygen is present, the thermal decomposition reaction dominates and theresulting ammonia aids in maintaining alkaline pH, which ensures the passivity ofsteels as described in Section 3.2.
3 N2H4(aq) −−→ 4 NH3(l) + N2(g) (9)The third corrosion impeding reaction of hydrazine [13, p. 4] is the reduction of
hematite to magnetite as shown in equation (10). Since magnetite layers are generallyconsidered more protective than hematite (except against FAC) [26], hydrazine canbe considered a passivating inhibitor [31, p. 359] (or passivator) as it promotes theformation of a more protective passive film on steel surfaces through this reaction.
N2H4(aq) + 6 Fe2O3(s) −−→ N2(g) + 2 H2O(l) + 4 Fe3O4(s) (10)The reaction kinetics for the passivating reaction could not be identified from the
literature, but are presumably slow in comparison to the oxygen scavenging reaction.Nevertheless, with a constant concentration of hydrazine present in the SG, thisreaction ensures that the passive film remains in its magnetite form, which may helpto protect the SG tubes against impurities or should an excessive amount of oxygenunexpectedly reach the SG [14, p. 7].
Hydrazine has three other favorable properties as an oxygen scavenger in thesecondary circuit as identified by [14, p. 7], which an alternative method for oxygenscavenging would have to provide for. The first property is that hydrazine is a volatile

21
liquid, which means that it simultaneously protects sections of the secondary circuitwhere liquid, steam, and both phases interact with metals. The second property isthat hydrazine does not produce solids that could cause problems in the circuit. Thethird property is that hydrazine does not produce, or decompose into, species thatdecrease the solution pH.
This section has reviewed the chemical properties of hydrazine as an inhibitor andoxygen scavenger. To summarize, hydrazine can be considered a versatile corrosioninhibitor with many favorable properties. The following section reviews the literatureon promising alternatives to hydrazine.
4.4 Alternatives to hydrazine in oxygen scavengingAlthough finding an alternative to hydrazine has proved to be challenging, researchershave identified several promising substitutes for oxygen scavenging [14]. These includemethyl-ethyl-ketoxime (MEKO), di-ethyl-hydroxylamine (DH) carbohydrazide (CH)and erythorbic acid (EA). The oxygen reduction kinetics of these compounds underconditions resembling maintenance and revision periods have been measured [66,67] to be in order i) EA, ii) CH, iii) DH, iv) MEKO (from fastest to slowest).Correspondingly, this section reviews the properties of CH, EA and DH. From thesethree compounds, two are then chosen for experimental evaluation.
Carbohydrazide
Carbohydrazide (CH, (N2H3)2CO, CAS number 497-18-7, EC number 207-837-2) is ahydrazine derivative that was introduced to the US utility industry in the 1980’s as areplacement to hydrazine [68]. At temperatures greater than 135 C [68], CH reactswith oxygen via two reaction routes. The first reaction route is the direct reactionshown in equation (11) and it governs the kinetics at lower reaction temperatures.The rate of oxygen removal was determined to follow the expression in equation (12)at temperatures of 25 and 50 C [66, 67]. The rate constant k for this reaction canbe assumed to follow the Arrhenius equation shown in equation (8).
(N2H3)2CO (aq) + 2 O2(g) −−→ 2 N2 (g) + 3 H2O (l) + CO2 (g) (11)
−12
dCCH
dt= −dCO2
dt= kCCHCO2 (12)
The second reaction route is an indirect reaction, by which CH first decomposesto hydrazine, as shown in equation (13), which subsequently reacts with oxygenaccording to equation (6). The rate constant k for the thermal decomposition reactionhas been determined [69] to follow an Arrhenius expression.
(N2H3)2CO (aq) + H2O (l) −−→ 2 N2H4 (aq) + CO2 (g) (13)However, this reaction route occurs somewhat slower than the direct reaction
when under Loviisa secondary circuit conditions, considering that the reaction rateconstant was estimated to be approximately four times greater in the direct reaction.

22
Here, the rate constant for the direct reaction was calculated at 228 C by use oflinear regression from results of [66, 67] and assuming an Arrhenius relationship overthe temperatures range of 25 C and 228 C. Correspondingly, the rate constant viathe indirect route was estimated at 228 C using the results from [69] and assumingthat thermal decomposition acts as the rate-limiting step. That is, at temperaturesof 228 C, oxygen scavenging by CH can be expected to occur primarily (80%) viathe direct reaction and (20%) via the indirect reaction.
Similarly to hydrazine, carbohydrazide also reduces hematite into magnetite asshown in equation (14) and has been shown [68] to passivate carbon steel surfaces moreeffectively than hydrazine at temperatures below 138 C. In addition, carbohydrazideis a volatile compound that does not generate solids to the system [14]. However,when CH reacts it produces carbon dioxide (CO2), which may impact the conductivityand pH of the coolant since dissolved carbon dioxide forms carbonic acid (H2CO3)in water [70, p. 310].
(N2H3)2CO (aq)+12 Fe2O3 (s) −−→ 8 Fe3O4 (s)+3 H2O (l)+2 N2 (g)+CO2 (g) (14)
Although CH acts similarly to hydrazine, it is not hazardous at room temperatureto the environment nor acutely toxic to people [71] and can thus been consideredsafer in terms of handling and storing than hydrazine. However, this safety benefithas been argued [14] to be rather small since much of the handling and storing ofthe chemical would occur by the use of various engineered and closed systems, whichalready limits the exposure to people. Moreover, since CH decomposes into hydrazineat temperatures over 180 C [12], it still poses a remote, but potential toxic risk incase of exposure during operation.
Although CH can technically be considered a reasonable alternative, hydrazineshould ideally be replaced by a method or chemical that poses no toxic risk. Thefollowing sections presents two organic oxygen scavengers that meet this objective.
Erythorbic acid
Erythorbic acid (EA, D-⟨−⟩) -isoascorbic acid, C6H8O6 CAS number 89-65-6 and ECnumber 201-928-0) is a stereoisomer of ascorbic acid (AA), which is more commonlyknown as vitamin C [72]. AA is an antioxidant found naturally in food and usedas a food suppliment [73] but also as an oxygen scavenger in food packaging [74].For this study, the reaction of EA and AA with oxygen can be considered close toidentical, and is in its simplified version [66, p. 8] shown in equation (15). However,the actual reaction mechanisms [75] for these organic molecules are quite complexand their understanding is not necessary for the aim of this thesis.
C6H8O6 (aq) + 12 O2 (g) −−→ C6H6O6 (aq) + H2O (l) (15)
The kinetics of the oxygen scavenging properties of erythorbic acid have beendetermined [66, 67] and the reaction rate was found to follow the expression shownin equation (16) at a temperature of 50 C. In the measurements conducted at room
23
temperature [66], the reaction rate order with respect to EA was estimated to be zero(i.e, the the reaction rate was independent of the EA concentration). Needless to say,the rate constant k for EA can be assumed to also follow the Arrhenius relationshipshown in equation (8).
−dCEA
dt= −dCO2
dt= kCEACO2 (16)
EA passivates steels by converting hematite and iron hydroxide to magnetite [76,p. 7] according to the overall reactions [67, p. 10] in equation (17). However, EA wasdetermined an ineffective passivator of 22K carbon steel at a temperature of 50 Cwhen compared to hydrazine and carbohyrazide [67, p. 32].
C6H8O6 (aq) + 3 Fe2O3 (s) −−→ C6H6O6 (aq) + 2 Fe3O4 (s) + H2O (l)C6H8O6 (aq) + 6 FeOOH (s) −−→ C6H6O6 (aq) + 2 Fe3O4 (s) + 4 H2O (l)
(17)
The reactions of EA produce dehydroerythorbic acid (C6H6O6), which subse-quently undergoes further reactions. Depending on the reaction temperature, pH andoxygen content, erythorbic acid finally decomposes into several organic compounds,including organic acids and salts, water and carbon dioxide [14, p. 17]. The corrosioneffect of these compounds has not been discussed in the literature. In addition, sinceEA is not volatile [77], it does not follow the steam and thus cannot protect steamcomponents.
Nevertheless, EA does not contribute solids to the system [77], it is generallyrecognized as safe (GRAS) by the US food and drug administrationa [78] and thetoxicity [72] is insignificant compared to hydrazine.
Diethylhydroxylamine
N-N-Diethylhydroxylamine (DH, (CH3CH2)2NOH, CAS number 3710-84-7 and ECnumber 223-055-4) is an organic compound that finds uses in paint and polymermanufacturing but is primarily used as an oxygen scavenger in water treatment [79].DH reduces dissolved oxygen according to the reaction [77, p. 3] shown in equa-tion (18). Similarly to EA, the actual reaction mechanisms for DH with oxygenare quite complicated and include several reaction steps [76, p. 6]. Therefore, thetheoretical ratio of DH to oxygen has been estimated to be 1.24 [77, p. 3] althoughequation (18) shows a ratio of 0.44.
4 (CH3CH2)2NOH (aq) + 9 O2 (g) −−→ 8 CH3COOH (aq) + 2 N2 (g) + 6 H2O (18)
The rate of oxygen reduction has been measured [66, 67] for DH and was foundto follow the expression in equation (19). The reaction rate was found to increaseconsiderably with temperature [67, p. 21], which suggests that the rate constant kfollows an Arrhenius relationship, shown in equation (8). However, the reaction ratefor DH was considerably lower than hydrazine, CH and EA, which may limit its

24
applicability. On the other hand, the oxygen reduction rate of DH can be increasedby applying organic catalyst as demonstrated by [80].
−dCO2
dt= kCDHCO2 (19)
DH reacts with iron oxides as shown in equation (20) and has thus been consideredto passivate steels [76, p. 6]. However, the passivating effect of DH on 22K carbon steelwas measured to be quite ineffective compared to that of hydrazine and carbohydrazideat a solution temperature of 50 C [67, p. 32].
DH + 6 Fe2O3 −−→ CH3CH−−NOH + CH3CHO + 4 Fe3O4 + H2ODH + 12 FeOOH −−→ CH3CH−−NOH + CH3CHO + 4 Fe3O4 + 7 H2O
(20)
The reaction products of DH undergo subsequent reactions and the final degrada-tion products include acetaldehyde, dialkyl amines and acetaldoxime acetic acid [77].Depending on what compounds are formed, the reaction products of DH may eitherincrease or decrease the pH of the environment. That is, the pH increases shoulddiethylamine be produced [76, p. 6], whereas the pH decreases if acetic acid forms [77].However, the literature does not mention the requisite for either product to formnor the rate of the decomposition reactions. Regardless of decomposition route andkinetics, the final degradation products should include carbon dioxide, which againmay acidify the coolant.
Although DH is volatile, some of its reaction products are not. E.g., in an alkalinesolution containing sodium hydroxide, acetic acid (CH3COOH, from the oxygenreduction in equation (18)) reacts with sodium to form sodium acetate which wouldremain in the SG [76, p. 6]. That is, DH contributes probably with solids (such assodium or calcium acetate [77]) that may deposit in the SG. Other reaction products,such as diethylamine, are volatile and can thus proceed to the steam-containingsections of the secondary circuit and protect these by controlling the pH [76, p. 6].
The toxicity of DH [81] is minor in comparison to hydrazine and can thus be usedmore safely. However, DH has been suspected to be carcinogenic and mutagenicand thus included [82, p. 8] in the community rolling action plan (CoRAP, which isthe first step of chemical regulation via REACH). That is, DH may face a similarregulation as hydrazine in the future.
To summarize, this section has introduced three organic compounds that mayprovide effective oxygen scavenging properties to the secondary circuit. Althoughthey do not fulfill the properties of hydrazine on an individual level, they may becombined with other chemicals or techniques to do so. In this study, the rate ofoxygen reduction for EA and DH are measured and compared against hydrazine.The following section presents two methods for determining the oxygen reductionrates.

25
5 Electrochemical techniquesThis chapter evaluates the electrochemical techniques used to determine the rateof oxygen reduction and the corrosion properties of carbon steel as an effect ofconcentration of oxygen scavengers. This chapter aims to evaluate the techniques withrespect to if they produce reliable outcomes under the conditions of the experiments.Section 5.1 introduces the electrochemical cell and the three-electrode set-up which themeasurement techniques rely on and the subsequent sections review the measurementtechniques from the literature.
5.1 Electrochemical cellsAn electrochemical cell used for experimental purposes is shown in Figure 8. Theelectrochemical cell commonly comprises of three electrodes: i) the working electrode(WE), which is the sample material and object of study, ii) the reference electrode(RE, such as Ag/AgCl), against which the potential of the WE is measured, and iii)the counter electrode (CE, commonly platinum), which provides a path for currentand closes the cell circuit [31, p. 168].
Figure 8: A glass cell used for electrochemical measurements including a threeelectrode set-up of working, counter and reference electrodes. Image adapted from [31,p. 168].
The electrodes are connected to a control and measuring device, commonly calleda potentiostat, which is connected to the electrochemical cell as shown in Figure 9.The potentiostat can carry out various electroanalytical measurements in both directcurrent (DC) and alternating current (AC) modes.
In DC mode, the potentiostat can be used to conduct measurements that are eithercurrent or potential controlled [31, p. 168]. In potential controlled measurements,such as linear polarization resistance (LPR), the potentiostat supplies a current at

26
Figure 9: The three-electrode set-up connected to a potentiostat under a potentialcontrolled measurement. E stands for the controlled WE potential, CA for controlamplifier (which is a type of operational amplifier), Um and Rm for the currentmeasuring voltage and resistor, Icell and Rcell for the cell current and resistor, andUa for the measured actual voltage between the RE and WE. The image was drawnbased on [83, p. 254].
the CE in order to maintain the potential of the WE (with respect to the RE, Ua)at a desired value E and records the current Icell [31, p. 168]. The LPR method isreviewed from the literature in Section 5.3.
In AC measurement mode, such as electrochemical impedance spectroscopy(EIS), the potentiostat applies an alternating current or potential perturbation ofsmall amplitude on the WE over a range of frequencies and measures the resultingimpedance of the sample [31, p. 427]. Section 5.4 reviews EIS from the literature.
The results from electrochemical measurements can be used to depict the kineticsof the electrochemical cell by the use of an equivalent circuit. The most simple of theseequivalent circuits is considered to be the Randles circuit, shown in Figure 10 [84].
The current Icell in an electrochemical cell corresponding to the Randles circuitresults from two processes. The first process is the electron transfer of a redoxreaction [42, p. 639] (e.g., the corrosion reaction of iron according to equation (5)),which generates a current that passes the charge transfer resistor component Rct.This process is also termed [42, p. 22] a Faradaic process and the resulting current aFaradaic current. The value of Rct for a corroding metal is inversely proportional tothe reaction rate of the redox reaction [42, p. 639]. That is, Rct can be consideredinversely proportional to the corrosion rate.
The second current generating process is the charging of the EDL [42, p. 639],represented by the capacitor Cedl, by which charged species in the electrolyte approachthe WE surface and are adsorbed onto it. This charging of the EDL results in aso-called non-faradaic current [42, p. 22].

27
Both Faradaic and non-faradaic currents (i.e., charge transfer and capacitivecurrents, respectively) pass through the solution resistor Rs [42, p. 639]. The solutionresistance causes a voltage drop on the measured voltage Ua equivalent to IcellRsaccording to Ohm’s law should the RE and CE be positioned at the same distancefrom the WE [42, p. 24]. By placing the RE as close as possible to the WE, themeasurement error from the voltage drop can be reduced by an amount IcellRc to avalue IcellRuc. The Rc and Ruc are the compensated and uncompensated part of thesolution resistance, respectively [42, p. 24].
Figure 10: Suggested equivalent circuit for the carbon steel metal-solution interface.WE is the working electrode, CE is the counter electrode, Cedl is the equivalentcapacitor for the electrical double layer, Rct is the equivalent resistor for chargetransfer and Rs is the equivalent resistor for the solution. Image adapted from [31,p. 432].
5.2 Electrochemical oxygen sensorsThe rate at which oxygen scavengers reduce dissolved oxygen from a liquid can bedetermined by measuring the oxygen concentration as a function of time, as shownin Section 4.3. To this end, this thesis utilizes two types of electrochemical sensorsfor measuring the oxygen concentration: i) a commercial membrane sensor and ii) anexperimental redox sensor. This section discusses the operating principles for thesetwo sensors.
Commercial sensor
The first oxygen sensor is an "Orbisphere model 3660 analyzer" produced by HachCompany which comprises of a two electrode setup, shown in Figure 11. Theelectrodes are immersed in an electrolyte and covered by an oxygen permeablemembrane, which allows for diffusion of dissolved oxygen between the cathode andthe analyzed solution [85, p. 508].

28
Figure 11: Top-view of the Orbisphere 3660 analyzer sensor head. Image adaptedfrom [86, p. 54].
According to the operational manual [86, p. 53], the sensor operates by applying aconstant voltage to the anode and measuring the current at the anode, which fits thedescription of a polarographic oxygen sensor described by [87, p. 17]. A polarographicsensor operates by applying a constant potential at the anode, causing the oxygen toreduce at the cathode according to equation (3) [85, p. 508]. The resulting currentthrough the sensor is then directly proportional to the oxygen concentration via therelation of Fick’s first law of diffusion as discussed in [88, p. 260].
The Orbisphere sensor measures the oxygen concentration over a range of 1ppb to 80 ppm at an accuracy of ±1% [86, p. 51]. In addition, the analyzercompensates the measured current with respect to the temperature of the solutionby the use of an external temperature sensor. Furthermore, the highest operatingtemperature and pressure are 100 C and 20 bar, respectively. The response time ofthe sensor after an 90% change in oxygen concentration is 30 seconds. Consideringthese operating conditions, the sensor can be regarded applicable for use as anconcentration measurement device for the experiments, provided that the sensoris placed in a location where the temperature and pressure are within the sensorspecifications.
Experimental sensor
The second sensor is a three electrode set-up with WE and CE consisting of platinumand a Ag/AgCl RE. The in-house sensor allows for estimate measurement of theconcentration of dissolved oxygen from the potential of the platinum WE assumingthe reaction in equation (21) using the relationship in equation (22) as demonstratedby [89, p. 13].
O2 (g) + H2O (l) + 2 e− −−→ 12 H2O2 (l) + 2 OH− (aq) (21)
CO2(t) = exp(
zF
RT
(E(t) − E
)) (22)

29
where:
z = number of transferred electrons, 2 in this caseF = Faraday constant, 96485 C mol−1
R = gas constant, 8.314 J mol−1K−1
T = absolute temperature in KE(t) = measured cell potential at time t in VE
= standard cell potential, 0.37 V at 228 C and pH 7 [89, p. 13]
In previous measurements [89, p. 13], the sensor was shown to generate good esti-mates of oxygen concentrations at 10 ppm using the relationship above. However, atlower oxygen concentrations, such as 100 ppb, the sensor was not able to measure theoxygen content accurately. Therefore, the equation (23) was derived for determiningthe rate of oxygen reduction. The origin of equation (23) is given in Appendix A.
E(0) − E(t) = RT
4αrFk′t (23)
where:
E(t) = measured cell potential at time t in Vαr = transfer coefficient for the oxygen reduction reaction, 0.043 [90]k′ = apparent rate constant in s−1
The benefit of this sensor is that it is able to operate at high temperatures andpressures whereas the membrane sensor is limited to 100 C and 20 bar. That is,under conditions resembling the secondary circuit, the experimental sensor can bedirectly placed at the location of oxygen scavenging, whereas the commercial sensorhas to be placed in a cooled segment on the return line. Therefore, the experimentalsensor can be considered to gather more representative data.
5.3 Linear polarization resistanceLinear polarization resistance (LPR) is a non-destructive polarization method carriedout with a three electrode set-up. Polarization essentially means that the potentiostatsupplies current via the CE to shift the WE potential an amount η into either positiveor negative direction from the open circuit potential EOCP [31, p. 127]. When theamount of polarization η is low (on the order of ±30 mV), the measured currentcorrelates linearly with the potential as shown in Figure 12.
The inverse of the slope for the linear region in Figure 12 is then equivalent byOhm’s law to a resistance, or the so-called polarization resistance Rp [31, p. 161],as shown in equation (24). The polarization resistance Rp can be considered thesum of the charge transfer resistance Rct and the uncompensated resistance Rucof the equivalent circuit shown in Figure 10 [91, p. 1145]. If the uncompensatedresistance is much smaller than that of charge transfer, the polarization resistancecan be considered approximately that of the charge transfer. In case of steels coveredwith an oxide film such as WWER secondary circuits, the polarization resistance

30
Figure 12: Polarization curve in the proximity of the open circuit potential showinga linear dependency between current and potential. Image adapted from [31, p. 160].
consists, in addition to the charge transfer resistance, of the resistance of the oxidefilm.
dη
dinet
= Rp = Rct + Ruc (24)
where:
η = amount of polarization in Vinet = net current density in Acm−2
Rp = polarization resistance in Ωcm2
Rct = charge transfer resistance in Ωcm2
Ruc = uncompensated resistance in Ωcm2
The electrode set-up used in the LPR measurements were similar to that for theexperimental oxygen sensor and the LPR measurements can be considered applicablealso at high temperatures and pressures. However, LPR as a method relies onseveral assumptions in order to produce reliable results [91, p. 1144] which have tobe considered. One assumption is that the system has reached a steady state sothat the open circuit potential remains constant. In the measurements in this thesis,there was a risk of the system not reaching steady-state due to practical reasonsprior to starting the measurements in particular after and during the injection ofoxygen scavengers. Therefore, these measurements must be analyzed cautiously.
Another assumption is that the measured potential and current show a linearrelationship as shown in Figure 12, which would have to be confirmed with linearregression analysis. However, due to the large amount of LPR data gathered in the

31
thesis experiments, linear regression analysis was not conducted on every single dataset. This has to be considered in the discussion of the results.
A third assumption is that the uncompensated resistance is much smaller thanthe charge transfer resistance. In our experiments, placing the RE as close as possibleto the WE was not possible due to the arrangement of the measurement cell andtherefore the uncompensated resistance can be expected to be significant and mustthus be accounted for accordingly. One method for discriminating the uncompensatedand charge transfer resistances is by measuring the voltage drop separately or bycomplementary EIS measurements [91, p. 1145], of which the latter is reviewed inthe following section.
5.4 Electrochemical impedance spectroscopyElectrochemical impedance spectroscopy (EIS) is an electrochemical technique thatapplies an sinusoidal perturbation of either current or potential to the electrochemicalsystem of interest, such as the metal-solution interface of carbon steel under secondarycircuit conditions, and measures the impedance response of that system [31, p. 427].The experimental setup for EIS comprises of a three electrode set-up inside anelectrochemical cell and a potentiostat [31, p. 430].
In EIS measurements, the presence of an alternating electric field causes differentparts of the metal-solution interface to respond at characteristic frequencies [31,p. 427], which the EIS potentiostat measures as a value of impedance. Consideringthe equivalent circuit in Figure 10, the resistors Ruc and Rct have impedances (Zuc andZct, respectively) equivalent to their resistances as shown in equation (25) whereasthe capacitor Cedl has an impedance Zedl expressed as a complex number as shownin equation (26) [31, p. 431].
Zuc = Ruc
Zct = Rct
(25)
where:
Zi = impedance of component i in Ωcm2
Ri = resistance of component i in Ωcm2
Zedl = 1jωCedl
= 1j2πfCedl
(26)
where:
Zedl = electrical double layer impedance in Ωcm2
j = imaginary number√
−1ω = angular frequency 2πf in Hz or s−1
Cedl = electrical double layer capacitance in µFcm−2
f = frequency in Hz or s−1

32
Circuit analysis and a bit of algebra [92, p. 302] gives the total impedance of theequivalent circuit in Figure 10 as a complex number shown in equation (27).
Z = Ruc + Rct
1 + ω2C2edlR
2ct
− jωCedlR
2ct
1 + ω2C2edlR
2ct
(27)
The total impedance Z consists of a real (Z′) and imaginary part (Z′′) as shownin equations (28),(29) and (30) [31, p. 433]. The absolute impedance |Z| is theEuclidean distance as shown in equation (31)[31, p. 430].
Z = Z ′ + jZ ′′ (28)
Z ′ = Ruc + Rct
1 + ω2C2edlR
2ct
(29)
Z ′′ = − ωCedlR2ct
1 + ω2C2edlR
2ct
(30)
|Z| =√
Z ′ 2 + Z ′′ 2 =⎡⎣(Ruc + Rct
1 + ω2CedlR2ct
)2
+(
ωCedlR2ct
1 + ω2C2edlR
2ct
)2⎤⎦ 1
2
(31)
Equation (31) shows that the absolute impedance can have two limit values.At very high values of angular frequency ω, the impedance approaches that of theuncompensated resistance Ruc as shown in equation (32). On the other hand, whenthe angular frequency approaches zero, the impedance approaches the sum of theuncompensated and charge transfer resistances as shown in equation (33).
limω→∞
|Z| =⎡⎣(Ruc + Rct
1 + ∞
)2+(
CedlR2ct
1∞ + ∞
)2⎤⎦ 1
2
= Ruc (32)
limω→0
|Z| =⎡⎣(Ruc + Rct
1 + 0
)2+( 0
1 + 0
)2⎤⎦ 1
2
= Ruc + Rct (33)
These limits appear as horizontal lines in the Bode plot in Figure 13A [31, p. 435].Between the horizontal lines, the spectra appears as a sloped line, which representsthe capacitor of the EDL. The impedance spectrum can also be plotted as theimaginary impedance against the real impedance in a so-called Nyquist plot shown inFigure 13B [31, p. 433]. Here, the limit values for the absolute impedance are shownintercepting the x-axis at either end of a half-circle with a radius Rct/2. At the pointof the half-circle apex (i.e., when dZ′′/dω= 0), the value of angular frequency can beused to determine the capacitance of the EDL according to equation (34).
ωZ′′max
= 1RctCedl
(34)

33
Figure 13: Impedance spectrum shown as A) Bode plot and B) Nyquist plot. Imagesadapted from [31, p. 434].
By the use of EIS, all three components of the equivalent circuit for the metal-solution interface can be determined as described above. However, an actual electro-chemical system is usually more complex and the measured impedance responsesmay deviate from that of the Randles circuit. In that case, the equivalent circuitmay have to be adjusted by adding or replacing components, thus constructing amore elaborate equivalent circuit.
Finding a representative equivalent circuit for a complex system may provechallenging as numerous circuits may equally well model the same impedance responseas shown by [93]. Therefore, the equivalent model should be constructed so thateach component represents a plausible chemical or physical process of the measuredelectrochemical system. The use of an equivalent circuit should also be justified bye.g., changing the physical properties of a component and verifying its effect on theimpedance response [94, p. 49].
The impedance spectra of carbon steel under secondary circuit conditions, shownin Figure 14, significantly deviate from the ideal response of the Randles circuit.The deviation was attributed to [24] the properties of the inner oxide layer ratherthan the capacitance of the EDL. The model for analysing these spectra did notrely on an equivalent circuit, but was derived [95, 96] from properties of the oxidelayers according to the mixed conduction model, some of which were introduced inSection 3.3.
Considering the thesis scope, it would be excessive to fit impedance spectra tothe mixed conduction model. Instead, this thesis assumes a modified Randles circuitshown in Figure 15 in which the EDL capacitor Cedl has been replaced by a constantphase element (CPE), which is an imperfect capacitor. The CPE has an impedanceZCPE described [97] in general by the expression in equation (35), which is similar tothe complex impedance of a capacitor. Correspondingly, the CPE has a capacitanceCCPE according to equation (36) [98].
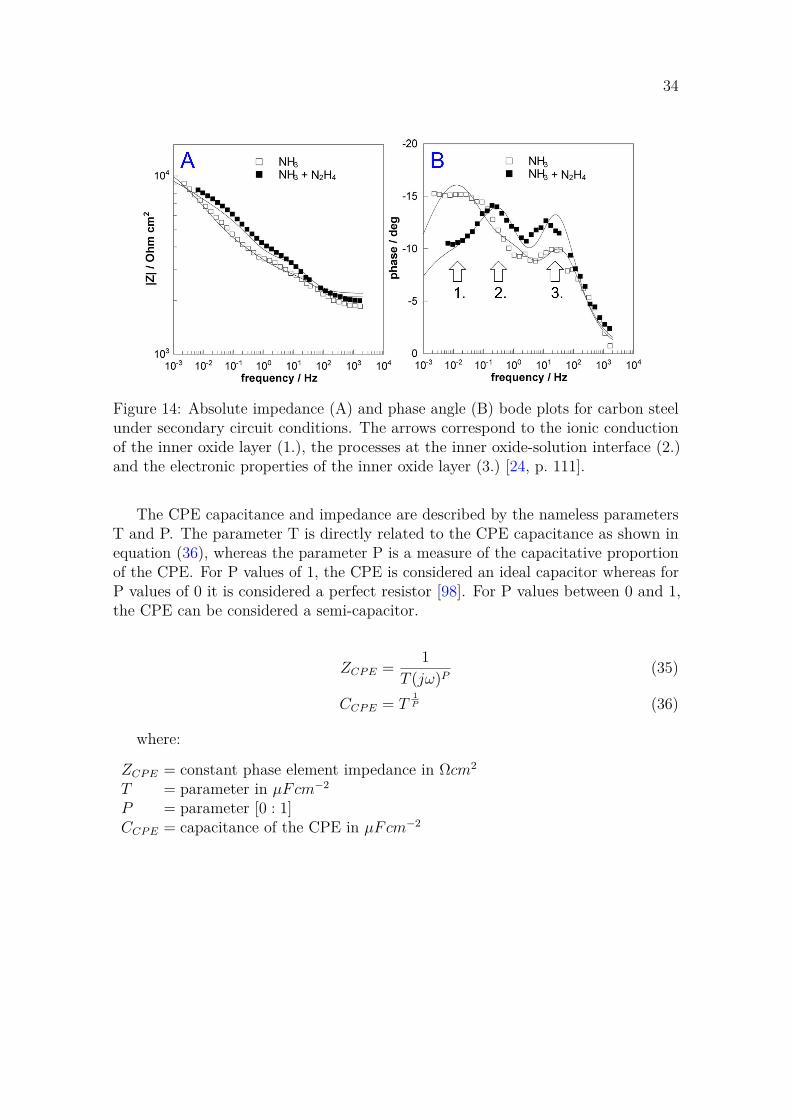
34
Figure 14: Absolute impedance (A) and phase angle (B) bode plots for carbon steelunder secondary circuit conditions. The arrows correspond to the ionic conductionof the inner oxide layer (1.), the processes at the inner oxide-solution interface (2.)and the electronic properties of the inner oxide layer (3.) [24, p. 111].
The CPE capacitance and impedance are described by the nameless parametersT and P. The parameter T is directly related to the CPE capacitance as shown inequation (36), whereas the parameter P is a measure of the capacitative proportionof the CPE. For P values of 1, the CPE is considered an ideal capacitor whereas forP values of 0 it is considered a perfect resistor [98]. For P values between 0 and 1,the CPE can be considered a semi-capacitor.
ZCP E = 1T (jω)P
(35)
CCP E = T1P (36)
where:
ZCP E = constant phase element impedance in Ωcm2
T = parameter in µFcm−2
P = parameter [0 : 1]CCP E = capacitance of the CPE in µFcm−2

35
Figure 15: Suggested equivalent circuit for fitting impedance spectra. The CPE isan imperfect capacitor, which may represent either the EDL or the iron oxide.

36
6 ExperimentalThis chapter presents the methodology, materials and equipment used in the thesis ex-periments. This chapter thereby provides necessary information for other researchersto reproduce the experiments and possibly confirm or debunk any drawn conclusions.
6.1 Equipment and materialsThe experiments were conducted in a water circuit shown schematically in Figure 16.The water was purified with a mixed-bed ion exchanger (Veolia SD2000) and thepH25C was adjusted using ammonia to 9.6±0.2, resulting in a conductivity of 13±5μS/cm2. The content of dissolved oxygen was adjusted to 100±20 ppb and 10±2ppm by bubbling nitrogen and oxygen in the mixing tank.
The circuit is divided into a low pressure, cold section and a high pressure, hotsection. The cold section, which had a temperature of 26±1 C and a pressure of1.0±0.3 bar above the ambient, provided the experiments with water of consistentquality in terms of conductivity, pH and oxygen content. The cold section alsoaccomodated the commercial oxygen sensor.
The condition of the hot section was adjusted to a temperature of 228±1 Cand pressure of 65±1 bar, resembling the feedwater at the entry point to Loviisasteam generators but at a comparatively small flow rate of 220±10 ml/min. The6 mm outer diameter pipeline of the hot section was made of titanium, while theflow-through cell consisted of AISI 316 stainless steel.
Figure 16: Water circuit comprising of a cold (blue) and hot (red) section. Themeasurements took place at locations marked by O2(t), LPR and EIS. γ indicates aconductivity sensor while LP and HP are low and high pressure pumps, respectively.Image reproduced from [24].
The 0.3 l volume flow-through cell housed a 0.05 M KCl Ag/AgCl RE (-0.0051 V vsSHE at 225 C [99, p. 655]) and two WE-CE pairs for electrochemical measurements.The first electrode pair was a 7 cm2 platinum mesh CE wrapped around a 1 cm2

37
cuboid-shaped 22K carbon steel WE at a separating distance of 5 mm. Grade 22Kcarbon steel has a nominal composition of 0.19-0.26% C, 0.75-01.0% Mn, 0.2-0.4% Si,≤0.03% P, ≤0.03% S, ≤0.3% Cr, ≤0.3% Ni, ≤0.3% Cu and balance Fe [19, p. 109].The second electrode pair comprised of a 10 cm2 platinum wire CE coiled around a 1cm2 platinum wire WE at a separating distance of 5 mm. The flow velocity in theflow-through cell was approximately 3 mm/s.
The studied oxygen scavengers were erythorbic acid (EA, 98% Alfa Aesar) anddiethylhydroxylamine (DH, 97%, Alfa Aesar). In addition, hydrazine (HZ, hydrazinemonohydrate, 98% Sigma-aldrich) was used as a reference oxygen scavenger. Theoxygen scavengers were dissolved into deoxygenated and deionized water producingstock solutions of concentrations between 0.15 mM and 60 mM.
The oxygen scavenger stock solutions were injected at the entry point to theflow-through cell using a liquid chromatography pump (Shimadzu LC-20AT). Theoxygen scavengers were injected to achieve molecular concentrations between one toten times that of the initial concentration of dissolved oxygen. The rate of injectionwas adjusted for the actual oxygen content to a value between 2 ml/min to 5 ml/min,having corrected for the pumping rate error described in Appendix B. The oxygenscavengers were finally removed from the water by filtering through the ion exchanger.
6.2 Oxygen reduction kineticsThe concentration of dissolved oxygen was continuously measured prior to, during andafter administration of oxygen scavengers using two oxygen sensors. The experimentalPt-Pt sensor, which was located in the hot section flow-through cell, measured theoxygen concentration close to the injection point. The commercial sensor, which wasplaced in the cold section return line, measured the oxygen concentration roughlythree minutes downstream from the injection point.
In case of the commercial sensor, the rate of oxygen reduction was determined fromthe general equation [63] shown in (37). The expression was simplified to equation (38)by substituting with the apparent rate constant k′ = kC m
OS and assuming a unityvalue for n as previous measurements have shown [66, 67] a pseudo-first reactionrate order with respect to oxygen. The simplified expression can be reorganizedwith a bit of algebra and finally integrated to give the linear relationship shown inequation (39).
−dCO2
dt= kC m
OSC nO2 (37)
k′=kC mOS=====⇒
n=1−dCO2
dt= k′CO2 (38)
algebra======⇒integration
lnC
O2
CO2
= k′t (39)
Using the relationship in equation (39), linear regression analysis was made todetermine the apparent rate constant k′. Based on the determined k′ values, a second
38
linear regression analysis was applied to determine the rate constant k from therelationship k′ = kC m
OS.In case of the experimental sensor, the apparent rate constant k′ was determined
using linear regression of the expression in equation (40). The resulting k′ values werethen feed into a second linear regression analysis to determine the rate constant kfrom the relationship k′ = kC m
OS. The origin of equation (40) is given in Appendix A.
E(0) − E(t) = RT
4(αo + αr)F(k′ − k′′)t (40)
6.3 Electrochemical measurements of carbon steelThe effect of OS addition on the linear polarization resistance and electrochemicalimpedance spectra were measured for a carbon steel sample conditioned for 72hours in 228 C water with an oxygen content of 100±20 ppb using an AutolabPGSTAT302F potentiostat and the electrochemical cell described above. Additionalmeasurements were conducted in oxygen concentrations of 10±2 ppm. The sampleswere ground with P1200 grit emery paper prior to installation to the water circuit.
In the LPR measurements, the potential was swept from -20 mV to +30 mV withrespect to a stable open circuit potential at a rate of 10 mV/min after held for 60 sat -20 mV. The intent was to use the standardized potential window of -30 mV to+30 mV relative to the corrosion potential but the initial 10 mV (from -30 mV to -20mV) produced non-linear relationships and were thus omitted in all measurements.The LPR measurements were repeated three times and the polarization resistanceswere determined using linear regression.
In the EIS measurements, a 30 mV alternating current was applied over a broadfrequency range of 10 kHz to 1 mHz in the absence of oxygen scavengers and over anarrower frequency range 200 Hz to 10 mHz in the presence of oxygen scavengers.The narrow frequency range in the presence of oxygen scavengers was applied tospeed up the impedance measurements since the prepared stock solution of oxygenscavengers would otherwise have run out during the measurement. The impedancespectra were analyzed and fit to equivalent circuits using Zview software.

39
7 Results and discussionThis chapter presents the experimental results and compares them to the resultsof previous studies. Should the results deviate from previous studies, this chaptersconsiders procedural and theoretical reasons that could explain such deviations.
7.1 Oxygen reduction kineticsThe rate at which the oxygen scavengers (OS) react with dissolved oxygen (DO) wasdetermined by measuring the change in oxygen concentration using a commercialsensor and the change in electrochemical potential of an experimental sensor asthe oxygen scavengers were administered into the experimental water circuit. Theexperimental Pt-Pt sensor was located close to the injection point and the commer-cial oxygen sensor was located in the cold section return line. The initial oxygenconcentration was adjusted in the majority of the measurements to 100±20 ppb butadditional measurements were also carried out in 10±2 ppm.
Commercial sensor
The typical measurement procedure is presented in Figure 17A, which shows thedecline in oxygen concentration as the oxygen scavenger was administered into thewater circuit. The measurements were repeated up to seven times by periodicallyinjecting the oxygen scavengers with a dosing pump. Prior to injection, the pumpingrate was adjusted to the oxygen concentration at the time to ensure a consistentconcentration ratio of oxygen scavengers and dissolved oxygen during each injection.
Figure 17: Exemplary results from A) the concentration measurements (EA, OS/DOratio 6, 80-90 ppb C
O2) and B) the corresponding linear regression analysis from
the first four injections. The linear regression analysis was used to determine theapparent rate constant k′. The k′ value of the first injection was usually found to bean outlier as shown in B).

40
The apparent rate constants k′ were determined from the linear relationshipsshown in Figure 17B. For each injection and corresponding instance of analysis,the initial oxygen concentration C
O2 was set to the last measured stable value of
oxygen concentration prior to the decline. The k′ values were tested using the Q testmethod [100] and the resulting outliers were excluded if the certainty was 90% ormore.
The oxygen reduction kinetics determined using the commercial sensor are shownwith respect to the injected amount of OS in Figure 18. The apparent rate constantsk′ showed a semi-linear relationship with respect to the OS concentration as shownin Figure 18B which corresponds to a unity value for the exponent term m. Theapparent rate constants k were determined over the linear regions using linearregression analysis as shown in Figure 18B and the rate constant values are shownin Table 2.
The results show that HZ and EA have considerably greater reaction rate constantsthan that of DH, which is a trend also shown in previous measurements [67] andcan thus be considered an expected result. On the other hand, the reaction rateconstant was found greater for EA than for HZ whereas previous measurementshave shown that HZ is considerably faster than EA. Considering that the previousmeasurements [66, 67] were conducted at low temperatures, one explanation couldbe that the reaction kinetics of EA are accelerated to a greater extent with the risein temperature, thus allowing EA to approach the kinetics of hydrazine. However, abeneficial temperature dependency cannot singlehandedly explain why EA wouldhave faster kinetics than HZ, considering that EA is an organic chemical with asignificantly larger molecular structure and that it may undergo many reaction stepsprior to the oxygen reduction reaction compared to HZ.
Figure 18: The apparent rate constant k′ as a function of A) the ratio of OS to DOand B) the OS concentration.
The indication that EA was measured to have faster kinetics than HZ caninstead be attributed with greater confidence to a systematic difference in the

41
measurements. The measurements differed in the initial oxygen concentration, whichfor measurements of EA were in the range of 80-100 ppb and for HZ in the range of100-120 ppb. Since the injected amount of OS was dictated by the concentration ratioof OS to oxygen, the lower oxygen concentrations during EA measurements resultedin lower OS concentrations in Figure 18B. As a consequence, the linear regressionsproduce a seemingly steeper slope for EA than for HZ although the concentrationratios were in fact the same as indicated in Figure 18A.
Although the automatic adjustment of the oxygen concentration provided consis-tent oxygen levels between consecutive days of measurements, the oxygen level couldvary between weeks. Since the tests with a specific OS usually extended over one ortwo weeks, the kinetics of the following OS was measured in waters having a slightlydifferent level of dissolved oxygen.
That is, Figure 18B and the rate constants k would have been suitable ascomparative measures if the initial oxygen concentration had been equal betweenthe measurements. However, since the concentrations did differ (although onlymoderately), Figure 18A is more applicable for comparing the oxygen reductionkinetics of these experiments. Figure 18A shows that the reaction rate is marginallyfaster for hydrazine than for EA. This trend was also found in the measurementsconducted in waters saturated with oxygen, having an initial oxygen concentrationof 10±2 ppm.
Although the oxygen reduction kinetics was only measured at two oxygen levels(and at the same concentration ratio OS to oxygen), the results indicate that theassumption of a unity rate order with respect to oxygen was within reason. Thisis because the ranking of the apparent rate constants k′ between OSs remained thesame at both oxygen concentrations (100 ppb and 10 ppm) and k′ values increasedwith the same proportions with an increase in oxygen concentration.
The dosing pump was found to cause an undesired ingress of air which has affectedthe results of the kinetic measurements as discussed in Appendix C. Nevertheless,the entered amount of air was considered quite insignificant and is believed to haveonly slightly distorted the results by producing somewhat slower reaction kinetics.
Experimental sensor
The measurement data from the experimental sensor was analysed analogously to thatof the commercial sensor as described previously. An exemplary set of measurementdata from the experimental sensor is shown in Figure 19A. The figure shows thatthe potential decreases as the oxygen scavengers were injected. The decrease inpotential was considered proportional to the decrease in oxygen concentration. Underthis assumption, the apparent rate constants k′ were determined using the linearrelationship between the change in potential and time as shown in Figure 19B.
The oxygen reduction kinetics determined from the experimental sensor data areshown as functions of the injected amount of OS in Figure 20. The apparent rateconstant k′ displayed linear relationships with the OS concentration, as shown inFigure 20B. This observation justifies the assumption of first rate orders with respectto the OSs (i.e., the exponent m can be considered to have a value of 1). The rate

42
Figure 19: Measurement results from A) the Pt-Pt cell potential (EA, OS/DO ratio8) and B) the corresponding linear regressions of the first four injections.
constants k were determined over the linear regions using the expression embeddedin Figure 20B and the rate constants are shown in Table 2.
Figure 20: The apparent rate constant k′ as a function of A) the ratio of OS to DOand B) the OS concentration. The initial oxygen concentration was about 80-90 ppbprior to OS injection.
The results suggest that EA and HZ have faster reaction kinetics than DH, whichcorresponds well with the results from the commercial sensor. However, the resultsalso suggest that the reaction kinetics of EA are faster than HZ, which deviatesfrom the results of previous studies [67, 66]. In comparison with the results fromthe commercial sensor, the results here deviate by indicating faster kinetics for EAthan HZ in both Figures 20A and B. Therefore, the deviations cannot be attributedto minor differences in the initial oxygen concentration nor to EA having kineticsthat benefit more from an increase in temperature. Instead, the deviation has tooriginate from a difference in the measurement methods.

43
Comparing to the results from the commercial sensor, the experimental sensorproduces higher rate constants. Since the Pt-Pt sensor cannot discriminate betweenredox reactions (poor selectivity), this observation suggests that the change in theelectrode potential may result from some complimentary redox reactions in additionto the oxygen reduction reactions. These complimentary reactions are discussedmore thoroughly in the LPR and EIS result sections. Considering this deviation, thethesis finds the results of the commercial sensor more representative.
In addition, the rate constants for the organic substitutes had increased to alarger extent than for HZ as they were 57% and 118% higher for EA and DH, butonly 23% higher for HZ. This finding suggests that EA and DH may contribute withcomplimentary reactions to a larger extent than HZ.
The measurements with a concentration ratio of 3 were repeated in waters withan oxygen content of 10±2 ppm. The results indicate that the assumption ofunity reaction rate order with respect to oxygen was within reason. However, theresults corresponded poorly wit the 100 ppb measurements as DH and EA displayedsignificantly faster reaction kinetics than HZ in the 10 ppm measurements. Moreover,the results corresponded poorly with the data from the commercial sensor. Thesefindings demonstrate again that greater confidence should be put in the commercialsensor.
Summary of the kinetic measurements
The results from the Pt potential and oxygen concentration measurements verifiedsemi first order reaction rates with respect to both oxygen and the oxygen scavengers.More importantly, the results from the kinetics measurements demonstrated that thereaction kinetics of EA are as fast as those of hydrazine, whereas the reaction ratesof DH are approximately one third of hydrazine. In addition, the results demonstratethat the experimental sensor was able to fairly well estimate the reaction rates ofthe three oxygen scavengers when the initial oxygen content was about 100 ppb.
Table 2: Reaction rate constants of hydrazine (HZ), erythorbic acid (EA) and diethyl-hydroxylamine (DH) determined using a commercial sensor (CS) and experimentalsensor (ES) in secondary circuit water (228 C, 66 bar and buffered with NH3 topH25C 9.6±0.2).
OS Rate equation CO2 (ppb) Method k (mM-1s-1) R2
HZ kCHZCO2 100-120 CS 1.34±0.03 0.94ES 1.65±0.03 0.97
EA kCEACO2 80-100 CS 1.65±0.03 0.96ES 2.59±0.05 0.94
DH kCDHCO2 90-120 CS 0.40±0.01 0.99ES 0.87±0.04 0.85

44
7.2 Electrochemical measurements of carbon steelLinear polarization resistance
The polarization resistance was measured for type 22K carbon steel in the presenceof the oxygen scavengers using the LPR method. The results from the LPR mea-surements in secondary circuit water containing about 100 ppb of oxygen are shownin Figure 21.
Figure 21: The polarization resistance for carbon steel decreased with A) an increasingratio of OS to oxygen and B) a decreasing concentration of oxygen. Repeated testswith hydrazine after an extended exposure time did in part not reproduce the sameresults.
Figure 21A shows that the polarization resistance decreased with an increasingconcentration of oxygen scavengers. The figure shows that the substitutes EA andDH reduce the resistance to a greater extent than hydrazine. Correspondingly, thepolarization resistance was found to decrease with a declining oxygen concentration,as shown in Figure 21B, regardless whether oxygen scavengers were present or not.However, in the presence of EA and DH, the polarization resistance decreased furtherthan if the oxygen was removed by bubbling nitrogen. HZ did not reduce thepolarization resistance beyond that achieved by scavenging with nitrogen gas.
The LPR measurements were also conducted in water saturated with oxygen,having an initial oxygen concentration of 10±2 ppm. However, the measurements werelimited to one injection series, where the OSs were administered at a concentrationratio OS to oxygen of approximately 3. Nevertheless, similar trends of decreasingpolarization resistances were found in these measurements. Although the chemicalsdid not differentiate as distinctively as in the measurements in 100 ppb oxygen, EAand DH were again found to decrease the polarization resistance to a larger extentthan HZ.
These results may seem counter-intuitive since a lower polarization resistance

45
would mean a higher corrosion rate, but previous researchers [67, 24] have alsoreported decreases of polarization resistance and it can therefore be considered anexpected result. Indeed, the decrease in polarization resistance with the addition ofhydrazine was found to correlate with an increased corrosion rate as confirmed byweight loss measurements (100 h exposure time, same environment) [24].
Another explanation for the decrease in polarization resistance may be parallelredox reactions taking place at the oxide-solution interface in addition to the corrosionreactions as discussed in [67]. These complimentary reactions may include oxidationreactions of the OS [67], such as intermediate reaction steps for the reduction ofoxygen. In addition, once most of the oxygen has been consumed, the oxidationreactions of the OS may couple to the reduction of the outermost layer of the oxidefilm, such as the reduction of FeOOH to Fe3O4 which results in a more protectiveoutermost oxide layer of magnetite as discussed in [67]. Under this assumption, thedecrease in polarization resistance can be considered a measure of how much the OSinteracts with the oxide film in a beneficial manner, rather than an indication ofincreased corrosion rates.
Since the measurements cannot discriminate between the corrosion reactionsand the suggested complimentary and ’beneficial’ redox reactions, both explanationsshould be considered plausible. Nevertheless, the thesis finds more reason in theexplanation that the ’instantaneous’ decrease in polarization resistances would resultin a ’long-term’ increase in corrosion rate since the weight-loss measurements inhydrazine [24] verified such a correlation. However, this reasoning means that thethesis assumes that this correlation also extends to EA and DH, although it is a biasedassumption that requires confirmation with corresponding weight-loss experimentsfor EA and DH.
Under these assumptions, the results indicate that the injections of EA, DHand HZ cause instantaneous increases in the corrosion rates of carbon steel, whichmay extend into the long-term but which are considered more likely to normalizewith time as the oxide chemistry transitions and becomes more protective. Moreimportantly, the results show that the injections of EA and DH increase the corrosionrates to greater extents than HZ when administered at concentration ratios COS/CO2
between 1-10.This is an unexpected outcome compared to the previous study [67], which showed
that EA and HZ affected the steel surface to similar extents whereas the effect ofDH was significantly lower. One reason for this deviation could be the temperatureof the experiments, which in [67] were room temperature and since the chemicalscan be considered to ’benefit’ from the temperatures to different degrees.
The polarization resistances measured in this work with LPR for blank solutionsfor both levels of oxygen (0.76 MΩcm2 in 100±20 ppb oxygen and 0.42 MΩcm2 in10±2 ppm) were in general on the order of one magnitude greater than those reportedby [67] and two orders of magnitude greater than those measured by [24]. Althoughmany attempts were made to attribute this unexpected deviation to procedural andtheoretical explanations, no definite source of error could be identified.
The deviation could not be explained by the characterization of the oxide film withscanning electron microscopy (SEM) in Appendix D, since the oxide film thicknesses

46
and surface morphology were found to be similar to those depicted in [24]. Moreover,the deviation could not be attributed to differences in environmental aspects sincethe experimental circuit and environmental parameters were close to identical tothose specified in [24].
In addition, the uncompensated resistance Ruc was determined by EIS measure-ments to be on the order of 5 kΩ and its effect on the measured polarization resistanceswas thus considered insignificant. Therefore, this deviation was most likely causedby a procedural or systematic issue in the measurements. One reason could be thecell arrangement, which differed significantly in terms of the distance between theWE and RE being about 50 mm in this study compared to the <50 μm in [24]. Thearrangement used in [24] could possibly eliminate the electrical interference causedby the low-conductivity electrolyte.
Electrochemical impedance spectroscopy
The effect of oxygen scavengers on the electrochemical properties of carbon steelgrade 22K were measured with EIS. A typical EIS measurement in 100±20 ppboxygen concentration is shown in Figure 22. The Nyquist plots indicated only onetime constant appearing as a depressed semi-circle between frequencies of 1 Hz and0.1 Hz, which corresponds to the processes at the oxide film-solution interface, asdiscussed in [24, 67]. These processes include charge transfer and the charging of theEDL which are represented in the equivalent circuit by the charge transfer resistanceRct and the semi-capacitative CPEedl component, respectively.
Figure 22: EIS data and best-fit calculations of 22K carbon steel in water with 100ppb oxygen shown as A) Nyquist and B) Bode plots.
In addition, the phase angle Bode plots hinted at the presence of two additionalprocesses. The first process is shown as a shoulder in the Figure 22B at a frequencyaround 100 Hz, which could be related to the semiconducting properties of the oxideas discussed in [24]. The second process can be barely recognized at the low frequencyend, which would be related to the diffusion processes within the oxide [24]. However,

47
since the processes were not considered recognizable enough from the spectra, theywere omitted in the modelling.
The impedance spectra were also measured for carbon steel in oxygen concen-trations of 10±2 ppm, and a characteristic set of measurement data is shown inFigure 23. The Nyquist spectra indicated the presence of a small semi-circle fusedtogether with a larger semi-circle, as shown in Figure 23A. Since the larger semi-circledominated the impedance spectra (but also due to issues in the fitting of the data tothe elaborated equivalent circuit embedded in Figure 23A), a single time constantequivalent circuit was assumed in the curve fitting and modelling.
Figure 23: The impedance spectra of 22K carbon steel in 10 ppm oxygen indicatedtwo processes as shown in the A) Nyquist and B) Bode pots. The two processes weredrawn by individually fitting the data to an equivalent circuit with a single timeconstant.
The first and ’smaller’ time-constant appears in the 10 ppm spectra betweenfrequencies of 1 Hz and 0.1 Hz and can again be attributed to the interface processesbetween the solution and the oxide film as described previously. The second andsignificantly ’larger’ time-constant peaks at a frequency of approximately 10 mHzand can be considered affiliated with the diffusion processes within the oxide filmas described by [24, 67]. The response due to the diffusion in the oxide film isrepresented in the equivalent circuit by the resistor Rf joined in parallel to thesemi-capacitative component CPEf .
The addition of oxygen scavengers changed the 100 ppb impedance responseas demonstrated in Figure 24. The figure shows that the impedance magnitudediminished with the addition of hydrazine, which is an observation also found for EAand DH. This result correlates well with the LPR measurements, which showed thatthe polarization resistance decreased significantly with an increasing concentrationof oxygen scavengers. The drastic change in the impedance spectra can be again beattributed to either an increased rate of corrosion reactions or due to complementaryredox reactions associated with the presence of oxygen scavengers as discussed in theLPR results, or both.

48
Figure 24: The impedance responses diminished with the addition of hydrazineshown in the A) Nyquist and B) Bode plots. The initial oxygen concentrations were100±20 ppb.
The same trend of diminishing impedance spectra were found in the 10 ppmmeasurements after the addition of oxygen scavengers. In the 10 ppm measurements,the impedance response of the oxide film disappeared entirely and only the inter-face processes were recognized in the presence of oxygen scavengers. This clearlydemonstrated a flaw in the measurement method since the oxygen scavengers areconsidered incapable of instantly affecting the diffusion processes in the oxide filmunder the limited time between the injection and the impedance measurement (about45 minutes).
The charge transfer resistance and the capacitance of the EDL were determinedfor the 100 ppb impedance spectra by fitting the data to an equivalent circuit witha single time constant. The results from the best-fit calculations of the 100 ppbspectra are compiled in Figure 25. Figure 25A shows that the addition of OS reducesthe charge transfer resistances, which correlates with the observations of previousstudies [67, 24] and can thus be considered an expected result. Considering hydrazine,the charge transfer resistance declines linearly from 100 kΩ cm2 to 10 kΩ cm2 withan increasing concentration ratio of OS to oxygen whereas for EA and DH the chargetransfer resistances decrease exponentially and converge at around 5 kΩ cm2. Thatis, at low to moderate concentration ratios ( COS/CO2 between 1 and 8) EA andDH reduce the charge transfer resistance significantly more than HZ, whereas athigh concentration ratios (COS/CO2 above 8) EA and DH reduce the charge transferresistance only slightly more than HZ.
These trends correspond well with the observations from the the polarizationresistances shown in Figure 21. However, the impedances from the EIS measurementsthat correspond to that determined by the LPR are one the order of one magnitudelower (i.e.,the impedance at 1.4 mHz, which corresponds to a potential sweep from-30 mV to +30 mV relative to the corrosion potential at a rate of 10 mV min-1).That is, the results from the LPR and EIS measurements show similar ’qualitative’

49
Figure 25: The results from 100 ppb impedance spectra indicate that A) the chargetransfer resistance decreased with the OS amount and B) the EDL capacitanceincreased with the OS amount.
trends but the results are quantitatively not comparable. On the other hand, theRct values correspond well with those measured by [67]. Therefore, the EIS resultscan be considered more representative in quantitative terms than those of the LPRmeasurements.
The electrical double layer capacity was found to increase semi-linearly with theaddition of HZ whereas the capacity increased irregularly for EA and DH, as shownin Figure 25B. The increase in the EDL capacity can be attributed to the change insolution chemistry with the addition of oxygen scavengers and a subsequent changein the chemistry at the solution-electrode interface.
Summary of LPR and EIS results
The LPR and EIS results demonstrated that the addition of OSs results in animmediate decrease of the polarization and charge transfer resistances. The decreasein resistances were considered primarily to represent an increase in corrosion ratesand in part to be the effect of complementary redox reactions associated with the OSs.Under this assumption, the results indicate that EA and DH increase the corrosionrates to greater extents than HZ when administered at low to moderate concentrationratios (values of COS/CO2 between 1 and 8), but only to a slightly greater extentwhen administered at high concentration ratios (COS/CO2 values greater than 8).That is, the results suggest that the effects of EA, DH and HZ can be consideredcomparable at high concentration ratios.
50
8 ConclusionsThis thesis set out to evaluate the feasibility of the two hydrazine substitutes ery-thorbic acid and diethylhydroxylamine for use as oxygen scavengers in the secondarycircuit of PWRs. To this end, an experimental water circuit was devised to resem-ble the Loviisa secondary circuit and the proposed substitutes were experimentallyevaluated with respect to their effectiveness to consume oxygen. In addition, theexperiments evaluated the effect of oxygen scavengers on the corrosion resistance of22K carbon steel, which is one of the most abundant structural materials in Loviisaand corresponding WWER-440 secondary circuits.
The results from the measurements of the oxygen reduction kinetics showed thaterythorbic acid consume oxygen as quickly and efficiently as hydrazine. In addition,diethylhydroxylamine was found to consume oxygen at rates of approximately onethird of hydrazine and erythorbic acid. However, the injections of oxygen scavengerswas found to increase the electrolytic conductivity as shown in Appendix E. Never-theless, the results indicate that erythorbic acid and diethylhydroxylamine can offersafe approaches for oxygen removal in PWR secondary circuits, provided that thegeneration of decomposition products are accounted for since they may increase theelectrolytic conductivity and reduce the pH of secondary waters.
The results from the LPR and EIS measurements of carbon steel grade 22Kdemonstrated that the addition of oxygen scavengers resulted in an immediate de-crease of the polarization and charge transfer resistances. The decrease in resistanceswere considered primarily to represent an increase in corrosion rates and in part tobe the effect of complementary redox reactions associated with the OSs. Under thisassumption, the results indicate that EA and DH increase the corrosion rates tocomparable extents when administered at high concentration ratios (COS/CO2 valuesgreater than 8).
In this study, carbon steel was exposed to the oxygen scavengers for only a fewhours and the measured increases in corrosion rates can thus be considered to betemporary. With time, the corrosion rates are expected to decrease and normalize asthe oxide chemistry transitions and the oxide becomes more protective. Nevertheless,this assumption should ideally be experimentally evaluated and field-tested in futurework in order to determine the long-term effects of the oxygen scavengers on thecorrosion resistance of secondary circuit materials. A suggested duration for thislong-term experiment could be one year, which would correspond to the full durationbetween the annual maintenances.
In addition, the effort of future work should be put on comparing additionalhydrazine substitutes, including carbohydrazide and methylethylketoxime. As forsuggestions on improvements of the experimental methodology, future studies shouldensure that the initial oxygen concentration remains identical between measure-ments and emphasize the results gathered with the commercial sensor and from EISmeasurements. Finally, the method for determining the oxygen reduction kineticsusing the experimental sensor could be tailored better for the organic substitutes byincreasing the sensor selectivity or modifying the analysis calculus.

51
References[1] Ministry of Economic Affairs and Employment. Government report on the
National Energy and Climate Strategy for 2030. Tech. rep. Helsinki: Ministryof Economic Affairs and Employment, 2017, p. 121. url: http://urn.fi/URN:ISBN:978-952-327-199-9.
[2] Supplies and total consumption of electricity, GWh. Tech. rep. StatisticsFinland, 2019. url: http://pxnet2.stat.fi/PXWeb/pxweb/en/StatFin/.
[3] Anni Lassila and Jarno Hartikainen. Olkiluoto 3:n käynnistyminen myöhästyyjälleen, Areva joutuu maksamaan korvauksia. Helsinki, 2019. url: https://www.hs.fi/talous/art-2000006176296.html.
[4] Anna Juvonen. “Fennovoima: Hanhikivi 1 kaupalliseen käyttöön 202826.12.2018”. In: Kauppalehti (2018). url: https://www.kauppalehti.fi/uutiset/fennovoima-hanhikivi-1-kaupalliseen-kayttoon-2028/c666e0fa-8fbc-46b5-a11a-d76d0b9547e2.
[5] Ministry of Trade and Industry. Decision on operating license of Loviisa 1and 2. Tech. rep. Helsinki: Ministry of Trade, Industry (2019: the Ministry ofEconomic Affairs, and Employment), 2007. url: https://tem.fi/loviisa-1-ja-2-kayttolupa-2007-2030.
[6] Ministry of Economic Affairs and Employment. Decision on operating licenseof Olkiluoto 1 and 2. Tech. rep. Ministry of Economic Affairs and Employment,2018. url: https://tem.fi/en/loviisa-1-and-2-operating-licence.
[7] Safety assessment 1 (107) PSR2015 Appendix 1 Nuclear Reactor RegulationAn assessment by the Radiation and Nuclear Safety Authority on the periodicsafety review of Loviisa NPP. Tech. rep. Helsinki: STUK - Radiation andNuclear Safety Authority, 2015. url: https://www.stuk.fi/documents/88234/254201/1694438-stuks-assessment-on-loviisa-npp-periodic-safety-review-safety-assessment.pdf/05543da6-3dd2-2a79-f8b8-7ddb9ba4d8bd.
[8] Hirotaka Kawamura et al. “PWR secondary water chemistry guidelines inJapan - Purpose and technical background”. In: Progress in Nuclear Energy114 (2019), pp. 121–137. issn: 01491970. doi: 10.1016/j.pnucene.2019.01.027.
[9] European Chemical Agency. Inclusion of Substances of Very High Concernin the Candidate List for eventual inclusion in Annex XIV. 2011. url:https://echa.europa.eu/documents/10162/c5b972a9-f57f-4fd5-8177-04b4e46c5e93.
[10] Työterveyslaitos. OVA-ohje: Hydratsiini. 2017. url: https://www.ttl.fi/ova/hydratsi.pdf.

52
[11] Environment Canada. Canadian Environmental Protection Act, 1999 FederalEnvironmental Quality Guidelines - Hydrazine. Tech. rep. 2013. url: http://www.ec.gc.ca/ese-ees/2FE86525-C439-4BC8-B20A-315AF1CB6F6A/FEQG_TBBPA_EN.pdf.
[12] Mersiha Spahic et al. “Control and management of the chemical risk linkedwith hydrazine hydrate storage, unloading and injection across french nuclearfleet”. In: The 18th International Conference on Water Chemistry in NuclearReactor Systems. 2012. url: http://www.inchem.org/documents/jecfa/jecmono/v28je03.htm.
[13] Harbhajan S Mahal and Katta Venkateswarlu. Water chemistry studies - ifuse of hydrazine for scavenging dissolved oxygen in high temperature water - areview. Tech. rep. Bombay: Government of India Atomic Energy Commission,1971, pp. 3–4.
[14] Iva Betova, Martin Bojinov, and Timo Saario. Hydrazine replacement innuclear power plants – alternative substances and techniques, VTR-R-03426-16. Tech. rep. Espoo: VTT Technical Research Centre of Finland, 2016,p. 30.
[15] Paul A. Breeze. Nuclear power. Academic Press, 2016. isbn: 9780128095126.url: https://learning.oreilly.com/library/view/nuclear-power/9780128095126/?ar.
[16] K. Varga, E.H. Deák, and J. Schunk. “Corrosion issues in water-cooledwater-moderated energetic reactor (WWER) systems”. In: Nuclear CorrosionScience and Engineering. Elsevier, 2012, pp. 634–678. isbn: 9781845697655.doi: 10.1533/9780857095343.5.634.
[17] Nuclear Power Reactors in the World. Vienna: International Atomic EnergyAgency, 2017, p. 74. isbn: 9789201040176.
[18] John. N. Lillington. The Future of Nuclear Power. Dorchester: Elsevier, 2004.Chap. Present Ge, pp. 3–12. isbn: 9780080444895. doi: 10.1016/B978-0-08-044489-5.X5000-1.
[19] L. Papp and J. Vacek. “WWER steam generators”. In: Steam Generatorsfor Nuclear Power Plants. Elsevier, 2017, pp. 107–124. isbn: 9780081009284.doi: 10.1016/B978-0-08-100894-2.00007-8.
[20] Marcin Karol Rowinski, Timothy John White, and Jiyun Zhao. “Small andMedium sized Reactors (SMR): A review of technology”. In: Renewable andSustainable Energy Reviews 44 (2015), pp. 643–656. issn: 13640321. doi:10.1016/j.rser.2015.01.006.
[21] Jose San and Niabot. Kernkraftverk mit Druckwasserreaktor (ohne Turm).png.2009. url: https://de.wikipedia.org/wiki/Datei:Kernkraftwerk_mit_Druckwasserreaktor_(ohne_Turm).png.

53
[22] Ritva Korhonen and Ossi Hietanen. Erosion Corrosion of Parallel FeedWater Discharge Lines At the Loviisa Vver 440. Tech. rep. Vantaa: IVOinternational, 1994, pp. 75–85. url: https://inis.iaea.org/search/search.aspx?orig_q=RN:28008731.
[23] M. Huhtinen et al. Voimalaitostekniikka. 1st editio. Helsinki: Opetushallitus,2008. isbn: 978-952-13-3476-4.
[24] Sari Järvimäki et al. “Effect of hydrazine on general corrosion of carbonand low-alloyed steels in pressurized water reactor secondary side water”. In:Nuclear Engineering and Design 295 (2015), pp. 106–115. issn: 00295493.doi: 10.1016/j.nucengdes.2015.08.033.
[25] Private communication on 29.11.2019 with Head of chemistry S. Buddas atFortum, Loviisa NPP.
[26] Yi Xie and Jinsuo Zhang. “Corrosion and deposition on the secondary circuitof steam generators”. In: Journal of Nuclear Science and Technology 53.10(2016), pp. 1455–1466. issn: 0022-3131. doi: 10.1080/00223131.2016.1152923.
[27] G. Saji et al. “Fundamental Mechanisms of Component Degradation byCorrosion in Nuclear Power Plants of Russian Design”. In: Volume 1: PlantOperations, Maintenance, Installations and Life Cycle; Component Reliabilityand Materials Issues; Advanced Applications of Nuclear Technology; Codes,Standards, Licensing and Regulato. Vol. 1. ASME, 2008, pp. 499–518. isbn:0-7918-3820-X. doi: 10.1115/ICONE16-48308.
[28] Vladimír Slugeň. Safety of VVER-440 Reactors. London: Springer London,2011, pp. 1–178. isbn: 978-1-84996-419-7. doi: 10.1007/978-1-84996-420-3.
[29] S. Savolainen and B. Elsing. “Feed water distribution pipe replacementat loviisa npp”. In: Third international seminar on horizontal steam gen-erators. 1994, p. 16. url: https : / / inis . iaea . org / collection /NCLCollectionStore/_Public/31/018/31018414.pdf.
[30] Antoaneta E. Stefanova, Rositsa V. Gencheva, and Pavlin P. Groudev. Use ofmain loop isolating valves (GZZS) in VVER 440. Tech. rep. Sofia: Institutefor Nuclear Research and Nuclear Energy, Bulgaria, 2002. url: https://inis.iaea.org/collection/NCLCollectionStore/_Public/34/043/34043603.pdf.
[31] Edward McCafferty. Introduction to Corrosion Science. New York, NY:Springer New York, 2010. isbn: 978-1-4419-0454-6. doi: 10.1007/978-1-4419-0455-3.
[32] F. King. “General corrosion in nuclear reactor components and nuclearwaste disposal systems”. In: Nuclear Corrosion Science and Engineering.Elsevier, 2012. Chap. 4, pp. 77–103. isbn: 9781845697655. doi: 10.1533/9780857095343.2.77.

54
[33] A.M. Olmedo, R. Bordoni, and M. Strack. “Characterization of the OxideFilms Grown at 260C in a Simulated Secondary Coolant of a Nuclear Reactor”.In: Procedia Materials Science 1.54 11 (2012), pp. 528–534. issn: 22118128.doi: 10.1016/j.mspro.2012.06.071.
[34] S. Delaunay et al. “Formation and Deposition of Iron Oxides on StainlessSteel and Carbon Steel in Conditions of Secondary Circuits of PressurizedWater Reactors”. In: CORROSION 67.1 (2011), pp. 015003–1–015003–10.issn: 0010-9312. doi: 10.5006/1.3546849.
[35] S. Nasrazadani et al. “Characterization of oxides on FAC susceptible small-bore carbon steel piping of a power plant”. In: International Journal ofPressure Vessels and Piping 86.12 (2009), pp. 845–852. issn: 03080161. doi:10.1016/j.ijpvp.2009.10.003.
[36] Masaichi Nagayama and Morris Cohen. “The Anodic Oxidation of Iron in aNeutral Solution I. The Nature and Composition of the Passive Film”. In:Journal of The Electrochemical Society 109.9 (1962), p. 787. doi: 10.1149/1.2425555.
[37] J. Robertson. “The mechanism of high temperature aqueous corrosion ofstainless steels”. In: Corrosion Science 32.4 (1991), pp. 443–465. issn:0010938X. doi: 10.1016/0010-938X(91)90125-9.
[38] R Winkler, F Huettner, and F Michel. “Reduction of corrosion rates in theprimary circuit of pressurized water reactors in order to limit radioactivedeposits”. In: VGB Kraftwerkstechnik (1989). url: https://inis.iaea.org/search/search.aspx?orig_q=RN:20061153.
[39] B. Stellwag. “The mechanism of oxide film formation on austenitic stainlesssteels in high temperature water”. In: Corrosion Science 40.2-3 (1998),pp. 337–370. issn: 0010938X. doi: 10.1016/S0010-938X(97)00140-6.
[40] B. Beverskog et al. “A mixed-conduction model for oxide films on Fe, Cr andFe–Cr alloys in high-temperature aqueous electrolytes—II. Adaptation andjustification of the model”. In: Corrosion Science 44.9 (2002), pp. 1923–1940.issn: 0010938X. doi: 10.1016/S0010-938X(02)00009-4.
[41] Paul L. Huoston. Chemical Kinetics and Reaction Dynamics. Dordrecht:Springer Netherlands, 2006. isbn: 978-1-4020-4546-2. doi: 10.1007/978-1-4020-4547-9.
[42] Cynthia G. Zoski. Handbook of Electrochemistry. Elsevier, 2007. Chap. 1,p. 17. isbn: 978-0-08-046930-0.
[43] J. S. Kim, E. A. Cho, and H. S. Kwon. “Photoelectrochemical study on thepassive film on Fe”. In: Corrosion Science 43.8 (2001), pp. 1403–1415. issn:0010938X. doi: 10.1016/S0010-938X(00)00159-1.
[44] Guangze Yang et al. “A review on clogging of recirculating steam generatorsin Pressurized-Water Reactors”. In: Progress in Nuclear Energy 97 (2017),pp. 182–196. issn: 01491970. doi: 10.1016/j.pnucene.2017.01.010.

55
[45] Suat Odar and Francis Nordmann. PWR and VVER secondary systemwater chemistry report. Tech. rep. Skultuna: Advanced Nuclear TechnologyInternational, 2010. url: https://www.antinternational.com/docs/samples/CCC/02/04-sswc_sample_report.pdf.
[46] Mikko Vepsäläinen and Timo Saario. Magnetite dissolution and deposition inNPP secondary circuit, VTT-R-09735-10. Tech. rep. Espoo: VTT TechnicalResearch Centre of Finland, 2010. url: https : / / www . vtt . fi / inf /julkaisut/muut/2010/VTT-R-09735-10.pdf.
[47] R.B Dooley and V.K Chexal. “Flow-accelerated corrosion of pressure vessels infossil plants”. In: International Journal of Pressure Vessels and Piping 77.2-3(2000), pp. 85–90. issn: 03080161. doi: 10.1016/S0308-0161(99)00087-3.
[48] R Barry Dooley. “Flow-Accelerated Corrosion in Fossil and Combined Cycle/ HRSG Plants”. In: Power Plant Chemistry 10.2 (2008), pp. 68–89.
[49] U. R. Evans. The corrosion and oxidation of metals. London: Edward Arnold,1971, p. 128. isbn: 978-0713120547.
[50] Shunsuke Uchida et al. “Evaluation of flow accelerated corrosion by coupledanalysis of corrosion and flow dynamics. Relationship of oxide film thick-ness, hematite/magnetite ratio, ECP and wall thinning rate”. In: NuclearEngineering and Design 241.11 (2011), pp. 4585–4593. issn: 00295493. doi:10.1016/j.nucengdes.2010.09.018.
[51] M. Halin et al. “Influence of feed water distribution pipe replacement on thewater chemistry in the steam generator at Loviisa NPP”. In: 1998. url:https://inis.iaea.org/collection/NCLCollectionStore/_Public/31/018/31018414.pdf.
[52] Jonathan J Morrison et al. “Effect of Water Chemistry on Corrosion ofStainless Steel and Deposition of Corrosion Products in High TemperatureHigh Pressure Water”. In: Nuclear Plant Chemistry (2012). url: https:/ / inis . iaea . org / Search / searchsinglerecord . aspx ? recordsFor =SingleRecord&RN=46071844.
[53] N. B. Trunov et al. “Present state of the problem of managing the servicelife of steam generators used at nuclear power stations equipped with VVERreactors”. In: Thermal Engineering 58.3 (2011), pp. 184–189. issn: 0040-6015.doi: 10.1134/S0040601511030141.
[54] Francis Nordmann, Suat Odar, and Dewey Rochester. “Issues and remediesfor secondary system of PWR/WER”. In: Revue Générale Nucléaire 6 (2012),pp. 45–55. issn: 0335-5004. doi: 10.1051/rgn/20126045.
[55] E. McCafferty. “Corrosion Behavior of Laser-Surface Melted and Laser-SurfaceAlloyed Steels”. In: Journal of The Electrochemical Society 133.6 (1986),p. 1090. issn: 00134651. doi: 10.1149/1.2108792.
[56] H. P. Leckie and H. H. Uhlig. “Environmental Factors Affecting the CriticalPotential for Pitting in 18–8 Stainless Steel”. In: Journal of The Electrochemi-cal Society 113.12 (1966), p. 1262. issn: 00134651. doi: 10.1149/1.2423801.

56
[57] D You et al. “Experimental study of concentrated solutions containing sodiumand chloride pollutants in sg flow restricted areas”. In: International confer-ence on water chemistry in nuclear reactors systems - operation optimisationand new developments. International Atomic Energy Agency, 2002, p. 1. url:https://www.osti.gov/etdeweb/servlets/purl/20386586.
[58] S.M. Peyghambarzadeh, A Vatani, and M Jamialahmadi. “Influences ofbubble formation on different types of heat exchanger fouling”. In: AppliedThermal Engineering 50.1 (2013), pp. 848–856. issn: 13594311. doi: 10.1016/j.applthermaleng.2012.07.015.
[59] D.R. Diercks, W.J. Shack, and J. Muscara. “Overview of steam generator tubedegradation and integrity issues”. In: Nuclear Engineering and Design 194.1(1999), pp. 19–30. issn: 00295493. doi: 10.1016/S0029-5493(99)00167-3.
[60] V D Bergunker. “Integrity of heat-exchange tubes of vertical and horizontalsteam generators”. In: 7th International Seminar on Horizontal Steam Gen-erators. Podolsk, 2006, pp. 70–87. url: http://www.gidropress.podolsk.ru/files/proceedings/seminar7/documents/f53.pdf.
[61] N. B. Trunov et al. “Steam generators – horizontal or vertical (which typeshould be used in nuclear power plants with VVER?)” In: Atomic Energy 105.3(2008), pp. 165–174. issn: 1063-4258. doi: 10.1007/s10512-008-9090-1.
[62] Annex XV dossier - Identification of hydrazine as SVHC. Tech. rep. Europeanchemical agency, 2011, p. 7. url: https://echa.europa.eu/documents/10162/2f29c6b2-e043-4a13-927e-c25a04cd4abe.
[63] Kazushige ISHIDA et al. “Hydrogen and Hydrazine Co-injection to MitigateStress Corrosion Cracking of Structural Materials in Boiling Water Reactors,(VI) The Effect of Ammonia on Intergranular Stress Corrosion Cracking”. In:Journal of Nuclear Science and Technology 44.12 (2007), pp. 1550–1556. issn:0022-3131. doi: 10.1080/18811248.2007.9711405.
[64] N. L. Dickinson. “An experimental investigation of hydrazine-oxygen reactionratios in boiler feed water”. In: Proceedings of the American Power Con-ference Volume XIX. 1957, p. 692. url: https://ci.nii.ac.jp/naid/10016732390/.
[65] D. Feron. “Hydrazine, oxygen and materials interactions in a PWR secondarysystem”. In: JAIF INT. Conf. on Water Chemistry in Nuclear Power Plants.Tokyo, 1988, p. 636. url: https://inis.iaea.org/search/search.aspx?orig_q=RN:20037831.
[66] Iva Betova, Martin Bojinov, and Timo Saario. Kinetics of oxygen removal byhydrazine alternatives in conditions of steam generator preservation during out-age, VTT-R-05209-17. Tech. rep. Espoo: VTT Technical Research Centre ofFinland, 2017. url: https://cris.vtt.fi/en/publications/kinetics-of-oxygen-removal-by-hydrazine-alternatives-in-condition.
57
[67] Iva Betova, Martin Bojinov, and Timo Saario. Hydrazine alternatives asoxygen scavengers and passivation agents in steam generator preservationconditions, VTT-R-01908-18. Tech. rep. Espoo: VTT Technical ResearchCentre of Finland, 2018.
[68] A Banweg, D G Wiltsey, and B N Nimry. “Carbohydrazide - A HydrazineReplacement: 10 Years of Utility Experience”. In: EPRI InternationalConference on Cycle Chemistry in Fossil Plants. Nalco Chemical Company.Baltimore, 1991. url: https://vdocuments.site/carbohydrazide-a-hydrazine-replacement-10-years-a-hydrazine-replacement.html.
[69] Kazutoshi Fujiwara et al. “Evaluation of Thermal Decomposition Rate ofCarbohydrazide And Its Reducing Effect on Carbon Steel Corrosion”. In:NACE International corrosion conference. Tokyo: NACE International, 1997.url: https://www.onepetro.org/conference-paper/NACE-97089.
[70] N. N. Greenwood and A. Earnshaw. Chemistry of the Elements. 2nd. Elsevier,1997, p. 310. isbn: 978-0-0805-0109-3.
[71] Safety data sheet on 1H-pyrrole-2-carbohydrazide, 97% from Thermo FisherScientific. Loughborough, 2019.
[72] R. Walker. Erythorbic acid and its sodium salt. Guildford, 1991. url:www.inchem.org/documents/jecfa/jecmono/v28je03.htm.
[73] Eunok Choe and David B. Min. “Mechanisms of Antioxidants in the Oxidationof Foods”. In: Comprehensive Reviews in Food Science and Food Safety 8.4(2009), pp. 345–358. issn: 15414337. doi: 10.1111/j.1541-4337.2009.00085.x.
[74] Aishee Dey and Sudarsan Neogi. “Oxygen scavengers for food packagingapplications: A review”. In: Trends in Food Science & Technology 90.August2018 (2019), pp. 26–34. issn: 09242244. doi: 10.1016/j.tifs.2019.05.013.
[75] R.J. Wilson, A.E. Beezer, and J.C. Mitchell. “A kinetic study of the oxidationof L-ascorbic acid (vitamin C) in solution using an isothermal microcalorime-ter”. In: Thermochimica Acta 264.C (1995), pp. 27–40. issn: 00406031. doi:10.1016/0040-6031(95)02373-A.
[76] John D Zupanovich. Oxidation And Degradation Products Of Common OxygenScavengers. Tech. rep. Association of Water Technologies, 2002. url: https://www.awt.org/pub/0149322F-0C20-5CEC-AE62-1E826AF61A4C.
[77] Arkema S.A. Selection Guide for Oxygen Scavengers. Philadelphia, 2001.url: http://www.subsportplus.eu/wp- content/uploads/2012/05/alternative-to-hydrtazine-USA-2001-k.pdf.
[78] USFDA. Sec. 182.3041 Erythorbic acid. 2019. url: https : / / www .accessdata.fda.gov/scripts/cdrh/cfdocs/cfcfr/CFRSearch.cfm?fr=182.3041.
https://vdocuments.site/carbohydrazide-a-hydrazine-replacement-10-years-a-hydrazine-replacement.html

58
[79] N,N-Diethylhydroxylamine. Tech. rep. Pubchem, 2019. url: https://pubchem.ncbi.nlm.nih.gov/compound/19463.
[80] Raphaël Lebeuf, Véronique Nardello-Rataj, and Jean-Marie Aubry. “Dramaticsynergistic effects between hydroquinone and resorcinol derivatives for theorganocatalyzed reduction of dioxygen by diethylhydroxylamine”. In: Chem.Commun. 50.7 (2014), pp. 866–868. issn: 1359-7345. doi: 10 . 1039 /C3CC47261B.
[81] Sigma-Aldrich. Safety data sheet on N,N-Diethylhydroxylamine. 2015. url:https://www.sigmaaldrich.com/catalog/product/aldrich/471593.
[82] Justification Document for the Selection of a CoRAP Substance. Tech. rep.Swedish Chemicals Agency KEMI, 2018. url: https://echa.europa.eu/documents/10162/6dd43077-f450-c22f-fe6e-c2bc2612ca3c.
[83] J. A. von Fraunhofer and C. H. Banks. Potentiostat and its applications.London: Butterworth & Co, 1972, p. 254.
[84] Mari Lundström. Lecture 5 in CHEM-E6185 Applied electrochemistry andcorrosion. Espoo, 2019.
[85] Jacob Fraden and Lawrence G. Rubin. “AIP Handbook of Modern Sensors”.In: Physics Today 47.6 (1994), pp. 74–75. issn: 0031-9228. doi: 10.1063/1.2808535.
[86] Operator’s manual for the 3660 Analyzer for Oxygen or Ozone. Neuchâtel,1998.
[87] The Dissolved Oxygen Handbook. 2009. url: https://www.fondriest.com/pdf/ysi_do_handbook.pdf.
[88] P. P. L. Regtien et al. Measurement science for engineers. 1st. Twente:Elsevier Science and Technology, 2004, p. 260. isbn: 9780080536019.
[89] Tiina Ikäläinen, Timo Saario, and Konsta Sipilä. Alternatives for hydrazinein PWRs. Tech. rep. Espoo: VTT Technical Research Centre of Finland,2019.
[90] Farzin Arjmand and Lefu Zhang. “Solution Resistivity, Ohmic Drop andOxygen Reduction Rate at High Temperature Pressurized Water”. In: Elec-trochimica Acta 216.October (2016), pp. 438–448. issn: 00134686. doi:10.1016/j.electacta.2016.08.136.
[91] D. C. Silverman. “Practical Corrosion Prediction Using ElectrochemicalTechniques”. In: Uhlig’s Corrosion Handbook. Hoboken, NJ, USA: JohnWiley & Sons, Inc., 2011. Chap. 85, pp. 1129–1166. isbn: 9780470080320.doi: 10.1002/9780470872864.ch85.
[92] Florian Mansfeld. “Recording and Analysis of AC Impedance Data forCorrosion Studies”. In: CORROSION 37.5 (1981), pp. 301–307. issn: 0010-9312. doi: 10.5006/1.3621688.
59
[93] Stephen Fletcher. “Tables of Degenerate Electrical Networks for Use in theEquivalent-Circuit Analysis of Electrochemical Systems”. In: Journal ofThe Electrochemical Society 141.7 (1994), p. 1823. issn: 00134651. doi:10.1149/1.2055011.
[94] Mari Lundström. Lecture 8 in CHEM-E6185 Applied electrochemistry andcorrosion. Espoo, 2019.
[95] Martin Bojinov et al. “Characterisation of the oxide layer on carbon steelduring hot conditioning of primary heat transport systems in heavy-waterreactors”. In: Corrosion Science 51.5 (2009), pp. 1146–1156. issn: 0010938X.doi: 10.1016/j.corsci.2009.02.006.
[96] Martin Bojinov et al. “Effect of Chloride on the Oxides on Low-Alloyed Steelin Conditions of a Light Water Reactor Pressure Vessel Cladding Flaw”. In:Journal of The Electrochemical Society 161.4 (2014), pp. C177–C187. issn:0013-4651. doi: 10.1149/2.004404jes.
[97] S. Kochowski and K. Nitsch. “Description of the frequency behaviour ofmetal–SiO2–GaAs structure characteristics by electrical equivalent circuitwith constant phase element”. In: Thin Solid Films 415.1-2 (2002), pp. 133–137. issn: 00406090. doi: 10.1016/S0040-6090(02)00506-0.
[98] Zview 2 software Help documentation Equivalent Circuits - Circuit Elements.[99] Richard S. Greeley et al. “Electromotive Force Studies in Aqueous Solutions
at Elevated Temperatures. I. The Standard Potential of the Silver-SilverChloride Electrode 1”. In: The Journal of Physical Chemistry 64.5 (1960),pp. 652–657. issn: 0022-3654. doi: 10.1021/j100834a031.
[100] R. B. Dean and W. J. Dixon. “Simplified Statistics for Small Numbers ofObservations”. In: Analytical Chemistry 23.4 (1951), pp. 636–638. issn:0003-2700. doi: 10.1021/ac60052a025.
[101] Martin Bojinov. Private communication on 18.12.2019 with Prof. MartinBojinov and colleagues at University of Chemical Technology and Metallurgy,Bulgaria, including calculation instructions "Analysis of E-t curves". Sofia.

60
Appendices
A Experimental sensor calculusSince the experimental oxygen sensor was found to overestimate the reaction rates foroxygen reduction in waters with 100 ppb oxygen concentrations, a new method fordetermining the reaction rates was developed. This appendix outlines this approach,which was developed by Prof. Martin Bojinov and colleagues [101].
The method was derived from the oxygen reduction reaction for hydrazine, shownin (A1). This reaction can be considered to occur on the Pt-electrode via the twohalf-cell reactions for oxidation of hydrazine and the reduction of oxygen shown inequations (A2) and (A3), respectively.
total reaction: N2H4 + O2k−−−→ 2 H2O + N2 (A1)
oxidation: N2H4 −−→ N2 + 4 H+ + 4 e− (A2)reduction: O2 + 2 H2O + 4 e− −−→ 4 OH− (A3)
The reaction rate was assumed to be first order with respect to oxygen andhydrazine, as shown in equation (A4). By substituting with the formal rate constantsk′ and k′′ and integrating over the time interval t = 0 and t = t and correspondingconcentrations CO2(t = 0), CO2(t = t), CN2H4(t = 0) and CN2H4(t = t), the reactionrate expressions were converted to equations (A5) and (A6).
−dCO2
dt= − dCN2H4
dt= kCO2CN2H4 (A4)
k′=kCN2H4======⇒integration
lnCO2(0)CO2(t) = k′t (A5)
k′′=kCO2======⇒integration
lnCN2H4(0)CN2H4(t) = k′′t (A6)
Since no net current flows at the open circuit potential, the sum of the oxidationand reduction currents is equal to zero as shown in equation (A7). Here the kineticsof the two half-cell reactions were assumed to be dictated by charge transfer.
4FkoCN2H4(t)exp(4αoF
RTE(t)
)− 4FkrCO2(t)exp
(4αrF
RTE(t)
)= 0 (A7)
where:F = Faraday constant, 96485 C mol−1
k′′, k′ = oxidation and reduction rate constants in s−1
Ci(t) = concentration of species i at time t in mol l−1
αi = transfer coefficient for ox. and red. reactionsR = gas constant, 8.314 Jmol−1K−1
T = absolute temperature in KE(t) = measured cell potential at time t in V
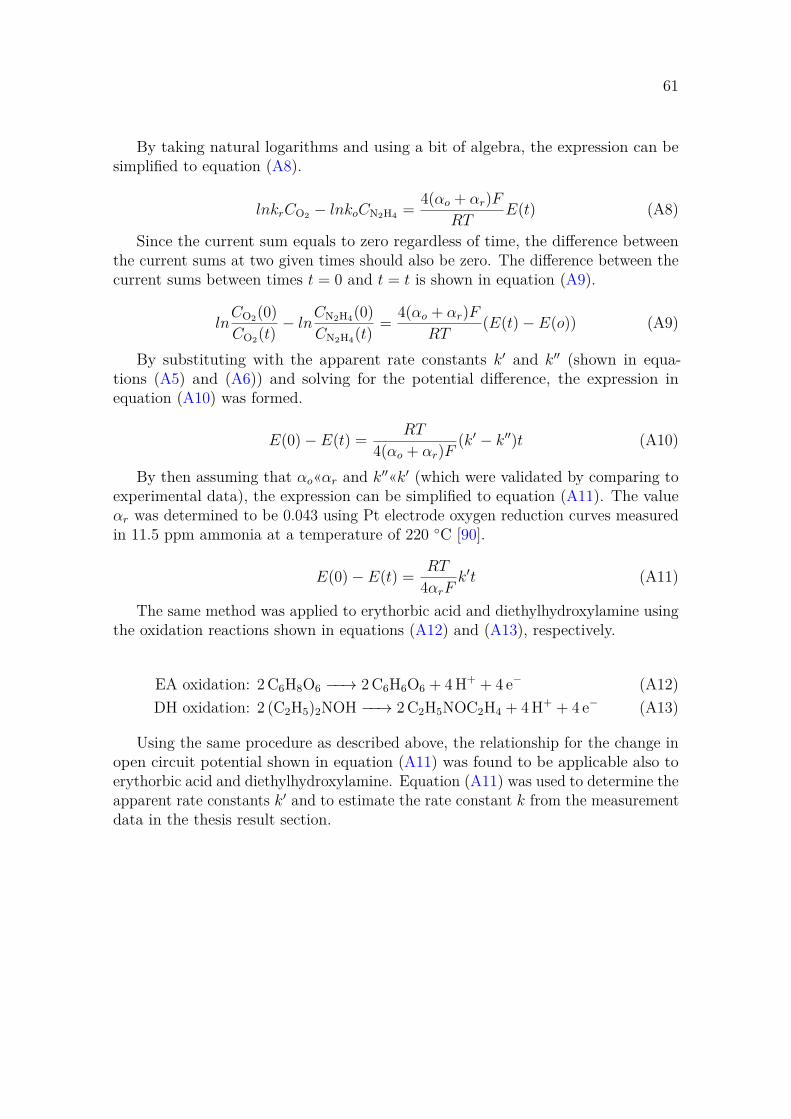
61
By taking natural logarithms and using a bit of algebra, the expression can besimplified to equation (A8).
lnkrCO2 − lnkoCN2H4 = 4(αo + αr)FRT
E(t) (A8)
Since the current sum equals to zero regardless of time, the difference betweenthe current sums at two given times should also be zero. The difference between thecurrent sums between times t = 0 and t = t is shown in equation (A9).
lnCO2(0)CO2(t) − ln
CN2H4(0)CN2H4(t) = 4(αo + αr)F
RT(E(t) − E(o)) (A9)
By substituting with the apparent rate constants k′ and k′′ (shown in equa-tions (A5) and (A6)) and solving for the potential difference, the expression inequation (A10) was formed.
E(0) − E(t) = RT
4(αo + αr)F(k′ − k′′)t (A10)
By then assuming that αo«αr and k′′«k′ (which were validated by comparing toexperimental data), the expression can be simplified to equation (A11). The valueαr was determined to be 0.043 using Pt electrode oxygen reduction curves measuredin 11.5 ppm ammonia at a temperature of 220 C [90].
E(0) − E(t) = RT
4αrFk′t (A11)
The same method was applied to erythorbic acid and diethylhydroxylamine usingthe oxidation reactions shown in equations (A12) and (A13), respectively.
EA oxidation: 2 C6H8O6 −−→ 2 C6H6O6 + 4 H+ + 4 e− (A12)DH oxidation: 2 (C2H5)2NOH −−→ 2 C2H5NOC2H4 + 4 H+ + 4 e− (A13)
Using the same procedure as described above, the relationship for the change inopen circuit potential shown in equation (A11) was found to be applicable also toerythorbic acid and diethylhydroxylamine. Equation (A11) was used to determine theapparent rate constants k′ and to estimate the rate constant k from the measurementdata in the thesis result section.

62
B Pump rate correctionDuring the initial measurements for determining the kinetics of oxygen reductionthere were indications that the dosing pump supplied the oxygen scavenger solutionat a faster rate than the desired rate promted into the pump user interface. To verifythese indications, measurements were carried out to determine the actual pump rate.The purpose of this appendix is to describe the measurements used to determine thethe actual pump rate.
The pump rate of the Shimadzu LC-20AT chromatography pump was determinedby injecting distilled water drawn from a 25 ml graduated cylinder and measuringthe time at intervals of a certain volume of water. The desired pumping rate was setto values between 2.0 ml min-1 and 4.0 ml min-1.
The measurement results are shown in Figure B1. The results show that theactual pump rate is approximately 25% greater than the desired pump rate. Theactual pump rates were used in the results analysis for calculating new concentrationratios COS/CO2 .
Figure B1: Results from the pump rate measurements. The slopes from A) areshown as separate values in B). The actual pump rate is approximately 25% largerthan the desired.

63
C Injection tests with blank solutionsIn some oxygen concentration measurements, the commercial oxygen sensor wouldindicate a sudden increase of oxygen shortly before the oxygen concentration startedto decline, as shown in Figure C1A. That is, undesired oxygen had entered the circuitduring the time when the oxygen scavengers were injected. This indicated that thedosing pump or the pipe line between the dosing pump and the injection point wasleaking, thus allowing external oxygen to enter the circuit from an ingress of air.
Since this ingress of air could affect the results of the kinetic measurements, aninjection test with deoxygenated and deionized water containing no OS was carriedout to determine the amount of air ingress and its significance. This appendixdescribes this injection test and discusses the measurement error caused by theundesired ingress of air.
The ingress of air was most noticeable during the very first injection if the pipelinebetween the dosing pump and the injection point had not been prefilled. That is, theintermediate pipeline seemed to allow some air to enter the stagnant solution whichwould increase the oxygen concentration of the initial amount of injected solution,which would then appear as a peak in the measurements.
When the intermediate pipeline was prefilled with the OS solution, oxygen peakswould not appear in the measurements. However, the ingress of air could still occurin a continuous manner but go unnoticed since the OS would instantaneously removethe entered oxygen. In order to determine the amount of continuous oxygen ingress,deoxygenated and deionized water containing no OS (i.e., ’blank solution’) wasinjected at a rate of 2.6 ml min-1. The results from the injection tests with blanksolutions are shown in Figure C1B.
Figure C1: The ingress of air was shown as A) peaks during OS injection and B) asregions of peaks and continuous ingress when a blank solution was injected (pumprate).
Figure C1B indicate that the ingress of air initially increased the oxygen concentra-tion by some 30 ppb shown as peaks, which were presumably caused by the stagnant

64
water in the intermediate pipeline having accumulated a higher oxygen concentration.However, after the oxygen peak, the oxygen concentration decreased and stabilizedat a value of 15-20 ppb above the oxygen concentration prior to pumping. Thiscontinuous ingress of air can be attributed to leaks in both the intermediate pipelineand the dosing pump. When the dosing pump was stopped, the oxygen concentrationdecreased again to an oxygen level same as prior to injection of the blank solution.
These results show that the dosing pump contributed with a 15-20 ppb continuousincrease in the oxygen concentration at a pump rate of 2.6 ml min-1. Although thistest was not repeated under additional pump rates, the amount of the continuousingress of air can be considered to increase with the pump rate. Since the samepump and similar pump rates have been used in all measurements, the determinedreaction kinetics are still comparable within this thesis.
This undesired ingress of air has affected the oxygen reduction kinetics. Theingress oxygen has most likely reacted with the OS already in the dosing pump andthe intermediate pipeline and can therefore be considered to have lowered the OSconcentration of the injected solution. For a given pump rate, the effect of the airingress has been greater the lower the concentration of the initial OS stock solution.
To summarize, the effect of the air ingress on the results of the oxygen reductionkinetics are dependent on the initial OS stock solution and the pump rate. Althoughthe magnitude of this error was not determined in quantitative measures, the airingress cannot be considered significant enough to entirely debunk any of the thesisresults. The air ingress has in the worst case scenario caused the determined reactionkinetics to be slightly slower than what can be expected. That is, if the air ingresscan be eliminated in repeated tests, faster oxygen scavenging kinetics can be expectedfor hydrazine, erythorbic acid and diethylhydroxylamine.

65
D Characterization of the iron oxidesThe oxide films on the carbon steel samples were characterized with Zeiss GeminiUltra Plus scanning electron microscopy (SEM) and energy-dispersive X-ray spec-troscopy (EDS). The purpose of this appendix is to highlight the findings from thecharacterizations.
The electron micrographs of the 100 ppb and 10 ppm samples are shown inthe figures D1 and D2. The surface morphology differs significantly between thetwo samples as the 100 ppb oxide surface consists of irregularly shaped particles ofseemingly similar sizes whereas the 10 ppm oxide consists of sphere-shaped particlesof varying sizes.
Figure D1: A) surface and B) cross-section electron micrographs and elementalcompositions (EDS, atom-%) of 22K carbon steel after 1200 hours of exposure torecirculating water with an CO2 of 100±20 ppb, a temperature of 228 C and apH25C of 9.6±0.2.
Figure D2: A) surface and B) cross-section electron micrographs and elementalcompositions (EDS, atom-%) of 22K carbon steel after 200 hours of exposure torecirculating water with an CO2 of 10±0.2 ppm, a temperature of 228 C and apH25C of 9.6±0.2.

66
The oxides differed also in thickness and composition. The 100 ppb oxide had athickness of 0.41±0.12 μm and the 10 ppm oxide had a thickness of 0.25±0.05 μm.The 100 ppb oxide cross-section was also found to consist to a larger degree of oxygen(oxygen to iron ratio of 1.25) than the oxide of the 10 ppm sample (oxygen to ironratio of 0.72) as determined by the EDS analysis.
These observations may seem counter-intuitive as a higher oxygen concentrationin the water can be expected to result in a thicker oxide and possibly also a higheroxygen content in the oxide. However, these deviations can be attributed to theexposure time as the 10 ppm sample was only part of the circuit for 200 hourswhereas the 100 ppb sample was for a total of 1200 hours which has allowed for athicker oxide to form but possibly also oxygen to occupy a larger share of the film.
Although the oxide film should consist of an inner and an outer layer, themicrographs were not able to convincingly discriminate between inner and outerlayers. Nevertheless, the surface morphology and the measured thicknesses correspondgenerally with oxides described in similar studies [24, 33, 34].
Although the EDS analysis could semi-quantitatively determine the ratio ofoxygen to iron atoms in the oxide films, the analysis was not able to discriminatebetween iron oxide forms, and thus not identify what oxides the films consisted of.However, the electrochemical potentials in LPR and EIS measurements were found tohave been for the most part inside the thermodynamically stable region of hematite.Therefore, the oxide films can be considered to have consisted primarily of hematite.

67
E The effect of OSs on the electrolytic conductivityDuring measurements in waters containing approximately 10 ppm oxygen content, theconductivity was found to increase with the addition of erythorbic acid. This appendixpresents the effect of adding oxygen scavengers on the electrolytic conductivity.The electrolytic conductivity was continuously measured with an electrochemicalconductivity sensor (HACH polymetron 8310) located in the cold section return lineas shown in Figure 16.
The electrolytic conductivity during administration of oxygen scavengers areshown as a function of time in Figure E1. In the 100 ppb measurements, erythorbicacid decreased the conductivity slightly, whereas hydrazine and diethylhydroxylaminehad no recognizable effect on the conductivity. In 10 ppm measurements, all threeoxygen scavengers increased the electrolytic conductivity.
The increase in conductivity can be attributed to the oxygen scavengers decom-posing into or participating in reactions that produce charged species, which in turnincrease the solution conductivity. An increase of the conductivity can be expectedto result in higher corrosion rates, which is undesirable. The threefold increase inconductivity caused by erythorbic acid is particularly concerning.
The decrease in conductivity of erythorbic acid in the 100 ppb measurementsseems counter-intuitive. A decrease in conductivity would mean that the activitiesof erythorbic acid would result in the consumption of ammonia, since the chargedspecies in the solution can be considered associated with the ammonia ions NH4
+
and NH2– . A decrease in conductivity would be concerning should it mean that
ammonia, which acts as a pH buffer, would be consumed by the oxygen scavenger.
Figure E1: The conductivity of the return line during administration of oxygenscavengers in waters with oxygen concentrations of A) 100±20 ppb and B) 10±2 ppmmeasurements. Erythorbic acid caused the most significant change of conductivity.The linear declines are due to filtering the water through ion-exchangers.