Gas Transfer Measurements at Hydraulic Structures on the ...
Upload
vuongquynhCategory
view
235download
0
HYDROLOGICAL PROCESSESHydrol. Process. 28, 255–278 (2014)Published online 5 November 2012 in Wiley Online Library(wileyonlinelibrary.com) DOI: 10.1002/hyp.9568
Hydraulic subsurface measurements and hydrodynamicmodelling as indicators for groundwater flow systems in the
Rotondo granite, Central Alps (Switzerland)
U. S. Ofterdinger,1* Ph. Renard2 and S. Loew3
1 Queen’s University of Belfast, Environmental Engineering, David Keir Building, Stranmillis Rd., Belfast BT7 1NN, Northern Ireland2 University of Neuchâtel, Centre of Hydrogeology and Geothermics, 11 Rue Emile Argand, CH-2000 Neuchâtel, Switzerland
3 ETH Zurich, Engineering Geology, Sonneggstrasse 5, CH-8092 Zurich, Switzerland
*CandStraE-m
Co
Abstract:
Regional groundwater flow in high mountainous terrain is governed by a multitude of factors such as geology, topography,recharge conditions, structural elements such as fracturation and regional fault zones as well as man-made undergroundstructures. By means of a numerical groundwater flow model, we consider the impact of deep underground tunnels and of anidealized major fault zone on the groundwater flow systems within the fractured Rotondo granite. The position of the freegroundwater table as response to the above subsurface structures and, in particular, with regard to the influence of spatialdistributed groundwater recharge rates is addressed. The model results show significant unsaturated zones below the mountainridges in the study area with a thickness of up to several hundred metres. The subsurface galleries are shown to have a strongeffect on the head distribution in the model domain, causing locally a reversal of natural head gradients. With respect to theposition of the catchment areas to the tunnel and the corresponding type of recharge source for the tunnel inflows (i.e. glaciers orrecent precipitation), as well as water table elevation, the influence of spatial distributed recharge rates is compared to uniformrecharge rates. Water table elevations below the well exposed high-relief mountain ridges are observed to be more sensitive tochanges in groundwater recharge rates and permeability than below ridges with less topographic relief. In the conceptualframework of the numerical simulations, the model fault zone has less influence on the groundwater table position, but moreimportantly acts as fast flow path for recharge from glaciated areas towards the subsurface galleries. This is in agreement with aprevious study, where the imprint of glacial recharge was observed in the environmental isotope composition of groundwatersampled in the subsurface galleries. Copyright © 2012 John Wiley & Sons, Ltd.
KEY WORDS numerical modelling; alpine hydrogeology; fractured bedrock aquifers
Received 18 April 2011; Accepted 1 October 2012
INTRODUCTION
High alpine catchments in fractured crystalline rocks presenta great challenge when assessing large scale groundwaterflow systems. Regionalflow systems are strongly influencedby topography and basin scale (Toth, 1963; Toth, 1984;Zijl, 1999; Winter, 2001; Gleeson and Manning, 2008).Furthermore, the geology (i.e. permeability and thermalconductivity), climatic conditions (available infiltrationand surface temperatures) and regional heat flux aregoverning factors on regional flow systems (Forster andSmith, 1988a, b). Structural elements such as fault zonesalso strongly govern the behaviour of these systems(Forster and Evans, 1991; Lopez and Smith, 1995).Various conceptual approaches have been developed inthe past decades to describe and model the groundwaterflow through fractured rock masses (NRC, 1996) rangingfrom equivalent continuum models (Carrera et al., 1990;Bear, 1993) to discrete fracture network simulation models
orrespondence to: U.S. Ofterdinger, School of Planning, ArchitectureCivil Engineering, Queen’s University of Belfast, David Keir Building,nmillis Rd., Belfast BT9 5AG, Northern Ireland.ail: [email protected]
pyright © 2012 John Wiley & Sons, Ltd.
(Dverstorp and Andersson, 1989; Cacas et al., 1990a, b, c;Davy et al., 2006). Numerous case studies have beenperformed in fractured crystalline rock in the frameworkof the safety assessments for nuclear waste repositories(Kimmermeier et al., 1985; Herbert et al., 1991;Neretnieks, 1993) investigating flow and transportphenomena on the small scale and on a regional scale(Voborny et al., 1991; Voborny et al., 1994). Observationsin subsurface galleries have been used to investigategroundwater flow systems within fractured crystallinerocks on a regional scale (Loew et al., 1996; Kitterodet al., 2000; Marechal and Etcheverry, 2003; Loewet al., 2007; Walton-Day and Poeter, 2009; Masset andLoew, 2010; Marechal, 2012). In high mountainouscatchments, recharge conditions have strong spatialvariability (Balek, 1988; Lerner et al., 1990; Kattelmannand Elder, 1991), depending on numerous factors such asgeology/soil cover, topography/land form and vegetation/land use. The impact of varying recharge conditions andspecific recharge sources such as snow pack and glaciers(Martinec et al., 1982; Manning and Solomon, 2005;Manning and Caine, 2007) in mountainous regions hasbeen investigated mainly with the focus on shallowgroundwater flow systems, and characteristic signatures

256 U. S. OFTERDINGER, PH. RENARD AND S. LOEW
of recharge sources were shown in terms of environmentalisotope content and hydrodynamic response (Flerchingeret al., 1992; Ward et al., 1999; Abbott et al., 2000;Hansmann et al., 2011).To understand large scale groundwater flow systems in
crystalline rocks of high mountainous terrain, a compre-hensive study has been completed in the Rotondo Massifof the Central Swiss Alps. Various types of measurementswere carried out at the terrain surface and in subsurfacegalleries. These range from the analysis of the hydrochemicaland environmental isotope composition of groundwater andprecipitation (Ofterdinger et al., 2004) to the acquisitionof data on the structural geology and the measurement ofhydrogeological parameters of the crystalline bedrocks.To improve our overall understanding of the groundwatersystems, numerical simulations following a deterministiccontinuum approach were carried out. Spatially distributedrecharge rateswere extracted from the results of a hydrologicalmodel (Vitvar and Gurtz, 1999) and applied as upperboundary condition for the groundwater flow simulations.Key questions addressedwith the groundwater flowmodel
are the influence of spatially distributed recharge on thegroundwater flow field and the position of the free watertable, the impact of subsurface galleries and the impact ofa large scale fault zone on the regional flow system inthis topographically complex terrain. The simulations areadditionally aimed at providing a better understanding ofthe environmental isotope data and to test our previouslyderived interpretations of these (Ofterdinger et al., 2004). Inthe following, we first introduce the geological and
Village (Re:Realp, O
Summit (Ro: Piz R
A
A AK UGZPN
O
M
Ow
Furka
R hône Gerenwa
s se r
Geological boundary
River/stream
Figure 1. Schematic view of the model domain indicating the projected trace ofand Gotthard-Massif (AM and GM) within the model domain [A, Aar-GraniteNorthern Paragneis (GM); O, Orthogneiss (GM); Pr, Southern Paragneis
C, Cacciola Granite (GM);
Copyright © 2012 John Wiley & Sons, Ltd.
hydrogeological setting of the study area. Then, the availableinformation on hydrogeological parameters is illustrated, andour conceptual model is described before details of themodelling approach, and results are given. Concludingthe discussion of the model results, a comparison with thefindings from a previous study of the environmentalisotope composition of the groundwater (Ofterdingeret al., 2004) in the study area is drawn.
GEOLOGICAL AND HYDROGEOLOGICAL SETTING
Major geological and hydrogeological units
The research area is situated in the western Gotthard-Massif of the Swiss Alps. Geologically, it consists mainlyof the late Hercynian Rotondo granite and orthogneisses ofearly Palaeozoic age (Figure 1). The topographic elevationof the granite body ranges from 1800 to 3200m a.s.l(Figure 2). On the northern margin of the study area, theFurka Tunnel passes through the granite body at an elevationof approx. 1490m a.s.l. (Figure 1). An abandoned andunlined support segment to this base tunnel, the BedrettoTunnel, is furthermore passing through the granite body innorthwest-southeast direction. Due to the partial collapse ofthe Bedretto Tunnel, only the northern, approx. 1.5 km, arestill accessible. Figure 2 shows, in particular, that this lattertunnel segment is also passing beneath glaciated areas of thestudy domain. It offers the opportunity for direct subsurfaceobservations and was used for sampling of groundwater andmonitoring of discharges and in situ parameters.
w:Oberwald, Ro:Ronco)
otondo) Tunnel
0 42 kilometers
AK
Pr
RG
C
F
Re
Ro
- basetunnel
Bedretto-tunnel
Furkareuss
AK Geological unit
Ro
O
M
the subsurface galleries and the individual geological units of the Aar-Massif(AM); AK, Southern Gneiss Zone (AM); UGZ, Urseren-Gavera Zone; PN,(GM); M, Ultra-Helvetic Sediments (GM); RG, Rotondo Granite (GM);F, Fibbia Granite (GM)]
Hydrol. Process. 28, 255–278 (2014)

2710
2760
2904 2840
2910
3070
2860
2880
3039
29103026
3062
2944
2990
2913
2700
3068
3023
3082
3120
3192
me
me
ro
wi
pe
le
le
st
mu
mu
sa
sa
sa
rg
gg
wg
BEDRETTO TUNNEL
FURKA TUNNEL
G
erenwasser (bro
ok)
Saa
sbach
(bro
ok)
0 1 2 kilometers
Model fault zone Glaciated areagg Gerenglacierwg Witenwasserenglacier2904
meSummit with altitudeand identification
me Mettligrat, ro Rotondo, wi Witenwasserenstock, le Leckihorn, rg Rotälligrat, sa Saashörner,mu Muttenhörner, st Stellibodenhorn, pe Pesciora Elevation contour interval = 75 m
mg
sg
sg Saasglaciermg Muttenglacier
Spring discharge
Figure 2. Enlarged plan view of the upper Gerental-valley in the model domain. Indicated are the projected tunnel trace together with the positionof the glaciers, the location of mountain summits and the trace of the model fault zone intersecting the Bedretto Tunnel
257GROUNDWATER FLOW SYSTEMS IN THE ROTONDO GRANITE, CENTRAL ALPS (CH)
The focus of this investigation is targeted on thegroundwater flow systems within the granite body and itsimmediately adjacent formations. For the modellingpurpose, the domain was however extended and includesadditional geological units (Figure 1). From north to south,the geological units are the Hercynian Aar-Granite (A)and the Southern Gneiss Zone (AK) of the Aar-Massif.Between these units of the Aar-Massif and the units of theGotthard-Massif to the south, the metamorphic sediments ofthe Permian-Jurrassic Urseren-Gavera-Zone (UGZ) can befound. Further to the south, the Cambrian-PalaeozoicParagneisses (PN) and Orthogneisses (O) are followed bythe Southern Paragneisses (Pr) within the Gotthard-Massif.Along the southern margin of the model domain followthe Triassic-Jurassic Ultra-Helvetic sediments (M) of theGotthard-Massif. Additional to the RotondoGranite, furtherHercynian granite bodies can be distinguished within thedomain. These are the Gamsboden/Cacciola-Granite (C)and the Fibbia-Granite (F). Throughout the area of theGotthard-Massif andAar-Massif, alpine faulting and foliationcan be observed (Labhart, 1999; Zangerl et al., 2006;Luetzenkirchen and Loew, 2011 ). The former are oftenfollowing pre-existing structures such as lithologicalboundaries, intrusive contacts or dykes and are foundtoday mainly with steep to subvertical inclinations.Foliation is selective and less developed within theVariscian granites. These tectonic elements show mainlya NE–SW or E–W strike orientation with steep orsubvertical inclination.
Copyright © 2012 John Wiley & Sons, Ltd.
The geological boundaries indicated in Figure 1 aresimplified for the modelling purpose and reflect thegeological make-up of the domain on the massif-scale.The boundaries are extrapolated vertically with depth. Thegeological record of the Furka Tunnel and the BedrettoTunnel (Keller and Schneider, 1982; Schneider, 1985b;Luetzenkirchen and Loew, 2011) show that for the Rotondoarea, this simplification is valid because of the subverticaldip of the geological boundaries. Also in the rest of themodel domain, mainly steep to subvertical lithologicalboundaries are observed (Labhart, 1999).
Structural geology
The Rotondo granite shows varying degrees of fractura-tion and faulting throughout the study area, changingboth in lateral and vertical directions. Data on fractureorientation and fracture frequency (l) were gathered bymeans of scanline surveys (Priest, 1993) on surface outcropsand along the unlined tunnel section of the BedrettoTunnel. Twenty-three scanlines with lengths of 10–20mwere measured. Additionally, geological tunnel records(Schneider, 1985a) for the tunnel sections within theRotondo granite as well as acoustic borehole televiewer datafrom a research borehole completed within the Rotondogranite were analysed leading to a database with 1174fracture measurements. From this database, four majorfracture sets can be deduced (Table I), where especially sets1 and 2 are dominants at the ground surface. The NW–SE
Hydrol. Process. 28, 255–278 (2014)

Table I. Mean orientation of fracture sets with precision k and apical half-angle θ of 95%-confidence cone from Fisher analysis togetherwith corresponding mean normal fracture frequency l (and standard deviation s; Priest 1993) from surface and tunnel outcrops
Number of setMean orientation k θ lsurface (s) ltunnel (s)
strike/dip [.] [�] [m�1] [m�1]
1 049/75 SE 8.8 7.0 2.1 (2.2) 0.5 (0.2)2 080/83 SE 16.5 5.0 1.5 (1.2) 0.2 (0.3)3 140/86 SW 20.7 3.5 0.7 (0.6) 2.6 (2.7)4 170/79 SW 7.4 5.8 0.04 (0.07) 0.3 (0.2)
258 U. S. OFTERDINGER, PH. RENARD AND S. LOEW
striking fracture sets (3 and 4) are more abundant alongthe tunnel profile and are believed to be related to thetunnel construction, that is induced or reactivated by localstress amplifications. In addition to the steeply dippingsets described earlier, shallow dipping fractures can beidentified at the terrain surface. These fractures generallystrike subparallel to the valley axes with dip directionstoward the valley bottom, most probably representingquaternary stress release joints. Occasionally, concentricaljointing can also be observed within the granite at groundsurface. In addition to the fracturation, steeply dipping faultzones can be identified as important larger structuralfeatures, both at surface and along the tunnel profiles(Luetzenkirchen, 2002). The fault zones are mostlyorientated subparallel or at acute angles to the generaltrend of the alpine structures of the Gotthard-Massif(ENE–WSW). It can be observed that both on the terrainsurface and in the subsurface, specific fracture sets andsub-parallel orientated fault zones are the dominant waterconducting features amongst the observed structuralfeatures (Ofterdinger, 2001; Luetzenkirchen, 2002).One of the dominant steeply dipping fault zones in the
research area is striking approx. 75� and follows the easternpart of the Gerental-valley (Figure 2) intersecting theBedretto Tunnel in the subsurface, where it is associatedwithmajor groundwater inflows. Although the fault zone onthe terrain surface is often obscured in the valley floor byscree deposits, it is consistently apparent through densefracturation along the northwestern valley slopes and in theNW–SE trendingmountain ridges to the east of the BedrettoTunnel. In the subsurface, the structure of the fault zone canbe directly studied along its intersection with the BedrettoTunnel. Fault zones may be conceptually subdivided intofault core with fine-grained gouge material and adjacentfractured damage zone towards the surrounding protolith(Smith et al., 1990b; Caine et al., 1996). The observedapproximately 120-m-wide zone, described in this paper,comprises several discrete fault zones of cm–dm width.Although the damage zones of these faults are pronouncedand characterized by dense fracturation, only few lenses offine-grained gouge material occur within these discretefaults. In the following, this 120-m-wide zone will bereferred to as ‘fault zone’, in the conceptual context of thisstudy, even though this term originally refers to anindividual structure of the previously described successionof fault core, damage zone and protolith. For a detaileddocumentation of this zone and its structural elements, referto Luetzenkirchen (2002), Luetzenkirchen and Loew (2001)
Copyright © 2012 John Wiley & Sons, Ltd.
and Luetzenkirchen and Loew (2011). Previous studies(Schneider, 1976) have traced this fault zone, which causedsubstantial problems during tunnel excavation (Keller andSchneider, 1982), on the surface along the Gerental valleyand further to the east to an overall length of more than10 km. As this interpretation is little constrained by directobservations (the fault zone to the east is obscured byglaciated areas and scree slopes), a conservative approxi-mation of the modelled fault zone geometry was chosenwith a length of approx. 4.5 km. The fault zone width wasapproximated to be constant with 120m, although it isknown that, generally, the width of fault zones may behighly variable and heterogeneous (Smith et al., 1990b)both laterally and with depth. Yet, fault zones with similarwidths at surface and in depth have also been observed(Raven, 1977; Wallace and Morris, 1979).
Environmental isotopes/hydrochemistry
In a previous study (Ofterdinger et al., 2004), thecomposition of the groundwater from the Rotondo granitewas studied with regard to environmental isotopes contentand hydrochemistry. The analysis of themajor ion chemistryand the 34S/18O content in aqueous SO4
2- of sampledgroundwater from the Bedretto Tunnel indicate that theencountered groundwater is derived primarily from withinthe granite body (Ofterdinger, 2001). A potential contribu-tion from the northern neighbouring gneiss unit might serveas an explanation for an observed alignment of 34S/18O-dataalong a mixing line with slope of approx. 0.6. VaryingCa/Na-ratios along the tunnel profile indicate the possibilityof groundwater contributions from the neighbouring gneisses(O) and in particular from local amphibolite wedges.The d18O measurements of groundwater samples
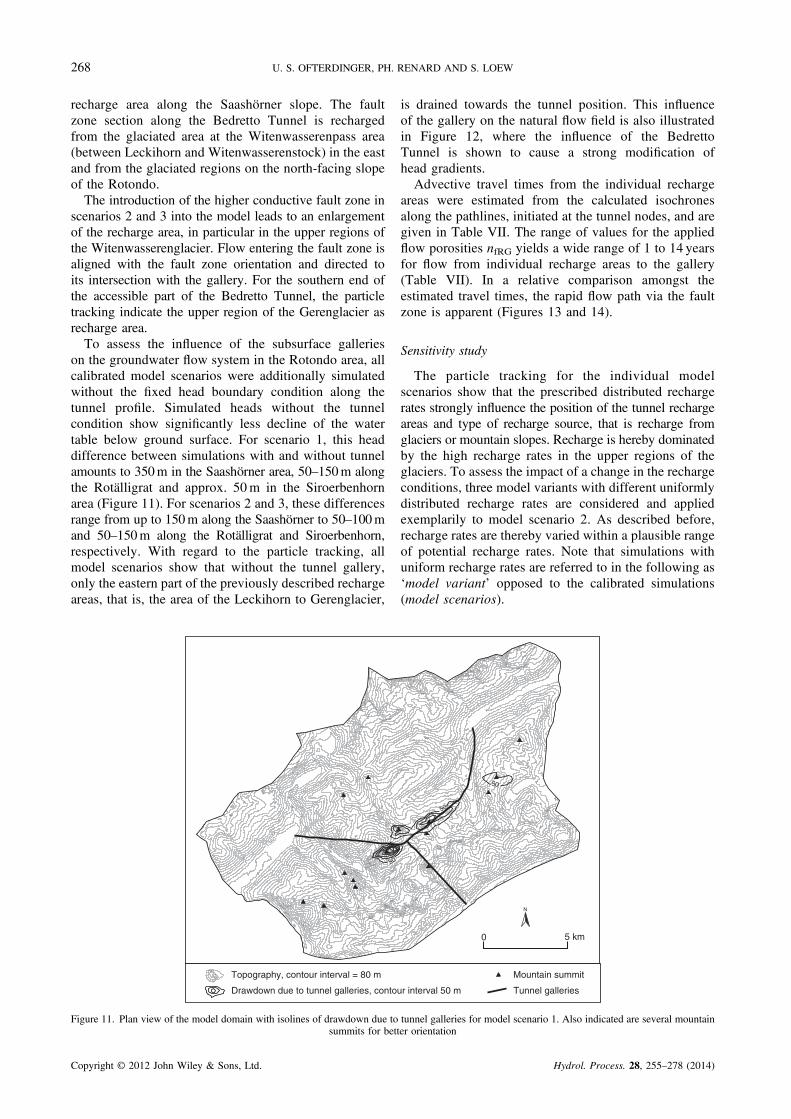
underline their meteoric origin and indicate majorcontributions from accumulated winter precipitation togroundwater recharge. Especially along the previouslydescribed fault zone, tritium, d18O and temperature dataimply a significant contribution of glacial melt water togroundwater recharge. Measured d18O reflect an altitudeeffect, that is higher recharge altitudes towards the northernend of the Bedretto Tunnel. Estimated recharge altitudeslie in the range of 2600–2800m a.s.l. Along the wholeBedretto Tunnel, no indications for upwelling brines orconvection driven flow are observed. Estimated meanresidence times from lumped-parameter modelling of thed18O-values in groundwater samples taken along the faultzone section are 1 to 1.5 years.
Hydrol. Process. 28, 255–278 (2014)

38
40
42
44
46
48
50
52 Change of sensor set-up
Change of sensor set-up
Change of sensor set-up
Change of sensor set-up
1.10.1999 1.01.2000 1.04.2000 1.07.2000 1.10.2000Date
Inte
rval
-pre
ssur
e [b
ar]
Interval 1
Interval 2
Figure 3. Long-term record of hydraulic pressures in the research
259GROUNDWATER FLOW SYSTEMS IN THE ROTONDO GRANITE, CENTRAL ALPS (CH)
Spring line
Few obvious spring discharges from the granite bedrockcan be observed in the Rotondo area. Their characteristicchemical composition is discussed in Ofterdinger et al.(2004). In the upper Gerental-valley, spring occurrencesgenerally lie at an elevation of 2200–2300m a.s.l,approximately 100–200m above the valley floor (Figure 2).Even though these spring discharges were observed tooriginate from open fractures in the granite bedrock orassociated to fault zones, the question whether the altitudeof these springs truly marks the intersection of thewater table with topography needs to be considered withcaution, as near surface flow enhanced by shallow dippingstress-release joints in the decompressed zone might maskthe true altitude of the water table along the slopes.
borehole; data from monitoring intervals 1 and 2
BM
0
BM
4900
BM 8050
BM11400
BM15400
TM 0
TM 3780
TM 5218Oberw
ald
Realp
Ronco
direction of tunnel drainage
Figure 4. Schematic trace of the Furka Tunnel andBedretto Tunnel. Indicatedare the directions of the tunnel drainage and the tunnelmetrics.Metrics refer to
metre from the Oberwald-portal and Ronco-portal, respectively
HYDROGEOLOGICAL PARAMETERS
Hydraulic heads
For the monitoring of hydraulic pressures within theRotondo granite, a shallow dipping approx. 100-m-longresearch borehole was drilled from the tunnel gallery. Theborehole is situated at the intersection of Furka Tunnel andBedretto Tunnel below the Saashörner-ridge with anapproximate overburden of 1200m and a plunge directionof 165� (30� deviation from the axis of the Bedretto Tunnel).The orientation was chosen to intersect the observedprevailing water conducting steeply dipping fracture setswithin the moderately fractured granite (l ~ 0.2–0.5m�1)at close to right angles. Two borehole intervals have beenpermanently packed by grout injection to monitor thehydraulic pressures. Monitoring intervals are 99.2–86.0m(Interval 1) and 50.0–66.0m (Interval 2) with perpendiculardistances to the axis of the Bedretto Tunnel of approxi-mately 43 and 29m, respectively. Previously completedboreholefluid logging revealed inflows along these intervalsof about 4 l/min (Interval 1) and 16 l/min (Interval 2)associated mainly with fractures of sets 1 and 2. Intervalpressures are monitored via 100 tubings at the boreholemouth. Monitoring started in July 1999. After a preliminaryphase, the final sensor-setup with piezoresistive transmitterswas installed in October 1999 (Type PA-53, Keller CH).Measured pressures are in the order of 50 bars for Interval 1and 40 bars for Interval 2 (Figure 3). The recorded signal inInterval 1 shows annualfluctuations in the order of 1–1.5 barwith maximum pressures in November and minimumpressures in June.Whereas a similar pattern can be observedfor 1999 in Interval 2, the pressure rise towards autumn2000 is less clear. As calibration target for the individualintervals, the average hydraulic pressure measured for theperiod from 1 November 1999 to 1 November 2000 waschosen (Table VI). With respect to the modelling effort,these headmeasurements are not sufficient to fully constraina regional model as they represent only a local areaobservation. Their purpose is mainly to investigate thelong-term transient behaviour of a moderately fracturedsection of the Rotondo granite.
Copyright © 2012 John Wiley & Sons, Ltd.
Groundwater fluxes
Measurements of spatially integrated inflow rates tothe subsurface galleries were carried out on a monthly/bimonthly basis. In the galleries, inflowing groundwater iscaptured in a basal drain and drained towards the tunnelportals. Inflows to the Furka Tunnel, east of kilometreBM11.4 (Figure 4), is drained towards the Realp-Portalwhereas the remaining section is drained towards theOberwald-Portal. No drainage water from the Furka Tunnelis passing through the Bedretto Tunnel. Groundwaterinflows along this tunnel section are drained towards thesouthern Ronco-Portal. Measurements of integral flow ratesalong particular tunnel sections were carried out in the basaldrain of the tunnels with depth-integrated velocity measure-ments (flow-anemometer). Discharge was then calculatedaccording to ISO748:1997(E) (ISO, 1997). In the FurkaTunnel measurement, locations were chosen to characterizethe inflow along the intersected section of the Rotondogranite as well as the total flow rates at the tunnel portals inOberwald and Realp. In the Bedretto Tunnel, measurementlocations were chosen to characterize the distribution ofinflow rates along the tunnel profile and especially along the
Hydrol. Process. 28, 255–278 (2014)

260 U. S. OFTERDINGER, PH. RENARD AND S. LOEW
intersected fault zone. Measurements were recorded fromAugust 1998 to January 2000 in the Furka Tunnel and fromNovember 1999 to November 2000 in the Bedretto Tunnel.Table II shows that the measured inflow rates show onlysmall temporal variability, usually within the range ofmeasurement errors.
Hydraulic conductivity
Several previous studies have been made to investigatethe potential range of hydraulic conductivity of fracturedcrystalline rocks both on the laboratory as well as on thefield scale (Brace, 1980; Brace, 1984; Clauser, 1992) and,in particular, the permeability distribution within faultzones and their adjacent crystalline formations (Davisonand Kozak, 1988; Forster et al., 1994; Scholz and Anders,1994; Evans et al., 1997; Caine and Forster, 1999; Massetand Loew, 2010). Commonly, a wide range of values arefound spanning several orders of magnitude depending onthe degree of deformation and the sampling positionwithin the fault zone or neighbouring crystalline rock.Accordingly, a range of anisotropy ratios for fault zonesare stated, describing the oftentimes observed enhancedfault-parallel flow in contrast to reduced fault-normal flow(e.g. Winkler et al., 2010).A first approximation of the hydraulic conductivities
of the more intact sections of the Rotondo granite wasdeduced from hydraulic tests completed in the researchborehole (constant-rate tests). Four packer tests withincreasing test interval length (7–35.5m) were carried outstarting from the bottom of the borehole. Apparenthydraulic conductivities (referenced to interval length)range from 6.0� 10�9 to 2.9� 10�8m/s with a geometricmean of 1.� 10�8m/s.On the basis of the measured inflow rates to the
Bedretto Tunnel and assuming steady-state conditions,hydraulic conductivities for the fault zone section andthe remaining granite section along the tunnel profile aswell as for the whole profile length were approximatedusing the analytical solution described by Goodman
Table II. Mean measured integral flow rate to the accessible sectionof the Bedretto Tunnel (total) and to the fault zone sectionwithin the Bedretto Tunnel together with integral flow rate to theRotondo Granite section of the Furka Tunnel as well as to thewhole Furka Tunnel (measured at the Portals). Tabulated furtherare standard deviation s as indicator for variability over timeand associated error of the measurement. For tunnel metrics
refer to Figure 4
Tunnelsection
Tunnelmetrics Q s
Measurementerror
[m] [l/s] [l/s] [l/s]
Bedretto Tunnel TM3780-5218 14.9 0.3 �0.5Fault Zone TM4200-4320 7.5 0.1 �0.5Furka Tunnel (RG) BM4900-8050 25.8 1.2 �5.6Portal Oberwald BM0-11400 94.4 1.7 �5.9Portal Realp† BM11400-15400 75.8 0.1 �5.9
†Only four measurements November 1998–March 1999.
Copyright © 2012 John Wiley & Sons, Ltd.
(1965) on the basis of the assumption of a linear constanthead boundary:
Q0 ¼ 2pTH0
ln 2H0r
� � (1)
with Q0 being the discharge rate along the investigatedsection (m3/s), T is the hydraulic transmissivity (m2/s), H0,the piezometric level above gallery (m) and r, the radius ofgallery (m). Hydraulic conductivity k is then estimatedfrom T= k� e, with e being the width of the investigatedzone (m). A range of potential hydraulic conductivities wascalculated for fixed heads at the topographic surface (z)and at a piezometric level of 0.7z. The latter assumption isbased on observations in similar rock types and overburdenwithin the scope of the Gotthard-base tunnel project ofAlpTransit/NEAT in Switzerland (Koella, 1993). Table IIIsummarizes the estimated values.Within the scope of the AlpTransit/NEAT project
(Loew et al., 2000), a comprehensive database of effectivehydraulic parameters from the geological units of the Aarand Gotthard Massif has been compiled (Colenco, 1993;Masset and Loew, 2010). The derivation of effectivetransmissivities was thereby based on the observation ofdischarge rates to numerous existing tunnels and subsurfacegalleries in these formations (Loew et al., 1996).With these,effective hydraulic conductivities were calculated for longertunnel sections (>100m; Voborny et al. (1994)). The soderived hydraulic conductivity for Hercynian granites in theGotthard Massif such as the Rotondo Granite at the tunnelelevation is 1.1� 10�8m/s. As no direct observational datawas available in the scope of this study to constrain thehydraulic conductivities of the neighbouring geologicalunits to the Rotondo granite, the mentioned database(Colenco, 1993)was used to establish initial approximationsfor the numerical model (Table IV).Several studies have shown the depth-dependence of the
hydraulic conductivity/transmissivity in crystalline rocks(Snow, 1968; Herbert et al., 1991; Thury et al., 1994;Manning and Caine, 2007; Masset and Loew, 2010;Marechal, 2012). Furthermore, it can be observed that adistinct hydraulic discontinuity occurs in the uppermost100–200m. Close to the terrain surface, substantially higherconductivities due to denser fracturation and larger aperturesoccur. This can be explained by stress release, weatheringprocesses and gravitationally induced weakening of the
Table III. Analytical approximations of hydraulic conductivities.Values are calculated for the fault zone section and the remaininggranite section as well as for the total tunnel section including the
fault zone section
Section of Bedretto TunnelHydraulic conductivity
[m/s]
Fault zone 6.0–8.2� 10�8
Remaining tunnel section 6.0–8.3� 10�9
Total tunnel section 1.0–1.4� 10�8
Hydrol. Process. 28, 255–278 (2014)

Table IV. Initial approximations of effective hydraulic conductivities (HC) for the geological units within the model domain togetherwith calibrated HCfor the individual scenarios
Name IndexInitial HC Calibrated HC [m/s]
[m/s] Scenario 1 Scenario 2 Scenario 3
Rotondo Granite RG 1.1� 10�8 1.2� 10�8 6.0� 10�9 6.5� 10�9
Aar Granite A 3.8� 10�9 nc nc ncs’ Aar Gneiss Zone AK 5.3� 10�9 nc nc ncUrseren-Gavera-Zone UGZ 1.5� 10�8 nc nc ncn’ Paragneiss PN 3.1� 10�8 3.1� 10�9 3.1� 10�9 3.1� 10�9
Orthogneiss O 2.3� 10�8 9.2� 10�9 1.4� 10�8 1.4� 10�8
s’ paragneiss P 3.1� 10�8 nc nc ncUltra-Helvetic Sediments M 4.0� 10�7 nc nc ncFibbia Granite F 1.1� 10�8 nc nc ncCacciola Granite C 1.1� 10�8 8.0� 10�8 8.0� 10�8 8.0� 10�8
Fault Zone FZ 1.2� 10�7 — 6.0� 10�8 6.5� 10�8
HC, hydraulic conductivities; nc, no change; s’, southern; n’, northern.
261GROUNDWATER FLOW SYSTEMS IN THE ROTONDO GRANITE, CENTRAL ALPS (CH)
bedrock along steep slopes. This zone if often referred toas the decompressed zone (Jamier, 1975; Raven, 1977;Cruchet, 1985; Marechal and Etcheverry, 2003) and canalso be observed in the research area (Ofterdinger, 2001).On the basis of a review of studies in the crystalline rocks ofthe Swiss Alps and the crystalline basement of Switzerland,Marechal (1998) proposes an exponential decrease ofhydraulic conductivity, where k (m/s) at a given overburdenC (m) follows:
k ¼ k0�e�a�C
(2)
with k0 being the hydraulic conductivity at surface.Marechal (1998) derives a value of 0.05m�1 for theexponent a for the uppermost decompressed zone, and avalue of 0.005m�1 at depth. This approach has beenadopted in this study, defining the decompressed zone asthe uppermost 100m of the massif. Although the depthdependence is frequently observed for the gneiss-formationswithin the Aar-massif and Gotthard-massif, this cleardependence is not observed within the Hercynian granitessuch as the Rotondo, Fibbia and Cacciola/Gamsbodengranite (Colenco, 1993; Loew et al., 1996; Masset andLoew, 2010). Furthermore, it can be observed that majorwater conducting faults often lack this depth-dependence(Thury et al., 1994). Therefore, the hydraulic conductivityfor the Hercynian granites was not modified with depth,except the distinction between the decompressed zone andthe deeper subsurface.The preferred orientation of fractures and faults,
associated with inflows to the tunnel within the Rotondogranite and the pronounced structural anisotropy withinthe neighbouring gneisses (foliation) imparts an anisotropyon the hydraulic conductivity of these formations, promotingflow along the strike of these features. As their orientation isapproximately subparallel or at acute angles to the overallstrike of the Gotthard Massif, the anisotropy is simplified tobe orientated globally with k1> k2, whereby k1 is orientatedparallel to the overall strike of the massif (72�). As thestructural features, such as the observed water conducting
Copyright © 2012 John Wiley & Sons, Ltd.
fractures within the granite, as well as the foliation in thegneisses are steeply subvertically inclined, the verticalcomponent of hydraulic conductivity was set equal to themaximum horizontal component. Studies in similar rocktypes suggest anisotropy ratios in the range of 1≤ 10–170(Hsieh et al., 1985; Raven, 1985; Nagra, 1988). In theabsence of further constrains on the absolute value of theanisotropy ratio, a conservative approximation of a 1:10ratio was adopted for the numerical model.Table III shows that the analytical approximation of
the k-value for the fault zone is approximately one orderof magnitude larger than the k-value approximated forthe remaining tunnel section. Other studies have statedpermeability contrasts between fault zone and neighbouringbedrock to be in the range of up to three orders of magnitude(Smith et al., 1990b; Forster et al., 1994; Caine et al., 1996).However, most of these studies consider narrow discretefault zones composed of the succession of fault gouge,damage zone and undamaged protolith. As stated earlier inthis study, the term fault zone is attributed to a 120-m-widezone comprising several narrow discrete faults with sectionsof densely fractured rock in between. Because of this, thecontrast to the surrounding bedrock is expected to be lesspronounced, compared to studies where a specific elementof a discrete fault zone in the strict sense, for example, thedamage zone, is compared with the essentially unfracturedbedrock. Therefore, a conductivity contrast of 1:10 isinitially set between the Rotondo granite as such and thefault zone within the granite. A similar contrast has beenfound by Colenco (1993) and Masset (2011) and has beenapplied in another study by Herbert et al. (1991) for aregional model.Anisotropy within the fault zone is set to be k1> k2 ,
whereby k1 is aligned parallel to the strike of the faultzone. Similar to the granite bedrock, the verticalcomponent of hydraulic conductivity (k3) was set tok3 = k1, as the fault zone is subvertically inclined. Manystudies have shown the decreased fault-normal flowacross fault zones, mainly caused by the low permeablecentral fault gouge and also by the preferred fault-parallel
Hydrol. Process. 28, 255–278 (2014)
262 U. S. OFTERDINGER, PH. RENARD AND S. LOEW
orientation of fracturation within the adjacent damagezone (Smith et al., 1990b; Caine et al., 1996; Lopez andSmith, 1996). This anisotropy ratio has been shown torange between ≤10 (Andersson et al., 1991; Forster andEvans, 1991) up to several orders of magnitude (Smithet al., 1990b; Evans et al., 1997). As the fault zone in ourcase includes only very few gouge material, which wouldpotentially inhibit fault-normal flow, an anisotropy ratiowithin the fault zone of 1:10 was initially assumed.
Groundwater recharge rates
Depending on topography, land use, vegetation andslope exposition, groundwater recharge shows strongvariability across catchments (e.g. Lerner et al., 1990;Scanlon et al., 2002; Heppner et al., 2007). As theresearch area is situated in a high mountainous areacovering a wide range of elevation zones, the spatialdiscretization of the groundwater recharge rates is a crucialfactor for estimating the upper boundary condition of thegroundwater flow model. For this reason, the rechargerates applied in the groundwater flow model were extractedfrom the results of a calibrated hydrological model of thestudy catchment.The applied GIS-based model precipitation-runoff-
evapotranspiration-hydrotope model combines the spatialdifferentiation of hydrologically similar response unitsor ‘hydrotopes’ and a runoff generation concept that allowsthe separate calculation of the water balance within eachhydrotope (Gurtz et al., 1999; Viviroli et al., 2009). Thehydrotopes were defined to represent hydrologicallyhomogeneous areas according to the most importantfactors controlling evapotranspiration and runoff formationprocess, such as the meteorological inputs, topography(catchment area, altitude, exposition and slope), land use
0 - 23 - 78 - 12
13 - 1516 - 1920 - 2728 - 3233 - 3738 - 42
x10-4 m/d
Figure 5. Map view of the distributed groundwater re
Copyright © 2012 John Wiley & Sons, Ltd.
and soil characteristics (Gurtz et al., 1990). For theglaciated areas, a conceptual model was applied, whichwas developed for a research study in the Rhônearea (Badoux, 1999). This concept attributes melt waterfrom the glaciated areas below the equilibrium linepreferentially to the fast runoff storage, whereas meltwater originating above the equilibrium line preferen-tially contributes to the slow runoff storage, that is togroundwater recharge.The hydrological model was first calibrated and
validated in the area of main interest, the Gerentalbasin (approx. 40 km2 ), and then applied to the largergroundwater flow model domain using identical modelparameters as calibrated in the Gerental basin. Thehydrograph simulation for the gauging station at theGerental catchment outlet was performed for the periodfrom January 1991 to October 1999. The results ofthe hydrograph simulation are discussed elsewhere(Vitvar and Gurtz, 1999). The temporal variations ofthe simulated recharge rates show maximum rechargerates in the upper Gerental-valley during spring andsummer (April–September), commencing with the onsetof the melting period.The resulting recharge distribution shows a strong
spatial variability, especially in the high altitude regionsof steep bare rock slopes, where low recharge areascontrast to the upper regions of the glaciers, characterizedby high recharge rates within small restricted areas(Figure 5 and 6). Another striking feature in the rechargedistribution is the observation of low to moderaterecharge rates along the valley floor and the lower valleyslopes. From a hydrodynamic perspective, these areas areexpected to constitute potential exfiltration areas, whereessentially, no groundwater recharge should occur. This
0 5 km
charge rates applied in the groundwater flow model
Hydrol. Process. 28, 255–278 (2014)

0 - 23 - 78 - 12
13 - 1516 - 1920 - 2728 - 3233 - 3738 - 42x10 m/d
0 500 m
SummitTunnel
Figure 6. Enlarged map view of the distributed groundwaterrecharge rates in the upper Gerental-valley, applied in the groundwater
flow model
263GROUNDWATER FLOW SYSTEMS IN THE ROTONDO GRANITE, CENTRAL ALPS (CH)
conceptual discrepancy might lead to a systematicerror in the spatial distribution of the recharge rates, aswith regard to the overall water budget, the wronglyassigned infiltrating waters in the potential exfiltrationzones would need to be attributed to other parts ofthe catchment to achieve a similar hydrograph simula-tion. For the purpose of the numerical simulations, anaverage recharge rate distribution was extracted fromthe nine-year average. The spatial average rechargerate of this distribution for the whole model domainis 12.05� 10�4 m/d, which is in agreement with studiesin similar topographic and geological settings in theCentral Alps (Koella, 1993) giving a range of2.7� 10�4 m/d to 21.9� 10�4 m/d with a most probablevalue of 10.9� 10�4 m/d.
Flow porosities
For the calculation of isochrones in the subsequentmodelling, an estimate of the flow porosity (kinematicporosity) nf for the fractured Rotondo granite was required.This flow porosity was estimated from the transmissivitydata obtained in the borehole tests and the frequencies ofthe fracture sets mainly associated to tunnel inflows. First,the apparent hydraulic aperture e of the flowing fracturesintersected by the borehole was estimated on the basis ofthe cubic law:
e ¼ffiffiffiffiffiffiffiffiffiffiffi12Tmrg
3
s(3)
with T as the hydraulic transmissivity (m2/s), m, theviscosity (kg/m s), r, the fluid density (kg/m3) and g, thegravitational constant (m/s2). The results are then used toestimate a range of porosities according to the following:
nf ¼ e
L(4)
where L is the measured average flowing fracture spacing(Himmelsbach et al., 1998). Comparison of these results
Copyright © 2012 John Wiley & Sons, Ltd.
were also made to fracture porosities approximated fromthe empirical relation of Snow (1968):
nf ¼ 5:45kiL2
� �13
(5)
with ki as the intrinsic permeability (m2 ) and L, the averageflowing fracture spacing (m). As L was set to equal thespacing of the fracture sets observed to be mainlyassociated to tunnel inflows, and no discrimination withinthese sets of the spacing of specific flowing fractures wasmade, the flow porosities derived on the basis of Lrepresent a potential overestimation of the actual porosity.The so calculated values are assumed to represent the flow
porosities of the more intact granite sections with moderatefracturation (blocks, nfB). Calculated values for nfB rangefrom 2.4� 10�5 to 2.9� 10�4 and are in agreement withpublished values for similar rock types (Abelin et al., 1991;Guimera and Carrera, 1997). For the approximation of anaverage flow porosity for the Rotondo granite on a largerscale, the discrete small-scale faults as well as the studiedmajor fault zone (which in turn also consists of severaldiscrete small-scale faults) within the granite also have to beaccounted for. Flow porosities for these features (nfF) couldnot be directly estimated, but published values for nfFindicate a range from 1.3� 10�3 (Himmelsbach et al., 1998)to 7.4� 10�3 (Frick, 1994). Based on these values, anaverage flow porosity for the Rotondo granite on theregional scale (nfRG) was approximated by averaging theflow porosities of the faults and of the granite blocks alongthe approx. 1.5-km tunnel profile, weighted by the measuredwidth of these sections along the tunnel profile following
nf RG ¼ ΣWF � nfF þ ΣWB � nfBWT
(6)
where WF (m) is the measured width of the encounteredsmall-scale faults along the tunnel section, andWB (m) is thewidth of the intermediate more intact blocks of granite. WT
(m) is the total length of the tunnel profile. Inserting thepreviously mentioned range of values for nfB and nfF yieldsan estimate for the average flow porosity of the Rotondogranite nfRG ranging from 2.0� 10�4 to 1.0� 10�3.
CONCEPTUAL MODEL
Many approaches are currently available for the simulationof flow in fractured rocks (Smith et al., 1990a; NRC, 1996),each corresponding to a different conceptualization of themedium, ranging from viewing themedium as an equivalentcontinuum with either single or double porosity based onprescribing effective hydraulic parameters (e.g. Carreraet al. 1990) to associating flow only to fractures with theneed for defining the geometry of the fracture network(Long et al., 1982; Dverstorp and Andersson, 1989; Cacaset al., 1990a, b, c). A combination of the two mentionedapproaches, that is the so-called hybrid models, consistsof treating minor fractures and the rock matrix as acontinuum and explicitly modelling major fracture zones
Hydrol. Process. 28, 255–278 (2014)

264 U. S. OFTERDINGER, PH. RENARD AND S. LOEW
(Kimmermeier et al., 1985; Carrera and Heredia, 1987). Inaddition, the channelling network concept reduces the 2Dflow through the fracture planes to a 1D channel lying inthe fracture plane (Neretnieks, 1983).As this study is focused on the groundwater flow systems
on the scale of the entire Rotondo massif and its interactionswith the subsurface galleries, we choose a continuumapproach with one discrete model fault zone to analyse thegroundwater flow at this scale. Effective hydraulic con-ductivities are introduced into the model to characterize thehydrogeological units. A fully three-dimensional model ischosen to simulate the influence of the complex topographyand the subsurface galleries on the flow systems. The effectof spatially distributed groundwater recharge rates isstudied by assigning a free and movable water table. Theinvestigated model fault zone within the Rotondo granite isrepresented in a discrete manner with three-dimensionalelements having anisotropic hydraulic parameters. Hydraulicanisotropy of the bedrock is introduced on the basis of fieldobservations of structural anisotropy and preferredorientations of water conducting features. The focus ofthe investigation and thus the modelling effort is aimedat the investigation of the groundwater flow systemswithin the Rotondo granite. However, as the position ofthe water divides is uncertain because of the anticipatedeffects of the tunnel galleries and the complex topog-raphy, the model domain is laterally extended to includeneighbouring formations and topography. Even though thisintroduces additional uncertainty into the model due tobadly constrained effective hydraulic parameters for theseunits, we consider this to be less crucial than prescribingwrong boundary conditions close to the area of interest.
NUMERICAL MODEL
The simulations of the groundwater flow in the research areawere carried out with the finite element FEFLOW-code(Diersch, 1998). The mesh consists of 141 022 nodes and259 156 elements distributed over 13 layers. Topographywas extracted from the digital elevationmodel on a 25� 25-mgrid. The model base is at 0m a.s.l. The total projected areaof the model domain comprises approx. 262 km2. The meshwas densified along the tunnel traces, in areas of complextopography and along the trace of the model fault zone andthe rivers/streams. The top three layers of the model werekept subparallel to topography, whereas the layers below arereferenced in orientation subparallel to the trace of thesubsurface galleries. This vertical discretization was chosento enable a better resolution of the free and movable watertable, to assign depth dependent k-values and to achieve adensified discretization around the galleries. The outerboundary conditions of the domain are set impervious(no-flow conditions). The perennial streams and rivers aretreated as fixed head inner boundary conditions. From theresults of the hydrological model, the spatially distributedlong-term mean recharge rates were extracted as upperboundary condition for the model. The Furka Tunnel andthe Bedretto Tunnel are represented as line sinks with
Copyright © 2012 John Wiley & Sons, Ltd.
fixed elevation heads. Initial conditions for steady-statesimulations are fully saturated conditions.
Modelling approach
The stable behaviour over time of the parametersmeasuredin the subsurface (inflow rates and hydrochemical/isotopiccomposition of groundwater (Ofterdinger et al., 2004)indicates that steady-state simulations are a feasibleapproach to calibrate effective k-values. Calibration effortsare carried out in a trial and error procedure and are focusedon the Rotondo granite and the immediate adjacentformations in order to reach a correlation to the observedinflow rates at the Bedretto Tunnel and the Furka Tunnel.In afirst phase, k-values for the Rotondo granite and/or the
fault zone within the granite are adapted to achieve theobserved discharge rates to the Bedretto Tunnel. Secondly,tomatch themeasured inflow to the Furka Tunnel, especiallyalong the section through the northern margin of the granitebody, additionally, k-values for the northern gneisses (O,PN) are adjusted to achieve a model calibration. Therecorded head data from the research borehole and theposition of the spring line on the terrain surface serve asadditional criteria to assess the plausibility of the modellingresults. During the modelling process, three base casescenarios are evaluated in which we address the impact ofthe model fault zone and the subsurface galleries on thegroundwater flow system.In scenario 1, a calibration is sought for a continuum
numerical model without including the higher conductivefault zone.In scenario 2, an isotropic higher conductive fault zone
(FZ) is incorporated into the model with a k-value contrast tothe surrounding granite bedrock (G) of 1:10 (kFZ =10� k1G).In scenario 3, anisotropy is introduced within the
fault zone of scenario 2. The anisotropy ratio is set tok1FZ = k3FZ = 10� k2FZ, with k2 representing the fault-normal flow direction.The influence of the subsurface galleries on the
groundwater flow field within the Rotondo Granite isinvestigated for all model scenarios by removing the fixedhead inner boundary conditions associatedwith the galleries.In a sensitivity study following the model calibration of
the individual scenarios, the influence of varying rechargeconditions is addressed. Model simulations with a series ofspatially uniform recharge rates are compared with themodel results with spatially distributed groundwaterrecharge rates. As values for the uniform recharge rates,the spatial average recharge rate for the whole modeldomain (12.05� 10�4 m/d or 19% of mean annualprecipitation), the spatial average recharge rate for theupper Gerental catchment (region above the BedrettoTunnel, 5.75� 10�4m/d or 7% of mean annual precipita-tion) as well as a minimal value of 2.74� 10�4 (approx. 3%of mean annual precipitation) were chosen. These values liein the range of published recharge rates for granitic terrain,ranging from 2–21% of mean annual precipitation (Lerneret al., 1990; Koella, 1993). Table V summarizes the approachto the individual model scenarios and model variants.
Hydrol. Process. 28, 255–278 (2014)

Table V. Summary of key characteristics of individual modelscenarios and model variants
Model Description
Scenario†
1 Higher conductive fault zone not included2 Isotropic higher conductive fault zone
included (kFZ = 10� k1G)3 Anisotropic higher conductive fault zone
included (k1FZ = k3FZ = 10� k2FZ)Variant{
1 Spatially uniform recharge rate applied(5.75� 10�4m/d)
2 Spatially uniform recharge rate applied(12.05� 10�4m/d)
3 Spatially uniform recharge rate applied(2.74� 10�4m/d)
FZ, fault zone; G, granite; k2FZ, fault-normal flow direction.† Spatially distributed recharge rates are applied to individual modelscenarios (refer to Section ‘Groundwater Recharge Rates’).{ Model variants are based on calibrated model scenario 2.
265GROUNDWATER FLOW SYSTEMS IN THE ROTONDO GRANITE, CENTRAL ALPS (CH)
For all model variants, particle tracking is carried out todelineate the respective recharge areas to the BedrettoTunnel. Particle backtracking is started along the meshnodes representing the Bedretto Tunnel as well as alongthe projected nodes on the 5m overlying and underlyingmesh slice. Additionally, forward tracking was initiatedfrom the top slice of the model to cross-check thedelineated recharge areas. Finally, isochrones werecalculated along the pathlines, initiated at the tunnelnodes, to approximate the advective travel times acrossdelineated recharge areas to the Bedretto Tunnel.
Model calibration
Scenario 1. To reach the calibration target of groundwaterinflow to the Bedretto Tunnel, the k-value of the Rotondogranite had to be adjusted to k1=1.2� 10�8m/s (Table VI).This value may range from 1.15� 10�8 m/s to1.25� 10�8 m/s to still meet the calibration target. Toachieve a calibration for the granite section along the FurkaTunnel, the k-value of the northern adjacent gneiss-unit (O)was additionally reduced by a factor of 0.4, and the k-value
Table VI. Calibration targets for inflow rates along specific tunnel sevalues for the individu
Calibration target Sce
Tunnel inflTunnel section [l/s]
Bedretto 14.9� 0.5 1Fault Zone 7.5� 0.5Furka (RG) 25.8� 5.6 2Oberwald 94.4� 5.9 9Realp† 75.8� 5.9 7
HydraulicMonitoring Interval [m]
Interval 1 1988 1Interval 2 1894 1
†Only four measurements 1998–March 1999.
Copyright © 2012 John Wiley & Sons, Ltd.
of the neighbouring PN-unit had to be reduced by one orderof magnitude from the initial value to match the flow rates atthe Oberwald-Portal of the Furka Tunnel. To further matchthe inflow along the section of the Furka Tunnel, whichdrains towards the Realp-Portal (Figure 4), the k-value forthe Cacciola-granite was increased to k1 = 8.0� 10�8m/s.This is regarded as plausible because major inflows alongthe Cacciola section of the Furka Tunnel are reported (Kellerand Schneider, 1982). The calibrated k-value for theRotondo granite is in good agreement with the firstapproximations following the analytical solution (Table III).Simulated heads in the monitoring intervals areunderestimated by the flux-calibrated model (Table VI).Furthermore, Figure 7 shows that this model scenariowithout the fault zone is not able to reproduce thecumulative inflow along the Bedretto Tunnel.
Scenario 2. With the fixed k-value contrast between thegranite bedrock and the fault zone of 1:10, a calibration tothe inflow rate along the fault zone section of the BedrettoTunnel as well as to the inflow rate along the remainingbedrock section was reached with k-values of6.0� 10�9m/s and 6.0� 10�8m/s for k1 of the graniteand the isotropic fault zone, respectively. These values areagain in good agreementwith the analytical approximations.Variation of the respective k-value for the granite bedrockand the fault zone within one order of magnitude yieldinflow rates to the Bedretto Tunnel beyond the calibrationtarget. An increase of the absolute k-values of the graniteand the fault zone to 8.0� 10�9/8.0� 10�8m/s leads forexample to inflow rates to the Bedretto Tunnel and the faultzone section of 19.3 and 10.3 l/s, respectively. A decrease ofk-values to 5.0� 10�9/5.0� 10�8m/s yields discharge ratesof 12.3 and 6.7 l/s for total inflow to the Bedretto Tunnel andthe fault zone section. To achieve a match to the inflowalong the Rotondo granite section of the Furka Tunnel, thek-values of the neighbouring gneiss (O) had to be increasedcompared with scenario 1 by a factor of 0.6 from the initialvalue. The cumulative inflow along the Bedretto Tunnel forthe calibratedmodel approximates well themeasured inflowprofile (Figure 7). However, similar to scenario 1, the headsin the monitoring intervals are underestimated (Table VI).
ctions and hydraulic heads in monitoring intervals with calibratedal model scenarios
nario 1 Scenario 2 Scenario 3
ow rates[l/s] [l/s] [l/s]4.8 15.0 15.2(1.9) 7.7 7.85.2 21.8 21.85.0 91.6 89.70.9 72.9 73.2heads[m] [m] [m]819 1851 1850756 1782 1781
Hydrol. Process. 28, 255–278 (2014)

Location of Fault Zone
0
200
400
600
800
1000
3500 3900 4300 4700 5100
NWSE
Tunnel metrics [m]
Cum
ulat
ive
inflo
w [l
/min
]
measured
scenario 1
scenario 3
scenario 2
Figure 7. Plot of measured cumulative groundwater inflow to the BedrettoTunnel along the tunnel profile versus simulation results for the individualmodel scenarios. The whole tunnel section is situated within the Rotondo
granite. For tunnel metrics, refer to Figure 4
266 U. S. OFTERDINGER, PH. RENARD AND S. LOEW
Scenario 3. The introduction of anisotropy within thefault zone (base case k1 = 10k2 with k2 fault-normalorientated) into the calibrated model of scenario 2 causesonly a slight decrease in fluxes to the Bedretto Tunnel(�0.8 l/s for the total tunnel from which �0.6 l/s along thefault zone section).K-valueswere adjusted to 6.5� 10�9 and6.0� 10�8m/s for the Rotondo granite and the fault zonerespectively to reach the calibration targets.A small additionalincrease of the k-values to 7.0� 10�9/7.0� 10�8 m/sleads to tunnel inflow beyond the calibration target of 16.3and 8.4 l/s for the Bedretto Tunnel and the fault zonesection, respectively. The cumulative inflow along theBedretto Tunnel resembles the simulation results ofscenario 2. Similar to the previous scenarios, the modelfails to reproduce the local head measurements in themonitoring intervals (Table VI).
1360
200
Topography, contour interval = 80 m
Depth to water table below ground surface, conto
Figure 8. Depth to the groundwater table below ground surface for model sce
Copyright © 2012 John Wiley & Sons, Ltd.
Model results
In all model scenarios, a considerable decline of the watertable below topography is simulated along the mountaincrests within the Rotondo area, especially along the trace ofthe subsurface galleries. For scenario 1, simulated positionof the water table range from ≤200m below the ridgesabove the Furka Tunnel in the orthogneiss to up to 600mbelow the crests of the Saashörner ridge in the Rotondogranite (Figure 8). In the east of the model domain, deepgroundwater tables can be observed in theWinterhorn andSiroerbenhorn area. In the western part of the domain, thegroundwater table lies at 100–300m below the ridges ofthe Mettligrat and Mittaghorn. In the Blauberg area to thenorth of the domain, depth to the groundwater tablereaches 200m.In scenario 2, the decline of the water table below
topography is less pronounced. Depth to the groundwatertable reaches up to 300m below the Saashörner and up to250m above the Furka Tunnel in the Rotälligrat area(Figure 9). No additional decline of thewater table due to theintroduction of the higher conductive fault zone is observed.The position of the groundwater table for scenario 3resembles closely the simulation results of scenario 2.Even though the water table position in the core of the
massifs differ significantly between model scenarios theobserved altitude of the spring discharges in the study area(Figure 2) is reproduced by all model scenarios within anaccuracy of 20–100m. The inaccuracy leads thereby to anoverestimation of the spring line altitude.For all three model scenarios, the particle tracking
delineates recharge areas to the Bedretto Tunnel lyingmainly along the crests of the high mountain ridges. Theupper glacier regions present here essentially the main
200
0 5 km
ur interval 100 m Tunnel galleries
Mountain summit
nario 1. Also indicated are several mountain summits for better orientation
Hydrol. Process. 28, 255–278 (2014)

1360
50
50
50
50
0 5 km
Topography, contour interval = 80 m
Depth to water table below ground surface, contour interval 50 m Tunnel galleries
Mountain summit
Figure 9. Depth to the groundwater table below ground surface for model scenario 2. Also indicated are several mountain summits for better orientation
267GROUNDWATER FLOW SYSTEMS IN THE ROTONDO GRANITE, CENTRAL ALPS (CH)
recharge source to the gallery (Figure 10). An additionalrecharge area is situated along the mid-altitude southernslope of the Sasshörner, along a smaller valley inwardtrending ridge. Here, moderate recharge rates are
sg
sa
sa
sa
0
TunnModel fault zone
Glaciated areamg Muttenglaciersg Saasglacierwg Witenwasserenglacier gg Gerenglacier
Rech(distr
Rech1 & 2
mu
mu
mg
Figure 10. Enlarged plan view of the upper Gerental-valley with the positionmodel varian
Copyright © 2012 John Wiley & Sons, Ltd.
predicted by the hydrological model (Figure 6). In allthree scenarios, the northern end of the Bedretto Tunnel isrecharged from the glaciated areas of the Leckihorn andSaashörner area as well as from the previously mentioned
wg
gg
le
le
wi
ro
1 km
el gallery
arge area for model scenariosibuted recharge rate)
arge area for model variant (uniform recharge rate)
Summit
mu Muttenhornle Leckihornsa Saashörnerwi Witenwasser-
enstockro Rotondo
of the recharge areas to the Bedretto Tunnel for the model scenarios andts 1 and 2
Hydrol. Process. 28, 255–278 (2014)
268 U. S. OFTERDINGER, PH. RENARD AND S. LOEW
recharge area along the Saashörner slope. The faultzone section along the Bedretto Tunnel is rechargedfrom the glaciated area at the Witenwasserenpass area(between Leckihorn and Witenwasserenstock) in the eastand from the glaciated regions on the north-facing slopeof the Rotondo.The introduction of the higher conductive fault zone in
scenarios 2 and 3 into the model leads to an enlargementof the recharge area, in particular in the upper regions ofthe Witenwasserenglacier. Flow entering the fault zone isaligned with the fault zone orientation and directed toits intersection with the gallery. For the southern end ofthe accessible part of the Bedretto Tunnel, the particletracking indicate the upper region of the Gerenglacier asrecharge area.To assess the influence of the subsurface galleries
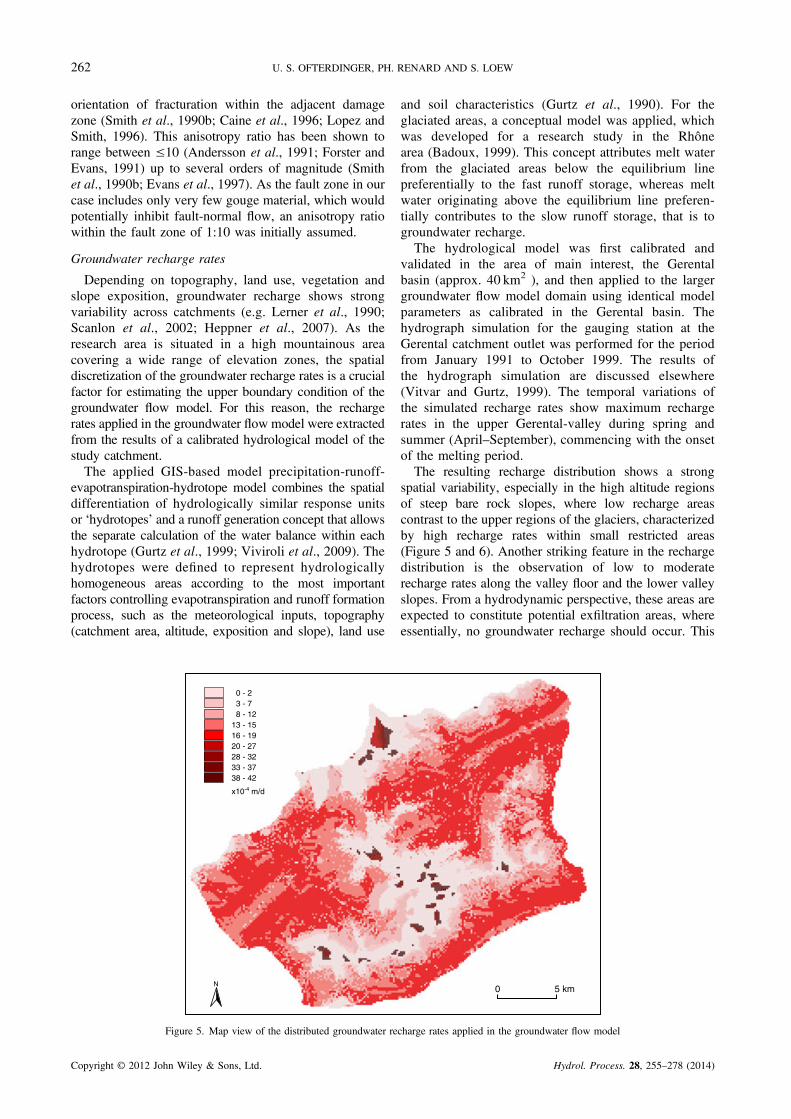
on the groundwater flow system in the Rotondo area, allcalibrated model scenarios were additionally simulatedwithout the fixed head boundary condition along thetunnel profile. Simulated heads without the tunnelcondition show significantly less decline of the watertable below ground surface. For scenario 1, this headdifference between simulations with and without tunnelamounts to 350m in the Saashörner area, 50–150m alongthe Rotälligrat and approx. 50m in the Siroerbenhornarea (Figure 11). For scenarios 2 and 3, these differencesrange from up to 150m along the Saashörner to 50–100mand 50–150m along the Rotälligrat and Siroerbenhorn,respectively. With regard to the particle tracking, allmodel scenarios show that without the tunnel gallery,only the eastern part of the previously described rechargeareas, that is, the area of the Leckihorn to Gerenglacier,
1360
50
Topography, contour interval = 80 m
Drawdown due to tunnel galleries, conto
Figure 11. Plan view of the model domain with isolines of drawdown due tosummits for bet
Copyright © 2012 John Wiley & Sons, Ltd.
is drained towards the tunnel position. This influenceof the gallery on the natural flow field is also illustratedin Figure 12, where the influence of the BedrettoTunnel is shown to cause a strong modification ofhead gradients.Advective travel times from the individual recharge
areas were estimated from the calculated isochronesalong the pathlines, initiated at the tunnel nodes, and aregiven in Table VII. The range of values for the appliedflow porosities nfRG yields a wide range of 1 to 14 yearsfor flow from individual recharge areas to the gallery(Table VII). In a relative comparison amongst theestimated travel times, the rapid flow path via the faultzone is apparent (Figures 13 and 14).
Sensitivity study
The particle tracking for the individual modelscenarios show that the prescribed distributed rechargerates strongly influence the position of the tunnel rechargeareas and type of recharge source, that is recharge fromglaciers or mountain slopes. Recharge is hereby dominatedby the high recharge rates in the upper regions of theglaciers. To assess the impact of a change in the rechargeconditions, three model variants with different uniformlydistributed recharge rates are considered and appliedexemplarily to model scenario 2. As described before,recharge rates are thereby varied within a plausible rangeof potential recharge rates. Note that simulations withuniform recharge rates are referred to in the following as‘model variant’ opposed to the calibrated simulations(model scenarios).
50
50
0 5 km
ur interval 50 m Tunnel galleries
Mountain summit
tunnel galleries for model scenario 1. Also indicated are several mountainter orientation
Hydrol. Process. 28, 255–278 (2014)

2560
2560
2400
ENEWSW
sasa
sa
0
2930F-B
B-T
x 10-4 m/d
F-B Furka Tunnel
B-T Bedretto Tunnel
sa Saashoerner
(a)
(b)
(c)
(d)
0
4
8
12
2930m0
2560
25602560
2400
2240
2080
water table
Figure 12. Two-dimensional section of hydraulic potentials for modelscenario 3. (a) Groundwater recharge rates extracted along the profilesection and interpolated on 50-m intervals along the section; (b) 2Dsection of hydraulic potentials and position of groundwater table for modelscenario 3 simulated with the tunnels; (c) corresponding section for modelscenario 3 simulated without tunnels; and (d) schematic plan view of thelocation of the profile section in the upper Gerental-valley (refer to
Figure 2). The vertical exaggeration of( b) and (c) is 0.7
Table VII. Approximated advective travel times across rechargeareas for model scenarios, deduced from calculated isochrones
along path lines initiated at the Bedretto Tunnel nodes
Recharge areaTravel times [years]
nfRG = 2.0� 10�4 nfRG = 1.0� 10�3
Leckihorn 2–3 8–10Witenwasserenstock 2–3.5 10–14Rotondo 2–2.5 10–12Saashoerner 2–2.5 9–10Witenwasserenpass 1–1.5 3–5(Through fault zone)
5300 5100 4900 4700 4500 4300 4100 3900 37000
200
400
600
800
1000
1200
1400
Tunnel Metrics [m]
Adv
ectiv
e tr
avel
tim
e [d
ays]
Figure 13. Range of advective travel times to the Bedretto Tunnel for120m intervals along the tunnel axis. Travel times are deduced fromcalculated isochrones along pathlines initiated at the Bedretto Tunnel
nodes (nfRG= 2.0� 10� 4)
1000
2000
3000
4000
5000
6000
5300 5100 4900 4700 4500 4300 4100 3900 37000
Tunnel Metrics [m]
Adv
ectiv
e tr
avel
tim
e [d
ays]
Figure 14. Range of advective travel times to the Bedretto Tunnel for120m intervals along the tunnel axis. Travel times are deduced fromcalculated isochrones along pathlines initiated at the Bedretto Tunnel
nodes (nfRG= 1.0� 10� 3)
269GROUNDWATER FLOW SYSTEMS IN THE ROTONDO GRANITE, CENTRAL ALPS (CH)
First, we consider a uniform recharge rate of5.75� 10�4m/d, a value extracted from the distributedrecharge rates as mean recharge rate in the upper Gerental
Copyright © 2012 John Wiley & Sons, Ltd.
catchment above the Bedretto Tunnel (>2000m a.s.l.,variant 1). We observe that the position of the watertable is significantly modified in comparison with modelsimulation with spatially distributed recharge rates.Figure 15 shows, in comparison with Figure 9, that theposition of the water table is significantly modified. Nodecline of the water table is observed in the Saashörnerarea, whereas an additional decline of the water table islocated in the Witenwasserenstock and Rotondo area. Anadditional decline of the water table can furthermore beobserved along the ridges in the east and west of thedomain as well as in the Blauberg area to the north. Thisillustrates the strong effect of the spatially distributedrecharge rates on the position of the groundwater tableespecially in the Saashörner area. Groundwater fluxes tothe Bedretto Tunnel are only changed by 2–3 % andfluxes to the Rotondo granite section of the Furka Tunnelby 7% (Table VIII). Changes in the simulated heads inthe monitoring intervals are only minor (Table VIII). Thelocations of the recharge areas to the Bedretto Tunnel arestrongly affected by the change in recharge conditions,especially to the west of the gallery (Figure 10). Here,the recharge area is now situated along the entire ridge ofthe Saashörner. No more drainage from the Saasglaciers
Hydrol. Process. 28, 255–278 (2014)

1360
200
200
200
200
0 5 km
Topography, contour interval = 80 m
Depth to water table below ground surface, contour interval 100 m Tunnel galleries
Mountain summit
Figure 15. Depth to the groundwater table below ground surface for model variant 1 with uniform groundwater recharge of 5.75� 10�4m/d. Alsoindicated are several mountain summits for better orientation
Table VIII. Simulated groundwater inflows to the tunnel galleriesand simulated heads in the monitoring intervals for model variants
with uniform groundwater recharge rates
Variant 1 Variant 2 Variant 3
Tunnel inflow rateTunnel section [l/s] [l/s] [l/s]
Bedretto 14.7 15.1 13.6Fault zone 7.5 7.6 7.0Furka (RG) 19.1 18.3 14.8Oberwald 86.4 86.7 65.0Realp 69.2 72.6 64.5
Hydraulic headsMonitoring interval [m] [m] [m]
Interval 1 1847.0 1854.6 1774.5Interval 2 1779.1 1784.8 1719.1
Variant 1: 5.75� 10�4m/d.Variant 2: 12.05� 10�4m/d.Variant 3: 2.74� 10�4m/d.
270 U. S. OFTERDINGER, PH. RENARD AND S. LOEW
and Muttenglaciers occurs. The recharge area to theeast of the Bedretto Tunnel is shifted downslope inthe Leckihorn area towards the west. Recharge areasto the fault zone are still situated along the glaciatedarea of the Witenwasserenpass, with an increased areatowards lower elevations, and along the southernRotondo slope.With a higher uniform recharge rate of 12.05� 10�4m/d
(variant 2) extracted from the distributed recharge rates asmean recharge rate for the entire model domain, generallyless decline of the water table below the ground surfacecan be observed when compared with the results from
Copyright © 2012 John Wiley & Sons, Ltd.
model scenario 2. No decline of the water table below theSaashörner ridge can be observed. Also, the depth to thegroundwater table in the Rotälligratt area is decreased. Inthe eastern and western parts of the model domain(Winterhorn andMettligrat area), changes are only minor.Changes in the groundwater flux to the galleries are minorwith 1–2% in the Bedretto Tunnel and 1–5% in the FurkaTunnel (Table VIII). Changes in simulated heads for themonitoring intervals are also only minor. The delineatedrecharge areas to the Bedretto Tunnel are similar to thosededuced for the model variant 1.In a third variant, the uniform groundwater recharge
rates are reduced to 2.74� 10�4 m/d, a value at thelower end of plausible recharge rates. This low uniformrecharge rate has a dramatic effect on the position ofthe groundwater table elevation in the model domain(Figure 16). Large areas, not only restricted to thecrest regions of the mountain ridges, show considerabledecline of the water table below the ground surface. Thewater table is in fact declined closely to the valley bottomin the upper Gerental catchment with considerabledecline also along the trace of the Bedretto Tunnelacross the upper Gerental valley. The depth to thegroundwater table amounts to 400–600m in theWinterhorn,Saashörner and Siroerbenhorn area. In the Leckihorn andWitenwasserenstock area, depths to the water table alsoreach 400–600m. The decline of the water table extendsbelow the Muttenglacier and Witenwasserenglacier andreaches 100–200m above the Bedretto Tunnel. The effectof this change in recharge rate is also manifested in a clearchange in groundwater fluxes to the Bedretto and FurkaTunnel with changes of 9–10% and 12–30%, respectively
Hydrol. Process. 28, 255–278 (2014)

1360
0 5 km
Topography, contour interval = 80 m
Depth to water table below ground surface, contour interval 100 m Tunnel galleries
Mountain summit
200200
400
200
400
200
200
Figure 16. Depth to the groundwater table below ground surface for model variant 3 with uniform groundwater recharge of 2.74� 10�4m/d. Alsoindicated are several mountain summits for better orientation
271GROUNDWATER FLOW SYSTEMS IN THE ROTONDO GRANITE, CENTRAL ALPS (CH)
(Table VIII). Also, the simulated heads in the monitoringintervals show a significant decrease (Table VIII). Therecharge areas are drastically modified. To the west, alarge area along the Saashörner slope is recharging to theBedretto Tunnel. Likewise to the east, the slopes of theLeckihorn are recharging to the gallery. Essentially abroad area from directly above the tunnel trace andexpanding to the west to the Sasshörner and to the east tothe Leckihorn area are drained to the Bedretto Tunnel.The recharge area to the fault zone is still largely situatedalong the Witenwasseren- and Gerenglacier.
Discussion of model results
The modelling of the previously mentioned scenariosin steady-state simulations show that the calibratedk-values are generally in good agreement with theanalytical a priori estimates. With regard to the hydraulicconductivities of the individual geological units, themodelling process showed that the fluxes to the BedrettoTunnel are mainly governed by the prescribed k-valuewithin the Rotondo granite, whereas the inflow along thegranite section to the Furka Tunnel are additionallysensitive to the k-values of the orthogneisses. Changes inhydraulic conductivity of the Rotondo granite in therange of less than one order of magnitude hereby causeobservable differences in the elevation of the groundwatertable, especially in the Saashörner area.The model simulations yield regional and local
groundwater flow systemswithin the Rotondo areawherebythe regional scale groundwater flow is mainly directedtowards the Rhône-valley in the east and the Ticino-valley
Copyright © 2012 John Wiley & Sons, Ltd.
at the southeastern border of the model domain.Unsaturated zones below the ridges and crests of up toseveral hundred metres are observed (Figures 8 and 9).The depths to the groundwater table below the Saashörnerand along the eastward section of the Furka Tunnel areenhanced by the presence of the subsurface galleries(Figure 11). Simulated pronounced decline of the watertable in the Saashörner area are confirmed by the findingsof a nuclear magnetic resonance survey along thesouthern slopes of this ridge, indicating a depth tothe water table of >90m (Legchenko et al., 1998). Thepresence of the subsurface galleries in the Rotondo areacauses strong modifications of the natural head gradients,leading locally to a reversal of natural groundwater flowdirections (Figure 12).The introduction of a higher conductive fault zone
within the base case scenario leads to a modificationof the head distribution in the model domain, as thehydraulic conductivity of the surrounding bedrock wasadapted to match the measured flow rates to the galleries.The ratio of anisotropy within the fault zone is of onlylittle significance in the simulated scenarios. This is mostprobably linked to the overall orientation of the faultzone sub-parallel to the main flow field and the regionalanisotropy of hydraulic conductivity within the adjacentbedrock. Thus, a potential barrier effect in fault-normaldirection due to a high ratio of anisotropy within thefault zone would not significantly hinder the naturalfault-parallel oriented flow field.Heads in themonitoring intervals of the research borehole,
characterizing the head distribution in a moderatelyfractured part of the granite body, are underestimated in
Hydrol. Process. 28, 255–278 (2014)

272 U. S. OFTERDINGER, PH. RENARD AND S. LOEW
all flux-calibrated model scenarios. Modifications of thek-value contrast between the granite bedrock and the faultzone from the originally set contrast of 1:10 does notprovide a better match of both inflow and the local headdata. For example, a decrease of the k-value of theRotondo granite in scenario 2 to a value of 1.0� 10�9 m/s,while maintaining the hydraulic conductivity of the faultzone at 6.0� 10�8 m/s results only in an increase ofsimulated heads in the monitoring intervals of 21m(interval 1) and 17m (interval 2), respectively. At the sametime, simulated groundwater inflow to the Bedretto Tunnelis already reduced by asmuch as 5.4 l/s. This amount cannotbe compensated for by a potential increase of the fault zonek-value without exceeding the measured calibration targetfor the inflow along the fault zone section. This modelbehaviour indicates that the presented equivalent continuumapproach with only a single discrete higher conductive faultzone is not able to simultaneously reproduce the measuredflow to the gallery and the local head data from the researchborehole correctly. For a match of both flux and head data,further discrete higher conductive features would need to beincluded into the model. This would then essentially lead tolower k-values for the granite bedrock in the calibrationprocess and thus to an increase of simulated heads at theborehole site.Generally, the model simulations reproduce well the
position of spring discharge in the upper Gerental valley.As these are situated only a few decametres to hundredmetres above the valley floor along the steep slopes, theinfluence of the conceptual discrepancy between themodelled exfiltration zones and the recharge areaspredicted along the valley floor by the hydrologicalmodel as stated earlier is thought to be less significant.The area concerned is rather small compared with thescale of the massif.Applying the groundwater recharge rate distribution from
the hydrological model to the individual model scenariosyields similar catchment areas to the Bedretto Tunnel. In theframework of this prescribed recharge distribution, thecatchment areas are mainly associated to the glaciated areaswith high recharge rates. The inflows to the fault zonesection along the Bedretto-tunnel are in all model scenariosconsistently recharged by the glaciated areas of theWitenwasserglacier and Gerenglacier.The distribution of delineated recharge areas is shown
to be strongly dependent on the spatial distribution ofthe recharge rates within the model domain. In theprescribed distributed recharge rates, the most strikingfeature is the strong contrast at high altitudes betweenthe steep bare rock slopes with little or essentially zerorecharge and the upper regions of the glaciers, wherehigh recharge rates are predicted (Figure 5 and 6). Thesestrongly localized high recharge rates dominate thedelineated recharge areas.The effect of the spatial discretization of the recharge
rates is apparent when compared with the results fromthe simulations with an equivalent uniform meanrecharge rate. The recharge areas to the Bedretto Tunnelare now more broadly aligned along the mountain ridges,
Copyright © 2012 John Wiley & Sons, Ltd.
and, especially to the west, a wider area along theSaashörner ridge is recharging to the Bedretto Tunnel(Figure 10). With a uniform recharge rate, the fault zonesection in the tunnel is consistently recharged from thearea of the Witenwasserenglacier and Gerenglacier.Additionally, the lower slopes of the Gerenglacier arerecharged along the fault zone to the Bedretto Tunnel.The groundwater fluxes to the Bedretto Tunnel are onlyaffected to a minor degree, when an average uniformrecharge rate is extracted from the spatially distributedrecharge rates of the upper Gerental (variant 1) or thewhole model domain (variant 2), respectively. However,when the absolute value of the uniform recharge rateis lowered to a minimum plausible value (variant 3),dramatic changes in terms of recharge area, water tableposition and tunnel inflows are observed (Figure 16,Table VIII). The latter are decreased clearly belowmeasured inflow rates to the galleries. Forster and Smith(1988a) investigate the nonlinear fashion in which thewater table elevations respond to changes in groundwaterrecharge rate. The response of the water table elevation inthe Rotondo granite (below the Saashörner) appears to beillustrating this nonlinear behaviour.Comparing the position of the water table for the
individual model scenarios and variants (Figures 8, 9, 15and 16), the magnitude of variations in water tableelevation below the Saashörner is striking. One explan-ation for this sensitive behaviour lies in the specifictopography, that is the high relief of this mountain. TheSaashörner are bound to three sides by deep valleys,especially to the north and west with steep slopesranging from 1800 to 2900m.a.sl. To the east, thesubsurface galleries impose an additional low fixed headboundary. The surrounding crests including the Leckihornand Rotälligrat are aligned along elongated mountainridges, show less steep relief and bounding valleys aregenerally at an altitude >2000–2100m a.s.l. Modelsimulations of Forster and Smith (1988b) have also shownthat high-relief terrain amplifies the impact of factors suchas permeability and recharge rate on groundwater flowsystems within mountain massifs.As a consequence of the sensitivity study, the eastern
recharge areas can be regarded as robust, because theyare delineated by all model variants as recharge areas,independent of the recharge conditions. The positionof the recharge areas to the west of the BedrettoTunnel are more clearly subject to the spatial discretizationof the recharge rates, and some ambiguity remains ontheir position. In the following, we will discuss howthe environmental isotope data can supplement theseinterpretations.
COMPARISON WITH RESULTS FROMENVIRONMENTAL ISOTOPE STUDY
In a previous study of the isotopic and hydrochemicalcomposition of the encountered groundwater along theBedretto Tunnel (Ofterdinger et al., 2004), measured
Hydrol. Process. 28, 255–278 (2014)
273GROUNDWATER FLOW SYSTEMS IN THE ROTONDO GRANITE, CENTRAL ALPS (CH)
d18O values indicate an altitude effect with higherrecharge altitudes towards the northern end of theBedretto Tunnel (Figure 17). Estimated mean rechargealtitudes lie in the range of 2600–2800m a.s.l.The numerical simulations with distributed recharge
rates yield recharge areas to the northern end of theBedretto Tunnel mainly associated with the Saasglacierand Muttenglacier as well as the Leckihorn area atelevations of 2800–2900m a.s.l. Proceeding to the southalong the Bedretto Tunnel, an additional recharge areaalong the Saashörner slope at elevations of 2500–2600ma.s.l. is drained towards the Bedretto Tunnel. Along thefault zone section of the gallery, depleted d18O valuesdiverging from the above trend are observed. A rechargealtitude of approx. 2740m a.s.l. is approximated fromthe isotope data. The delineated recharge area for thefault zone section from the model simulations withdistributed recharge rates is situated at the glaciatedWitenwasserenpass area at an elevation of approx.2800m a.s.l. Additionally, an area along the northern
1480
2400
2600
2800
3000
3200 0 500 m
Tunnel collapsed
Alti
tude
[m
a.s
.l]
SE NW
Glacier
sampled inflow
b
a
c0
4
8
12
16
Trit
ium
[T
U]
-15.2
-15.0
-14.8
-14.6
12.5
15.0
17.5
20.0
Tem
pera
ture
[°c
]
22.5
δ18O
[ %
]
Figure 17. Cross section along the profile of the Bedretto Tunnel withlocation of sampled inflows; (a) mean temperature, (b) mean tritiumconcentration and (c) mean d18O value of sampled groundwater. The
analytical error is indicated
Copyright © 2012 John Wiley & Sons, Ltd.
slope of the Rotondo at an elevation of 2800–2900m a.s.l.is delineated as recharge area to the fault zone section.For the southern end, d18O values similar to the mostnorthern end of the gallery are observed. The modelsimulations delineate a recharge area along the upperslopes of the Gerenglacier as recharge source to thistunnel section. A decreasing recharge altitude alongthe northern end of the tunnel is also reproduced inthe model variants with uniform recharge rates. To thewest of the Bedretto Tunnel a recharge area along theSaashörner is delineated with altitudes between 2800and 2700m a.s.l. and to the east of the gallery between2900 and 2700ma.s.l. as sampling locations in the tunneladvance southwards. The fault zone section is rechargedfrom the Witenwasserenglacier and Gerenglacier atelevations ranging from 2700–2800m a.s.l. to the eastand 2800–2900m a.s.l. along the Rotondo slope. Eventhough the range of values deduced from both rechargedistributions show an agreement, it has to be stressedthat the specific position and thus altitude of the rechargeareas is subject to the prescribed orientation of k1 withinthe Rotondo granite, which was constrained by fieldobservations and measurements.Estimated mean residence times from lumped-parameter
modelling of the d18O signature in groundwater samplestaken along the fault zone section are 1–1.5 years. In thenumerical simulations, the advective travel times deducedfrom the calculated isochrones for pathlines to the faultsection of the gallery are in a similar order of magnitude,however showing a wider range from 1–5 years dependingon the applied flow porosity value. Travel times to thefault zone section of the Bedretto Tunnel werefurthermore estimated on the basis of tritium data ingroundwater samples and recharge components (Ofterdinger,2001; Ofterdinger et al., 2004) using the decay equation(Clark and Fritz, 1997)
at3H ¼ a03He�lt (7)
with a03H initial tritium concentration in groundwater
recharge, at3H residual tritium concentration in ground-
water sample (both in TU) and l decay term l = ln2/t1/2(t1/2 = 12:43 years, half-life of tritium). These simplifiedcalculations underline that for these range of travel times,summer precipitation is only a minor component ingroundwater recharge to the fault zone section of theBedretto Tunnel.The tritium data measured along the Bedretto Tunnel
show, that the groundwater encountered along the faultzone section is recharged from glacial melt water as acombination of melt water from accumulated low tritiumwinter precipitation and glacial ice melt. The contributionof sub-modern glacial ice melt thus leads to the observedlow tritium values in the inflows (Ofterdinger et al., 2004).All model scenarios and variants reproduce the observationsof glacial recharge.To the northern end of the Bedretto Tunnel, measured
tritium values indicate recharge from recent winter precipi-tation (Figure 17). The model scenarios with distributed
Hydrol. Process. 28, 255–278 (2014)

274 U. S. OFTERDINGER, PH. RENARD AND S. LOEW
recharge rates delineate the Saasglacier andMuttenglacier asan important recharge source to this tunnel section,whereas the model variants with uniform rechargedelineate the slopes of the Saashörner as recharge area.If the Saasglacier and Muttenglacier were to contributedominantly to the groundwater recharge to this tunnelsection, the difference between the measured tritiumvalues in this section to the observed low tritium valuesalong the fault zone section would need to be explained bya different isotopic composition of the melt water fromtheses glaciers, as both tunnel sections would then berecharged essentially by the same type of recharge source.Groundwater recharge from recent accumulated winterprecipitation on the slopes of the Saashörner couldhowever explain well the measured tritium values in thenorthern tunnel section. The tritium data observed alongthe northern section of the Bedretto Tunnel is thus not inagreement with the recharge sources delineated from thesimulations with the distributed recharge rates. Thesepredict the upper regions of the glaciers as dominantrecharge areas to the tunnel with high recharge rates.The dominance of these recharge areas results from thebi-modal groundwater recharge concept for the glaciatedareas applied in the hydrological model. In this concept,melt water from above the equilibrium line of the glacierspreferentially contributes to the slow runoff storage andthus to groundwater recharge, whereas melt water frombelow the equilibrium line is attributed to the fast runoffstorage. This model has been previously applied forhydrological studies in the Rhône-area (Badoux, 1999)and builds on the idea that melt water from above theequilibrium line percolates through the glacial body andcrevasses towards the distributed subglacial drainagesystem. Here, its contact time with the fractured bedrocksurface is potentially larger than for melt water originatingcloser to the glacier snout. In these regions of the glacier,a higher portion of the melt water runs off via theglacier surface and through a more developed channelizedsubglacial drainage system (Tranter et al., 1996).However, this concept is based on strong generalizedassumptions, especially as the geometry of the subglacialdrainage system within the glacier is highly variable andno constrains, as to which areas below the glaciers of thestudy area groundwater recharge may occur, are available.Additionally, melt water from the glacial ice is availablefor groundwater recharge throughout the base of thetemperate glaciers because of frictional heat and theconductive heat flux from the bedrock (Menzies, 1995).Therefore, the assumption of the equilibrium line as alimit for preferential groundwater recharge from theglaciers poses a strong constrain on the spatial distributionof the recharge in these regions. Furthermore, the highamount of predicted groundwater recharge in these smallregions of the glaciers is striking (up to 40% of meanprecipitation rate). Even though substantial rechargemay occur along fractures (Lerner et al., 1990) withconsiderable water intake rates (Rasmussen and Evans,1993; Gleeson et al., 2009), such localized high rechargerates in the upper regions of the glaciers seem less
Copyright © 2012 John Wiley & Sons, Ltd.
plausible. A comparable recharge flux, distributed over awider area of the glaciated regions might be a betterapproximation of the groundwater recharge below theglaciated areas.A second factor for the dominance of the localized
high recharge areas in the glaciated regions lies in thestrong contrast in recharge rates between these areas andthe neighbouring steep bare rock slopes, where very littlerecharge is predicted by the hydrological model.According to Forster and Smith (1988b), recharge ratesalong the summits might reach ≤10% of the precipita-tion rate. Although it is plausible that liquid precipitationwill preferentially enter fast surface runoff along thesteep slopes, melt water from the winter snow cover is animportant potential recharge source at these altitudes.This has been described by Rodhe (1998) and Hansmannet al. (2011) as a very efficient input to groundwaterrecharge. Snow cover along the Saashörner for exampleis generally substantial and especially topographicdepressions, in this case small kars at the foot of thesteep rock faces, might serve as potential rechargeareas (Lissey, 1968; Lerner et al., 1990). Thesenumerous small areas are however not distinguishedin the hydrological model because of the resolution ofthe applied model grid. The previously mentionedconsiderations might thus lead to an overestimation ofthe contrast in recharge rates along the partly glaciatedcrests of the mountain ridges in the Rotondo area.The spread of the encountered tritium data in the
northern section of the gallery has been attributed tovarying flow velocities (reflected by different tritiumconcentrations) within separate hydraulic features suchas fractures and small scale faults. In this sense, thegroundwater system might be viewed as an assemblageof discrete water parcels that move along defined flowpaths (Gat, 1981). Similar observations were made byFontes et al. (1981) in a comprehensive study in theMont-Blanc tunnel. Even though the homogeneouscontinuum approach cannot reproduce the potentialheterogeneity of velocities present in the granite bodydue to discrete small scale fractures and faults, a certainspread of deduced travel times for flow towards thisnorthern tunnel section can also be observed in thisapproach (Table VII).The tritium data at the southern end of the accessible part
of the Bedretto Tunnel displays a similar discrepancy withregard to the recharge source as the data at the northern endof the gallery. Although the scenarios with a distributedrecharge predict mainly glacial melt water as rechargesource, the uniform recharge variants delineate the slopes ofthe Wittenwasserenstock and the Rotondo as main rechargesources with only a minor glacial component. In general,the findings from the analysis of the chemical andenvironmental isotope composition of the groundwaterencountered along the Bedretto Tunnel are reproduced inthe model simulations. In particular the analysis of theobserved tritium data along the Bedretto Tunnel allows anevaluation of the plausibility of the different rechargeconditions applied in the model simulation.
Hydrol. Process. 28, 255–278 (2014)
275GROUNDWATER FLOW SYSTEMS IN THE ROTONDO GRANITE, CENTRAL ALPS (CH)
CONCLUSION
In this paper, we presented hydraulic measurements from adeep tunnel in fractured crystalline rocks of the SwissAlps and used this data subsequently to constrain aregional groundwater flow model. One of the aims wasto investigate the effects of controlling factors on theflow system such as recharge conditions and structuralelements in model simulations. The results of thesesimulations were compared with the findings of a previousstudy, as part of which, the environmental isotopecomposition and the hydrochemistry of the groundwaterwas investigated.In the framework of the chosen continuum approach,
the numerical simulations were able to provide valuableinsights with regard to the impact of the subsurfacegalleries on the natural flow field within the Rotondo areaand increased our understanding of the most influentialparameters affecting the position of the groundwater tablein a high alpine catchment area.The water table position was shown to be sensitive to
even small changes in prescribed hydraulic conductivities,with changes in elevation of several hundred metres formodifications of hydraulic conductivity of less than oneorder of magnitude. The significant decline of the watertable below the mountain ridges of up to 600m observedin the simulations is enhanced by the presence of thesubsurface galleries, which generally modify the naturalflow field by enhancing natural head gradients or evencausing a reversal of the regional head gradients. Thepresence of a higher conductive fault zone with a k-valuecontrast to the surrounding bedrock of 1:10 causes nosignificant impact on the regional groundwater table, butmost importantly acts as fast flowpath for groundwaterrecharging in glaciated areas in the eastern part of thestudy area and discharging to the Bedretto Tunnel. Theinternal anisotropy ratio of the horizontal components ofhydraulic conductivity within the fault zone is lessimportant because of the overall sub-parallel orientationof the fault zone with the orientation of the majorhorizontal component of hydraulic conductivity withinthe adjacent granite. Calibrated k-values for the Rotondogranite in the order of 6.5� 10�9 to 1.2� 10�8 m/s lie inthe range of reported equivalent k-values for Hercyniangranites of the Central Alps (Loew et al., 1996; Massetand Loew, 2010).Spatially distributed groundwater recharge rates
significantly affect the head distribution within the researcharea when compared with simulations with uniformrecharge estimates. High relief massifs are moresensitive to changes in the recharge rate with regard tothe water table elevation.Compared with the interpretations based on the analysis
of environmental isotopes and hydrochemistry, thenumerical simulations underline that the groundwaterrecharge to the Bedretto Tunnel is derived from within thegranite body with a potentially minor recharge contributionfrom an isolated amphibolite wedge in the Leckihorn areatowards the northern end of the gallery.
Copyright © 2012 John Wiley & Sons, Ltd.
In the combined interpretation of environmentalisotopes and hydrodynamical modelling, we found thetritium data a very useful tool in the delineation ofgroundwater recharge sources in this alpine region. Theanalysis has shown that while the fault zone section inthe Bedretto Tunnel is recharged by the glaciated areasto the east of the gallery, the northern section of thetunnel receives mainly groundwater inflow rechargedfrom recent precipitation with a major component ofaccumulated winter precipitation. In the comparison ofthese findings, we could show that the spatiallydistributed recharge rates extracted from the hydrologicalmodel overestimate the contribution of the glaciatedareas in groundwater recharge to the northern part of thetunnel. This is linked to the simplified assumption madein the hydrological model concerning the spatialdiscretization of groundwater recharge in the glaciatedareas. A more physical based model of the glaciatedareas (e.g. Arnold et al. (1998), Richards et al. (1996)),especially of the melt water routing through the glacialbody, would aid the better understanding of the spatialavailability of potential groundwater recharge and thuslead to a better representation of these recharge sourceswithin the numerical groundwater flow model.
ACKNOWLEDGEMENTS
Access to the Furka Tunnel and the Bedretto Tunnel aswell as logistic help was kindly provided by the Furka-Oberalp-Bahn. Then, digital elevation map DHM25 of theresearch area was used with approval by the Bundesamtfür Landestopographie, Wabern (CH; Reference:BA013094). This research was funded by the ETHresearch fund.
REFERENCES
Abbott MD, Lini A, Bierman PR. 2000. d18O And 3H measurementsconstrain groundwater recharge patterns in an upland fracturedbedrock aquifer, Vermont, USA. Journal of Hydrology 228:101–112.
Abelin H, Birgersson L., Moreno L, Widen H, Agren T, Neretnieks I.1991. A large-scale flow and tracer experiment in granite - 2. Resultsand interpretation. Water Resources Research 27: 3119–3135.
Andersson J, Ekman L, Nordqvist R, Winberg A. 1991. Hydraulic testingand modelling of a low-angle fracture zone at Finnsjoen, Sweden.Journal of Hydrology 126: 45–77.
Arnold N, Richards K, Willis I, Sharp M. 1998. Initial results from adistributed, physically based model of glacier hydrology. HydrologicalProcesses 12: 191–219.
Badoux A. 1999. Untersuchung zur Flaechendifferenzierten Modellierungvon Abfluss und Schmelze in teilvergletscherten Einzugsgebieten.MSc Thesis, Swiss Federal Institute of Technology (ETH) Zurich,Switzerland.
Balek J. 1988. Groundwater recharge concepts. In Estimation of NaturalGroundwater Recharge, Simmers I (ed). NATO ASI Series. Series C222. D Reidel Publishing Company: Dordrecht; 3–11.
Bear J. 1993. Modeling flow and contaminant transport in fractured rocks.In Flow and Contaminant Transport in Fractured Rock, Bear J, TsangC, de Marsily G (eds). Academic Press: Amsterdam; 1–38.
Brace WF. 1980. Permeability of crystalline and argillaceousrocks. International Journal of Rock Mechnics & Mining Science17: 241–251.
Hydrol. Process. 28, 255–278 (2014)
276 U. S. OFTERDINGER, PH. RENARD AND S. LOEW
BraceWF. 1984. Permeability of crystalline rocks: new in situ measurements.Journal of Geophyscial Research 89: 4327–4330.
Cacas MC, Ledoux E, De Marsily G, Barbreau A, Calmels P, Gaillard B,Margritta R. 1990a. Modeling fracture flow with a stochastic discretefracture network: calibration and validation - 2. The transport model.Water Resources Research 26: 491–500.
Cacas MC, Ledoux E, de Marsily G, Tillie B, Barbreau A, Calmels P,Gaillard B, Margrita R, Durand E, Feuga B, Peaudecerf P. 1990b.Flow and transport in fractured rocks: an in situ experiment in theFanay-Augeres mine and its interpretation with a discrete fracturenetwork model. In Memoires of the 22nd Congress IAH, Vol XXII.Lausanne; 13–37.
Cacas MC, Ledoux E, De Marsily G, Tillie B, Barbreau A, Durand E,Feuga B, Peaudecerf P. 1990c. Modeling fracture flow with a stochasticdiscrete fracture network: calibration and validation - 1. The flowmodel. Water Resources Research 26: 479–489.
Caine JS, Forster CB. 1999. Fault zone architecture and fluid flow:insights from field data and numerical modeling. In Faults andSubsurface Fluid Flow in the Shallow Crust, Haneberg WC, MozleyPS, Moore JC, Goodwin LB (eds). American Geophysical Union:Washington D.C.; 101–127.
Caine JS, Evans JP, Forster CB. 1996. Fault zone architecture andpermeability structure. Geology 24: 1025–1028.
Carrera J, Heredia J. 1987. Inverse problem of chalk river block,HYDROCOIN level 2 (Case3) and level 2 (Case5a). Technical ReportNTB-88-14. NAGRA.
Carrera J, Heredia J, Vomvoris S, Hufschmied P. 1990. Fracture flowmodelling: application of automatic calibration techniques to a smallfractured monzonitic gneiss block. In Hydrogeology of LowPermeability Environments, Neuman SP, Neretnieks I (eds). IAH -Selected Papers, Verlag Heinz Heise: Hannover (Germany); 115–167.
Clark ID, Fritz P. 1997. Environmental Isotopes in Hydrogeology. LewisPublishers: Boca Raton, Florida.
Clauser C. 1992. Permeability of crystalline rocks. Eos 73: 233–240.Colenco. 1993. Gotthard-Basistunnel: Quantitative AnalyseHydrogeologischer Aufnahmen von Stollen- und Tunnelbauten imGebiet Aar-Massiv-Gotthard-Massiv-Leventina. Technical Report1763/5. Colenco Power Consulting.
Cruchet M. 1985. Influence de la decompression sur le comportementhydrogeologique des massifs cristallins En basse Maurienne (savoie,France). Geologie Alpine 61: 65–73.
Davison CC, Kozak ET. 1988. Hydrogeologic characteristics ofmajor fracture zones in a large granite batholith of the Canadianshield. In Proceedings of the 4th {Canadian/American} Conferenceon Hydrogeology. National Ground Water Association. Dublin,Ohio.
Davy P, Bour O, De-Dreuzy J-R, Darcel C. 2006. Flow in multiscalefractal fracture networks. In Fractal Analysis for Natural Hazards, vol.261, Cello G, Mulamud BD (eds). Geological Society: London. SpecialPublication; 31–45.
Diersch H-JG. 1998. FEFLOW - Interactive, Graphics-Based FiniteElement Simulation System for Modeling Groundwater Flow,Contaminant Mass and Heat Transport Processes, User’s Manual.WASY: Berlin.
Dverstorp B, Andersson J. 1989. Application of the discrete fracturenetwork concept with field data: possibilities of model calibration andvalidation. Water Resources Research 25: 540–50.
Evans JP, Forster CB, Goddard JV. 1997. Permeability of fault-relatedrocks, and implications for hydraulic structure of fault zones. Journal ofStructural Geology 19: 1393–404.
Flerchinger GN, Cooley KR, Ralston DR. 1992. Groundwater responseto snowmelt in a mountainous watershed. Journal of Hydology 133:293–311.
Fontes JC, Bortolami GC, Zuppi GM. 1981. Hydrologie Isotopique DuMassif Du Mont-Blanc. In Isotope Hydrology. IAEA/UNESCO.Proceedings Symposium Neuherberg 1, Vienna; 411–440.
Forster CB, Evans JP. 1991. Hydrology of thrust faults and crystallinethrust sheets: results of combined field and modeling studies.Geophysical Research Letters 18: 979–982.
Forster C, Smith L. 1988a. Groundwater flow systems in mountainousterrain - 1. Numerical modeling technique. Water Resources Research24: 999–1010.
Forster C, Smith L. 1988b. Groundwater flow systems in mountainous terrain- 2. Controlling factors. Water Resources Research 24: 1011–1023.
Forster CB, Goddard JV, Evans JP. 1994. Permeability structure ofa thrust fault. In Technical Report Open-File-Report 94–228.Proceedings of Workshop LXIII - The Mechanical Involvement ofFluids in Faulting. USGS.
Copyright © 2012 John Wiley & Sons, Ltd.
Frick U. 1994. The Grimsel radionuclide migration experiment - acontribution to raising confidence in the validity of solute transportmodels used in performance assessment. In GEOVAL ’94 - Validationthrogh Model Testing, Proceedings of an NEA/SKI Symposium. OECDNuclear Energy Agency; 245–273.
Gat JR. 1981. Groundwater. In Stable Isotope Hydrology. Deuterium andOxygen-18 in the Water Cycle, Gat JR, Gonfiantini R (eds). IAEA:Vienna; 223–240.
Gleeson T, Manning AH. 2008. Regional groundwater flow inmountainous terrain: three-dimensional simulations of topographicand hydrogeologic control. Water Resources Research 44: W10403.
Gleeson T, Novakowski K, Kyser TK. 2009. Extremely rapid andlocalized recharge to a fractured rock aquifer. Journal of Hydrology376: 496–509.
Goodman RE. 1965. Ground water inflows during tunnel driving.Engineering Geology 2: 39–56.
Guimera J, Carrera J. 1997. On the interdependence of transport andhydraulic parameters in Low permeability fractured media. In HardRock Hydrosystems, Pointet T (ed). IAHS Publication No. 241, IAHSPress: Wallingford (UK); 123–133.
Gurtz J, Peschke G, Mendel O. 1990. Hydrologic processes in smallexperimental areas influenced by vegetation cover. In HydrologicalResearch Basins and Environment Proceedings and Information No.44. International Conference Wageningen; 61–69.
Gurtz J, Baltensweiler A, LangH. 1999. Spatially distributed hydrotope-basedmodelling of evapotranspiration and runoff in mountainous basins.Hydrological Processes 13: 2751–2768.
Hansmann J, Loew S, Evans KF. 2011. Reversible rock-slope deformationscaused by cyclic water table fluctuations in mountain slopes of theCentral Alps, Switzerland. Hydrogeology Journal 20: 73–91.
Heppner C, Nimmo J, Folmar G, Gburek W, Risser D. 2007. Multiple-methods investigation of recharge at a humid-region fractured rock site.Hydrogeology Journal 15: 915–927.
Herbert A, Gale J, Lanyon G, MacLeod R. 1991. Modelling for the stripasite characterization and validation drift - inflow: prediction of flowthrough fractured rock. Technical Report SKB91-35. SKB.
Himmelsbach T, Hoetzl H, Maloszewski P. 1998. Solute transportprocesses in a highly permeable fault zone of Lindau fractured rock testsite. Ground Water 36: 792–800.
Hsieh PA, Neuman SP, Stiles GK, Simpson ES. 1985. Field determinationof the three-dimensional hydraulic conductivity tensor of anisotropicmedia - 2. Methodology and application to fractured rocks. WaterResources Research 21: 1667–1676.
ISO. 1997. Measurement of liquid flow in open channels - velocity-areamethods. Technical Report ISO 748:1997(E). InternationalOrganization for Standardisation, Geneva.
Jamier D. 1975. Etude de la Fissuration, de L’hydrogeologie et dela Geochemie Des Eaux Profondes Des Massifs de L’arpille et DuMont-Blanc. PhD Thesis, Faculte des Sciences de l’Universite deNeuchatel, Switzerland.
Kattelmann R, Elder K. 1991. Hydrologic characteristics and waterbalance of an alpine basin in the Sierra Nevada. Water ResourcesResearch 27: 1553–1562.
Keller F, Schneider TR. 1982. Der Furka-Basistunnel - Zur Eroeffnung am25. Juni 1982; Geologie und Geotechnik. Schweizer Ingenieur undArchitekt 24: 512–520.
Kimmermeier E, Perrochet P, Andrews R, Kiraly L. 1985. Simulation parModele Mathematique des Ecoulements Souterrains Entre Les Alpeset la Foret Noire. Technical Report NTB-84-50. NAGRA.
Kitterod N, Colleuille H, Wong WK, Pedersen TS. 2000. Simulation ofgroundwater drainage into a tunnel in fractured rock and numericalanalysis of leakage remediation, Romeriksporten tunnel, Norway.Hydrogeology Journal 8: 480–93.
Koella E. 1993. Gotthard-Basistunnel - Regional Hydrogeologie imProjektgebiet unter Besonderer Beruecksichtigung des Ritom-Gebietes.Unpublished Report from 30.11.1993.
Labhart TP. 1999. Aarmassiv, Gotthardmassiv und TavetscherZwischenmassiv: Aufbau und Entstehungsgeschichte. In Vorerkundungund Prognose des Basistunnel am Gotthard und am LoetschbergProceedings Symposium Geologie Alptransit. Loew S, Wyss R (eds).A.A. Balkema: Rotterdam (NL); 31–43.
Legchenko A, Beauce A, Ofterdinger US, Renard P. 1998. Field tests ofthe surface proton magnetic resonance instrument NUMIS in fracturedcrystalline rocks of the Western Gotthard-Massif (Switzerland).Technical Report BRGM-ETH3465/13. Department of Geology, SwissFederal Institute of Technology (ETH) Zurich, Switzerland.
Lerner DN, Issar AS, Simmers I. 1990. Groundwater Recharge – A Giude toUnderstanding and Estimating Natural Recharge. Heinz Heise: Verlag.
Hydrol. Process. 28, 255–278 (2014)

277GROUNDWATER FLOW SYSTEMS IN THE ROTONDO GRANITE, CENTRAL ALPS (CH)
Lissey A. 1968. Surficial mapping of groundwater flow systems withapplication to the Oak River Basin, Manitoba. PhD Thesis, Universityof Saskatchewan.
Loew S, Ehrminger B, Klemenz W, Gilby D. 1996. Abschaetzung vonBergwasserzufluessen und Oberflaechenauswirkungen am Beispiel desGotthard-Basistunnels. In Instabile Haenge und andere RisikorelevanteNatuerliche Prozesse, Oddsson B (ed). Birkhaeuser: Verlag; 353–376.
Loew S, Ziegler H, Keller F. 2000. AlpTransit: engineering geology ofthe world’s longest tunnel system. In GeoEng2000-InternationalConference on geotechnical and Geological Engineering, Melbourne.Technomic Publishing Co.: Lancaster, PA; 927–37.
Loew S, Luetzenkirchen VH, Ofterdinger U, Zangerl C, Eberhardt E,Evans K. 2007. Environmental impacts of tunnels in fracturedcrystalline rocks of the Central Alps. In Groundwater in FracturedRocks – IAH-Selected Papers 9, Krasny J, Sharp JM (eds). Taylor &Francis: London; 55–68.
Long JCS, Remer JS, Wilson CR, Witherspoon PA. 1982. Porous mediaequivalents for networks of discontinuous fractures. Water ResourcesResearch 18: 645–658.
Lopez DL, Smith L. 1995. Fluid flow in fault zones: analysis of the interplayof convective circulation and topographically driven groundwater flow.Water Resources Research 31: 1489–1503.
Lopez DL, Smith L. 1996. Fluid flow in fault zones: influence of hydraulicanisotropy and heterogeneity on the fluid flow and heat transfer regime.Water Resources Research 32: 3227–3235.
Luetzenkirchen VH. 2002. Structural geology and hydrogeology of brittlefault zones in the central and eastern Gotthard massif. PhD thesis, SwissFederal Institute of Technology (ETH) Zurich, Switzerland.
Luetzenkirchen VH, Loew S. 2001. Regional ground water flow incataclastic fault zones. Results from large scale tracer test in the SwissAlps. In Proceedings XXXI Congress IAH. Seiler K-P (ed). Munich.
Luetzenkirchen VH, Loew S. 2011. Late alpine brittle faulting in therotondo granite (Switzerland): deformation mechanisms and faultevolution. Swiss Journal of Geosciences 104: 31–54.
Manning AH, Caine JS. 2007. Groundwater noble gas, age, and temperaturesignatures in an alpine watershed: valuable tools in conceptual modeldevelopment. Water Resources Research 43: W04404.
Manning AH, Solomon DK. 2005. An integrated environmental tracerapproach to characterizing groundwater circulation in a mountain block.Water Resources Research 41: W12412.
Marechal JC. 1998. Les circulations d’eau dans les massifs cristallinsalpins et leurs relations avec les ouvrages souterrains. PhD thesis, EcolePolytechnique Federale de Lausanne.
Marechal JC. 2012. Les Tunnels Alpins: Observatoires de L’Hydrogeologiedes Grands Massifs Montagneux. La Houille Blanche 1: 44–50.
Marechal JC, Etcheverry D. 2003. The use of 3H and 18O tracers tocharacterize water inflows in Alpine Tunnels. Applied Geochemistry18: 339–351.
Martinec J, Oeschger H, Schotterer U, Siegenthaler U. 1982. Snowmeltand groundwater storage in an Alpine Basin. In Hydrological Aspects ofAlpine and High Mountain Areas. Glenn JW (ed). IAHS PublicationNo. 138: Birmingham (UK); 169–175.
Masset O. 2011. Transient tunnel inflow and hydraulic conductivity offractured crystalline rocks in the Central Alps (Switzerland). PhDThesis, Swiss Federal Institute of Technology (ETH) Zurich,Switzerland.
Masset O, Loew S. 2010. Hydraulic conductivity distribution in crystallinerocks, derived from inflows to tunnels and galleries in the Central Alps,Switzerland. Hydrogeology Journal 18: 863–891.
Menzies J. 1995. Hydrology of glaciers. InModern Glacial Environments,Menzies J (ed). Butterworth-Heinemann: Oxford; 197–240.
Nagra. 1988. Berichterstattung ueber die Untersuchungen der Phase I AmPotentiellen Standort Piz Pian Grand (Gemeinden Mesocco und Rossa,GR). Technical Report NTB88-19. Nagra.
Neretnieks I. 1983. A note on fracture flow mechanisms in the ground.Water Resources Research 19: 364–370.
Neretnieks I. 1993. Solute transport in fractured rock - applications toradionuclide waste repositories. In Flow and Contaminant Transport inFractured Rock, Bear J, Tsang C, de Marsily G (eds). Academic Press:Amsterdam; 39–128.
NRC. 1996. Rock Fractures and Fluid Flow. National Research Council(NRC), National Academic Press: Washington D.C.
Ofterdinger US. 2001. Groundwater flow systems in the Rotondo Granite,Central Alps (Switzerland). PhD thesis, Swiss Federal Institute ofTechnology (ETH) Zurich, Switzerland.
Ofterdinger US, Balderer W, Loew S, Renard P. 2004. Environmentalisotopes as indicators for ground water recharge to fractured granite.Ground Water 42: 868–879.
Copyright © 2012 John Wiley & Sons, Ltd.
Priest SD. 1993. Discontinuity Analysis for Rock Engineering. Chapmanand Hall: London.
Rasmussen TC, Evans DP. 1993. Water infiltration into exposed fracturedrock surfaces. Soil Science Society Journal 57: 324–329.
Raven K.G. 1977. Preliminary evaluation of structural and groundwaterconditions in underground mines and excavations. In Report ofActivities. Geological Survey of Canada; 39–42.
Raven KG. 1985. Field investigations of a small ground water flowsystem in fractured monzonitic gneiss. In Hydrogeology of Rocks ofLow Permeability-Proceedings 17th International Congress {IAH}.IAH; 72–86.
Richards K, Sharp M, Arnold N, Gurnell A, Clark M, Tranter M, NienowP, Brown G, Willis I, Lawson W. 1996. An integrated approach tomodelling hydrology and water quality in glacierized catchments.Hydrological Processes 10: 479–508.
Rodhe A. 1998. Snowmelt-dominated systems. In Isotope Tracers inCatchment Hydrology, Kendall C, McDonnell JJ (eds). Elsevier:Amsterdam; 391–433.
Scanlon B, Healy R, Cook P. 2002. Choosing appropriate techniques forquantifying groundwater recharge. Hydrogeology Journal 10: 18–39.
Schneider TR. 1976. Furka-Basistunnel – Zur Frage Von Stoerungen imBereich des Fensterpunktes des Bahntunnels. Technical Report 338 h.Furka-Oberalp-Bahn. Brig (CH).
Schneider TR. 1985a. Basistunnel-Furka, Los 63-Bedretto, GeologischeAufnahme des Fensters. Technical Report 338 g. Furka-Oberalp-Bahn.Brig (CH).
Schneider TR. 1985b. Geologischer Schlussbericht, Furka-Basistunnel.Technical Report 338o. Furka-Oberalp-Bahn. Brig (CH).
Scholz CH, Anders MH. 1994. The permeability of faults. In TechnicalReport Open-File-Report 94–228 Proceedings of Workshop LXIII- Themechanical involvement of fluids in faulting. USGS.
Smith L, Clemo T, Robertson MD. 1990a. New approaches to thesimulation of field-scale solute transport in fractured rocks. InProceedings 5th Canadian/American Conference on Hydrogeology,Bachu S (ed). National Well Association: Dublin, Ohio; 329–342.
Smith L, Forster C, Evans J. 1990b. Interaction of faultzones, fluidflow and heat transfer at the basin scale. In Hydrogeology ofLow Permeability Environments, Neuman SP, Neretnieks I (eds).IAH - Selected Papers, Verlag Heinz Heise: Hannover (Germany); 41–67.
Snow DT. 1968. Rock fracture spacings, openings, and porosities. Journalof the soil mechanics and foundation division, ASCE 94: 73–90.
Thury M, Gautschi A, Mazurek M, Mueller WH, Naef H, Pearson FJ,Vomvoris S, Wilson W. 1994. Geology and hydrogeology of thecrystalline basement of Northern Switzerland. Technical ReportNTB93-01. NAGRA.
Toth J. 1963. A theoretical analysis of groundwater flow in small drainagebasins. Journal of Geophysical Research 68: 4795–4812.
Toth J. 1984. The role of regional gravity flow in the chemical and thermalevolution of ground water. In Practical Applications of Ground WaterGeochemistry Proceedings 1st Canadian/American Conference onHydrogeology. Hitchon B, El W. (eds). Worthington, Ohio. NationalWater Well Association and Alberta Research Council; 3–39.
Tranter M, Brown GH, Hodson AJ, Gurnell AM. 1996. Hydrochemistryas an indicator of subglacial drainage system structure: a comparisonof Alpine and sub-polar environments. Hydrological Processes 10:541–556.
Vitvar T, Gurtz J. 1999. Spatially distributed hydrological modeling in therotondo area, western gothard-massif. Technical Report 3465/16Department of Geology Swiss Federal Institute of Technology (ETH)Zurich, Switzerland.
Viviroli D, Zappa M, Gurtz J, Weingartner R. 2009. An introductionto the hydrological modelling system PREVAH and its pre- andpost-processing tools. Environmental Modelling & Software 24:1209–1222.
Voborny O, Adank P, Huerlimann W, Vomvoris S, Mishra S. 1991.Grimsel test site – modeling of groundwater flow in the rock bodysurrounding the underground laboratory. Technical Report NTB91-03.NAGRA.
Voborny OS, Vomvoris S, Wilson G, Resele G, Huerlimann W. 1994.Hydrodynamic synthesis and modeling of groundwater flow incrystaline rocks of Northern Switzerland. Techncial Report92-04.NAGRA.
Wallace RE, Morris HT. 1979. Characteristics of faults and shear zones asseen in mines at depths as much as 2.5 km below the surface. TechnicalReport Open-File-Report 79–1239. USGS.
Walton-Day K., Poeter E. 2009. Investigating hydraulic conenctions andthe origin of water in a mine tunnel using stable isotopes andhydrographs. Applied Geochemistry 24: 2266–2282.
Hydrol. Process. 28, 255–278 (2014)

278 U. S. OFTERDINGER, PH. RENARD AND S. LOEW
Ward JV, Malard F, Tockner K, Uehlinger U. 1999. Influence of groundwater on surface water conditions in a galcial flood plain of the SwissAlps. Hydrological Processes 13: 277–293.
Winkler G, Kurz W, Hergarten S, Kiechl E. 2010. Hydrauliccharacterization of core zones in crystalline hard rocks at teh talhoffault (Eastern Alps). Grundwasser 15: 59–68.
Copyright © 2012 John Wiley & Sons, Ltd.
Winter TC. 2001. The concept of hydrologic landscape. Journal of theAmerican Water Resources Association 37: 335–349.
Zangerl C, Loew S, Eberhardt E. 2006. Structure, geometry and formation ofbrittle discontinuities in anisotropic crystalline rocks of the CentralGotthardMassif, Switzerland.EclogaeGeologicaeHelvetiae 99: 271–290.
Zijl W. 1999. 1. Hydrogeology Journal 7: 139–50.
Hydrol. Process. 28, 255–278 (2014)