Hydrate Poster crystal - Consortium for Ocean...
1
Activity Activity Like a Bolt from the Blue Introduction This poster was designed specifically for upper level high school and early undergraduate Earth systems, chemistry and/or environmental science students. While the gas law problems may not be appropriate for younger audiences, some of the demonstrations and activities presented in “Don’t Try This At Home” may be adaptable for middle or early high school groups. The text and activities address most, if not all of the National Science Education Standards for grades 9-12, but we have chosen to focus upon: Content Standard A: Science as Inquiry, Content Standard B: Physical Science, and Content Standard D: Earth and Space Science. Image Descriptions and Discussion 1. Gas hydrate or methane hydrate – what, exactly, is the structure pictured here? Both names are correct. Meth- ane hydrates, also known as gas hydrates, are frozen crystalline solids composed of rigid cages (clathrate structures) of water molecules enclosing methane and other low molecular weight gases. The maximum amount of methane trapped in the hydrate is fixed by the clathrate geometry: 1 m 3 of hydrate in situ (below the seafloor) yields 164 m 3 of methane at standard ambient temperature and pressure (0°C and 1 atm) in a ratio of 1 mole CH 4 : 5.75 moles H 2 O. Use Charles’ Law to find the new volume of 164 m 3 of methane when conditions are changed from standard ambient temperature and pressure to STP (0°C and 1 atm). 1 2. From methane to methane hydrate – how does it happen? Methane is produced when anaerobic bacteria de- compose organic matter through a series of energy producing reactions called methanogenesis: CH 2 0 ⇔ CH 4 + CO 2 . Methanogenesis takes place everywhere from landfills to lake bottoms to the ocean floor – any time and any place that decomposition occurs in the absence of oxygen, sulfate or nitrate sources. Methanogenesis may also support communities of animals like the ice worms pictured here. We’re familiar with methane and its uses: generat- ing electricity, home heating, a substitute for gasoline in buses, trucks and trains. Indentify at least three other sources of methane in the environment. Out of the sources you’ve indentified, which ones do humans contribute to? List at least three other uses for methane. 2 3. Burning ice – is it really possible? No, this photo is deceptive. Instead, the image depicts burning methane. The “ice” is actually methane hydrate, unstable at ambient classroom or laboratory temperatures and pressures. But, how was the methane trapped in the ice? Methane molecules “seed” the formation of cage-like hydrate structures when temperatures are very low and/or pressures are very high, like the conditions in arctic tundra or the deep seafloor. Don’t try this at home. You couldn’t, even if you wanted to. What other ice-like substance sublimates from a solid to a gas? 3 4. Methane hydrate discovery - past, present and future. The Ocean Drilling Program, using the drillship JOIDES Resolution (pictured here), conducted the first scientific drilling expedition dedicated entirely to methane hydrate re- search, Leg 164, east of the Carolina coast in 1995. Still a fairly new field, exploration and study will continue through the Integrated Ocean Drilling Program (IODP) and other organizations. See http://iodp.tamu.edu/scienceops/expe- ditions/exp311.html for daily and weekly reports from the most recent hydrate expedition, IODP Expedition 311. Study the methane hydrate drill site map. What do all the sites have in common? What conclusions can you draw about the formation and location of methane hydrates? 4 5. Methane hydrates – like a bolt from the blue. On Leg 208, in 2003, the Ocean Drilling Program conducted re- search on ancient climate change at the Walvis Ridge in the south Atlantic. Findings from the expedition suggest that the Paleocene-Eocene thermal maximum (PETM), a period of peak global warming that occurred 55 million years ago, is attributable to the rapid release of a large mass of methane from gas hydrates in the ocean. Knowing the green- house capability of methane, what does this information about the PETM suggest about our future and the pace of global climate change? 5 Additional Resources on Methane Hydrates Watch Dr. Marta Torres’ 2005 Distinguished Lecture, “Methane in an Icy Cage,” for an excellent introduction to methane hydrate research and information. A web cast of the lecture can be found at www.joilearning.org. For more detailed scientific write-ups, see the Scientific Results volumes for Ocean Drilling Program Legs 164, 201, 204, and 208 available at ODP Publications at http://www-odp.tamu.edu/publications/pubs.htm References 1, 2, 3 Dr. Marta Torres, Public Lecture, “Methane in an Icy Cage”, 2004-2005 DLS Series. 4 http://www-odp.tamu.edu/publications/leg_ndx/164ndex.htm 5 http://www-odp.tamu.edu/publications/leg_ndx/208ndex.htm Map Kvenvolden, Keith A. and Lorenson, Thomas D., “A Global Inventory of Natural Gas Hydrate Occurrence.” http://walrus.wr.usgs.gov/ globalhydrate/index.html. 2000 Photo Credits 2 Charles Fisher, Penn State University; 3 Gary Klinkhammer, Oregon State University; 4,5 IODP-TAMU © Joint Oceanographic Institutions. All rights reserved. Educational institutions may duplicate portions of this poster for use with their students. We’d like to hear from you! Please contact us with questions or comments. Visit www.joilearning.org for more education materials and resources. 30˚E 60˚E 90˚E 120˚E 150˚E 180˚ 150˚W 120˚W 90˚W 60˚W 30˚W 90˚S 60˚S 30˚S 0˚ 30˚N 60˚N 0˚ 90˚N 90˚S 60˚S 30˚S 0˚ 30˚N 60˚N 90˚N 0˚ 30˚E 60˚E 90˚E 120˚E 150˚E 180˚ 150˚W 120˚W 90˚W 60˚W 30˚W 0˚ 0˚ Legs 11, 76, & 164 Leg 201 Leg 112 Legs 67 & 84 Leg 204 Leg 146, Expedition 311 Leg 96 Global Distribution of Methane Hydrates Leg 66 Leg 170 Leg 131 Leg 127 Leg 190 & 196 Location of recovery of naturally-occurring oceanic gas hydrate samples DSDP/ODP/IODP study and recovery of naturally-occurring oceanic gas hydrate deposit Adapted from Kvenvolden and Lorenson, 2000 Inferred location of naturally-occurring oceanic gas hydrate (based on well logs and bottom seismic reflectors) Background Gas hydrate or methane hydrate – what, exactly, is the structure pictured in the poster? Both names are cor- rect. Methane hydrates, also known as gas hydrates, are frozen crystalline solids composed of rigid cages (clath- rate structures) of water molecules enclosing methane and other low molecular weight gases. The maximum amount of methane trapped in the hydrate is fixed by the clathrate geometry: 1 m 3 of hydrate in situ (below the seafloor) yields 164 m 3 of methane at standard ambient temperature and pressure (STP) in a ratio of 1 mole CH 4 : 5.75 moles H 2 O. Objectives Students will be able to model, study, and compare clathrate structures commonly found in methane hy- drates. Vocabulary clathrate structure host molecule dodecahedron hydrogen bond gas hydrate methane guest molecule Materials • Chemistry modeling kits or materials (at least 20 water molecules, methane molecule, and 30 bonding structures per student) • Copies of the clathrate structures Methods 1. Examine the simplified clathrate structure pictured to the right. Hydrogen bonding causes the water molecules to arrange in pentagonal dodecahedral (12 five-sided “faces”) host molecules around a single meth- ane guest molecule. Count and record the number of hydrogen bonds and water and methane molecules needed to model one methane hydrate structure. 2. Construct the clathrate structure model. 3. Link your clathrate model (cage) to several others constructed by your classmates. Count and record the ratios of water molecules to methane molecules each time a cage is added. 4. Does the methane to water ratio change with the addition of new clathrates? If so, how? Don’t Try This at Home An inquiry-based activity on Methane Hydrates 25 April, Chemistry II, George Washington High School Objective: Use observation skills to form a question or hypothesis. “Don’t try this at home,” the chemistry teacher said to her high school class as she pinned a new photo to the bul- letin board. “You couldn’t anyway and neither could I. Why? Let’s discuss it,” she continued. The class computer genius spoke right up. “Anyone could do that with a little graphic know-how.” “Perhaps,” the teacher answered, “but let’s assume for now that this is a real photo of a real phenomenon. Everyone now, what do you see in this photo?” The observations came faster than she could record them on the board: “A bare hand holding a white solid...” “The solid is on fire and the flame is orange.” A third student raised her voice in order to be heard, “A clear liquid is drip- ping from the solid, or at least from the fingers and they don’t appear to be burning.” “It looks like it’s burning and melting at the same time.” “It looks like a hunk of ice or sugar or maybe even cake! It is almost lunchtime.” “Ok,” the teacher interrupted, “what do sugar and cake have in common?” This time the list came even faster: energy, fuel for living things, carbon. “Good, keep going.” The sleepy kid in the far right corner of the room suddenly stirred and nearly yelling added, “Carbohydrates – carbon, hy- drogen and oxygen!” “Right! Go,” said the teacher with excitement in her voice. “Hit the books and the web and come back tomorrow with the answer. But first, would someone form a question to get us started?” Everyone was really involved in the discussion at this point and a number of students spoke nearly in unison. “What kind of carbohydrate –or hydrocarbon – would appear to burn and melt at the same time?” “Excellent. We’ll start there tomorrow.” 26 April, Chemistry II, George Washington High School Objective: Use research skills to answer a question or hypothesis. The class was very bright and extremely web savvy. Many had the answers. A number were able to locate the same or similar photos. Two students came across an interesting video on a web site related to the new Integrated Ocean Drilling Program, http://www.joilearning.org, shot off the coast of Oregon aboard the JOIDES Resolution during Leg 204 of the Ocean Drilling Program. Together, they watched that video, described on the website as methane hy- drate expanding from the drill string on board the ship. Before class was dismissed, the students constructed a chart of the facts and figures they had collectively researched. Homework? Look around the house for examples of gas under pressure. 1. Gas hydrates consist of ice frozen around gas molecules. 2. Methane, the most abundant gas in hydrate, is produced when anaerobic bacteria decompose organic matter (dead stuff). Remember your biology! 3. When water is present, pressure is high enough and temperatures low enough, a clathrate (cage-like) ice struc- ture forms around a “guest” methane molecule from the decomposition process or from deeper gas deposits. 4. Methane hydrates are found in cold and/or high-pressure environments like permafrost regions and seafloor sedi- ments below 500 meters. 5. If the hydrates get too warm, the ice melts and methane is released. 6. Hydrates are also unstable at low pressures and are difficult to move from the seafloor to a ship or laboratory (see video), but may offer a source of energy much larger than existing oil reserves. 7. Methane hydrates from the seafloor look like dirty ice and fizz and pop like Pop Rocks candy unless they’re pres- surized. 8. The Joint Oceanographic Institutions (through the Integrated Ocean Drilling Program), the Department of En- ergy, the United States Geological Survey and the Minerals Management Service explore or conduct research about methane hydrates. 9. Changes in ocean temperature can cause methane hydrates to destabilize, which may lead to shifting sediments and/or massive loss of methane to the atmosphere. Methane is a greenhouse gas, capable of absorbing ten times more heat than carbon dioxide. 10. Some authors believe a release of methane from seafloor hydrates might have caused the Bermuda Triangle effect. 27 April, Chemistry II, George Washington High School Objective: Use every day materials to model methane hydrate. Three days into the hydrate inquiry, the class discussion of models for methane hydrates centered on carbonated water -- easy to acquire, inexpensive and completely safe for experimentation. Nearly half the class came with soda cans or fizzy water bottles. Anticipating this response, the teacher was prepared with carbonated water bottles for everyone. How is carbonated water produced? Carbon dioxide is added to water in a pressurized environment. Simply twisting the cap releases the pressure, thereby allowing the gas to come out of solution. In this way, fizzy wa- ter models methane in water, but what about methane in ice? Predictably, various students began to talk about freez- ing their unopened bottles. Knowing the water would expand, some decided to gently decant about half the soda in hopes the bottle wouldn’t break but some carbon dioxide would remain in solution. With time to kill before the bell, the class listed gas law demonstrations they had seen before that might be useful in studying methane hydrates. One they had time to try was bubbling methane from the outlet (through a rubber hose attached to a small funnel) into a soapy solution. As the bubbles rose, they calculated the mass (16 g) and volume (22.4 L) of one mole of methane at STP. Careful not to emit too much methane into the lab, the teacher ignited one or two bubbles with a birthday candle taped to a meter stick. Homework? Think about your frozen carbonated water. Even though it isn’t perfect, what else can we do with your frozen water to model methane hydrates and their behavior? 28 April, Chemistry II, George Washington High School Objective: Devise an experimental method. Maria, usually too shy to speak up, returned to class enthusiastically proclaiming it wouldn’t be difficult to collect the carbon dioxide from the now frozen bottles. “All we have to do is tape a balloon to the mouth, wait ‘till it melts and pour the water back and forth from the bottle to the balloon. They did it in my SCUBA class last year to demonstrate the bends. Then we could mass the gas or calculate the volume, pop it in the freezer again, warm it over a water bath, etc...” “One more thing,” her best friend added, “we could use the universal gas law to solve for changes in pressure once we’ve measured the volume and know the temperature.” The teacher was grateful, as the students had initiated the entire experiment. Divided into lab groups, each wrote an experimental method and got to work. NOTE: The demonstrations and experiments could go on for days. All the gas laws could be tested and students could even devise and submit their own gas law problems about methane rising from the seafloor in the water col- umn or through the drill string to the ship. Exercises Knowing that 1 m 3 of methane hydrate taken from below the seafloor can yield up to 164 m 3 of methane at 25° C and 1 atm pressure (shipboard conditions - standard ambient temperature and pressure), put your knowledge of the gas laws to work to solve the following problems. 1. Use Charles’ Law to find the new volume of 164 m 3 of methane when conditions are changed from standard ambient temperature and pressure to STP (0°C and 1 atm). 2. Using the volume of one mole of gas at STP and your answer from number 1, above, find the number of moles and mass of methane in a cubic meter of methane hydrate below the seafloor. 3. Given the molar ratio of 1 mole of CH 4 to 5.75 moles of H 2 0 in a perfectly saturated methane hydrate, find the number of moles and the mass of water in 1 m 3 of methane hydrate. 4. The methane hydrate stability zone is defined by the low temperatures and high pressures that characterize deep ocean waters and the sediments beneath them. The ideal gas law (PV = nRT) can be used to predict changes in the volume of methane once the hydrate has been destabilized and methane begins rising in the water column. Calcu- late the volume of 1 m 3 of methane at the depths and temperatures listed below (remember that pressure increases approximately 1 atm with every 10 meters in depth). Depth Temperature Volume 10 meters 22°C _______ 100 meters 15°C _______ 250 meters 8°C _______ 300 meters 3°C _______ 500 meters 3°C _______ What are the implications of volume change for researchers planning to bring methane hydrate samples to the sur- face? To download the flaming hydrate photo and view additional materials, see these sources: • http://www.usssp-iodp.org/Images/flaming_hydrate.jpg • Summerlin, L.R. and Ealy, J.L. Jr., Chemical Demonstrations A Sourcebook for Teachers, American Chemical Society, Washington, DC, 190 pp, 1985. • http://www.fe.doe.gov/news/techlines/2002/tl_hydrates_oregon.html • http://www.llnl.gov/str/Durham.html • http://www.fe.doe.gov/programs/oilgas/hydrates/ 5. Calculate the mass (in atomic mass units) of a single clathrate cage. Do the same for your multi-clathrate model. Extensions The simplified models you have constructed are small cages, but in reality, a structure I hydrate, the type most commonly found by researchers in gas hydrates, would contain both small and large cages. Large structure I cages are 14-sided, with 2 hexagons and 12 pentagons in a ratio of 2 small cages for every 6 large cages. 1. Construct a single large cage clathrate molecule. 2. For a real challenge, construct and link 2 small and 6 large clathrate cages to model a structure I methane hydrate. Reference Ripmeester, J.A., Ratcliffe, C.I., Klug, D.D., and Tse, J.S., 1994. Molecular perspectives on structure and dynamics in clathrate hydrates. Annals of the New York Academy of Sciences, 715: In- ternational Conference on Natural Gas Hydrates. The New York Academy of Sciences, New York, New York. JOI Learning 1201 New York Avenue, NW [email protected] Suite 400 www.joilearning.org Washington, DC 20005 t. 202.232.3900 All Caged Up ����������� �� ���� �������� �������� �������� Photo courtesy of Dr. Gary Klinkhammer, Oregon State University
Transcript of Hydrate Poster crystal - Consortium for Ocean...
Activity
Activity
Like a Bolt from the Blue
IntroductionThis poster was designed specifically for upper level high school and early undergraduate Earth systems, chemistry and/or environmental science students. While the gas law problems may not be appropriate for younger audiences, some of the demonstrations and activities presented in “Don’t Try This At Home” may be adaptable for middle or early high school groups. The text and activities address most, if not all of the National Science Education Standards for grades 9-12, but we have chosen to focus upon: Content Standard A: Science as Inquiry, Content Standard B: Physical Science, and Content Standard D: Earth and Space Science.
Image Descriptions and Discussion1. Gas hydrate or methane hydrate – what, exactly, is the structure pictured here? Both names are correct. Meth-ane hydrates, also known as gas hydrates, are frozen crystalline solids composed of rigid cages (clathrate structures) of water molecules enclosing methane and other low molecular weight gases. The maximum amount of methane trapped in the hydrate is fixed by the clathrate geometry: 1 m3 of hydrate in situ (below the seafloor) yields 164 m3 of methane at standard ambient temperature and pressure (0°C and 1 atm) in a ratio of 1 mole CH4: 5.75 moles H2O. Use Charles’ Law to find the new volume of 164 m3 of methane when conditions are changed from standard ambient temperature and pressure to STP (0°C and 1 atm).1
2. From methane to methane hydrate – how does it happen? Methane is produced when anaerobic bacteria de-compose organic matter through a series of energy producing reactions called methanogenesis: CH20 ⇔ CH4 + CO2. Methanogenesis takes place everywhere from landfills to lake bottoms to the ocean floor – any time and any place that decomposition occurs in the absence of oxygen, sulfate or nitrate sources. Methanogenesis may also support communities of animals like the ice worms pictured here. We’re familiar with methane and its uses: generat-ing electricity, home heating, a substitute for gasoline in buses, trucks and trains. Indentify at least three other sources of methane in the environment. Out of the sources you’ve indentified, which ones do humans contribute to? List at least three other uses for methane.2
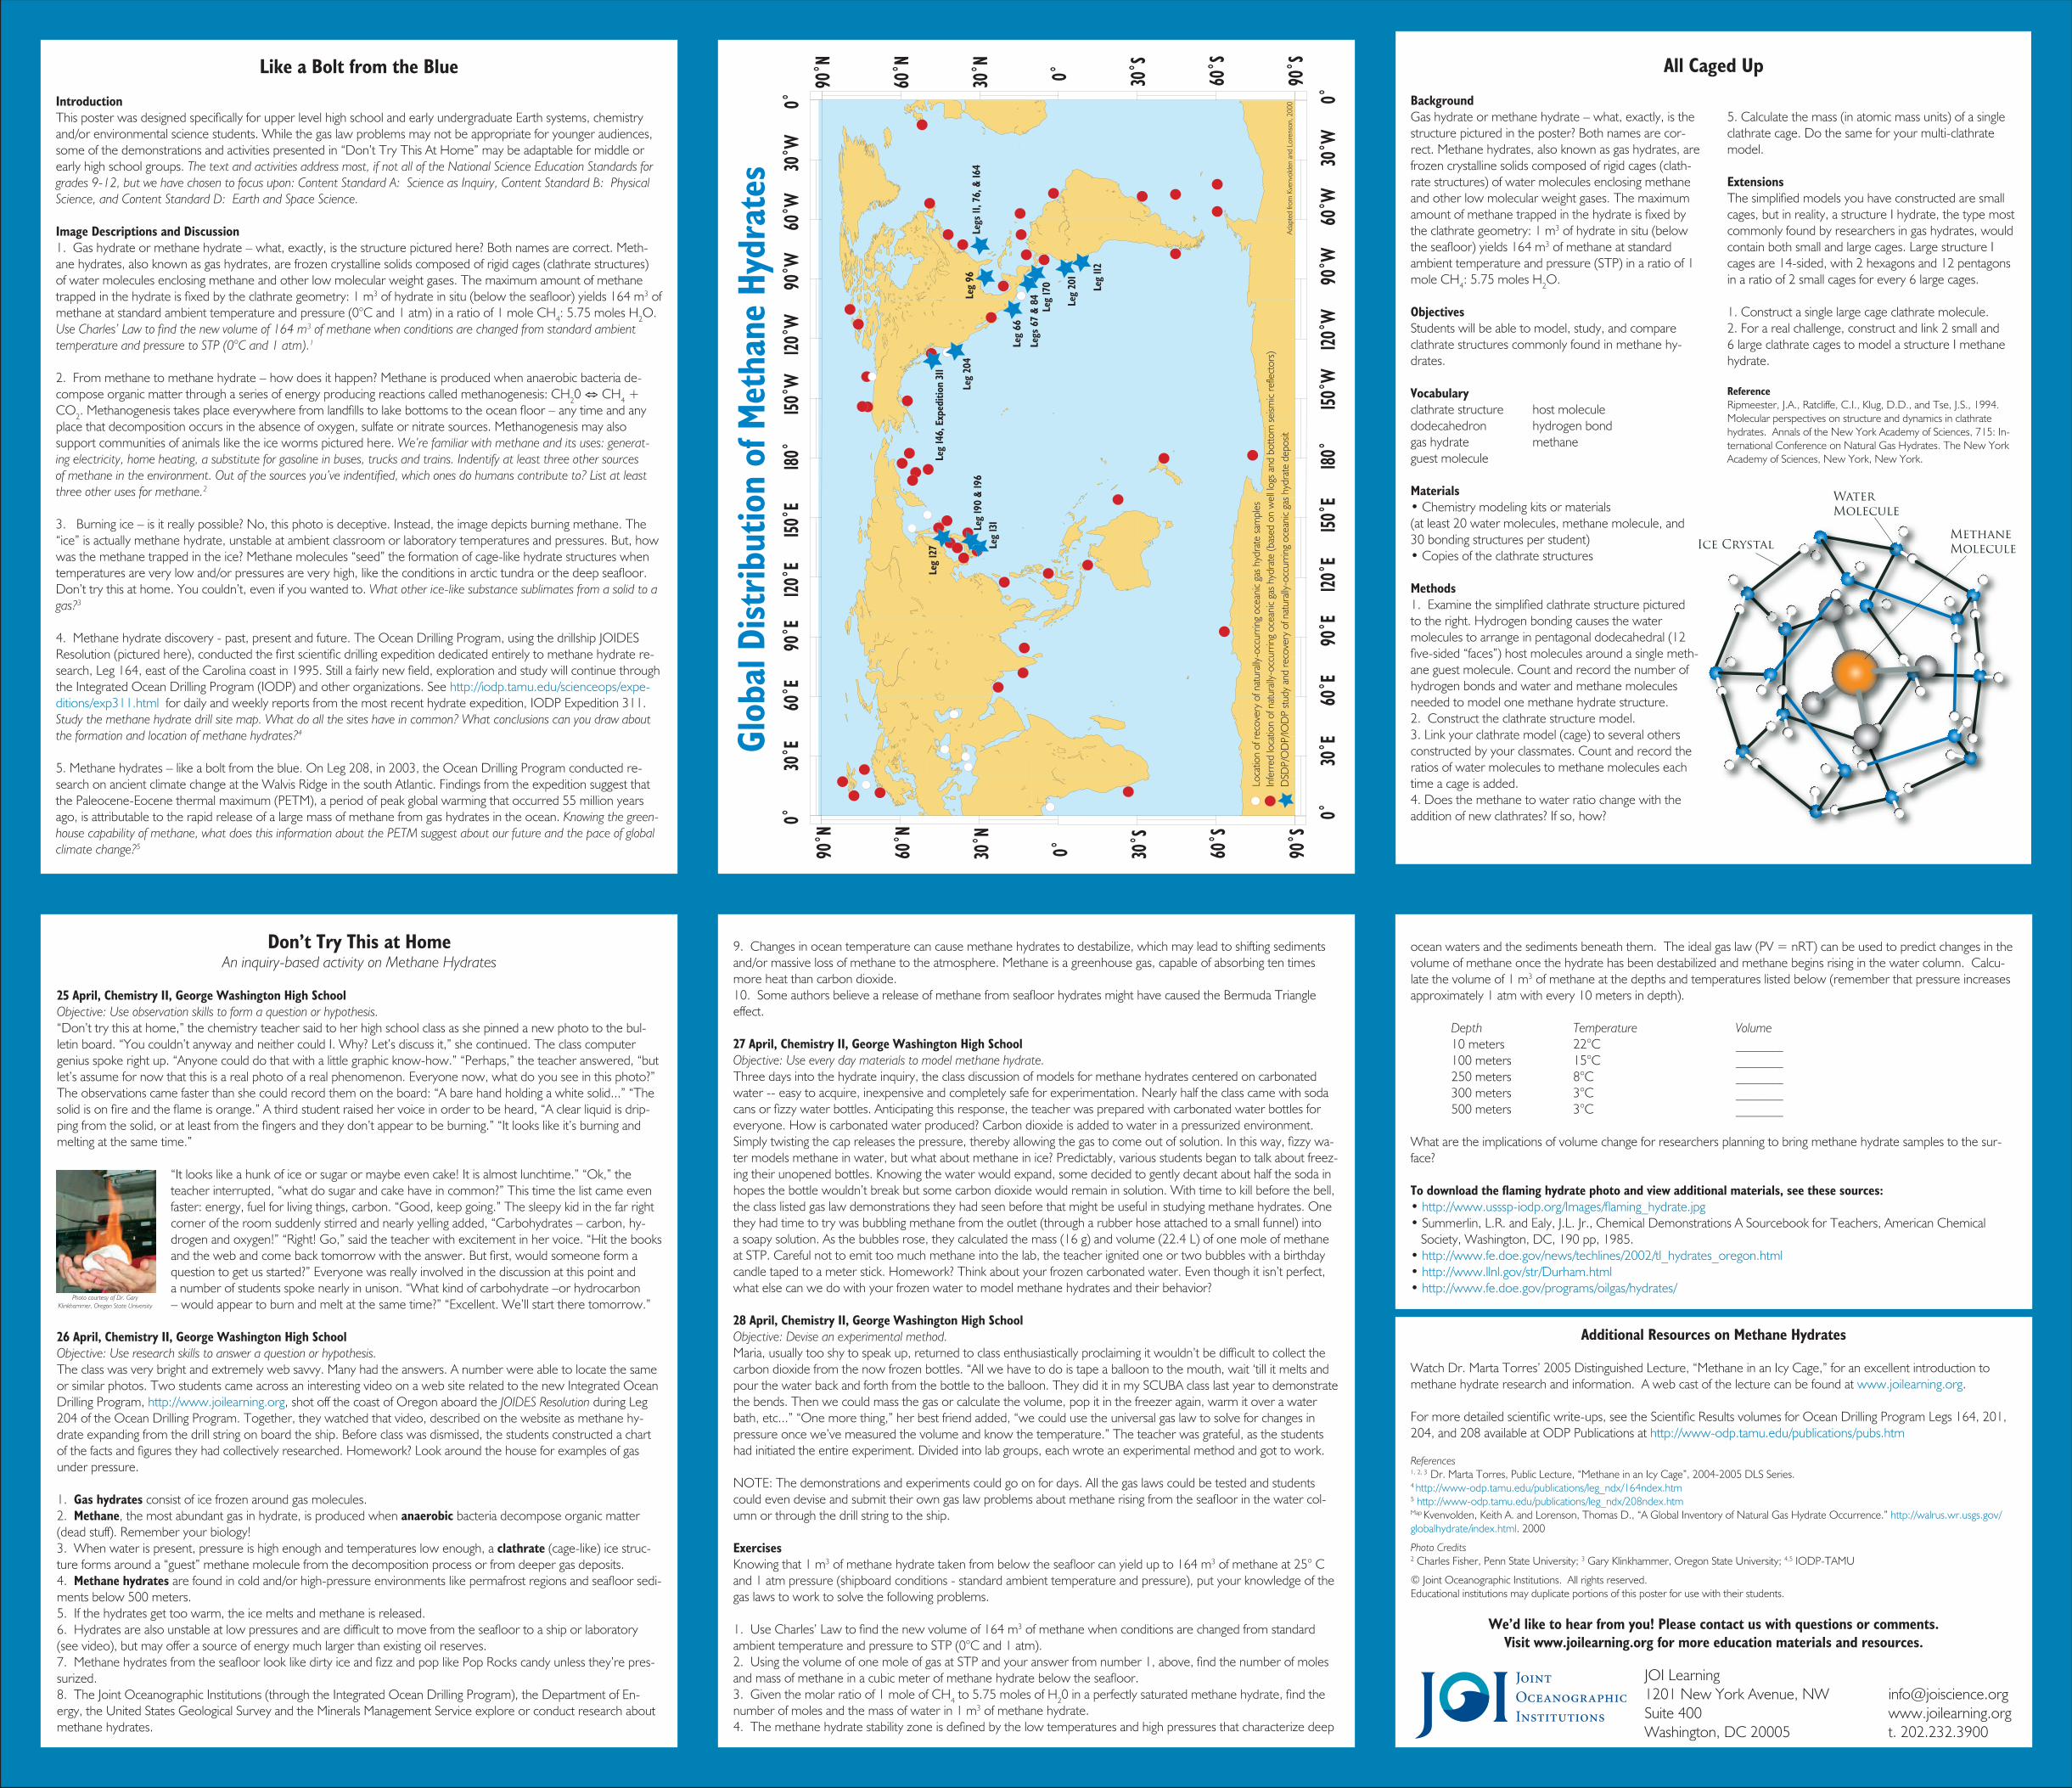
3. Burning ice – is it really possible? No, this photo is deceptive. Instead, the image depicts burning methane. The “ice” is actually methane hydrate, unstable at ambient classroom or laboratory temperatures and pressures. But, how was the methane trapped in the ice? Methane molecules “seed” the formation of cage-like hydrate structures when temperatures are very low and/or pressures are very high, like the conditions in arctic tundra or the deep seafloor. Don’t try this at home. You couldn’t, even if you wanted to. What other ice-like substance sublimates from a solid to a gas?3
4. Methane hydrate discovery - past, present and future. The Ocean Drilling Program, using the drillship JOIDES Resolution (pictured here), conducted the first scientific drilling expedition dedicated entirely to methane hydrate re-search, Leg 164, east of the Carolina coast in 1995. Still a fairly new field, exploration and study will continue through the Integrated Ocean Drilling Program (IODP) and other organizations. See http://iodp.tamu.edu/scienceops/expe-ditions/exp311.html for daily and weekly reports from the most recent hydrate expedition, IODP Expedition 311. Study the methane hydrate drill site map. What do all the sites have in common? What conclusions can you draw about the formation and location of methane hydrates?4
5. Methane hydrates – like a bolt from the blue. On Leg 208, in 2003, the Ocean Drilling Program conducted re-search on ancient climate change at the Walvis Ridge in the south Atlantic. Findings from the expedition suggest that the Paleocene-Eocene thermal maximum (PETM), a period of peak global warming that occurred 55 million years ago, is attributable to the rapid release of a large mass of methane from gas hydrates in the ocean. Knowing the green-house capability of methane, what does this information about the PETM suggest about our future and the pace of global climate change?5
Additional Resources on Methane Hydrates
Watch Dr. Marta Torres’ 2005 Distinguished Lecture, “Methane in an Icy Cage,” for an excellent introduction to methane hydrate research and information. A web cast of the lecture can be found at www.joilearning.org.
For more detailed scientific write-ups, see the Scientific Results volumes for Ocean Drilling Program Legs 164, 201, 204, and 208 available at ODP Publications at http://www-odp.tamu.edu/publications/pubs.htm
References1, 2, 3 Dr. Marta Torres, Public Lecture, “Methane in an Icy Cage”, 2004-2005 DLS Series.4 http://www-odp.tamu.edu/publications/leg_ndx/164ndex.htm5 http://www-odp.tamu.edu/publications/leg_ndx/208ndex.htmMap Kvenvolden, Keith A. and Lorenson, Thomas D., “A Global Inventory of Natural Gas Hydrate Occurrence.” http://walrus.wr.usgs.gov/globalhydrate/index.html. 2000
Photo Credits2 Charles Fisher, Penn State University; 3 Gary Klinkhammer, Oregon State University; 4,5 IODP-TAMU
© Joint Oceanographic Institutions. All rights reserved. Educational institutions may duplicate portions of this poster for use with their students.
We’d like to hear from you! Please contact us with questions or comments. Visit www.joilearning.org for more education materials and resources.
30˚E
60˚E
90˚E
120˚E
150˚E
180˚
150˚W
120˚W
90˚W
60˚W
30˚W
90˚S
60˚S
30˚S
0˚30˚N
60˚N
0˚
90˚N
90˚S
60˚S
30˚S0˚30˚N
60˚N
90˚N
0˚
30˚E
60˚E
90˚E
120˚E
150˚E
180˚
150˚W
120˚W
90˚W
60˚W
30˚W
0˚0˚
Legs
11, 7
6, &
164
Leg
201
Leg
112
Legs
67
& 84
Leg
204
Leg
146,
Exp
editi
on 3
11
Leg
96
Glob
al D
istr
ibut
ion
of M
etha
ne H
ydra
tes
Leg
66
Leg
170
Leg
131
Leg
127
Leg
190
& 19
6
Loca
tion
of re
cove
ry o
f nat
urall
y-oc
curr
ing
ocea
nic
gas h
ydra
te sa
mpl
es
DSD
P/O
DP/
IOD
P stu
dy a
nd re
cove
ry o
f nat
urall
y-oc
curr
ing
ocea
nic
gas h
ydra
te d
epos
itAd
apte
d fro
m K
venv
olde
n an
d Lo
rens
on, 2
000
Infe
rred
loca
tion
of n
atur
ally-
occu
rrin
g oc
eani
c ga
s hyd
rate
(bas
ed o
n w
ell lo
gs a
nd b
otto
m se
ismic
refle
ctor
s)
BackgroundGas hydrate or methane hydrate – what, exactly, is the structure pictured in the poster? Both names are cor-rect. Methane hydrates, also known as gas hydrates, are frozen crystalline solids composed of rigid cages (clath-rate structures) of water molecules enclosing methane and other low molecular weight gases. The maximum amount of methane trapped in the hydrate is fixed by the clathrate geometry: 1 m3 of hydrate in situ (below the seafloor) yields 164 m3 of methane at standard ambient temperature and pressure (STP) in a ratio of 1 mole CH4: 5.75 moles H2O.
ObjectivesStudents will be able to model, study, and compare clathrate structures commonly found in methane hy-drates.
Vocabularyclathrate structure host moleculedodecahedron hydrogen bondgas hydrate methane guest molecule
Materials• Chemistry modeling kits or materials(at least 20 water molecules, methane molecule, and 30 bonding structures per student)• Copies of the clathrate structures
Methods1. Examine the simplified clathrate structure pictured to the right. Hydrogen bonding causes the water molecules to arrange in pentagonal dodecahedral (12 five-sided “faces”) host molecules around a single meth-ane guest molecule. Count and record the number of hydrogen bonds and water and methane molecules needed to model one methane hydrate structure.2. Construct the clathrate structure model.3. Link your clathrate model (cage) to several others constructed by your classmates. Count and record the ratios of water molecules to methane molecules each time a cage is added.4. Does the methane to water ratio change with the addition of new clathrates? If so, how?
Don’t Try This at HomeAn inquiry-based activity on Methane Hydrates
25 April, Chemistry II, George Washington High SchoolObjective: Use observation skills to form a question or hypothesis.“Don’t try this at home,” the chemistry teacher said to her high school class as she pinned a new photo to the bul-letin board. “You couldn’t anyway and neither could I. Why? Let’s discuss it,” she continued. The class computer genius spoke right up. “Anyone could do that with a little graphic know-how.” “Perhaps,” the teacher answered, “but let’s assume for now that this is a real photo of a real phenomenon. Everyone now, what do you see in this photo?” The observations came faster than she could record them on the board: “A bare hand holding a white solid...” “The solid is on fire and the flame is orange.” A third student raised her voice in order to be heard, “A clear liquid is drip-ping from the solid, or at least from the fingers and they don’t appear to be burning.” “It looks like it’s burning and melting at the same time.”
“It looks like a hunk of ice or sugar or maybe even cake! It is almost lunchtime.” “Ok,” the teacher interrupted, “what do sugar and cake have in common?” This time the list came even faster: energy, fuel for living things, carbon. “Good, keep going.” The sleepy kid in the far right corner of the room suddenly stirred and nearly yelling added, “Carbohydrates – carbon, hy-drogen and oxygen!” “Right! Go,” said the teacher with excitement in her voice. “Hit the books and the web and come back tomorrow with the answer. But first, would someone form a question to get us started?” Everyone was really involved in the discussion at this point and a number of students spoke nearly in unison. “What kind of carbohydrate –or hydrocarbon – would appear to burn and melt at the same time?” “Excellent. We’ll start there tomorrow.”
26 April, Chemistry II, George Washington High SchoolObjective: Use research skills to answer a question or hypothesis.The class was very bright and extremely web savvy. Many had the answers. A number were able to locate the same or similar photos. Two students came across an interesting video on a web site related to the new Integrated Ocean Drilling Program, http://www.joilearning.org, shot off the coast of Oregon aboard the JOIDES Resolution during Leg 204 of the Ocean Drilling Program. Together, they watched that video, described on the website as methane hy-drate expanding from the drill string on board the ship. Before class was dismissed, the students constructed a chart of the facts and figures they had collectively researched. Homework? Look around the house for examples of gas under pressure.
1. Gas hydrates consist of ice frozen around gas molecules.2. Methane, the most abundant gas in hydrate, is produced when anaerobic bacteria decompose organic matter (dead stuff). Remember your biology! 3. When water is present, pressure is high enough and temperatures low enough, a clathrate (cage-like) ice struc-ture forms around a “guest” methane molecule from the decomposition process or from deeper gas deposits.4. Methane hydrates are found in cold and/or high-pressure environments like permafrost regions and seafloor sedi-ments below 500 meters. 5. If the hydrates get too warm, the ice melts and methane is released.6. Hydrates are also unstable at low pressures and are difficult to move from the seafloor to a ship or laboratory (see video), but may offer a source of energy much larger than existing oil reserves.7. Methane hydrates from the seafloor look like dirty ice and fizz and pop like Pop Rocks candy unless they’re pres-surized.8. The Joint Oceanographic Institutions (through the Integrated Ocean Drilling Program), the Department of En-ergy, the United States Geological Survey and the Minerals Management Service explore or conduct research about methane hydrates.
9. Changes in ocean temperature can cause methane hydrates to destabilize, which may lead to shifting sediments and/or massive loss of methane to the atmosphere. Methane is a greenhouse gas, capable of absorbing ten times more heat than carbon dioxide.10. Some authors believe a release of methane from seafloor hydrates might have caused the Bermuda Triangle effect.
27 April, Chemistry II, George Washington High SchoolObjective: Use every day materials to model methane hydrate.Three days into the hydrate inquiry, the class discussion of models for methane hydrates centered on carbonated water -- easy to acquire, inexpensive and completely safe for experimentation. Nearly half the class came with soda cans or fizzy water bottles. Anticipating this response, the teacher was prepared with carbonated water bottles for everyone. How is carbonated water produced? Carbon dioxide is added to water in a pressurized environment. Simply twisting the cap releases the pressure, thereby allowing the gas to come out of solution. In this way, fizzy wa-ter models methane in water, but what about methane in ice? Predictably, various students began to talk about freez-ing their unopened bottles. Knowing the water would expand, some decided to gently decant about half the soda in hopes the bottle wouldn’t break but some carbon dioxide would remain in solution. With time to kill before the bell, the class listed gas law demonstrations they had seen before that might be useful in studying methane hydrates. One they had time to try was bubbling methane from the outlet (through a rubber hose attached to a small funnel) into a soapy solution. As the bubbles rose, they calculated the mass (16 g) and volume (22.4 L) of one mole of methane at STP. Careful not to emit too much methane into the lab, the teacher ignited one or two bubbles with a birthday candle taped to a meter stick. Homework? Think about your frozen carbonated water. Even though it isn’t perfect, what else can we do with your frozen water to model methane hydrates and their behavior?
28 April, Chemistry II, George Washington High SchoolObjective: Devise an experimental method. Maria, usually too shy to speak up, returned to class enthusiastically proclaiming it wouldn’t be difficult to collect the carbon dioxide from the now frozen bottles. “All we have to do is tape a balloon to the mouth, wait ‘till it melts and pour the water back and forth from the bottle to the balloon. They did it in my SCUBA class last year to demonstrate the bends. Then we could mass the gas or calculate the volume, pop it in the freezer again, warm it over a water bath, etc...” “One more thing,” her best friend added, “we could use the universal gas law to solve for changes in pressure once we’ve measured the volume and know the temperature.” The teacher was grateful, as the students had initiated the entire experiment. Divided into lab groups, each wrote an experimental method and got to work.
NOTE: The demonstrations and experiments could go on for days. All the gas laws could be tested and students could even devise and submit their own gas law problems about methane rising from the seafloor in the water col-umn or through the drill string to the ship.
ExercisesKnowing that 1 m3 of methane hydrate taken from below the seafloor can yield up to 164 m3 of methane at 25° C and 1 atm pressure (shipboard conditions - standard ambient temperature and pressure), put your knowledge of the gas laws to work to solve the following problems.
1. Use Charles’ Law to find the new volume of 164 m3 of methane when conditions are changed from standard ambient temperature and pressure to STP (0°C and 1 atm). 2. Using the volume of one mole of gas at STP and your answer from number 1, above, find the number of moles and mass of methane in a cubic meter of methane hydrate below the seafloor. 3. Given the molar ratio of 1 mole of CH4 to 5.75 moles of H20 in a perfectly saturated methane hydrate, find the number of moles and the mass of water in 1 m3 of methane hydrate.4. The methane hydrate stability zone is defined by the low temperatures and high pressures that characterize deep
ocean waters and the sediments beneath them. The ideal gas law (PV = nRT) can be used to predict changes in the volume of methane once the hydrate has been destabilized and methane begins rising in the water column. Calcu-late the volume of 1 m3 of methane at the depths and temperatures listed below (remember that pressure increases approximately 1 atm with every 10 meters in depth).
Depth Temperature Volume 10 meters 22°C _______ 100 meters 15°C _______ 250 meters 8°C _______ 300 meters 3°C _______ 500 meters 3°C _______
What are the implications of volume change for researchers planning to bring methane hydrate samples to the sur-face?
To download the flaming hydrate photo and view additional materials, see these sources:• http://www.usssp-iodp.org/Images/flaming_hydrate.jpg• Summerlin, L.R. and Ealy, J.L. Jr., Chemical Demonstrations A Sourcebook for Teachers, American Chemical Society, Washington, DC, 190 pp, 1985.• http://www.fe.doe.gov/news/techlines/2002/tl_hydrates_oregon.html• http://www.llnl.gov/str/Durham.html• http://www.fe.doe.gov/programs/oilgas/hydrates/
5. Calculate the mass (in atomic mass units) of a single clathrate cage. Do the same for your multi-clathrate model.
ExtensionsThe simplified models you have constructed are small cages, but in reality, a structure I hydrate, the type most commonly found by researchers in gas hydrates, would contain both small and large cages. Large structure I cages are 14-sided, with 2 hexagons and 12 pentagons in a ratio of 2 small cages for every 6 large cages.
1. Construct a single large cage clathrate molecule. 2. For a real challenge, construct and link 2 small and 6 large clathrate cages to model a structure I methane hydrate.
ReferenceRipmeester, J.A., Ratcliffe, C.I., Klug, D.D., and Tse, J.S., 1994. Molecular perspectives on structure and dynamics in clathrate hydrates. Annals of the New York Academy of Sciences, 715: In-ternational Conference on Natural Gas Hydrates. The New York Academy of Sciences, New York, New York.
JOI Learning 1201 New York Avenue, NW [email protected] 400 www.joilearning.org Washington, DC 20005 t. 202.232.3900
All Caged Up
�����������
��������������
����������������
Photo courtesy of Dr. Gary Klinkhammer, Oregon State University