Hydrate formation in an unsaturated system - Impacts of ... Library/Research/Oil-Gas/methane... ·...
13
Hydrate formation in an unsaturated system - Impacts of fine particles and water content Liang Lei 1,2 , Zhichao Liu 1 , Yongkoo Seol 1 , Ray Boswell 1 , Sheng Dai 2* 1 National Energy Technology Laboratory, U.S. Department of Energy, Morgantown, VW 26507. 2 Geosystems Engineering, Georgia Institute of Technology, Atlanta, GA 30332. *Corresponding author: [email protected] Abstract Parametric study of hydrate saturation dependent properties of hydrate-bearing sediments requires a large amount of uniform and representative specimens. Expedited synthetization of hydrate- bearing sediments in the laboratory usually uses an unsaturated system due to low methane solubility in water. This study experimentally investigates how various factors affect the distribution of formed hydrate in the sediments via X-ray computed tomography. Results show that the pressure-temperature history is the most critical factor influencing water migration during hydrate formation. Hydrate formed by cooling-pressurization method tends to lead to preferred hydrate formation at core boundaries where exothermic heat can be easily dissipated. The presence of fine-grained particles fails to mitigate this phenomenon, but can effectively suppress water migration even when hydrate is formed using the pressurization-cooling method or the freezing- pressurization-thawing method. Fine-grained particles reduce water activity which further reduce the amount of hydrate formed in the system. The mixing sequence of sand-clay-water mixture affects the final morphology and distribution of each phase and eventually affects hydrate distribution in the sediments. A small amount of clay in sands can suppress water preferentially residing at grain contacts and combine with water acting as a pore filling component. This potentially helps synthesize non-cementing hydrate-bearing sediments in the laboratory more efficiently. 1. Introduction Parametric characterization of hydrate-bearing sediments requires a large number of specimens from either nature (i.e., pressure cores [1, 2]) or laboratory synthetization. Pressure cores are rare and expensive and do not always have consistency in host sediments to study hydrate saturation Sh dependent physical properties, whereas laboratory synthesized specimens are challenged by their representativeness. Formation of methane gas hydrate in sediments in the laboratory using the dissolved-gas method, which is considered to be the most representative of naturally occurred specimen, suffers from extremely slow crystal growth rate due to low methane solubility in water [3, 4]. Expedited methods typically use water soluble proxies like THF [5], excess-gas in unsaturated systems resulting cementing-type hydrate pore habits [6, 7], or brine injection to form non-cementing hydrate pore habits [8]. Table 1 summarizes the reported methods of laboratory synthetization of hydrate in sediments. Different hydrate formation methods result in various hydrate pore habits and distribution, and furtherly impact all fundamental physical properties of hydrate-bearing sediments. Sediments with the same amount of hydrate but different hydrate distribution may result in several orders of magnitude of difference in their physical properties [9]. The pore habits and morphology of laboratory formed hydrate in sediments can be obtained via direct visualization through sapphire windows of high pressure chambers [10] or X-ray computed tomography at pore- [11-13] and core-scales [14-16]. X-ray technique is non-destructive and three-dimensional. It has been used to characterize both pressure cores [16-18] and laboratory specimens during hydrate formation and dissociation [14, 19, 20]. Since hydrate has an attenuation coefficient close to that of water, it is difficult to distinguish the two phases in X-ray CT. Reported studies typically use KI dissolved in water to increase the attenuation coefficient of water [12, 21] or Xenon gas as a hydrate former to increase the attenuation coefficient of hydrate [22, 23]. Phase isolation then assists further analyses of hydrate saturation dependent properties such as wave velocity and permeability [24-26]. Micro-focus CT could achieve a resolution of tens of microns to sub-microns which enables the study of hydrate
Transcript of Hydrate formation in an unsaturated system - Impacts of ... Library/Research/Oil-Gas/methane... ·...

Hydrate formation in an unsaturated system - Impacts of fine particles and water content
Liang Lei1,2, Zhichao Liu1, Yongkoo Seol1, Ray Boswell1, Sheng Dai2*
1National Energy Technology Laboratory, U.S. Department of Energy, Morgantown, VW 26507. 2Geosystems Engineering, Georgia Institute of Technology, Atlanta, GA 30332. *Corresponding author: [email protected]
Abstract Parametric study of hydrate saturation dependent properties of hydrate-bearing sediments requires a large amount of uniform and representative specimens. Expedited synthetization of hydrate-bearing sediments in the laboratory usually uses an unsaturated system due to low methane solubility in water. This study experimentally investigates how various factors affect the distribution of formed hydrate in the sediments via X-ray computed tomography. Results show that the pressure-temperature history is the most critical factor influencing water migration during hydrate formation. Hydrate formed by cooling-pressurization method tends to lead to preferred hydrate formation at core boundaries where exothermic heat can be easily dissipated. The presence of fine-grained particles fails to mitigate this phenomenon, but can effectively suppress water migration even when hydrate is formed using the pressurization-cooling method or the freezing-pressurization-thawing method. Fine-grained particles reduce water activity which further reduce the amount of hydrate formed in the system. The mixing sequence of sand-clay-water mixture affects the final morphology and distribution of each phase and eventually affects hydrate distribution in the sediments. A small amount of clay in sands can suppress water preferentially residing at grain contacts and combine with water acting as a pore filling component. This potentially helps synthesize non-cementing hydrate-bearing sediments in the laboratory more efficiently.
1. Introduction
Parametric characterization of hydrate-bearing sediments requires a large number of specimens from either nature (i.e., pressure cores [1, 2]) or laboratory synthetization. Pressure cores are rare and expensive and do not always have consistency in host sediments to study hydrate saturation Sh dependent physical properties, whereas laboratory synthesized specimens are challenged by their representativeness. Formation of methane gas hydrate in sediments in the laboratory using the dissolved-gas method, which is considered to be the most representative of naturally occurred specimen, suffers from extremely slow crystal growth rate due to low methane solubility in water [3, 4]. Expedited methods typically use water soluble proxies like THF [5], excess-gas in unsaturated systems resulting cementing-type hydrate pore habits [6, 7], or brine injection to form non-cementing hydrate pore habits [8]. Table 1 summarizes the reported methods of laboratory synthetization of hydrate in sediments. Different hydrate formation methods result in various hydrate pore habits and distribution, and furtherly impact all fundamental physical properties of hydrate-bearing sediments. Sediments with the same amount of hydrate but different hydrate distribution may result in several orders of magnitude of difference in their physical properties [9]. The pore habits and morphology of laboratory formed hydrate in sediments can be obtained via direct visualization through sapphire windows of high pressure chambers [10] or X-ray computed tomography at pore- [11-13] and core-scales [14-16]. X-ray technique is non-destructive and three-dimensional. It has been used to characterize both pressure cores [16-18] and laboratory specimens during hydrate formation and dissociation [14, 19, 20]. Since hydrate has an attenuation coefficient close to that of water, it is difficult to distinguish the two phases in X-ray CT. Reported studies typically use KI dissolved in water to increase the attenuation coefficient of water [12, 21] or Xenon gas as a hydrate former to increase the attenuation coefficient of hydrate [22, 23]. Phase isolation then assists further analyses of hydrate saturation dependent properties such as wave velocity and permeability [24-26]. Micro-focus CT could achieve a resolution of tens of microns to sub-microns which enables the study of hydrate

pore habits [12, 22, 27, 28], yet no micro-CT images of naturally occurred hydrate-bearing sediments have been reported. This study experimentally investigates how laboratory synthesized hydrate-bearing specimens may be impacted by various factors including pressure-temperature (PT) history, freezing, fines content, and initial water saturation. Formed specimens are imaged using X-ray CT, from which the distribution of different phases is revealed and analyzed at core scale. Results are expected to enhance current understanding on laboratory hydrate formation methods and their impacts on measured physical properties.
Table 1: Laboratory methods of forming hydrate-bearing sandy sediments
Hydrate formation methods Possible hydrate pore habit
Satu
rate
d sy
stem
Saturated soil: Pressurization → gas injection
Soil saturated with dissolved gas in water
Uns
atur
ated
syst
em
Unsaturated soils: Pressurization → saturation
Unsaturated soils: Saturation → pressurization
Unsaturated soils: PT → brine injection → PT
Moist sands: Freeze → thaw → pressurization Freeze → pressurization → thaw
Sand-ice mixture: Pressurization → thaw
2. Experimental Study 2.1 Experimental configuration Figure 1 illustrates the experimental set up of this study. Specimens are made in a high-pressure aluminum vessel, with an inner diameter of 33mm (1.3 inch). The pressure within the vessel is controlled by a carbon dioxide CO2 gas tank, thus CO2 is the hydrate former in this study. Temperature is controlled by circulating coolant outside of the aluminum vessel. The temperature inside the specimens are continuously measured using two K-type thermocouples with resolution of 0.1K. Specimens are visualized at different stages of the experiments (i.e., initial state after packing, hydrate formation, freezing, etc.) using a micro-focus X-ray CT scanner.
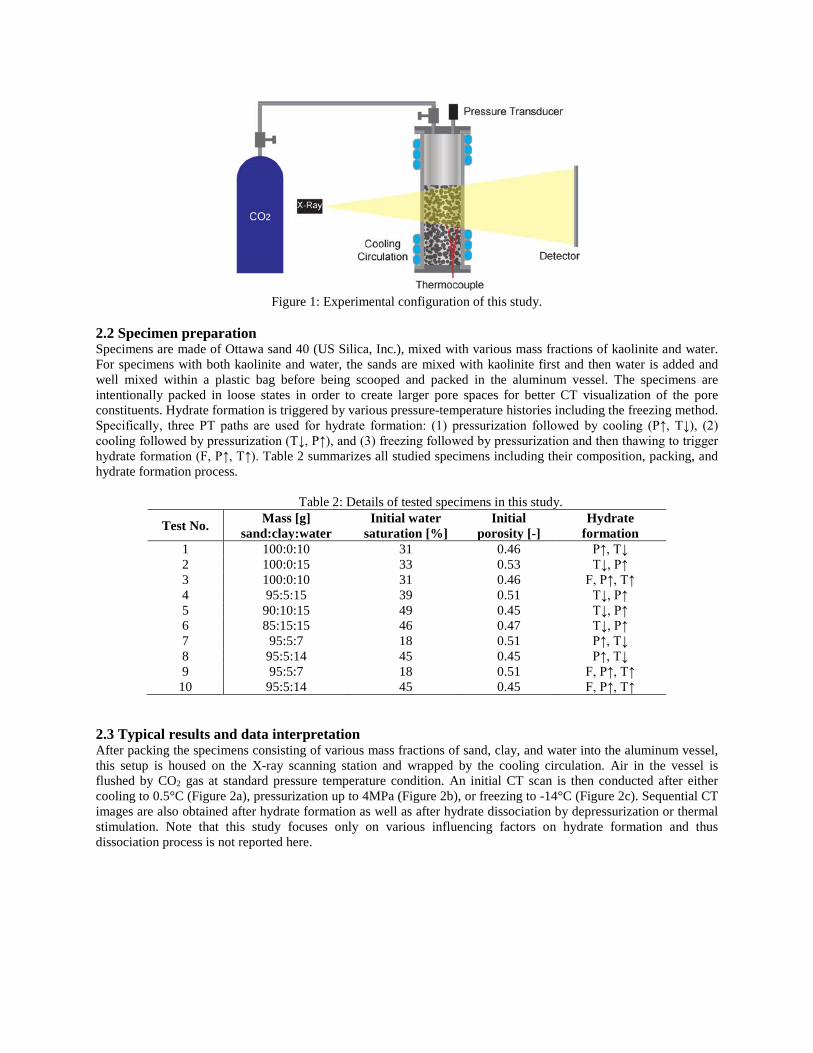
Figure 1: Experimental configuration of this study.
2.2 Specimen preparation Specimens are made of Ottawa sand 40 (US Silica, Inc.), mixed with various mass fractions of kaolinite and water. For specimens with both kaolinite and water, the sands are mixed with kaolinite first and then water is added and well mixed within a plastic bag before being scooped and packed in the aluminum vessel. The specimens are intentionally packed in loose states in order to create larger pore spaces for better CT visualization of the pore constituents. Hydrate formation is triggered by various pressure-temperature histories including the freezing method. Specifically, three PT paths are used for hydrate formation: (1) pressurization followed by cooling (P↑, T↓), (2) cooling followed by pressurization (T↓, P↑), and (3) freezing followed by pressurization and then thawing to trigger hydrate formation (F, P↑, T↑). Table 2 summarizes all studied specimens including their composition, packing, and hydrate formation process.
Table 2: Details of tested specimens in this study.
Test No. Mass [g] sand:clay:water
Initial water saturation [%]
Initial porosity [-]
Hydrate formation
1 100:0:10 31 0.46 P↑, T↓ 2 100:0:15 33 0.53 T↓, P↑ 3 100:0:10 31 0.46 F, P↑, T↑ 4 95:5:15 39 0.51 T↓, P↑ 5 90:10:15 49 0.45 T↓, P↑ 6 85:15:15 46 0.47 T↓, P↑ 7 95:5:7 18 0.51 P↑, T↓ 8 95:5:14 45 0.45 P↑, T↓ 9 95:5:7 18 0.51 F, P↑, T↑
10 95:5:14 45 0.45 F, P↑, T↑ 2.3 Typical results and data interpretation After packing the specimens consisting of various mass fractions of sand, clay, and water into the aluminum vessel, this setup is housed on the X-ray scanning station and wrapped by the cooling circulation. Air in the vessel is flushed by CO2 gas at standard pressure temperature condition. An initial CT scan is then conducted after either cooling to 0.5°C (Figure 2a), pressurization up to 4MPa (Figure 2b), or freezing to -14°C (Figure 2c). Sequential CT images are also obtained after hydrate formation as well as after hydrate dissociation by depressurization or thermal stimulation. Note that this study focuses only on various influencing factors on hydrate formation and thus dissociation process is not reported here.
(a)
0
1
2
3
4
-1 0 1 2 3 4 5 6
Pres
sure
[MPa
]
Temperature [°C]
(1) Cooling
(2) Pressurization
(3) Depressurization
T↓, P↑ (Test No.2)
(b)
0
1
2
3
4
-5 0 5 10 15 20
Pres
sure
[MPa
]
Temperature [°C]
(2) Hydrate
(2) Cooling
(1) P
ress
uriz
atio
n
(3) Depressurization
P↑, T↓ (Test No.8)
(c)
0
1
2
3
4
-15 -10 -5 0 5 10 15
Pres
sure
[MPa
]
Temperature [°C]
(1) Freezing
(2) Pressurization(3) Thawing
(4) Warming
F, P↑, T↓ (Test No.10)
Figure 2: Typical PT history of three hydrate formation processes used in this study. (a) Cooling followed by
pressurization. (b) Pressurization followed by cooling. (c) Freezing followed by pressurization and then thawing to trigger hydrate formation. Insets are profile view of X-ray CT images obtained at different experimental stages.
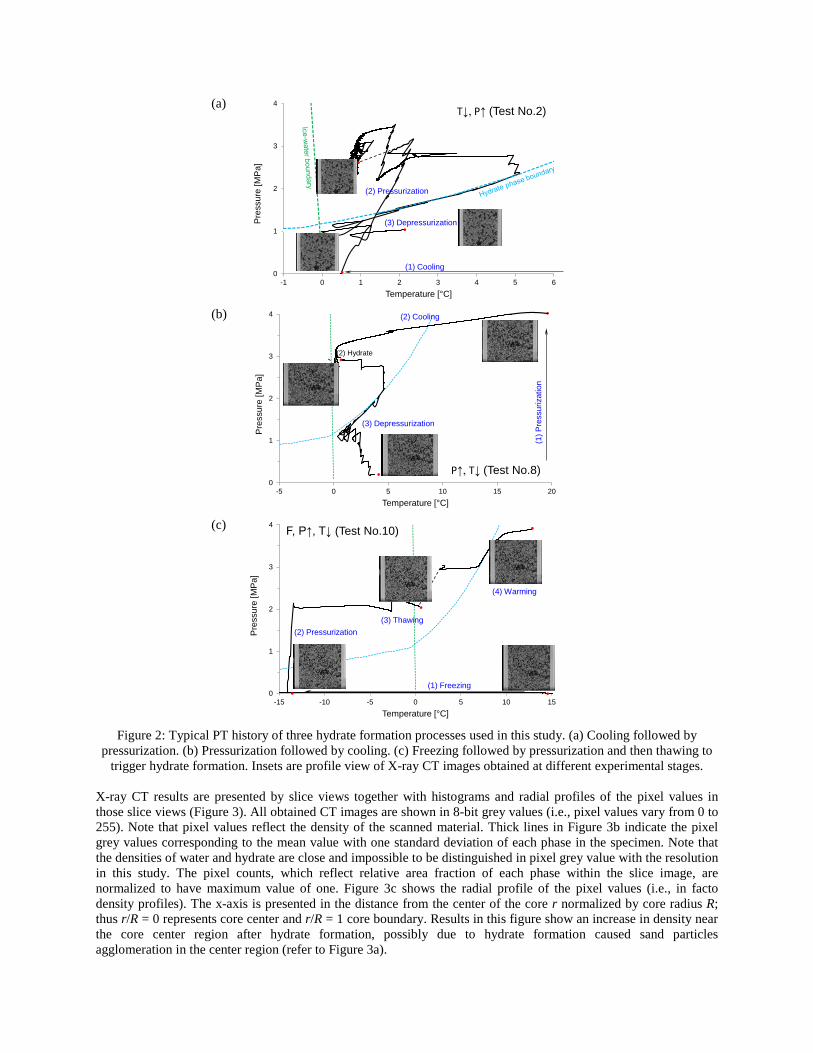
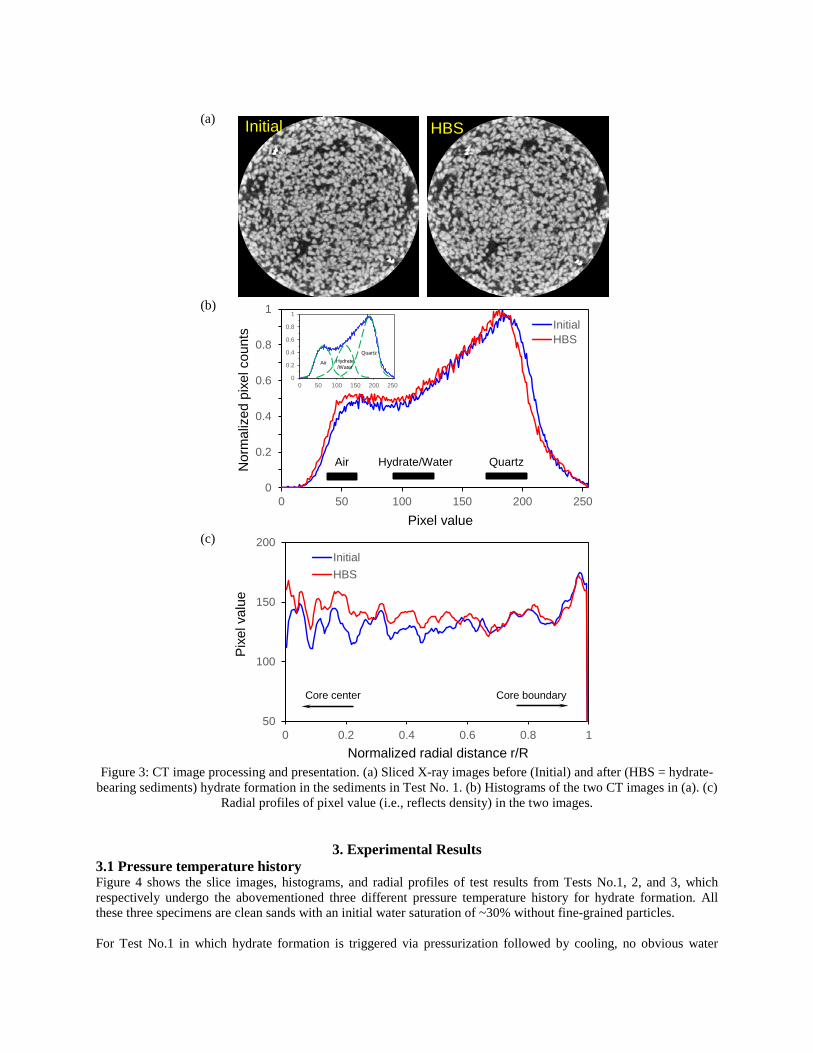
X-ray CT results are presented by slice views together with histograms and radial profiles of the pixel values in those slice views (Figure 3). All obtained CT images are shown in 8-bit grey values (i.e., pixel values vary from 0 to 255). Note that pixel values reflect the density of the scanned material. Thick lines in Figure 3b indicate the pixel grey values corresponding to the mean value with one standard deviation of each phase in the specimen. Note that the densities of water and hydrate are close and impossible to be distinguished in pixel grey value with the resolution in this study. The pixel counts, which reflect relative area fraction of each phase within the slice image, are normalized to have maximum value of one. Figure 3c shows the radial profile of the pixel values (i.e., in facto density profiles). The x-axis is presented in the distance from the center of the core r normalized by core radius R; thus r/R = 0 represents core center and r/R = 1 core boundary. Results in this figure show an increase in density near the core center region after hydrate formation, possibly due to hydrate formation caused sand particles agglomeration in the center region (refer to Figure 3a).
(a) Initial HBS
(b)
0
0.2
0.4
0.6
0.8
1
0 50 100 150 200 250
Nor
mal
ized
pix
el c
ount
s
Pixel value
InitialHBS
Air QuartzHydrate/Water
0
0.2
0.4
0.6
0.8
1
0 50 100 150 200 250
Air
QuartzHydrate/Water
(c)
50
100
150
200
0 0.2 0.4 0.6 0.8 1
Pixe
l val
ue
Normalized radial distance r/R
InitialHBS
Core boundaryCore center
Figure 3: CT image processing and presentation. (a) Sliced X-ray images before (Initial) and after (HBS = hydrate-
bearing sediments) hydrate formation in the sediments in Test No. 1. (b) Histograms of the two CT images in (a). (c) Radial profiles of pixel value (i.e., reflects density) in the two images.
3. Experimental Results 3.1 Pressure temperature history Figure 4 shows the slice images, histograms, and radial profiles of test results from Tests No.1, 2, and 3, which respectively undergo the abovementioned three different pressure temperature history for hydrate formation. All these three specimens are clean sands with an initial water saturation of ~30% without fine-grained particles. For Test No.1 in which hydrate formation is triggered via pressurization followed by cooling, no obvious water
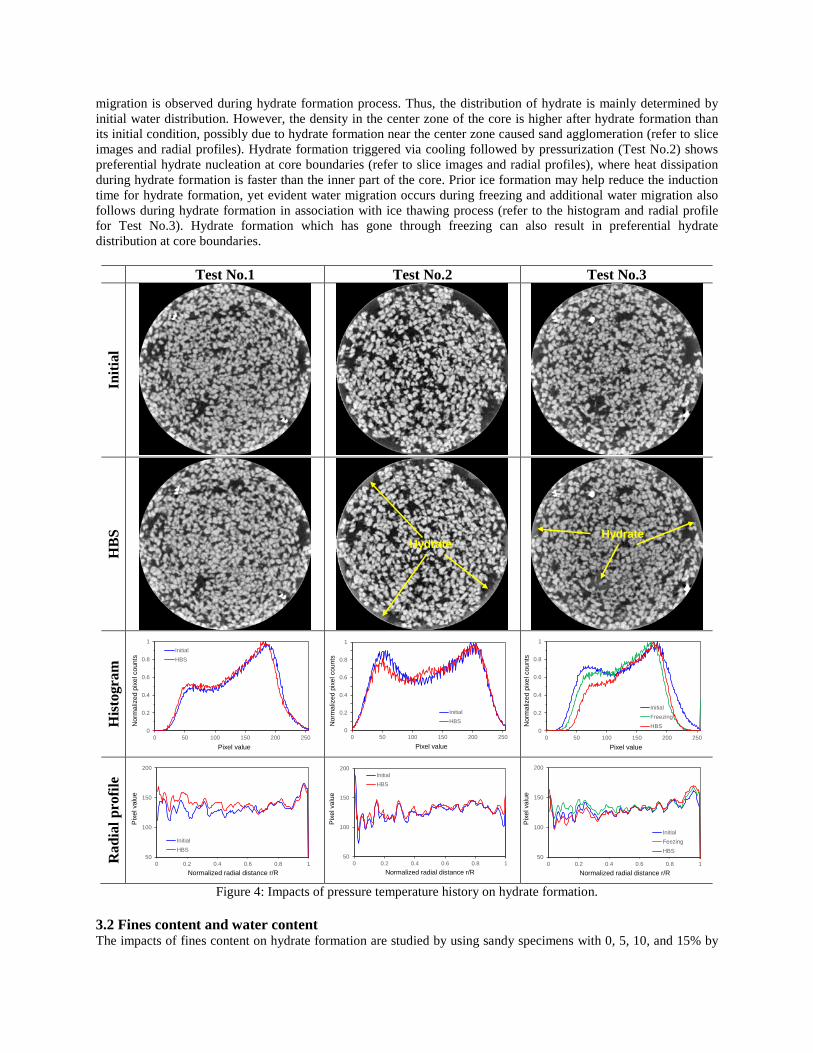
migration is observed during hydrate formation process. Thus, the distribution of hydrate is mainly determined by initial water distribution. However, the density in the center zone of the core is higher after hydrate formation than its initial condition, possibly due to hydrate formation near the center zone caused sand agglomeration (refer to slice images and radial profiles). Hydrate formation triggered via cooling followed by pressurization (Test No.2) shows preferential hydrate nucleation at core boundaries (refer to slice images and radial profiles), where heat dissipation during hydrate formation is faster than the inner part of the core. Prior ice formation may help reduce the induction time for hydrate formation, yet evident water migration occurs during freezing and additional water migration also follows during hydrate formation in association with ice thawing process (refer to the histogram and radial profile for Test No.3). Hydrate formation which has gone through freezing can also result in preferential hydrate distribution at core boundaries. Test No.1 Test No.2 Test No.3
Initi
al
HB
S
Hydrate
Hydrate
His
togr
am
0
0.2
0.4
0.6
0.8
1
0 50 100 150 200 250
Nor
mal
ized
pix
el c
ount
s
Pixel value
InitialHBS
0
0.2
0.4
0.6
0.8
1
0 50 100 150 200 250
Nor
mal
ized
pix
el c
ount
s
Pixel value
InitialHBS
0
0.2
0.4
0.6
0.8
1
0 50 100 150 200 250
Nor
mal
ized
pix
el c
ount
s
Pixel value
InitialFreezingHBS
Rad
ial p
rofil
e
50
100
150
200
0 0.2 0.4 0.6 0.8 1
Pixe
l val
ue
Normalized radial distance r/R
InitialHBS
50
100
150
200
0 0.2 0.4 0.6 0.8 1
Pixe
l val
ue
Normalized radial distance r/R
InitialHBS
50
100
150
200
0 0.2 0.4 0.6 0.8 1
Pixe
l val
ue
Normalized radial distance r/R
InitialFeezingHBS
Figure 4: Impacts of pressure temperature history on hydrate formation.
3.2 Fines content and water content The impacts of fines content on hydrate formation are studied by using sandy specimens with 0, 5, 10, and 15% by

mass of kaolinite. Hydrate formation is triggered via cooling followed by pressurization, which may cause preferential hydrate formation at core boundaries. This is done purposely to learn whether the presence of fine particles can suppress the prefererential hydrate nucleation caused by cooling-pressurization process. To avoid repeating the same information, results of the specimen with 0% fines content (Test No.2) are shown in Figure 4, and Figure 5 shows only results of specimens with 5, 10, and 15% fines (Test No.4, 5, and 6 respectively). Results show that regardless of fines content, i.e., 0-15% in this study, hydrate prefers nucleating at core boundaries if the hydrate formation is caused by the cooling-pressurization method. The presence of fine-grained particles cannot efficiently suppress water migration during hydrate formation in this case. However, the presence of fines does affect the uniformity of packing with a general trend of being less uniform for specimens with higher fines content (refer to slice view images in Figure 5). Sands tend to agglomerate in patches by fine-grained particles mixed with water; and thus, after hydrate formation, the specimen with 15% fines (Test No.6) appears patchier than that with no fine-grained particles (Test No.2). The radial profiles also become less smooth for specimens with increasing fines content, suggesting less uniform packing. Admittedly, the initial packing (dense versus loose) should have an impact on the final packing after hydrate formation. Fine-grained particles tend to adsorb water on its surface and decrease water activity; thus, less free water will be converted to form hydrate. Experimental results also show that for specimens with identical water content, those with higher fines content render less gas consumption for hydrate formation. Test No.4 Test No.5 Test No.6
Initi
al
HB
S
His
togr
am
0
0.2
0.4
0.6
0.8
1
0 50 100 150 200 250
Nor
mal
ized
pix
el c
ount
s
Pixel value
InitialHBS
0
0.2
0.4
0.6
0.8
1
0 50 100 150 200 250
Nor
mal
ized
pix
el c
ount
s
Pixel value
InitialHBS
0
0.2
0.4
0.6
0.8
1
0 50 100 150 200 250
Nor
mal
ized
pix
el c
ount
s
Pixel value
InitialHBS
Rad
ial p
rofil
e
50
100
150
200
0 0.2 0.4 0.6 0.8 1
Pixe
l val
ue
Normalized radial distance r/R
InitialHBS
50
100
150
200
0 0.2 0.4 0.6 0.8 1
Pixe
l val
ue
Normalized radial distance r/R
InitialHBS
50
100
150
200
0 0.2 0.4 0.6 0.8 1
Pixe
l val
ue
Normalized radial distance r/R
InitialHBS
Figure 5: The impacts of fines content on hydrate formation using the T↓, P↑ method.
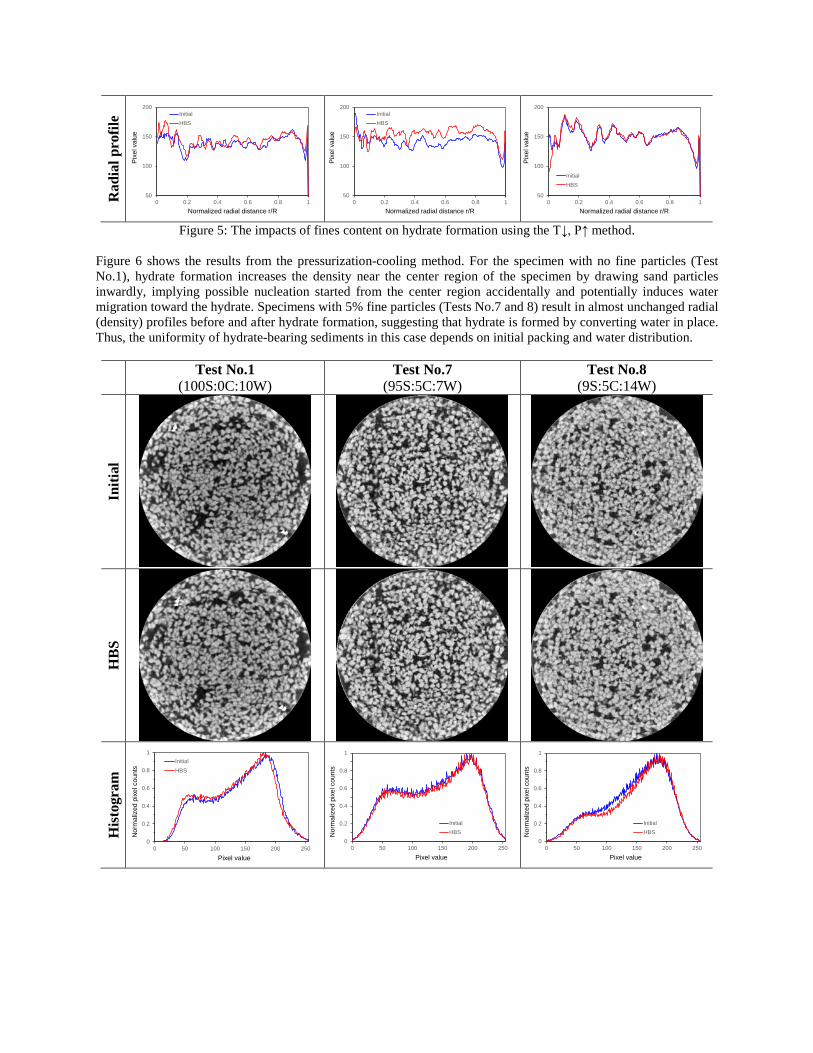
Figure 6 shows the results from the pressurization-cooling method. For the specimen with no fine particles (Test No.1), hydrate formation increases the density near the center region of the specimen by drawing sand particles inwardly, implying possible nucleation started from the center region accidentally and potentially induces water migration toward the hydrate. Specimens with 5% fine particles (Tests No.7 and 8) result in almost unchanged radial (density) profiles before and after hydrate formation, suggesting that hydrate is formed by converting water in place. Thus, the uniformity of hydrate-bearing sediments in this case depends on initial packing and water distribution.
Test No.1
(100S:0C:10W) Test No.7
(95S:5C:7W) Test No.8
(9S:5C:14W)
Initi
al
HB
S
His
togr
am
0
0.2
0.4
0.6
0.8
1
0 50 100 150 200 250
Nor
mal
ized
pix
el c
ount
s
Pixel value
InitialHBS
0
0.2
0.4
0.6
0.8
1
0 50 100 150 200 250
Nor
mal
ized
pix
el c
ount
s
Pixel value
InitialHBS
0
0.2
0.4
0.6
0.8
1
0 50 100 150 200 250
Nor
mal
ized
pix
el c
ount
s
Pixel value
InitialHBS
Rad
ial p
rofil
e
50
100
150
200
0 0.2 0.4 0.6 0.8 1
Pixe
l val
ue
Normalized radial distance r/R
InitialHBS
50
100
150
200
0 0.2 0.4 0.6 0.8 1
Pixe
l val
ue
Normalized radial distance r/R
InitialHBS
50
100
150
200
0 0.2 0.4 0.6 0.8 1
Pixe
l val
ue
Normalized radial distance r/R
InitialHBS
Figure 6: The impacts of fines content on hydrate formation using the P↑, T↓ method.
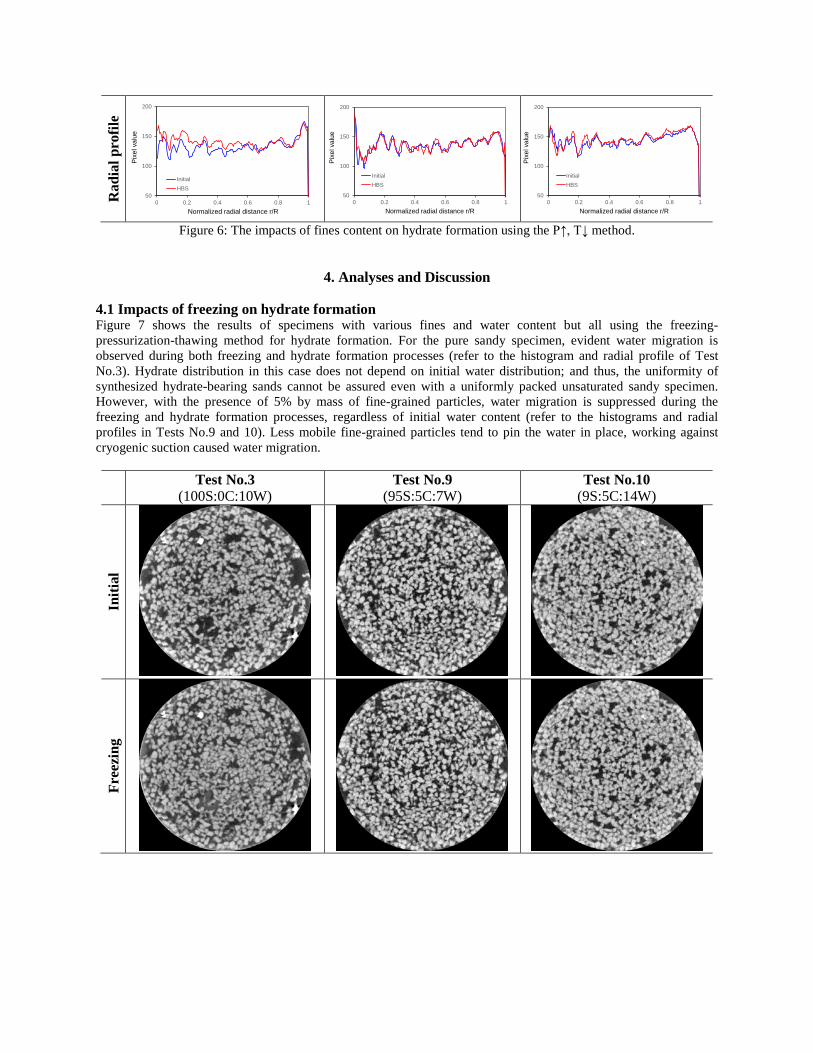
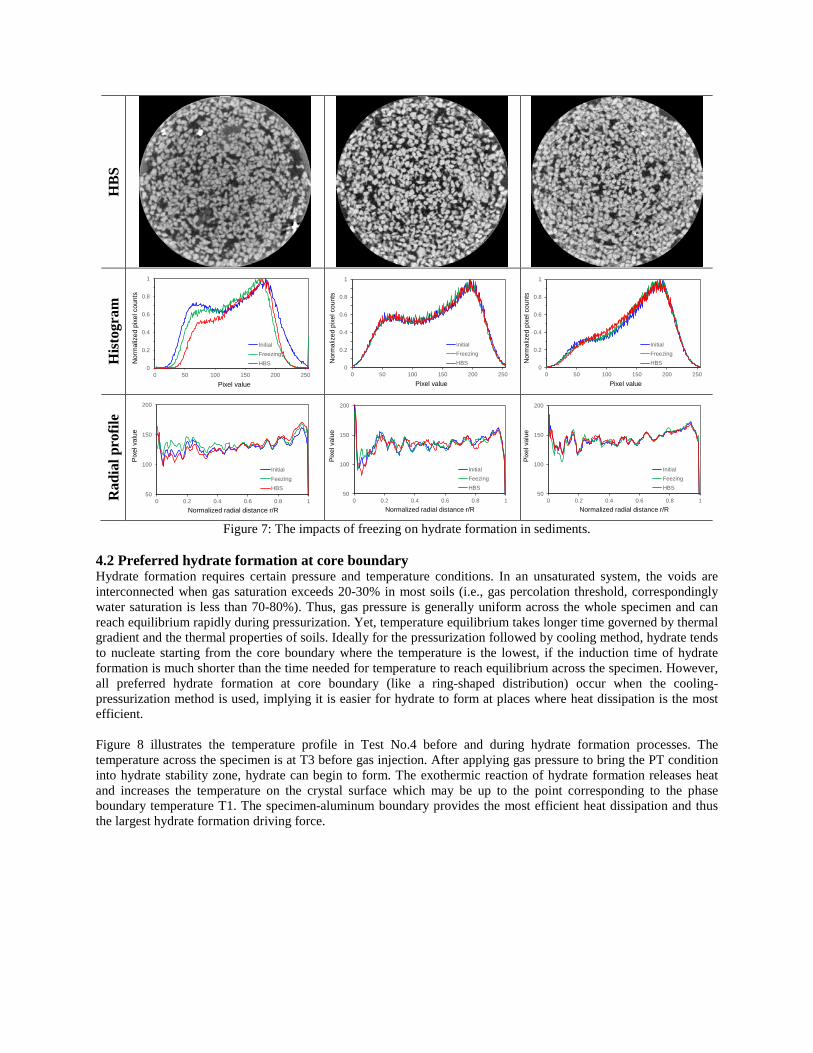
4. Analyses and Discussion 4.1 Impacts of freezing on hydrate formation Figure 7 shows the results of specimens with various fines and water content but all using the freezing-pressurization-thawing method for hydrate formation. For the pure sandy specimen, evident water migration is observed during both freezing and hydrate formation processes (refer to the histogram and radial profile of Test No.3). Hydrate distribution in this case does not depend on initial water distribution; and thus, the uniformity of synthesized hydrate-bearing sands cannot be assured even with a uniformly packed unsaturated sandy specimen. However, with the presence of 5% by mass of fine-grained particles, water migration is suppressed during the freezing and hydrate formation processes, regardless of initial water content (refer to the histograms and radial profiles in Tests No.9 and 10). Less mobile fine-grained particles tend to pin the water in place, working against cryogenic suction caused water migration.
Test No.3
(100S:0C:10W) Test No.9
(95S:5C:7W) Test No.10
(9S:5C:14W)
Initi
al
Free
zing
HB
S
His
togr
am
0
0.2
0.4
0.6
0.8
1
0 50 100 150 200 250
Nor
mal
ized
pix
el c
ount
s
Pixel value
InitialFreezingHBS
0
0.2
0.4
0.6
0.8
1
0 50 100 150 200 250
Nor
mal
ized
pix
el c
ount
s
Pixel value
InitialFreezingHBS
0
0.2
0.4
0.6
0.8
1
0 50 100 150 200 250
Nor
mal
ized
pix
el c
ount
s
Pixel value
InitialFreezingHBS
Rad
ial p
rofil
e
50
100
150
200
0 0.2 0.4 0.6 0.8 1
Pixe
l val
ue
Normalized radial distance r/R
InitialFeezingHBS
50
100
150
200
0 0.2 0.4 0.6 0.8 1
Pixe
l val
ue
Normalized radial distance r/R
InitialFeezingHBS
50
100
150
200
0 0.2 0.4 0.6 0.8 1
Pixe
l val
ue
Normalized radial distance r/R
InitialFeezingHBS
Figure 7: The impacts of freezing on hydrate formation in sediments.
4.2 Preferred hydrate formation at core boundary Hydrate formation requires certain pressure and temperature conditions. In an unsaturated system, the voids are interconnected when gas saturation exceeds 20-30% in most soils (i.e., gas percolation threshold, correspondingly water saturation is less than 70-80%). Thus, gas pressure is generally uniform across the whole specimen and can reach equilibrium rapidly during pressurization. Yet, temperature equilibrium takes longer time governed by thermal gradient and the thermal properties of soils. Ideally for the pressurization followed by cooling method, hydrate tends to nucleate starting from the core boundary where the temperature is the lowest, if the induction time of hydrate formation is much shorter than the time needed for temperature to reach equilibrium across the specimen. However, all preferred hydrate formation at core boundary (like a ring-shaped distribution) occur when the cooling-pressurization method is used, implying it is easier for hydrate to form at places where heat dissipation is the most efficient. Figure 8 illustrates the temperature profile in Test No.4 before and during hydrate formation processes. The temperature across the specimen is at T3 before gas injection. After applying gas pressure to bring the PT condition into hydrate stability zone, hydrate can begin to form. The exothermic reaction of hydrate formation releases heat and increases the temperature on the crystal surface which may be up to the point corresponding to the phase boundary temperature T1. The specimen-aluminum boundary provides the most efficient heat dissipation and thus the largest hydrate formation driving force.
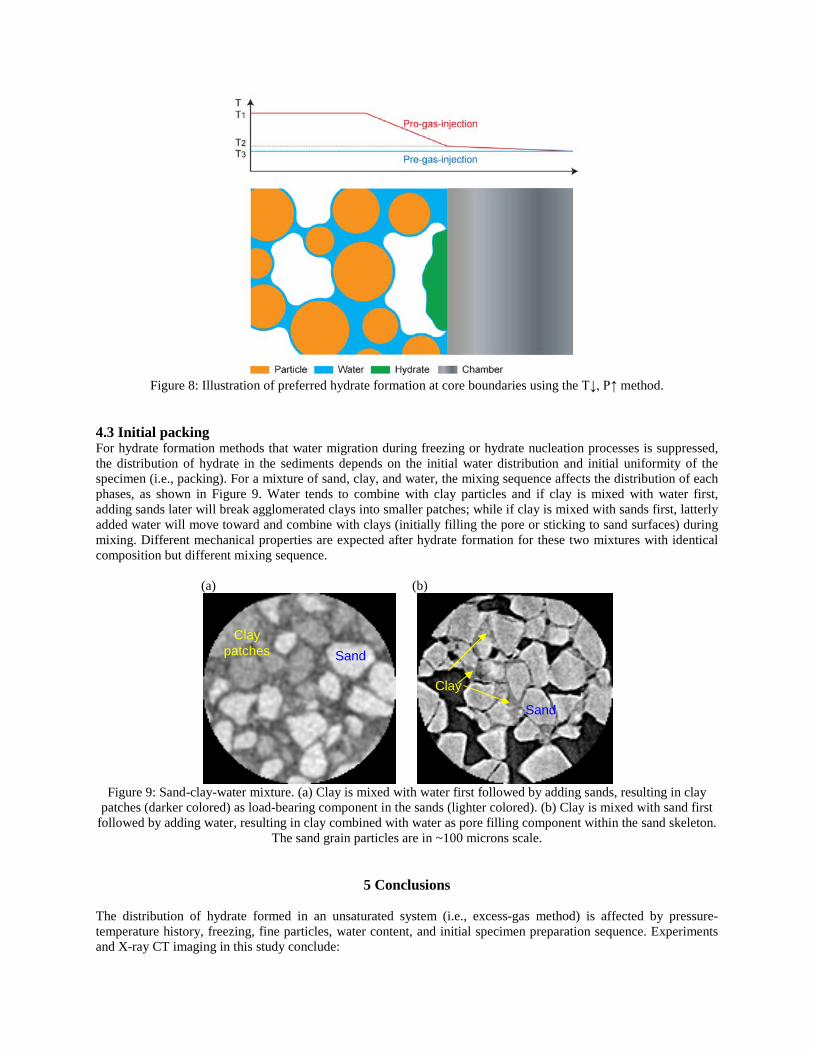
Figure 8: Illustration of preferred hydrate formation at core boundaries using the T↓, P↑ method.
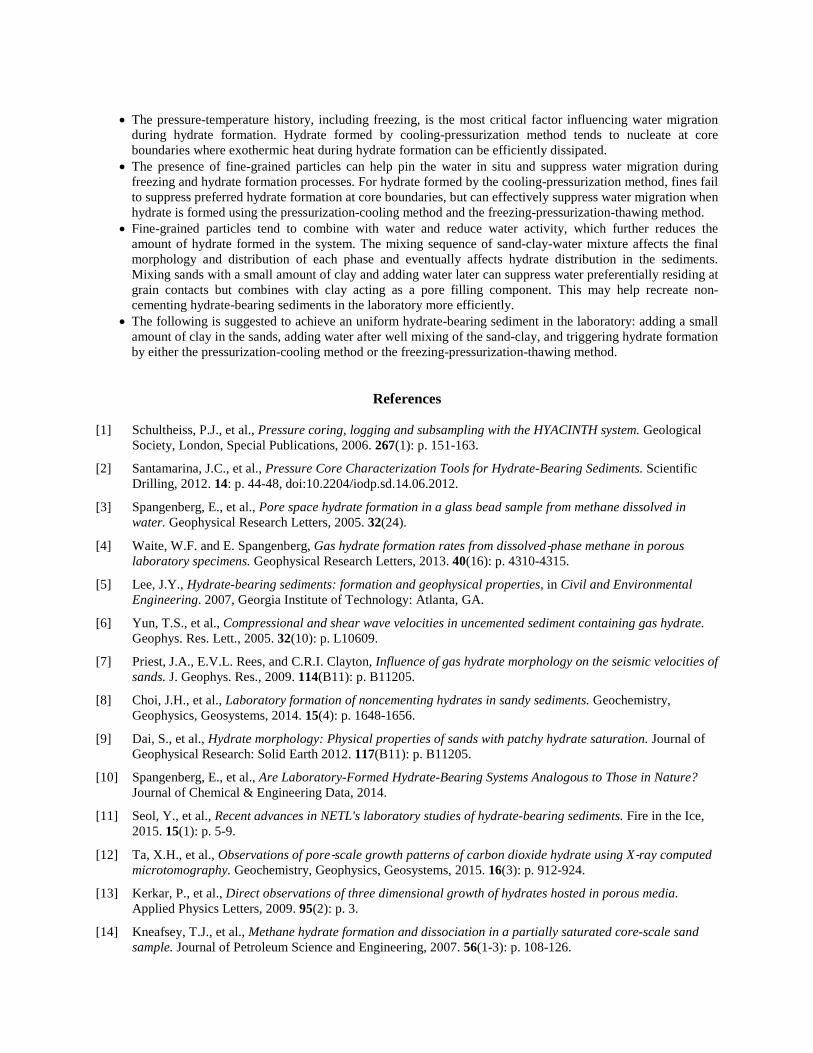
4.3 Initial packing For hydrate formation methods that water migration during freezing or hydrate nucleation processes is suppressed, the distribution of hydrate in the sediments depends on the initial water distribution and initial uniformity of the specimen (i.e., packing). For a mixture of sand, clay, and water, the mixing sequence affects the distribution of each phases, as shown in Figure 9. Water tends to combine with clay particles and if clay is mixed with water first, adding sands later will break agglomerated clays into smaller patches; while if clay is mixed with sands first, latterly added water will move toward and combine with clays (initially filling the pore or sticking to sand surfaces) during mixing. Different mechanical properties are expected after hydrate formation for these two mixtures with identical composition but different mixing sequence.
(a)
Clay patches Sand
(b)
Sand
Clay
Figure 9: Sand-clay-water mixture. (a) Clay is mixed with water first followed by adding sands, resulting in clay
patches (darker colored) as load-bearing component in the sands (lighter colored). (b) Clay is mixed with sand first followed by adding water, resulting in clay combined with water as pore filling component within the sand skeleton.
The sand grain particles are in ~100 microns scale.
5 Conclusions The distribution of hydrate formed in an unsaturated system (i.e., excess-gas method) is affected by pressure-temperature history, freezing, fine particles, water content, and initial specimen preparation sequence. Experiments and X-ray CT imaging in this study conclude:
• The pressure-temperature history, including freezing, is the most critical factor influencing water migration
during hydrate formation. Hydrate formed by cooling-pressurization method tends to nucleate at core boundaries where exothermic heat during hydrate formation can be efficiently dissipated.
• The presence of fine-grained particles can help pin the water in situ and suppress water migration during freezing and hydrate formation processes. For hydrate formed by the cooling-pressurization method, fines fail to suppress preferred hydrate formation at core boundaries, but can effectively suppress water migration when hydrate is formed using the pressurization-cooling method and the freezing-pressurization-thawing method.
• Fine-grained particles tend to combine with water and reduce water activity, which further reduces the amount of hydrate formed in the system. The mixing sequence of sand-clay-water mixture affects the final morphology and distribution of each phase and eventually affects hydrate distribution in the sediments. Mixing sands with a small amount of clay and adding water later can suppress water preferentially residing at grain contacts but combines with clay acting as a pore filling component. This may help recreate non-cementing hydrate-bearing sediments in the laboratory more efficiently.
• The following is suggested to achieve an uniform hydrate-bearing sediment in the laboratory: adding a small amount of clay in the sands, adding water after well mixing of the sand-clay, and triggering hydrate formation by either the pressurization-cooling method or the freezing-pressurization-thawing method.
References [1] Schultheiss, P.J., et al., Pressure coring, logging and subsampling with the HYACINTH system. Geological
Society, London, Special Publications, 2006. 267(1): p. 151-163.
[2] Santamarina, J.C., et al., Pressure Core Characterization Tools for Hydrate-Bearing Sediments. Scientific Drilling, 2012. 14: p. 44-48, doi:10.2204/iodp.sd.14.06.2012.
[3] Spangenberg, E., et al., Pore space hydrate formation in a glass bead sample from methane dissolved in water. Geophysical Research Letters, 2005. 32(24).
[4] Waite, W.F. and E. Spangenberg, Gas hydrate formation rates from dissolved‐phase methane in porous laboratory specimens. Geophysical Research Letters, 2013. 40(16): p. 4310-4315.
[5] Lee, J.Y., Hydrate-bearing sediments: formation and geophysical properties, in Civil and Environmental Engineering. 2007, Georgia Institute of Technology: Atlanta, GA.
[6] Yun, T.S., et al., Compressional and shear wave velocities in uncemented sediment containing gas hydrate. Geophys. Res. Lett., 2005. 32(10): p. L10609.
[7] Priest, J.A., E.V.L. Rees, and C.R.I. Clayton, Influence of gas hydrate morphology on the seismic velocities of sands. J. Geophys. Res., 2009. 114(B11): p. B11205.
[8] Choi, J.H., et al., Laboratory formation of noncementing hydrates in sandy sediments. Geochemistry, Geophysics, Geosystems, 2014. 15(4): p. 1648-1656.
[9] Dai, S., et al., Hydrate morphology: Physical properties of sands with patchy hydrate saturation. Journal of Geophysical Research: Solid Earth 2012. 117(B11): p. B11205.
[10] Spangenberg, E., et al., Are Laboratory-Formed Hydrate-Bearing Systems Analogous to Those in Nature? Journal of Chemical & Engineering Data, 2014.
[11] Seol, Y., et al., Recent advances in NETL's laboratory studies of hydrate-bearing sediments. Fire in the Ice, 2015. 15(1): p. 5-9.
[12] Ta, X.H., et al., Observations of pore‐scale growth patterns of carbon dioxide hydrate using X‐ray computed microtomography. Geochemistry, Geophysics, Geosystems, 2015. 16(3): p. 912-924.
[13] Kerkar, P., et al., Direct observations of three dimensional growth of hydrates hosted in porous media. Applied Physics Letters, 2009. 95(2): p. 3.
[14] Kneafsey, T.J., et al., Methane hydrate formation and dissociation in a partially saturated core-scale sand sample. Journal of Petroleum Science and Engineering, 2007. 56(1-3): p. 108-126.

[15] Seol, Y. and T.J. Kneafsey, X-ray computed-tomography observations of water flow through anisotropic methane hydrate-bearing sand. Journal of Petroleum Science and Engineering, 2009. 66(3): p. 121-132.
[16] Rees, E.V.L., J.A. Priest, and C.R.I. Clayton, The structure of methane gas hydrate bearing sediments from the Krishna–Godavari Basin as seen from Micro-CT scanning. Marine and Petroleum Geology, 2011. 28(7): p. 1283-1293.
[17] Lee, J.Y., et al., Pressure core based study of gas hydrates in the Ulleung Basin and implication for geomechanical controls on gas hydrate occurrence. Marine and Petroleum Geology, 2013. 47(0): p. 85-98.
[18] Melanie Holland, et al. Observed Gas Hydrate Morphologies in Marine Sediments. in Proceedings of the 6th International Conference on Gas Hydrates (ICGH 2008). 2008. Vancouver, British Columbia, CANADA.
[19] Shigeki, J., et al., Structure Analyses of Artificial Methane Hydrate Sediments by Microfocus X-ray Computed Tomography. Japanese Journal of Applied Physics, 2004. 43(8R): p. 5673.
[20] Mitsutaka, S., et al., Distribution of Hydrate Saturation Ratios in Artificial Methane Hydrate Sediments Measured by High-Speed X-Ray Computerized Tomography. Japanese Journal of Applied Physics, 2005. 44(1R): p. 473.
[21] Kerkar, P.B., et al., Imaging methane hydrates growth dynamics in porous media using synchrotron X-ray computed microtomography. Geochemistry, Geophysics, Geosystems, 2014. 15(12): p. 4759-4768.
[22] Chaouachi, M., et al., Microstructural evolution of gas hydrates in sedimentary matrices observed with synchrotron X-ray computed tomographic microscopy. Geochemistry, Geophysics, Geosystems, 2015. 16(6): p. 1711-1722.
[23] Jin, Y., et al., Observation of Xe Hydrate Growth at Gas−Ice Interface by Microfocus X-ray Computed Tomography. The Journal of Physical Chemistry C, 2008. 112(44): p. 17253-17256.
[24] Waite, W.F., et al., Physical property changes in hydrate-bearing sediment due to depressurization and subsequent repressurization. Journal of Geophysical Research: Solid Earth, 2008. 113(B7): p. n/a-n/a.
[25] Kneafsey, T.J., et al., Permeability of laboratory-formed methane-hydrate-bearing sand: measurements and observations using X-ray Computed Tomography. SPE Journal, 2011. 16(1): p. 78-94.
[26] Jin, Y., et al., New Method of Assessing Absolute Permeability of Natural Methane Hydrate Sediments by Microfocus X-ray Computed Tomography. Japanese Journal of Applied Physics, 2007. 46(5R): p. 3159.
[27] Choi, J.-H., et al., X-ray computed-tomography imaging of gas migration in water-saturated sediments: From capillary invasion to conduit opening. Geophysical Research Letters, 2011. 38(17): p. L17310.
[28] Yang, L., et al., Synchrotron X-ray computed microtomography study on gas hydrate decomposition in a sedimentary matrix. Geochemistry, Geophysics, Geosystems, 2016. 17(9): p. 3717-3732.