
Hybrid Disease DiagnosisUsing ...downloads.hindawi.com/journals/jhe/2017/5907264.pdfHybrid Disease...
28
Research Article Hybrid Disease Diagnosis Using Multiobjective Optimization with Evolutionary Parameter Optimization MadhuSudana Rao Nalluri, 1 Kannan K., 1 Manisha M., 1 and Diptendu Sinha Roy 2 1 SASTRA University, Thanjavur, Tamil Nadu, India 2 National Institute of Technology, Meghalaya, India Correspondence should be addressed to Diptendu Sinha Roy; [email protected] Received 10 December 2016; Revised 23 February 2017; Accepted 30 March 2017; Published 4 July 2017 Academic Editor: Ashish Khare Copyright © 2017 MadhuSudana Rao Nalluri et al. This is an open access article distributed under the Creative Commons Attribution License, which permits unrestricted use, distribution, and reproduction in any medium, provided the original work is properly cited. With the widespread adoption of e-Healthcare and telemedicine applications, accurate, intelligent disease diagnosis systems have been profoundly coveted. In recent years, numerous individual machine learning-based classifiers have been proposed and tested, and the fact that a single classifier cannot effectively classify and diagnose all diseases has been almost accorded with. This has seen a number of recent research attempts to arrive at a consensus using ensemble classification techniques. In this paper, a hybrid system is proposed to diagnose ailments using optimizing individual classifier parameters for two classifier techniques, namely, support vector machine (SVM) and multilayer perceptron (MLP) technique. We employ three recent evolutionary algorithms to optimize the parameters of the classifiers above, leading to six alternative hybrid disease diagnosis systems, also referred to as hybrid intelligent systems (HISs). Multiple objectives, namely, prediction accuracy, sensitivity, and specificity, have been considered to assess the efficacy of the proposed hybrid systems with existing ones. The proposed model is evaluated on 11 benchmark datasets, and the obtained results demonstrate that our proposed hybrid diagnosis systems perform better in terms of disease prediction accuracy, sensitivity, and specificity. Pertinent statistical tests were carried out to substantiate the efficacy of the obtained results. 1. Introduction The proliferations of computer usage across all aspects of life have resulted in accumulating a large number of systematic and related data. This has necessitated identifying useful patterns from raw datasets as the next logical step forward. Thus, data mining, a broad discipline encompassing classifi- cation, clustering, association, prediction, estimation, and visualization tasks [1], has emerged as a dynamic and signif- icant field of research to address theoretical challenges as well as practical issues. Data mining and knowledge engineering techniques have been successfully applied to numerous areas, like education, pattern recognition, fraud detection, and medicine [2, 3]. The application of data mining and knowledge engineer- ing techniques in the medical domain plays a prime role in the diagnosis of diseases and prognostication [4]. It assists healthcare professionals and doctors to analyze and predict diseases [5] and is often commonly referred to as medical engineering. Numerous machine learning algorithms have been developed to extract useful patterns from raw medical data over the years [6]. These patterns have been utilized for disease prediction using classification and clustering strategies. Medical research focuses on employing data min- ing for prediction of a broad range of diseases, including breast cancer [7], heart diseases [8], Parkinson’s disease [9], hepatitis, and diabetes, only to name a few. Over the years, several supervised machine learning tech- niques such as classification as well as several unsupervised machine learning techniques like clustering have been applied to available medical information [10, 11]. Individual classifiers, ensembles thereof, and hybrid systems have often been used to diagnose various diseases. Several techniques have been applied on medical data to improve such diag- nosing efficacy, regarding performance parameters such as prediction accuracy, sensitivity, and specificity [12, 13]. Hindawi Journal of Healthcare Engineering Volume 2017, Article ID 5907264, 27 pages https://doi.org/10.1155/2017/5907264
Transcript of Hybrid Disease DiagnosisUsing ...downloads.hindawi.com/journals/jhe/2017/5907264.pdfHybrid Disease...
Research ArticleHybrid Disease Diagnosis Using Multiobjective Optimization withEvolutionary Parameter Optimization
MadhuSudana Rao Nalluri,1 Kannan K.,1 Manisha M.,1 and Diptendu Sinha Roy2
1SASTRA University, Thanjavur, Tamil Nadu, India2National Institute of Technology, Meghalaya, India
Correspondence should be addressed to Diptendu Sinha Roy; [email protected]
Received 10 December 2016; Revised 23 February 2017; Accepted 30 March 2017; Published 4 July 2017
Academic Editor: Ashish Khare
Copyright © 2017 MadhuSudana Rao Nalluri et al. This is an open access article distributed under the Creative CommonsAttribution License, which permits unrestricted use, distribution, and reproduction in any medium, provided the original workis properly cited.
With the widespread adoption of e-Healthcare and telemedicine applications, accurate, intelligent disease diagnosis systems havebeen profoundly coveted. In recent years, numerous individual machine learning-based classifiers have been proposed and tested,and the fact that a single classifier cannot effectively classify and diagnose all diseases has been almost accorded with. This has seen anumber of recent research attempts to arrive at a consensus using ensemble classification techniques. In this paper, a hybrid systemis proposed to diagnose ailments using optimizing individual classifier parameters for two classifier techniques, namely, supportvector machine (SVM) and multilayer perceptron (MLP) technique. We employ three recent evolutionary algorithms tooptimize the parameters of the classifiers above, leading to six alternative hybrid disease diagnosis systems, also referred to ashybrid intelligent systems (HISs). Multiple objectives, namely, prediction accuracy, sensitivity, and specificity, have beenconsidered to assess the efficacy of the proposed hybrid systems with existing ones. The proposed model is evaluated on 11benchmark datasets, and the obtained results demonstrate that our proposed hybrid diagnosis systems perform better in termsof disease prediction accuracy, sensitivity, and specificity. Pertinent statistical tests were carried out to substantiate the efficacy ofthe obtained results.
1. Introduction
The proliferations of computer usage across all aspects of lifehave resulted in accumulating a large number of systematicand related data. This has necessitated identifying usefulpatterns from raw datasets as the next logical step forward.Thus, data mining, a broad discipline encompassing classifi-cation, clustering, association, prediction, estimation, andvisualization tasks [1], has emerged as a dynamic and signif-icant field of research to address theoretical challenges as wellas practical issues. Data mining and knowledge engineeringtechniques have been successfully applied to numerous areas,like education, pattern recognition, fraud detection, andmedicine [2, 3].
The application of data mining and knowledge engineer-ing techniques in the medical domain plays a prime role inthe diagnosis of diseases and prognostication [4]. It assistshealthcare professionals and doctors to analyze and predict
diseases [5] and is often commonly referred to as medicalengineering. Numerous machine learning algorithms havebeen developed to extract useful patterns from raw medicaldata over the years [6]. These patterns have been utilizedfor disease prediction using classification and clusteringstrategies. Medical research focuses on employing data min-ing for prediction of a broad range of diseases, includingbreast cancer [7], heart diseases [8], Parkinson’s disease [9],hepatitis, and diabetes, only to name a few.
Over the years, several supervised machine learning tech-niques such as classification as well as several unsupervisedmachine learning techniques like clustering have beenapplied to available medical information [10, 11]. Individualclassifiers, ensembles thereof, and hybrid systems have oftenbeen used to diagnose various diseases. Several techniqueshave been applied on medical data to improve such diag-nosing efficacy, regarding performance parameters such asprediction accuracy, sensitivity, and specificity [12, 13].
HindawiJournal of Healthcare EngineeringVolume 2017, Article ID 5907264, 27 pageshttps://doi.org/10.1155/2017/5907264

This paper presents a hybrid system for diagnosis andprediction of numerous diseases using optimized parametersfor classifiers. The classifier parameters are optimized usingevolutionary algorithms to enhance classification perfor-mance. By juxtaposing the proposed parameter optimizationstep within existing classifier mechanisms, our methodprovides improved prediction accuracy. In this paper, 16classifiers are executed in which two basics are with andwithout resampling, 6 hybrid intelligent systems withoutresampling and 6 hybrid intelligent systems with resamplingtechnique. In summary, this paper presents a comparativeanalysis of parameter optimized versions of two classifiers,namely, support vector machine (SVM) and multilayerperceptron (MLP) for medical data. It has been concludedfrom experimental results presented in this paper that ourproposed hybrid system outperforms state of the art (singleor ensemble) for classifying medical data. To contrive theparameter optimization, we have employed three popularevolutionary algorithms, namely, particle swarm optimiza-tion (PSO), gravitational search algorithm (GSA), and fireflyalgorithm (FA) for optimizing parameters of SVM andMLP classifiers. Accordingly, we study the performanceof six alternative hybrid systems for classifying medicaldata towards a diagnosis of such diseases. The performanceof the proposed hybrid intelligent techniques is comparedwith the recent literature results (both simple and ensembleclassifiers [14–16]). This hybrid intelligent system showsbetter performance than the recently published ensembleclassifiers on 11 benchmark datasets.
The rest of this paper is organized as follows: A briefexposition of existing researches has been dealt with inSection 2, specifically focusing on several machine learningalgorithms employed for processing medical datasets. Theproblem formulation of our proposed weighted multiobjec-tive optimization for the classifying problem dealt with hasbeen presented in Section 3. Section 4 provides the rudimen-tary steps and key features of the evolutionary algorithmsemployed for the parameter optimization of SVM and MLPclassifiers, namely, particle swarm optimization (PSO), grav-itational search algorithm (GSA), and firefly algorithm (FA).A very basic introduction of the two classifiers employed,namely, SVM and MLP, has been discussed in Section 5.Section 6 elaborately explains the development of the pro-posed hybrid classification system for disease diagnosis alongwith their key components and design principles involved.The performance of the proposed hybrid scheme is testedover 11 benchmark medical datasets, and Section 7 providesa brief account of the experimental setup and the experi-ments conducted and summarizes the results obtained. Thissection also presents a statistical analysis of obtained resultsfor validating the acceptability of obtained statistical results.The conclusions of the research have been presented inSection 8.
2. Related Work
There have been abundant attempts to analyze and diagnoseailments employing machine learning algorithms. Thissection gives a summary of the efforts in this field to put
the contribution of our work in perspective. These researches,however, vary considerably in terms of classifiers applied andnature of systems employed; for example, some are simpleand others are hybrid whereas some others present ensemblesystems. There are also major varieties in terms of objectivefunctions chosen, single or multiobjective formulation, thenumber of datasets on which these methods have beenapplied, performance parameters employed for validatingthe efficacy, and so forth.
Among the different disease datasets that have beenstudied in the literature, heart disease diagnosis has been veryprominent within medical engineering circles, and a widevariety of machine learning techniques have been exploredtowards diagnosing the same. References [17–38] includesome prominent contributions towards diagnosing heart dis-eases from various aspects using myriad machine learningtechniques, details of which are presented hereafter. Chitraand Seenivasagam [18] proposed a cascaded neural network(CNN) classifier and support vector machine (SVM) to diag-nose heart diseases. The performance of CNN and SVM wascompared based on the accuracy, sensitivity, and specificity.Pattekari and Parveen [19] suggested an intelligent system,which used a naive Bayes classifier that was further improvedby developing ensemble-based classifiers. Das et al. [17]developed a neural network ensemble model for heart diseasediagnosis. The proposed technique used Statistical AnalysisSystem (SAS) enterprise guide 4.3 programs for data prepro-cessing and SAS Enterprise miner 5.2 programs for recogniz-ing the heart disease by combining three neural networksensemble. The technique was further improved by com-bining other neural networks and was also used for variousdatasets. Das et al. [37] described an SAS-based Software9.1.3 for diagnosing valvular heart diseases. The proposedmethod used a neural network ensemble. Predicted values,posterior probabilities, and voting posterior probabilitieswere applied.
Masethe and Masethe [21] used J48, naive Bayes,REPTREE, CART, and Bayes Net for diagnosing the efficacyof heart diseases. High accuracy was obtained using a J48tree. Shaikh et al. [22] evaluated the performance of threeclassifiers, namely, k-NN, naive Bayesian, and decision treebased on four parameters, namely, precision, recall, accuracy,and F-measure. k-NN produced higher accuracy than othermethods. Bhatla and Jyoti [26] compared naive Bayes, deci-sion tree, and neural networks for the said diagnosis. Forthe decision tree, genetic algorithm and fuzzy logic wereemployed, and results presented used TANAGRA tool.
Kavitha and Christopher [23] performed classificationof heart rate using a hybrid particle swarm optimizationand fuzzy C-means (PSO-FCM) clustering. The proposedmethod performed feature selection using PSO. The fuzzyC-means cluster and classifier are combined to enhancethe accuracy. Enhanced SVM was used for classifying heartdiseases. The hybrid system could be trained to shorten theimplementation time. Alizadehsani et al. [24] evaluatedsequential minimal optimization (SMO), naive Bayes, bag-ging with SMO, and neural networks. They employed rapidminer tool, and high accuracy was obtained using baggingwith SMO. Abhishek [38] employed j48, naive Bayes, neural
2 Journal of Healthcare Engineering
networks with all attributes for diagnosing heart diseaseswith the WEKA machine learning software and concludedthat j48 outperformed others regarding accuracy.
Jabbar et al. [20] used association mining and geneticalgorithm in conjunction with heart disease prediction. Theproposed method used Gini index statistics for associationalgorithm and crossover, the mutation for the geneticalgorithm. They further employed a feature selection tech-nique for improved accuracy. Ordonez et al. [36] presentedan improved algorithm to determine constrained associationrules by two techniques: mapping medical data and identify-ing constraints. The proposed method used mining attri-butes. Constrained association rules and parameters wereused for the mapping. The technique produced interestingresults by comparing this association rule with classificationrule. Shenfield and Rostami [25] introduced a multiobjec-tive approach to the evolutionary design of artificial neuralnetworks for predicting heart disease.
Parthiban and Subramanian [27] developed a coactiveneurofuzzy inference system (CANFIS) for prediction ofheart diseases. The proposed model combined CANFIS,neural network, and fuzzy logic. It was then integrated witha genetic algorithm. Results showed that GA was usefulfor autotuning of the CANFIS parameters. Hedeshi andAbadeh [28] performed PSO algorithm with a boostingapproach. The proposed method used fuzzy rule extractionwith PSO and enhanced-particle swarm optimization 2(En-PSO2). Karaolis et al. [35] used myocardial infarction(MI), percutaneous coronary intervention (PCI), and coro-nary artery bypass graft surgery (CABG) models. The pro-posed method used C4.5 decision tree algorithms. Resultswere compared based on false positive (FP), precision,and so forth. By further investigation with various datasetsand employing extraction rule algorithms further, betterresults were obtained.
Kim et al. [30] proposed a fuzzy rule-based adaptive cor-onary heart disease prediction support model. The proposedmethod had three parts, namely, introducing fuzzy member-ship functions, a decision-tree rule induction technique, andfuzzy inference based on Mamdani’s method. Outcomeswere compared with neural network, logistic regression, deci-sion tree, and Bayes Net. Chaurasia and Pal [31] offered threepopular data mining algorithms: CART (classification andregression tree), ID3 (iterative dichotomized 3), and decisiontable (DT) for diagnosing heart diseases, and the results pre-sented demonstrated that CART obtained higher accuracywithin less time.
Olaniyi et al. [29] used neural network and supportvector machine for heart diseases. Their proposed methodused multilayer perceptron and demonstrated that SVMproduced high accuracy. Yan et al. [32] proposed that multi-layer perception with hidden layers is found by a cascadeprocess. For the inductive reasoning of the methods, theproposed method used three assessment procedures, namely,cross-validation, hold out, and five bootstrapping samples forfive intervals. Yan et al. [33] utilized multilayer perception forthe diagnosis of five different cases of heart disease. Themethod employed a cascade learning process to find hiddenlayers and used back propagation for training the datasets.
Further improvements to the accuracy were achieved byparameter adjustments. Shouman et al. [34] identified gapsin the research work for heart disease diagnosis. The pro-posed method applied both single and hybrid data miningtechniques to establish baseline accuracy and compared.Based on the research, hybrid classifier produced higheraccuracy than a single classifier.
Sartakhti et al. [39] presented a method for diagnosisof hepatitis by novel machine learning methods thathybridize support vector machine and simulated annealingprocess. The proposed method used two hyperparametersfor radial basis function (RBF) kernel: C and gamma.For all potential combinations of C and gamma interval,k-fold cross-validation score had been calculated. Resultsdemonstrated that tuning SVM parameters by simulatedannealing increased the accuracy. Çalişir et al. [40] developedthe principle component analysis and least square supportvector machine (PS-LLSVM). The suggested method wascarried out in two steps: (1) the feature extraction fromhepatitis disease database and feature reduction by PCAand (2) the reduced features are fed to the LSSVM classi-fier. Li and Wong [41] proposed C4.5 and PCL classifier.The outcomes were compared between C4.5 (bagging,boosting, and single tree) and PCL, and it was concludedthat PCL produced higher accuracy than C4.5 based ontheir observations.
Weng et al. [42] investigated the performance of differentclassifiers which predicts Parkinson’s disease. The proposedmethod used an ANN classifier based on the evaluationcriteria. Jane et al. [43] proposed a Q-back propagated timedelay neural network (Q-BTDNN) classifier. It developedtemporal classification models that performed the taskof classification and prognostication in clinical decision-making system. It used to feed forward time-delay neuralnetwork (TDNN) where training was imparted by a Q-learning-induced back propagation (Q-BP) technique. A10-fold-cross-validation was employed for assessing theclassification model. The results obtained were consideredfor comparative analysis, and it produced high accuracy.Gürüler [44] described a combination of the k-meansclustering-based feature weighting (KMCFW) methodand a complex-valued artificial neural network (CVANN).The suggested method considered five different evaluationmethods. The cluster centers were estimated using the KMC.Results obtained showed very high accuracy.
Bashir et al. [45] presented an ensemble framework forpredicting people with diabetes with multilayer classificationusing enhanced bagging and optimized weighting. The pro-posed HM-BagMOOV method used KNN approach formissing data imputation and had three layers, namely, layer1 containing naive Bayes (NB), quadratic discriminant anal-ysis (QDA), linear regression (LR), instance-based learning(IBL), and SVM; layer 2 included ANN and RF; and layer 3used multilayer weighted bagging prediction. The outcomeshowed that it produced good accuracy for all datasets. Iyeret al. [46] prescribed a method to diagnose the disease usingdecision tree and naive Bayes. The proposed method used10-fold cross-validation. The technique had been furtherenhanced by using other classifiers and neural network
3Journal of Healthcare Engineering
techniques. Choubey and Sanchita [47] used geneticalgorithm and multilayer perceptron techniques for thediagnosis of diabetics. The suggested methodology wasimplemented in two levels where genetic algorithm (GA)was used for feature selection and multilayer perceptronneural network (MLP NN) was used for classification ofthe selected characteristics. The results produced excellentaccuracy that was further increased by considering receiveroperating characteristic (ROC).
Kharya [48] used various data mining techniques for thediagnosis and prognosis of cancer. The proposed methodused neural network, association rule mining, naïve Bayes,C4.5 decision tree algorithm, and Bayesian networks. Theresults showed that decision tree produced better accuracythan other classifiers. Chaurasia and Pal [49] investigatedthe performance of different classification techniques onbreast cancer data. The proposed method used three clas-sification techniques, namely, SMO, k-nearest neighboralgorithm (IBK), and best first (BF) tree. The results dem-onstrated that SMO produced higher accuracy than theother two techniques. In this article [50], an expert system(ES) is proposed for clinical diagnosis which is helpful fordecision making in primary health care. The ES proposedused a rule-based system to identify several diseases basedon clinical test reports.
Alzubaidi et al. studied ovarian cancer well [51]. In thiswork, features are selected using a hybrid global optimizationtechnique. The hybridization process has involved mutualinformation, linear discriminate analysis, and genetic algo-rithm. The performance of the proposed hybrid techniqueis compared with support vector machine. This hybrid tech-nique has shown significant performance improvementsthan support vector machine.
Gwak et al. [52] have proposed an ensemble frame-work for combining various crossover strategies usingprobability. The performance of this context had testedover 27 benchmark functions. It showed outperformanceon eight tough benchmark functions. This ensemble frame-work further can be efficiently used for feature selection ofbig datasets.
Hsieh et al. [53] have developed and ensemble machinelearning model for diagnosing breast cancer. In this model,information-gain has been adopted for feature selection.The list of classifiers used for developing ensemble classifieris neural fuzzy (NF), k-nearest neighbor (KNN), and thequadratic classifier (QC). The performance of ensembleframework is compared with individual classifier perfor-mance. The results demonstrate that ensemble frameworkhas shown better performance than single classifier.
Review of existing literature for disease diagnosis tech-niques with machine learning indicates that there exists aplethora of individual classifiers as well as ensemble tech-niques. However, from such studies, it was also beenconclusively evident that no individual classifier gives highprediction accuracy for different disease datasets. This hasled to abundant ensemble classifiers for disease diagnosis,compromising the simplicity that an individual classifieroffers. To this end, this paper indulges in designing ahybrid system that focuses on providing generalized
performance across a broad range of benchmark datasets.The most significant contribution of the proposed hybriddisease classifiers is that unlike most research works men-tioned before that targets a specific disease, this papervalidates the efficacy of the proposed hybrid classifiersacross six different diseases collected over eleven datasets.For instance, among all heart disease, related diagnosissystems only [33] consider five different datasets for thesaid disease. Also, there are very few attempts in validatingdiagnosis efficacy over multiple diseases. Shen et al. [54]and Bashir et al. [14] are few exceptions that validatetheir results for four and five different diseases, respectively.The proposed classifiers employ novel parameter optimi-zation approaches using a few recent evolutionary algo-rithms, detailed design of which has been presented insubsequent sections.
3. Problem Formulation
In this paper, we deal with classifying data from different dis-ease datasets using a hybrid technique that optimizes theparameters of SVM and MLP classifiers for improved diseaseprediction. The list of objective functions to be targeted whilesolving the said classification problem include (i) predictionaccuracy, (ii) specificity, and (iii) sensitivity, which has beenconsidered very commonly for this problem in existing liter-ature [55–57]. Each of these objective functions capturessome aspect of quality of disease classification. In this sense,the problem studied in this paper is a multiobjective optimi-zation problem.
All the aforementioned measures are computed in termsof the following values: true positive (TP), true negative (TN),false positive (FP), and false negative (FN), and their signifi-cance is defined as follows: TP: total number of positives thatare correctly identified as positive; TN: total number ofnegatives that are identified as negatives; FP: total numberof negatives that are incorrectly identified as positives;and FN: total number of positives that are wrongly identifiedas negatives.
The objective functions considered for optimization inthis work are prediction accuracy (PAC), specificity (SPY),and sensitivity (SEY). To model these functions, two randomindicator variables are introduced for all the data objects tocompute TP, TN, FP, and FN. These are Xi1 and Xi2, wherethese are defined as follows:
Xi1 = I CLi = PCi = C+Xi2 = I CLi = PCi = C− , 1
where C+ represents the actual class label is positive (+), C−represents the actual class label is negative (−), PCi representspredicted class label of ith data object, and CLi represents theactual class label of the ith data object. At any point of thetime, the sum of the entire indicator random variable valuesis equal to 1; that is, ∑2
j=1Xij = 1, ∀i.Let the classifier being developed for classifying a given
dataset be a binary classifier and the dataset has N instanceswith m1 positive and m2 negative instances. Therefore,
4 Journal of Healthcare Engineering

TP = 〠N
i=1Xi1,
TN = 〠N
i=1Xi2,
FN =m1 − TP =m1 − 〠N
i=1Xi1,
FP =m2 − TN =m2 − 〠N
i=1Xi2
2
The performance parameters for the classifiers can thusbe obtained using the following three equations:
Prediction accuracy PAC =TP + TN
TP + TN + FP + FN
=〠N
i=1Xi1 +〠N
i=1Xi2
m1 +m2,
3
Specif icity SPY = TNTN + FP
=〠N
i=1Xi2
m2, 4
Sensitivity SEY = TPTP + FN
=〠N
i=1Xi1
m15
The aim of this research is to arrive at optimal values ofclassifier parameters through evolution such that some max-ima are attained for PAC, SPY, and SEY. It is worthwhile tomention that even different sets of classifier parameter valueswith same PAC can have different values for SPY and SEY.Thus, there exist tradeoffs among (3), (4), and (5).
Any multiobjective optimization problem can then besolved either by converting the objective functions into a sin-gle linear or nonlinear objective function or by computingPareto fronts using the concept of nondominance [58].
In this paper, a linear combination of objective functionshas been taken to form a single linear compound objectivefunction due to the requirement of additional computationaleffort for finding Pareto fronts in every iteration.
MaximizeZ =W1∗PAC +W2∗SPY +W3∗SEY,
MaximizeZ =W1∗〠N
i=1Xi1 +〠N
i=1Xi2
m1 +m2+W2∗
〠N
i=1Xi2
m2
+W3∗〠N
i=1Xi1
m1
6
subject to the constraints
W1 +W2 +W3 = 1, 7
1 ≥Wi ≥ 0 ∀i, 8
Ui ≥ CLASSIFIER PARi ≥ Li ∀i, 9
where CLASSIFIER PARi is the ith sensitive parameter ofthe considered classifier, (7) represents the totality condition
of the weights, (8) guarantees the nonnegativity condition,and (9) checks that the ith classifier parameter values iswithin the specified bounds.
4. Evolutionary Algorithms
In this section, we present a summary of the three evolu-tionary algorithms employed to optimize the parameters ofSVM and MLP for classifying medical datasets for diseasediagnosis. The discussions are restricted only to provide abrief overview. Detailed information and possible variationsof these algorithms are beyond the scope of this paper.
4.1. Gravitational Search Algorithm (GSA). Gravitationalsearch algorithm (GSA) is one of the population-basedstochastic search methods initially developed by Rashediet al. in the year 2009 [59]. GSA is inspired by Newton’sgravitational law in physics, where every particle in the uni-verse attracts every other particle with a force that is directlyproportional to the product of their masses and inverselyproportional to the square of the distance between them.GSA has been successfully applied to solve several engineer-ing optimization problems [60, 61].
In GSA, several masses are considered on a d-dimen-sional space. The position of each mass resembles a pointin the solution space of the problem to be solved. The fitnessvalues of the agent, worst (t), and best (t) are used to computethe force (F) of mass. Equations corresponding to theseparameters are provided in
qi t =f iti t − worst tbest t − worst t
, 10
Mi t = qi t
〠s
j=1qj t, 11
best t =min f itk t ∀k , 12
worst t =max f itk t ∀k 13
To update the position of mass xdi t + 1 , velocityvdi t needs to be updated first. The velocity of the massat the time t + 1 majorly depends on the values of velocityand acceleration at that time instant t. Acceleration of theith mass at instant t is adi t depending on forces of all otherheavy masses based on (14). The equation corresponding tothe acceleration is given in (15). Equations correspondingto updating process of mass position and mass velocity areprovided in (16) and (17).
Fdi t =〠
j∈kbest,j≠irandj G tMj t Mi t
Rij t + ∈xdj t − xdi t ,
14
adi t =Fdi t
Mi t, 15
Vdi t + 1 = randi ×Vd
i t + adi t , 16
5Journal of Healthcare Engineering
Xdi t + 1 = Xd
i t +Vdi t + 1 , 17
where randi and randj lie between 0 and 1. “ ∈ ” is asmall value. The distance between agents i and j isdenoted by Rij t . The best k agents are denoted withkbest. G is a gravitational constant which is initializedwith G0 at the beginning, and with the progress in time,the value of G decreases.
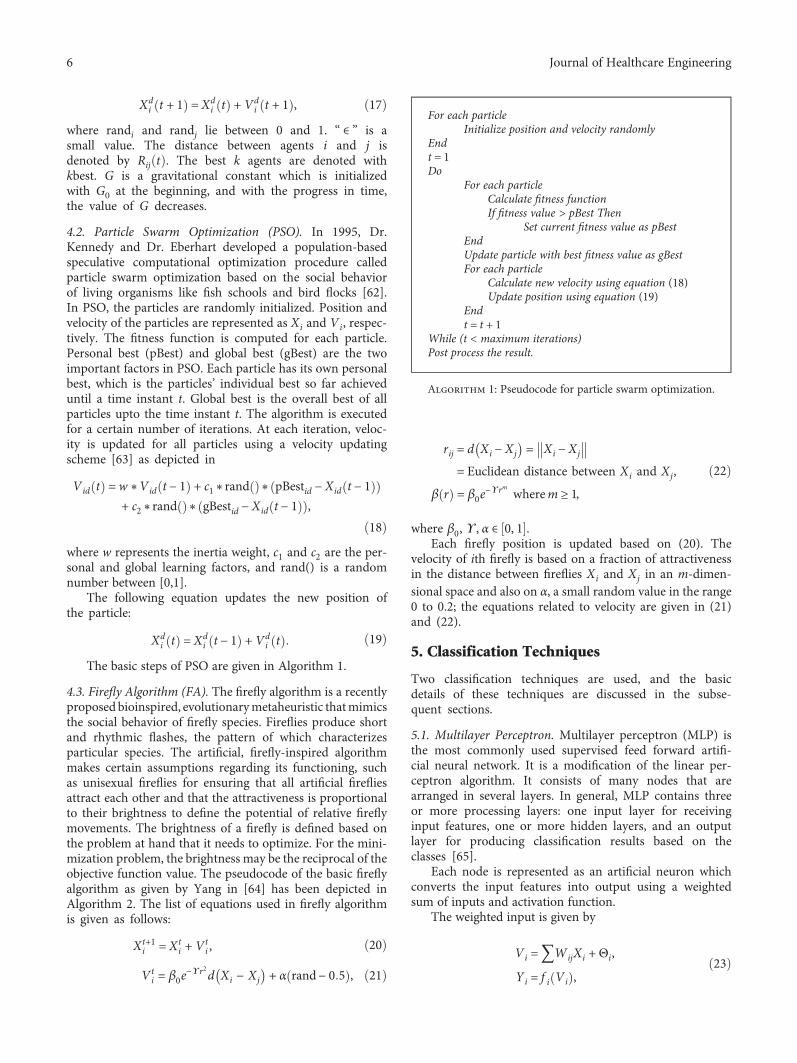
4.2. Particle Swarm Optimization (PSO). In 1995, Dr.Kennedy and Dr. Eberhart developed a population-basedspeculative computational optimization procedure calledparticle swarm optimization based on the social behaviorof living organisms like fish schools and bird flocks [62].In PSO, the particles are randomly initialized. Position andvelocity of the particles are represented as Xi and Vi, respec-tively. The fitness function is computed for each particle.Personal best (pBest) and global best (gBest) are the twoimportant factors in PSO. Each particle has its own personalbest, which is the particles’ individual best so far achieveduntil a time instant t. Global best is the overall best of allparticles upto the time instant t. The algorithm is executedfor a certain number of iterations. At each iteration, veloc-ity is updated for all particles using a velocity updatingscheme [63] as depicted in
Vid t =w ∗Vid t − 1 + c1∗rand ∗ pBestid − Xid t − 1+ c2∗rand ∗ gBestid − Xid t − 1 ,
18
where w represents the inertia weight, c1 and c2 are the per-sonal and global learning factors, and rand() is a randomnumber between [0,1].
The following equation updates the new position ofthe particle:
Xdi t = Xd
i t − 1 +Vdi t 19
The basic steps of PSO are given in Algorithm 1.
4.3. Firefly Algorithm (FA). The firefly algorithm is a recentlyproposed bioinspired, evolutionarymetaheuristic thatmimicsthe social behavior of firefly species. Fireflies produce shortand rhythmic flashes, the pattern of which characterizesparticular species. The artificial, firefly-inspired algorithmmakes certain assumptions regarding its functioning, suchas unisexual fireflies for ensuring that all artificial firefliesattract each other and that the attractiveness is proportionalto their brightness to define the potential of relative fireflymovements. The brightness of a firefly is defined based onthe problem at hand that it needs to optimize. For the mini-mization problem, the brightness may be the reciprocal of theobjective function value. The pseudocode of the basic fireflyalgorithm as given by Yang in [64] has been depicted inAlgorithm 2. The list of equations used in firefly algorithmis given as follows:
Xt+1i = Xt
i +Vti , 20
Vti = β0e
−ϒ r2d Xi − Xj + α rand− 0 5 , 21
rij = d Xi − Xj = Xi − Xj
= Euclidean distance between Xi and Xj,
β r = β0e−ϒ rm wherem ≥ 1,
22
where β0,ϒ , α ∈ 0, 1 .Each firefly position is updated based on (20). The
velocity of ith firefly is based on a fraction of attractivenessin the distance between fireflies Xi and Xj in an m-dimen-sional space and also on α, a small random value in the range0 to 0.2; the equations related to velocity are given in (21)and (22).
5. Classification Techniques
Two classification techniques are used, and the basicdetails of these techniques are discussed in the subse-quent sections.
5.1. Multilayer Perceptron. Multilayer perceptron (MLP) isthe most commonly used supervised feed forward artifi-cial neural network. It is a modification of the linear per-ceptron algorithm. It consists of many nodes that arearranged in several layers. In general, MLP contains threeor more processing layers: one input layer for receivinginput features, one or more hidden layers, and an outputlayer for producing classification results based on theclasses [65].
Each node is represented as an artificial neuron whichconverts the input features into output using a weightedsum of inputs and activation function.
The weighted input is given by
Vi =〠WijXi +Θi,
Yi = f i Vi ,23
For each particleInitialize position and velocity randomly
Endt = 1Do
For each particleCalculate fitness functionIf fitness value > pBest Then
Set current fitness value as pBestEndUpdate particle with best fitness value as gBestFor each particle
Calculate new velocity using equation (18)Update position using equation (19)
Endt = t + 1
While (t < maximum iterations)Post process the result.
Algorithm 1: Pseudocode for particle swarm optimization.
6 Journal of Healthcare Engineering
where V is the weighted sum of input features, W representsweights, X represents the input features, and Θ is the biasbased on the classes.
The activation function is denoted by f(x). The mostfrequently used activation functions are sigmoids. They areas follows:
f vi = tanh vi ,
f vi = 1 + e−vi−1 24
The multilayer perceptron is trained using back propaga-tion (BP). The weight update equation used in BP is given in
wji ←wji + ηδj xji + αΔwij n− 1 where 1 ≥ η, α ≥ 0
25
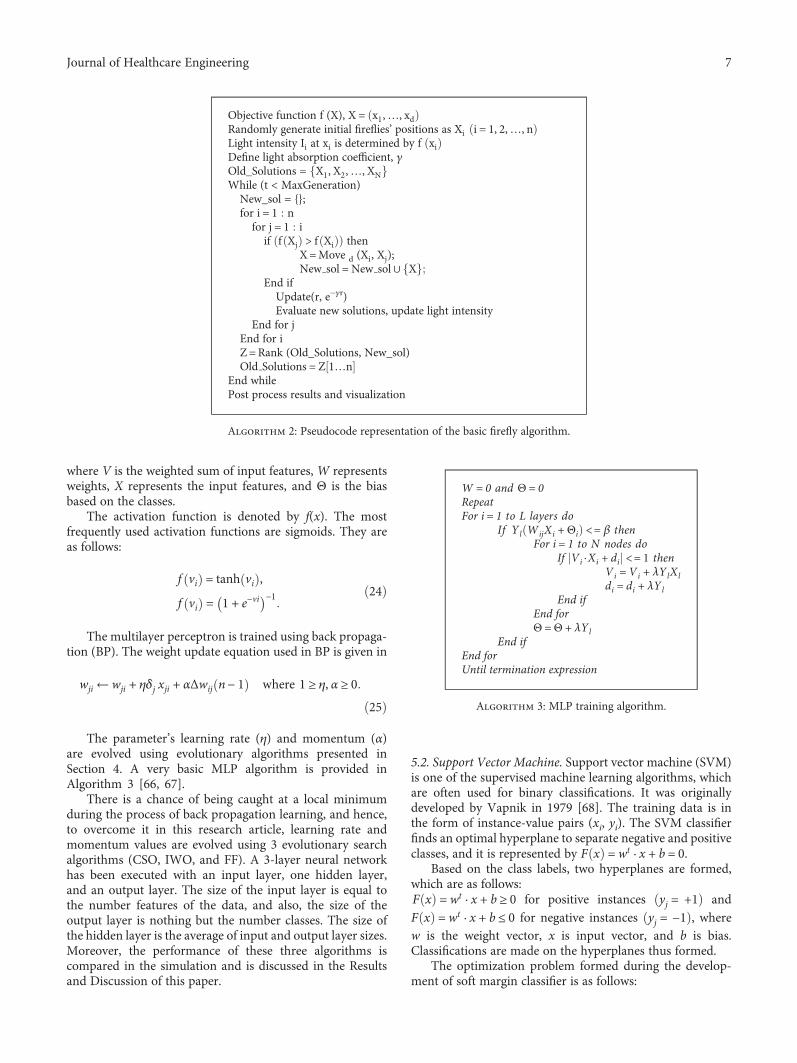
The parameter’s learning rate (η) and momentum (α)are evolved using evolutionary algorithms presented inSection 4. A very basic MLP algorithm is provided inAlgorithm 3 [66, 67].
There is a chance of being caught at a local minimumduring the process of back propagation learning, and hence,to overcome it in this research article, learning rate andmomentum values are evolved using 3 evolutionary searchalgorithms (CSO, IWO, and FF). A 3-layer neural networkhas been executed with an input layer, one hidden layer,and an output layer. The size of the input layer is equal tothe number features of the data, and also, the size of theoutput layer is nothing but the number classes. The size ofthe hidden layer is the average of input and output layer sizes.Moreover, the performance of these three algorithms iscompared in the simulation and is discussed in the Resultsand Discussion of this paper.
5.2. Support Vector Machine. Support vector machine (SVM)is one of the supervised machine learning algorithms, whichare often used for binary classifications. It was originallydeveloped by Vapnik in 1979 [68]. The training data is inthe form of instance-value pairs (xi, yi). The SVM classifierfinds an optimal hyperplane to separate negative and positiveclasses, and it is represented by F x =wt · x + b = 0.
Based on the class labels, two hyperplanes are formed,which are as follows:F x =wt · x + b ≥ 0 for positive instances yj = +1 andF x =wt · x + b ≤ 0 for negative instances yj = −1 , wherew is the weight vector, x is input vector, and b is bias.Classifications are made on the hyperplanes thus formed.
The optimization problem formed during the develop-ment of soft margin classifier is as follows:
Objective function f (X), X = x1,…, xdRandomly generate initial fireflies’ positions as Xi i = 1, 2,…, nLight intensity Ii at xi is determined by f xiDefine light absorption coefficient, γOld_Solutions = X1, X2,…, XNWhile (t < MaxGeneration)
New_sol = {};for i = 1 nfor j = 1 i
if f Xj > f Xi thenX=Move d (Xi, Xj);New sol = New sol ∪ X
End ifUpdate(r, e−γr)Evaluate new solutions, update light intensity
End for jEnd for iZ =Rank (Old_Solutions, New_sol)Old Solutions = Z 1…n
End whilePost process results and visualization
Algorithm 2: Pseudocode representation of the basic firefly algorithm.
W = 0 and Θ = 0RepeatFor i = 1 to L layers do
If Yl WijXi +Θi <= β thenFor i = 1 to N nodes do
If Vi ⋅Xi + di <= 1 thenVi =Vi + λYlXldi = di + λYl
End ifEnd forΘ =Θ + λYl
End ifEnd forUntil termination expression
Algorithm 3: MLP training algorithm.
7Journal of Healthcare Engineering
Minimize Z = 12<w, w> + C〠
iξi,
subject toYi <wi, xi> + b ≥ 1− ξi
26
The parameter cost (C) mentioned in (26) will be evolvedusing the evolutionary algorithms mentioned in Section 4.
6. Hybrid Intelligent System for DiagnosingDiseases
Diagnosing diseases from data collected from many patientswith a varied degree of a specific disease is a classificationproblem. In medical information systems, single classifiersas well as ensemble classifiers have been studied for the dis-ease diagnosis problem. In this section, we present the design
of hybrid systems that employ evolutionary algorithms aswell as classification techniques to classify diseases based ondata. A few hybrid systems have been developed to optimizethe parameters of the classifiers [69, 70]; however, the pre-mises of such classifiers are different application domains.
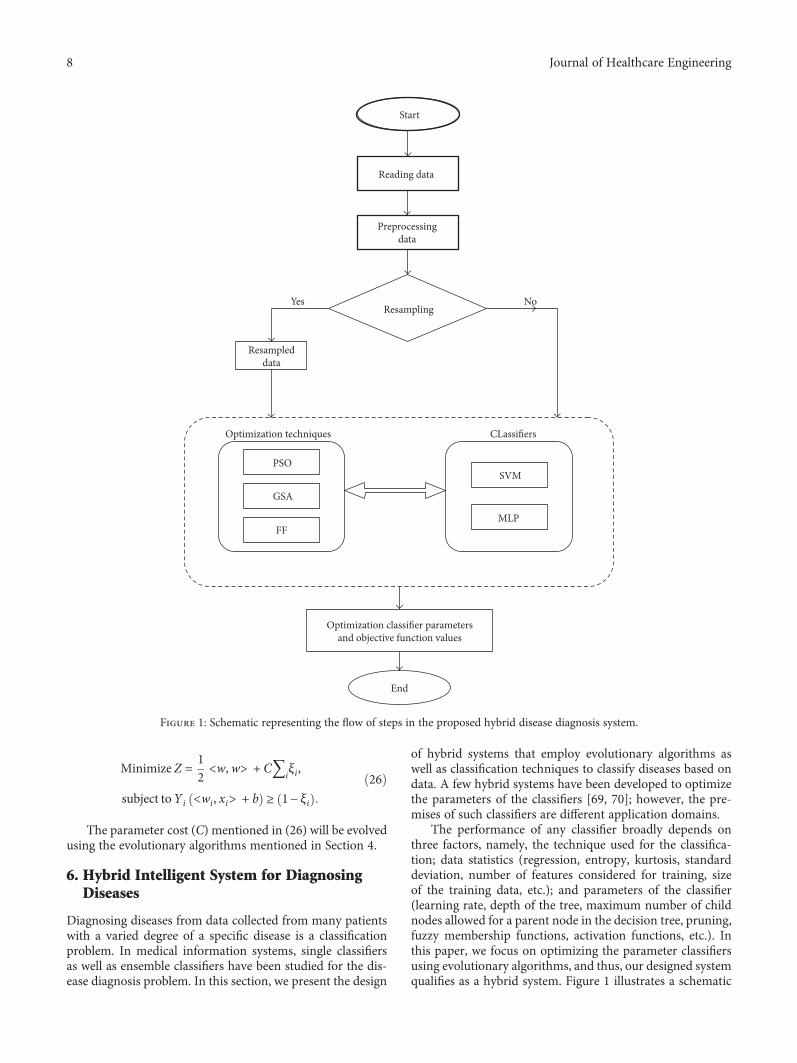
The performance of any classifier broadly depends onthree factors, namely, the technique used for the classifica-tion; data statistics (regression, entropy, kurtosis, standarddeviation, number of features considered for training, sizeof the training data, etc.); and parameters of the classifier(learning rate, depth of the tree, maximum number of childnodes allowed for a parent node in the decision tree, pruning,fuzzy membership functions, activation functions, etc.). Inthis paper, we focus on optimizing the parameter classifiersusing evolutionary algorithms, and thus, our designed systemqualifies as a hybrid system. Figure 1 illustrates a schematic
Start
Reading data
Resampling
Optimization techniques
PSOSVM
MLP
End
Optimization classi�er parametersand objective function values
CLassi�ers
GSA
FF
Resampleddata
Yes No
Preprocessingdata
Figure 1: Schematic representing the flow of steps in the proposed hybrid disease diagnosis system.
8 Journal of Healthcare Engineering
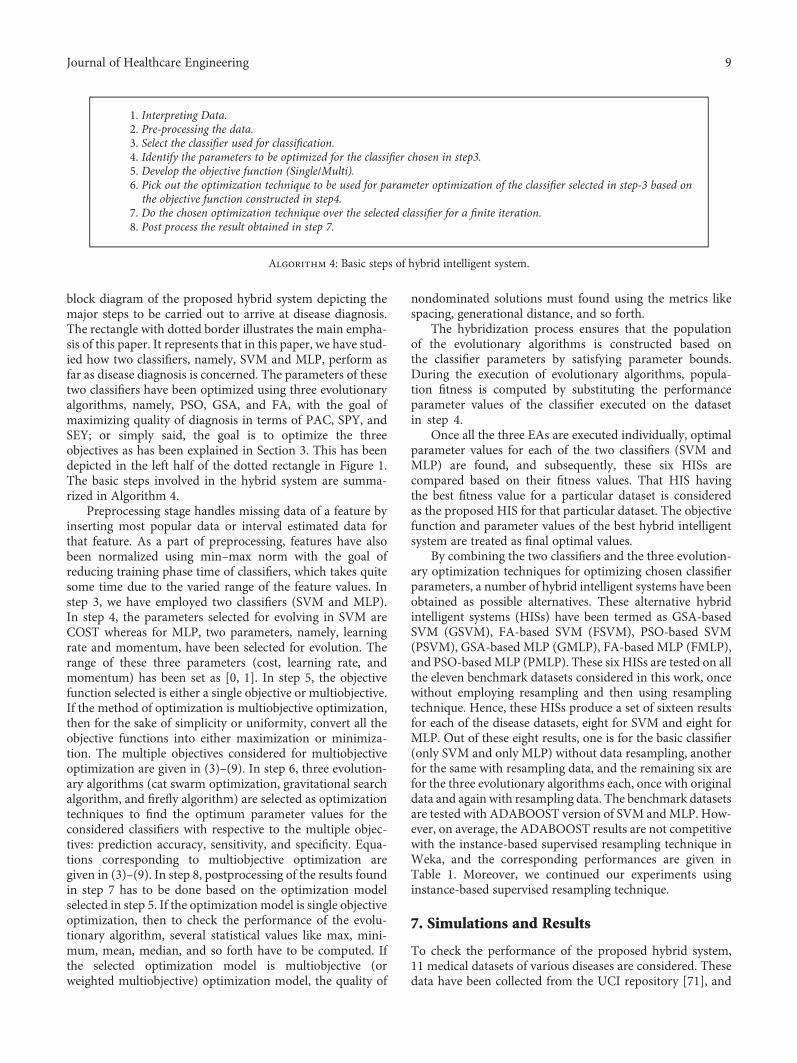
block diagram of the proposed hybrid system depicting themajor steps to be carried out to arrive at disease diagnosis.The rectangle with dotted border illustrates the main empha-sis of this paper. It represents that in this paper, we have stud-ied how two classifiers, namely, SVM and MLP, perform asfar as disease diagnosis is concerned. The parameters of thesetwo classifiers have been optimized using three evolutionaryalgorithms, namely, PSO, GSA, and FA, with the goal ofmaximizing quality of diagnosis in terms of PAC, SPY, andSEY; or simply said, the goal is to optimize the threeobjectives as has been explained in Section 3. This has beendepicted in the left half of the dotted rectangle in Figure 1.The basic steps involved in the hybrid system are summa-rized in Algorithm 4.
Preprocessing stage handles missing data of a feature byinserting most popular data or interval estimated data forthat feature. As a part of preprocessing, features have alsobeen normalized using min–max norm with the goal ofreducing training phase time of classifiers, which takes quitesome time due to the varied range of the feature values. Instep 3, we have employed two classifiers (SVM and MLP).In step 4, the parameters selected for evolving in SVM areCOST whereas for MLP, two parameters, namely, learningrate and momentum, have been selected for evolution. Therange of these three parameters (cost, learning rate, andmomentum) has been set as [0, 1]. In step 5, the objectivefunction selected is either a single objective or multiobjective.If the method of optimization is multiobjective optimization,then for the sake of simplicity or uniformity, convert all theobjective functions into either maximization or minimiza-tion. The multiple objectives considered for multiobjectiveoptimization are given in (3)–(9). In step 6, three evolution-ary algorithms (cat swarm optimization, gravitational searchalgorithm, and firefly algorithm) are selected as optimizationtechniques to find the optimum parameter values for theconsidered classifiers with respective to the multiple objec-tives: prediction accuracy, sensitivity, and specificity. Equa-tions corresponding to multiobjective optimization aregiven in (3)–(9). In step 8, postprocessing of the results foundin step 7 has to be done based on the optimization modelselected in step 5. If the optimization model is single objectiveoptimization, then to check the performance of the evolu-tionary algorithm, several statistical values like max, mini-mum, mean, median, and so forth have to be computed. Ifthe selected optimization model is multiobjective (orweighted multiobjective) optimization model, the quality of
nondominated solutions must found using the metrics likespacing, generational distance, and so forth.
The hybridization process ensures that the populationof the evolutionary algorithms is constructed based onthe classifier parameters by satisfying parameter bounds.During the execution of evolutionary algorithms, popula-tion fitness is computed by substituting the performanceparameter values of the classifier executed on the datasetin step 4.
Once all the three EAs are executed individually, optimalparameter values for each of the two classifiers (SVM andMLP) are found, and subsequently, these six HISs arecompared based on their fitness values. That HIS havingthe best fitness value for a particular dataset is consideredas the proposed HIS for that particular dataset. The objectivefunction and parameter values of the best hybrid intelligentsystem are treated as final optimal values.
By combining the two classifiers and the three evolution-ary optimization techniques for optimizing chosen classifierparameters, a number of hybrid intelligent systems have beenobtained as possible alternatives. These alternative hybridintelligent systems (HISs) have been termed as GSA-basedSVM (GSVM), FA-based SVM (FSVM), PSO-based SVM(PSVM), GSA-based MLP (GMLP), FA-based MLP (FMLP),and PSO-basedMLP (PMLP). These six HISs are tested on allthe eleven benchmark datasets considered in this work, oncewithout employing resampling and then using resamplingtechnique. Hence, these HISs produce a set of sixteen resultsfor each of the disease datasets, eight for SVM and eight forMLP. Out of these eight results, one is for the basic classifier(only SVM and only MLP) without data resampling, anotherfor the same with resampling data, and the remaining six arefor the three evolutionary algorithms each, once with originaldata and again with resampling data. The benchmark datasetsare tested with ADABOOST version of SVM andMLP. How-ever, on average, the ADABOOST results are not competitivewith the instance-based supervised resampling technique inWeka, and the corresponding performances are given inTable 1. Moreover, we continued our experiments usinginstance-based supervised resampling technique.
7. Simulations and Results
To check the performance of the proposed hybrid system,11 medical datasets of various diseases are considered. Thesedata have been collected from the UCI repository [71], and
1. Interpreting Data.2. Pre-processing the data.3. Select the classifier used for classification.4. Identify the parameters to be optimized for the classifier chosen in step3.5. Develop the objective function (Single/Multi).6. Pick out the optimization technique to be used for parameter optimization of the classifier selected in step-3 based on
the objective function constructed in step4.7. Do the chosen optimization technique over the selected classifier for a finite iteration.8. Post process the result obtained in step 7.
Algorithm 4: Basic steps of hybrid intelligent system.
9Journal of Healthcare Engineering
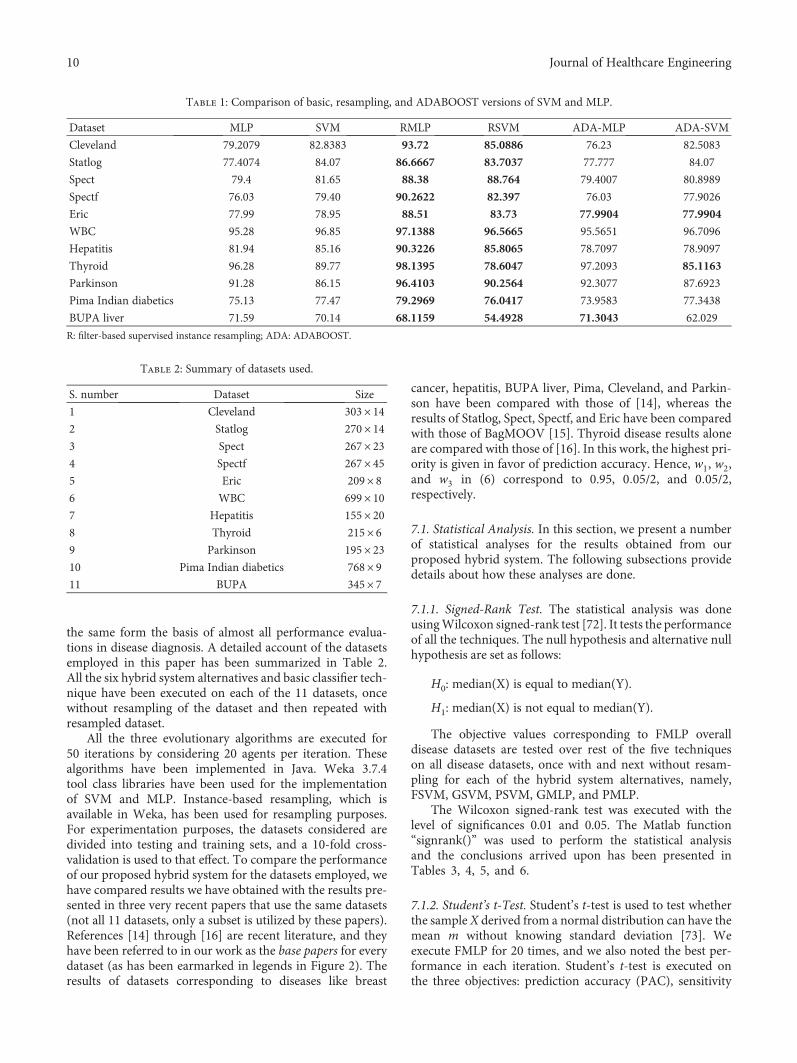
the same form the basis of almost all performance evalua-tions in disease diagnosis. A detailed account of the datasetsemployed in this paper has been summarized in Table 2.All the six hybrid system alternatives and basic classifier tech-nique have been executed on each of the 11 datasets, oncewithout resampling of the dataset and then repeated withresampled dataset.
All the three evolutionary algorithms are executed for50 iterations by considering 20 agents per iteration. Thesealgorithms have been implemented in Java. Weka 3.7.4tool class libraries have been used for the implementationof SVM and MLP. Instance-based resampling, which isavailable in Weka, has been used for resampling purposes.For experimentation purposes, the datasets considered aredivided into testing and training sets, and a 10-fold cross-validation is used to that effect. To compare the performanceof our proposed hybrid system for the datasets employed, wehave compared results we have obtained with the results pre-sented in three very recent papers that use the same datasets(not all 11 datasets, only a subset is utilized by these papers).References [14] through [16] are recent literature, and theyhave been referred to in our work as the base papers for everydataset (as has been earmarked in legends in Figure 2). Theresults of datasets corresponding to diseases like breast
cancer, hepatitis, BUPA liver, Pima, Cleveland, and Parkin-son have been compared with those of [14], whereas theresults of Statlog, Spect, Spectf, and Eric have been comparedwith those of BagMOOV [15]. Thyroid disease results aloneare compared with those of [16]. In this work, the highest pri-ority is given in favor of prediction accuracy. Hence, w1, w2,and w3 in (6) correspond to 0.95, 0 05/2, and 0 05/2,respectively.
7.1. Statistical Analysis. In this section, we present a numberof statistical analyses for the results obtained from ourproposed hybrid system. The following subsections providedetails about how these analyses are done.
7.1.1. Signed-Rank Test. The statistical analysis was doneusingWilcoxon signed-rank test [72]. It tests the performanceof all the techniques. The null hypothesis and alternative nullhypothesis are set as follows:
H0: median(X) is equal to median(Y).
H1: median(X) is not equal to median(Y).
The objective values corresponding to FMLP overalldisease datasets are tested over rest of the five techniqueson all disease datasets, once with and next without resam-pling for each of the hybrid system alternatives, namely,FSVM, GSVM, PSVM, GMLP, and PMLP.
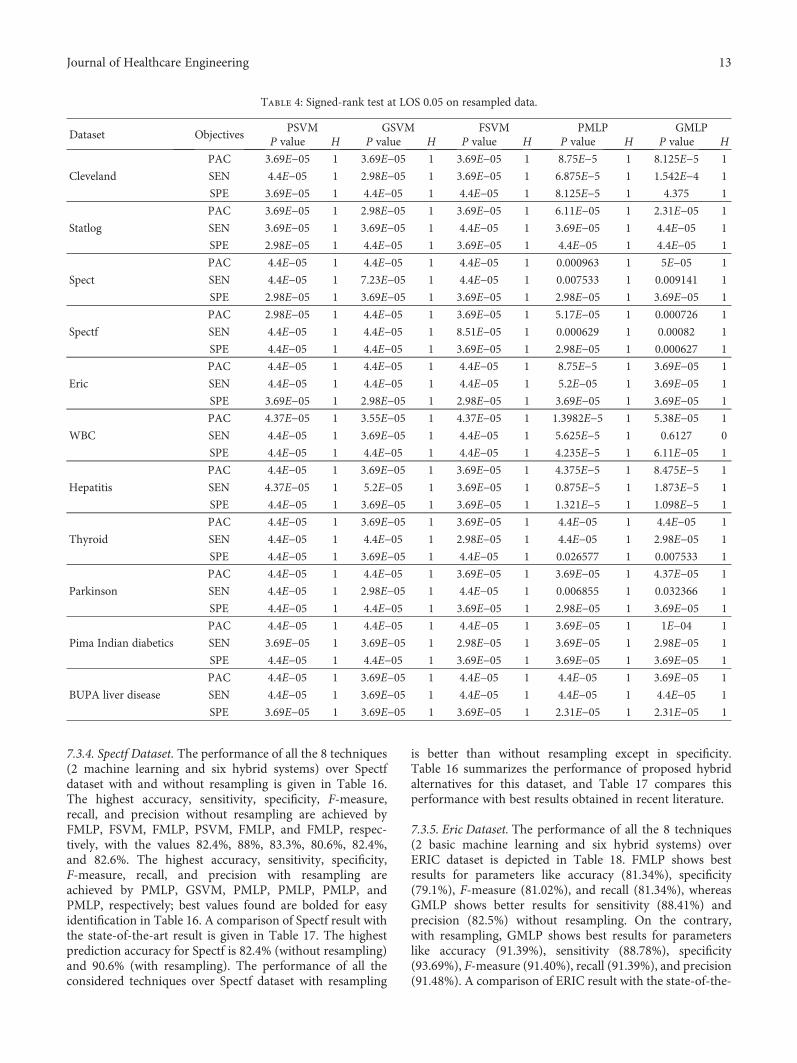
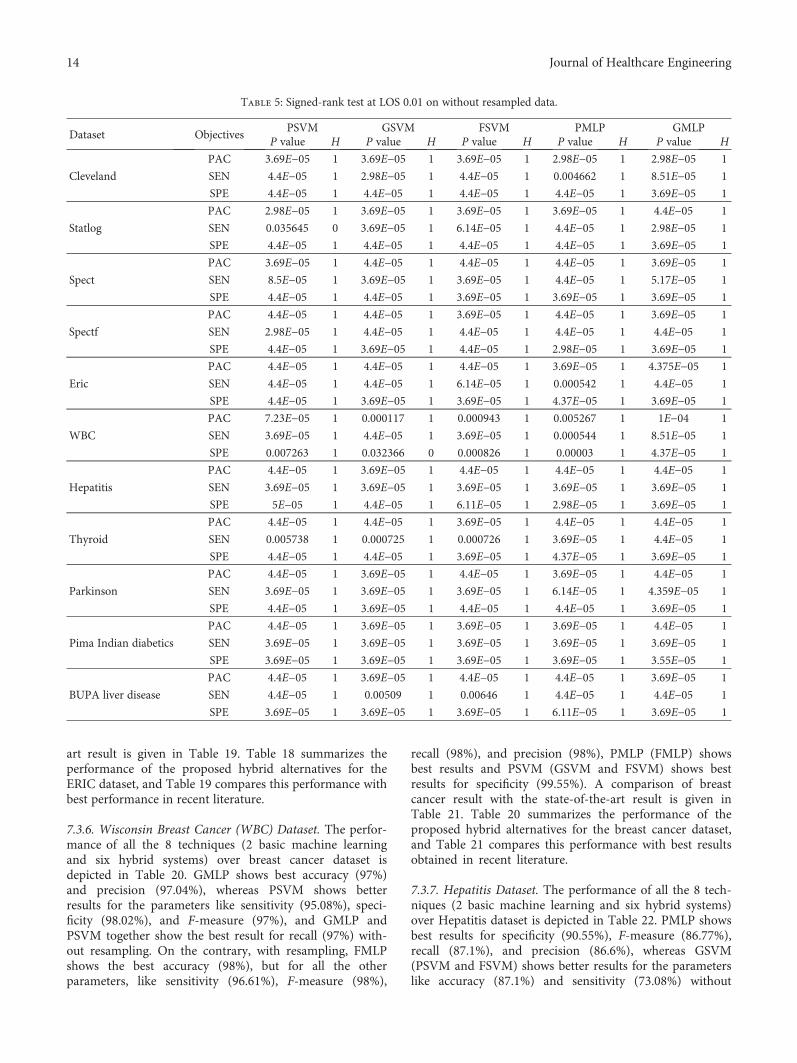
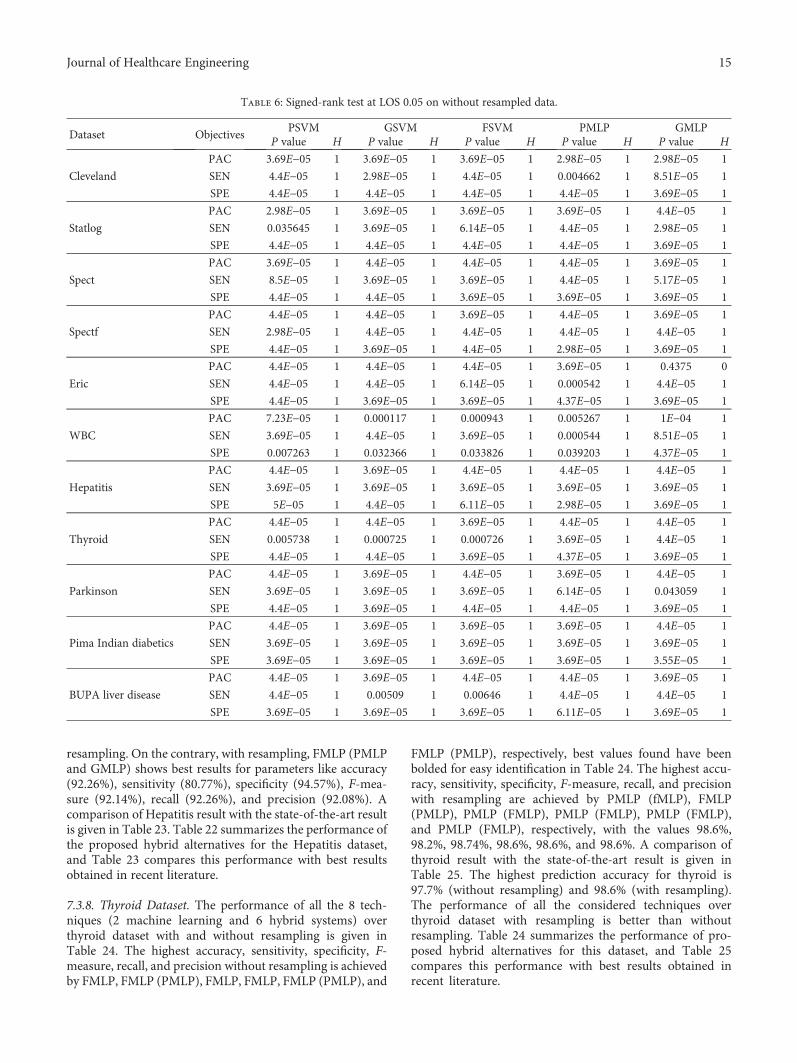
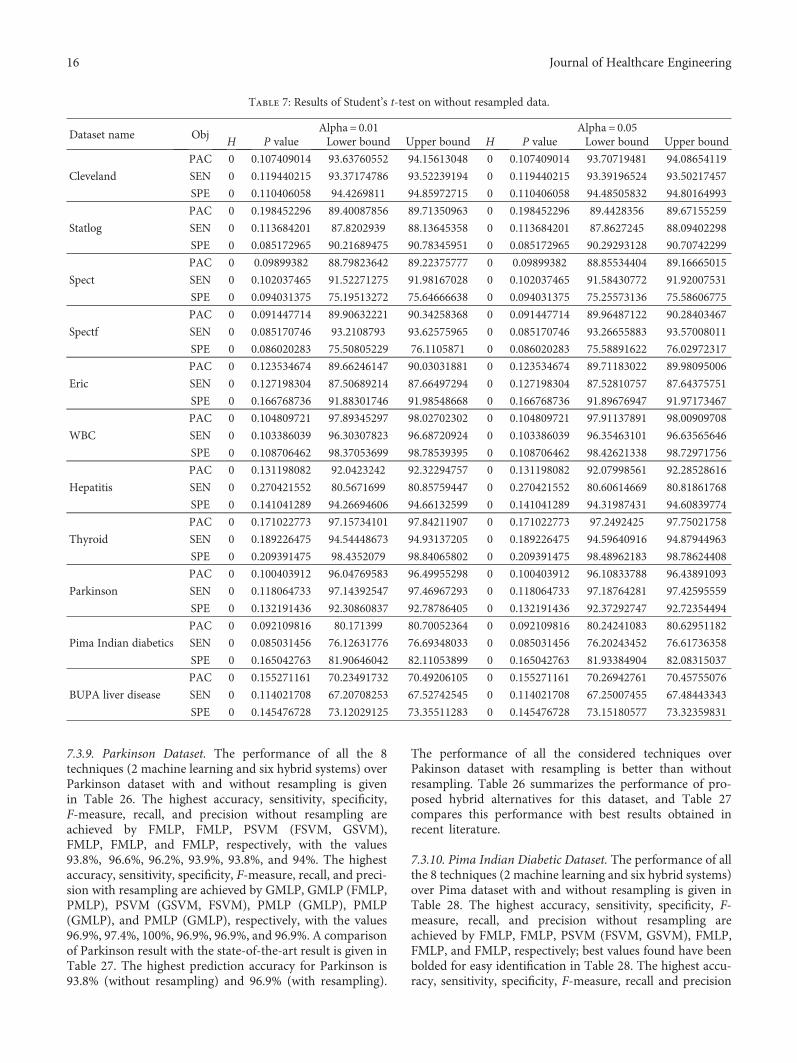
The Wilcoxon signed-rank test was executed with thelevel of significances 0.01 and 0.05. The Matlab function“signrank()” was used to perform the statistical analysisand the conclusions arrived upon has been presented inTables 3, 4, 5, and 6.
7.1.2. Student’s t-Test. Student’s t-test is used to test whetherthe sample X derived from a normal distribution can have themean m without knowing standard deviation [73]. Weexecute FMLP for 20 times, and we also noted the best per-formance in each iteration. Student’s t-test is executed onthe three objectives: prediction accuracy (PAC), sensitivity
Table 1: Comparison of basic, resampling, and ADABOOST versions of SVM and MLP.
Dataset MLP SVM RMLP RSVM ADA-MLP ADA-SVM
Cleveland 79.2079 82.8383 93.72 85.0886 76.23 82.5083
Statlog 77.4074 84.07 86.6667 83.7037 77.777 84.07
Spect 79.4 81.65 88.38 88.764 79.4007 80.8989
Spectf 76.03 79.40 90.2622 82.397 76.03 77.9026
Eric 77.99 78.95 88.51 83.73 77.9904 77.9904
WBC 95.28 96.85 97.1388 96.5665 95.5651 96.7096
Hepatitis 81.94 85.16 90.3226 85.8065 78.7097 78.9097
Thyroid 96.28 89.77 98.1395 78.6047 97.2093 85.1163
Parkinson 91.28 86.15 96.4103 90.2564 92.3077 87.6923
Pima Indian diabetics 75.13 77.47 79.2969 76.0417 73.9583 77.3438
BUPA liver 71.59 70.14 68.1159 54.4928 71.3043 62.029
R: filter-based supervised instance resampling; ADA: ADABOOST.
Table 2: Summary of datasets used.
S. number Dataset Size
1 Cleveland 303× 142 Statlog 270× 143 Spect 267× 234 Spectf 267× 455 Eric 209× 86 WBC 699× 107 Hepatitis 155× 208 Thyroid 215× 69 Parkinson 195× 2310 Pima Indian diabetics 768× 911 BUPA 345× 7
10 Journal of Healthcare Engineering
(SEN), and specificity (SPE). Null hypothesis and alternativehypothesis are set as follows:
H0: μX=m, H1: μX≠m.
Student’s t-test is performed by using ttest() func-tion available in MATLAB. The performance of this testfor various parameter values has been summarized inTables 7 and 8.
7.2. Performance Metrics. The important distinct goals ofmultiobjective optimization are (1) finding solutions asclose to the Pareto-optimal solutions as possible and (2)finding solutions as diverse as possible in the obtainednondominated front. In this work, to test the first goalis tested using generational distance (GD) and the sec-ond target is tested by computing spacing [58]. In themetric computation, two sets are used, namely, Q andP∗, where Q is the Pareto front found by test algorithmand P∗ is the subset of true Pareto-optimal members.Before computing these metrics, the data in Q is to benormalized since various objective functions will havedifferent ranges.
Generational distance (GD): Veldhuizen introduces thismetric in the year 1990 [74]. This metric finds an averagedistance between the members of Q and P∗ as follows:
GD = ∑ Qi=1d
pi
1/p/ Q . For p = 2, the parameter di is the
Euclidean distance between the members of Q and the
nearest member of P∗: di =min P∗
k=1 ∑Mm=1 f im − f ∗ k
m
2,
where f ∗ km is the mth objective function value of the kth
member of P∗. An algorithm having a small value of GD isbetter. The members in P∗ are having a maximum value forat least one objective function.
Spacing (SP): Schott introduces this metric in theyear 1995 [75]. This metric finds the standard deviationof different di values. It can be calculated as follows: S =
1/ Q ∑ Qi=1 di − d
2, where di =mink∈Q∩k≠i∑Mm=1 f im − f km
and d is the mean value of di’s. A good algorithm will behaving a minimal SP value. The set Q is caught by executingFMLP for 50 iterations with each iteration having 20 agents.In every iteration, the Pareto fronts are stored in externalmemory. The metrics for GD and SP for all the three objec-tives with and without resampling are given in Table 9.
7.3. Results and Discussion. The best values found in all thehybrid systems are discussed as follows.
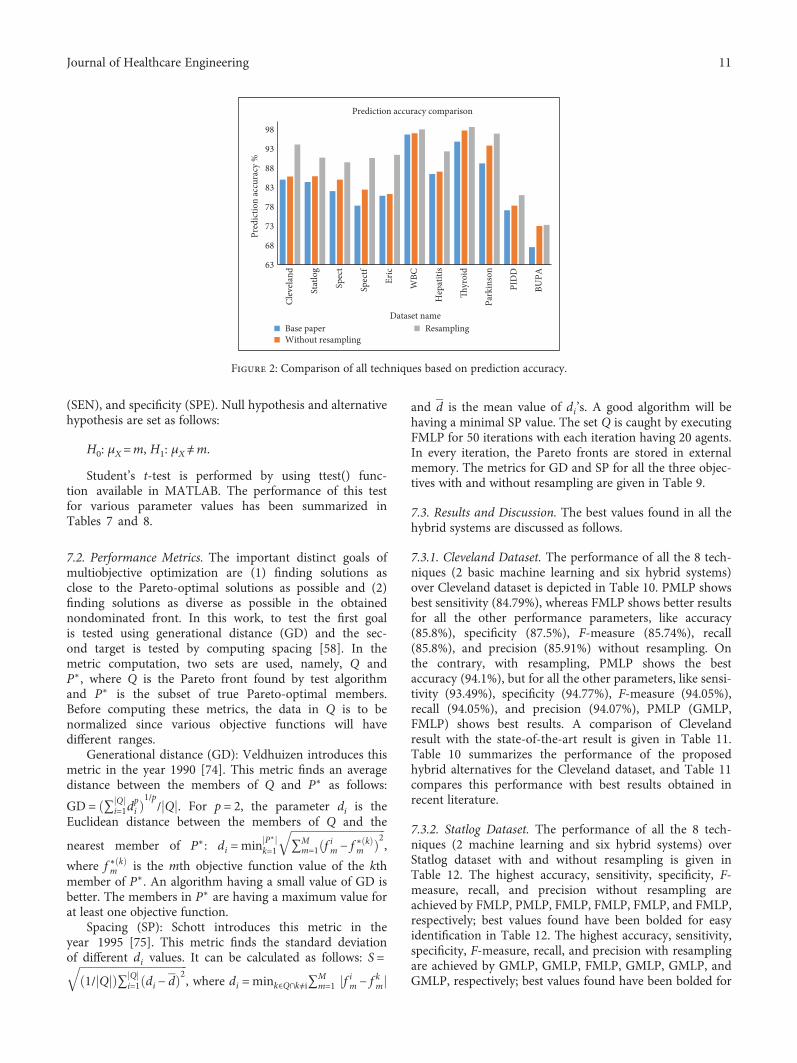
7.3.1. Cleveland Dataset. The performance of all the 8 tech-niques (2 basic machine learning and six hybrid systems)over Cleveland dataset is depicted in Table 10. PMLP showsbest sensitivity (84.79%), whereas FMLP shows better resultsfor all the other performance parameters, like accuracy(85.8%), specificity (87.5%), F-measure (85.74%), recall(85.8%), and precision (85.91%) without resampling. Onthe contrary, with resampling, PMLP shows the bestaccuracy (94.1%), but for all the other parameters, like sensi-tivity (93.49%), specificity (94.77%), F-measure (94.05%),recall (94.05%), and precision (94.07%), PMLP (GMLP,FMLP) shows best results. A comparison of Clevelandresult with the state-of-the-art result is given in Table 11.Table 10 summarizes the performance of the proposedhybrid alternatives for the Cleveland dataset, and Table 11compares this performance with best results obtained inrecent literature.
7.3.2. Statlog Dataset. The performance of all the 8 tech-niques (2 machine learning and six hybrid systems) overStatlog dataset with and without resampling is given inTable 12. The highest accuracy, sensitivity, specificity, F-measure, recall, and precision without resampling areachieved by FMLP, PMLP, FMLP, FMLP, FMLP, and FMLP,respectively; best values found have been bolded for easyidentification in Table 12. The highest accuracy, sensitivity,specificity, F-measure, recall, and precision with resamplingare achieved by GMLP, GMLP, FMLP, GMLP, GMLP, andGMLP, respectively; best values found have been bolded for
63
Clev
elan
d
Spec
t
Stat
log
Spec
tf
Eric
WBC
Hep
atiti
s
Thyr
oid
Park
inso
n
PID
D
BUPA
68
73
78
83
88
93
98
Pred
ictio
n ac
cura
cy %
Dataset name
Prediction accuracy comparison
Base paperWithout resampling
Resampling
Figure 2: Comparison of all techniques based on prediction accuracy.
11Journal of Healthcare Engineering

easy identification in Table 12. A comparison of Statlogresult with the state-of-the-art result is given inTable 13. The highest prediction accuracy for Statlog is85.9% (without resampling) and 90.7 (with resampling).The performance of all the considered techniques overStatlog dataset with resampling is better than withoutresampling. Table 12 summarizes the performance of pro-posed hybrid alternatives for this dataset, and Table 13compares this performance with best results obtained inrecent literature.
7.3.3. Spect Dataset. The performance of all the 8 techniques(2 machine learning and six hybrid systems) over Spectdataset with and without resampling is given in Table 14.The highest accuracy, sensitivity, specificity, F-measure,recall, and precision without resampling are achieved by
FMLP, FSVM, FMLP, FMLP, FMLP, and FMLP, respec-tively, with the values 85%, 88.4%, 74.2%, 83.3%, 85%, and83.9%. The highest accuracy, sensitivity, specificity, F-mea-sure, recall, and precision with resampling are achieved byGMLP (PMLP), GMLP (FMLP, PMLP), GMLP (PMLP),PMLP (GMLP), GMLP (PMLP), and GMLP (PMLP),respectively, with the values 89.5%, 91.9%, 77.3%, 89.2%,89.5%, and 89.1%. A comparison of Spect result with thestate-of-the-art result is given in Table 15. The highestprediction accuracy for Spect is 85% (without resampling)and 89.5 (with resampling). The performance of all theconsidered techniques over Spect dataset with resampling isbetter than without resampling. Table 14 summarizes theperformance of proposed hybrid alternatives for this dataset,and Table 15 compares this performance with best resultsobtained in recent literature.
Table 3: Signed-rank test at LOS 0.01 on resampled data.
Dataset ObjectivesPSVM GSVM FSVM PMLP GMLP
P value H P value H P value H P value H P value H
Cleveland
PAC 3.69E−05 1 3.69E−05 1 3.69E−05 1 8.75E−05 1 8.125E−5 1
SEN 4.4E−05 1 2.98E−05 1 3.69E−05 1 6.875E−5 1 1.13E−5 1
SPE 3.69E−05 1 4.4E−05 1 4.4E−05 1 8.125E−5 1 4.375E−5 1
Statlog
PAC 3.69E−05 1 2.98E−05 1 3.69E−05 1 6.11E−05 1 2.31E−05 1
SEN 3.69E−05 1 3.69E−05 1 4.4E−05 1 3.69E−05 1 4.4E−05 1
SPE 2.98E−05 1 4.4E−05 1 3.69E−05 1 4.4E−05 1 4.4E−05 1
Spect
PAC 4.4E−05 1 4.4E−05 1 4.4E−05 1 0.000963 1 5E−05 1
SEN 4.4E−05 1 7.23E−05 1 4.4E−05 1 0.007533 1 0.009141 1
SPE 2.98E−05 1 3.69E−05 1 3.69E−05 1 2.98E−05 1 3.69E−05 1
Spectf
PAC 2.98E−05 1 4.4E−05 1 3.69E−05 1 5.17E−05 1 0.000726 1
SEN 4.4E−05 1 4.4E−05 1 8.51E−05 1 0.000629 1 0.00082 1
SPE 4.4E−05 1 4.4E−05 1 3.69E−05 1 2.98E−05 1 0.000627 1
Eric
PAC 4.4E−05 1 4.4E−05 1 4.4E−05 1 0.875 0 3.69E−05 1
SEN 4.4E−05 1 4.4E−05 1 4.4E−05 1 5.2E−05 1 3.69E−05 1
SPE 3.69E−05 1 2.98E−05 1 2.98E−05 1 3.69E−05 1 3.69E−05 1
WBC
PAC 4.37E−05 1 3.55E−05 1 4.37E−05 1 1 0 5E−05 1
SEN 4.4E−05 1 3.69E−05 1 4.4E−05 1 0.5625 0 0.006127 1
SPE 4.4E−05 1 4.4E−05 1 4.4E−05 1 0.4375 0 6.11E−05 1
Hepatitis
PAC 4.4E−05 1 3.69E−05 1 3.69E−05 1 0.4375 0 8.4375 1
SEN 4.37E−05 1 5.2E−05 1 3.69E−05 1 8.75E−6 1 5.7126E−5 1
SPE 4.4E−05 1 3.69E−05 1 3.69E−05 1 1.15E−5 1 2.3123E−5 1
Thyroid
PAC 4.4E−05 1 3.69E−05 1 3.69E−05 1 4.4E−05 1 4.4E−05 1
SEN 4.4E−05 1 4.4E−05 1 2.98E−05 1 4.4E−05 1 2.98E−05 1
SPE 4.4E−05 1 3.69E−05 1 4.4E−05 1 6.577E−5 1 0.007533 1
Parkinson
PAC 4.4E−05 1 4.4E−05 1 3.69E−05 1 3.69E−05 1 4.37E−05 1
SEN 4.4E−05 1 2.98E−05 1 4.4E−05 1 0.006855 1 3.2366E−5 1
SPE 4.4E−05 1 4.4E−05 1 3.69E−05 1 2.98E−05 1 3.69E−05 1
Pima Indian diabetics
PAC 4.4E−05 1 4.4E−05 1 4.4E−05 1 3.69E−05 1 1E−04 1
SEN 3.69E−05 1 3.69E−05 1 2.98E−05 1 3.69E−05 1 2.98E−05 1
SPE 4.4E−05 1 4.4E−05 1 3.69E−05 1 3.69E−05 1 3.69E−05 1
BUPA liver disease
PAC 4.4E−05 1 3.69E−05 1 4.4E−05 1 4.4E−05 1 3.69E−05 1
SEN 4.4E−05 1 3.69E−05 1 4.4E−05 1 4.4E−05 1 4.4E−05 1
SPE 3.69E−05 1 3.69E−05 1 3.69E−05 1 2.31E−05 1 2.31E−05 1
12 Journal of Healthcare Engineering
7.3.4. Spectf Dataset. The performance of all the 8 techniques(2 machine learning and six hybrid systems) over Spectfdataset with and without resampling is given in Table 16.The highest accuracy, sensitivity, specificity, F-measure,recall, and precision without resampling are achieved byFMLP, FSVM, FMLP, PSVM, FMLP, and FMLP, respec-tively, with the values 82.4%, 88%, 83.3%, 80.6%, 82.4%,and 82.6%. The highest accuracy, sensitivity, specificity,F-measure, recall, and precision with resampling areachieved by PMLP, GSVM, PMLP, PMLP, PMLP, andPMLP, respectively; best values found are bolded for easyidentification in Table 16. A comparison of Spectf result withthe state-of-the-art result is given in Table 17. The highestprediction accuracy for Spectf is 82.4% (without resampling)and 90.6% (with resampling). The performance of all theconsidered techniques over Spectf dataset with resampling
is better than without resampling except in specificity.Table 16 summarizes the performance of proposed hybridalternatives for this dataset, and Table 17 compares thisperformance with best results obtained in recent literature.
7.3.5. Eric Dataset. The performance of all the 8 techniques(2 basic machine learning and six hybrid systems) overERIC dataset is depicted in Table 18. FMLP shows bestresults for parameters like accuracy (81.34%), specificity(79.1%), F-measure (81.02%), and recall (81.34%), whereasGMLP shows better results for sensitivity (88.41%) andprecision (82.5%) without resampling. On the contrary,with resampling, GMLP shows best results for parameterslike accuracy (91.39%), sensitivity (88.78%), specificity(93.69%), F-measure (91.40%), recall (91.39%), and precision(91.48%). A comparison of ERIC result with the state-of-the-
Table 4: Signed-rank test at LOS 0.05 on resampled data.
Dataset ObjectivesPSVM GSVM FSVM PMLP GMLP
P value H P value H P value H P value H P value H
Cleveland
PAC 3.69E−05 1 3.69E−05 1 3.69E−05 1 8.75E−5 1 8.125E−5 1
SEN 4.4E−05 1 2.98E−05 1 3.69E−05 1 6.875E−5 1 1.542E−4 1
SPE 3.69E−05 1 4.4E−05 1 4.4E−05 1 8.125E−5 1 4.375 1
Statlog
PAC 3.69E−05 1 2.98E−05 1 3.69E−05 1 6.11E−05 1 2.31E−05 1
SEN 3.69E−05 1 3.69E−05 1 4.4E−05 1 3.69E−05 1 4.4E−05 1
SPE 2.98E−05 1 4.4E−05 1 3.69E−05 1 4.4E−05 1 4.4E−05 1
Spect
PAC 4.4E−05 1 4.4E−05 1 4.4E−05 1 0.000963 1 5E−05 1
SEN 4.4E−05 1 7.23E−05 1 4.4E−05 1 0.007533 1 0.009141 1
SPE 2.98E−05 1 3.69E−05 1 3.69E−05 1 2.98E−05 1 3.69E−05 1
Spectf
PAC 2.98E−05 1 4.4E−05 1 3.69E−05 1 5.17E−05 1 0.000726 1
SEN 4.4E−05 1 4.4E−05 1 8.51E−05 1 0.000629 1 0.00082 1
SPE 4.4E−05 1 4.4E−05 1 3.69E−05 1 2.98E−05 1 0.000627 1
Eric
PAC 4.4E−05 1 4.4E−05 1 4.4E−05 1 8.75E−5 1 3.69E−05 1
SEN 4.4E−05 1 4.4E−05 1 4.4E−05 1 5.2E−05 1 3.69E−05 1
SPE 3.69E−05 1 2.98E−05 1 2.98E−05 1 3.69E−05 1 3.69E−05 1
WBC
PAC 4.37E−05 1 3.55E−05 1 4.37E−05 1 1.3982E−5 1 5.38E−05 1
SEN 4.4E−05 1 3.69E−05 1 4.4E−05 1 5.625E−5 1 0.6127 0
SPE 4.4E−05 1 4.4E−05 1 4.4E−05 1 4.235E−5 1 6.11E−05 1
Hepatitis
PAC 4.4E−05 1 3.69E−05 1 3.69E−05 1 4.375E−5 1 8.475E−5 1
SEN 4.37E−05 1 5.2E−05 1 3.69E−05 1 0.875E−5 1 1.873E−5 1
SPE 4.4E−05 1 3.69E−05 1 3.69E−05 1 1.321E−5 1 1.098E−5 1
Thyroid
PAC 4.4E−05 1 3.69E−05 1 3.69E−05 1 4.4E−05 1 4.4E−05 1
SEN 4.4E−05 1 4.4E−05 1 2.98E−05 1 4.4E−05 1 2.98E−05 1
SPE 4.4E−05 1 3.69E−05 1 4.4E−05 1 0.026577 1 0.007533 1
Parkinson
PAC 4.4E−05 1 4.4E−05 1 3.69E−05 1 3.69E−05 1 4.37E−05 1
SEN 4.4E−05 1 2.98E−05 1 4.4E−05 1 0.006855 1 0.032366 1
SPE 4.4E−05 1 4.4E−05 1 3.69E−05 1 2.98E−05 1 3.69E−05 1
Pima Indian diabetics
PAC 4.4E−05 1 4.4E−05 1 4.4E−05 1 3.69E−05 1 1E−04 1
SEN 3.69E−05 1 3.69E−05 1 2.98E−05 1 3.69E−05 1 2.98E−05 1
SPE 4.4E−05 1 4.4E−05 1 3.69E−05 1 3.69E−05 1 3.69E−05 1
BUPA liver disease
PAC 4.4E−05 1 3.69E−05 1 4.4E−05 1 4.4E−05 1 3.69E−05 1
SEN 4.4E−05 1 3.69E−05 1 4.4E−05 1 4.4E−05 1 4.4E−05 1
SPE 3.69E−05 1 3.69E−05 1 3.69E−05 1 2.31E−05 1 2.31E−05 1
13Journal of Healthcare Engineering
art result is given in Table 19. Table 18 summarizes theperformance of the proposed hybrid alternatives for theERIC dataset, and Table 19 compares this performance withbest performance in recent literature.
7.3.6. Wisconsin Breast Cancer (WBC) Dataset. The perfor-mance of all the 8 techniques (2 basic machine learningand six hybrid systems) over breast cancer dataset isdepicted in Table 20. GMLP shows best accuracy (97%)and precision (97.04%), whereas PSVM shows betterresults for the parameters like sensitivity (95.08%), speci-ficity (98.02%), and F-measure (97%), and GMLP andPSVM together show the best result for recall (97%) with-out resampling. On the contrary, with resampling, FMLPshows the best accuracy (98%), but for all the otherparameters, like sensitivity (96.61%), F-measure (98%),
recall (98%), and precision (98%), PMLP (FMLP) showsbest results and PSVM (GSVM and FSVM) shows bestresults for specificity (99.55%). A comparison of breastcancer result with the state-of-the-art result is given inTable 21. Table 20 summarizes the performance of theproposed hybrid alternatives for the breast cancer dataset,and Table 21 compares this performance with best resultsobtained in recent literature.
7.3.7. Hepatitis Dataset. The performance of all the 8 tech-niques (2 basic machine learning and six hybrid systems)over Hepatitis dataset is depicted in Table 22. PMLP showsbest results for specificity (90.55%), F-measure (86.77%),recall (87.1%), and precision (86.6%), whereas GSVM(PSVM and FSVM) shows better results for the parameterslike accuracy (87.1%) and sensitivity (73.08%) without
Table 5: Signed-rank test at LOS 0.01 on without resampled data.
Dataset ObjectivesPSVM GSVM FSVM PMLP GMLP
P value H P value H P value H P value H P value H
Cleveland
PAC 3.69E−05 1 3.69E−05 1 3.69E−05 1 2.98E−05 1 2.98E−05 1
SEN 4.4E−05 1 2.98E−05 1 4.4E−05 1 0.004662 1 8.51E−05 1
SPE 4.4E−05 1 4.4E−05 1 4.4E−05 1 4.4E−05 1 3.69E−05 1
Statlog
PAC 2.98E−05 1 3.69E−05 1 3.69E−05 1 3.69E−05 1 4.4E−05 1
SEN 0.035645 0 3.69E−05 1 6.14E−05 1 4.4E−05 1 2.98E−05 1
SPE 4.4E−05 1 4.4E−05 1 4.4E−05 1 4.4E−05 1 3.69E−05 1
Spect
PAC 3.69E−05 1 4.4E−05 1 4.4E−05 1 4.4E−05 1 3.69E−05 1
SEN 8.5E−05 1 3.69E−05 1 3.69E−05 1 4.4E−05 1 5.17E−05 1
SPE 4.4E−05 1 4.4E−05 1 3.69E−05 1 3.69E−05 1 3.69E−05 1
Spectf
PAC 4.4E−05 1 4.4E−05 1 3.69E−05 1 4.4E−05 1 3.69E−05 1
SEN 2.98E−05 1 4.4E−05 1 4.4E−05 1 4.4E−05 1 4.4E−05 1
SPE 4.4E−05 1 3.69E−05 1 4.4E−05 1 2.98E−05 1 3.69E−05 1
Eric
PAC 4.4E−05 1 4.4E−05 1 4.4E−05 1 3.69E−05 1 4.375E−05 1
SEN 4.4E−05 1 4.4E−05 1 6.14E−05 1 0.000542 1 4.4E−05 1
SPE 4.4E−05 1 3.69E−05 1 3.69E−05 1 4.37E−05 1 3.69E−05 1
WBC
PAC 7.23E−05 1 0.000117 1 0.000943 1 0.005267 1 1E−04 1
SEN 3.69E−05 1 4.4E−05 1 3.69E−05 1 0.000544 1 8.51E−05 1
SPE 0.007263 1 0.032366 0 0.000826 1 0.00003 1 4.37E−05 1
Hepatitis
PAC 4.4E−05 1 3.69E−05 1 4.4E−05 1 4.4E−05 1 4.4E−05 1
SEN 3.69E−05 1 3.69E−05 1 3.69E−05 1 3.69E−05 1 3.69E−05 1
SPE 5E−05 1 4.4E−05 1 6.11E−05 1 2.98E−05 1 3.69E−05 1
Thyroid
PAC 4.4E−05 1 4.4E−05 1 3.69E−05 1 4.4E−05 1 4.4E−05 1
SEN 0.005738 1 0.000725 1 0.000726 1 3.69E−05 1 4.4E−05 1
SPE 4.4E−05 1 4.4E−05 1 3.69E−05 1 4.37E−05 1 3.69E−05 1
Parkinson
PAC 4.4E−05 1 3.69E−05 1 4.4E−05 1 3.69E−05 1 4.4E−05 1
SEN 3.69E−05 1 3.69E−05 1 3.69E−05 1 6.14E−05 1 4.359E−05 1
SPE 4.4E−05 1 3.69E−05 1 4.4E−05 1 4.4E−05 1 3.69E−05 1
Pima Indian diabetics
PAC 4.4E−05 1 3.69E−05 1 3.69E−05 1 3.69E−05 1 4.4E−05 1
SEN 3.69E−05 1 3.69E−05 1 3.69E−05 1 3.69E−05 1 3.69E−05 1
SPE 3.69E−05 1 3.69E−05 1 3.69E−05 1 3.69E−05 1 3.55E−05 1
BUPA liver disease
PAC 4.4E−05 1 3.69E−05 1 4.4E−05 1 4.4E−05 1 3.69E−05 1
SEN 4.4E−05 1 0.00509 1 0.00646 1 4.4E−05 1 4.4E−05 1
SPE 3.69E−05 1 3.69E−05 1 3.69E−05 1 6.11E−05 1 3.69E−05 1
14 Journal of Healthcare Engineering
resampling. On the contrary, with resampling, FMLP (PMLPand GMLP) shows best results for parameters like accuracy(92.26%), sensitivity (80.77%), specificity (94.57%), F-mea-sure (92.14%), recall (92.26%), and precision (92.08%). Acomparison of Hepatitis result with the state-of-the-art resultis given in Table 23. Table 22 summarizes the performance ofthe proposed hybrid alternatives for the Hepatitis dataset,and Table 23 compares this performance with best resultsobtained in recent literature.
7.3.8. Thyroid Dataset. The performance of all the 8 tech-niques (2 machine learning and 6 hybrid systems) overthyroid dataset with and without resampling is given inTable 24. The highest accuracy, sensitivity, specificity, F-measure, recall, and precision without resampling is achievedby FMLP, FMLP (PMLP), FMLP, FMLP, FMLP (PMLP), and
FMLP (PMLP), respectively, best values found have beenbolded for easy identification in Table 24. The highest accu-racy, sensitivity, specificity, F-measure, recall, and precisionwith resampling are achieved by PMLP (fMLP), FMLP(PMLP), PMLP (FMLP), PMLP (FMLP), PMLP (FMLP),and PMLP (FMLP), respectively, with the values 98.6%,98.2%, 98.74%, 98.6%, 98.6%, and 98.6%. A comparison ofthyroid result with the state-of-the-art result is given inTable 25. The highest prediction accuracy for thyroid is97.7% (without resampling) and 98.6% (with resampling).The performance of all the considered techniques overthyroid dataset with resampling is better than withoutresampling. Table 24 summarizes the performance of pro-posed hybrid alternatives for this dataset, and Table 25compares this performance with best results obtained inrecent literature.
Table 6: Signed-rank test at LOS 0.05 on without resampled data.
Dataset ObjectivesPSVM GSVM FSVM PMLP GMLP
P value H P value H P value H P value H P value H
Cleveland
PAC 3.69E−05 1 3.69E−05 1 3.69E−05 1 2.98E−05 1 2.98E−05 1
SEN 4.4E−05 1 2.98E−05 1 4.4E−05 1 0.004662 1 8.51E−05 1
SPE 4.4E−05 1 4.4E−05 1 4.4E−05 1 4.4E−05 1 3.69E−05 1
Statlog
PAC 2.98E−05 1 3.69E−05 1 3.69E−05 1 3.69E−05 1 4.4E−05 1
SEN 0.035645 1 3.69E−05 1 6.14E−05 1 4.4E−05 1 2.98E−05 1
SPE 4.4E−05 1 4.4E−05 1 4.4E−05 1 4.4E−05 1 3.69E−05 1
Spect
PAC 3.69E−05 1 4.4E−05 1 4.4E−05 1 4.4E−05 1 3.69E−05 1
SEN 8.5E−05 1 3.69E−05 1 3.69E−05 1 4.4E−05 1 5.17E−05 1
SPE 4.4E−05 1 4.4E−05 1 3.69E−05 1 3.69E−05 1 3.69E−05 1
Spectf
PAC 4.4E−05 1 4.4E−05 1 3.69E−05 1 4.4E−05 1 3.69E−05 1
SEN 2.98E−05 1 4.4E−05 1 4.4E−05 1 4.4E−05 1 4.4E−05 1
SPE 4.4E−05 1 3.69E−05 1 4.4E−05 1 2.98E−05 1 3.69E−05 1
Eric
PAC 4.4E−05 1 4.4E−05 1 4.4E−05 1 3.69E−05 1 0.4375 0
SEN 4.4E−05 1 4.4E−05 1 6.14E−05 1 0.000542 1 4.4E−05 1
SPE 4.4E−05 1 3.69E−05 1 3.69E−05 1 4.37E−05 1 3.69E−05 1
WBC
PAC 7.23E−05 1 0.000117 1 0.000943 1 0.005267 1 1E−04 1
SEN 3.69E−05 1 4.4E−05 1 3.69E−05 1 0.000544 1 8.51E−05 1
SPE 0.007263 1 0.032366 1 0.033826 1 0.039203 1 4.37E−05 1
Hepatitis
PAC 4.4E−05 1 3.69E−05 1 4.4E−05 1 4.4E−05 1 4.4E−05 1
SEN 3.69E−05 1 3.69E−05 1 3.69E−05 1 3.69E−05 1 3.69E−05 1
SPE 5E−05 1 4.4E−05 1 6.11E−05 1 2.98E−05 1 3.69E−05 1
Thyroid
PAC 4.4E−05 1 4.4E−05 1 3.69E−05 1 4.4E−05 1 4.4E−05 1
SEN 0.005738 1 0.000725 1 0.000726 1 3.69E−05 1 4.4E−05 1
SPE 4.4E−05 1 4.4E−05 1 3.69E−05 1 4.37E−05 1 3.69E−05 1
Parkinson
PAC 4.4E−05 1 3.69E−05 1 4.4E−05 1 3.69E−05 1 4.4E−05 1
SEN 3.69E−05 1 3.69E−05 1 3.69E−05 1 6.14E−05 1 0.043059 1
SPE 4.4E−05 1 3.69E−05 1 4.4E−05 1 4.4E−05 1 3.69E−05 1
Pima Indian diabetics
PAC 4.4E−05 1 3.69E−05 1 3.69E−05 1 3.69E−05 1 4.4E−05 1
SEN 3.69E−05 1 3.69E−05 1 3.69E−05 1 3.69E−05 1 3.69E−05 1
SPE 3.69E−05 1 3.69E−05 1 3.69E−05 1 3.69E−05 1 3.55E−05 1
BUPA liver disease
PAC 4.4E−05 1 3.69E−05 1 4.4E−05 1 4.4E−05 1 3.69E−05 1
SEN 4.4E−05 1 0.00509 1 0.00646 1 4.4E−05 1 4.4E−05 1
SPE 3.69E−05 1 3.69E−05 1 3.69E−05 1 6.11E−05 1 3.69E−05 1
15Journal of Healthcare Engineering
7.3.9. Parkinson Dataset. The performance of all the 8techniques (2 machine learning and six hybrid systems) overParkinson dataset with and without resampling is givenin Table 26. The highest accuracy, sensitivity, specificity,F-measure, recall, and precision without resampling areachieved by FMLP, FMLP, PSVM (FSVM, GSVM),FMLP, FMLP, and FMLP, respectively, with the values93.8%, 96.6%, 96.2%, 93.9%, 93.8%, and 94%. The highestaccuracy, sensitivity, specificity, F-measure, recall, and preci-sion with resampling are achieved by GMLP, GMLP (FMLP,PMLP), PSVM (GSVM, FSVM), PMLP (GMLP), PMLP(GMLP), and PMLP (GMLP), respectively, with the values96.9%, 97.4%, 100%, 96.9%, 96.9%, and 96.9%. A comparisonof Parkinson result with the state-of-the-art result is given inTable 27. The highest prediction accuracy for Parkinson is93.8% (without resampling) and 96.9% (with resampling).
The performance of all the considered techniques overPakinson dataset with resampling is better than withoutresampling. Table 26 summarizes the performance of pro-posed hybrid alternatives for this dataset, and Table 27compares this performance with best results obtained inrecent literature.
7.3.10. Pima Indian Diabetic Dataset. The performance of allthe 8 techniques (2 machine learning and six hybrid systems)over Pima dataset with and without resampling is given inTable 28. The highest accuracy, sensitivity, specificity, F-measure, recall, and precision without resampling areachieved by FMLP, FMLP, PSVM (FSVM, GSVM), FMLP,FMLP, and FMLP, respectively; best values found have beenbolded for easy identification in Table 28. The highest accu-racy, sensitivity, specificity, F-measure, recall and precision
Table 7: Results of Student’s t-test on without resampled data.
Dataset name ObjAlpha = 0.01 Alpha = 0.05
H P value Lower bound Upper bound H P value Lower bound Upper bound
Cleveland
PAC 0 0.107409014 93.63760552 94.15613048 0 0.107409014 93.70719481 94.08654119
SEN 0 0.119440215 93.37174786 93.52239194 0 0.119440215 93.39196524 93.50217457
SPE 0 0.110406058 94.4269811 94.85972715 0 0.110406058 94.48505832 94.80164993
Statlog
PAC 0 0.198452296 89.40087856 89.71350963 0 0.198452296 89.4428356 89.67155259
SEN 0 0.113684201 87.8202939 88.13645358 0 0.113684201 87.8627245 88.09402298
SPE 0 0.085172965 90.21689475 90.78345951 0 0.085172965 90.29293128 90.70742299
Spect
PAC 0 0.09899382 88.79823642 89.22375777 0 0.09899382 88.85534404 89.16665015
SEN 0 0.102037465 91.52271275 91.98167028 0 0.102037465 91.58430772 91.92007531
SPE 0 0.094031375 75.19513272 75.64666638 0 0.094031375 75.25573136 75.58606775
Spectf
PAC 0 0.091447714 89.90632221 90.34258368 0 0.091447714 89.96487122 90.28403467
SEN 0 0.085170746 93.2108793 93.62575965 0 0.085170746 93.26655883 93.57008011
SPE 0 0.086020283 75.50805229 76.1105871 0 0.086020283 75.58891622 76.02972317
Eric
PAC 0 0.123534674 89.66246147 90.03031881 0 0.123534674 89.71183022 89.98095006
SEN 0 0.127198304 87.50689214 87.66497294 0 0.127198304 87.52810757 87.64375751
SPE 0 0.166768736 91.88301746 91.98548668 0 0.166768736 91.89676947 91.97173467
WBC
PAC 0 0.104809721 97.89345297 98.02702302 0 0.104809721 97.91137891 98.00909708
SEN 0 0.103386039 96.30307823 96.68720924 0 0.103386039 96.35463101 96.63565646
SPE 0 0.108706462 98.37053699 98.78539395 0 0.108706462 98.42621338 98.72971756
Hepatitis
PAC 0 0.131198082 92.0423242 92.32294757 0 0.131198082 92.07998561 92.28528616
SEN 0 0.270421552 80.5671699 80.85759447 0 0.270421552 80.60614669 80.81861768
SPE 0 0.141041289 94.26694606 94.66132599 0 0.141041289 94.31987431 94.60839774
Thyroid
PAC 0 0.171022773 97.15734101 97.84211907 0 0.171022773 97.2492425 97.75021758
SEN 0 0.189226475 94.54448673 94.93137205 0 0.189226475 94.59640916 94.87944963
SPE 0 0.209391475 98.4352079 98.84065802 0 0.209391475 98.48962183 98.78624408
Parkinson
PAC 0 0.100403912 96.04769583 96.49955298 0 0.100403912 96.10833788 96.43891093
SEN 0 0.118064733 97.14392547 97.46967293 0 0.118064733 97.18764281 97.42595559
SPE 0 0.132191436 92.30860837 92.78786405 0 0.132191436 92.37292747 92.72354494
Pima Indian diabetics
PAC 0 0.092109816 80.171399 80.70052364 0 0.092109816 80.24241083 80.62951182
SEN 0 0.085031456 76.12631776 76.69348033 0 0.085031456 76.20243452 76.61736358
SPE 0 0.165042763 81.90646042 82.11053899 0 0.165042763 81.93384904 82.08315037
BUPA liver disease
PAC 0 0.155271161 70.23491732 70.49206105 0 0.155271161 70.26942761 70.45755076
SEN 0 0.114021708 67.20708253 67.52742545 0 0.114021708 67.25007455 67.48443343
SPE 0 0.145476728 73.12029125 73.35511283 0 0.145476728 73.15180577 73.32359831
16 Journal of Healthcare Engineering
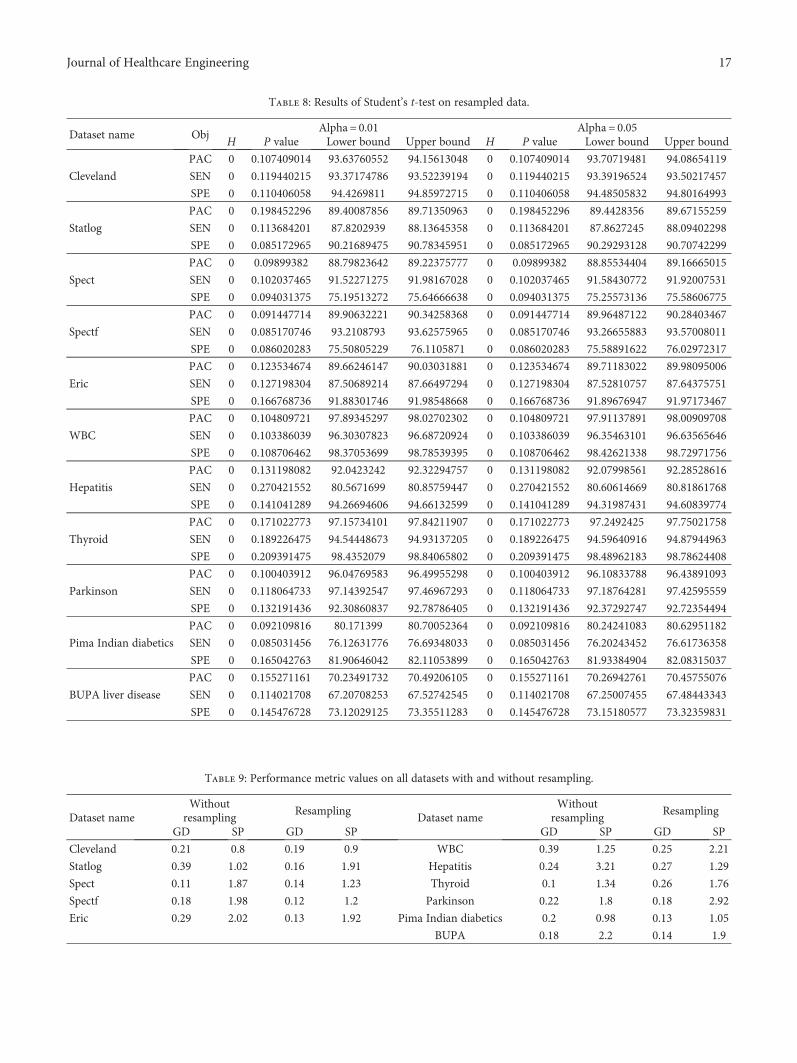
Table 8: Results of Student’s t-test on resampled data.
Dataset name ObjAlpha = 0.01 Alpha = 0.05
H P value Lower bound Upper bound H P value Lower bound Upper bound
Cleveland
PAC 0 0.107409014 93.63760552 94.15613048 0 0.107409014 93.70719481 94.08654119
SEN 0 0.119440215 93.37174786 93.52239194 0 0.119440215 93.39196524 93.50217457
SPE 0 0.110406058 94.4269811 94.85972715 0 0.110406058 94.48505832 94.80164993
Statlog
PAC 0 0.198452296 89.40087856 89.71350963 0 0.198452296 89.4428356 89.67155259
SEN 0 0.113684201 87.8202939 88.13645358 0 0.113684201 87.8627245 88.09402298
SPE 0 0.085172965 90.21689475 90.78345951 0 0.085172965 90.29293128 90.70742299
Spect
PAC 0 0.09899382 88.79823642 89.22375777 0 0.09899382 88.85534404 89.16665015
SEN 0 0.102037465 91.52271275 91.98167028 0 0.102037465 91.58430772 91.92007531
SPE 0 0.094031375 75.19513272 75.64666638 0 0.094031375 75.25573136 75.58606775
Spectf
PAC 0 0.091447714 89.90632221 90.34258368 0 0.091447714 89.96487122 90.28403467
SEN 0 0.085170746 93.2108793 93.62575965 0 0.085170746 93.26655883 93.57008011
SPE 0 0.086020283 75.50805229 76.1105871 0 0.086020283 75.58891622 76.02972317
Eric
PAC 0 0.123534674 89.66246147 90.03031881 0 0.123534674 89.71183022 89.98095006
SEN 0 0.127198304 87.50689214 87.66497294 0 0.127198304 87.52810757 87.64375751
SPE 0 0.166768736 91.88301746 91.98548668 0 0.166768736 91.89676947 91.97173467
WBC
PAC 0 0.104809721 97.89345297 98.02702302 0 0.104809721 97.91137891 98.00909708
SEN 0 0.103386039 96.30307823 96.68720924 0 0.103386039 96.35463101 96.63565646
SPE 0 0.108706462 98.37053699 98.78539395 0 0.108706462 98.42621338 98.72971756
Hepatitis
PAC 0 0.131198082 92.0423242 92.32294757 0 0.131198082 92.07998561 92.28528616
SEN 0 0.270421552 80.5671699 80.85759447 0 0.270421552 80.60614669 80.81861768
SPE 0 0.141041289 94.26694606 94.66132599 0 0.141041289 94.31987431 94.60839774
Thyroid
PAC 0 0.171022773 97.15734101 97.84211907 0 0.171022773 97.2492425 97.75021758
SEN 0 0.189226475 94.54448673 94.93137205 0 0.189226475 94.59640916 94.87944963
SPE 0 0.209391475 98.4352079 98.84065802 0 0.209391475 98.48962183 98.78624408
Parkinson
PAC 0 0.100403912 96.04769583 96.49955298 0 0.100403912 96.10833788 96.43891093
SEN 0 0.118064733 97.14392547 97.46967293 0 0.118064733 97.18764281 97.42595559
SPE 0 0.132191436 92.30860837 92.78786405 0 0.132191436 92.37292747 92.72354494
Pima Indian diabetics
PAC 0 0.092109816 80.171399 80.70052364 0 0.092109816 80.24241083 80.62951182
SEN 0 0.085031456 76.12631776 76.69348033 0 0.085031456 76.20243452 76.61736358
SPE 0 0.165042763 81.90646042 82.11053899 0 0.165042763 81.93384904 82.08315037
BUPA liver disease
PAC 0 0.155271161 70.23491732 70.49206105 0 0.155271161 70.26942761 70.45755076
SEN 0 0.114021708 67.20708253 67.52742545 0 0.114021708 67.25007455 67.48443343
SPE 0 0.145476728 73.12029125 73.35511283 0 0.145476728 73.15180577 73.32359831
Table 9: Performance metric values on all datasets with and without resampling.
Dataset nameWithout
resamplingResampling
Dataset nameWithout
resamplingResampling
GD SP GD SP GD SP GD SP
Cleveland 0.21 0.8 0.19 0.9 WBC 0.39 1.25 0.25 2.21
Statlog 0.39 1.02 0.16 1.91 Hepatitis 0.24 3.21 0.27 1.29
Spect 0.11 1.87 0.14 1.23 Thyroid 0.1 1.34 0.26 1.76
Spectf 0.18 1.98 0.12 1.2 Parkinson 0.22 1.8 0.18 2.92
Eric 0.29 2.02 0.13 1.92 Pima Indian diabetics 0.2 0.98 0.13 1.05
BUPA 0.18 2.2 0.14 1.9
17Journal of Healthcare Engineering

Table 10: Performance of hybrid systems on Cleveland dataset.
Cleveland
Resampling Without resamplingResampling Without resampling
PSO GSA FA PSO GSA FA
Basic SVM Parameter optimized SVM
PAC 85.14 82.83 86.79 86.13 86.13 83.49 82.83 83.49
Sensitivity 83.33 82.18 84.91 84.74 84.35 82.38 82.18 82.38
Specificity 87.80 83.72 89.51 88.09 88.70 85.03 83.72 85.03
F-measure 85.04 82.77 86.71 86.06 86.05 83.41 82.77 83.41
Recall 85.14 82.83 86.79 86.13 86.13 83.49 82.83 83.49
Precision 85.36 82.8 87.01 86.27 86.33 83.60 82.88 83.60
Basic MLP Parameter optimized MLP
PAC 93.72 79.20 94.05 94.05 94.05 85.14 84.15 85.80
Sensitivity 93.45 80.23 93.49 93.49 93.49 84.79 84.11 84.57
Specificity 94.07 77.94 94.77 94.77 94.77 85.60 84.21 87.5
F-measure 93.72 79.18 94.05 94.05 94.05 85.11 84.12 85.74
Recall 93.72 79.20 94.05 94.05 94.05 85.14 84.15 85.80
Precision 93.73 79.18 94.07 94.07 94.07 85.16 84.16 85.91
Table 11: Comparison of hybrid systems with HMV [14] for Cleveland dataset.
Method Accuracy Sensitivity Specificity F-measure
Base paper Ensemble 85 83.82 88.41 82.15
Without resampling FMLP 85.8 87.5 84.6 87.5
Resampling FMLP (PMLP) 94.1 94.8 93.5 94.1
Table 12: Performance of hybrid systems on Statlog dataset.
Statlog
Resampling Without resamplingResampling Without resampling
PSO GSA FA PSO GSA FA
Basic SVM Parameter optimized SVM
PAC 85.19 84.44 85.56 85.56 85.56 84.44 84.81 84.44
Sensitivity 83.81 83.62 82.73 83.96 83.96 83.62 84.35 84.21
Specificity 86.06 85.06 87.50 86.59 86.59 85.06 85.16 84.62
F-measure 85.12 84.41 85.55 85.50 85.50 84.41 84.78 84.40
Recall 85.19 84.44 85.56 85.56 85.56 84.44 84.81 84.44
Precision 85.14 84.42 85.54 85.51 85.51 84.42 84.80 84.44
Basic MLP Parameter optimized MLP
PAC 86.67 77.41 90.37 90.74 89.63 84.07 81.85 85.93
Sensitivity 82.61 73.60 91.26 92.16 88.07 85.32 79.34 83.61
Specificity 89.68 80.69 89.82 89.88 90.68 83.23 83.89 87.84
F-measure 86.70 77.45 90.31 90.67 89.61 83.97 81.86 85.94
Recall 86.67 77.41 90.37 90.74 89.63 84.07 81.85 85.93
Precision 86.77 77.54 90.41 90.82 89.61 84.16 81.87 85.96
Table 13: Comparison of hybrid systems with BagMOOV [15] for Statlog dataset.
Method Accuracy Sensitivity Specificity F-measure
Base paper Ensemble 84.4 86 86 86
Without resampling FMLP 85.9 83.6 87.8 85.9
Resampling GMLP 90.74 92.2 89.9 90.7
18 Journal of Healthcare Engineering
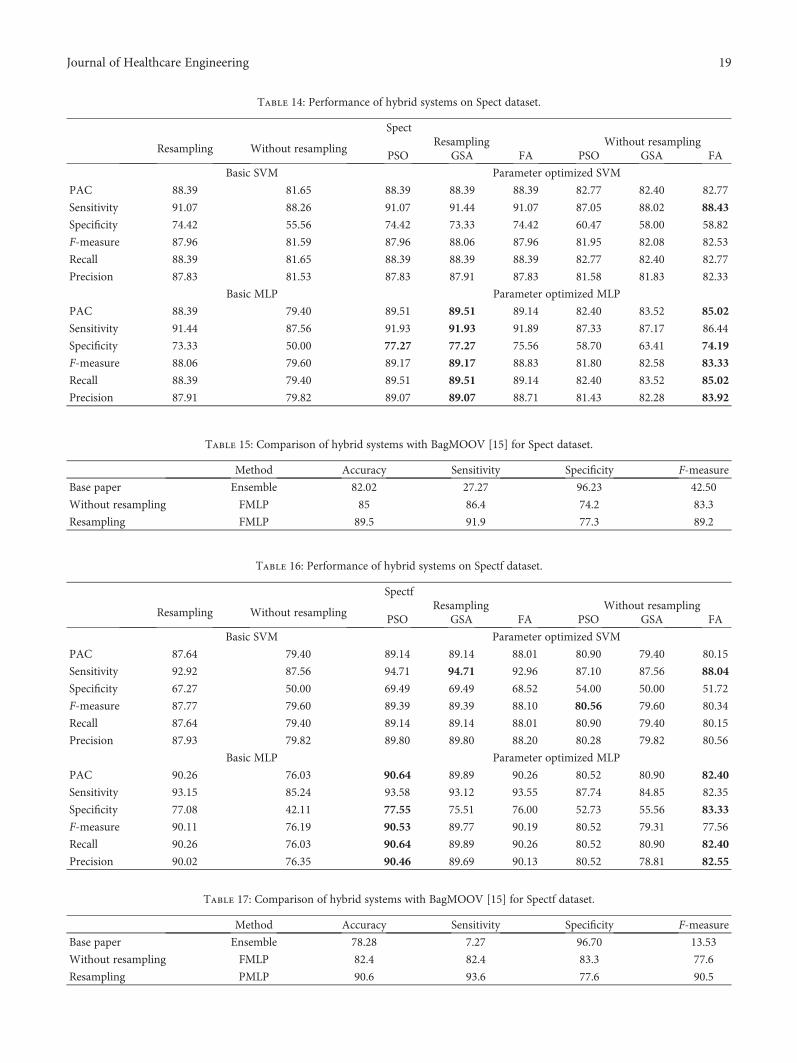
Table 14: Performance of hybrid systems on Spect dataset.
Spect
Resampling Without resamplingResampling Without resampling
PSO GSA FA PSO GSA FA
Basic SVM Parameter optimized SVM
PAC 88.39 81.65 88.39 88.39 88.39 82.77 82.40 82.77
Sensitivity 91.07 88.26 91.07 91.44 91.07 87.05 88.02 88.43
Specificity 74.42 55.56 74.42 73.33 74.42 60.47 58.00 58.82
F-measure 87.96 81.59 87.96 88.06 87.96 81.95 82.08 82.53
Recall 88.39 81.65 88.39 88.39 88.39 82.77 82.40 82.77
Precision 87.83 81.53 87.83 87.91 87.83 81.58 81.83 82.33
Basic MLP Parameter optimized MLP
PAC 88.39 79.40 89.51 89.51 89.14 82.40 83.52 85.02
Sensitivity 91.44 87.56 91.93 91.93 91.89 87.33 87.17 86.44
Specificity 73.33 50.00 77.27 77.27 75.56 58.70 63.41 74.19
F-measure 88.06 79.60 89.17 89.17 88.83 81.80 82.58 83.33
Recall 88.39 79.40 89.51 89.51 89.14 82.40 83.52 85.02
Precision 87.91 79.82 89.07 89.07 88.71 81.43 82.28 83.92
Table 15: Comparison of hybrid systems with BagMOOV [15] for Spect dataset.
Method Accuracy Sensitivity Specificity F-measure
Base paper Ensemble 82.02 27.27 96.23 42.50
Without resampling FMLP 85 86.4 74.2 83.3
Resampling FMLP 89.5 91.9 77.3 89.2
Table 16: Performance of hybrid systems on Spectf dataset.
Spectf
Resampling Without resamplingResampling Without resampling
PSO GSA FA PSO GSA FA
Basic SVM Parameter optimized SVM
PAC 87.64 79.40 89.14 89.14 88.01 80.90 79.40 80.15
Sensitivity 92.92 87.56 94.71 94.71 92.96 87.10 87.56 88.04
Specificity 67.27 50.00 69.49 69.49 68.52 54.00 50.00 51.72
F-measure 87.77 79.60 89.39 89.39 88.10 80.56 79.60 80.34
Recall 87.64 79.40 89.14 89.14 88.01 80.90 79.40 80.15
Precision 87.93 79.82 89.80 89.80 88.20 80.28 79.82 80.56
Basic MLP Parameter optimized MLP
PAC 90.26 76.03 90.64 89.89 90.26 80.52 80.90 82.40
Sensitivity 93.15 85.24 93.58 93.12 93.55 87.74 84.85 82.35
Specificity 77.08 42.11 77.55 75.51 76.00 52.73 55.56 83.33
F-measure 90.11 76.19 90.53 89.77 90.19 80.52 79.31 77.56
Recall 90.26 76.03 90.64 89.89 90.26 80.52 80.90 82.40
Precision 90.02 76.35 90.46 89.69 90.13 80.52 78.81 82.55
Table 17: Comparison of hybrid systems with BagMOOV [15] for Spectf dataset.
Method Accuracy Sensitivity Specificity F-measure
Base paper Ensemble 78.28 7.27 96.70 13.53
Without resampling FMLP 82.4 82.4 83.3 77.6
Resampling PMLP 90.6 93.6 77.6 90.5
19Journal of Healthcare Engineering
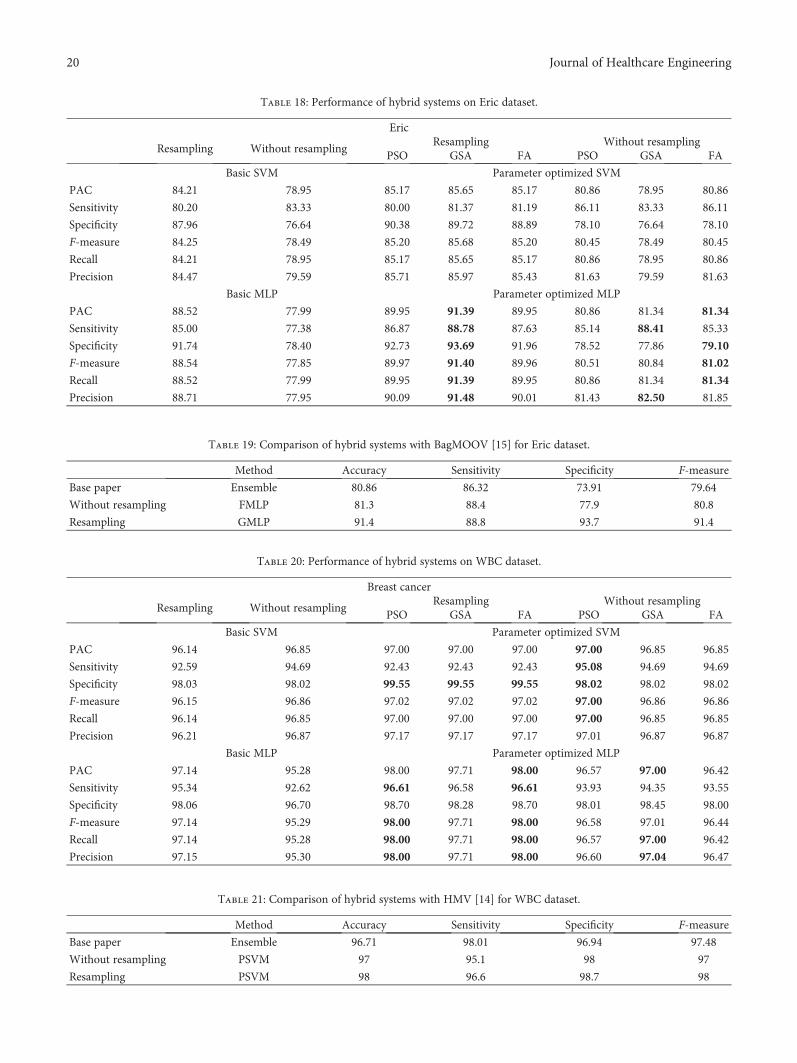
Table 18: Performance of hybrid systems on Eric dataset.
Eric
Resampling Without resamplingResampling Without resampling
PSO GSA FA PSO GSA FA
Basic SVM Parameter optimized SVM
PAC 84.21 78.95 85.17 85.65 85.17 80.86 78.95 80.86
Sensitivity 80.20 83.33 80.00 81.37 81.19 86.11 83.33 86.11
Specificity 87.96 76.64 90.38 89.72 88.89 78.10 76.64 78.10
F-measure 84.25 78.49 85.20 85.68 85.20 80.45 78.49 80.45
Recall 84.21 78.95 85.17 85.65 85.17 80.86 78.95 80.86
Precision 84.47 79.59 85.71 85.97 85.43 81.63 79.59 81.63
Basic MLP Parameter optimized MLP
PAC 88.52 77.99 89.95 91.39 89.95 80.86 81.34 81.34
Sensitivity 85.00 77.38 86.87 88.78 87.63 85.14 88.41 85.33
Specificity 91.74 78.40 92.73 93.69 91.96 78.52 77.86 79.10
F-measure 88.54 77.85 89.97 91.40 89.96 80.51 80.84 81.02
Recall 88.52 77.99 89.95 91.39 89.95 80.86 81.34 81.34
Precision 88.71 77.95 90.09 91.48 90.01 81.43 82.50 81.85
Table 19: Comparison of hybrid systems with BagMOOV [15] for Eric dataset.
Method Accuracy Sensitivity Specificity F-measure
Base paper Ensemble 80.86 86.32 73.91 79.64
Without resampling FMLP 81.3 88.4 77.9 80.8
Resampling GMLP 91.4 88.8 93.7 91.4
Table 20: Performance of hybrid systems on WBC dataset.
Breast cancer
Resampling Without resamplingResampling Without resampling
PSO GSA FA PSO GSA FA
Basic SVM Parameter optimized SVM
PAC 96.14 96.85 97.00 97.00 97.00 97.00 96.85 96.85
Sensitivity 92.59 94.69 92.43 92.43 92.43 95.08 94.69 94.69
Specificity 98.03 98.02 99.55 99.55 99.55 98.02 98.02 98.02
F-measure 96.15 96.86 97.02 97.02 97.02 97.00 96.86 96.86
Recall 96.14 96.85 97.00 97.00 97.00 97.00 96.85 96.85
Precision 96.21 96.87 97.17 97.17 97.17 97.01 96.87 96.87
Basic MLP Parameter optimized MLP
PAC 97.14 95.28 98.00 97.71 98.00 96.57 97.00 96.42
Sensitivity 95.34 92.62 96.61 96.58 96.61 93.93 94.35 93.55
Specificity 98.06 96.70 98.70 98.28 98.70 98.01 98.45 98.00
F-measure 97.14 95.29 98.00 97.71 98.00 96.58 97.01 96.44
Recall 97.14 95.28 98.00 97.71 98.00 96.57 97.00 96.42
Precision 97.15 95.30 98.00 97.71 98.00 96.60 97.04 96.47
Table 21: Comparison of hybrid systems with HMV [14] for WBC dataset.
Method Accuracy Sensitivity Specificity F-measure
Base paper Ensemble 96.71 98.01 96.94 97.48
Without resampling PSVM 97 95.1 98 97
Resampling PSVM 98 96.6 98.7 98
20 Journal of Healthcare Engineering
Table 22: Performance of hybrid systems on hepatitis dataset.
Hepatitis
Resampling Without resamplingResampling Without resampling
PSO GSA FA PSO GSA FA
Basic SVM Parameter optimized SVM
PAC 89.03 85.16 89.68 89.68 89.68 87.10 87.10 87.10
Sensitivity 73.91 65.52 80.00 80.00 80.00 73.08 73.08 73.08
Specificity 91.67 89.68 91.11 91.11 91.11 89.92 89.92 89.92
F-measure 88.60 84.89 88.97 88.97 88.97 86.58 86.58 86.58
Recall 89.03 85.16 89.68 89.68 89.68 87.10 87.10 87.10
Precision 88.46 84.69 89.10 89.10 89.10 86.44 86.44 86.44
Basic MLP Parameter optimized MLP
PAC 90.32 81.94 92.26 92.26 92.26 87.10 85.16 83.23
Sensitivity 72.41 56.67 80.77 80.77 80.77 71.43 71.43 59.38
Specificity 94.44 88.00 94.57 94.57 94.57 90.55 87.31 89.43
F-measure 90.39 81.72 92.14 92.14 92.14 86.77 83.94 83.23
Recall 90.32 81.94 92.26 92.26 92.26 87.10 85.16 83.23
Precision 90.46 81.53 92.08 92.08 92.08 86.60 84.03 83.23
Table 23: Comparison of hybrid systems with HMV [14] for hepatitis dataset.
Method Accuracy Specificity Sensitivity F-measure
Base paper Ensemble 86.45 90.48 92.68 91.57
Without resampling PMLP 87.1 90.6 71.4 86.8
Resampling PMLP 92.3 80.8 94.6 92.1
Table 24: Performance of hybrid systems on thyroid dataset.
Thyroid
Resampling Without resamplingResampling Without resampling
PSO GSA FA PSO GSA FA
Basic SVM Parameter optimized SVM
PAC 89.77 89.77 91.16 91.16 91.16 89.77 89.77 89.77
Sensitivity 90.70 93.88 97.50 97.50 97.50 93.88 93.88 93.88
Specificity 89.53 88.55 89.71 89.71 89.71 88.55 88.55 88.55
F-measure 89.27 89.31 90.61 90.61 90.61 89.31 89.31 89.31
Recall 89.77 89.77 91.16 91.16 91.16 89.77 89.77 89.77
Precision 89.84 90.16 91.78 91.78 91.78 90.16 90.16 90.16
Basic MLP Parameter optimized MLP
PAC 98.14 96.28 98.60 97.67 98.6 97.67 96.74 97.67
Sensitivity 98.18 93.85 98.21 94.83 98.21 95.45 93.94 95.45
Specificity 98.13 97.33 98.74 98.73 98.74 98.66 97.99 98.66
F-measure 98.13 96.28 98.60 97.68 98.6 97.68 96.75 97.68
Recall 98.14 96.28 98.60 97.67 98.6 97.67 96.74 97.67
Precision 98.14 96.28 98.60 97.69 98.6 97.69 96.76 97.69
Table 25: Comparison of hybrid systems with neural network [16] for thyroid dataset.
Method Accuracy Sensitivity Specificity F-measure
Base paper Neural networks 94.81 NIL NIL NIL
Without resampling FMLP 97.7 95.5 98.7 97.7
Resampling FMLP 98.6 98.2 98.7 98.6
21Journal of Healthcare Engineering

Table 26: Performance of hybrid systems on Parkinson dataset.
Parkinson’s disease
Resampling Without resamplingResampling Without resampling
PSO GSA FA PSO GSA FA
Basic SVM Parameter optimized SVM
PAC 91.28 86.15 91.28 91.28 91.28 87.69 87.69 87.69
Sensitivity 90.00 87.04 90.00 90.00 90.00 86.39 86.39 86.39
Specificity 100.00 81.82 100.00 100.00 100.00 96.15 96.15 96.15
F-measure 90.41 85.21 90.41 90.41 90.41 86.29 86.29 86.29
Recall 91.28 86.15 91.28 91.28 91.28 87.69 87.69 87.69
Precision 92.15 85.75 92.15 92.15 92.15 88.79 88.79 88.79
Basic MLP Parameter optimized MLP
PAC 96.41 91.28 96.92 96.92 96.41 92.31 92.31 93.85
Sensitivity 97.40 94.52 97.42 97.42 97.40 95.83 96.48 96.55
Specificity 92.68 81.63 95.00 95.00 92.68 82.35 81.13 86.00
F-measure 96.39 91.31 96.90 96.90 96.39 92.38 92.43 93.89
Recall 96.41 91.28 96.92 96.92 96.41 92.31 92.31 93.85
Precision 96.39 91.35 96.90 96.90 96.39 92.52 92.70 93.95
Table 27: Comparison of hybrid systems with HMV [14] for Parkinson dataset.
Method Accuracy Sensitivity Specificity F-measure
Base paper Ensemble 89.23 91.45 94.56 92.98
Without resampling FMLP 93.8 96.6 86 93.9
Resampling GMLP 96.9 97.4 95 96.9
Table 28: Performance of hybrid systems on Pima Indian diabetics’ dataset.
Pima Indian diabetics
Resampling Without resamplingResampling Without resampling
PSO GSA FA PSO GSA FA
Basic SVM Parameter optimized SVM
PAC 77.08 77.47 77.08 77.21 77.60 78.26 78.26 78.13
Sensitivity 72.78 72.51 72.53 72.93 73.63 74.63 74.63 74.51
Specificity 78.40 79.35 78.50 78.53 78.84 79.57 79.57 79.43
F-measure 75.86 76.74 75.90 76.01 76.45 77.45 77.45 77.30
Recall 77.08 77.47 77.08 77.21 77.60 78.26 78.26 78.13
Precision 76.51 76.97 76.49 76.65 77.09 77.85 77.85 77.71
Basic MLP Parameter optimized MLP
PAC 79.30 75.13 77.47 80.60 80.99 74.48 77.60 76.04
Sensitivity 70.71 65.34 69.41 76.59 73.14 64.06 70.87 65.79
Specificity 83.18 79.88 80.69 82.06 84.60 79.69 80.48 81.47
F-measure 79.09 74.93 76.97 79.97 80.83 74.34 77.16 76.02
Recall 79.30 75.13 77.47 80.60 80.99 74.48 77.60 76.04
Precision 78.99 74.81 76.90 80.22 80.75 74.24 77.13 76.00
Table 29: Comparison of hybrid systems with HMV [14] for Pima Indian diabetics’ dataset.
Method Accuracy Sensitivity Specificity F-measure
Base paper Ensemble 77.08 78.93 88.4 83.4
Without resampling PSVM 78.3 74.6 79.6 77.5
Resampling FMLP 81 73.1 84.6 80.8
22 Journal of Healthcare Engineering
with resampling are achieved by FMLP, GMLP, FMLP,FMLP, FMLP, and FMLP, respectively; best values foundhave been bolded for easy identification in Table 28. Acomparison of Pima result with the state-of-the-art resultis given in Table 29. The highest prediction accuracy forPima is 78.3% (without resampling) and 81% (with resam-pling). The performance of all the considered techniquesover Pima dataset with resampling is better than withoutresampling. Table 28 summarizes the performance of pro-posed hybrid alternatives for this dataset, and Table 29compares this performance with best results obtained inrecent literature.
7.3.11. BUPA Liver Disease Dataset. The performance of allthe 8 techniques (2 machine learning and six hybrid systems)over BUPA dataset with and without resampling is givenin Table 30. The highest accuracy, sensitivity, specificity,F-measure, recall, and precision without resampling areachieved by GMLP, PSVM, FMLP, FMLP, FMLP, and FMLP,respectively, with the values 73%, 72%, 74.9%, 72.8%, 73%,and 72.8%. The highest accuracy, sensitivity, specificity,F-measure, recall, and precision with resampling are achievedby GMLP, FMLP, GMLP, GMLP, GMLP, and GMLP,respectively, with the values 73.3%, 67.5%, 78.4%, 73.3%,73.3%, and 73.9%. A comparison of BUPA result withthe state-of-the-art result is given in Table 31. The highestprediction accuracy for BUPA is 73% (without resampling)and 73.3% (with resampling). The performance of all the
considered techniques over BUPA dataset with resamplingis better than without resampling except in sensitivity.Table 30 summarizes the performance of proposed hybridalternatives for this dataset, and Table 31 compares thisperformance with best results obtained in recent literature.
In GSA updating of an agent, the position is learned fromall other agents, whereas in PSO updating of an agent posi-tion is based on two parameters called gBEST and pBEST.In each iteration of these two algorithms at most n, new solu-tions are brought forth. However, in FA in the worst case,each agent develops O(n) new solution by moving towardsall other best solutions. Therefore, in the worst case of FA,space is managed more efficiently than the other two algo-rithms (GSA and PSO). The same is demonstrated over the11 medical datasets.
From the previous observations, it is concluded thatMLP without resampling shows improvement in all data-sets when compared with latest literature results and thesame is depicted in Figure 2. As mentioned earlier, inFigure 2, the blue bar represents best performance inliterature. Best results obtained by any of the six HISsproposed in this paper has been depicted in Figure 2alongside, once without resampling (orange bar) and thenwith resampled data (gray bar). Sensitivity and specificityvalues for all systems have been presented in Tables 32and 33, and it can be observed that our proposed hybridsystem performs very well across all the datasets, in particu-lar, the parameter optimized MLP. Table 34 summarizes
Table 30: Performance of hybrid systems on BUPA liver disease dataset.
BUPA liver disease
Resampling Without resamplingResampling Without resampling
PSO GSA FA PSO GSA FA
Basic SVM Parameter optimized SVM
PAC 63.48 70.14 66.09 66.67 63.48 70.72 70.14 70.14
Sensitivity 61.44 68.10 64.86 65.97 61.44 72.00 68.10 68.10
Specificity 65.10 71.18 67.01 67.16 65.10 70.20 71.18 71.18
F-measure 63.40 69.50 65.95 66.47 63.40 69.52 69.50 69.50
Recall 63.48 70.14 66.09 66.67 63.48 70.72 70.14 70.14
Precision 63.39 69.89 66.01 66.61 63.39 70.96 69.89 69.89
Basic MLP Parameter optimized MLP
PAC 68.12 71.59 65.80 73.33 70.43 72.75 73.04 71.59
Sensitivity 63.93 69.75 61.88 68.85 67.46 70.73 70.00 68.50
Specificity 72.84 72.57 70.12 78.40 73.30 73.87 74.88 73.39
F-measure 68.12 71.06 65.81 73.34 70.46 72.35 72.80 71.27
Recall 68.12 71.59 65.80 73.33 70.43 72.75 73.04 71.59
Precision 68.68 71.38 66.27 73.94 70.57 72.55 72.83 71.34
Table 31: Comparison of hybrid systems with HMV [14] for BUPA liver disease dataset.
Method Accuracy Sensitivity Specificity F-measure
Base paper Ensemble 67.54 68.54 42.07 52.14
Without resampling GMLP 73 70 74.9 72.8
Resampling GMLP 73.3 68.9 78.4 73.3
23Journal of Healthcare Engineering
the optimal parameter values of MLP. Hence, in comparisonwith the ensemble techniques, parameter optimized MLPgives a better result.
Table 3 gives the outcomes of the rank test for the resultsof with resampling at the level of significance (LOS) 0.01.If h value is zero, then H0 is true otherwise H1 is true. In
Table 32: Sensitivity improvement with hybrid systems.
S. number SetSensitivity
Base paperWithout resampling Resampling
Technique Percentage Technique Percentage
1 Cleveland 83.82 FMLP 87.5 FMLP 94.8
2 Statlog 86 PMLP 85.3 GMLP 92.2
3 Spect 27.27 FSVM 88.4 FMLP 91.9
4 Spectf 7.27 FSVM 88 GSVM 94.7
5 Eric 86.32 GMLP 88.4 GMLP 88.8
6 WBC 98.01 PSVM 95.1 FMLP 96.6
7 Hepatitis 90.48 FSVM 73.1 FMLP 80.8
8 Thyroid NIL GMLP 95.5 GMLP 98.2
9 Parkinson 91.45 FMLP 96.6 FMLP 97.4
10 Pima Indian diabetics 78.93 PSVM 74.6 FMLP 76.6
11 BUPA 68.54 PSVM 72 FMLP 67.5
Table 33: Specificity improvement with hybrid systems.
S. number DatasetSpecificity
Base paperWithout resampling Resampling
Technique Percentage Technique Percentage
1 Cleveland 88.41 PMLP 84.8 FMLP 93.5
2 Statlog 86 FMLP 87.8 FMLP 90.7
3 Spect 96.23 FMLP 74.2 GMLP 77.3
4 Spectf 96.7 FMLP 83.3 PMLP 77.6
5 Eric 73.91 FMLP 79.1 GMLP 93.7
6 WBC 96.94 FMLP 98 FMLP 98.7
7 Hepatitis 92.68 PMLP 90.6 FMLP 94.6
8 Thyroid NIL GMLP 98.7 FMLP 98.7
9 Parkinson 94.56 FSVM 96.2 FSVM 100
10 Pima Indian diabetics 88.4 FMLP 81.5 GMLP 84.6
11 BUPA 42.07 GMLP 74.9 GMLP 78.4
Table 34: Parameters to be used in MLP for all datasets.
Dataset Learning rate Momentum Hybrid MLP accuracy Base paper accuracy
Cleveland 0.4410246832765716 0.945131728055943 85.8 85
Statlog 0.24687115044065697 0.7512112614957723 85.9 84.4
Spect 0.001620407197768992 0.5458467309532906 85 82.02
Spectf 0.0037254964036241137 0.6064034495456784 82.4 78.28
Eric 0.6953073769599724 0.9167657941184544 81.3 80.86
Breast cancer 0.5272364248697747 0.9288899224295802 96.99 96.71
Hepatitis 0.6376255545427609 0.9250563419048221 87.1 86.45
Thyroid 0.1516498076389815 0.48805304429332785 97.7 94.81
Parkinson 0.8486064853474067 0.3499016503919223 93.8 89.23
Pima Indian diabetics 0.03218577681226653 0.06466339445401592 77.60 77.08
BUPA 0.8329619224653821 0.014749643317800043 73 67.54
24 Journal of Healthcare Engineering
Table 3, 161 ones are there out of a total of 165. It meansthat 161 times null hypothesis is false and four times nullhypothesis is true.
Table 4 gives the outcomes of the rank test for the resultsof with resampling at the level of significance (LOS) 0.05. InTable 4, 163 ones are there out of 165. It means that 163 timesnull-hypothesis is false and four times null hypothesis is true.
Table 5 gives the outcomes of the rank test for the results ofwithout resampling at the level of significance (LOS) 0.01. InTable 5, 164 ones are there out of 165. It means that 164 timesnull hypothesis is false and one time null hypothesis is true.
Table 6 gives the outcomes of the rank test for the resultsof without resampling at the level of significance (LOS) 0.05.In Table 6, 164 ones are there out of 165. It means that 164times null hypothesis is false and one-time null hypothesisis true.
The outcomes of FMLP are taken as “m” value. Tables 7and 8 give the results of t-test for both resampling andwithout resampling techniques with LOS 0.01 and 0.05. Inthese tables, h value is zero for all datasets at 0.01 and 0.05LOS. Hence, null hypothesis is accepted for all datasets.
8. Conclusion
Due to the complex framework of ensemble approach andthe moderate performance of the individual classifier, hybridsystems have a lot of promise in the diagnosis and prognosisof diseases. To overcome these, we proposed a disease diag-nosis system by juxtaposing three evolutionary algorithmsand SVM andMLP classifiers. Three evolutionary algorithmsoptimize the parameters of the two classifiers and suchenhanced classifiers have been used to train and diagnose dis-eases. Accordingly, six hybrid diagnosis alternatives havebeen obtained by working out the combinations of classifiersand evolutionary algorithms. Based on results presented inthis paper, it can be concluded that our hybridizationapproach provides high prediction accuracy than othermethods in literature across a wide variety of disease datasets.Even among the six alternative parameter optimized classifiersystems proposed, FMLP was found to be the relatively bestacross the majority of the 11 datasets considered. On average,MLP shows 2.2% and 6.814% improvement in predictionaccuracy on the 11 datasets with and without resampling.The ranges of improvements shown by MLP in the objectivesensitivity are −2.9 to 75.13 and −9.68 to 86.33 without andwith resampling, respectively. The ranges of improvementshown by MLP in the objective specificity are −9.68 to 86.33and −18.93 to 36.33 without and with resampling, respec-tively. From the experimental results, it is concluded thatFMLP shows outperformance than recently developedensemble classifiers ([14, 15]). As a part of the continuationof this research, we intend to process a very higher dimen-sional dataset with the major phases of feature selection andparameter evolution of the classifier. For feature selection,similarity metric-based hypergraph will be constructed andthen by using hypergraph special properties, important topo-logical and geometrical features will be identified. In phase 2,competitive and co-operative parallel hybrid intelligent sys-tems will be employed for incorporating direct and indirect
communication among the different systems at guaranteedrun times thatwould allow the entireHISs to converge to a sin-gle value. This work is presently ongoing.
Conflicts of Interest
The authors declare that there is no conflict of interestregarding the publication of this paper.
Acknowledgments
Two of the authors (MadhuSudana Rao Nalluri and KannanK.) of this paper wish to thank the Department of Scienceand Technology, Government of India, for the financialsanction towards this work under FIST programme: SR/FST/MSI-107/2015.
References
[1] S.-H. Liao, P.-H. Chu, and P.-Y. Hsiao, “Data miningtechniques and applications–a decade review from 2000 to2011,” Expert Systems with Applications, vol. 39, no. 12,pp. 11303–11311, 2012.
[2] E. W. T. Ngai, L. Xiu, and D. C. K. Chau, “Application of datamining techniques in customer relationship management: aliterature review and classification,” Expert Systems withApplications, vol. 36, no. 2, pp. 2592–2602, 2009.
[3] E. W. Ngai, Y. Hu, Y. H. Wong, Y. Chen, and X. Sun, “Theapplication of data mining techniques in financial frauddetection: a classification framework and an academic reviewof literature,” Decision Support Systems, vol. 50, no. 3,pp. 559–569, 2011.
[4] N. Esfandiari, M. R. Babavalian, A. M. Moghadam, and V. K.Tabar, “Knowledge discovery in medicine: current issue andfuture trend,” Expert Systems with Applications, vol. 41, no. 9,pp. 4434–4463, 2014.
[5] Y. Li, C. Bai, and C. K. Reddy, “A distributed ensembleapproach for mining healthcare data under privacy con-straints,” Information Sciences, vol. 330, pp. 245–259, 2016.
[6] R. Ramos-Pollán, M. Á. Guevara-López, and E. Oliveira, “Asoftware framework for building biomedical machine learningclassifiers through grid computing resources,” Journal ofMedical Systems, vol. 36, no. 4, pp. 2245–2257, 2012.
[7] A. Malik and J. Iqbal, “Extreme learning machine basedapproach for diagnosis and analysis of breast cancer,” Journalof the Chinese Institute of Engineers, vol. 39, no. 1, pp. 74–78,2016.
[8] S. Palaniappan and R. Awang, “Intelligent heart diseaseprediction system using data mining techniques,” in 2008IEEE/ACS International Conference on Computer Systemsand Applications, pp. 108–115, Doha, 2008.
[9] M. Hariharan, K. Polat, and R. Sindhu, “A new hybridintelligent system for accurate detection of Parkinson’sdisease,” Computer Methods and Programs in Biomedicine,vol. 113, no. 3, pp. 904–913, 2014.
[10] I. Castelli and E. Trentin, “Combination of supervised andunsupervised learning for training the activation functions ofneural networks,” Pattern Recognition Letters, vol. 37,pp. 178–191, 2014.
[11] B. Xie, Y. Liu, H. Zhang, and J. Yu, “A novel supervisedapproach to learning efficient kernel descriptors for high
25Journal of Healthcare Engineering
accuracy object recognition,” Neurocomputing, vol. 182,pp. 94–101, 2016.
[12] K.Morris andP.D.McNicholas, “Clustering, classification, dis-criminant analysis, and dimension reduction via generalizedhyperbolic mixtures,” Computational Statistics & DataAnalysis, vol. 97, pp. 133–150, 2016.
[13] V. Elyasigomari, M. S. Mirjafari, H. R. Screen, and M. H.Shaheed, “Cancer classification using a novel gene selectionapproach by means of shuffling based on data clusteringwith optimization,” Applied Soft Computing, vol. 35,pp. 43–51, 2015.
[14] S. Bashir, U. Qamar, F. H. Khan, and L. Naseem, “HMV: amedical decision support framework using multi-layer classi-fiers for disease prediction,” Journal of Computational Science,vol. 13, pp. 10–25, 2016.
[15] S. Bashir, U. Qamar, and F. H. Khan, “BagMOOV: a novelensemble for heart disease prediction bootstrap aggregationwith multi-objective optimized voting,” Australasian Physical& Engineering Sciences in Medicine, vol. 38, no. 2, pp. 305–323, 2015.
[16] F. Temurtas, “A comparative study on thyroid disease diagno-sis using neural networks,” Expert Systems with Applications,vol. 36, no. 1, pp. 944–949, 2009.
[17] R. Das, I. Turkoglu, and A. Sengur, “Effective diagnosisof heart disease through neural networks ensembles,”Expert Systems with Applications, vol. 36, no. 4,pp. 7675–7680, 2009.
[18] R. Chitra and V. Seenivasagam, “Heart disease predictionsystem using supervised learning classifier,” Bonfring Interna-tional Journal of Software Engineering and Soft Computing,vol. 3, no. 1, p. 1, 2013.
[19] S. A. Pattekari and A. Parveen, “Prediction system for heartdisease using Naïve Bayes,” International Journal of AdvancedComputer and Mathematical Sciences, vol. 3, no. 3, pp. 290–294, 2012.
[20] M. A. Jabbar, B. L. Deekshatulu, and P. Chandra, “Heartdisease prediction system using associative classification andgenetic algorithm,” 2012, http://arxiv.org/abs/1303.5919.
[21] H. D. Masethe and M. A. Masethe, “Prediction of heart diseaseusing classification algorithms,” in Proceedings of the WorldCongress on Engineering and Computer Science, vol. 2,pp. 22–24, San Francisco, USA, October 2014.
[22] A. Shaikh, N. Mahoto, F. Khuhawar, and M. Memon, “Perfor-mance evaluation of classification methods for heart diseasedataset,” Sindh University Research Journal-SURJ (ScienceSeries), vol. 47, no. 3, 2015.
[23] R. Kavitha and T. Christopher, “An effective classification ofheart rate data using PSO-FCM clustering and enhancedsupport vector machine,” Indian Journal of Science andTechnology, vol. 8, no. 30, 2015.
[24] R. Alizadehsani, J. Habibi, M. J. Hosseini et al., “A data miningapproach for diagnosis of coronary artery disease,” ComputerMethods and Programs in Biomedicine, vol. 111, no. 1,pp. 52–61, 2013.
[25] A. Shenfield and S. Rostami, “A multi objective approach toevolving artificial neural networks for coronary heart diseaseclassification,” in 2015 IEEE Conference on ComputationalIntelligence in Bioinformatics and Computational Biology(CIBCB), pp. 1–8, Niagara Falls, ON, 2015.
[26] N. Bhatla and K. Jyoti, “An analysis of heart disease predic-tion using different data mining techniques,” International
Journal of Engineering Research and Technology, vol. 1,no. 8, pp. 1–4, 2012.
[27] L. Parthiban and R. Subramanian, “Intelligent heart diseaseprediction system using CANFIS and genetic algorithm,”International Journal of Biological, Biomedical and MedicalSciences, vol. 3, no. 3, 2008.
[28] N. G. Hedeshi and M. S. Abadeh, “Coronary artery diseasedetection using a fuzzy-boosting PSO approach,” Computa-tional Intelligence and Neuroscience, vol. 2014, Article ID783734, 12 pages, 2014.
[29] E. O. Olaniyi, O. K. Oyedotun, and K. Adnan, “Heart diseasesdiagnosis using neural networks arbitration,” InternationalJournal of Intelligent Systems and Applications (IJISA), vol. 7,no. 12, p. 75, 2015.
[30] J. K. Kim, J. S. Lee, D. K. Park, Y. S. Lim, Y. H. Lee, andE. Y. Jung, “Adaptive mining prediction model for contentrecommendation to coronary heart disease patients,” ClusterComputing, vol. 17, no. 3, pp. 881–891, 2014.
[31] V. Chauraisa and S. Pal, “Early prediction of heart diseasesusing data mining techniques,” Caribbean Journal of Scienceand Technology, vol. 1, pp. 208–217, 2013.
[32] H. Yan, Y. Jiang, J. Zheng, C. Peng, and Q. Li, “A multilayerperceptron-based medical decision support system for heartdisease diagnosis,” Expert Systems with Applications, vol. 30,no. 2, pp. 272–281, 2006.
[33] H. Yan, J. Zheng, Y. Jiang, C. Peng, and Q. Li, “Developmentof a decision support system for heart disease diagnosisusing multilayer perceptron,” in Proceedings of the 2003International Symposium on Circuits and Systems (ISCAS '03),vol. 5, pp. V-709–V-712, 2003.
[34] M. Shouman, T. Turner, and R. Stocker, “Using data miningtechniques in heart disease diagnosis and treatment,” in 2012Japan-Egypt Conference on Electronics, Communications andComputers, pp. 173–177, Alexandria, 2012.
[35] M. Karaolis, J. A. Moutiris, and C. S. Pattichis, “Assessment ofthe risk of coronary heart event based on data mining,” in 20088th IEEE International Conference on BioInformatics andBioEngineering, pp. 1–5, Athens, 2008.
[36] C. Ordonez, E. Omiecinski, L. De Braal et al., “Miningconstrained association rules to predict heart disease,” in Pro-ceedings 2001 IEEE International Conference on Data Mining,pp. 433–440, San Jose, CA, USA, 2001.
[37] R. Das, I. Turkoglu, and A. Sengur, “Diagnosis of valvularheart disease through neural networks ensembles,” ComputerMethods and Programs in Biomedicine, vol. 93, no. 2,pp. 185–191, 2009.
[38] A. Taneja, “Heart disease prediction system using data miningtechniques,” Oriental Journal of Computer Science and Tech-nology, vol. 6, no. 4, pp. 457–466, 2013.
[39] J. S. Sartakhti, M. H. Zangooei, and K. Mozafari, “Hepatitisdisease diagnosis using a novel hybrid method based on sup-port vector machine and simulated annealing (SVM-SA),”Computer Methods and Programs in Biomedicine, vol. 108,no. 2, pp. 570–579, 2012, ISSN 0169-2607.
[40] D. Çalişir and E. Dogantekin, “A new intelligent hepatitisdiagnosis system: PCA–LSSVM,” Expert Systems withApplications, vol. 38, no. 8, pp. 10705–10708, 2011.
[41] J. Li and L. Wong, “Using rules to analyse bio-medical data: acomparison between C4.5 and PCL,” in Advances in Web-AgeInformation Management, pp. 254–265, Springer, BerlinHeidelberg, 2003.
26 Journal of Healthcare Engineering

[42] C.-H. Weng, T. C.-K. Huang, and R.-P. Han, “Diseaseprediction with different types of neural network classifiers,”Telematics and Informatics, vol. 33, no. 2, pp. 277–292,2016.
[43] Y. N. Jane, H. K. Nehemiah, and K. Arputharaj, “A Q-backpropagated time delay neural network for diagnosingseverity of gait disturbances in Parkinson’s disease,” Journalof Biomedical Informatics, vol. 60, pp. 169–176, 2016.
[44] H. Gürüler, “A novel diagnosis system for Parkinson’s diseaseusing complex-valued artificial neural network with k-meansclustering feature weighting method,” in Neural Computingand Applications, pp. 1–10, Springer, London, 2016.
[45] S. Bashir, U. Qamar, and F. H. Khan, “IntelliHealth: a medicaldecision support application using a novel weighted multi-layer classifier ensemble framework,” Journal of BiomedicalInformatics, vol. 59, pp. 185–200, 2016.
[46] A. Iyer, S. Jeyalatha, and R. Sumbaly, “Diagnosis of diabetesusing classification mining techniques,” 2015, http://arxiv.org/abs/1502.03774.
[47] D. K. Choubey and P. Sanchita, “GA_MLP NN: a hybrid intel-ligent system for diabetes disease diagnosis,” InternationalJournal of Intelligent Systems and Applications, vol. 8, no. 1,p. 49, 2016.
[48] S. Kharya, “Using data mining techniques for diagnosisand prognosis of cancer disease,” 2012, http://arxiv.org/abs/1205.1923.
[49] V. Chaurasia and S. Pal, “A novel approach for breast cancerdetection using data mining techniques,” International Journalof Innovative Research in Computer and CommunicationEngineering, vol. 2, no. 1, pp. 2456–2465, 2014.
[50] R. Fernandez-Millan, J. A. Medina-Merodio, R. B. Plata, J. J.Martinez-Herraiz, and J. M. Gutierrez-Martinez, “A labora-tory test expert system for clinical diagnosis support inprimary health care,” Applied Sciences, vol. 5, no. 3, pp. 222–240, 2015.
[51] A. Alzubaidi, G. Cosma, D. Brown, and A. G. Pockley, “Anew hybrid global optimization approach for selecting clin-ical and biological features that are relevant to the effectivediagnosis of ovarian cancer,” in 2016 IEEE SymposiumSeries on Computational Intelligence (SSCI), pp. 1–8, Athens,December 2016.
[52] J. Gwak, M. Jeon, and W. Pedrycz, “Bolstering efficientSSGAs based on an ensemble of probabilistic variable-wisecrossover strategies,” Soft Computing, vol. 20, no. 6,pp. 2149–2176, 2016.
[53] S. L. Hsieh, S. H. Hsieh, P. H. Cheng et al., “Design ensemblemachine learning model for breast cancer diagnosis,” Journalof Medical Systems, vol. 36, no. 5, pp. 2841–2847, 2012.
[54] L. Shen, H. Chen, Z. Yu et al., “Evolving support vectormachines using fruit fly optimization for medical data classifi-cation,” Knowledge-Based Systems, vol. 96, pp. 61–75, 2016.
[55] T. Fawcett, “An introduction to ROC analysis,” Pattern Recog-nition Letters, vol. 27, no. 8, pp. 861–874, 2006.
[56] C. Phua, V. Lee, K. Smith, and R. Gayler, “A comprehensivesurvey of data mining-based fraud detection research,” 2010,http://arxiv.org/abs/1009.6119.
[57] A. A. Freitas, “A critical review of multi-objective optimizationin data mining: a position paper,” ACM SIGKDD ExplorationsNewsletter, vol. 6, no. 2, pp. 77–86, 2004.
[58] K. Deb, Multi-Objective Optimization Using EvolutionaryAlgorithms, John Wiley & Sons, 2001.
[59] E. Rashedi, H. Nezamabadi-Pour, and S. Saryazdi, “GSA: agravitational search algorithm,” Information Sciences, vol. 179,no. 13, pp. 2232–2248, 2009.
[60] E. Rashedi, H. Nezamabadi-Pour, and S. Saryazdi, “Filtermodeling using gravitational search algorithm,” EngineeringApplications of Artificial Intelligence, vol. 24, no. 1, pp. 117–122, 2011.
[61] C. Li and J. Zhou, “Parameters identification of hydraulicturbine governing system using improved gravitational searchalgorithm,” Energy Conversion and Management, vol. 52,no. 1, pp. 374–381, 2011.
[62] J. Kennedy and R. Eberhart, “Particle swarm optimization,” inNeural Networks, 1995. Proceedings., IEEE InternationalConference on, vol. 4, pp. 1942–1948, Perth, WA, 1995.
[63] C.-L. Huang and J.-F. Dun, “A distributed PSO–SVM hybridsystem with feature selection and parameter optimization,”Applied Soft Computing, vol. 8, no. 4, pp. 1381–1391, 2008.
[64] X.-S. Yang, “Firefly algorithm, stochastic test functions anddesign optimisation,” International Journal of bio-InspiredComputation, vol. 2, no. 2, pp. 78–84, 2010.
[65] F. Rosenblatt, “Principles of neurodynamics. Perceptrons andthe theory of brain mechanisms,” Cornell Aeronautical LabInc., Buffalo, NY, 1961.
[66] S. K. Pal and S. Mitra, “Multilayer perceptron, fuzzy sets, andclassification,” IEEE Transactions on Neural Networks, vol. 3,no. 5, pp. 683–697, 1992.
[67] R. Collobert and S. Bengio, “Links between perceptrons, MLPsand SVMs,” in Proceedings of the Twenty-First InternationalConference on Machine Learning (ICML '04), Banff, Alberta,Canada, 2004.
[68] C. Cortes and V. Vapnik, “Support-vector networks,”MachineLearning, vol. 20, no. 3, pp. 273–297, 1995.
[69] S. W. Lin, K. C. Ying, S. C. Chen, and Z. J. Lee, “Particle swarmoptimization for parameter determination and featureselection of support vector machines,” Expert Systems withApplications, vol. 35, no. 4, pp. 1817–1824, 2008.
[70] S. Chatterjee, S. Sarkar, S. Hore, N. Dey, A. S. Ashour, and V. E.Balas, “Particle swarm optimization trained neural network forstructural failure prediction of multistoried RC buildings,” inNeural Computing and Applications, pp. 1–12, Springer,London, 2016.
[71] http://archive.ics.uci.edu/ml/datasets.html.
[72] F. Wilcoxon, “Individual comparisons by ranking methods,”Biometrics Bulletin, vol. 1, no. 6, pp. 80–83, 1945.
[73] W. L. Martinez and A. R. Martinez, Computational StatisticsHandbook with MATLAB, vol. 22, CRC press, 2007.
[74] D. A. Van Veldhuizen, “Multiobjective evolutionary algo-rithms: classifications, analyses, and new innovations,” AirForce Institute of Technology Wright-Patterson AFB OHSchool of Engineering, 1999.
[75] J. R. Schott, “Fault tolerant design using single and multicri-teria genetic algorithm optimization,” Air Force Institute ofTechnology Wright-Patterson AFB OH, 1995.
27Journal of Healthcare Engineering

RoboticsJournal of
Hindawi Publishing Corporationhttp://www.hindawi.com Volume 2014
Hindawi Publishing Corporationhttp://www.hindawi.com Volume 2014
Active and Passive Electronic Components
Control Scienceand Engineering
Journal of
Hindawi Publishing Corporationhttp://www.hindawi.com Volume 2014
International Journal of
RotatingMachinery
Hindawi Publishing Corporationhttp://www.hindawi.com Volume 2014
Hindawi Publishing Corporation http://www.hindawi.com
Journal of
Volume 201
Submit your manuscripts athttps://www.hindawi.com
VLSI Design
Hindawi Publishing Corporationhttp://www.hindawi.com Volume 201
Hindawi Publishing Corporationhttp://www.hindawi.com Volume 2014
Shock and Vibration
Hindawi Publishing Corporationhttp://www.hindawi.com Volume 2014
Civil EngineeringAdvances in
Acoustics and VibrationAdvances in
Hindawi Publishing Corporationhttp://www.hindawi.com Volume 2014
Hindawi Publishing Corporationhttp://www.hindawi.com Volume 2014
Electrical and Computer Engineering
Journal of
Advances inOptoElectronics
Hindawi Publishing Corporation http://www.hindawi.com
Volume 2014
The Scientific World JournalHindawi Publishing Corporation http://www.hindawi.com Volume 2014
SensorsJournal of
Hindawi Publishing Corporationhttp://www.hindawi.com Volume 2014
Modelling & Simulation in EngineeringHindawi Publishing Corporation http://www.hindawi.com Volume 2014
Hindawi Publishing Corporationhttp://www.hindawi.com Volume 2014
Chemical EngineeringInternational Journal of Antennas and
Propagation
International Journal of
Hindawi Publishing Corporationhttp://www.hindawi.com Volume 2014
Hindawi Publishing Corporationhttp://www.hindawi.com Volume 2014
Navigation and Observation
International Journal of
Hindawi Publishing Corporationhttp://www.hindawi.com Volume 2014
DistributedSensor Networks
International Journal of


