HUSSMAN INVESTMENT TRUST
92
HUSSMAN INVESTMENT TRUST HUSSMAN STRATEGIC GROWTH FUND HUSSMAN STRATEGIC TOTAL RETURN FUND HUSSMAN STRATEGIC INTERNATIONAL FUND ANNUAL REPORT June 30, 2019 Beginning on January 1, 2021, and as permitted by a rule adopted by the U.S. Securities and Exchange Commission, paper copies of the Funds’ shareholder reports like this one will no longer be sent to you by mail, unless you specifically request that the Funds or your financial intermediary (i.e., the broker-dealer or bank through which you own your shares) send you paper copies of these reports. Instead, shareholder reports will be made available on a website, and you will be notified by mail each time a report is posted and provided with a website link to access the report. If you have already elected to receive shareholder reports electronically, you will not be affected by this change and need not take any action. You may elect to receive electronic delivery of shareholder reports and other communications from the Funds by contacting the Funds at 1-800-487-7626 or, if you own your shares through a financial intermediary, by contacting your financial intermediary. You may elect to receive all future shareholder reports of the Funds in paper free of charge. You can inform the Funds that you wish to continue receiving paper copies of your shareholder reports by contacting the Funds at 1-800-487-7626. If you own shares through a financial intermediary, you may contact your financial intermediary or follow instructions included with this document to elect to continue to receive paper copies of your shareholder reports. Your election to receive reports in paper will apply to the reports of each of the Funds and, if you own shares through a financial intermediary, to the reports of each of the Funds and all other funds that you own through your financial intermediary.
Transcript of HUSSMAN INVESTMENT TRUST

HUSSMAN INVESTMENT TRUST
HUSSMAN STRATEGIC GROWTH FUND
HUSSMAN STRATEGIC TOTAL RETURN FUND
HUSSMAN STRATEGIC INTERNATIONAL FUND
ANNUAL REPORT June 30, 2019
Beginning on January 1, 2021, and as permitted by a rule adopted by the U.S. Securities and Exchange Commission, paper copies of the Funds’ shareholder reports like this one will no longer be sent to you by mail, unless you specifically request that the Funds or your financial intermediary (i.e., the broker-dealer or bank through which you own your shares) send you paper copies of these reports. Instead, shareholder reports will be made available on a website, and you will be notified by mail each time a report is posted and provided with a website link to access the report.
If you have already elected to receive shareholder reports electronically, you will not be affected by this change and need not take any action. You may elect to receive electronic delivery of shareholder reports and other communications from the Funds by contacting the Funds at 1-800-487-7626 or, if you own your shares through a financial intermediary, by contacting your financial intermediary.
You may elect to receive all future shareholder reports of the Funds in paper free of charge. You can inform the Funds that you wish to continue receiving paper copies of your shareholder reports by contacting the Funds at 1-800-487-7626. If you own shares through a financial intermediary, you may contact your financial intermediary or follow instructions included with this document to elect to continue to receive paper copies of your shareholder reports. Your election to receive reports in paper will apply to the reports of each of the Funds and, if you own shares through a financial intermediary, to the reports of each of the Funds and all other funds that you own through your financial intermediary.

Table of Contents
Performance Information
Hussman Strategic Growth Fund . . . . . . . . . . . . . . . . . . . . . . . . . . . . . 1
Hussman Strategic Total Return Fund . . . . . . . . . . . . . . . . . . . . . . . . . . 2
Hussman Strategic International Fund . . . . . . . . . . . . . . . . . . . . . . . . . . 3
Letter to Shareholders . . . . . . . . . . . . . . . . . . . . . . . . . . . . . . . . . . . . . . . 4
Portfolio Information . . . . . . . . . . . . . . . . . . . . . . . . . . . . . . . . . . . . . . . . 20
Schedules of Investments
Hussman Strategic Growth Fund . . . . . . . . . . . . . . . . . . . . . . . . . . . . . 22
Hussman Strategic Total Return Fund . . . . . . . . . . . . . . . . . . . . . . . . . . 31
Hussman Strategic International Fund . . . . . . . . . . . . . . . . . . . . . . . . . . 34
Statements of Assets and Liabilities . . . . . . . . . . . . . . . . . . . . . . . . . . . . . . 40
Statements of Operations . . . . . . . . . . . . . . . . . . . . . . . . . . . . . . . . . . . . 42
Statements of Changes in Net Assets
Hussman Strategic Growth Fund . . . . . . . . . . . . . . . . . . . . . . . . . . . . . 44
Hussman Strategic Total Return Fund . . . . . . . . . . . . . . . . . . . . . . . . . . 45
Hussman Strategic International Fund . . . . . . . . . . . . . . . . . . . . . . . . . . 46
Financial Highlights
Hussman Strategic Growth Fund . . . . . . . . . . . . . . . . . . . . . . . . . . . . . 47
Hussman Strategic Total Return Fund . . . . . . . . . . . . . . . . . . . . . . . . . . 48
Hussman Strategic International Fund . . . . . . . . . . . . . . . . . . . . . . . . . . 49
Notes to Financial Statements . . . . . . . . . . . . . . . . . . . . . . . . . . . . . . . . . 50
Report of Independent Registered Public Accounting Firm . . . . . . . . . . . . . . . 73
About Your Funds’ Expenses . . . . . . . . . . . . . . . . . . . . . . . . . . . . . . . . . . 75
Board of Trustees and Officers . . . . . . . . . . . . . . . . . . . . . . . . . . . . . . . . . 77
Other Information . . . . . . . . . . . . . . . . . . . . . . . . . . . . . . . . . . . . . . . . . 79
Federal Tax Information . . . . . . . . . . . . . . . . . . . . . . . . . . . . . . . . . . . . . . 79
Approval of Investment Advisory Agreements . . . . . . . . . . . . . . . . . . . . . . . 80

1
HUSSMAN STRATEGIC GROWTH FUNDComparison of the Change in Value of a $10,000 Investment in
Hussman Strategic Growth Fund versus the S&P 500 Index(a) (Unaudited)
$29,142
$47,740
$5,000
$10,000
$15,000
$20,000
$25,000
$30,000
$35,000
$40,000
$45,000
$50,000Past performance is not predictive of future performance.
$10,311
S&P 500 Index
Hussman Strategic Growth Fund (HSGFX)HSGFX equity investments and cash equivalents only (unhedged)
7/24/0
0
12/31
/00
6/30/0
1
6/30/0
2
6/30/0
3
6/30/0
4
6/30/0
5
6/30/0
6
6/30/0
7
6/30/0
8
6/30/0
9
6/30/1
1
6/30/1
0
6/30/1
2
6/30/1
3
6/30/1
4
6/30/1
5
6/30/1
6
6/30/1
9
6/30/1
7
6/30/1
8
Average Annual Total ReturnsFor Periods Ended June 30, 2019
1 Year 3 Years 5 Years 10 YearsSince
Inception(b)
Hussman Strategic Growth Fund(c)(d) (8.05%) (8.95%) (9.03%) (7.02%) 0.16%S&P 500 Index 10.42% 14.19% 10.71% 14.70% 5.81%
(a) Hussman Strategic Growth Fund invests primarily in stocks listed on the New York, American, and NASDAQ exchanges and varies its exposure to market fluctuations depending on market conditions. The S&P 500 Index is an index of large capitalization stocks. However, the Fund may invest in securities that are not included in the S&P 500 Index and there are no restrictions as to the market capitalization of companies in which the Fund invests. “HSGFX equity investments and cash equivalents only (unhedged)” reflects the performance of the Fund’s stock investments and modest day-to-day cash balances, after fees and expenses, and does not reflect the impact of hedging transactions on the Fund’s overall investment performance. The Fund’s unhedged equity investments do not represent a separately available portfolio, and their performance is presented solely for purposes of comparison and performance attribution.
(b) The Fund commenced operations on July 24, 2000.(c) Returns do not reflect the deduction of taxes a shareholder would pay on Fund distributions or the redemption of Fund shares.(d) The Adviser has contractually agreed to waive its investment advisory fees and/or absorb Fund expenses until at least November 1,
2019 to the extent necessary to limit the Fund’s annual ordinary operating expenses to an amount not exceeding 1.15% annually of the Fund’s average daily net assets. This limit on operating expenses was increased from 1.13% to 1.15% effective November 1, 2018. The gross expense ratio as disclosed in the November 1, 2018 prospectus was 1.37%.

2
HUSSMAN STRATEGIC TOTAL RETURN FUNDComparison of the Change in Value of a $10,000 Investment in Hussman Strategic Total Return Fund
versus the Bloomberg Barclays U.S. Aggregate Bond Index(a) (Unaudited)
Bloomberg Barclays U.S. Aggregate Bond IndexHussman Strategic Total Return Fund (HSTRX)
$20,015
$21,399
$8,000
$10,000
$12,000
$14,000
$16,000
$18,000
$20,000
$22,000Past performance is not predictive of future performance.
9/12/0
2
12/31
/02
6/30/0
3
6/30/0
4
6/30/0
5
6/30/0
6
6/30/0
7
6/30/0
8
6/30/0
9
6/30/1
1
6/30/1
0
6/30/1
2
6/30/1
3
6/30/1
4
6/30/1
5
6/30/1
6
6/30/1
9
6/30/1
7
6/30/1
8
Average Annual Total ReturnsFor Periods Ended June 30, 2019
1 Year 3 Years 5 Years 10 YearsSince
Inception(b)
Hussman Strategic Total Return Fund(c)(d) 9.72% 1.86% 2.73% 2.65% 4.63%Bloomberg Barclays U.S. Aggregate Bond Index 7.87% 2.31% 2.95% 3.90% 4.22%
(a) The Bloomberg Barclays U.S. Aggregate Bond Index covers the U.S. investment grade fixed rate bond market, with index components for U.S. government, agency and corporate securities. The Fund does not invest solely in securities included in the Bloomberg Barclays U.S. Aggregate Bond Index and may invest in other types of bonds, as well as common stocks, exchange-traded funds and other securities.
(b) The Fund commenced operations on September 12, 2002.(c) Returns do not reflect the deduction of taxes a shareholder would pay on Fund distributions or the redemption of Fund shares.(d) The Adviser has contractually agreed to waive its investment advisory fees and/or absorb Fund expenses until at least November 1,
2019 to the extent necessary to limit the Fund’s annual ordinary operating expenses to an amount not exceeding 0.75% annually of the Fund’s average daily net assets. This limit on operating expenses was increased from 0.73% to 0.75% effective November 1, 2018. The gross expense ratio as disclosed in the November 1, 2018 prospectus was 0.82%.

3
HUSSMAN STRATEGIC INTERNATIONAL FUNDComparison of the Change in Value of a $10,000 Investment in
Hussman Strategic International Fund versus the MSCI EAFE Index(a) (Unaudited)
MSCI EAFE Index Hussman Strategic International Fund (HSIEX)
$15,967
$8,840
$8,000
$10,000
$12,000
$14,000
$16,000
$18,000Past performance is not predictive of future performance.
12/31
/09
6/30/1
0
6/30/1
2
6/30/1
1
6/30/1
3
6/30/1
4
6/30/1
5
6/30/1
6
6/30/1
7
6/30/1
8
6/30/1
9
Average Annual Total ReturnsFor Periods Ended June 30, 2019
1 Year 3 Years 5 YearsSince
Inception(b)
Hussman Strategic International Fund(c)(d) (5.79%) (2.95%) (3.03%) (1.29%)MSCI EAFE Index 1.08% 9.11% 2.25% 5.05%
(a) The MSCI EAFE (Europe, Australasia, and Far East) Index is a free float-adjusted weighted capitalization index that is designed to measure the equity market performance of developed markets, excluding the U.S. and Canada. As of June 30, 2019, the MSCI EAFE Index consisted of the following 21 developed market country indices: Australia, Austria, Belgium, Denmark, Finland, France, Germany, Hong Kong, Ireland, Israel, Italy, Japan, the Netherlands, New Zealand, Norway, Portugal, Singapore, Spain, Sweden, Switzerland and the United Kingdom. The Fund may not invest in all of the countries represented in the MSCI EAFE Index and may invest in securities that are not included in the MSCI EAFE Index. In addition, the Fund varies its exposure to market fluctuations depending on market conditions.
(b) The Fund commenced operations on December 31, 2009.(c) Returns do not reflect the deduction of taxes a shareholder would pay on Fund distributions or the redemption of Fund shares.(d) The Adviser has contractually agreed to waive its investment advisory fees and/or absorb Fund expenses until at least November 1,
2019 to the extent necessary to limit the Fund’s annual ordinary operating expenses to an amount not exceeding 2.00% annually of the Fund’s average daily net assets. The gross expense ratio as disclosed in the November 1, 2018 prospectus was 2.42%.

4
Dear Shareholder,“One of the best indications of the speculative willingness of investors is the
‘uniformity’ of positive market action across a broad range of internals. Probably the most important aspect of last week’s decline was the decisive negative shift in these measures.”
— John P. Hussman, Market Internals Go Negative, July 30, 2007
For most of the period since January 2018, we have observed persistently divergent market action, based on the behavior of thousands of stocks, industries, sectors, and security-types, including debt securities of varying creditworthiness. During this time, major stock market indices comprised of large-capitalization stocks, such as the Standard & Poor’s 500 Index, have experienced wide swings but little net progress. Still, occasional market rebounds from correction lows to marginal new highs have created the appearance of resilience, similar to what Barron’s Magazine described in February 1969:
“The failure of the general market to decline during the past year despite its obvious vulnerability, as well as the emergence of new investment characteristics, has caused investors to believe that the U.S. has entered a new investment era to which the old guidelines no longer apply. Many have now come to believe that market risk is no longer a realistic consideration, while the risk of being underinvested or in cash and missing opportunities exceeds any other.”
In hindsight, the S&P 500 had already entered a bear market weeks earlier. The S&P 500 Index would stand below its 1968 peak even 14 years later, with its total return lagging inflation by -3.4% over that period.
Small- and mid-cap stocks, particularly those with less extreme valuations, have not enjoyed the same resilience as the large-cap indices. For the year ended June 30, 2019, the large-cap S&P 500 Index gained 10.42% and the large-cap Nasdaq 100 Index gained 10.16%, while the small-cap Russell 2000 Index lost -3.31%.
A similar pattern of divergences across various market sectors reflects a loss of what I call “internal uniformity.” Our interpretation is that investor psychology has increasingly shifted from speculation toward risk-aversion. In a steeply overvalued market, the emergence of risk-aversion among investors often opens a trap-door that permits deep market losses. In the interim, however, this dispersion has created a headwind for hedged-equity strategies that purchase individual stocks and hedge those portfolios using offsetting short-sales using futures or option combinations on major indices like the S&P 500 Index.
The Hussman FundsLetter to Shareholders August 12, 2019

5
The Hussman FundsLetter to Shareholders (continued)
This difference in performance between value-focused stocks and large-capitalization “glamour” stocks is similar to what we observed at the 2000 market peak, which was followed by an enormous reversal in the opposite direction in subsequent years. There is no assurance that we will observe a similar reversal in the current instance, but the evidence across a century of market cycles suggests that the current overvaluation of the large-capitalization indices is not sustainable, particularly when investors are becoming increasingly risk-averse.
Meanwhile, I continue to believe that it remains reasonable to accept the risk that results from active, value-conscious stock selection. Indeed, the stock selection component of Strategic Growth Fund has generally been compensated by returns in excess of the indices it uses to hedge, despite recent headwinds. In fact, this difference in performance was a major contributor to the 105.57% gain in Strategic Growth Fund from its inception on July 24, 2000 to the March 9, 2009 market low, a nearly 9-year period when the S&P 500 lost -45.99%, including dividends.
In short, although the loss of internal uniformity has been challenging for hedged-equity strategies over the past year, the combination of extreme market valuations and deteriorating internal uniformity also creates a potential trap-door for the equity markets that investors should not ignore.
As I observed in October 2000, near the peak of the technology bubble, “Historically, when trend uniformity has been positive, stocks have generally ignored overvaluation, no matter how extreme. When the market loses that uniformity, valuations often matter suddenly and with a vengeance. This is a lesson best learned before a crash rather than after one.”
Our measures of both valuation and market internals have continued to be effective, particularly in combination, as they were in prior market cycles. The difficulty we experienced during the speculative half-cycle since 2009 was the result of our pre-emptive bearish response to syndromes of “overvalued, overbought, overbullish” conditions that had reliably placed something of a “limit” on continued speculation in other market cycles across history. Extraordinary monetary and corporate tax policies during the recent cycle eventually led us to abandon the idea of “limits” to speculation.
In late-2017, we adapted our approach to refrain from adopting or amplifying a negative market outlook unless our measures of market internals have explicitly deteriorated. As I expressed in our 2018 Semi-Annual Report, my hope and expectation is that over the completion of the current market cycle, and in future ones, our long-term investors will feel very much like an old, familiar friend is back at the wheel.

6
The Hussman FundsLetter to Shareholders (continued)
Passive investing and performance-chasingEvery financial bubble is characterized by self-reinforcing behavior. As investors
look backward at past returns, they are often emboldened to chase the securities or strategies that have enjoyed popularity, driving prices higher, further emboldening performance-chasing, and eventually producing a situation where prices become detached from underlying fundamentals.
In prior bubbles, the objects of this speculation have taken the form of “Nifty-Fifty” glamour stocks, industrial conglomerates, dot-com stocks, technology stocks, mortgage obligations, and other securities. In the recent speculative episode, they have primarily taken the form of government debt, low-grade “covenant lite” corporate debt, leveraged loans (loans to already highly-indebted borrowers), glamour technology companies that benefit from “network” effects (e.g. FAANG), and stocks that comprise widely-followed stock market indices such as the S&P 500.
According to Morningstar, the amount invested in “passive” U.S. equity funds is now equal to the amount invested in actively-managed funds. Passive funds typically invest in a specific list of stocks, generally in proportion to their individual market capitalizations, and tied to popular indices like the S&P 500.
The exodus to passive investing has two self-reinforcing elements. First, as funds have purchased the component stocks of the S&P 500 in proportion to their market capitalizations, with zero regard for price or value, the S&P 500 Index has performed better than both the broad market and the unweighted average of the very same stocks. That, in turn, has provoked further performance-chasing. In addition, because the funds are passively managed, they can operate with lower expenses, and the combination of strong backward-looking performance and relatively low fees has further amplified the exodus from active to passive investing.
Nearly 30 years ago, I wrote my dissertation at Stanford University on the efficiency and inefficiency of financial markets where rational investors hold differing sets of private information. One of the interesting features of a so-called “efficient market” is that, because the willingness of an investor to buy or sell reveals that the investor holds private information, other investors can infer that private information without actually seeing it, so the equilibrium market price always comes to reflect all information, whether private or public.
Apart from the largely ignored side-theorem that trading volume will always be precisely zero in that sort of market, a central requirement for an efficient market is that investors must be constantly monitoring and policing the market for inefficiencies. It is

7
The Hussman FundsLetter to Shareholders (continued)
The Hussman FundsLetter to Shareholders (continued)
the very act of using prices as information, and aggressively policing every possible profit opportunity, that enforces an efficient market. Without that constant vigilance, one can never assume that financial markets are efficiently priced.
To put this in simple terms, one can visualize an efficient market as a sheep standing on a nickel. If there are enough sheepdogs around, constantly ensuring that the sheep doesn’t stray, then yes, the sheep will keep standing on the nickel. But if the sheepdogs simply assume that sheep always stand on nickels (the equivalent of asserting that “low-cost index investing is always efficient”), the sheep may not even stay in the neighborhood. That is the situation that the performance-chasing popularity of index investing has created today.
My own view is that every stock is a claim to some expected stream of future cash flows that will be delivered into the hands of investors over time. We spend a great deal of effort evaluating those factors, as well as market action that helps to convey the information of others. Across multiple market cycles, this sort of analysis has enabled our stock-selection approach to materially outperform the major indices, even after fees and transaction costs.
Indeed, despite the recent underperformance of our value-conscious stock selection discipline, the stock-selection approach of Strategic Growth Fund, excluding the impact of hedging, has had an average annual return of 8.60% from the inception of the Fund on July 24, 2000 through June 30, 2019, compared with an average annual total return of 5.81% for the S&P 500 during the same period. Our goal, of course, is for the hedging component of the Fund’s strategy to augment our stock-selection returns over the complete market cycle.
One consequence of the exodus to passive indexing is that the median price/revenue ratio of S&P 500 components has reached the highest level in history, easily eclipsing both the 2000 and 2007 market extremes. My expectation is that over the completion of the current market cycle, and during the market cycle that follows, the valuation gap between stocks favored by our stock selection discipline and stocks comprising the S&P 500 will be reversed, much as we observed during the 2000-2002 period. Such a reversal would be expected to contribute to future investment returns.
At present, our most reliable measures of market valuation remain near the highest levels in history, rivaling the extremes of 1929 and 2000. Meanwhile, apart from a brief positive whipsaw in early 2019, our measures of market internals have been

8
The Hussman FundsLetter to Shareholders (continued)
unfavorable since February 2018. Generally speaking, when a hypervalued market is joined by risk-aversion among investors, the market environment becomes permissive of steep, waterfall losses.
Given weakness in leading measures of economic activity, coupled with unfortunately-timed shocks to global trade, the Hussman Funds are well-prepared for the potential for steep losses in the U.S. stock market. Improvement in our measures of market internals may ease our immediate downside concerns from time-to-time, but only a significant retreat in prices, or at least a decade of near-zero market returns, will ease the profound downside potential that our valuation measures presently imply for the U.S. stock market.
Fund Performance
Strategic Growth FundDuring the fiscal year ended June 30, 2019, Strategic Growth Fund lost -8.05%,
wholly attributable to a difference in the performance of the stocks held by the Fund, relative to the indices that the Fund uses to hedge. The primary driver of Fund returns during the recent fiscal year was broadening divergence in the internal behavior of the stock market, which has historically been associated with vulnerability of the U.S. stock market to major losses. Despite losses that I view as a temporary consequence of this divergence, the objective of the Fund’s hedging approach is to mitigate or even benefit from likely market losses, as it has during other major market declines.
The stock selection approach of Strategic Growth Fund has outperformed the S&P 500 Index by an average of 2.79% (279 basis points) annually since the inception of the Fund. During the fiscal year ended June 30, 2019, however, Fund’s stock selections, excluding the impact of hedging, lost -1.39% despite a 10.42% gain in the S&P 500 Index.
From the inception of Strategic Growth Fund on July 24, 2000 through June 30, 2019, the Fund had an average annual total return of 0.16%, compared with an average annual total return of 5.81% for the S&P 500 Index. An initial $10,000 investment in the Fund at its inception on July 24, 2000 would have grown to $10,311, compared with $29,142 for the same investment in the S&P 500 Index. The deepest loss experienced by the Fund since inception was -56.13%. The deepest loss experienced by the S&P 500 Index since the inception of the Fund was -55.25%.

9
The Hussman FundsLetter to Shareholders (continued)
The Hussman FundsLetter to Shareholders (continued)
Strategic Growth Fund and the S&P 500 have each experienced their own periods of difficulty and loss since 2000, though at different times. Notably, the performance of the Fund since its inception remained materially ahead of the S&P 500 from its inception in 2000 until June 2013. As noted below, I believe that the primary difficulty in recent years has been fully addressed.
It is also notable that the steep losses of the S&P 500 in 2000-2002 and again in 2007-2009 were largely consistent with a century of historical experience. In contrast, the difficulty experienced by Strategic Growth Fund during the advancing half-cycle since 2009 resulted from an extraordinary departure from historical experience.
A century of historical experience indicates that extreme market valuations are predictably followed by major market losses over the completion of the market cycle. Indeed, during the 9-year period from March 24, 2000 to March 9, 2009, the Standard & Poor’s 500 Index declined by -55.71%, with a total return, including dividends, of -48.04%. By the 2009 market low, the S&P 500 had lagged Treasury bill returns for the nearly 14-year period since May 3, 1995.
Given current extremes in the valuation measures we find best-correlated with actual subsequent market returns, a loss in the S&P 500 on the order of 60-65% over the completion of this cycle, and negative S&P 500 total returns over the coming 10-12 year horizon, would be fully consistent with historical experience.
In contrast, the loss in Strategic Growth Fund in recent years has reflected wholly unprecedented conditions. Specifically, the novel and experimental pursuit of zero interest rates by the Federal Reserve encouraged persistent speculation by investors, despite extreme “overvalued, overbought, overbullish” syndromes that had historically placed a reliable “limit” on further speculation.
In late-2017, we adapted our investment strategy to abandon our pre-emptive bearish response to these syndromes. We now require explicit deterioration in our measures of market internals before adopting or amplifying a negative market outlook. This adaptation eliminates the key source of the Fund’s difficulty in the recent advancing half-cycle. In contrast, I do not have any belief that a presently hypervalued stock market has somehow adapted away the risk of profound losses over the completion of this cycle.
Strategic Growth Fund retains the flexibility to respond to improved market conditions, which we expect to emerge over the completion of the current market cycle, as well as unfavorable conditions like the 2000-2002 and 2007-2009 collapses, which emerged from the same combination of rich valuations and market internals as we presently observe.

10
The Hussman FundsLetter to Shareholders (continued)
Strategic Total Return FundDuring the fiscal year ended June 30, 2019, Strategic Total Return Fund gained
9.72%, compared with a gain of 7.87% in the Bloomberg Barclay U.S. Aggregate Bond Index. During this period, Strategic Total Return Fund held a moderately constructive position in long-term bonds, with a duration typically ranging between 3-4 years (meaning that a 100 basis point move in interest rates would be expected to affect Fund value by about 3-4% on the basis of bond price fluctuations). The Fund benefited from holdings in shares of companies engaged in the mining of precious metals, largely by varying the size of its investment positions in response to periods of strength and weakness in this sector.
From the inception of Strategic Total Return Fund on September 12, 2002 through June 30, 2019, the Fund had an average annual total return of 4.63%, compared with an average annual total return of 4.22% for the Bloomberg Barclays U.S. Aggregate Bond Index. An initial $10,000 investment in the Fund on September 12, 2002 would have grown to $21,399, compared with $20,015 for the same investment in the Bloomberg Barclays U.S. Aggregate Bond Index. The deepest loss experienced by the Fund since inception was -11.52%, compared with a maximum loss of -5.08% for the Bloomberg Barclays U.S. Aggregate Bond Index during the same period.
Strategic International FundDuring the fiscal year ended June 30, 2019, Strategic International Fund lost
-5.79% compared with a total return of 1.60% in the capitalization-weighted MSCI EAFE Index. During the same period, the unweighted version of the EAFE Index lost 1.70%. While the 3.30% spread between the capitalization-weighted and unweighted EAFE Index may appear modest, this level of underperformance in the unweighted index has been observed on only a few occasions in the past 20 years. The two most pronounced instances were in March 2000 and January 2008, both near the beginning of major bear market declines.
Strategic International Fund remained fully hedged against the impact of general market fluctuations during the 2019 fiscal year. As we observe in the U.S. equity market, the performance of international equities has been strongest in passive, capitalization-weighted indices, with weaker performance in the broader market, particularly among value-oriented stocks.
Because international stock markets tend to become highly correlated during steep declines in the U.S. stock market, the downside risk that we observe in the U.S. market exists in international equity markets as well. A material improvement in U.S. conditions, particularly in our measures of market internals, would likely encourage

11
The Hussman FundsLetter to Shareholders (continued)
The Hussman FundsLetter to Shareholders (continued)
a constructive stance in the international markets as well. Without the elevated level of market risk that we currently observe, the Fund will have substantially greater opportunity to establish a constructive investment stance based on individual country valuations, market action and other local considerations.
From the inception of Strategic International Fund on December 31, 2009 through June 30, 2019, the Fund had an average annual total return of -1.29%, compared with an average annual total return of 5.05% for the MSCI EAFE Index. An initial $10,000 investment in the Fund on December 31, 2009 would be worth $8,840, compared with $15,967 for the same investment in the MSCI EAFE Index. The deepest loss experienced by the Fund since inception was -21.77%, compared with a maximum loss of -26.48% for the MSCI EAFE Index during the same period.
Portfolio CompositionAs of June 30, 2019, Strategic Growth Fund had net assets of $293,905,889,
and held 138 stocks in a wide variety of industries. The largest sector holdings as a percent of net assets were consumer discretionary (24.4%), communication services (15.5%), health care (15.0%), information technology (13.1%), industrials (11.1%), consumer staples (7.3%) and materials (7.2%). The smallest sector holdings were in financials (3.9%), utilities (3.2%), energy (1.1%) and real estate (1.0%).
Strategic Growth Fund’s holdings of individual stocks as of June 30, 2019 were valued at $302,249,214. Against these stock positions, the Fund also held 725 option combinations (long put option/short call option) on the S&P 500 Index, 400 option combinations on the Russell 2000 Index and 25 option combinations on the Nasdaq 100 Index. Each option combination behaves as a short sale on the underlying index, with a notional value of $100 times the index value. On June 30, 2019, the S&P 500 Index closed at 2,941.76, while the Russell 2000 Index and the Nasdaq 100 Index closed at 1,566.572 and 7,671.074, respectively. The Fund’s total hedge therefore represented a short position of $295,118,168, thereby hedging 97.6% of the dollar value of the Fund’s long investment positions in individual stocks.
Though the performance of Strategic Growth Fund’s diversified portfolio cannot be attributed to any narrow group of stocks, the following equity holdings achieved gains in excess of $1.5 million during the year ended June 30, 2019: Cree and NeoGenomics. Equity holdings with a loss in excess of $1.5 million during this same period were United Natural Foods, Urban Outfitters, Mallinckrodt, Express and Inogen.

12
The Hussman FundsLetter to Shareholders (continued)
As of June 30, 2019, Strategic Total Return Fund had net assets of $221,235,166. Treasury notes, Treasury Inflation-Protected Securities (TIPS) and investments in money market funds represented 74.7% of the Fund’s net assets. Shares of exchange-traded funds, precious metals shares and energy and utilities shares accounted for 4.0%, 14.8% and 6.3% of net assets, respectively.
In Strategic Total Return Fund, during the year ended June 30, 2019, portfolio gains in excess of $1 million were achieved in U.S Treasury Note (2.875%, due 8/15/2028), Barrick Gold, Anglogold Ashanti (ADR), U.S. Treasury Note (2.25%, due 2/15/2027) and U.S. Treasury Note (1.50%, due 8/15/2026). The Fund did not incur any portfolio losses in excess of $1 million during this same period.
As of June 30, 2019, Strategic International Fund had net assets of $21,934,105 and held 74 stocks in a wide variety of industries. The largest sector holdings as a percent of net assets were in industrials (12.3%), consumer discretionary (11.1%), financials (8.7%), information technology (7.4%), communication services (5.7%), consumer staples (4.8%), materials (4.0%) and health care (3.7%). The smallest sector holdings were in utilities (3.0%), energy (1.6%) and real estate (0.8%).
In order to hedge the impact of general market fluctuations, as of June 30, 2019, Strategic International Fund was short 140 futures on the Mini MSCI EAFE Index. The notional value of this hedge was $13,463,100, hedging 97.3% of the dollar value of equity investments held by the Fund. When the Fund is in a hedged investment position, the primary driver of Fund returns is the difference in performance between the stocks owned by the Fund and the indices that are used to hedge.
While the investment portfolio of Strategic International Fund is widely diversified and its performance is affected by numerous investment positions, the hedging strategy of the Fund was primarily responsible for the reduced sensitivity of the Fund to market fluctuations from the Fund’s inception through June 30, 2019. Air Canada was the only individual equity holding having a portfolio gain in excess of $125,000 during the year ended June 30, 2019. Equity holdings recognizing a portfolio loss in excess of $125,000 during this period were Norwegian Air Shuttle and U-Blox.
Supplementary information including quarterly returns and equity-only performance of the Funds is available on the Hussman Funds website: www.hussmanfunds.com.
Current Outlook“There are three principal phases of a bull market: the first is represented by
reviving confidence in the future of business; the second is the response of stock prices to the known improvement in corporate earnings, and the third is the period

13
The Hussman FundsLetter to Shareholders (continued)
The Hussman FundsLetter to Shareholders (continued)
when speculation is rampant – a period when stocks are advanced on hopes and expectations. There are three principal phases of a bear market: the first represents the abandonment of the hopes upon which stocks were purchased at inflated prices; the second reflects selling due to decreased business and earnings, and the third is caused by distress selling of sound securities, regardless of their value, by those who must find a cash market for at least a portion of their assets.”
— Robert Rhea, The Dow Theory, 1932
Amid the increasing perception that market and economic cycles are artifacts of the past, it is important to recognize where the financial markets and the economy actually stand in their respective cycles.
The recent bull market has already clocked in as the longest in history. As of the recent July peak in the S&P 500, the market advance since the March 2009 low has outlived the 1990-2000 bull market by nearly a year. Likewise, as of July, the current economic expansion is now longer than the record 10-year expansion that ended in early 2001. The U.S. unemployment rate is down to just 3.7% from a peak of 10% during the global financial crisis. The entire post-crisis “output gap” between actual real GDP and the Congressional Budget Office estimate of potential real GDP has been eliminated.
Meanwhile, based on the valuation measures we find best-correlated with actual subsequent market returns across history, the current market extreme already matches or exceeds those of the 1929 and 2000 peaks. There is little question that the market is long into what Rhea described as the final phase of the bull market; “the period when speculation is rampant – a period when stocks are advanced on hopes and expectations.”
Monetary policy has not repealed market or economic cyclesMarket valuations have been extreme for a long time. While valuations have
enormously important implications for long-term market returns and full-cycle market risks, valuations are not a timing tool. Indeed, it is impossible for valuations to reach hypervalued peaks like 1929, 2000, and today without persistently advancing through lesser extremes.
As I have regularly emphasized, extreme valuations can become even more overextended, provided that investors remain inclined toward speculation (which we infer from the condition of market internals). In previous market cycles across history, sufficiently extreme “overvalued, overbought, overbullish” syndromes typically acted as a limit to further speculation, and helped to warn of oncoming market plunges even

14
The Hussman FundsLetter to Shareholders (continued)
before market internals deteriorated. That regularity failed in recent years. One had to wait for market internals to deteriorate explicitly before adopting a bearish market outlook.
The elevated risk of the stock market here is not merely the result of extreme valuations. It is the result of the full combination of extreme valuations, plus unfavorable market internals (indicating a shift among investors from speculation toward risk-aversion), plus extreme overextension, plus persistent weakness in leading economic measures.
The economic expansion since the 2009 economic low has been a rather standard mean-reverting recovery, with a trajectory no different than one could have been projected at the time of that low. Nearly every economic expansion in the U.S. has followed a rather simple trajectory, where the amount of economic slack at the economic trough (measured by the GDP “output gap”) has gradually narrowed at a rate of about 8% per quarter. Extraordinary monetary policies did nothing to materially change that basic mean-reverting trajectory.
Much of the growth in real U.S. GDP since the global financial crisis has been driven by a cyclical decline in the rate of unemployment. Meanwhile, the long-term “structural” drivers of the economy – labor force growth and productivity growth – have continued their persistent slowdown from historical norms. Holding the U.S. unemployment rate constant, U.S. real GDP growth would currently be running at only about 1.6% annually. This is the norm that investors should expect in the years ahead, and it amplifies the vulnerability to recession, because even a 0.8% increase in the unemployment rate from its recent lows would likely be associated with negative GDP growth.
Understand what low structural growth implies for the U.S. stock market. First, while Wall Street mechanically recites the aphorism that “lower interest rates justify higher valuation multiples,” this proposition actually holds only if the trajectory of future cash flows is held constant. Even then, this proposition is identical to saying that lower interest rates justify lower future stock market returns.
The problem is that if interest rates are low because growth is also low, lower interest rates don’t justify any increase in valuation multiples at all. Normal valuation multiples would already be enough to produce lower future equity returns, via the slower growth of future fundamentals. If investors instead bid valuation multiples up anyway, subsequent returns are penalized twice, and can be driven to negative
15
The Hussman FundsLetter to Shareholders (continued)
The Hussman FundsLetter to Shareholders (continued)
levels for years to come. That is what investors have done here. We are left with the combination of a hypervalued market, historically low structural economic growth, and profoundly weak prospects for long-term market returns.
Put simply, the primary effect of extraordinary monetary policy in recent years was not to drive real economic gains, but instead to amplify speculation. None of this yield-seeking speculation and overvaluation has done anything to create aggregate “wealth” – it has simply taken future returns and embedded them into current prices. Long-term “wealth” is unchanged, because the actual wealth is in the future cash flows that will be delivered to investors over time.
Remember that once a security is issued, somebody has to hold that security at every point in time until it is retired. So the only thing that elevated investment valuations do is to provide an opportunity for current holders to receive a transfer of wealth by selling to some other unfortunate investor who pays an excessive price for the privilege of holding the bag of low future returns over time.
At current valuation extremes, it is only the illusion of “paper wealth” that temporarily anesthetizes investors and pension funds to the fact that their actual basis of wealth – the likely future stream of cash flows that will be delivered into their hands over time – is the smallest amount, relative to those “paper prices,” since the 1929 and 2000 extremes. This is exactly what hypervaluation means.
Easy money does not always support the market
In recent months, even as leading measures of economic activity have deteriorated, investors have become enthusiastic about a shift by the Federal Reserve toward fresh interest rate cuts, after a period of modest normalization that brought Treasury bill yields as high as 2.4%. It is useful to recognize that except for 1967 and 1996, every shift by the Federal Reserve from hiking rates (amounting to a cumulative increase in the Discount Rate in excess of 0.5%) to cutting rates (amounting to a cumulative cut of at least 0.5%), was associated with an oncoming or ongoing recession.
While aggressive monetary policy strongly amplified financial speculation in recent years, the 2000-2002 and 2007-2009 collapses were also accompanied by persistent and aggressive monetary easing by the Federal Reserve, with no benefit to the stock market other than short-lived rebounds that were quickly followed by collapsing prices. It is essential to understand what accounts for this distinction.
The way Fed easing “works” to support stock prices is straightforward. Provided that investors are inclined toward speculation and risk-seeking, Fed easing tends to be very favorable for the market, because safe, low-interest liquidity is a hot-potato to

16
The Hussman FundsLetter to Shareholders (continued)
risk-seeking speculators. Each successive holder wants to get rid of it, yet somebody has to hold it at each point in time. The resulting effort to exchange it for something else has the effect of driving up stocks, bonds, and anything else that offers a “pickup” to low short-term rates.
In contrast, when investors are inclined toward risk-aversion, safe low-interest liquidity is a preferred asset rather than an inferior one. So creating more of the stuff does nothing to encourage more speculation. When one recalls that the Federal Reserve eased persistently and aggressively throughout the 2000-2002 and 2007-2009 collapses, it should be clear that a recessionary collapse in stocks would not be interrupted by a sudden shift toward rate cuts, aside for very short-lived knee-jerk reactions.
So while it is possible that Fed easing could help to shift investor psychology back toward speculation, the likely effect of Fed policy on the stock market will be best gauged by monitoring market internals directly. If market internals remain ragged and divergent, as they are as of mid-August, then even persistent and aggressive easing should not be expected to support stocks.
Conversely, during periods when market internals shift to a uniformly favorable condition, Fed easing will tend to amplify the speculative tendencies of investors, and it will be appropriate to adopt a constructive outlook in response. In any event, investors should be very careful not to assume that “easy money” means “rising market.”
Inflation risk should not be dismissed
Following a rumor that he had died, Mark Twain famously said “Reports of my death are greatly exaggerated.” Despite a long period of stability, the same thing can likely be said about inflation.
During the global financial crisis, the U.S. Federal deficit briefly exploded to over $1.5 trillion, peaking at just over 9% of GDP. Yet the size of this deficit was fairly consistent with the substantial level of economic slack at the time.
Presently, even with the unemployment rate down from 10% to a recent low of 3.6%, and even having completely eliminated the output gap between actual GDP and Congressional Budget Office estimates of potential GDP, the U.S. Federal deficit has exploded to nearly $1 trillion. Over the next few years, we expect the Federal deficit to reach record levels. Indeed, even a mild recession is likely to drive the deficit, as a share of GDP, to levels that match or exceed the extremes seen in the global financial crisis.

17
The Hussman FundsLetter to Shareholders (continued)
The Hussman FundsLetter to Shareholders (continued)
There are only a handful of instances – 1967, 1972 and 1979 – where the real GDP output gap pushed to positive levels (i.e. real GDP temporarily moved above CBO estimates of potential GDP) yet the Federal budget was already in a deficit position. These points are notable from the standpoint of economic history because they were exactly the points at which inflation expectations became most unstable, as the public abandoned its faith that fiscal policy was on a stable course.
It is also notable that the rampant inflation of the 1970’s was not ended by actually moving the Federal budget to a surplus. It was enough to restore public expectations that movements in the deficit would not continue along an unsustainable trajectory – particularly, relative to the GDP output gap. These expectations have remained intact for three decades, until recently. The Federal government certainly ran a deficit following the 1981-82 recession, but that deficit was much smaller than would have been expected based on the GDP output gap at the time. This is not likely to be the case during the next recession.
Accelerating inflation is not assured in the years ahead, because inflation has a significant psychological component, and it has no simple linear relationship with any of the factors that are usually used to explain it. From a historical perspective, however, the present “cyclically excessive deficit” creates a substantially increased risk of destabilized public expectations about fiscal discipline and monetary soundness in the coming years. For that reason, it will remain important to attend to various inflation measures, including interest rate spreads, commodity prices, and inflation-sensitive securities.
Based on the behavior of leading economic measures, and the tendency of employment data to lag other indicators of economic activity, I expect a substantial decline in the rate of job creation over the coming months. As a result, it is quite possible that Treasury bond yields may fall below their already depressed levels. This is particularly true given that European and Japanese central banks have already engineered negative interest rates (by creating bank reserves that must be held by someone until those reserves are retired, and then actually charging banks interest for holding them).
Still, the price of gold has begun to advance, apparently in revulsion to these monetary hot potatoes. Moreover, it is worth remembering that a 10-year Treasury bond yielding 1.7% will, in fact, only provide a total return of 1.7% annually over the coming 10 year period. The expectation of obtaining a higher total return in the short run, as the result of a further decline in this yield, is essentially a speculative operation.

18
Given these conditions, Strategic Total Return Fund presently maintains a modestly constructive exposure to Treasury bonds, with a recent portfolio duration of about 3 years (meaning that a 100 basis point move in interest rates would be expected to impact the Fund by about 3% on the basis of bond price fluctuations), coupled with a moderate exposure to shares in companies in the gold and precious metals industry, recently ranging between 10-15% of Fund assets.
Presently, market conditions feature a combination of rich valuations, vulnerable profit margins, record corporate debt relative to revenues, rising default risk, deteriorating market internals, and accumulating risk of oncoming recession. These conditions largely mirror those we observed in 2000 and 2007. While the deterioration of the broad market, relative to large capitalization-weighted indices has been a headwind for our hedged-equity approach during the past year, I view this market behavior as temporary. The more durable consideration is that we adapted our investment strategy in late-2017 to eliminate the key source of our difficulty during the recent half-cycle.
The Hussman Funds continue to adhere to a historically‐informed, value‐conscious investment discipline focused on the complete market cycle. I expect our investment outlook to become considerably more constructive in response to improvements in valuations and market internals over the completion of the market cycle. Presently, however, the combination of extreme valuations, coupled with ragged market internals, should not be dismissed.
I remain grateful, as always, for your trust.
Sincerely,
John P. Hussman, Ph.D.
Past performance is not predictive of future performance. Investment results and principal value will fluctuate so that shares of the Funds, when redeemed, may be worth more or less than their original cost. Current performance may be higher or lower than the performance data quoted.
Weekly updates regarding market conditions and investment strategy, as well as special reports, analysis, and performance data current to the most recent month end, are available at the Hussman Funds website www.hussmanfunds.com.
An investor should consider the investment objectives, risks, charges and expenses of the Funds carefully before investing. The Funds’ prospectuses contain this and other important information. To obtain a copy of the Hussman Funds’ prospectuses please
The Hussman FundsLetter to Shareholders (continued)

19
visit our website at www.hussmanfunds.com or call 1-800-487-7626 and a copy will be sent to you free of charge. Please read the prospectus carefully before you invest. The Hussman Funds are distributed by Ultimus Fund Distributors, LLC.
Estimates of prospective return and risk for equities, bonds, and other financial markets are forward-looking statements based on the analysis and reasonable beliefs of Hussman Strategic Advisors. They are not a guarantee of future performance, and are not indicative of the prospective returns of any of the Hussman Funds. Actual returns may differ substantially from the estimates provided. Estimates of prospective long-term returns for the S&P 500 Index reflect valuation methods focusing on the relationship between current market prices and earnings, dividends and other fundamentals, adjusted for variability over the economic cycle.
This Letter to Shareholders seeks to describe some of the adviser’s current opinions and views of the financial markets. Although the adviser believes it has a reasonable basis for any opinions or views expressed, actual results may differ, sometimes significantly so, from those expected or expressed. The securities held by the Funds that are discussed in this Letter to Shareholders were held during the period covered by this Report. They do not comprise the entire investment portfolios of the Funds, may be sold at any time and may no longer be held by the Funds. The opinions of the Funds’ adviser with respect to those securities may change at any time.
The Hussman FundsLetter to Shareholders (continued)
The Hussman FundsLetter to Shareholders (continued)

20
Sector Allocation (% of Common Stocks)
0.0%
5.0%
10.0%
15.0%
20.0%
25.0%
Consum
er Dis
cretio
nary
Indust
rials
Inform
ation
Tech
nolog
y
Utilities
Health
Care
Materia
ls
Finan
cials
Energ
y
Consum
er Sta
ples
S&P 500 IndexHussman Strategic Growth Fund
Real
Estate
Commun
icatio
n Serv
ices
Asset Allocation (% of Net Assets)
6.5%
63.5%
U.S. Treasury Notes - 63.5%
4.0%4.9%
21.1%
Common Stocks - 21.1%
U.S. Treasury In�ation-Protected Notes - 6.5%
Exchange-Traded Funds - 4.0%
Money Market Funds & Other Assets & Liabilities - 4.9%
Hussman Strategic Growth Fund Portfolio Information June 30, 2019 (Unaudited)
Hussman Strategic Total Return Fund Portfolio Information June 30, 2019 (Unaudited)

21
Hussman Strategic Growth Fund Portfolio Information June 30, 2019 (Unaudited)
Sector Allocation (% of Common Stocks)
0.0%
5.0%
10.0%
15.0%
20.0%
Energ
y
Health
Care
Consum
er Sta
ples
Indust
rials
Real
Estate
Finan
cials
Inform
ation
Tech
nolog
y
Materia
ls
Consum
er Dis
cretio
nary
Utilities
Commun
icatio
n Serv
ices
Country Allocation (% of Common Stocks)
0.0%
5.0%
10.0%
15.0%
20.0%
25.0%
Netherl
ands
Franc
e
Austra
lia
Denm
ark
Norway
Portu
gal
Belgi
umJap
an
German
y
Finlan
dSw
eden
Canad
a
Switz
erlan
d
United
King
dom
Hussman Strategic International Fund Portfolio Information June 30, 2019 (Unaudited)

22
Hussman Strategic Growth FundSchedule of Investments June 30, 2019
COMMON STOCKS — 102.8% Shares Value
Communication Services — 15.5%Diversified Telecommunication Services — 1.2%
Verizon Communications, Inc. . . . . . . . . . . . . . . . . . . . . . . 60,000 $ 3,427,800
Entertainment — 2.8% AMC Entertainment Holdings, Inc. - Class A . . . . . . . . . . . . . 125,000 1,166,250Viacom, Inc. - Class B . . . . . . . . . . . . . . . . . . . . . . . . . . . 100,000 2,987,000Walt Disney Company (The) . . . . . . . . . . . . . . . . . . . . . . . 30,000 4,189,200
8,342,450Interactive Media & Services — 0.6%
Momo, Inc. - ADR . . . . . . . . . . . . . . . . . . . . . . . . . . . . . . 50,000 1,790,000
Media — 9.6% AMC Networks, Inc. - Class A (a) . . . . . . . . . . . . . . . . . . . . 60,000 3,269,400Comcast Corporation - Class A . . . . . . . . . . . . . . . . . . . . . 100,000 4,228,000Discovery, Inc. - Series A (a) . . . . . . . . . . . . . . . . . . . . . . . . 75,000 2,302,500Gray Television, Inc. (a) . . . . . . . . . . . . . . . . . . . . . . . . . . . 225,000 3,687,750Interpublic Group of Companies, Inc. (The) . . . . . . . . . . . . . 35,000 790,650Meredith Corporation . . . . . . . . . . . . . . . . . . . . . . . . . . . 35,000 1,927,100Nexstar Media Group, Inc. - Class A . . . . . . . . . . . . . . . . . 25,000 2,525,000Omnicom Group, Inc. . . . . . . . . . . . . . . . . . . . . . . . . . . . 30,000 2,458,500Sirius XM Holdings, Inc. . . . . . . . . . . . . . . . . . . . . . . . . . . 800,000 4,464,000TEGNA, Inc. . . . . . . . . . . . . . . . . . . . . . . . . . . . . . . . . . 175,000 2,651,250
28,304,150Wireless Telecommunication Services — 1.3%
Telephone and Data Systems, Inc. . . . . . . . . . . . . . . . . . . . 50,000 1,520,000United States Cellular Corporation (a) . . . . . . . . . . . . . . . . . 50,000 2,233,500
3,753,500Consumer Discretionary — 24.4%
Auto Components — 1.4% Gentex Corporation . . . . . . . . . . . . . . . . . . . . . . . . . . . . . 125,000 3,076,250Gentherm, Inc. (a) . . . . . . . . . . . . . . . . . . . . . . . . . . . . . . 25,000 1,045,750
4,122,000Diversified Consumer Services — 0.6%
H&R Block, Inc. . . . . . . . . . . . . . . . . . . . . . . . . . . . . . . . . 35,000 1,025,500Strategic Education, Inc. . . . . . . . . . . . . . . . . . . . . . . . . . . 5,000 890,000
1,915,500Hotels, Restaurants & Leisure — 5.0%
BJ’s Restaurants, Inc. . . . . . . . . . . . . . . . . . . . . . . . . . . . . . 50,000 2,197,000

23
Hussman Strategic Growth Fund Schedule of Investments (continued)
June 30, 2019
COMMON STOCKS — 102.8% (continued) Shares Value
Consumer Discretionary — 24.4% (continued)Hotels, Restaurants & Leisure — 5.0% (continued)
Brinker International, Inc. . . . . . . . . . . . . . . . . . . . . . . . . . . 75,000 $ 2,951,250Dave & Buster’s Entertainment, Inc. . . . . . . . . . . . . . . . . . . . 35,000 1,416,450Dunkin’ Brands Group, Inc. . . . . . . . . . . . . . . . . . . . . . . . . 50,000 3,983,000Starbucks Corporation . . . . . . . . . . . . . . . . . . . . . . . . . . . 50,000 4,191,500
14,739,200Household Durables — 1.1%
iRobot Corporation (a) . . . . . . . . . . . . . . . . . . . . . . . . . . . . 35,000 3,207,400
Internet & Direct Marketing Retail — 0.5% Shutterstock, Inc. . . . . . . . . . . . . . . . . . . . . . . . . . . . . . . . 35,000 1,371,650
Leisure Equipment & Products — 0.9% Malibu Boats, Inc. - Class A (a) . . . . . . . . . . . . . . . . . . . . . . 65,000 2,525,250
Multiline Retail — 4.5% Dollar General Corporation . . . . . . . . . . . . . . . . . . . . . . . . 25,000 3,379,000Kohl’s Corporation . . . . . . . . . . . . . . . . . . . . . . . . . . . . . . 50,000 2,377,500Macy’s, Inc. . . . . . . . . . . . . . . . . . . . . . . . . . . . . . . . . . . 50,000 1,073,000Target Corporation . . . . . . . . . . . . . . . . . . . . . . . . . . . . . 75,000 6,495,750
13,325,250Specialty Retail — 9.8%
American Eagle Outfitters, Inc. . . . . . . . . . . . . . . . . . . . . . . 200,000 3,380,000Chico’s FAS, Inc. . . . . . . . . . . . . . . . . . . . . . . . . . . . . . . . 200,000 674,000Designer Brands, Inc. - Class A . . . . . . . . . . . . . . . . . . . . . 50,000 958,500Dick’s Sporting Goods, Inc. . . . . . . . . . . . . . . . . . . . . . . . . 85,000 2,943,550Express, Inc. (a) . . . . . . . . . . . . . . . . . . . . . . . . . . . . . . . . 200,000 546,000Genesco, Inc. (a) . . . . . . . . . . . . . . . . . . . . . . . . . . . . . . . 100,000 4,229,000Group 1 Automotive, Inc. . . . . . . . . . . . . . . . . . . . . . . . . . 15,000 1,228,350Hibbett Sports, Inc. (a) . . . . . . . . . . . . . . . . . . . . . . . . . . . 50,000 910,000Home Depot, Inc. (The) . . . . . . . . . . . . . . . . . . . . . . . . . . 5,000 1,039,850Murphy USA, Inc. (a) . . . . . . . . . . . . . . . . . . . . . . . . . . . . 35,000 2,941,050Sally Beauty Holdings, Inc. (a) . . . . . . . . . . . . . . . . . . . . . . 125,000 1,667,500Sleep Number Corporation (a) . . . . . . . . . . . . . . . . . . . . . . 25,000 1,009,750Tile Shop Holdings, Inc. . . . . . . . . . . . . . . . . . . . . . . . . . . 100,000 400,000Ulta Beauty, Inc. (a) . . . . . . . . . . . . . . . . . . . . . . . . . . . . . 5,000 1,734,450Urban Outfitters, Inc. (a) . . . . . . . . . . . . . . . . . . . . . . . . . . 50,000 1,137,500Williams-Sonoma, Inc. . . . . . . . . . . . . . . . . . . . . . . . . . . . 60,000 3,900,000
28,699,500

24
Hussman Strategic Growth Fund Schedule of Investments (continued)
June 30, 2019
COMMON STOCKS — 102.8% (continued) Shares Value
Consumer Discretionary — 24.4% (continued)Textiles, Apparel & Luxury Goods — 0.6%
Carter’s, Inc. . . . . . . . . . . . . . . . . . . . . . . . . . . . . . . . . . . 10,000 $ 975,400Under Armour, Inc. - Class C (a) . . . . . . . . . . . . . . . . . . . . . 35,000 777,000
1,752,400Consumer Staples — 7.3%
Food & Staples Retailing — 2.7% Kroger Company (The) . . . . . . . . . . . . . . . . . . . . . . . . . . . 125,000 2,713,750Sprouts Farmers Market, Inc. (a) . . . . . . . . . . . . . . . . . . . . . 125,000 2,361,250Walgreens Boots Alliance, Inc. . . . . . . . . . . . . . . . . . . . . . 50,000 2,733,500
7,808,500Food Products — 4.6%
B&G Foods, Inc. . . . . . . . . . . . . . . . . . . . . . . . . . . . . . . . 50,000 1,040,000Campbell Soup Company . . . . . . . . . . . . . . . . . . . . . . . . 65,000 2,604,550Darling Ingredients, Inc. (a) . . . . . . . . . . . . . . . . . . . . . . . . 75,000 1,491,750Flowers Foods, Inc. . . . . . . . . . . . . . . . . . . . . . . . . . . . . . 50,000 1,163,500General Mills, Inc. . . . . . . . . . . . . . . . . . . . . . . . . . . . . . . 60,000 3,151,200J.M. Smucker Company (The) . . . . . . . . . . . . . . . . . . . . . . 20,000 2,303,800Kellogg Company . . . . . . . . . . . . . . . . . . . . . . . . . . . . . . 35,000 1,874,950
13,629,750Energy — 1.1%
Oil, Gas & Consumable Fuels — 1.1% Cosan Ltd. - Class A (a) . . . . . . . . . . . . . . . . . . . . . . . . . . . 100,000 1,336,000World Fuel Services Corporation . . . . . . . . . . . . . . . . . . . . 50,000 1,798,000
3,134,000Financials — 3.9%
Consumer Finance — 2.1% American Express Company . . . . . . . . . . . . . . . . . . . . . . . 25,000 3,086,000Discover Financial Services . . . . . . . . . . . . . . . . . . . . . . . . 25,000 1,939,750Nelnet, Inc. - Class A . . . . . . . . . . . . . . . . . . . . . . . . . . . . 20,000 1,184,400
6,210,150Insurance — 1.8%
Aflac, Inc. . . . . . . . . . . . . . . . . . . . . . . . . . . . . . . . . . . . 60,000 3,288,600Progressive Corporation (The) . . . . . . . . . . . . . . . . . . . . . . 25,000 1,998,250
5,286,850Health Care — 15.0%
Biotechnology — 4.0% Alexion Pharmaceuticals, Inc. (a) . . . . . . . . . . . . . . . . . . . . . 10,000 1,309,800Amgen, Inc. . . . . . . . . . . . . . . . . . . . . . . . . . . . . . . . . . . 5,000 921,400

25
Hussman Strategic Growth Fund Schedule of Investments (continued)
June 30, 2019
Hussman Strategic Growth Fund Schedule of Investments (continued)
June 30, 2019
COMMON STOCKS — 102.8% (continued) Shares Value
Health Care — 15.0% (continued)Biotechnology — 4.0% (continued)
Biogen, Inc. (a) . . . . . . . . . . . . . . . . . . . . . . . . . . . . . . . . 10,000 $ 2,338,700Celgene Corporation (a) . . . . . . . . . . . . . . . . . . . . . . . . . . 40,000 3,697,600Regeneron Pharmaceuticals, Inc. (a) . . . . . . . . . . . . . . . . . . . 5,000 1,565,000United Therapeutics Corporation (a) . . . . . . . . . . . . . . . . . . . 25,000 1,951,500
11,784,000Health Care Equipment & Supplies — 2.9%
Cardiovascular Systems, Inc. (a) . . . . . . . . . . . . . . . . . . . . . 50,000 2,146,500Inogen, Inc. (a) . . . . . . . . . . . . . . . . . . . . . . . . . . . . . . . . 15,000 1,001,400Lantheus Holdings, Inc. (a) . . . . . . . . . . . . . . . . . . . . . . . . . 100,000 2,830,000NuVasive, Inc. (a) . . . . . . . . . . . . . . . . . . . . . . . . . . . . . . . 35,000 2,048,900Tandem Diabetes Care, Inc. (a) . . . . . . . . . . . . . . . . . . . . . 10,000 645,200
8,672,000Health Care Providers & Services — 4.2%
Centene Corporation (a) . . . . . . . . . . . . . . . . . . . . . . . . . . 20,000 1,048,800CVS Health Corporation . . . . . . . . . . . . . . . . . . . . . . . . . . 35,000 1,907,150HCA Healthcare, Inc. . . . . . . . . . . . . . . . . . . . . . . . . . . . 20,000 2,703,400Henry Schein, Inc. (a) . . . . . . . . . . . . . . . . . . . . . . . . . . . . 60,000 4,194,000Tenet Healthcare Corporation (a) . . . . . . . . . . . . . . . . . . . . . 50,000 1,033,000WellCare Health Plans, Inc. (a) . . . . . . . . . . . . . . . . . . . . . . 5,000 1,425,350
12,311,700Health Care Technology — 0.5%
Cerner Corporation . . . . . . . . . . . . . . . . . . . . . . . . . . . . . 20,000 1,466,000
Life Sciences Tools & Services — 1.6% Luminex Corporation . . . . . . . . . . . . . . . . . . . . . . . . . . . . 125,000 2,580,000NeoGenomics, Inc. (a) . . . . . . . . . . . . . . . . . . . . . . . . . . . 100,000 2,194,000
4,774,000Pharmaceuticals — 1.8%
ANI Pharmaceuticals, Inc. (a) . . . . . . . . . . . . . . . . . . . . . . . 25,000 2,055,000Endo International plc (a) . . . . . . . . . . . . . . . . . . . . . . . . . . 200,000 824,000Mallinckrodt plc (a) . . . . . . . . . . . . . . . . . . . . . . . . . . . . . . 165,000 1,514,700Supernus Pharmaceuticals, Inc. (a) . . . . . . . . . . . . . . . . . . . . 25,000 827,250
5,220,950Industrials — 11.1%
Air Freight & Logistics — 0.4% United Parcel Service, Inc. - Class B . . . . . . . . . . . . . . . . . . 10,000 1,032,700

26
Hussman Strategic Growth Fund Schedule of Investments (continued)
June 30, 2019
COMMON STOCKS — 102.8% (continued) Shares Value
Industrials — 11.1% (continued)Airlines — 0.6%
Spirit Airlines, Inc. (a) . . . . . . . . . . . . . . . . . . . . . . . . . . . . 35,000 $ 1,670,550
Building Products — 1.1% Allegion plc . . . . . . . . . . . . . . . . . . . . . . . . . . . . . . . . . . 30,000 3,316,500
Commercial Services & Supplies — 2.3% Covanta Holding Corporation . . . . . . . . . . . . . . . . . . . . . . 150,000 2,686,500Steelcase, Inc. - Class A . . . . . . . . . . . . . . . . . . . . . . . . . . 125,000 2,137,500Tetra Tech, Inc. . . . . . . . . . . . . . . . . . . . . . . . . . . . . . . . . 25,000 1,963,750
6,787,750Construction & Engineering — 1.4%
Quanta Services, Inc. . . . . . . . . . . . . . . . . . . . . . . . . . . . . 110,000 4,200,900
Electrical Equipment — 1.6% Atkore International Group, Inc. (a) . . . . . . . . . . . . . . . . . . . 25,000 646,750Generac Holdings, Inc. (a) . . . . . . . . . . . . . . . . . . . . . . . . . 60,000 4,164,600
4,811,350Machinery — 0.8%
Allison Transmission Holdings, Inc. . . . . . . . . . . . . . . . . . . . 50,000 2,317,500
Marine — 1.0% Matson, Inc. . . . . . . . . . . . . . . . . . . . . . . . . . . . . . . . . . . 75,000 2,913,750
Professional Services — 0.7% Robert Half International, Inc. . . . . . . . . . . . . . . . . . . . . . . . 35,000 1,995,350
Trading Companies & Distributors — 1.2% Aircastle Ltd. . . . . . . . . . . . . . . . . . . . . . . . . . . . . . . . . . . 50,000 1,063,000Fastenal Company . . . . . . . . . . . . . . . . . . . . . . . . . . . . . 80,000 2,607,200
3,670,200Information Technology — 13.1%
Communications Equipment — 2.5% Ciena Corporation (a) . . . . . . . . . . . . . . . . . . . . . . . . . . . . 75,000 3,084,750F5 Networks, Inc. (a) . . . . . . . . . . . . . . . . . . . . . . . . . . . . 15,000 2,184,450ViaSat, Inc. (a) . . . . . . . . . . . . . . . . . . . . . . . . . . . . . . . . . 25,000 2,020,500
7,289,700

27
Hussman Strategic Growth Fund Schedule of Investments (continued)
June 30, 2019
Hussman Strategic Growth Fund Schedule of Investments (continued)
June 30, 2019
COMMON STOCKS — 102.8% (continued) Shares Value
Information Technology — 13.1% (continued)Electronic Equipment, Instruments & Components — 1.3%
Fabrinet (a) . . . . . . . . . . . . . . . . . . . . . . . . . . . . . . . . . . . 35,000 $ 1,738,450ScanSource, Inc. (a) . . . . . . . . . . . . . . . . . . . . . . . . . . . . . 65,000 2,116,400
3,854,850IT Services — 4.8%
21Vianet Group, Inc. - ADR (a) . . . . . . . . . . . . . . . . . . . . . . 75,000 584,250Akamai Technologies, Inc. (a) . . . . . . . . . . . . . . . . . . . . . . . 50,000 4,007,000Cardtronics plc - Class A (a) . . . . . . . . . . . . . . . . . . . . . . . . 100,000 2,732,000Cognizant Technology Solutions Corporation - Class A . . . . . 15,000 950,850Genpact Ltd. . . . . . . . . . . . . . . . . . . . . . . . . . . . . . . . . . 35,000 1,333,150NIC, Inc. . . . . . . . . . . . . . . . . . . . . . . . . . . . . . . . . . . . . 150,000 2,406,000Virtusa Corporation (a) . . . . . . . . . . . . . . . . . . . . . . . . . . . 50,000 2,221,500
14,234,750Semiconductors & Semiconductor Equipment — 3.0%
Canadian Solar, Inc. (a) . . . . . . . . . . . . . . . . . . . . . . . . . . 150,000 3,274,500Intel Corporation . . . . . . . . . . . . . . . . . . . . . . . . . . . . . . . 25,000 1,196,750JinkoSolar Holding Company Ltd. - ADR (a) . . . . . . . . . . . . . . 75,000 1,626,750SolarEdge Technologies, Inc. (a) . . . . . . . . . . . . . . . . . . . . . 20,000 1,249,200Xperi Corporation . . . . . . . . . . . . . . . . . . . . . . . . . . . . . . 75,000 1,544,250
8,891,450Software — 0.3%
FireEye, Inc. (a) . . . . . . . . . . . . . . . . . . . . . . . . . . . . . . . . 50,000 740,500
Technology Hardware, Storage & Peripherals — 1.2% 3D Systems Corporation (a) . . . . . . . . . . . . . . . . . . . . . . . . 225,000 2,047,500Stratasys Ltd. (a) . . . . . . . . . . . . . . . . . . . . . . . . . . . . . . . . 50,000 1,468,500
3,516,000Materials — 7.2%
Chemicals — 0.4% CF Industries Holdings, Inc. . . . . . . . . . . . . . . . . . . . . . . . . 25,000 1,167,750
Containers & Packaging — 1.3% Crown Holdings, Inc. (a) . . . . . . . . . . . . . . . . . . . . . . . . . . 65,000 3,971,500
Metals & Mining — 5.5% Agnico-Eagle Mines Ltd. . . . . . . . . . . . . . . . . . . . . . . . . . . 100,000 5,124,000Barrick Gold Corporation . . . . . . . . . . . . . . . . . . . . . . . . . 453,200 7,146,964Newmont Mining Corporation . . . . . . . . . . . . . . . . . . . . . . 100,000 3,847,000
16,117,964

28
Hussman Strategic Growth Fund Schedule of Investments (continued)
June 30, 2019
COMMON STOCKS — 102.8% (continued) Shares Value
Real Estate — 1.0%Equity Real Estate Investment Trusts (REITs) — 1.0%
Hannon Armstrong Sustainable Infrastructure Capital, Inc. . . . . 100,000 $ 2,818,000
Utilities — 3.2%Electric Utilities — 1.6%
Exelon Corporation . . . . . . . . . . . . . . . . . . . . . . . . . . . . . 100,000 4,794,000
Independent Power and Renewable Electricity Producers — 1.6% AES Corporation . . . . . . . . . . . . . . . . . . . . . . . . . . . . . . . 100,000 1,676,000Pattern Energy Group, Inc. . . . . . . . . . . . . . . . . . . . . . . . . 125,000 2,886,250
4,562,250
Total Common Stocks (Cost $303,504,337) . . . . . . . . . . . . . $ 302,249,214
EXCHANGE-TRADED PUT OPTION CONTRACTS — 2.0% Contracts
Notional Amount Value
Nasdaq 100 Index Option, 08/16/2019 at $7,500 . . . . . . . . . . . 25 $ 19,177,688 $ 353,750
Russell 2000 Index Option, 08/16/2019 at $1,550 . . . . . . . . . . . 400 62,662,880 1,225,200
S&P 500 Index Option, 08/16/2019 at $2,950 . . . . . . . . . . . 725 213,277,600 4,292,000
Total Put Option Contracts (Cost $5,895,405) . . . . . . . . . . . . . . . . $ 295,118,168 $ 5,870,950
Total Investments at Value — 104.8% (Cost $309,399,742) . . . . . . . . . . . . . . $ 308,120,164

29
Hussman Strategic Growth Fund Schedule of Investments (continued)
June 30, 2019
Hussman Strategic Growth Fund Schedule of Investments (continued)
June 30, 2019
MONEY MARKET FUNDS — 56.8% Shares Value
Invesco Short-Term Investments Trust - Treasury Portfolio - Institutional Class, 2.22% (b) (Cost $166,886,610) . . . . . . . . . 166,886,610 $ 166,886,610
Total Investments and Money Market Funds at Value — 161.6% (Cost $476,286,352) . . . . . . . . . . . . . . . . . . . . . . $ 475,006,774
Written Call Option Contracts — (62.6%) . . . . . . . . . . . . . . (183,898,100)
Other Assets in Excess of Liabilities — 1.0% . . . . . . . . . . . 2,797,215
Net Assets — 100.0% . . . . . . . . . . . . . . . . . . . . . . . . . . . . . $ 293,905,889
ADR - American Depositary Receipt.(a) Non-income producing security.(b) The rate shown is the 7-day effective yield as of June 30, 2019.
See accompanying notes to financial statements.

30
Hussman Strategic Growth Fund Schedule of Open Written Option ContractsJune 30, 2019
WRITTEN CALL OPTION CONTRACTS Contracts
Notional Amount
Strike Price
Expiration Date
Value of Options
Call Option ContractsNasdaq 100 Index Option . . 25 $ 19,177,688 $ 4,000 09/20/2019 $ 9,184,500Russell 2000 Index Option . . 400 62,662,880 700 09/20/2019 34,585,600S&P 500 Index Option . . . . 725 213,277,600 1,000 09/20/2019 140,128,000
Total Written Call Option Contracts (Premiums received $171,756,616) . . $ 295,118,168 $ 183,898,100
See accompanying notes to financial statements.

31
Hussman Strategic Growth Fund Schedule of Open Written Option ContractsJune 30, 2019
Hussman Strategic Total Return FundSchedule of InvestmentsJune 30, 2019
COMMON STOCKS — 21.1% Shares Value
Energy — 3.8%Energy Equipment & Services — 1.5%
Halliburton Company . . . . . . . . . . . . . . . . . . . . . . . . . . . . 35,000 $ 795,900Helmerich & Payne, Inc. . . . . . . . . . . . . . . . . . . . . . . . . . . 25,000 1,265,500Schlumberger Ltd. . . . . . . . . . . . . . . . . . . . . . . . . . . . . . . 35,000 1,390,900
3,452,300Oil, Gas & Consumable Fuels — 2.3%
Cheniere Energy Partners, L.P. . . . . . . . . . . . . . . . . . . . . . . 20,000 843,600CNX Midstream Partners, L.P. . . . . . . . . . . . . . . . . . . . . . . 60,000 843,000NuStar Energy, L.P. . . . . . . . . . . . . . . . . . . . . . . . . . . . . . 31,000 841,340ONEOK, Inc. . . . . . . . . . . . . . . . . . . . . . . . . . . . . . . . . . 985 67,778PBF Energy, Inc. - Class A . . . . . . . . . . . . . . . . . . . . . . . . . 35,000 1,095,500Valero Energy Corporation . . . . . . . . . . . . . . . . . . . . . . . . 15,000 1,284,150Williams Companies, Inc. (The) . . . . . . . . . . . . . . . . . . . . . 1,293 36,255
5,011,623Materials — 14.8%
Metals & Mining — 14.8% Agnico-Eagle Mines Ltd. . . . . . . . . . . . . . . . . . . . . . . . . . . 75,000 3,843,000AngloGold Ashanti Ltd. - ADR . . . . . . . . . . . . . . . . . . . . . . 125,000 2,226,250B2Gold Corporation (a) . . . . . . . . . . . . . . . . . . . . . . . . . . 200,000 606,000Barrick Gold Corporation . . . . . . . . . . . . . . . . . . . . . . . . . 400,000 6,308,000Coeur Mining, Inc. (a) . . . . . . . . . . . . . . . . . . . . . . . . . . . . 25,000 108,500Compania de Minas Buenaventura S.A.A. - ADR . . . . . . . . . 75,000 1,250,250Kinross Gold Corporation (a) . . . . . . . . . . . . . . . . . . . . . . . 500,000 1,940,000Newmont Mining Corporation . . . . . . . . . . . . . . . . . . . . . . 200,000 7,694,000Novagold Resources, Inc. (a) . . . . . . . . . . . . . . . . . . . . . . . 100,000 591,000Pan American Silver Corporation . . . . . . . . . . . . . . . . . . . . 55,000 710,050Royal Gold, Inc. . . . . . . . . . . . . . . . . . . . . . . . . . . . . . . . 25,000 2,562,250Sibanye Gold Ltd. - ADR (a) . . . . . . . . . . . . . . . . . . . . . . . . 181,900 864,025Wheaton Precious Metals Corporation . . . . . . . . . . . . . . . . 125,000 3,022,500Yamana Gold, Inc. . . . . . . . . . . . . . . . . . . . . . . . . . . . . . 400,000 1,008,000
32,733,825Utilities — 2.5%
Electric Utilities — 1.9% American Electric Power Company, Inc. . . . . . . . . . . . . . . . 1,000 88,010Duke Energy Corporation . . . . . . . . . . . . . . . . . . . . . . . . . 9,333 823,544Edison International . . . . . . . . . . . . . . . . . . . . . . . . . . . . . 10,000 674,100Entergy Corporation . . . . . . . . . . . . . . . . . . . . . . . . . . . . . 1,000 102,930Exelon Corporation . . . . . . . . . . . . . . . . . . . . . . . . . . . . . 15,000 719,100

32
Hussman Strategic Total Return Fund Schedule of Investments (continued)
June 30, 2019
COMMON STOCKS — 21.1% (continued) Shares Value
Utilities — 2.5% (continued)Electric Utilities — 1.9% (continued)
FirstEnergy Corporation . . . . . . . . . . . . . . . . . . . . . . . . . . 1,000 $ 42,810NextEra Energy, Inc. . . . . . . . . . . . . . . . . . . . . . . . . . . . . 1,000 204,860Pinnacle West Capital Corporation . . . . . . . . . . . . . . . . . . 1,000 94,090PPL Corporation . . . . . . . . . . . . . . . . . . . . . . . . . . . . . . . 25,000 775,250Southern Company (The) . . . . . . . . . . . . . . . . . . . . . . . . . . 15,000 829,200
4,353,894Independent Power and Renewable Electricity Producers — 0.4%
AES Corporation . . . . . . . . . . . . . . . . . . . . . . . . . . . . . . . 50,000 838,000
Multi-Utilities — 0.2% Ameren Corporation . . . . . . . . . . . . . . . . . . . . . . . . . . . . 1,000 75,110Dominion Energy, Inc. . . . . . . . . . . . . . . . . . . . . . . . . . . . 1,669 129,047DTE Energy Company . . . . . . . . . . . . . . . . . . . . . . . . . . . 1,000 127,880Public Service Enterprise Group, Inc. . . . . . . . . . . . . . . . . . . 1,000 58,820
390,857
Total Common Stocks (Cost $39,833,832) . . . . . . . . . . . . . . $ 46,780,499
U.S. TREASURY OBLIGATIONS — 70.0% Par Value Value
U.S. Treasury Inflation-Protected Notes — 6.5%2.50%, due 01/15/2029 . . . . . . . . . . . . . . . . . . . . . . . $ 11,900,500 $ 14,322,449
U.S. Treasury Notes — 63.5%1.25%, due 08/31/2019 . . . . . . . . . . . . . . . . . . . . . . . 50,000,000 49,914,9962.00%, due 05/31/2024 . . . . . . . . . . . . . . . . . . . . . . . 25,000,000 25,296,3872.125%, due 05/31/2026 . . . . . . . . . . . . . . . . . . . . . . 10,000,000 10,168,1641.50%, due 08/15/2026 . . . . . . . . . . . . . . . . . . . . . . . 25,000,000 24,365,2452.25%, due 02/15/2027 . . . . . . . . . . . . . . . . . . . . . . . 20,000,000 20,499,2192.25%, due 11/15/2027 . . . . . . . . . . . . . . . . . . . . . . . 10,000,000 10,239,258
140,483,269
Total U.S. Treasury Obligations (Cost $150,619,442) . . . . . $ 154,805,718

33
Hussman Strategic Total Return Fund Schedule of Investments (continued)
June 30, 2019
Hussman Strategic Total Return Fund Schedule of Investments (continued)
June 30, 2019
EXCHANGE-TRADED FUNDS — 4.0% Shares Value
Invesco CurrencyShares British Pound Sterling Trust (a) . . . . . . . . . . . 20,000 $ 2,462,800Invesco CurrencyShares Euro Currency Trust (a) . . . . . . . . . . . . . . . 20,000 2,165,400Invesco CurrencyShares Japanese Yen Trust (a) . . . . . . . . . . . . . . . . 1,000 88,340Invesco CurrencyShares Swedish Krona Trust (a) . . . . . . . . . . . . . . 5,000 499,989Invesco CurrencyShares Swiss Franc Trust (a) . . . . . . . . . . . . . . . . . 5,000 474,550iShares 1-3 Year International Treasury Bond ETF . . . . . . . . . . . . . . 1,000 80,160iShares Gold Trust (a) . . . . . . . . . . . . . . . . . . . . . . . . . . . . . . . . 25,000 337,500iShares International Treasury Bond ETF . . . . . . . . . . . . . . . . . . . . 2,000 101,700SPDR Bloomberg Barclays International Treasury Bond ETF . . . . . . . 2,000 57,840SPDR Bloomberg Barclays Short Term International Treasury Bond ETF . . 1,000 31,080SPDR FTSE International Government Inflation-Protected Bond ETF . . . 1,000 55,580SPDR Gold Shares (a) . . . . . . . . . . . . . . . . . . . . . . . . . . . . . . . . 5,000 666,000United States Oil Fund, L.P. (a) . . . . . . . . . . . . . . . . . . . . . . . . . . 150,000 1,806,000Total Exchange-Traded Funds (Cost $8,199,051) . . . . . . . . . $ 8,826,939
Total Investments at Value — 95.1% (Cost $198,652,325) . $ 210,413,156
MONEY MARKET FUNDS — 4.7% Shares Value
Invesco Short-Term Investments Trust - Treasury Portfolio - Institutional Class, 2.22% (b) (Cost $10,319,036) . . . . . . . . . . 10,319,036 $ 10,319,036
Total Investments and Money Market Funds at Value — 99.8% (Cost $208,971,361) . . . . . . . . . . . . . . . . . . . . . . . $ 220,732,192
Other Assets in Excess of Liabilities — 0.2% . . . . . . . . . . . 502,974
Net Assets — 100.0% . . . . . . . . . . . . . . . . . . . . . . . . . . . . . $ 221,235,166
ADR - American Depositary Receipt.(a) Non-income producing security.(b) The rate shown is the 7-day effective yield as of June 30, 2019.
See accompanying notes to financial statements.

34
Hussman Strategic International FundSchedule of Investments June 30, 2019
COMMON STOCKS — 63.1% Shares Value
Australia — 4.0%Bapcor Ltd. (a) . . . . . . . . . . . . . . . . . . . . . . . . . . . . . . . . . 24,000 $ 94,215Crown Resorts Ltd. (a) . . . . . . . . . . . . . . . . . . . . . . . . . . . . 21,000 183,549Harvey Norman Holdings Ltd. (a) . . . . . . . . . . . . . . . . . . . . 70,000 200,310Super Retail Group Ltd. (a) . . . . . . . . . . . . . . . . . . . . . . . . . 40,000 231,525TPG Telecom Ltd. (a) . . . . . . . . . . . . . . . . . . . . . . . . . . . . . 40,000 181,034
890,633Belgium — 1.4%
AGFA-Gevaert N.V. (a) (b) . . . . . . . . . . . . . . . . . . . . . . . . . 34,000 132,086Colruyt S.A. (a) . . . . . . . . . . . . . . . . . . . . . . . . . . . . . . . . 3,000 174,167
306,253Canada — 10.3%
Air Canada (b) . . . . . . . . . . . . . . . . . . . . . . . . . . . . . . . . 7,000 212,137Great-West Lifeco, Inc. . . . . . . . . . . . . . . . . . . . . . . . . . . . 10,000 230,211IGM Financial, Inc. . . . . . . . . . . . . . . . . . . . . . . . . . . . . . 7,000 199,844Magna International, Inc. . . . . . . . . . . . . . . . . . . . . . . . . . 1,600 79,605Manulife Financial Corporation . . . . . . . . . . . . . . . . . . . . . 10,000 181,725Metro, Inc. . . . . . . . . . . . . . . . . . . . . . . . . . . . . . . . . . . . 5,600 210,117MTY Food Group, Inc. . . . . . . . . . . . . . . . . . . . . . . . . . . . 5,000 249,528Open Text Corporation . . . . . . . . . . . . . . . . . . . . . . . . . . . 5,500 226,943Power Corporation of Canada . . . . . . . . . . . . . . . . . . . . . 10,400 224,014Ritchie Bros. Auctioneers, Inc. . . . . . . . . . . . . . . . . . . . . . . 5,600 186,215Royal Bank of Canada . . . . . . . . . . . . . . . . . . . . . . . . . . . 3,200 254,281
2,254,620Denmark — 0.7%
Tryg A/S (a) . . . . . . . . . . . . . . . . . . . . . . . . . . . . . . . . . . 5,000 162,708
Finland — 0.5%Tikkurila Oyj . . . . . . . . . . . . . . . . . . . . . . . . . . . . . . . . . . 7,200 121,174
France — 5.1%Albioma S.A. (a) . . . . . . . . . . . . . . . . . . . . . . . . . . . . . . . 8,000 212,042Electricite de France S.A. (a) . . . . . . . . . . . . . . . . . . . . . . . 20,000 252,166Eutelsat Communications S.A. (a) . . . . . . . . . . . . . . . . . . . . 11,000 205,444Ingenico Group S.A. (a) . . . . . . . . . . . . . . . . . . . . . . . . . . 2,500 221,261Neopost S.A. (a) . . . . . . . . . . . . . . . . . . . . . . . . . . . . . . . 10,500 224,647
1,115,560Germany — 1.1%
SAP SE - ADR . . . . . . . . . . . . . . . . . . . . . . . . . . . . . . . . . 1,000 136,800

35
Hussman Strategic International Fund Schedule of Investments (continued)
June 30, 2019
COMMON STOCKS — 63.1% (continued) Shares Value
Germany — 1.1% (continued)STRATEC SE . . . . . . . . . . . . . . . . . . . . . . . . . . . . . . . . . . 1,500 $ 97,055
233,855
Japan — 13.8%Advantest Corporation (a) . . . . . . . . . . . . . . . . . . . . . . . . . 8,000 220,257Kanagawa Chuo Kotsu Company Ltd. (a) . . . . . . . . . . . . . . . 7,100 244,798Kato Works Company Ltd. (a) . . . . . . . . . . . . . . . . . . . . . . 9,000 168,201Konica Minolta, Inc. (a) . . . . . . . . . . . . . . . . . . . . . . . . . . . 20,000 194,881Kurimoto Ltd. (a) . . . . . . . . . . . . . . . . . . . . . . . . . . . . . . . . 5,000 67,466Marvelous, Inc. (a) . . . . . . . . . . . . . . . . . . . . . . . . . . . . . . 25,000 190,351Nihon Chouzai Company Ltd. (a) (b) . . . . . . . . . . . . . . . . . . 5,000 154,820NuFlare Technology, Inc. (a) . . . . . . . . . . . . . . . . . . . . . . . . 3,000 184,718Rakuten, Inc. (a) . . . . . . . . . . . . . . . . . . . . . . . . . . . . . . . . 17,500 209,225Sawai Pharmaceutical Company Ltd. (a) . . . . . . . . . . . . . . . 4,000 216,514Shinko Plantech Company Ltd. (a) . . . . . . . . . . . . . . . . . . . . 17,500 205,671SoftBank Group Corporation (a) . . . . . . . . . . . . . . . . . . . . . 5,600 269,738SRG Takamiya Company Ltd. (a) . . . . . . . . . . . . . . . . . . . . . 25,000 179,094Towa Pharmaceutical Company Ltd. (a) . . . . . . . . . . . . . . . . 7,200 183,279Toyota Motor Corporation (a) . . . . . . . . . . . . . . . . . . . . . . . 3,000 186,200Yamazen Corporation (a) (b) . . . . . . . . . . . . . . . . . . . . . . . . 15,000 144,720
3,019,933Netherlands — 1.7%
NN Group N.V. (a) . . . . . . . . . . . . . . . . . . . . . . . . . . . . . 5,000 201,001Randstad N.V. (a) . . . . . . . . . . . . . . . . . . . . . . . . . . . . . . . 3,150 172,887
373,888Norway — 4.9%
Austevoll Seafood ASA (a) . . . . . . . . . . . . . . . . . . . . . . . . . 19,000 199,691Borregaard ASA (a) . . . . . . . . . . . . . . . . . . . . . . . . . . . . . 16,800 194,714Equinor ASA (a) . . . . . . . . . . . . . . . . . . . . . . . . . . . . . . . . 7,700 152,738Gjensidige Forsikring ASA (a) . . . . . . . . . . . . . . . . . . . . . . . 12,000 241,847Norway Royal Salmon ASA (a) . . . . . . . . . . . . . . . . . . . . . . 5,045 107,201Olav Thon Eiendomsselskap ASA . . . . . . . . . . . . . . . . . . . . 11,000 185,676
1,081,867Portugal — 0.9%
EDP-Energias de Portugal S.A. (a) . . . . . . . . . . . . . . . . . . . . 50,000 190,029
Sweden — 10.1%Granges AB (a) . . . . . . . . . . . . . . . . . . . . . . . . . . . . . . . . 21,000 240,543Hennes & Mauritz AB - B Shares (a) . . . . . . . . . . . . . . . . . . 8,000 142,139

36
Hussman Strategic International Fund Schedule of Investments (continued)
June 30, 2019
COMMON STOCKS — 63.1% (continued) Shares Value
Sweden — 10.1% (continued)Hexpol AB (a) . . . . . . . . . . . . . . . . . . . . . . . . . . . . . . . . . 30,000 $ 244,746ICA Gruppen AB . . . . . . . . . . . . . . . . . . . . . . . . . . . . . . 4,900 210,660Intrum AB (a) . . . . . . . . . . . . . . . . . . . . . . . . . . . . . . . . . . 8,000 205,659JM AB (a) . . . . . . . . . . . . . . . . . . . . . . . . . . . . . . . . . . . . 8,400 193,213Modern Times Group MTG AB - Class B (a) (b) . . . . . . . . . . . 3,500 39,247Mycronic AB (a) . . . . . . . . . . . . . . . . . . . . . . . . . . . . . . . . 17,500 212,955Nordic Entertainment Group AB - Class B . . . . . . . . . . . . . . 5,000 117,388Peab AB (a) . . . . . . . . . . . . . . . . . . . . . . . . . . . . . . . . . . 20,000 171,032SKF AB - B Shares (a) . . . . . . . . . . . . . . . . . . . . . . . . . . . . 10,500 193,312Telia Company AB (a) . . . . . . . . . . . . . . . . . . . . . . . . . . . . 55,000 243,850
2,214,744Switzerland — 1.0%
Swiss Re AG (a) . . . . . . . . . . . . . . . . . . . . . . . . . . . . . . . . 2,100 213,399
United Kingdom — 7.6%Aggreko plc (a) . . . . . . . . . . . . . . . . . . . . . . . . . . . . . . . . 20,000 200,785Ashtead Group plc (a) . . . . . . . . . . . . . . . . . . . . . . . . . . . . 5,600 160,444Bovis Homes Group plc (a) . . . . . . . . . . . . . . . . . . . . . . . . 10,000 131,465Burberry Group plc (a) . . . . . . . . . . . . . . . . . . . . . . . . . . . 8,500 201,464Dunelm Group plc . . . . . . . . . . . . . . . . . . . . . . . . . . . . . . 12,000 140,199GlaxoSmithKline plc (a) . . . . . . . . . . . . . . . . . . . . . . . . . . . 9,100 182,404Next plc (a) . . . . . . . . . . . . . . . . . . . . . . . . . . . . . . . . . . . 2,800 196,071QinetiQ Group plc (a) . . . . . . . . . . . . . . . . . . . . . . . . . . . 65,000 230,962SThree plc . . . . . . . . . . . . . . . . . . . . . . . . . . . . . . . . . . . 60,484 218,909
1,662,703
Total Investments at Value — 63.1% (Cost $13,179,722) . . $ 13,841,366

37
Hussman Strategic International Fund Schedule of Investments (continued)
June 30, 2019
MONEY MARKET FUNDS — 28.5% Shares Value
Northern Institutional Treasury Portfolio, 2.25% (c) (Cost $6,240,822) . . . . . . . . . . . . . . . . . . . . . . . . . . . . . . . 6,240,822 $ 6,240,822
Total Investments and Money Market Funds at Value — 91.6% (Cost $19,420,544) . . . . . . . . . . . . . . . . . . . . . . . . . . . $ 20,082,188
Other Assets in Excess of Liabilities — 8.4% . . . . . . . . . . . . 1,851,917
Net Assets — 100.0% . . . . . . . . . . . . . . . . . . . . . . . . . . . . . $ 21,934,105
ADR - American Depositary Receipt.(a) Level 2 Security (Note 1).(b) Non-income producing security.(c) The rate shown is the 7-day effective yield as of June 30, 2019.
See accompanying notes to financial statements.
Hussman Strategic International Fund Schedule of Investments (continued)
June 30, 2019

38
Hussman Strategic International Fund Schedule of Investments (continued)
June 30, 2019
Common Stocks by Sector/Industry% of Net Assets
Communication Services — 5.7%Diversified Telecommunication Services . . . . . . . . . . . . . . . . . . . . . . . . . . . . . . . . . . . . 2.0%Entertainment . . . . . . . . . . . . . . . . . . . . . . . . . . . . . . . . . . . . . . . . . . . . . . . . . . . . . 1.4%Media . . . . . . . . . . . . . . . . . . . . . . . . . . . . . . . . . . . . . . . . . . . . . . . . . . . . . . . . . . 1.1%Wireless Telecommunication Services . . . . . . . . . . . . . . . . . . . . . . . . . . . . . . . . . . . . . 1.2%
Consumer Discretionary — 11.1%Auto Components . . . . . . . . . . . . . . . . . . . . . . . . . . . . . . . . . . . . . . . . . . . . . . . . . . 0.4%Automobiles . . . . . . . . . . . . . . . . . . . . . . . . . . . . . . . . . . . . . . . . . . . . . . . . . . . . . . 0.8%Distributors . . . . . . . . . . . . . . . . . . . . . . . . . . . . . . . . . . . . . . . . . . . . . . . . . . . . . . . 0.4%Hotels, Restaurants & Leisure . . . . . . . . . . . . . . . . . . . . . . . . . . . . . . . . . . . . . . . . . . . 2.0%Household Durables . . . . . . . . . . . . . . . . . . . . . . . . . . . . . . . . . . . . . . . . . . . . . . . . . 1.5%Internet & Direct Marketing Retail . . . . . . . . . . . . . . . . . . . . . . . . . . . . . . . . . . . . . . . . 1.0%Multiline Retail . . . . . . . . . . . . . . . . . . . . . . . . . . . . . . . . . . . . . . . . . . . . . . . . . . . . 1.8%Specialty Retail . . . . . . . . . . . . . . . . . . . . . . . . . . . . . . . . . . . . . . . . . . . . . . . . . . . . 2.3%Textiles, Apparel & Luxury Goods . . . . . . . . . . . . . . . . . . . . . . . . . . . . . . . . . . . . . . . . 0.9%
Consumer Staples — 4.8%Food & Staples Retailing . . . . . . . . . . . . . . . . . . . . . . . . . . . . . . . . . . . . . . . . . . . . . . 3.4%Food Products . . . . . . . . . . . . . . . . . . . . . . . . . . . . . . . . . . . . . . . . . . . . . . . . . . . . . 1.4%
Energy — 1.6%Energy Equipment & Services . . . . . . . . . . . . . . . . . . . . . . . . . . . . . . . . . . . . . . . . . . 0.9%Oil, Gas & Consumable Fuels . . . . . . . . . . . . . . . . . . . . . . . . . . . . . . . . . . . . . . . . . . 0.7%
Financials — 8.7%Banks . . . . . . . . . . . . . . . . . . . . . . . . . . . . . . . . . . . . . . . . . . . . . . . . . . . . . . . . . . 1.2%Capital Markets . . . . . . . . . . . . . . . . . . . . . . . . . . . . . . . . . . . . . . . . . . . . . . . . . . . 0.9%Insurance . . . . . . . . . . . . . . . . . . . . . . . . . . . . . . . . . . . . . . . . . . . . . . . . . . . . . . . . 6.6%
Health Care — 3.7%Health Care Equipment & Supplies . . . . . . . . . . . . . . . . . . . . . . . . . . . . . . . . . . . . . . . 0.4%Health Care Technology . . . . . . . . . . . . . . . . . . . . . . . . . . . . . . . . . . . . . . . . . . . . . . 0.6%Pharmaceuticals . . . . . . . . . . . . . . . . . . . . . . . . . . . . . . . . . . . . . . . . . . . . . . . . . . . 2.7%
Industrials — 12.3%Aerospace & Defense . . . . . . . . . . . . . . . . . . . . . . . . . . . . . . . . . . . . . . . . . . . . . . . 1.1%Airlines . . . . . . . . . . . . . . . . . . . . . . . . . . . . . . . . . . . . . . . . . . . . . . . . . . . . . . . . . 1.0%Commercial Services & Supplies . . . . . . . . . . . . . . . . . . . . . . . . . . . . . . . . . . . . . . . . 2.7%Construction & Engineering . . . . . . . . . . . . . . . . . . . . . . . . . . . . . . . . . . . . . . . . . . . . 0.8%Machinery . . . . . . . . . . . . . . . . . . . . . . . . . . . . . . . . . . . . . . . . . . . . . . . . . . . . . . . 1.6%Professional Services . . . . . . . . . . . . . . . . . . . . . . . . . . . . . . . . . . . . . . . . . . . . . . . . 1.8%Road & Rail . . . . . . . . . . . . . . . . . . . . . . . . . . . . . . . . . . . . . . . . . . . . . . . . . . . . . . 1.1%Trading Companies & Distributors . . . . . . . . . . . . . . . . . . . . . . . . . . . . . . . . . . . . . . . . 2.2%
Hussman Strategic International Fund Schedule of Futures Contracts Sold ShortJune 30, 2019

39
Common Stocks by Sector/Industry (continued)% of Net Assets
Information Technology — 7.4%Electronic Equipment, Instruments & Components . . . . . . . . . . . . . . . . . . . . . . . . . . . . . . 2.0%Semiconductors & Semiconductor Equipment . . . . . . . . . . . . . . . . . . . . . . . . . . . . . . . . 1.8%Software . . . . . . . . . . . . . . . . . . . . . . . . . . . . . . . . . . . . . . . . . . . . . . . . . . . . . . . . 1.7%Technology Hardware, Storage & Peripherals . . . . . . . . . . . . . . . . . . . . . . . . . . . . . . . . 1.9%
Materials — 4.0%Chemicals . . . . . . . . . . . . . . . . . . . . . . . . . . . . . . . . . . . . . . . . . . . . . . . . . . . . . . . 2.6%Metals & Mining . . . . . . . . . . . . . . . . . . . . . . . . . . . . . . . . . . . . . . . . . . . . . . . . . . . 1.4%
Real Estate — 0.8%Real Estate Management & Development . . . . . . . . . . . . . . . . . . . . . . . . . . . . . . . . . . . 0.8%
Utilities — 3.0%Electric Utilities . . . . . . . . . . . . . . . . . . . . . . . . . . . . . . . . . . . . . . . . . . . . . . . . . . . . 2.0%Independent Power and Renewable Electricity Producers . . . . . . . . . . . . . . . . . . . . . . . . 1.0%
63.1%
See accompanying notes to financial statements.
Hussman Strategic International Fund Schedule of Futures Contracts Sold ShortJune 30, 2019
FUTURES CONTRACTS SOLD SHORT Contracts
Expiration Date
Notional Amount
Value/Unrealized
Depreciation*
FINANCIAL FUTURESMini MSCI EAFE Index Futures . . . . . . . 140 09/20/2019 $ 13,463,100 $ (312,050)
* Includes cumulative appreciation (depreciation) of futures contracts from the date that contracts were opened through June 30, 2019. Only current day variation margin is reported on the Statements of Assets and Liabilities.
See accompanying notes to financial statements.
Hussman Strategic International Fund Schedule of Investments (continued)
June 30, 2019

40
Hussman Strategic
Growth Fund
Hussman Strategic Total Return Fund
ASSETSInvestments in securities:
At cost . . . . . . . . . . . . . . . . . . . . . . . . . . . . . . . . . . . . . . . . . . . $ 309,399,742 $ 198,652,325At value (Note 1) . . . . . . . . . . . . . . . . . . . . . . . . . . . . . . . . . . . . $ 308,120,164 $ 210,413,156
Investments in money market funds . . . . . . . . . . . . . . . . . . . . . . . . . . . 166,886,610 10,319,036Cash . . . . . . . . . . . . . . . . . . . . . . . . . . . . . . . . . . . . . . . . . . . . . . 8,100 —Receivable for capital shares sold . . . . . . . . . . . . . . . . . . . . . . . . . . . 202,412 76,884Receivable for investment securities sold . . . . . . . . . . . . . . . . . . . . . . . 7,186,241 —Dividends and interest receivable . . . . . . . . . . . . . . . . . . . . . . . . . . . . 565,413 796,384Tax reclaims receivable . . . . . . . . . . . . . . . . . . . . . . . . . . . . . . . . . . 8,509 —Other assets . . . . . . . . . . . . . . . . . . . . . . . . . . . . . . . . . . . . . . . . . . 68,198 51,029
Total Assets . . . . . . . . . . . . . . . . . . . . . . . . . . . . . . . . . . . . . . . . 483,045,647 221,656,489
LIABILITIESWritten call options, at value (Notes 1 and 4)
(premiums received $171,756,616) . . . . . . . . . . . . . . . . . . . . . . . 183,898,100 —Distributions payable . . . . . . . . . . . . . . . . . . . . . . . . . . . . . . . . . . . . — 59,304Payable for capital shares redeemed . . . . . . . . . . . . . . . . . . . . . . . . . 88,747 184,351Payable for investment securities purchased . . . . . . . . . . . . . . . . . . . . . 4,825,858 —Accrued investment advisory fees (Note 3) . . . . . . . . . . . . . . . . . . . . . 187,518 84,381Payable to administrator (Note 3) . . . . . . . . . . . . . . . . . . . . . . . . . . . 31,400 22,500Accrued professional fees . . . . . . . . . . . . . . . . . . . . . . . . . . . . . . . . . 69,400 53,400Other accrued expenses . . . . . . . . . . . . . . . . . . . . . . . . . . . . . . . . . 38,735 17,387
Total Liabilities . . . . . . . . . . . . . . . . . . . . . . . . . . . . . . . . . . . . . . 189,139,758 421,323CONTINGENCIES AND COMMITMENTS (NOTES 8 & 9) . . . . . . . — —NET ASSETS . . . . . . . . . . . . . . . . . . . . . . . . . . . . . . . . . . . . . . . . . . $ 293,905,889 $ 221,235,166
Net assets consist of:Paid-in capital . . . . . . . . . . . . . . . . . . . . . . . . . . . . . . . . . . . . . . . . $ 1,200,598,943 $ 288,576,227Accumulated deficit . . . . . . . . . . . . . . . . . . . . . . . . . . . . . . . . . . . . . (906,693,054) (67,341,061)
NET ASSETS . . . . . . . . . . . . . . . . . . . . . . . . . . . . . . . . . . . . . . . . . . $ 293,905,889 $ 221,235,166
Shares of beneficial interest outstanding (unlimited number of shares authorized, no par value) . . . . . . . . . . . . . . 50,067,861 17,244,856
Net asset value, offering price and redemption price per share (a) (Note 1) . . $ 5.87 $ 12.83
(a) Redemption fee may apply to redemptions of shares held for 60 days or less.See accompanying notes to financial statements.
Hussman Investment TrustStatements of Assets and LiabilitiesJune 30, 2019
Hussman Investment TrustStatements of Assets and Liabilities (continued)
June 30, 2019

41
Hussman Strategic
International FundASSETS
Investments in securities:At cost . . . . . . . . . . . . . . . . . . . . . . . . . . . . . . . . . . . . . . . . . . . . . . . . . . . . . . . . . . . . $ 13,179,722At value (Note 1) . . . . . . . . . . . . . . . . . . . . . . . . . . . . . . . . . . . . . . . . . . . . . . . . . . . . . $ 13,841,366
Investments in money market funds . . . . . . . . . . . . . . . . . . . . . . . . . . . . . . . . . . . . . . . . . . . . 6,240,822Receivable for investment securities sold . . . . . . . . . . . . . . . . . . . . . . . . . . . . . . . . . . . . . . . . 66,996Dividends receivable . . . . . . . . . . . . . . . . . . . . . . . . . . . . . . . . . . . . . . . . . . . . . . . . . . . . . 20,884Tax reclaims receivable . . . . . . . . . . . . . . . . . . . . . . . . . . . . . . . . . . . . . . . . . . . . . . . . . . . 99,060Margin deposits for futures contracts (Note 1) . . . . . . . . . . . . . . . . . . . . . . . . . . . . . . . . . . . . 1,850,142Other assets . . . . . . . . . . . . . . . . . . . . . . . . . . . . . . . . . . . . . . . . . . . . . . . . . . . . . . . . . . . 47,994
Total Assets . . . . . . . . . . . . . . . . . . . . . . . . . . . . . . . . . . . . . . . . . . . . . . . . . . . . . . . . . 22,167,264
LIABILITIESDue to custodian . . . . . . . . . . . . . . . . . . . . . . . . . . . . . . . . . . . . . . . . . . . . . . . . . . . . . . . . 66,996Variation margin payable (Notes 1 and 4) . . . . . . . . . . . . . . . . . . . . . . . . . . . . . . . . . . . . . . . . . . . . . . . 67,721Accrued investment advisory fees (Note 3) . . . . . . . . . . . . . . . . . . . . . . . . . . . . . . . . . . . . . . 2,914Payable to administrator (Note 3) . . . . . . . . . . . . . . . . . . . . . . . . . . . . . . . . . . . . . . . . . . . . 7,275Accrued professional fees . . . . . . . . . . . . . . . . . . . . . . . . . . . . . . . . . . . . . . . . . . . . . . . . . . 54,600Accrued custodian fees . . . . . . . . . . . . . . . . . . . . . . . . . . . . . . . . . . . . . . . . . . . . . . . . . . . 25,000Other accrued expenses . . . . . . . . . . . . . . . . . . . . . . . . . . . . . . . . . . . . . . . . . . . . . . . . . . 8,653
Total Liabilities . . . . . . . . . . . . . . . . . . . . . . . . . . . . . . . . . . . . . . . . . . . . . . . . . . . . . . . 233,159CONTINGENCIES AND COMMITMENTS (NOTE 8) . . . . . . . . . . . . . . . . . . . . . . . . . . . . . —NET ASSETS . . . . . . . . . . . . . . . . . . . . . . . . . . . . . . . . . . . . . . . . . . . . . . . . . . . . . . . . . . . $ 21,934,105
Net assets consist of:Paid-in capital . . . . . . . . . . . . . . . . . . . . . . . . . . . . . . . . . . . . . . . . . . . . . . . . . . . . . . . . . $ 37,177,715Accumulated deficit . . . . . . . . . . . . . . . . . . . . . . . . . . . . . . . . . . . . . . . . . . . . . . . . . . . . . . (15,243,610)
NET ASSETS . . . . . . . . . . . . . . . . . . . . . . . . . . . . . . . . . . . . . . . . . . . . . . . . . . . . . . . . . . . $ 21,934,105
Shares of beneficial interest outstanding (unlimited number of shares authorized, no par value) . . . . . . 2,627,614
Net asset value, offering price and redemption price per share (a) (Note 1) . . . . . . . . . . . . . . . . . . . $ 8.35
(a) Redemption fee may apply to redemptions of shares held for 60 days or less. See accompanying notes to financial statements.
Hussman Investment TrustStatements of Assets and Liabilities (continued)
June 30, 2019

42
Hussman Strategic
Growth Fund
Hussman Strategic Total Return Fund
INVESTMENT INCOMEDividends . . . . . . . . . . . . . . . . . . . . . . . . . . . . . . . . . . . . . . . . . . . $ 8,927,151 $ 1,315,669Foreign withholding taxes on dividends . . . . . . . . . . . . . . . . . . . . . . . (20,532) (36,961)Interest . . . . . . . . . . . . . . . . . . . . . . . . . . . . . . . . . . . . . . . . . . . . . — 3,589,166
Total Income . . . . . . . . . . . . . . . . . . . . . . . . . . . . . . . . . . . . . . . 8,906,619 4,867,874
EXPENSESInvestment advisory fees (Note 3) . . . . . . . . . . . . . . . . . . . . . . . . . . . 2,864,479 1,158,733Transfer agent, account maintenance and shareholder services fees (Note 3) . 256,426 137,703Administration fees (Note 3) . . . . . . . . . . . . . . . . . . . . . . . . . . . . . . . . . . . . 222,820 162,056Legal fees . . . . . . . . . . . . . . . . . . . . . . . . . . . . . . . . . . . . . . . . . . . . . . . . 115,045 46,778Trustees’ fees and expenses (Note 3) . . . . . . . . . . . . . . . . . . . . . . . . . 77,976 77,976Insurance expense . . . . . . . . . . . . . . . . . . . . . . . . . . . . . . . . . . . . . 64,993 55,200Fund accounting fees (Note 3) . . . . . . . . . . . . . . . . . . . . . . . . . . . . . 61,817 53,151Custodian fees . . . . . . . . . . . . . . . . . . . . . . . . . . . . . . . . . . . . . . . . 78,069 25,583Audit fees . . . . . . . . . . . . . . . . . . . . . . . . . . . . . . . . . . . . . . . . . . . 52,650 44,400Registration and filing fees . . . . . . . . . . . . . . . . . . . . . . . . . . . . . . . . 38,920 32,932Postage and supplies . . . . . . . . . . . . . . . . . . . . . . . . . . . . . . . . . . . . 36,622 27,896Compliance service fees (Note 3) . . . . . . . . . . . . . . . . . . . . . . . . . . . 33,195 25,205Printing of shareholder reports . . . . . . . . . . . . . . . . . . . . . . . . . . . . . . 28,651 20,843Pricing fees . . . . . . . . . . . . . . . . . . . . . . . . . . . . . . . . . . . . . . . . . . 10,979 2,274Interest expense (Note 7) . . . . . . . . . . . . . . . . . . . . . . . . . . . . . . . . . — 355Other expenses . . . . . . . . . . . . . . . . . . . . . . . . . . . . . . . . . . . . . . . 8,741 9,270
Total Expenses . . . . . . . . . . . . . . . . . . . . . . . . . . . . . . . . . . . . . . 3,951,383 1,880,355Less fee waivers by the Adviser (Note 3) . . . . . . . . . . . . . . . . . . . . . . . (313,486) (166,982)
Net Expenses . . . . . . . . . . . . . . . . . . . . . . . . . . . . . . . . . . . . . . 3,637,897 1,713,373
NET INVESTMENT INCOME . . . . . . . . . . . . . . . . . . . . . . . . . . . . . . 5,268,722 3,154,501
REALIZED AND UNREALIZED GAINS (LOSSES) ON INVESTMENTS AND WRITTEN OPTION CONTRACTSNet realized gains (losses) from:
Investments . . . . . . . . . . . . . . . . . . . . . . . . . . . . . . . . . . . . . . . . 10,688,703 2,340,572Written option contracts (Note 4) . . . . . . . . . . . . . . . . . . . . . . . . . (15,608,054) —
Net change in unrealized appreciation (depreciation) on:Investments . . . . . . . . . . . . . . . . . . . . . . . . . . . . . . . . . . . . . . . . (17,070,666) 13,936,087Written option contracts (Note 4) . . . . . . . . . . . . . . . . . . . . . . . . . (10,639,338) —
NET REALIZED AND UNREALIZED GAINS (LOSSES) ON INVESTMENTS AND WRITTEN OPTION CONTRACTS . . . . . . . (32,629,355) 16,276,659
NET INCREASE (DECREASE) IN NET ASSETS RESULTING FROM OPERATIONS . . . . . . . . . . . . . . . . . . . . . . . $ (27,360,633) $ 19,431,160
See accompanying notes to financial statements.
Hussman Investment TrustStatements of OperationsFor the Year Ended June 30, 2019
Hussman Investment Trust Statements of Operations (continued)
For the Year Ended June 30, 2019
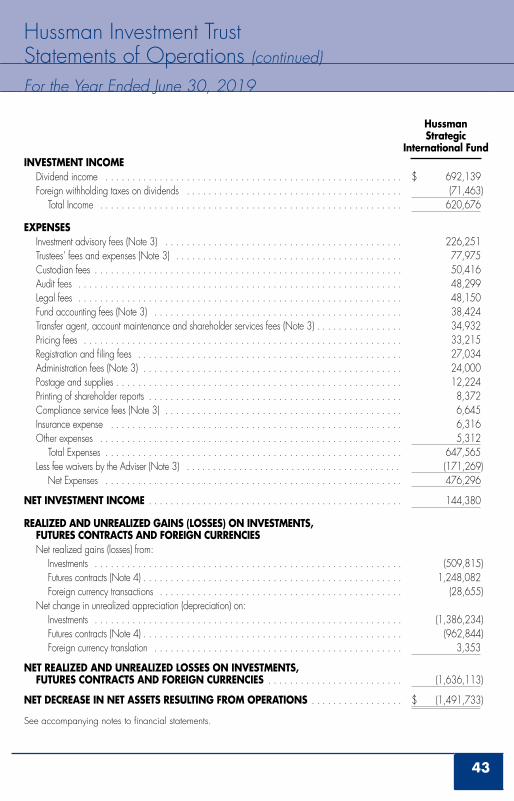
43
Hussman Strategic
International FundINVESTMENT INCOME
Dividend income . . . . . . . . . . . . . . . . . . . . . . . . . . . . . . . . . . . . . . . . . . . . . . . . . . . . . . . $ 692,139Foreign withholding taxes on dividends . . . . . . . . . . . . . . . . . . . . . . . . . . . . . . . . . . . . . . . . (71,463)
Total Income . . . . . . . . . . . . . . . . . . . . . . . . . . . . . . . . . . . . . . . . . . . . . . . . . . . . . . . . 620,676
EXPENSES Investment advisory fees (Note 3) . . . . . . . . . . . . . . . . . . . . . . . . . . . . . . . . . . . . . . . . . . . . 226,251Trustees’ fees and expenses (Note 3) . . . . . . . . . . . . . . . . . . . . . . . . . . . . . . . . . . . . . . . . . . 77,975Custodian fees . . . . . . . . . . . . . . . . . . . . . . . . . . . . . . . . . . . . . . . . . . . . . . . . . . . . . . . . . 50,416Audit fees . . . . . . . . . . . . . . . . . . . . . . . . . . . . . . . . . . . . . . . . . . . . . . . . . . . . . . . . . . . . 48,299Legal fees . . . . . . . . . . . . . . . . . . . . . . . . . . . . . . . . . . . . . . . . . . . . . . . . . . . . . . . . . . . . 48,150Fund accounting fees (Note 3) . . . . . . . . . . . . . . . . . . . . . . . . . . . . . . . . . . . . . . . . . . . . . . 38,424Transfer agent, account maintenance and shareholder services fees (Note 3) . . . . . . . . . . . . . . . . 34,932Pricing fees . . . . . . . . . . . . . . . . . . . . . . . . . . . . . . . . . . . . . . . . . . . . . . . . . . . . . . . . . . . 33,215Registration and filing fees . . . . . . . . . . . . . . . . . . . . . . . . . . . . . . . . . . . . . . . . . . . . . . . . . 27,034Administration fees (Note 3) . . . . . . . . . . . . . . . . . . . . . . . . . . . . . . . . . . . . . . . . . . . . . . . . 24,000Postage and supplies . . . . . . . . . . . . . . . . . . . . . . . . . . . . . . . . . . . . . . . . . . . . . . . . . . . . . 12,224Printing of shareholder reports . . . . . . . . . . . . . . . . . . . . . . . . . . . . . . . . . . . . . . . . . . . . . . . 8,372Compliance service fees (Note 3) . . . . . . . . . . . . . . . . . . . . . . . . . . . . . . . . . . . . . . . . . . . . 6,645Insurance expense . . . . . . . . . . . . . . . . . . . . . . . . . . . . . . . . . . . . . . . . . . . . . . . . . . . . . . 6,316Other expenses . . . . . . . . . . . . . . . . . . . . . . . . . . . . . . . . . . . . . . . . . . . . . . . . . . . . . . . . 5,312
Total Expenses . . . . . . . . . . . . . . . . . . . . . . . . . . . . . . . . . . . . . . . . . . . . . . . . . . . . . . . 647,565Less fee waivers by the Adviser (Note 3) . . . . . . . . . . . . . . . . . . . . . . . . . . . . . . . . . . . . . . . . . (171,269)
Net Expenses . . . . . . . . . . . . . . . . . . . . . . . . . . . . . . . . . . . . . . . . . . . . . . . . . . . . . . . 476,296
NET INVESTMENT INCOME . . . . . . . . . . . . . . . . . . . . . . . . . . . . . . . . . . . . . . . . . . . . . . . 144,380
REALIZED AND UNREALIZED GAINS (LOSSES) ON INVESTMENTS, FUTURES CONTRACTS AND FOREIGN CURRENCIESNet realized gains (losses) from:
Investments . . . . . . . . . . . . . . . . . . . . . . . . . . . . . . . . . . . . . . . . . . . . . . . . . . . . . . . . . (509,815)Futures contracts (Note 4) . . . . . . . . . . . . . . . . . . . . . . . . . . . . . . . . . . . . . . . . . . . . . . . . 1,248,082Foreign currency transactions . . . . . . . . . . . . . . . . . . . . . . . . . . . . . . . . . . . . . . . . . . . . . (28,655)
Net change in unrealized appreciation (depreciation) on:Investments . . . . . . . . . . . . . . . . . . . . . . . . . . . . . . . . . . . . . . . . . . . . . . . . . . . . . . . . . (1,386,234)Futures contracts (Note 4) . . . . . . . . . . . . . . . . . . . . . . . . . . . . . . . . . . . . . . . . . . . . . . . . (962,844)Foreign currency translation . . . . . . . . . . . . . . . . . . . . . . . . . . . . . . . . . . . . . . . . . . . . . . 3,353
NET REALIZED AND UNREALIZED LOSSES ON INVESTMENTS, FUTURES CONTRACTS AND FOREIGN CURRENCIES . . . . . . . . . . . . . . . . . . . . . . . . . (1,636,113)
NET DECREASE IN NET ASSETS RESULTING FROM OPERATIONS . . . . . . . . . . . . . . . . . $ (1,491,733)
See accompanying notes to financial statements.
Hussman Investment Trust Statements of Operations (continued)
For the Year Ended June 30, 2019

44
Year Ended June 30,
2019
Year Ended June 30, 2018 (a)
FROM OPERATIONSNet investment income . . . . . . . . . . . . . . . . . . . . . . . . . . . . . . . . . . . $ 5,268,722 $ 2,755,479Net realized gains (losses) from:
Investments . . . . . . . . . . . . . . . . . . . . . . . . . . . . . . . . . . . . . . . . 10,688,703 40,940,757Written option contracts . . . . . . . . . . . . . . . . . . . . . . . . . . . . . . . . (15,608,054) (50,604,962)
Net change in unrealized appreciation (depreciation) on:Investments . . . . . . . . . . . . . . . . . . . . . . . . . . . . . . . . . . . . . . . . (17,070,666) (5,381,857)Written option contracts . . . . . . . . . . . . . . . . . . . . . . . . . . . . . . . . (10,639,338) (212,088)
Net decrease in net assets resulting from operations . . . . . . . . . . . . . . . . . (27,360,633) (12,502,671)
DISTRIBUTIONS TO SHAREHOLDERS (Note 1) . . . . . . . . . . . . . . . (4,057,363) (1,544,228)
FROM CAPITAL SHARE TRANSACTIONSProceeds from shares sold . . . . . . . . . . . . . . . . . . . . . . . . . . . . . . . . 66,168,829 55,451,071Net asset value of shares issued in reinvestment
of distributions to shareholders . . . . . . . . . . . . . . . . . . . . . . . . . . . 3,847,274 1,464,244Proceeds from redemption fees collected (Note 1) . . . . . . . . . . . . . . . . 21,431 58,968Payments for shares redeemed . . . . . . . . . . . . . . . . . . . . . . . . . . . . . (68,716,182) (94,391,366)
Net increase (decrease) in net assets from capital share transactions . . . . . . . 1,321,352 (37,417,083)
TOTAL DECREASE IN NET ASSETS . . . . . . . . . . . . . . . . . . . . . . . . . (30,096,644) (51,463,982)
NET ASSETSBeginning of year . . . . . . . . . . . . . . . . . . . . . . . . . . . . . . . . . . . . . . 324,002,533 375,466,515End of year . . . . . . . . . . . . . . . . . . . . . . . . . . . . . . . . . . . . . . . . . . $ 293,905,889 $ 324,002,533
CAPITAL SHARE ACTIVITYShares sold . . . . . . . . . . . . . . . . . . . . . . . . . . . . . . . . . . . . . . . . . . 10,267,145 8,592,319Shares reinvested . . . . . . . . . . . . . . . . . . . . . . . . . . . . . . . . . . . . . . 570,812 233,532Shares redeemed . . . . . . . . . . . . . . . . . . . . . . . . . . . . . . . . . . . . . . (10,960,536) (14,823,897)Net decrease in shares outstanding . . . . . . . . . . . . . . . . . . . . . . . . . . (122,579) (5,998,046)Shares outstanding at beginning of year . . . . . . . . . . . . . . . . . . . . . . . 50,190,440 56,188,486Shares outstanding at end of year . . . . . . . . . . . . . . . . . . . . . . . . . . . 50,067,861 50,190,440
(a) The presentation of Distributions to Shareholders has been updated to reflect the changes prescribed in amendments to Regulation S-X, effective November 5, 2018 (Note 1). For the year ended June 30, 2018, all distributions to shareholders were from net investment income. As of June 30, 2018, accumulated net investment income was $1,381,557.
See accompanying notes to financial statements.
Hussman Strategic Growth FundStatements of Changes in Net Assets
Hussman Strategic Total Return FundStatements of Changes in Net Assets

45
Year Ended June 30,
2019
Year Ended June 30, 2018 (a)
FROM OPERATIONSNet investment income . . . . . . . . . . . . . . . . . . . . . . . . . . . . . . . . . . . $ 3,154,501 $ 2,469,640Net realized gains (losses) from investments . . . . . . . . . . . . . . . . . . . . . 2,340,572 (1,615,533)Net change in unrealized appreciation (depreciation) on investments . . . . 13,936,087 (869,509)
Net increase (decrease) in net assets resulting from operations . . . . . . . . . . . 19,431,160 (15,402)
DISTRIBUTIONS TO SHAREHOLDERS (Note 1) . . . . . . . . . . . . . . . (3,195,796) (2,496,823)
FROM CAPITAL SHARE TRANSACTIONSProceeds from shares sold . . . . . . . . . . . . . . . . . . . . . . . . . . . . . . . . 26,725,419 15,121,405Net asset value of shares issued in reinvestment
of distributions to shareholders . . . . . . . . . . . . . . . . . . . . . . . . . . . 2,992,151 2,330,683Proceeds from redemption fees collected (Note 1) . . . . . . . . . . . . . . . . 6,430 5,375Payments for shares redeemed . . . . . . . . . . . . . . . . . . . . . . . . . . . . . (99,326,617) (112,844,614)
Net decrease in net assets from capital share transactions . . . . . . . . . . . . . (69,602,617) (95,387,151)
TOTAL DECREASE IN NET ASSETS . . . . . . . . . . . . . . . . . . . . . . . . . (53,367,253) (97,899,376)
NET ASSETSBeginning of year . . . . . . . . . . . . . . . . . . . . . . . . . . . . . . . . . . . . . . 274,602,419 372,501,795End of year . . . . . . . . . . . . . . . . . . . . . . . . . . . . . . . . . . . . . . . . . . $ 221,235,166 $ 274,602,419
CAPITAL SHARE ACTIVITYShares sold . . . . . . . . . . . . . . . . . . . . . . . . . . . . . . . . . . . . . . . . . . 2,194,486 1,256,190Shares reinvested . . . . . . . . . . . . . . . . . . . . . . . . . . . . . . . . . . . . . . 244,901 194,932Shares redeemed . . . . . . . . . . . . . . . . . . . . . . . . . . . . . . . . . . . . . . (8,341,021) (9,403,724)Net decrease in shares outstanding . . . . . . . . . . . . . . . . . . . . . . . . . . (5,901,634) (7,952,602)Shares outstanding at beginning of year . . . . . . . . . . . . . . . . . . . . . . . 23,146,490 31,099,092Shares outstanding at end of year . . . . . . . . . . . . . . . . . . . . . . . . . . . 17,244,856 23,146,490
(a) The presentation of Distributions to Shareholders has been updated to reflect the changes prescribed in amendments to Regulation S-X, effective November 5, 2018 (Note 1). For the year ended June 30, 2018, all distributions to shareholders were from net investment income. As of June 30, 2018, accumulated net investment income was $290,838.
See accompanying notes to financial statements.
Hussman Strategic Total Return FundStatements of Changes in Net Assets

46
Year Ended June 30,
2019
Year Ended June 30, 2018 (a)
FROM OPERATIONSNet investment income . . . . . . . . . . . . . . . . . . . . . . . . . . . . . . . . . . . $ 144,380 $ 51,018Net realized gains (losses) from:
Investments . . . . . . . . . . . . . . . . . . . . . . . . . . . . . . . . . . . . . . . . (509,815) 3,259,143Futures contracts . . . . . . . . . . . . . . . . . . . . . . . . . . . . . . . . . . . . . 1,248,082 (1,880,950)Foreign currency transactions . . . . . . . . . . . . . . . . . . . . . . . . . . . . (28,655) (34,273)
Net change in unrealized appreciation (depreciation) on:Investments . . . . . . . . . . . . . . . . . . . . . . . . . . . . . . . . . . . . . . . . (1,386,234) (1,530,243)Futures contracts . . . . . . . . . . . . . . . . . . . . . . . . . . . . . . . . . . . . . (962,844) 533,577Foreign currency translation . . . . . . . . . . . . . . . . . . . . . . . . . . . . . 3,353 3,049
Net increase (decrease) in net assets resulting from operations . . . . . . . . . . . (1,491,733) 401,321
DISTRIBUTIONS TO SHAREHOLDERS (Note 1) . . . . . . . . . . . . . . . (17,482) (152,328)
FROM CAPITAL SHARE TRANSACTIONSProceeds from shares sold . . . . . . . . . . . . . . . . . . . . . . . . . . . . . . . . 948,919 515,232Net asset value of shares issued in reinvestment
of distributions to shareholders . . . . . . . . . . . . . . . . . . . . . . . . . . . 16,890 151,447Proceeds from redemption fees collected (Note 1) . . . . . . . . . . . . . . . . 90 1,745Payments for shares redeemed . . . . . . . . . . . . . . . . . . . . . . . . . . . . . (4,495,398) (4,438,482)
Net decrease in net assets from capital share transactions . . . . . . . . . . . . . (3,529,499) (3,770,058)
TOTAL DECREASE IN NET ASSETS . . . . . . . . . . . . . . . . . . . . . . . . . (5,038,714) (3,521,065)
NET ASSETSBeginning of year . . . . . . . . . . . . . . . . . . . . . . . . . . . . . . . . . . . . . . 26,972,819 30,493,884End of year . . . . . . . . . . . . . . . . . . . . . . . . . . . . . . . . . . . . . . . . . . $ 21,934,105 $ 26,972,819
CAPITAL SHARE ACTIVITYShares sold . . . . . . . . . . . . . . . . . . . . . . . . . . . . . . . . . . . . . . . . . . 111,988 57,943Shares reinvested . . . . . . . . . . . . . . . . . . . . . . . . . . . . . . . . . . . . . . 1,996 17,017Shares redeemed . . . . . . . . . . . . . . . . . . . . . . . . . . . . . . . . . . . . . . (526,121) (499,238)Net decrease in shares outstanding . . . . . . . . . . . . . . . . . . . . . . . . . . (412,137) (424,278)Shares outstanding at beginning of year . . . . . . . . . . . . . . . . . . . . . . . 3,039,751 3,464,029Shares outstanding at end of year . . . . . . . . . . . . . . . . . . . . . . . . . . . 2,627,614 3,039,751
(a) The presentation of Distributions to Shareholders has been updated to reflect the changes prescribed in amendments to Regulation S-X, effective November 5, 2018 (Note 1). For the year ended June 30, 2018, all distributions to shareholders were from net investment income. As of June 30, 2018, accumulated net investment income was $17,403.
See accompanying notes to financial statements.
Hussman Strategic International FundStatements of Changes in Net Assets

47
Year Ended
June 30, 2019
Year Ended
June 30, 2018
Year Ended
June 30, 2017
Year Ended
June 30, 2016
Year Ended
June 30, 2015
Net asset value at beginning of year . . . . . . . . . . . . . $ 6.46 $ 6.68 $ 7.93 $ 8.70 $ 9.74
Income (loss) from investment operations:Net investment income . . . . . . . . . . . . . . . . . . . . 0.10 0.06 0.02 0.03 0.08Net realized and unrealized losses on
investments and written option contracts . . . . . . (0.61) (0.25) (1.25) (0.75) (1.05)Total from investment operations . . . . . . . . . . . . . . . . . (0.51) (0.19) (1.23) (0.72) (0.97)
Less distributions:Dividends from net investment income . . . . . . . . . . (0.08) (0.03) (0.02) (0.05) (0.07)
Proceeds from redemption fees collected (Note 1) . . . . 0.00(a) 0.00(a) 0.00(a) 0.00(a) 0.00(a)
Net asset value at end of year . . . . . . . . . . . . . . . . . $ 5.87 $ 6.46 $ 6.68 $ 7.93 $ 8.70
Total return (b) . . . . . . . . . . . . . . . . . . . . . . . . . . . . . (8.05%) (2.81%) (15.53%) (8.34%) (9.99%)
Net assets at end of year (000’s) . . . . . . . . . . . . . . . . $ 293,906 $ 324,003 $ 375,467 $ 580,503 $ 756,904
Ratio of total expenses to average net assets . . . . . . . . 1.24% 1.23% 1.19% 1.15% 1.12%
Ratio of net expenses to average net assets (c) . . . . . . . 1.14% 1.13% 1.12% 1.09% 1.07%
Ratio of net investment income to average net assets (c) . 1.66% 0.82% 0.19% 0.34% 0.79%
Portfolio turnover rate . . . . . . . . . . . . . . . . . . . . . . . . 124% 142% 209% 161% 107%
(a) Amount rounds to less than $0.01 per share.(b) Total return is a measure of the change in value of an investment in the Fund over the period covered, which assumes
any dividends or capital gains distributions are reinvested in shares of the Fund. Returns do not reflect the deduction of taxes a shareholder would pay on Fund distributions or the redemption of Fund shares.
(c) Ratio was determined after advisory fee waivers (Note 3).See accompanying notes to financial statements.
Hussman Strategic Growth FundFinancial HighlightsSelected Per Share Data and Ratios for a Share Outstanding Throughout Each Year

48
Year Ended
June 30, 2019
Year Ended
June 30, 2018
Year Ended
June 30, 2017
Year Ended
June 30, 2016
Year Ended
June 30, 2015
Net asset value at beginning of year . . . . . . . . . . . . . $ 11.86 $ 11.98 $ 12.44 $ 11.32 $ 11.63
Income (loss) from investment operations:Net investment income . . . . . . . . . . . . . . . . . . . . 0.19 0.10 0.02 0.04 0.05Net realized and unrealized gains (losses)
on investments . . . . . . . . . . . . . . . . . . . . . . . 0.95 (0.12) (0.46) 1.13 (0.27)Total from investment operations . . . . . . . . . . . . . . . . . 1.14 (0.02) (0.44) 1.17 (0.22)
Less distributions:Dividends from net investment income . . . . . . . . . . (0.17) (0.10) (0.02) (0.05) (0.09)
Proceeds from redemption fees collected (Note 1) . . . . 0.00(a) 0.00(a) 0.00(a) 0.00(a) 0.00(a)
Net asset value at end of year . . . . . . . . . . . . . . . . . $ 12.83 $ 11.86 $ 11.98 $ 12.44 $ 11.32
Total return (b) . . . . . . . . . . . . . . . . . . . . . . . . . . . . . 9.72% (0.18%) (3.50%) 10.33% (1.86%)
Net assets at end of year (000’s) . . . . . . . . . . . . . . . . $ 221,235 $ 274,602 $ 372,502 $ 463,503 $ 485,015
Ratio of total expenses to average net assets . . . . . . . . 0.81% 0.77% 0.75% 0.75% 0.73%
Ratio of net expenses to average net assets (c) . . . . . . . 0.74% 0.73% 0.72% 0.69% 0.66%
Ratio of net investment income to average net assets (c) . 1.36% 0.76% 0.12% 0.36% 0.38%
Portfolio turnover rate . . . . . . . . . . . . . . . . . . . . . . . . 61% 63% 341% 129% 196%
(a) Amount rounds to less than $0.01 per share.(b) Total return is a measure of the change in value of an investment in the Fund over the period covered, which assumes
any dividends or capital gains distributions are reinvested in shares of the Fund. Returns do not reflect the deduction of taxes a shareholder would pay on Fund distributions or the redemption of Fund shares.
(c) Ratio was determined after advisory fee waivers (Note 3).See accompanying notes to financial statements.
Hussman Strategic Total Return FundFinancial HighlightsSelected Per Share Data and Ratios for a Share Outstanding Throughout Each Year
Hussman Strategic International FundFinancial HighlightsSelected Per Share Data and Ratios for a Share Outstanding Throughout Each Year

49
Year Ended
June 30, 2019
Year Ended
June 30, 2018
Year Ended
June 30, 2017
Year Ended
June 30, 2016
Year Ended
June 30, 2015
Net asset value at beginning of year . . . . . . . . . . . . . $ 8.87 $ 8.80 $ 9.19 $ 8.57 $ 9.90
Income (loss) from investment operations:Net investment income (loss) . . . . . . . . . . . . . . . . 0.06 0.02 0.01 (0.05) 0.17Net realized and unrealized gains (losses)
on investments, futures contracts and foreign currencies . . . . . . . . . . . . . . . . . . (0.57) 0.10 (0.40) 0.67 (1.41)
Total from investment operations . . . . . . . . . . . . . . . . . (0.51) 0.12 (0.39) 0.62 (1.24)
Less distributions:Dividends from net investment income . . . . . . . . . . (0.01) (0.05) — — (0.09)
Proceeds from redemption fees collected (Note 1) . . . . 0.00(a) 0.00(a) 0.00(a) 0.00(a) 0.00(a)
Net asset value at end of year . . . . . . . . . . . . . . . . . $ 8.35 $ 8.87 $ 8.80 $ 9.19 $ 8.57
Total return (b) . . . . . . . . . . . . . . . . . . . . . . . . . . . . . (5.79%) 1.34% (4.24%) 7.23% (12.56%)
Net assets at end of year (000’s) . . . . . . . . . . . . . . . . $ 21,934 $ 26,973 $ 30,494 $ 37,645 $ 42,325
Ratio of total expenses to average net assets . . . . . . . . 2.72% 2.42% 2.26% 2.03% 1.61%
Ratio of net expenses to average net assets (c) . . . . . . . 2.00% 2.00% 2.00% 2.00% 1.61%
Ratio of net investment income (loss) to average net assets (c) . . . . . . . . . . . . . . . . . . . . . 0.61% 0.18% 0.25% (0.05%) 0.98%
Portfolio turnover rate . . . . . . . . . . . . . . . . . . . . . . . . 58% 61% 102% 107% 62%
(a) Amount rounds to less than $0.01 per share.(b) Total return is a measure of the change in value of an investment in the Fund over the period covered, which assumes
any dividends or capital gains distributions are reinvested in shares of the Fund. Returns do not reflect the deduction of taxes a shareholder would pay on Fund distributions or the redemption of Fund shares.
(c) Ratio was determined after advisory fee waivers (Note 3).See accompanying notes to financial statements.
Hussman Strategic International FundFinancial HighlightsSelected Per Share Data and Ratios for a Share Outstanding Throughout Each Year

50
1. ORGANIZATION AND SIGNIFICANT ACCOUNTING POLICIESHussman Strategic Growth Fund, Hussman Strategic Total Return Fund and
Hussman Strategic International Fund (each, a “Fund,” and collectively, the “Funds”) are diversified, separate series of Hussman Investment Trust (the “Trust”), which is registered under the Investment Company Act of 1940, as amended (the “1940 Act”), as an open-end management investment company. Each Fund is authorized to issue an unlimited number of shares.
Hussman Strategic Growth Fund’s investment objective is to provide long-term capital appreciation, with added emphasis on protection of capital during unfavorable market conditions.
Hussman Strategic Total Return Fund’s investment objective is to provide long-term total return from income and capital appreciation, with added emphasis on protection of capital during unfavorable market conditions.
Hussman Strategic International Fund’s investment objective is to provide long-term capital appreciation, with added emphasis on the protection of capital during unfavorable market conditions. The Fund invests primarily in equity securities of non-U.S. issuers.
In August 2018, the U.S. Securities and Exchange Commission (the “SEC”) adopted regulations that eliminated or amended disclosure requirements that were redundant or outdated in light of changes in SEC requirements, accounting principles generally accepted in the United States of America (“GAAP”), International Financial Reporting Standards, or changes in technology or the business environment. The changes in disclosure requirements were effective November 5, 2018, and the Funds are complying with them.
The following is a summary of significant accounting policies followed by the Funds. The policies are in conformity with GAAP. Each Fund follows accounting and reporting guidance under Financial Accounting Standards Board (“FASB”) Accounting Standards Codification (“ASC”) Topic 946 “Financial Services – Investment Companies.”
New Accounting Pronouncement — On August 28, 2018, FASB issued Accounting Standards Update No. 2018-13 (“ASU 2018-13”), “Disclosure Framework – Changes to the Disclosure Requirements for Fair Value Measurement,” which amends the fair value measurement disclosure requirements of ASC Topic 820 (“ASC 820”), “Fair Value Measurement.” ASU 2018-13 includes new, eliminated, and modified disclosure requirements for ASC 820. The standard eliminates, adds and modifies certain disclosure requirements for fair value measurements. Entities will no longer
Hussman Investment TrustNotes to Financial StatementsJune 30, 2019

51
be required to disclose the amount of and reasons for transfers between Level 1 and Level 2, but public companies will be required to disclose the range and weighted average used to develop significant unobservable inputs for Level 3 securities. In addition, ASU 2018-13 clarifies that materiality is an appropriate consideration of entities when evaluating disclosure requirements. ASU 2018-13 is effective for fiscal years beginning after December 15, 2019, including interim periods therein. Early adoption is permitted and the Funds have adopted ASU 2018-13 with these financial statements. The Funds have determined this ASU 2018-13 did not have a material impact on the financial statements as they do not have any Level 3 securities, nor do they have a history of transfers between levels.
Securities, Options and Futures Valuation — The Funds’ portfolio securities are valued at market value as of the close of regular trading on the New York Stock Exchange (“NYSE”) (normally, 4:00 p.m. Eastern time) on each business day the NYSE is open. Securities listed on the NYSE or other exchanges, other than options, are valued on the basis of their last sale prices on the exchanges on which they are primarily traded. However, if the last sale price on the NYSE is different than the last sale price on any other exchange, the NYSE price will be used. If there are no sales on that day, the securities are valued at the last bid price on the NYSE or other primary exchange for that day. Securities quoted by NASDAQ are valued at the NASDAQ Official Closing Price. If there are no sales on that day, the securities are valued at the last bid price as reported by NASDAQ. Securities traded in over-the-counter markets, other than NASDAQ quoted securities, are valued at the last sales price, or if there are no sales on that day, at the mean of the closing bid and ask prices. Securities traded on a foreign stock exchange are valued at their closing prices on the principal exchange where they are traded; however, on days when the value of securities traded on foreign stock exchanges may be materially affected by events occurring before the Funds’ pricing time, but after the close of the primary markets or exchanges on which such securities are traded, such securities typically will be valued at their fair value as determined by an independent pricing service approved by the Board of Trustees where such value is believed to reflect the market values of such securities as of the time of computation of the net asset values of the Funds. As a result, the prices of foreign securities used to calculate a Fund’s net asset value may differ from quoted or published prices for these securities. Values of foreign securities are translated from the local currency into U.S. dollars using prevailing currency exchange rates as of the close of the NYSE, as supplied by an independent pricing service.
Hussman Investment Trust Notes to Financial Statements (continued)
June 30, 2019

52
Pursuant to procedures approved by the Board of Trustees, options traded on a national securities exchange are valued at prices between the closing bid and ask prices determined by Hussman Strategic Advisors, Inc. (the “Adviser”) to most closely reflect market value as of the time of computation of net asset value. As of June 30, 2019, all options held by Hussman Strategic Growth Fund have been valued in this manner. Options not traded on a national securities exchange or board of trade, but for which over-the-counter market quotations are readily available, are valued at the mean of their closing bid and ask prices. Futures contracts and options thereon, which are traded on commodities exchanges, are valued at their last sale prices as of the close of regular trading on the NYSE or, if not available, at the mean of their bid and ask prices.
Fixed income securities not traded or dealt in upon any securities exchange, but for which over-the-counter market quotations are readily available, generally are valued at the mean of their closing bid and ask prices. Fixed income securities may also be valued on the basis of prices provided by an independent pricing service. Debt securities with remaining maturities of 60 days or less may be valued at amortized cost if the Adviser, under the supervision of the Board of Trustees, determines that the amortized cost value of the security represents fair value.
Investments representing shares of other open-end investment companies, other than shares of exchange-traded funds, are valued at their net asset values per share as reported by such companies.
In the event that market quotations are not readily available or are determined by the Adviser to not be reflective of fair market value due to market events or developments, securities and other financial instruments will be valued at fair value as determined by the Adviser in accordance with procedures adopted by the Board of Trustees. Such methods of fair valuation may include, but are not limited to: multiple of earnings, multiple of book value, discount from market of a similar freely traded security, purchase price of the security, subsequent private transactions in the security or related securities, or a combination of these and other factors.
GAAP establishes a single authoritative definition of fair value, sets out a framework for measuring fair value and requires additional disclosures about fair value measurements.
Various inputs are used in determining the values of the Funds’ investments. These inputs are summarized in the three broad levels listed below:
• Level 1 – quoted unadjusted prices for identical instruments in active markets to which the Fund has access at the date of measurement.
Hussman Investment Trust Notes to Financial Statements (continued)
June 30, 2019
Hussman Investment Trust Notes to Financial Statements (continued)
June 30, 2019

53
Hussman Investment Trust Notes to Financial Statements (continued)
June 30, 2019
• Level 2 – quoted prices for similar instruments in active markets; quoted prices for identical or similar instruments in markets that are not active; and model-derived valuations in which all significant inputs and significant value drivers are observable in active markets. Level 2 inputs are those in markets for which there are few transactions, the prices are not current, little public information exists or instances where prices vary substantially over time or among market makers.
• Level 3 – model-derived valuations in which one or more significant inputs or significant value drivers are unobservable. Unobservable inputs are those inputs that reflect the Fund’s own assumptions that market participants would use to price the asset or liability based on the best available information.
Option contracts purchased or written by Hussman Strategic Growth Fund are classified as Level 2 since they are valued using “other significant observable inputs” at prices between the closing bid and ask prices determined by the Adviser to most closely reflect market value. U.S. Treasury obligations held by Hussman Strategic Total Return Fund are classified as Level 2 since values are based on prices provided by an independent pricing service that utilizes various “other significant observable inputs,” including bid and ask quotations, prices of similar securities and interest rates, among other factors. Non-U.S. equity securities actively traded in foreign markets held by Hussman Strategic International Fund may be classified as Level 2 despite the availability of closing prices because such securities are typically valued at their fair value as determined by an independent pricing service.
As previously noted, the Trust uses an independent pricing service to determine the fair value of portfolio securities traded on a foreign securities exchange when the value of such securities may be materially affected by events occurring before a Fund’s pricing time, but after the close of the primary markets or exchanges on which such securities are traded. These intervening events might be: country-specific (e.g., natural disaster, economic or political developments, interest rate change); issuer specific (e.g., earnings report, merger announcement); or U.S. markets-specific (such as a significant movement in the U.S. markets that is deemed likely to affect the value of foreign securities). The pricing service uses an automated system incorporating a model based on multiple parameters, including a security’s local closing price, relevant general and sector indices, currency fluctuations, trading in depositary receipts and futures, if applicable, and/or research valuations by its staff, in determining what it believes is the fair value of the securities. The frequency of use of this procedure depends on market events and thus cannot be predicted. However, the procedure may be utilized to a significant extent by Hussman Strategic International Fund.
Hussman Investment Trust Notes to Financial Statements (continued)
June 30, 2019

54
Determining the fair value of portfolio securities involves reliance on judgment, and a security’s fair value may differ depending on the method used for determining value. With respect to a portfolio security that has been valued at fair value, there can be no assurance that a Fund could purchase or sell that security at a price equal to the fair value of such security used in calculating the Fund’s net asset value. Because of the inherent uncertainty in fair valuations and the various factors considered in determining fair value, there can be significant deviations between the fair value at which a portfolio security is being carried and the price at which it can be sold. Moreover, to the extent Hussman Strategic International Fund has significant holdings of foreign securities, fair valuation may be used more frequently than for the other Funds.
The inputs or methodology used for valuing securities are not necessarily an indication of the risks associated with investing in those securities. The inputs used to measure the value of a particular security may fall into more than one level of the fair value hierarchy. In such cases, for disclosure purposes, the level in the fair value hierarchy within which the fair value measurement of that security is determined to fall in its entirety is the lowest level input that is significant to the fair value measurement.
The following is a summary of the inputs used to value each Fund’s investments and other financial instruments as of June 30, 2019 by security type:
Hussman Strategic Growth FundLevel 1 Level 2 Level 3 Total
Investments in Securities and Money Market Funds:
Common Stocks . . . . . . . . . . . . . . . . $ 302,249,214 $ — $ — $ 302,249,214Put Option Contracts . . . . . . . . . . . . . — 5,870,950 — 5,870,950Money Market Funds . . . . . . . . . . . . . 166,886,610 — — 166,886,610Total Investments in Securities and
Money Market Funds . . . . . . . . . . . $ 469,135,824 $ 5,870,950 $ — $ 475,006,774
Other Financial Instruments:
Written Call Option Contracts . . . . . . . $ — $ (183,898,100) $ — $ (183,898,100)Total Other Financial Instruments . . . . . . $ — $ (183,898,100) $ — $ (183,898,100)
Hussman Investment Trust Notes to Financial Statements (continued)
June 30, 2019
Hussman Investment Trust Notes to Financial Statements (continued)
June 30, 2019

55
Hussman Investment Trust Notes to Financial Statements (continued)
June 30, 2019
Hussman Strategic Total Return Fund
Level 1 Level 2 Level 3 Total Investments in Securities and Money Market Funds:
Common Stocks . . . . . . . . . . . . . . . . $ 46,780,499 $ — $ — $ 46,780,499U.S. Treasury Obligations . . . . . . . . . . — 154,805,718 — 154,805,718Exchange-Traded Funds . . . . . . . . . . . 8,826,939 — — 8,826,939Money Market Funds . . . . . . . . . . . . . 10,319,036 — — 10,319,036Total Investments in Securities and
Money Market Funds . . . . . . . . . . . $ 65,926,474 $ 154,805,718 $ — $ 220,732,192
Hussman Strategic International Fund
Level 1 Level 2 Level 3 Total
Investments in Securities:
Common Stocks . . . . . . . . . . . . . . . . $ 3,482,481 $ 10,358,885 $ — $ 13,841,366Money Market Funds . . . . . . . . . . . . . 6,240,822 — — 6,240,822Total Investments in Securities and
Money Market Funds . . . . . . . . . . . $ 9,723,303 $ 10,358,885 $ — $ 20,082,188
Other Financial Instruments:
Futures Contracts Sold Short . . . . . . . . $ (312,050) $ — $ — $ (312,050)Total Other Financial Instruments . . . . . . $ (312,050) $ — $ — $ (312,050)
Each Fund’s Schedule of Investments identifies the specific securities (by type of security and sector and industry type or geographical region) that comprise that Fund’s holdings within the Level 1 and Level 2 categories shown in the tables above.
The Funds did not have any assets or liabilities that were measured at fair value on a recurring basis using significant unobservable inputs (Level 3) during the year ended June 30, 2019.
Futures Contracts and Option Transactions — Hussman Strategic Growth Fund and Hussman Strategic International Fund may purchase and write call and put options on broad-based stock indices and also may purchase and write call and put option contracts on individual securities. Each of the Funds may use financial futures contracts and related option contracts to hedge against changes in the market value of its portfolio securities. Hussman Strategic Total Return Fund and Hussman Strategic International Fund may also purchase foreign currency options to manage their exposures to foreign currencies, and Hussman Strategic Total Return Fund may
Hussman Investment Trust Notes to Financial Statements (continued)
June 30, 2019

56
purchase interest rate futures contracts to protect against a decline in the value of its portfolio resulting from rising interest rates. Hussman Strategic International Fund may enter into forward foreign currency contracts to hedge against the adverse impact of changes in foreign exchange rates on the U.S. dollar value of its investments or changes in the prices at which it effects transactions in foreign securities.
Hussman Strategic Growth Fund and Hussman Strategic International Fund may use futures and option contracts on stock indices for the purpose of seeking to reduce the market risk that would otherwise be associated with the securities in which it invests. For example, these Funds may sell a stock index futures contract to hedge the risk of a general market or market sector decline that might adversely affect prices of the Funds’ portfolio securities. To the extent there is a correlation between a Fund’s portfolio and a particular stock index, the sale of futures contracts on that index could reduce the Fund’s exposure to general market risk.
When a Fund writes an index option, an amount equal to the net premium (the premium less the commission) received by the Fund is recorded as a liability in the Fund’s Statement of Assets and Liabilities and is subsequently marked-to market daily. If an index option written by a Fund expires unexercised on the stipulated expiration date or if a Fund enters into a closing purchase transaction, it will realize a gain or a loss depending on whether the cost of a closing purchase transaction is less than or exceeds the net premium received when the option was sold and the liability related to such option will be eliminated. If an index option written by a Fund is exercised, the Fund will be required to pay the difference between the closing index value and the exercise price of the option. In this event, the proceeds of the sale will be increased by the net premium originally received and the Fund will realize a gain or loss.
When a Fund purchases or sells a stock index futures contract, no price is paid to or received by the Fund upon the purchase or sale of the futures contract. Instead, the Fund is required to deposit in a segregated asset account an amount of cash or qualifying securities currently ranging from 2% to 11% of the contract amount. This is called “initial margin.” Subsequent payments, known as “variation margin,” are made or received by the Fund each day, depending on the daily fluctuations in the value of the underlying stock index. The Fund recognizes an unrealized gain or loss equal to the daily variation margin. If general market movements are not as expected, the Fund may not achieve the anticipated benefits of the futures contracts and may realize a loss. In addition to the possibility that there may be an imperfect correlation or no correlation at all between the movements in the stock index futures and the portion of the portfolio being hedged, the price of the stock index futures may not correlate perfectly with movements in the stock index due to certain market distortions.
Hussman Investment Trust Notes to Financial Statements (continued)
June 30, 2019
Hussman Investment Trust Notes to Financial Statements (continued)
June 30, 2019

57
Hussman Investment Trust Notes to Financial Statements (continued)
June 30, 2019
Foreign Currency Translation — Amounts and securities denominated in or expected to settle in foreign currencies are translated into U.S. dollars based on exchange rates on the following basis:
A. The values of investment securities and other assets and liabilities are translated as of the close of the NYSE each day.
B. Purchases and sales of investment securities and income and expenses are translated at the rate of exchange prevailing as of 4:00 p.m. on the respective date of such transactions.
C. The Funds do not isolate that portion of the results of operations caused by changes in foreign exchange rates on investments from those caused by changes in market prices of securities held. Such fluctuations are included with the net realized and unrealized gains or losses on investments.
Reported net realized foreign exchange gains or losses arise from: (1) purchases and sales of foreign currencies; (2) currency gains or losses realized between the trade and settlement dates on securities transactions; and (3) the difference between the amounts of dividends, interest and foreign withholding taxes recorded on a Fund’s books and the U.S. dollar equivalent of the amounts actually received or paid. Reported net unrealized foreign exchange gains and losses arise from changes in the U.S. dollar value of assets and liabilities that result from changes in exchange rates.
Share Valuation and Redemption Fees — The net asset value per share of each Fund is calculated as of the close of regular trading on the NYSE (normally 4:00 p.m., Eastern time) on each day that the NYSE is open for business. The net asset value per share of each Fund is calculated by dividing the total value of the Fund’s assets, less its liabilities, by the number of its shares outstanding. The offering price and redemption price per share of each Fund is equal to the net asset value per share next computed after receipt of an order to purchase or to redeem shares. However, a redemption fee of 1.5%, payable to the applicable Fund, generally will apply to shares that are redeemed 60 days or less from the date of purchase. During the years ended June 30, 2019 and 2018, proceeds from redemption fees, recorded in capital, totaled: $21,431 and $58,968, respectively, for Hussman Strategic Growth Fund; $6,430 and $5,375, respectively, for Hussman Strategic Total Return Fund; and $90 and $1,745, respectively, for Hussman Strategic International Fund.
Hussman Investment Trust Notes to Financial Statements (continued)
June 30, 2019

58
Investment Income — Interest income is accrued as earned. Dividend income is recorded on the ex-dividend date. Discounts and premiums on fixed income securities are amortized using the effective interest method. Withholding taxes on foreign dividends have been recorded in accordance with the Trust’s understanding of the applicable country’s rules and tax rates.
Distributions to Shareholders — Dividends from net investment income, if any, are declared and paid annually to shareholders of Hussman Strategic Growth Fund and Hussman Strategic International Fund and are declared and paid quarterly to shareholders of Hussman Strategic Total Return Fund. Net realized short-term capital gains, if any, may be distributed throughout the year and net realized long-term capital gains, if any, are generally distributed annually. The amount of distributions from net investment income and net realized capital gains are determined in accordance with federal income tax regulations, which may differ from GAAP. These “book/tax” differences are either temporary or permanent in nature and are primarily due to timing differences in the recognition of capital gains or losses on option and futures transactions, losses deferred due to wash sales and the treatment of foreign currency transactions. The tax character of distributions paid by each Fund during the years ended June 30, 2019 and 2018 was ordinary income.
Investment Transactions — Investment transactions are accounted for on trade date for financial reporting purposes. Realized gains and losses on investments sold are determined on a specific identification basis.
Common Expenses — Expenses of the Trust not attributable solely to one of the Funds are allocated among the Funds based on the relative net assets of each Fund or based on the nature of the expense and its relative applicability to each Fund.
Accounting Estimates — The preparation of financial statements in conformity with GAAP requires management to make estimates and assumptions that affect the reported amounts of assets and liabilities and the disclosure of contingent assets and liabilities as of the date of the financial statements and the reported amounts of income and expenses during the reporting period. Actual results could differ from these estimates.
Federal Income Tax — Each Fund has qualified and intends to continue to qualify each year as a “regulated investment company“ under Subchapter M of the Internal Revenue Code of 1986, as amended (the “Code”). By so qualifying, a Fund generally will not be subject to federal income taxes to the extent that it distributes its net investment income and any net realized capital gains in accordance with the Code. Accordingly, no provision for income taxes has been made.
Hussman Investment Trust Notes to Financial Statements (continued)
June 30, 2019
Hussman Investment Trust Notes to Financial Statements (continued)
June 30, 2019

59
Hussman Investment Trust Notes to Financial Statements (continued)
June 30, 2019
In order to avoid imposition of a federal excise tax applicable to regulated investment companies, it is each Fund’s intention to declare and pay as dividends in each calendar year at least 98% of its net investment income (earned during the calendar year) and 98.2% of its net realized capital gains (earned during the twelve months ended October 31) plus undistributed amounts from prior years.
The tax character of accumulated deficit as of June 30, 2019 was as follows:
Hussman Strategic
Growth Fund
Hussman Strategic Total Return Fund
Hussman Strategic
International Fund
Net unrealized appreciation (depreciation) . . . . . . . . . $ (1,298,120) $ 8,749,969 $ 662,357Accumulated (distributions in excess of) ordinary income . . 2,517,668 125,184 115,646Capital loss carryforwards . . . . . . . . . . . . . . . . . . . . (907,912,602) (76,156,910) (16,021,613)Other temporary differences . . . . . . . . . . . . . . . . . . . — (59,304) —Total accumulated deficit . . . . . . . . . . . . . . . . . . . . . $ (906,693,054) $ (67,341,061) $ (15,243,610)
The following information is based upon the federal income tax cost of investment securities as of June 30, 2019:
Hussman Strategic
Growth Fund
Hussman Strategic Total Return Fund
Hussman Strategic
International Fund
Cost of investments, money market funds, written option contracts and foreign currencies . . . . . $ 476,329,351 $ 211,982,223 $ 19,420,544
Gross unrealized appreciation . . . . . . . . . . . . . . . . . . $ 38,628,500 $ 9,632,442 $ 1,247,674Gross unrealized depreciation . . . . . . . . . . . . . . . . . . (39,926,620) (882,473) (586,030)Net unrealized appreciation (depreciation) . . . . . . . . . $ (1,298,120) $ 8,749,969 $ 661,644
The difference between the federal income tax cost of portfolio investments and the financial statement cost of portfolio investments for each Fund is due to certain timing differences in the recognition of capital gains or losses under income tax regulations and GAAP. These “book/tax” differences are temporary in nature and are primarily due to losses deferred due to wash sales, derivatives and adjustments to basis on publicly traded partnerships and grantor trusts.
Hussman Investment Trust Notes to Financial Statements (continued)
June 30, 2019

60
As of June 30, 2019, $824,973,031 of short-term capital loss carryforwards of Hussman Strategic Growth Fund expired unused.
During the year ended June 30, 2019, Hussman Strategic Total Return Fund utilized $2,842,200 of capital loss carryforwards to offset current year gains.
As of June 30, 2019, the Funds had the following capital loss carryforwards for federal income tax purposes:
Hussman Strategic
Growth Fund
Hussman Strategic Total Return Fund
Hussman Strategic
International Fund
Short-term loss carryforwards . . . . . . . . . . . . . . . . . . . $ 671,034,111 $ 60,806,412 $ 16,021,613Long-term loss carryforwards. . . . . . . . . . . . . . . . . . . . 236,878,491 15,350,497 —Total . . . . . . . . . . . . . . . . . . . . . . . . . . . . . . . . . . . $ 907,912,602 $ 76,156,909 $ 16,021,613
These capital loss carryforwards, which do not expire, may be utilized by the Funds in future years to offset their net realized capital gains, if any.
For the year ended June 30, 2019, the following reclassifications were made as a result of permanent differences between the financial statement and income tax reporting requirements due to adjustments for the expiration of capital loss carryforwards and nondeductible expenses from publicly traded partnerships:
Hussman Strategic
Growth Fund
Hussman Strategic Total Return Fund
Hussman Strategic
International Fund
Paid-in capital $ (824,973,113) $ (31) $ —Accumulated deficit 824,973,113 31 —
Such reclassifications have no effect on each Fund’s total net assets or its net asset value per share.
Each Fund recognizes the tax benefits or expenses of uncertain tax positions only when the position is “more likely than not” to be sustained assuming examination by tax authorities. Management has reviewed each Fund’s tax positions taken on federal income tax returns for the current and all open tax years (generally filed within the past three years) and all major jurisdictions and has concluded that no provision for unrecognized tax benefits or expenses is required in these financial statements. Therefore, no tax expense (including interest and penalties) was recorded in the current year and no adjustments were made to prior periods.
Hussman Investment Trust Notes to Financial Statements (continued)
June 30, 2019
Hussman Investment Trust Notes to Financial Statements (continued)
June 30, 2019

61
Hussman Investment Trust Notes to Financial Statements (continued)
June 30, 2019
2. INVESTMENT TRANSACTIONSDuring the year ended June 30, 2019, cost of purchases and proceeds from
sales and maturities of investment securities, other than short-term investments and U.S. government securities, amounted to: $406,710,993 and $428,857,096, respectively, for Hussman Strategic Growth Fund; $49,702,605 and $41,530,770, respectively, for Hussman Strategic Total Return Fund; and $11,608,286 and $18,598,783, respectively, for Hussman Strategic International Fund.
3. TRANSACTIONS WITH AFFILIATES
Advisory Agreement
Under the terms of an Advisory Agreement between the Trust and the Adviser, Hussman Strategic Growth Fund pays the Adviser a fee, which is computed and accrued daily and paid monthly, at annual rates of 0.90% of the first $2 billion of the Fund’s average daily net assets; 0.85% of the next $3 billion of such assets; and 0.80% of such assets over $5 billion, less any fee waivers. Under the terms of a separate Advisory Agreement between the Trust and the Adviser, Hussman Strategic Total Return Fund pays the Adviser a fee, which is computed and accrued daily and paid monthly, at annual rates of 0.50% of the first $1 billion of the Fund’s average daily net assets; 0.45% of the next $1.5 billion of such assets; and 0.40% of such assets over $2.5 billion, less any fee waivers. Under the terms of a separate Advisory Agreement between the Trust and the Adviser, Hussman Strategic International Fund pays the Adviser a fee, which is computed and accrued daily and paid monthly, at annual rates of 0.95% of the first $2 billion of the Fund’s average daily net assets; 0.90% of the next $3 billion of such assets; and 0.85% of such assets over $5 billion, less any fee waivers.
Effective November 1, 2018, the Adviser has contractually agreed that, until November 1, 2019, it will waive its advisory fees and/or absorb operating expenses of the Funds to the extent necessary so that operating expenses of Hussman Strategic Growth Fund, Hussman Strategic Total Return Fund and Hussman Strategic International Fund (excluding fees and expenses incurred on investments in other investment companies and pooled investment vehicles, brokerage commissions, taxes, interest expense and any extraordinary expenses) do not exceed annually an amount equal to 1.15%, 0.75%, and 2.00%, respectively, of such Fund’s average daily net assets. Prior to November 1, 2018, the Adviser had contractually agreed to waive its advisory fees or to absorb operating expenses of the Funds (excluding those fees and expenses noted above) to the extent necessary so that ordinary operating expenses of
Hussman Investment Trust Notes to Financial Statements (continued)
June 30, 2019

62
Hussman Strategic Growth Fund, Hussman Strategic Total Return Fund and Hussman Strategic International Fund did not exceed annually an amount equal to 1.13%, 0.73% and 2.00%, respectively, of such Fund’s average daily net assets. During the year ended June 30, 2019, the Adviser waived advisory fees in the amount of $313,486, $166,982 and $171,269 with respect to Hussman Strategic Growth Fund, Hussman Strategic Total Return Fund and Hussman Strategic International Fund, respectively.
Fee waivers and expenses absorbed by the Adviser pursuant to the Expense Limitation Agreements governing these arrangements are subject to future repayment by the Funds provided that such repayment does not result in Hussman Strategic Growth Fund’s, Hussman Strategic Total Return Fund’s and Hussman Strategic International Fund’s annual operating expenses (excluding those fees and expenses noted above) exceeding an amount equal to 1.07%, 0.63% and 2.00%, respectively, of such Fund’s average daily net assets, and provided further that repayment does not cause a Fund’s operating expenses to exceed any expense limitation in effect at the time of the reimbursement. In addition, the date as of which the advisory fees or expenses which are the subject of the repayment may not have been incurred more than three years prior to the date of repayment. As of June 30, 2019, the amount of fee waivers available for possible recovery by the Adviser from Hussman Strategic Growth Fund, Hussman Strategic Total Return Fund and Hussman Strategic International Fund is $980,255, $431,575 and $381,597, respectively. The portions of these amounts that the Adviser may recover expire as of the following dates:
June 30, 2020
June 30, 2021
June 30, 2022
Hussman Strategic Growth Fund . . . . . . . . . . . . . . . . . . . . . . $ 347,554 $ 319,215 $ 313,486Hussman Strategic Total Return Fund . . . . . . . . . . . . . . . . . $ 138,941 $ 125,652 $ 166,982Hussman Strategic International Fund . . . . . . . . . . . . . . . . $ 89,143 $ 121,185 $ 171,269
The Adviser may agree to continue after November 1, 2019 the current arrangement to limit the ordinary expenses of the Funds, or to implement a similar arrangement, but is not obligated to do so.
Certain officers of the Trust are also officers of the Adviser.
Other Service Providers
Ultimus Fund Solutions, LLC (“Ultimus”) provides administration, fund accounting, compliance and transfer agency services to the Funds. The Funds pay Ultimus fees for these services in accordance with various servicing agreements. In addition, the
Hussman Investment Trust Notes to Financial Statements (continued)
June 30, 2019
Hussman Investment Trust Notes to Financial Statements (continued)
June 30, 2019

63
Hussman Investment Trust Notes to Financial Statements (continued)
June 30, 2019
Funds reimburse Ultimus for certain out-of-pocket expenses, including, but not limited to, postage, supplies and costs of pricing the Funds’ portfolio securities. Certain officers of the Trust are also officers of Ultimus, or of Ultimus Fund Distributors, LLC (the “Distributor”), the principal underwriter of the Funds. The Distributor is a wholly-owned subsidiary of Ultimus.
The Funds compensate certain financial intermediaries for providing account maintenance and shareholder services to shareholder accounts held through such intermediaries. During the year ended June 30, 2019, Hussman Strategic Growth Fund, Hussman Strategic Total Return Fund and Hussman Strategic International Fund paid $177,165, $90,692 and $16,932, respectively, to financial intermediaries for such services. These amounts are included in transfer agent, account maintenance and shareholder services fees on the Statements of Operations.
Trustee Compensation
Trustees and officers affiliated with the Adviser or Ultimus are not compensated by the Funds for their services. Each Trustee who is not an “interested person,” as defined by the 1940 Act, of the Trust or an affiliated person of the Adviser or Ultimus (“Independent Trustee”) receives from the Trust: an annual retainer of $50,000, payable quarterly; a fee of $10,000 for attendance at each in-person meeting of the Board of Trustees (except that such fee is $15,000 with respect to the annual meeting of the Board) and a fee of $4,000 for attendance at each telephone meeting of the Board of Trustees; a fee of $3,000 for attendance at each meeting of any committee of the Board if not held on the same day as a Board meeting; a fee of $1,500 for participation in each informal monthly telephone conference call of the Board; and reimbursement of travel and other expenses incurred in attending meetings. Each Fund pays its proportionate share of the Independent Trustees’ fees and expenses.
Hussman Investment Trust Notes to Financial Statements (continued)
June 30, 2019

64
4. DERIVATIVES TRANSACTIONSThe locations in the Statements of Assets and Liabilities of the derivative positions
of Hussman Strategic Growth Fund and Hussman Strategic International Fund are as follows:
Hussman Strategic Growth Fund
Fair Value Average Monthly
Type of Derivative Risk Location
Asset Derivatives
Liability Derivatives
Notional Value During the Year
Ended June 30, 2019**
Index put options purchased
Equity Investments in securities at value $ 5,870,950 $ — $ 321,897,130
Index call options written
Equity Written call options, at value — (183,898,100) (320,133,345)
Hussman Strategic Growth Fund did not have any outstanding index call options purchased as of June 30, 2019. The average monthly notional value of index call options purchased during the year ended June 30, 2019 was $484,292 for Hussman Strategic Growth Fund.
Hussman Strategic International Fund
Fair Value* Average Monthly
Type of Derivative Risk Location
Asset Derivatives
Liability Derivatives
Notional Value During the Year
Ended June 30, 2019**
Futures contracts sold short
Equity Variation margin payable $ — $ (312,050) $ (19,337,898)
* Includes cumulative appreciation (depreciation) of futures contracts from the date the contracts were opened through June 30, 2019. Only current day variation margin is reported on the Statements of Assets and Liabilities.
**The average monthly notional value generally represents the Fund’s derivative activity throughout the period.
Hussman Investment Trust Notes to Financial Statements (continued)
June 30, 2019
Hussman Investment Trust Notes to Financial Statements (continued)
June 30, 2019

65
Hussman Investment Trust Notes to Financial Statements (continued)
June 30, 2019
Realized and unrealized gains and losses associated with transactions in derivative instruments for Hussman Strategic Growth Fund and Hussman Strategic International Fund during the year ended June 30, 2019 are recorded in the following locations on the Statements of Operations:
Hussman Strategic Growth Fund
Type of Derivative Risk Location
Realized Gains (Losses) Location
Change in Unrealized
Appreciation (Depreciation)
Index call options purchased
Equity Net realized gains (losses) from investments
$ 4,143,551
Net change in unrealized appreciation (depreciation) on investments $ 147,041
Index put options purchased
Equity Net realized gains (losses) from investments
(10,752,497)
Net change in unrealized appreciation (depreciation) on investments 50,671
Index call options written
Equity Net realized gains (losses) from written option contracts
(15,608,054)
Net change in unrealized appreciation (depreciation) on written option contracts (10,639,338)
Hussman Strategic International Fund
Type of Derivative Risk Location
Realized Gains Location
Change in Unrealized
Appreciation (Depreciation)
Index put options purchased
Equity Net realized gains (losses) from investments
$ 8,619
Net change in unrealized appreciation (depreciation) on investments $ —
Futures contracts sold short
Equity Net realized gains (losses) from futures contracts
1,248,082
Net change in unrealized appreciation (depreciation) on futures contracts (962,844)
Hussman Investment Trust Notes to Financial Statements (continued)
June 30, 2019

66
Hussman Strategic Total Return Fund had no transactions in derivative instruments during the year ended June 30, 2019.
In the ordinary course of business, Hussman Strategic Growth Fund and Hussman Strategic International Fund may enter into transactions subject to enforceable netting agreements or other similar arrangements (“netting agreements”). Generally, the right to offset in netting agreements allows each Fund to offset the exposure it has on any transaction with a specific counterparty with any collateral it has received or delivered in connection with other transactions with that counterparty. Generally, the Funds manage their cash collateral and securities collateral on a counterparty basis.
The offsetting of financial liabilities and derivative liabilities as of June 30, 2019 are as follows:
Hussman Strategic Growth Fund
Description
Gross Amounts of Recognized Liabilities
Gross Amounts Offset on
Statements of Assets and
Liabilities
Net Amounts of Liabilities Presented on Statements
of Assets and Liabilities
Collateral Pledged Net Amount
Written call options at market value . . . . . . . $ (183,898,100) $ — $ (183,898,100) $ — $ (183,898,100)
Total subject to a master netting or similar arrangement . . . . . $ (183,898,100) $ — $ (183,898,100) $ — $ (183,898,100)
Hussman Strategic International Fund
Description
Gross Amounts of Recognized Liabilities
Gross Amounts Offset on
Statements of Assets and
Liabilities
Net Amounts of Liabilities Presented on Statements
of Assets and Liabilities
Collateral Pledged* Net Amount
Variation margin payable - futures contracts . . . . . $ (67,721) $ — $ (67,721) $ 67,721 $ —
Total subject to a master netting or similar arrangement . . . . . $ (67,721) $ — $ (67,721) $ 67,721 $ —
* Amounts in cash collateral pledged in the table above are limited to the net amounts of liabilities presented on the Statements of Assets and Liabilities.
Hussman Investment Trust Notes to Financial Statements (continued)
June 30, 2019
Hussman Investment Trust Notes to Financial Statements (continued)
June 30, 2019

67
Hussman Investment Trust Notes to Financial Statements (continued)
June 30, 2019
5. CERTAIN INVESTMENTS AND ASSOCIATED RISKSThe securities in which the Funds invest, as well as the risks associated with these
securities and with the investment programs of the Funds, are described in each Fund’s Prospectus. Among these risks are those associated with investments in derivative instruments, investments in shares of money market funds, concentration of investments within a particular business sector and, in the case of Hussman Strategic International Fund, investments in foreign securities.
Risks of Derivative Instruments — The purchase and sale of derivative instruments, including options and futures contracts, and other derivative transactions involve risks different from those involved with direct investments in securities and also require different skills from the Adviser in managing each Fund’s portfolio of investments. While utilization of options, futures contracts and similar instruments may be advantageous to the Funds, if the Adviser is not successful in employing such instruments in managing a Fund’s investments or in anticipating general market movements, the Fund’s performance will be worse than if the Fund did not make such investments. It is possible that there will be imperfect correlation, or even no correlation, between price movements of the investments held by the Funds and the options, futures or other derivative instruments used to hedge those investments. It is also possible that a Fund may be unable to close out or liquidate its hedges during unusual periods of illiquidity in the options, futures or other markets. In addition, a Fund will pay commissions and other costs in connection with its transactions in such instruments, which may increase its expenses and reduce its investment performance.
Investments in Money Market Funds — In order to maintain sufficient liquidity to implement investment strategies, or for temporary defensive purposes, each Fund may at times invest a significant portion of its assets in shares of money market funds. As of June 30, 2019, Hussman Strategic Growth Fund and Hussman Strategic International Fund had 56.8% and 28.5%, respectively, of the value of their net assets invested in shares of a money market fund registered under the 1940 Act. An investment in a money market fund is not insured or guaranteed by the Federal Deposit Insurance Corporation or any other governmental agency, entity or person. While investor losses in money market funds have been rare, they are possible. The Funds incur additional indirect expenses due to acquired fund fees and expenses to the extent they invest in shares of money market funds.
Sector Risk — If a Fund has significant investments in the securities of issuers in industries within a particular business sector, any development generally affecting that sector will have a greater impact on the value of the net assets of the Fund than would be the case if the Fund did not have significant investments in that sector. This may
Hussman Investment Trust Notes to Financial Statements (continued)
June 30, 2019

68
increase the risk of loss of an investment in a Fund and increase the volatility of a Fund’s net asset value per share. From time to time, circumstances may affect a particular sector and the companies within such sector. For instance, economic or market factors, regulation or deregulation, and technological or other developments, may negatively impact all companies in a particular sector and therefore the value of a Fund’s portfolio could be adversely affected if it has significant holdings of securities of issuers in that sector. As of June 30, 2019, Hussman Strategic Growth Fund had 24.4% of the value of its net assets invested in stocks within the Consumer Discretionary sector.
Foreign Investment Risk — Compared with investing in the United States, investing in foreign markets involves a greater degree and variety of risks. Investors in foreign markets may face delayed settlements, currency controls and adverse economic developments as well as higher overall transaction costs. In addition, fluctuations in the U.S. dollar’s value versus other currencies may erode or reverse gains from investments denominated in foreign currencies or increase losses. Foreign governments may expropriate assets, impose capital or currency controls, impose punitive taxes, impose limits on ownership or nationalize a company or industry. Any of these actions could have a severe effect on securities prices and impair an investor’s ability to bring its capital or income back to the U.S. Exchange rate fluctuations also may impair a foreign issuer’s ability to repay U.S. dollar denominated debt, thereby increasing credit risk associated with investment in such debt. The values of foreign securities may be affected by incomplete, less frequent or inaccurate financial information about their issuers, social upheavals or political actions ranging from tax code changes to government collapse. Foreign companies may also receive less coverage than U.S. companies by market analysts and may be subject to reporting standards or regulatory requirements that differ from those applicable to U.S. companies.
As of June 30, 2019, investments of Hussman Strategic International Fund in issuers in the United Kingdom (the “UK”) represented 12.0% of the value of its stock portfolio and investments by the Fund in issuers in countries within the European Union (the “EU”), including the UK, represented 46.1% of the value of its stock portfolio. EU member countries that use the Euro as their currency (so-called Eurozone countries) lack the ability to implement an independent monetary policy and may be significantly affected by requirements that limit their fiscal options. Since the global economic crisis in 2008, some of these countries have depended on, and may continue to depend on, assistance from others such as the European Central Bank and other governments or institutions, and failure to implement reforms as a condition of assistance may have negative long-them effects for the economies of those countries and other European countries. In June 2016, voters in the UK approved a referendum calling for the exit
Hussman Investment Trust Notes to Financial Statements (continued)
June 30, 2019
Hussman Investment Trust Notes to Financial Statements (continued)
June 30, 2019

69
Hussman Investment Trust Notes to Financial Statements (continued)
June 30, 2019
of the UK from the EU (a process commonly referred to as “Brexit”). There presently is considerable uncertainty regarding the impact of Brexit on the economies and financial markets of the UK and of EU and other European countries, and following Brexit, there may be an extended period of political and economic uncertainty and market volatility in the UK, the EU, other European countries and globally, which may adversely impact the prices and liquidity of securities held by Hussman Strategic International Fund.
As of June 30, 2019, Hussman Strategic International Fund had 21.8% of the value of its stock portfolio invested in stocks of companies domiciled in Japan. At times, the Japanese economy has been negatively affected by government intervention and protectionism, an unstable financial services sector, a heavy reliance on international trade, and natural disasters. These factors, as well as other adverse political developments, increases in government debt, and changes to fiscal monetary or trade policies, may negatively affect Japanese markets and the prices of stocks of Japenese companies.
6. FORWARD FOREIGN CURRENCY EXCHANGE CONTRACTSHussman Strategic International Fund is subject to foreign currency exchange
rate risk in the normal course of pursuing its investment objective. Hussman Strategic International Fund may (but is not required to) enter into contracts for the purchase or sale of a specific foreign currency at a fixed price on a future date as a hedge or cross-hedge against either specific transactions or portfolio positions generally. Foreign currency hedging transactions may be used to reduce the risk that the U.S. dollar value of the Fund’s holdings of securities denominated in foreign currency will decline in value due to changes in foreign currency exchange rates or to protect against adverse changes in the prices of securities that the Fund is purchasing or selling prior to settlement of those transactions. All foreign currency exchange contracts are “marked-to-market” daily at the applicable translation rates resulting in unrealized gains or losses. Realized and unrealized gains or losses from transactions in foreign currency exchange contracts are included in the Fund’s Statement of Assets and Liabilities and Statement of Operations. Risks associated with these contracts include the potential inability of counterparties to meet the terms of their contracts and unanticipated movements in the value of a foreign currency relative to the U.S. dollar. Hussman Strategic International Fund, as previously noted, may also purchase foreign currency options to manage foreign currency exposures.
As of and during the year ended June 30, 2019, Hussman Strategic International Fund had no forward currency exchange contracts outstanding.
Hussman Investment Trust Notes to Financial Statements (continued)
June 30, 2019

70
7. BANK LINE OF CREDITHussman Strategic Growth Fund has an unsecured bank line of credit with its
custodian bank in the amount of $10,000,000. Hussman Strategic Total Return Fund has an unsecured bank line of credit with its custodian bank in the amount of $2,000,000. Any borrowings under these arrangements bear interest at a rate determined by the lending bank at the time of borrowing. During the year ended June 30, 2019, Hussman Strategic Growth Fund did not borrow under its line of credit. During the year ended June 30, 2019, Hussman Strategic Total Return Fund incurred $355 of interest expense related to borrowings. The average debt outstanding and the average interest rate for days with borrowings for Hussman Total Return Fund during the year ended June 30, 2019 were $1,278,500 and 5.0%, respectively. The largest outstanding borrowing during the year ended June 30, 2019 for Hussman Total Return Fund was $2,000,000. As of June 30, 2019, Hussman Total Return Fund did not have any outstanding borrowings. Hussman Strategic International Fund currently does not have a bank line of credit.
8. CONTINGENCIES AND COMMITMENTSThe Trust’s officers and Trustees are entitled to indemnification from the Funds for
certain liabilities to which they may become subject in connection with the performance of their duties to the Funds. Additionally, in the normal course of business, the Funds enter into contracts that contain a variety of representations and warranties and which may require the Funds to indemnify the other parties to the contracts in the event of certain losses. The Funds’ maximum exposure under these arrangements is unknown, as this would involve potential claims for indemnification for losses that may or may not be incurred in the future. However, based on experience, the Trust believes the risk of loss to be remote.
9. LEGAL PROCEEDINGSSeveral lawsuits have been filed relating to Hussman Strategic Growth Fund’s
investment in Tribune Company common stock in connection with Tribune Company’s Chapter 11 bankruptcy. The lawsuits stem from a leveraged buyout by which Tribune Company converted to a privately-held company in 2007. The Trust, Hussman Strategic Growth Fund and the Adviser (the “Hussman Entities”) were named as defendants and putative members of the proposed defendant class of shareholders in an adversary proceeding brought by The Official Committee of Unsecured Creditors of Tribune Company in the U.S. Bankruptcy Court for the District of Delaware in 2010. That action was subsequently transferred to the U.S. District Court for the
Hussman Investment Trust Notes to Financial Statements (continued)
June 30, 2019

71
Southern District of New York by order of the Judicial Panel on Multidistrict Litigation, and Marc S. Kirschner, the Litigation Trustee for the Tribune Litigation Trust, became successor plaintiff to the Creditors Committee on December 31, 2012, the effective date of Tribune Company’s plan of reorganization. The Trust and Hussman Strategic Growth Fund were also named as defendants in a lawsuit filed by the indenture trustees of certain noteholders of Tribune Company in the U.S. District Court for the Southern District of Ohio in 2011. Hussman Strategic Growth Fund and the Adviser were named as defendants in a similar action in the U.S. District Court for the District of Maryland in 2011. Both of those actions have been transferred to the U.S. District Court for the Southern District of New York for coordinated proceedings with many other similar lawsuits brought by individual creditors against former Tribune Company shareholders and the action currently prosecuted by the Tribune Litigation Trustee. The Trust, Hussman Strategic Growth Fund and the Adviser may also be putative defendant class members in some of these actions. The plaintiffs in all these lawsuits seek to recover amounts paid to shareholders of Tribune Company in connection with the leveraged buyout, plus interest and attorneys’ fees and expenses.
An omnibus motion to dismiss the actions filed by the individual creditors (the “Individual Creditor Actions”), but not the action prosecuted by the Litigation Trustee for the Tribune Litigation Trust (the “Litigation Trustee Action”), was filed in November 2012. On September 23, 2013, the U.S. District Court Judge issued a decision and order dismissing the Individual Creditor Actions in full. The plaintiffs in those actions appealed that decision to the U.S. Court of Appeals for the Second Circuit and certain shareholder defendants, including each of the Hussman Entities, cross-appealed. The Second Circuit heard oral argument on November 5, 2014 and issued a unanimous decision affirming the District Court’s decision on March 29, 2016. A petition of the individual creditors for rehearing or rehearing en banc was denied by the Second Circuit on July 22, 2016. The individual creditors filed a petition for a writ of certiorari in the United States Supreme Court on September 9, 2016, seeking Supreme Court review of the Second Circuit decision. On April 10, 2018, the plaintiffs in the Individual Creditor Actions filed a motion requesting that the Second Circuit recall its mandate, vacate its prior decision, and remand the actions to the District Court for further proceedings in light of the Supreme Court’s decision in Merit Management Group, LP v. FTI Consulting, Inc., No. 16-784 (U.S.) (“Merit Management”). The Second Circuit issued an order recalling the mandate “in anticipation of further panel review” on May 16, 2018.
Hussman Investment Trust Notes to Financial Statements (continued)
June 30, 2019

72
On August 2, 2013, with the District Court’s permission, the Litigation Trustee filed an amended complaint in the Litigation Trustee Action that named Hussman Strategic Growth Fund as one of the class representatives for the putative class of shareholder defendants. A global motion to dismiss this action was filed on behalf of all shareholder defendants on May 23, 2014 and the District Court issued an opinion and order granting the motion to dismiss on January 6, 2017. The Litigation Trustee noticed an appeal from the District Court’s decision on July 15, 2019.
On July 18, 2017, the Litigation Trustee requested a pre-motion conference in the District Court on a proposed motion to amend his complaint in the Litigation Trustee Action to add a claim for constructive fraudulent conveyance against the shareholder defendants based on the Supreme Court’s decision in Merit Management. Although the District Court denied the Litigation Trustee’s motion to amend its complaint on August 24, 2017, that denial was without prejudice and the Litigation Trustee renewed the motion to amend on March 8, 2018, based on the Supreme Court’s decision in Merit Management. The District Court denied the Litigation Trustee’s renewed motion to amend on April 23, 2019, and the Litigation Trustee noticed an appeal from the District Court’s decision on July 15, 2019.
The lawsuits allege no misconduct by the Hussman Entities, and each of them intends to defend itself vigorously in the lawsuits. Although the outcome of these proceedings cannot be predicted, the adverse impact to Hussman Strategic Growth Fund is not expected to exceed materially the value of the proceeds received by the Fund in connection with the leveraged buyout, which was $29,432,814 (representing, as of June 30, 2019 approximately 10.0% of the Fund’s net assets), plus interest. If the proceedings are decided or settled in a manner adverse to Hussman Strategic Growth Fund, the payment of judgments or settlements by the Fund in connection with the proceedings could have a material adverse effect on its net asset value per share.
10. SUBSEQUENT EVENTSThe Funds are required to recognize in their financial statements the effects of all
subsequent events that provide additional evidence about conditions that existed as of the date of the Statements of Assets and Liabilities. For non-recognized subsequent events that must be disclosed to keep the financial statements from being misleading, the Funds are required to disclose the nature of the event as well as an estimate of its financial effect, or a statement that such an estimate cannot be made. Management has evaluated subsequent events through the date of issuance of these financial statements and has noted no such events.
Hussman Investment Trust Notes to Financial Statements (continued)
June 30, 2019

73
To the Shareholders and the Board of Trustees of Hussman Investment Trust
Opinion on the Financial StatementsWe have audited the accompanying statements of assets and liabilities of Hussman Investment Trust (the “Trust”) (comprising the Hussman Strategic Growth Fund, Hussman Strategic Total Return Fund and Hussman Strategic International Fund (collectively referred to as the “Funds”)), including the schedule of investments and the schedule of open written option contracts for Hussman Strategic Growth Fund, the schedule of investments for Hussman Strategic Total Return Fund, and the schedule of investments and the schedule of futures contracts sold short for Hussman Strategic International Fund, as of June 30, 2019, and the related statements of operations for the year then ended, the statements of changes in net assets for each of the two years in the period then ended, the financial highlights for each of the five years in the period then ended and the related notes (collectively referred to as the “financial statements”). In our opinion, the financial statements present fairly, in all material respects, the financial position of each of the Funds comprising Hussman Investment Trust at June 30, 2019, the results of their operations for the year then ended, the changes in their net assets for each of the two years in the period then ended and their financial highlights for each of the five years in the period then ended, in conformity with U.S. generally accepted accounting principles.
Basis for OpinionThese financial statements are the responsibility of the Trust’s management. Our responsibility is to express an opinion on each of the Funds’ financial statements based on our audits. We are a public accounting firm registered with the Public Company Accounting Oversight Board (United States) (“PCAOB”) and are required to be independent with respect to the Trust in accordance with the U.S. federal securities laws and the applicable rules and regulations of the Securities and Exchange Commission and the PCAOB.
We conducted our audits in accordance with the standards of the PCAOB. Those standards require that we plan and perform the audit to obtain reasonable assurance about whether the financial statements are free of material misstatement, whether due to error or fraud. The Trust is not required to have, nor were we engaged to perform, an audit of the Trust’s internal control over financial reporting. As part of our audits, we
Hussman Investment TrustReport of Independent Registered Public Accounting Firm

74
Hussman Investment TrustReport of Independent Registered Public Accounting Firm (continued)
are required to obtain an understanding of internal control over financial reporting but not for the purpose of expressing an opinion on the effectiveness of the Trust’s internal control over financial reporting. Accordingly, we express no such opinion.
Our audits included performing procedures to assess the risks of material misstatement of the financial statements, whether due to error or fraud, and performing procedures that respond to those risks. Such procedures included examining, on a test basis, evidence regarding the amounts and disclosures in the financial statements. Our procedures included confirmation of securities owned as of June 30, 2019, by correspondence with the custodian and brokers or by other appropriate auditing procedures where replies from brokers were not received. Our audits also included evaluating the accounting principles used and significant estimates made by management, as well as evaluating the overall presentation of the financial statements. We believe that our audits provide a reasonable basis for our opinion.
We have served as the auditor of one or more Hussman Investment Trust investment companies since 2002.
Cincinnati, Ohio August 23, 2019

75
We believe it is important for you to understand the impact of costs on your investment. As a shareholder of the Funds, you incur two types of costs: (1) transaction costs, which may include redemption fees; and (2) ongoing costs, including management fees and other Fund expenses. The following examples are intended to help you understand your ongoing costs (in dollars) of investing in the Funds and to compare these costs with the ongoing costs of investing in other mutual funds. A mutual fund’s ongoing costs are expressed as a percentage of its average net assets. This figure is known as the expense ratio.
The examples below are based on an investment of $1,000 made at the beginning of the period shown and held for the entire period (January 1, 2019 – June 30, 2019).
The table on the following page illustrates each Fund’s ongoing costs in two ways:
Actual fund return – This section helps you to estimate the actual expenses that you paid over the period. The “Ending Account Value” shown is derived from each Fund’s actual return, and the fourth column shows the dollar amount of operating expenses that would have been paid by an investor who started the period with $1,000 invested in that Fund. You may use that information, together with the amount of your investment, to estimate the expenses that you paid over the period.
To do so, simply divide your account value by $1,000 (for example, an $8,600 account value divided by $1,000 = 8.6), and then multiply the result by the number given for the applicable Fund under the heading “Expenses Paid During Period.”
Hypothetical 5% return – This section is intended to help you compare each Fund’s ongoing costs with those of other mutual funds. It assumes that each Fund had an annual return of 5% before expenses during the period shown. In this case, because the return used is not each Fund’s actual return, the results do not illustrate the actual expenses associated with your investment. However, the example is useful in making comparisons because the SEC requires all mutual funds to provide an example of fund expenses based on a 5% annual return. You can assess each Fund’s ongoing costs by comparing this hypothetical example with the hypothetical examples that appear in shareholder reports of other mutual funds.
Note that expenses shown in the table are meant to highlight and help you compare ongoing costs only. The expense ratios used in computing annual expenses in the tables are the expense ratios of the Funds during the six-month period ended June 30, 2019, annualized, after fee reductions. Actual expenses of the Funds in future
Hussman Investment TrustAbout Your Funds’ Expenses (Unaudited)

76
periods may differ. The calculations assume no shares were bought or sold during the period. Your actual costs may have been higher or lower, depending on the amount of your investment and the timing of any purchases or redemptions.
More information about each Fund’s expenses, including annual expense ratios, can be found elsewhere in this report. For additional information on operating expenses and other shareholder costs, please refer to each Fund’s prospectus.
Beginning Account Value
January 1, 2019
Ending Account Value June 30, 2019
Net Expense Ratio(a)
Expenses Paid During
Period(b)
Hussman Strategic Growth FundBased on Actual Fund Return $ 1,000.00 $ 870.90 1.15% $ 5.33Based on Hypothetical 5%
Return (before expenses) $ 1,000.00 $ 1,019.09 1.15% $ 5.76
Hussman Strategic Total Return FundBased on Actual Fund Return $ 1,000.00 $ 1,071.60 0.75% $ 3.85Based on Hypothetical 5%
Return (before expenses) $ 1,000.00 $ 1,021.08 0.75% $ 3.76
Hussman Strategic International FundBased on Actual Fund Return $ 1,000.00 $ 987.00 2.00% $ 9.85Based on Hypothetical 5%
Return (before expenses) $ 1,000.00 $ 1,014.88 2.00% $ 9.99
(a) Annualized, based on each Fund’s most recent one-half year expenses.(b) Expenses are equal to each Fund’s annualized net expense ratio multiplied by the average account value over the
period, multiplied by 181/365 (to reflect the one-half year period).
Hussman Investment Trust About Your Funds’ Expenses (Unaudited) (continued)

77
Overall responsibility for supervision of management of the Funds rests with the Board of Trustees. The Trustees serve during the lifetime of the Trust and until its termination, or until death, resignation, retirement or removal. The Trustees, in turn, elect the officers of the Trust to supervise the day-to-day operations of the Funds. The officers are elected for annual terms. The following are the Trustees and executive officers of the Trust:
Trustee Address AgePosition Held with the Trust
Length of Time Served
*John P. Hussman, Ph. D. 6021 University Boulevard, Suite 490 Ellicott City, MD 21043
56 President and Trustee
Since June 2000
David C. Anderson 225 Pictoria Drive Cincinnati, OH 45246
68 Trustee Since June 2000
Jody T. Foster 225 Pictoria Drive Cincinnati, OH 45246
50 Trustee Since June 2016
William H. Vanover 225 Pictoria Drive Cincinnati, OH 45246
72 Trustee Since June 2000
Robert G. Dorsey 225 Pictoria Drive Cincinnati, OH 45246
62 Vice President Since June 2000
Mark J. Seger 225 Pictoria Drive Cincinnati, OH 45246
57 Treasurer Since June 2000
John F. Splain 225 Pictoria Drive Cincinnati, OH 45246
62 Secretary and Chief Compliance Officer
Since June 2000
* Dr. Hussman, as an affiliated person of the Adviser, is an “interested person” of the Trust within the meaning of Section 2(a)(19) of the 1940 Act.
As of the date of this Report, each Trustee oversees three portfolios of the Trust. The principal occupations during the past five years of the Trustees and executive officers of the Trust and public directorships (if any) currently held by the Trustees are set forth below:
John P. Hussman, Ph.D. is Chairman, President and Treasurer of the Adviser.
David C. Anderson is Network Administrator for Hephzibah Children’s Association (a child welfare organization).
Jody T. Foster is President of Symphony Consulting LLC (a provider of compliance, finance, marketing, operations and human resources services to public and private fund advisers).
Hussman Investment TrustBoard of Trustees and Officers (Unaudited)

78
William H. Vanover is retired. Prior to June 30, 2018, he was an investment counselor with Planning Alternatives, Ltd. (a registered investment adviser).
Robert G. Dorsey is Vice Chairman of Ultimus Fund Solutions, LLC (the Trust’s administrator and transfer agent) and affiliated companies. He was previously Co-CEO of Ultimus Fund Solutions, LLC (1999-2019).
Mark J. Seger is Vice Chairman of Ultimus Fund Solutions, LLC and affiliated companies. He was previously Co-CEO of Ultimus Fund Solutions, LLC (1999-2019).
John F. Splain is an Executive Vice President of Ultimus Fund Solutions, LLC.
Additional information about members of the Board of Trustees and executive officers of the Trust is available in the Statement of Additional Information (“SAI”) of each Fund. To obtain a free copy of the SAI, please call 1-800-487-7626.
Hussman Investment Trust Board of Trustees and Officers (Unaudited) (continued)

79
A description of the policies and procedures the Funds use to determine how to vote proxies relating to portfolio securities is available without charge upon request by calling toll-free 1-800-HUSSMAN (1-800-487-7626), or on the SEC’s website at www.sec.gov. Information regarding how the Funds voted proxies relating to portfolio securities during the most recent 12-month period ended June 30 is also available without charge upon request by calling toll-free 1-800-HUSSMAN, or on the SEC’s website at www.sec.gov.
The Trust files a complete listing of portfolio holdings for each Fund with the SEC as of the end of the first and third quarters of each fiscal year on Form N-Q. The filings are available upon request, by calling 1-800-HUSSMAN (1-800-487-7626). You may also obtain copies of these filings on the SEC’s website at www.sec.gov.
Hussman Investment TrustOther Information (Unaudited)
In accordance with federal tax requirements, the following provides shareholders with information concerning distributions from ordinary income made by the Funds during the fiscal year ended June 30, 2019. Certain dividends paid by the Funds may be subject to a maximum tax rate of 23.8%. Hussman Strategic Growth Fund, Hussman Strategic Total Return Fund and Hussman Strategic International Fund intend to designate up to a maximum amount of $4,057,363, $3,195,796 and $17,482, respectively, as taxed at a maximum rate of 23.8%. For the fiscal year ended June 30, 2019, 100%, 17% and 100% of the dividends paid from ordinary income by Hussman Strategic Growth Fund, Hussman Strategic Total Return Fund and Hussman Strategic International Fund, respectively, qualified for the dividends received deduction for corporations.
As required by federal regulations, the Trust will send to each shareholder complete information regarding dividends and other distributions of the Funds for 2019 on Form 1099-DIV.
Federal Tax Information (Unaudited)

80
At a meeting held in person on June 3, 2019, the Board of Trustees (the “Board”) of Hussman Investment Trust, including the Trustees who are not “interested persons,” as defined by the Investment Company Act of 1940, of the Trust (the “Independent Trustees”) voting separately, reviewed and unanimously approved the continuance of each Fund’s Advisory Agreement with the Adviser for an additional annual period.
In determining whether to approve continuances of the Advisory Agreements, the Independent Trustees requested and received from the Adviser such information as they deemed reasonably necessary to evaluate the terms of the Advisory Agreements and to assess whether the Advisory Agreements continue to be in the best interests of the Funds and their shareholders. In addition to reviewing and considering this information, the Independent Trustees considered information relating to the Funds and the Adviser that was provided to them in connection with meetings of the Board held throughout the year. They reviewed and considered, among other things: (i) the nature, extent and quality of the services provided by the Adviser to each of the Funds; (ii) the investment performance of each of the Funds; (iii) comparisons of the advisory fees of the Funds and their expenses to those of peer groups of mutual funds; (iv) the Adviser’s costs of providing services to the Funds and the profits realized by the Adviser from its relationship with the Funds; (v) whether economies of scale in the Adviser’s costs of providing services have been realized from growth of the Funds’ assets; and (vi) whether the advisory fees payable by each Fund reflect an appropriate sharing of any such economies with such Fund for the benefit of the Fund and its shareholders. The Independent Trustees also reviewed the background, qualifications, education and experience of the Adviser’s investment professionals and support personnel, and discussed and considered: (i) the quality of shareholder communications, administrative functions and other services provided by the Adviser to the Trust and each of the Funds; (ii) the quality of the Adviser’s compliance program; (iii) the Adviser’s role in coordinating and supervising services provided to the Trust; and (iv) indirect benefits that the Adviser may derive from its relationship with the Funds. The Independent Trustees were advised and supported in this process by independent legal counsel and, prior to voting, met with and asked questions of representatives of the Adviser, including Dr. John Hussman, and met separately with their counsel.
The Adviser provided the Independent Trustees with extensive information to assist them in analyzing both the absolute and risk-adjusted returns of the Funds over various periods. The returns of each Fund were compared to the returns of relevant indices and to the average returns of one or more selected peer groups of other mutual funds. These analyses and comparisons showed that, since its inception on July 24, 2000 through April 30, 2019, Hussman Strategic Growth Fund generated an average annual total
Hussman Investment TrustApproval of Investment Advisory Agreements(Unaudited)

81
Hussman Investment TrustApproval of Investment Advisory Agreements(Unaudited) (continued)
return of 0.32%, compared with an average annual total return of 5.85% for the S&P 500 Index. These analyses also showed that, since inception, Hussman Strategic Growth Fund’s hedging strategies have generally been successful in reducing the volatility of an investment in the Fund as compared to the volatility of relevant securities indices. Information provided to the Board indicated that the Adviser’s stock selection record for Hussman Strategic Growth Fund has over the long term been acceptable and that the underperformance by the Fund in recent years is largely attributable to the Fund’s use of hedging techniques and the nature of the Fund’s alternative investment approach, which is not intended to track general market movements. In evaluating the Fund’s investment performance, the Independent Trustees recognized that the use of hedging is an integral part of the Fund’s investment program and that, although this has caused significant underperformance, the Adviser has consistently managed the investment portfolio of Hussman Strategic Growth Fund in a manner consistent with the Fund’s investment objective and policies, and with the Adviser’s investment methodology, as described in the Fund’s prospectus. The Independent Trustees also recognized that the Adviser has adapted and refined the models and analytics it uses in managing the Fund in seeking to address the Fund’s underperformance and noted that the Adviser has from time to time implemented various modifications in its analytics and restrictions in its hedging approach with the goals of improving the investment performance of the Fund over the long term and reducing the risks and costs associated with its hedging strategy. The Independent Trustees observed that, although Hussman Strategic Growth Fund has underperformed the S&P 500 Index from 2009 to date, this period represents only half of a full market cycle and that the Fund’s outperformance of the Index prior to 2009 was substantial.
In reviewing the performance of Hussman Strategic Total Return Fund, the Independent Trustees took note of the fact that the Fund underperformed the Bloomberg Barclays U.S. Aggregate Bond Index during the one year period ended April 30, 2019, returning 4.90% versus a return of 5.29% for the Index. They also considered that the Fund’s average annual total return of 4.39% since its inception on September 12, 2002 through April 30, 2019 compares favorably to the 4.07% average annual total return of the Bloomberg Barclays U.S. Aggregate Bond Index during the same period.
With respect to Hussman Strategic International Fund, the Independent Trustees took note of the fact that the Fund underperformed the MSCI Europe, Australasia, Far East (“EAFE”) Index during the one year period ended April 30, 2019, returning –4.57% versus a return of –3.22% for the Index. They also considered the fact that the Fund’s average annual total return of –1.22% since its inception on December 31, 2009

82
through April 30, 2019 lagged the 5.05% average annual total return of the MSCI EAFE Index during the same period. In their evaluation of the investment performance of Hussman Strategic International Fund, the Independent Trustees observed that, since its inception, the Fund has maintained a defensive investment position in which it has been substantially fully hedged against the impact of general market fluctuations. They also observed, however, that the Fund has experienced less downside risk since its inception than would have resulted from use of a passive investment approach and noted that the Fund has not been in existence for a full market cycle, making it difficult to evaluate the Fund’s long-term investment performance relative to its investment objective.
In evaluating the advisory fees payable by the Funds and the Funds’ expense ratios, the Independent Trustees reviewed comparative expense and advisory fee information for peer groups of mutual funds based on investment style.
With respect to advisory fees, the Independent Trustees concluded that the advisory fee of Hussman Strategic Growth Fund, computed at the annual rate of 0.90% of average daily net assets (based on the Fund’s current asset level), compares favorably to the average advisory fees payable by other “long-short” and “market neutral” mutual funds, as categorized by Morningstar, and that, when compared to the advisory compensation payable by private investment funds that pursue hedged equity strategies, Hussman Strategic Growth Fund is much less expensive. The Independent Trustees also concluded that the advisory fee of Hussman Strategic Total Return Fund, computed at the annual rate of 0.50% of average daily net assets (based on the Fund’s current asset level), is within the range of advisory fees of other funds of similar size investing in similar securities. The Independent Trustees observed that the advisory fee of Hussman Strategic International Fund, computed at the annual rate of 0.95% of average daily net assets (based on the Fund’s current asset level), is higher than the advisory fee rates of most other international stock funds, but also observed that the Fund’s fee rate is less than the average advisory fee rates for “long-short” and “market neutral” mutual funds, as categorized by Morningstar. They noted in this regard that, unlike most international stock funds and similar to “long-short” and “market neutral” mutual funds, Hussman Strategic International Fund employs an investment strategy that incorporates risk management and hedging techniques. Thus, the Independent Trustees concluded that the advisory fee payable by that Fund is appropriate. With respect to each of the Funds, the Independent Trustees determined that the fees payable to the Adviser appropriately reflect the nature and scope of services provided by the Adviser (which are broader than the norm) and the value to the Funds of the Adviser’s experience, expertise and analytic capabilities. They also determined that the advisory
Hussman Investment TrustApproval of Investment Advisory Agreements(Unaudited) (continued)

83
fee schedules of the Funds, which include breakpoints in the fee rates applicable to net assets in excess of specified levels, provide the opportunity for each of the Funds and its shareholders to participate in economies of scale in the Adviser’s costs of providing services that may be associated with potential future growth of the Funds’ assets.
With respect to the total expenses of the Funds, the Independent Trustees considered the fact that the expense ratios of Hussman Strategic Growth Fund and Hussman Strategic Total Return Fund, both before and after advisory fee reductions pursuant to the Adviser’s agreement to waive its fees or to absorb expenses of the Funds as necessary to maintain the operating expenses of the Fund (excluding acquired fund fees and expenses, brokerage commissions, taxes, interest expense and any extraordinary expenses) at specified levels, are considerably less than the averages for their respective peer group funds. They noted in this regard that Hussman Strategic Growth Fund has one of the lowest expense ratios among mutual funds classified by Morningstar as “long-short” or “market neutral” funds. They further noted that, notwithstanding the significant decline in the net assets of Hussman Strategic Growth Fund in recent years, the expense ratio of the Fund (after fee waivers) has not increased significantly and, in addition, that the Fund has continued to benefit from reductions in the contractual fee rates payable pursuant to its Advisory Agreement that were implemented when the Fund’s assets were substantially greater. With respect to Hussman Strategic Total Return Fund, the Independent Trustees noted that the Fund’s expense ratio is considerably less than the average expense ratio of “tactical allocation” or “multi-sector bond” mutual funds tracked by Morningstar. They also noted that, from time to time since each such Fund’s inception, its expense ratio was reduced through the introduction of advisory fee breakpoints. In addition, the Independent Trustees considered the fact that, since March 2013, the Adviser has contractually been waiving a portion of its fees to reduce the total operating expenses of Hussman Strategic Growth Fund and Hussman Strategic Total Return Fund, and most recently has agreed to waive its advisory fees or to absorb operating expenses of these Funds until at least November 1, 2019, to the extent necessary to limit the total annual operating expenses of Hussman Strategic Growth Fund and Hussman Strategic Total Return Fund (excluding acquired fund fees and expenses, brokerage commissions, taxes, interest expense and any extraordinary expenses) to 1.15% and 0.75%, respectively, of average daily net assets.
The Independent Trustees also reviewed comparative information relating to the total expenses of Hussman Strategic International Fund. They noted that the expense ratio of Hussman Strategic International Fund is higher than many other mutual funds that have similar investment strategies. However, the Independent Trustees considered the fact that this higher expense ratio is attributable, in part, to the small size of
Hussman Investment TrustApproval of Investment Advisory Agreements(Unaudited) (continued)

84
Hussman Investment TrustApproval of Investment Advisory Agreements(Unaudited) (continued)
Hussman Strategic International Fund and took into consideration the expense limitation arrangement under which the Adviser has contractually agreed to waive its advisory fees or to absorb operating expenses of the Fund until at least November 1, 2019, to the extent necessary to limit total annual operating expenses of the Fund (excluding acquired fund fees and expenses, brokerage commissions, taxes, interest expense and any extraordinary expenses) to 2.00% of average daily net assets. The Independent Trustees also considered the fact that the Adviser agreed several years ago to a new schedule of advisory fee rates which resulted in an immediate reduction in the effective advisory fee rate for Hussman Strategic International Fund of 0.05% of average daily net assets (based on the Fund’s then current asset level). They concluded that Hussman Strategic International Fund has benefited and continues to benefit from a reduction in advisory fee rates and expense limitation arrangements that have enabled it to maintain an expense ratio within the range of expense ratios of its peer group funds.
In evaluating the expense ratios of the Funds, the Independent Trustees recognized that, although under the expense limitation agreements currently in effect the Adviser may be entitled to reimbursement from each Fund for all or a portion of fees waived and expenses absorbed by the Adviser, any such reimbursement could not result in the expense ratio of the Fund (excluding acquired fund fees and expenses, brokerage commissions, taxes, interest expense and any extraordinary expenses) exceeding: (i) the expense limitation in effect for the Fund at the time of the fee waiver or expense absorption by the Adviser; or (ii) the expense limitation (if any) in effect at the time of reimbursement by the Fund. The Independent Trustees were cognizant of the fact that the current expense limitation agreement for each Fund remains in effect only until November 1, 2019, but recognized that the Adviser has historically agreed to continuing such agreements in effect from year to year (either without change or with only relatively minor upward adjustment in the applicable expense limitation).
The Independent Trustees also reviewed recent financial statements of the Adviser, as well as schedules showing the Adviser’s estimated revenues, expenses and profitability with respect to each of the Funds for calendar years 2016, 2017 and 2018. They noted that the Adviser has waived its fees payable to it by the Funds, thereby reducing its profitability, pursuant to expense limitation agreements. They recognized that, although the Adviser has realized significant profits over the years from its advisory relationship with each Fund and the Adviser’s profit margins associated with providing services to each Fund have been significant at times, they concluded that the Adviser’s profitability with respect to each of the Funds was not excessive when viewed in light of the scope of services provided by the Adviser and the Adviser’s adherence to its stated investment philosophy and the investment

85
programs of the Funds. The Independent Trustees also recognized that the Adviser’s profitability with respect to each Fund has declined significantly in recent years as a consequence of declines in the total net assets of the Funds. In evaluating the Adviser’s profitability, the Independent Trustees considered the broad and unique skill set and talent of the Adviser that is required for the Adviser to pursue and to adhere to the Funds’ well-defined and disciplined investment programs, which has been a primary attraction of the Funds to investors. They determined that, notwithstanding a decline in the Adviser’s revenues and the resulting decrease in its profitability, the Adviser has available financial resources to continue to provide all required services to the Funds, without diminution of service quality, and that, to the extent any further declines in the net assets of the Funds may reduce the Adviser’s revenues, it would be feasible for the Adviser to reduce its expenses or access capital resources if necessary to maintain the scope and quality of services provided to the Funds.
Based on a careful review of the investment performance and risk characteristics of the Funds and consideration of other matters deemed by them to be pertinent (including, but not limited to, the factors and information discussed above), the Independent Trustees concluded that the Adviser has provided all required services to the Funds in a satisfactory manner. They determined that this conclusion is supported by the nature and scope of advisory services required by the Funds, which are broader and more sophisticated than those required by many other mutual funds due to the nature of the Funds’ investment programs and which involve extensive use of risk-management techniques. The Independent Trustees also considered the fact that the Adviser has generally achieved lower volatility of investment returns for the Funds than would have resulted from use of a passive investment approach. They recognized that challenges associated with the Adviser’s hedging approach have reduced the returns of Hussman Strategic Growth Fund and Hussman Strategic International Fund in the period since 2009, but noted that the Adviser has implemented meaningful changes in its methodologies since 2009 that may operate to reduce the frequency of similar challenges in future market cycles while maintaining the favorable attributes that the Adviser’s hedging strategies exhibited in the years prior to 2009. In this regard, the Independent Trustees specifically considered the fact that the investment performance of each of the Funds in recent years generally has been disappointing and considered whether, under such circumstances, it would be appropriate and consistent with their duties and the interests of the Funds to approve the continuance of each of the Advisory Agreements, as proposed.
Hussman Investment TrustApproval of Investment Advisory Agreements(Unaudited) (continued)

86
Hussman Investment TrustApproval of Investment Advisory Agreements(Unaudited) (continued)
The Independent Trustees concluded that the Adviser has consistently taken a proactive stance with regard to shareholder protections, service quality and ethical standards. Among other things, they noted that the Adviser: (i) does not derive any material indirect benefits from its relationship with the Funds; (ii) does not derive any economic benefit in connection with transactions in shares of the Funds; and (iii) adheres to a brokerage placement policy that seeks to obtain best execution and low commissions on all of the Funds’ brokerage transactions and does not direct transactions to obtain “soft dollar” services, which has resulted in significant savings to the Funds and their shareholders by reducing transaction costs (which are not reflected in the expense ratios of the Funds) and has operated to increase the Funds’ investment performance after expenses. The Independent Trustees thought it was significant that Dr. John Hussman and other personnel of the Adviser, and their immediate family members and charitable entities, maintain substantial investments in the Funds, which helps to align the interests of the Adviser and its personnel with the interests of shareholders.
After evaluating all pertinent factors and information (including but not limited to the factors and information discussed above), the Board determined that the fees payable by each Fund pursuant to the Advisory Agreements were appropriate in view of the nature, scope and quality of services provided by the Adviser and determined that continuances of the Advisory Agreements would be in the best interests of the Funds and their shareholders. Accordingly, the Board voted unanimously to approve the continuance of each of the Advisory Agreements for an additional annual period. No single factor was considered in isolation or to be determinative to this decision.

THIS PAGE INTENTIONALLY LEFT BLANK.
Hussman Investment TrustApproval of Investment Advisory Agreements(Unaudited) (continued)

THIS PAGE INTENTIONALLY LEFT BLANK.

THIS PAGE INTENTIONALLY LEFT BLANK.

INVESTMENT ADVISER Hussman Strategic Advisors, Inc.
6021 University Boulevard, Suite 490 Ellicott City, Maryland 21043
www.hussmanfunds.com 1-800-HUSSMAN (1-800-487-7626)
ADMINISTRATOR/TRANSFER AGENTUltimus Fund Solutions, LLC
225 Pictoria Drive, Suite 450 Cincinnati, Ohio 45246
CUSTODIANSU.S. Bank, N.A.
425 Walnut Street Cincinnati, Ohio 45202
The Northern Trust Company50 South LaSalle StreetChicago, Illinois 60675
INDEPENDENT REGISTERED PUBLIC ACCOUNTING FIRM
Ernst & Young LLP 1900 Scripps Center 312 Walnut Street
Cincinnati, Ohio 45202
LEGAL COUNSELSchulte Roth & Zabel LLP
919 Third Avenue New York, New York 10022
This Report is authorized for distribution only if accompanied or preceded
by a current Prospectus of the Funds.