HURRICANE TRACKING ADVISORY eVENT - Willis · Warnings, Watches and New Tropical Cyclone Potential...
2
1 of 2 © Copyright 2011 Willis Limited/Willis Re Inc. All rights reserved: No part of this publication may be reproduced, stored in a retrieval system, or transmitted in any form or by any means, whether electronic, mechanical, photocopying, recording, or otherwise, without the written permission of Willis Limited/Willis Re Inc. Some information contained in this report may be compiled from third party sources; however, we do not guarantee and are not responsible for the accuracy of such. This report is for general guidance only, is not intended to be relied upon, and any action based on or in connection with anything contained herein should be taken only after obtaining specific advice. The views expressed in this report are not necessarily those of Willis Limited/Willis Re Inc., or any of its/their parent or sister companies, subsidiaries or affiliates (hereinafter “Willis“). Willis accepts no responsibility for the content or quality of any third party websites to which we refer. The TAOS real-time hazard and impact forecast information is provided "as is" and without warranties as to performance or any other warranties whether expressed or implied. The user is strongly cautioned to recognize that natural hazards modeling and analysis are subject to many uncertainties. These uncertainties include, but are not limited to, the uncertainties inherent in weather and climate, incomplete or inaccurate weather data, changes to the natural and built environment, limited historical records, and limitations in the state of the art of modeling, as well as limits to the scientific understanding of storm weather phenomena. Anyone making use of the hazard and impact information provided by KAC, or the information contained within, assumes all liability deriving from such use, and agrees to "hold harmless" any and all agencies or individuals associated with its creation. The user agrees to provide any subsequent users of this data with this disclaimer. The publication of the material contained herein is not intended as a representation or warranty that this information is suitable for any general or particular use. Hazard and damage potential maps produced by Willis are based on numerical modeling results from Kinetic Analysis Corporation. Tropical Storm Ophelia Information from NHC Advisory 10, 5:00 AM EDT Friday September 23, 2011 Tropical Storm Ophelia continues to weaken. Some additional weakening is forecast during the next 48 hours and Ophelia could become a tropical depression over the weekend. Intensity Measures Position & Heading Landfall Forecast (NHC) Max Sustained Wind Speed: 45 mph (tropical storm) Position Relative to Land: 740 miles ESE of the Leeward Islands Est. Time & Region: n/a Min Central Pressure: 1004 mb Coordinates: 14.5, 51.0 W Trop. Storm Force Winds (39+ mph): 260 miles from the center Bearing/Speed: WNW or 290 degrees at 13 mph Est. Max Sustained Wind Speed: n/a HURRICANE TRACKING ADVISORY eVENT ™ Forecast Summary • Within 48 hours, there is a 42% chance Ophelia will remain a tropical storm (39-73 mph winds), a 4% chance Ophelia will strengthen to a hurricane (74+ mph winds) and a 56% chance Ophelia will weaken to a tropical depression (winds below 39 mph) or dissipate. • The windfield map – based on the HWRF 00:00 UTC forecast (below right) – shows that this model has forecast the storm’s peak winds at category 1 hurricane strength (74-95 mph winds). The HWRF – one of many models used by NOAA – has been statistically identified as the current “best performing” model for Tropical Storm Ophelia by Kinetic Analysis Corp. Forecast tracks for all current models (All Fcst Tracks) are shown on the map (in pale gray) to illustrate the uncertainty in Ophelia’s forecast track. • The NHC estimates that Barbuda and Saint Maarten each have an 8% chance of experiencing weak tropical storm force winds (39-58 mph) from Ophelia within the next five days. Other islands in the vicinity of Barbuda and Saint Maarten are also estimated to have some chance of experiencing Ophelia’s winds, but lower than the chances estimated for Barbuda and Saint Maarten. Forecast Track for Tropical Storm Ophelia (National Hurricane Center) Forecast Windfield & Rain Footprint for Tropical Storm Ophelia (Based on HWRF as of 00:00 UTC) from Kinetic Analysis Corp. Santo Domingo Washington D.C. Ottawa Ottawa San Juan San Juan Kingston Kingston Port-au-Prince Port-au-Prince Nassau Nassau Castries Castries Willemstad Willemstad Fort-De-France Fort-De-France Miami Miami Buffalo Buffalo Toronto Toronto US US CA CA DO DO CU CU Tropic of Cancer Tropic of Cancer Bermuda 09-28 09-25 09-24 09-27 09-26 09-23 0 1,000 2,000 500 Miles weak TS strong TS Cat 1 Cat 2 Cat 3 Cat 4 Cat 5 All Fcst Tracks below 1 in 1 - 3 in 3 - 6 in 6 - 9 in 9 - 12 in 12 - 24 in HWRF FcstTrack NHC FcstTrack Ï ! D TD Ï ! S TS Ï ! 1 Cat1 Ï ! 2 Cat2 Ï ! 3 Cat3 Ï ! 4 Cat4 Ï ! 5 Cat5
Transcript of HURRICANE TRACKING ADVISORY eVENT - Willis · Warnings, Watches and New Tropical Cyclone Potential...

1 of 2
© Copyright 2011 Willis Limited/Willis Re Inc. All rights reserved: No part of this publication may be reproduced, stored in a retrieval system, or transmitted in any form or by any means, whether electronic, mechanical, photocopying, recording, or otherwise, without the written permission of Willis Limited/Willis Re Inc. Some information contained in this report may be compiled from third party sources; however, we do not guarantee and are not responsible for the accuracy of such. This report is for general guidance only, is not intended to be relied upon, and any action based on or in connection with anything contained herein should be taken only after obtaining specific advice. The views expressed in this report are not necessarily those of Willis Limited/Willis Re Inc., or any of its/their parent or sister companies, subsidiaries or affiliates (hereinafter “Willis“). Willis accepts no responsibility for the content or quality of any third party websites to which we refer. The TAOS real-time hazard and impact forecast information is provided "as is" and without warranties as to performance or any other warranties whether expressed or implied. The user is strongly cautioned to recognize that natural hazards modeling and analysis are subject to many uncertainties. These uncertainties include, but are not limited to, the uncertainties inherent in weather and climate, incomplete or inaccurate weather data, changes to the natural and built environment, limited historical records, and limitations in the state of the art of modeling, as well as limits to the scientific understanding of storm weather phenomena. Anyone making use of the hazard and impact information provided by KAC, or the information contained within, assumes all liability deriving from such use, and agrees to "hold harmless" any and all agencies or individuals associated with its creation. The user agrees to provide any subsequent users of this data with this disclaimer. The publication of the material contained herein is not intended as a representation or warranty that this information is suitable for any general or particular use.
Hazard and damage potential maps produced by Willis are based on numerical modeling results from Kinetic Analysis Corporation.
Tropical Storm OpheliaInformation from NHC Advisory 10, 5:00 AM EDT Friday September 23, 2011Tropical Storm Ophelia continues to weaken. Some additional weakening is forecast during the next 48 hours and Ophelia could become a tropical depression over the weekend.
Intensity Measures Position & Heading Landfall Forecast (NHC)
Max Sustained Wind Speed:
45 mph (tropical storm)
Position Relative to Land:
740 miles ESE of the Leeward Islands Est. Time & Region: n/a
Min Central Pressure: 1004 mb Coordinates: 14.5, 51.0 W
Trop. Storm ForceWinds (39+ mph):
260 miles from the center Bearing/Speed: WNW or 290 degrees at 13 mph Est. Max Sustained Wind
Speed: n/a
HURRICANE TRACKING ADVISORY
eVENT™
Forecast Summary• Within 48 hours, there is a 42% chance Ophelia will remain a tropical storm (39-73 mph winds), a 4% chance Ophelia will strengthen to a
hurricane (74+ mph winds) and a 56% chance Ophelia will weaken to a tropical depression (winds below 39 mph) or dissipate.
• The windfield map – based on the HWRF 00:00 UTC forecast (below right) – shows that this model has forecast the storm’s peak winds at
category 1 hurricane strength (74-95 mph winds). The HWRF – one of many models used by NOAA – has been statistically identified as the
current “best performing” model for Tropical Storm Ophelia by Kinetic Analysis Corp. Forecast tracks for all current models (All Fcst Tracks) are
shown on the map (in pale gray) to illustrate the uncertainty in Ophelia’s forecast track.
• The NHC estimates that Barbuda and Saint Maarten each have an 8% chance of experiencing weak tropical storm force winds (39-58 mph) from
Ophelia within the next five days. Other islands in the vicinity of Barbuda and Saint Maarten are also estimated to have some chance of experiencing Ophelia’s winds, but lower than the chances estimated for Barbuda and Saint Maarten.
Forecast Track for Tropical Storm Ophelia(National Hurricane Center)
Forecast Windfield & Rain Footprint for Tropical Storm Ophelia(Based on HWRF as of 00:00 UTC) from Kinetic Analysis Corp.
Santo Domingo
Washington D.C.
OttawaOttawa
San JuanSan JuanKingstonKingston Port-au-PrincePort-au-Prince
NassauNassau
CastriesCastries
WillemstadWillemstad
Fort-De-FranceFort-De-France
MiamiMiami
BuffaloBuffaloTorontoToronto
USUS
CACA
DODO
CUCU
COCO VEVE
Tropic of CancerTropic of Cancer
Bermuda
09-28
09-25
09-24
09-27
09-26
09-23
0 1,000 2,000500 Miles
weak TSstrong TSCat 1Cat 2Cat 3Cat 4Cat 5All Fcst Tracks
below 1 in1 - 3 in3 - 6 in6 - 9 in9 - 12 in12 - 24 inHWRF FcstTrackNHC FcstTrack
Ï!D TD
Ï!S TS
Ï!1 Cat1
Ï!2 Cat2
Ï!3 Cat3
Ï!4 Cat4
Ï!5 Cat5
Page 2 of 2
Roy Cloutier7760 France Avenue SouthMinneapolis, MN [email protected]+1 (952) 841-6652
Contact us
Brian Owens51 Lime Street London EC3M [email protected]+44 (0)20 3124 7637
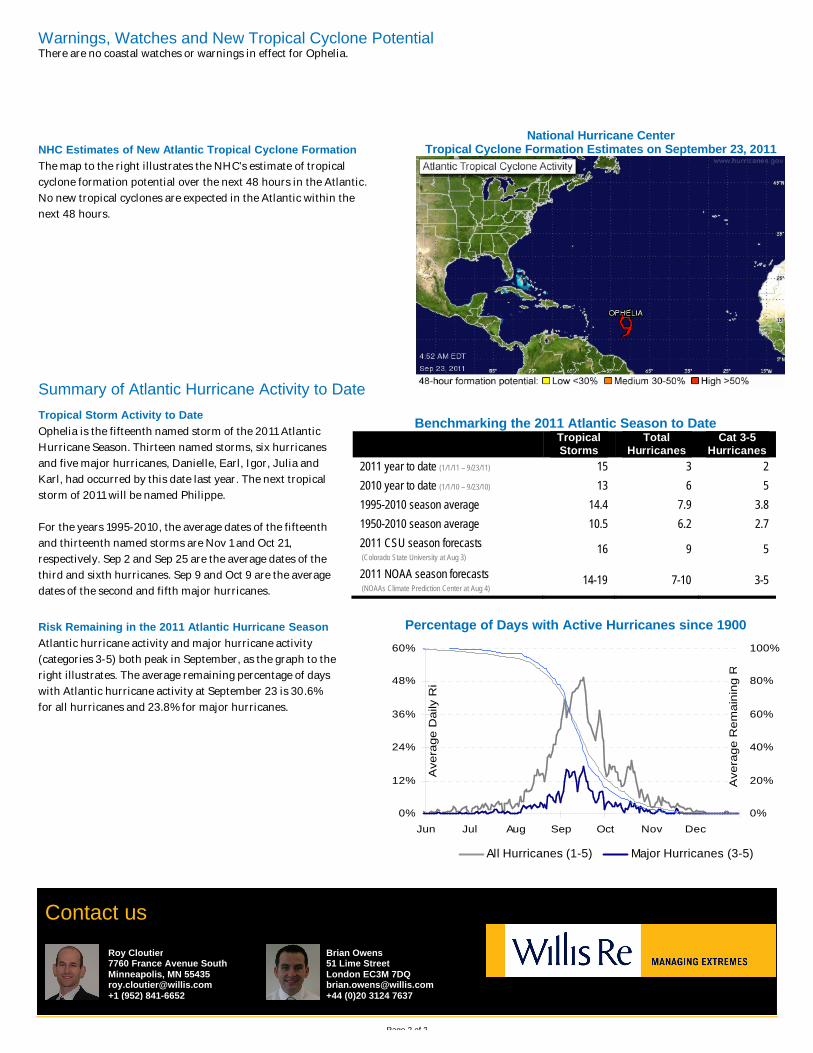
Warnings, Watches and New Tropical Cyclone PotentialThere are no coastal watches or warnings in effect for Ophelia.
NHC Estimates of New Atlantic Tropical Cyclone FormationThe map to the right illustrates the NHC’s estimate of tropical
cyclone formation potential over the next 48 hours in the Atlantic.
No new tropical cyclones are expected in the Atlantic within the
next 48 hours.
National Hurricane Center Tropical Cyclone Formation Estimates on September 23, 2011
Summary of Atlantic Hurricane Activity to DateTropical Storm Activity to DateOphelia is the fifteenth named storm of the 2011 Atlantic
Hurricane Season. Thirteen named storms, six hurricanes
and five major hurricanes, Danielle, Earl, Igor, Julia and
Karl, had occurred by this date last year. The next tropical
storm of 2011 will be named Philippe.
For the years 1995-2010, the average dates of the fifteenth
and thirteenth named storms are Nov 1 and Oct 21,
respectively. Sep 2 and Sep 25 are the average dates of the
third and sixth hurricanes. Sep 9 and Oct 9 are the average
dates of the second and fifth major hurricanes.
Benchmarking the 2011 Atlantic Season to DateTropical Storms
Total Hurricanes
Cat 3-5 Hurricanes
2011 year to date (1/1/11 – 9/23/11) 15 3 22010 year to date (1/1/10 – 9/23/10) 13 6 51995-2010 season average 14.4 7.9 3.81950-2010 season average 10.5 6.2 2.72011 CSU season forecasts(Colorado State University at Aug 3)
16 9 5
2011 NOAA season forecasts(NOAAs Climate Prediction Center at Aug 4)
14-19 7-10 3-5
Risk Remaining in the 2011 Atlantic Hurricane SeasonAtlantic hurricane activity and major hurricane activity
(categories 3-5) both peak in September, as the graph to the
right illustrates. The average remaining percentage of days
with Atlantic hurricane activity at September 23 is 30.6%
for all hurricanes and 23.8% for major hurricanes.
Percentage of Days with Active Hurricanes since 1900
0%
12%
24%
36%
48%
60%
Jun Jul Aug Sep Oct Nov Dec
Ave
rage
Dai
ly R
isk
0%
20%
40%
60%
80%
100%
Ave
rage
Rem
aini
ng R
isk
All Hurricanes (1-5) Major Hurricanes (3-5)