HURRICANE SANDY - NOAA Tides & Currents - National · PDF fileNOAA NOS Hurricane Sandy Water...
62
NOAA Water Level and Meteorological Data Report HURRICANE SANDY Silver Spring, Maryland January 24, 2013 noaa National Oceanic and Atmospheric Administration U.S. DEPARTMENT OF COMMERCE National Ocean Service Center for Operational Oceanographic Products and Services Photo Credit: NOAA National Environmental Satellite, Data & Information Service GOES Imagery
Transcript of HURRICANE SANDY - NOAA Tides & Currents - National · PDF fileNOAA NOS Hurricane Sandy Water...

NOAA Water Level and Meteorological Data Report HURRICANE SANDY
Silver Spring, Maryland January 24, 2013
noaa National Oceanic and Atmospheric Administration U.S. DEPARTMENT OF COMMERCE National Ocean Service Center for Operational Oceanographic Products and Services
Photo Credit: NOAA National Environmental Satellite, Data & Information Service GOES Imagery

NOAA Water Level and Meteorological Data Report HURRICANE SANDY Colleen Fanelli, Paul Fanelli, David Wolcott January 24, 2013
noaa National Oceanic and Atmospheric Administration U.S. DEPARTMENT National Oceanic and National Ocean Service OF COMMERCE Atmospheric Administration Dr. Holly Bamford Rebecca Blank Dr. Jane Lubchenco Assistant Administrator Acting Secretary Administrator
Center for Operational Oceanographic Products and Services Director, Richard Edwing

NOAA NOS Hurricane Sandy Water Level & Meteorological Data Report 1
Table of Contents Report Overview ................................................................................................................................ 2 Tropical Cyclone Summary ................................................................................................................. 3 Map of Storm Track relative to NOS Water Level Station Locations ..................................................... 5 Table of Maximum Recorded Water Levels (Storm Tide) ..................................................................... 8 Table of Maximum Wind Speed and Minimum Barometric Pressure .................................................. 11 Table of Maximum Recorded Water Level Residuals (Storm Surge) ................................................... 14 Stations that Exceeded Historical Maximum Water Levels................................................................. 17 Time-Series Plots of Observed, Predicted and Residual Water Levels ................................................. 18 Contact Information ......................................................................................................................... 54 Table of NOS Water Level Station Locations ...................................................................................... 55 Definitions ....................................................................................................................................... 57 Saffir-Simpson Hurricane Wind Scale Classification ........................................................................... 60

NOAA NOS Hurricane Sandy Water Level & Meteorological Data Report 2
Overview The National Oceanic and Atmospheric Administration (NOAA) Center for Operational
Oceanographic Products and Services (CO-OPS) maintains a network of oceanographic and meteorological stations along the United States coastlines and Great Lakes to monitor water levels, winds (speed, direction and gusts), barometric pressure, and air/water temperature. This report documents the elevated water levels, high winds and reduced barometric pressures recorded at stations along the East Coast of the U.S. from Florida to Maine during Hurricane Sandy.
Station information and locations are contained in Figures 1 & 2a-2c and Appendices 1 & 2. Tidal stations are referenced to the standard chart datum of Mean Lower Low Water (MLLW), based on the National Tidal Datum Epoch 1983-2001 (Appendix 3). In addition, at several locations along the U.S. coast, water levels are provided relative to a geodetic reference datum, the North American Vertical Datum of 1988 (NAVD88), to assist in relating water levels to coastal inundation estimates.
Table 1 provides storm tide elevations and predicted tide elevations for stations affected by Hurricane Sandy by geographic region. Where available, water level elevations relative to NAVD88 are also presented, along with the residuals at the time of the maximum storm tides. Maximum storm surge levels are summarized in Table 3, ranked by amplitude. Storm tides are the maximum water level elevations during a storm passage. Residuals are the elevation differences between observed and predicted tides. Storm surge is the residual caused directly by the storm during its passage. Table 2 provides maximum wind speeds, wind gusts, and minimum barometric pressures observed at the stations during Hurricane Sandy.
In addition, the report highlights stations which have exceeded historical recorded maximum water levels as a result of Sandy (Figure 3). The historical recorded maximum water levels are the maximum water elevation measured by a water level station with a continuous time series throughout a high tide cycle for the entire historical period. A complete cycle is required to calculate the maximum tide elevation, applying a best fit curve to the observations. These historical records may not have included the highest water levels measured at a station during an event if a complete high tide cycle was not measured due to station/sensor damage (Appendix 3).
Individual time series graphs are provided for each station (Figures 4 – 74). For comparison and context, the historical recorded maximum water levels are displayed on the graphs, where available. The Highest Astronomical Tide (HAT) datum is also displayed to illustrate the elevation of the highest predicted astronomical tide expected to occur at a specific tide station over the 1983-2001 National Tidal Datum Epoch.
Within data reports that CO-OPS generates for significant tropical cyclones, storms are designated by the most significant classification obtained throughout the storm’s duration. While Sandy was, at times, a tropical storm, a hurricane and a post-tropical cyclone prior to making landfall along the East Coast of the U.S., the storm will be referenced as Hurricane Sandy throughout this report.
NOAA NOS Hurricane Sandy Water Level & Meteorological Data Report 3
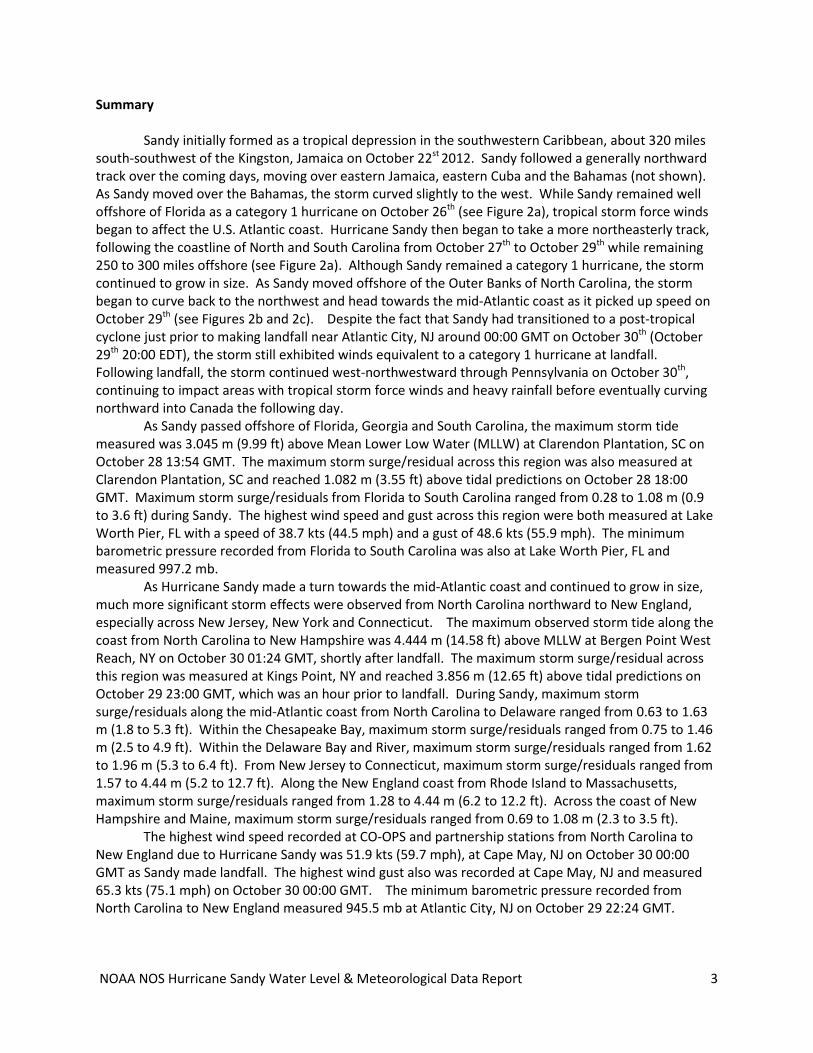
Summary
Sandy initially formed as a tropical depression in the southwestern Caribbean, about 320 miles south-southwest of the Kingston, Jamaica on October 22st 2012. Sandy followed a generally northward track over the coming days, moving over eastern Jamaica, eastern Cuba and the Bahamas (not shown). As Sandy moved over the Bahamas, the storm curved slightly to the west. While Sandy remained well offshore of Florida as a category 1 hurricane on October 26th (see Figure 2a), tropical storm force winds began to affect the U.S. Atlantic coast. Hurricane Sandy then began to take a more northeasterly track, following the coastline of North and South Carolina from October 27th to October 29th while remaining 250 to 300 miles offshore (see Figure 2a). Although Sandy remained a category 1 hurricane, the storm continued to grow in size. As Sandy moved offshore of the Outer Banks of North Carolina, the storm began to curve back to the northwest and head towards the mid-Atlantic coast as it picked up speed on October 29th (see Figures 2b and 2c). Despite the fact that Sandy had transitioned to a post-tropical cyclone just prior to making landfall near Atlantic City, NJ around 00:00 GMT on October 30th (October 29th 20:00 EDT), the storm still exhibited winds equivalent to a category 1 hurricane at landfall. Following landfall, the storm continued west-northwestward through Pennsylvania on October 30th, continuing to impact areas with tropical storm force winds and heavy rainfall before eventually curving northward into Canada the following day.
As Sandy passed offshore of Florida, Georgia and South Carolina, the maximum storm tide measured was 3.045 m (9.99 ft) above Mean Lower Low Water (MLLW) at Clarendon Plantation, SC on October 28 13:54 GMT. The maximum storm surge/residual across this region was also measured at Clarendon Plantation, SC and reached 1.082 m (3.55 ft) above tidal predictions on October 28 18:00 GMT. Maximum storm surge/residuals from Florida to South Carolina ranged from 0.28 to 1.08 m (0.9 to 3.6 ft) during Sandy. The highest wind speed and gust across this region were both measured at Lake Worth Pier, FL with a speed of 38.7 kts (44.5 mph) and a gust of 48.6 kts (55.9 mph). The minimum barometric pressure recorded from Florida to South Carolina was also at Lake Worth Pier, FL and measured 997.2 mb.
As Hurricane Sandy made a turn towards the mid-Atlantic coast and continued to grow in size, much more significant storm effects were observed from North Carolina northward to New England, especially across New Jersey, New York and Connecticut. The maximum observed storm tide along the coast from North Carolina to New Hampshire was 4.444 m (14.58 ft) above MLLW at Bergen Point West Reach, NY on October 30 01:24 GMT, shortly after landfall. The maximum storm surge/residual across this region was measured at Kings Point, NY and reached 3.856 m (12.65 ft) above tidal predictions on October 29 23:00 GMT, which was an hour prior to landfall. During Sandy, maximum storm surge/residuals along the mid-Atlantic coast from North Carolina to Delaware ranged from 0.63 to 1.63 m (1.8 to 5.3 ft). Within the Chesapeake Bay, maximum storm surge/residuals ranged from 0.75 to 1.46 m (2.5 to 4.9 ft). Within the Delaware Bay and River, maximum storm surge/residuals ranged from 1.62 to 1.96 m (5.3 to 6.4 ft). From New Jersey to Connecticut, maximum storm surge/residuals ranged from 1.57 to 4.44 m (5.2 to 12.7 ft). Along the New England coast from Rhode Island to Massachusetts, maximum storm surge/residuals ranged from 1.28 to 4.44 m (6.2 to 12.2 ft). Across the coast of New Hampshire and Maine, maximum storm surge/residuals ranged from 0.69 to 1.08 m (2.3 to 3.5 ft).
The highest wind speed recorded at CO-OPS and partnership stations from North Carolina to New England due to Hurricane Sandy was 51.9 kts (59.7 mph), at Cape May, NJ on October 30 00:00 GMT as Sandy made landfall. The highest wind gust also was recorded at Cape May, NJ and measured 65.3 kts (75.1 mph) on October 30 00:00 GMT. The minimum barometric pressure recorded from North Carolina to New England measured 945.5 mb at Atlantic City, NJ on October 29 22:24 GMT.

NOAA NOS Hurricane Sandy Water Level & Meteorological Data Report 4
More information, data and storm reports can be found at the CO-OPS website, http://tidesandcurrents.noaa.gov. Storm reports are located under the Publications section of the webpage.

NOAA NOS Hurricane Sandy Water Level & Meteorological Data Report 5
Figure 1: NOAA and partnership stations relative to the Hurricane Sandy storm track (track information courtesy of the NOAA National Hurricane Center).

NOAA NOS Hurricane Sandy Water Level & Meteorological Data Report 6
Figures 2a and 2b: NOAA and partnership stations located along the coast of a) Florida to North Carolina and b) South Carolina to New Jersey, relative to the Hurricane Sandy storm track (track information courtesy of the NOAA National Hurricane Center).

NOAA NOS Hurricane Sandy Water Level & Meteorological Data Report 7
Figure 2c: NOAA and partnership stations located along the Atlantic Coast from Maryland to Maine, relative to the Hurricane Sandy storm track (track information courtesy of the NOAA National Hurricane Center).

NOAA NOS Hurricane Sandy Water Level & Meteorological Data Report 8
Table 1a: Maximum recorded water levels in geographic order for Hurricane Sandy, October 2012, referenced to MLLW and NAVD88 (where available). Storm Tide includes both tidal and meteorological forces and storm surge represents the observed water level (storm tide) minus predicted astronomical tide. Stations where the historical maximum water level was exceeded are highlighted in gray.
Storm Tide Predicted Storm Tide Predicted
Key West, FL 8724580 10/30/2012 02:24 0.930 0.675 0.255 0.392 3.05 2.21 0.84 1.29
Vaca Key, FL 8723970 10/30/2012 03:48 0.827 0.357 0.470 0.420 2.71 1.17 1.54 1.38
Virginia Key, FL 8723214 10/28/2012 12:48 1.264 0.826 0.438 0.662 4.15 2.71 1.44 2.173 Lake Worth Pier, FL 8722670 10/28/2012 11:06 1.614 1.060 0.554 0.866 5.30 3.48 1.82 2.84
Trident Pier, FL 8721604 10/28/2012 10:54 2.022 1.338 0.684 1.149 6.63 4.39 2.24 3.77
I-295 Bridge, St Johns River, FL 8720357 10/28/2012 15:24 0.812 0.331 0.481 0.666 2.66 1.09 1.57 2.19
Mayport (Bar Pilots Dock), FL 8720218 10/28/2012 12:42 2.009 1.711 0.298 1.093 6.59 5.61 0.98 3.59
Fernandina Beach, FL 8720030 10/28/2012 13:06 2.456 2.142 0.314 1.291 8.06 7.03 1.03 4.24
Fort Pulaski, GA 8670870 10/28/2012 12:24 2.752 2.368 0.384 1.517 9.03 7.77 1.26 4.98
Clarendon Plantation, SC 8667633 10/28/2012 13:54 3.045 2.547 0.498 n/a 9.99 8.36 1.63 n/a
Charleston, SC 8665530 10/28/2012 12:06 2.238 1.866 0.372 1.281 7.34 6.12 1.22 4.20
Oyster Landing (N. Inlet Estuary), SC 8662245 10/28/2012 12:42 2.021 1.657 0.364 1.196 6.63 5.44 1.19 3.92
Springmaid Pier, SC 8661070 10/28/2012 12:00 2.166 1.717 0.449 1.204 7.11 5.63 1.48 3.95
Wrightsville Beach, NC 8658163 10/28/2012 11:48 1.947 1.394 0.553 1.175 6.39 4.57 1.82 3.85
Wilmington, NC 8658120 10/30/2012 15:00 1.802 1.488 0.314 n/a 5.91 4.88 1.03 n/a
Beaufort, NC 8656483 10/29/2012 12:30 1.633 1.162 0.471 n/a 5.36 3.81 1.55 n/a3 USCG Station Hatteras, NC 8654467 10/29/2012 03:00 1.441 0.222 1.219 n/a 4.73 0.73 4.00 n/a
Oregon Inlet Marina, NC 8652587 10/29/2012 14:42 1.309 0.262 1.047 1.094 4.29 0.86 3.43 3.592 Duck, NC 8651370 10/28/2012 11:24 2.128 1.213 0.915 1.461 6.98 3.98 3.00 4.79
Money Point, VA 8639348 10/29/2012 14:00 2.223 1.035 1.188 n/a 7.29 3.40 3.89 n/a
Chesapeake Bay Bridge Tunnel, VA 8638863 10/29/2012 12:36 2.163 0.978 1.185 n/a 7.10 3.21 3.89 n/a
Sewells Point, VA 8638610 10/29/2012 13:18 2.076 0.919 1.157 1.575 6.81 3.02 3.79 5.17
Yorktown USCG Training Center, VA 8637689 10/29/2012 13:30 1.835 0.876 0.959 n/a 6.02 2.87 3.15 n/a
Windmill Point, VA 8636580 10/29/2012 14:30 1.336 0.494 0.842 n/a 4.38 1.62 2.76 n/a
Lewisetta, VA 8635750 10/28/2012 18:12 1.144 0.476 0.668 0.891 3.75 1.56 2.19 2.92
Kiptopeke, VA 8632200 10/29/2012 12:48 2.080 0.982 1.098 1.500 6.82 3.22 3.60 4.92
Wachapreague, VA 8631044 10/29/2012 12:12 2.558 1.497 1.061 n/a 8.39 4.91 3.48 n/a
Storm Surge/Residual (ft)(m, MLLW) (ft, MLLW)
Station Name Station ID Date & TimeGMT
Storm Surge/Residual (m)
Storm Tide(m, NAVD88)
Storm Tide(ft, NAVD88)
1 Sensor reached physical limit on measurements and did not record a maximum value. 2 Sensor was damaged or destroyed and likely did not record a maximum water level 3 Maximum recorded water level value exceeded historical maximum value.

NOAA NOS Hurricane Sandy Water Level & Meteorological Data Report 9
Table 1b: Maximum recorded water levels in geographic order for Hurricane Sandy, October 2012, referenced to MLLW and NAVD88 (where available). Storm Tide includes both tidal and meteorological forces and storm surge represents the observed water level (storm tide) minus predicted astronomical tide. Stations where the historical maximum water level was exceeded are highlighted in gray.
Storm Tide Predicted Storm Tide Predicted
Washington, DC 8594900 10/31/2012 00:06 1.863 0.887 0.976 1.438 6.11 2.91 3.20 4.721 Solomons Island, MD 8577330 10/30/2012 22:48 0.894 0.267 0.627 0.635 2.93 0.88 2.05 2.08
Annapolis, MD 8575512 10/30/2012 13:00 1.183 0.192 0.991 0.948 3.88 0.63 3.25 3.11
Baltimore, MD 8574680 10/30/2012 10:36 1.420 0.351 1.069 1.166 4.66 1.15 3.51 3.83
Chesapeake City, MD 8573927 10/30/2012 13:54 1.808 0.787 1.021 n/a 5.93 2.58 3.35 n/a
Tolchester Beach, MD 8573364 10/30/2012 11:24 1.460 0.410 1.050 n/a 4.79 1.35 3.44 n/a
Cambridge, MD 8571892 10/29/2012 21:30 1.386 0.633 0.753 1.049 4.55 2.08 2.47 3.443 Bishops Head, MD 8571421 10/30/2012 18:36 1.310 0.661 0.649 0.930 4.30 2.17 2.13 3.05
Ocean City Inlet, MD 8570283 10/29/2012 13:42 1.847 0.707 1.140 1.348 6.06 2.32 3.74 4.42
Lewes, DE 8557380 10/29/2012 13:00 2.654 1.478 1.176 1.853 8.71 4.85 3.86 6.082 Brandywine Shoal Light, DE 8555889 10/29/2012 12:00 2.470 1.682 0.788 n/a 8.10 5.52 2.58 n/a
Reedy Point, DE 8551910 10/30/2012 05:42 2.774 1.306 1.468 1.869 9.10 4.28 4.82 6.133 Delaware City, DE 8551762 10/30/2012 05:54 2.968 1.332 1.636 n/a 9.74 4.37 5.37 n/a
Newbold, PA 8548989 10/30/2012 09:18 3.731 2.117 1.614 n/a 12.25 6.95 5.30 n/a3 Philadelphia, PA 8545240 10/30/2012 08:06 3.237 1.602 1.635 2.292 10.62 5.26 5.36 7.523 Marcus Hook, PA 8540433 10/30/2012 06:48 3.100 1.450 1.650 n/a 10.17 4.76 5.41 n/a
Burlington, Delaware River, NJ 8539094 10/30/2012 09:12 3.563 1.882 1.681 n/a 11.69 6.17 5.52 n/a
Tacony-Palmyra Bridge, NJ 8538886 10/30/2012 08:36 3.324 1.707 1.617 n/a 10.91 5.60 5.31 n/a3 Ship John Shoal, NJ 8537121 10/30/2012 04:12 2.872 1.531 1.341 n/a 9.42 5.02 4.40 n/a3 Cape May, NJ 8536110 10/29/2012 13:42 2.717 1.645 1.072 1.797 8.91 5.40 3.51 5.89
Atlantic City, NJ 8534720 10/30/2012 00:24 2.712 1.242 1.470 1.915 8.90 4.07 4.83 6.282,3 Sandy Hook, NJ 8531680 10/29/2012 23:36 4.033 1.422 2.611 3.175 13.23 4.67 8.56 10.423 Bergen Point West Reach, NY 8519483 10/30/2012 01:24 4.443 1.571 2.872 n/a 14.58 5.15 9.43 n/a3 The Battery, NY 8518750 10/30/2012 01:24 4.284 1.418 2.866 3.438 14.06 4.65 9.41 11.283 Kings Point, NY 8516945 10/30/2012 02:06 4.361 1.758 2.603 n/a 14.31 5.77 8.54 n/a
Montauk, NY 8510560 10/30/2012 00:12 2.169 0.574 1.595 1.691 7.12 1.88 5.24 5.553 Bridgeport, CT 8467150 10/30/2012 02:06 4.007 1.617 2.390 2.836 13.15 5.31 7.84 9.30
Storm Surge/Residual (ft)
Storm Tide(ft, NAVD88)(m, MLLW) (ft, MLLW)
Station Name Station ID Date & TimeGMT
Storm Surge/Residual (m)
Storm Tide(m, NAVD88)
1 Sensor reached physical limit on measurements and did not record a maximum value. 2 Sensor was damaged or destroyed and likely did not record a maximum water level 3 Maximum recorded water level value exceeded historical maximum value.

NOAA NOS Hurricane Sandy Water Level & Meteorological Data Report 10
Table 1c: Maximum recorded water levels in geographic order for Hurricane Sandy, October 2012, referenced to MLLW and NAVD88 (where available). Storm Tide includes both tidal and meteorological forces and storm surge represents the observed water level (storm tide) minus predicted astronomical tide. Stations where the historical maximum water level was exceeded are highlighted in gray.
Storm Tide Predicted Storm Tide Predicted
3 New Haven, CT 8465705 10/30/2012 01:36 3.733 1.253 2.480 n/a 12.25 4.11 8.14 n/a
New London, CT 8461490 10/30/2012 00:12 2.436 0.634 1.802 1.876 7.99 2.08 5.91 6.161 Quonset Point, RI 8454049 10/30/2012 01:12 2.045 1.098 0.947 n/a 6.71 3.60 3.11 n/a
Providence, RI 8454000 10/29/2012 23:30 2.854 1.215 1.639 2.100 9.37 3.99 5.38 6.893 Conimicut Light, RI 8452944 10/29/2012 23:12 2.760 1.084 1.676 n/a 9.06 3.56 5.50 n/a
Newport, RI 8452660 10/29/2012 23:00 2.491 0.930 1.561 1.869 8.17 3.05 5.12 6.13
Nantucket Island, MA 8449130 10/29/2012 16:06 1.821 1.069 0.752 n/a 5.97 3.51 2.46 n/a
Woods Hole, MA 8447930 10/29/2012 22:18 1.769 0.243 1.526 1.354 5.81 0.80 5.01 4.44
Chatham, MA 8447435 10/29/2012 16:00 2.821 1.896 0.925 1.790 9.26 6.22 3.04 5.873 Fall River, MA 8447386 10/29/2012 23:42 2.730 1.247 1.483 n/a 8.96 4.09 4.87 n/a
Boston, MA 8443970 10/29/2012 15:48 3.939 3.147 0.792 2.261 12.92 10.32 2.60 7.42
Fort Point, NH 8423898 10/29/2012 15:36 3.474 2.908 0.566 1.953 11.40 9.54 1.86 6.41
Wells, ME 8419317 10/29/2012 15:42 3.487 2.960 0.527 n/a 11.44 9.71 1.73 n/a
Portland, ME 8418150 10/29/2012 15:18 3.627 3.043 0.584 2.026 11.90 9.98 1.92 6.65
Bar Harbor, ME 8413320 10/29/2012 15:06 3.883 3.522 0.361 n/a 12.74 11.56 1.18 n/a
Cutler Farris Wharf, ME 8411060 10/31/2012 16:24 4.953 4.497 0.456 n/a 16.25 14.75 1.50 n/a
Eastport, ME 8410140 10/31/2012 16:18 6.293 5.925 0.368 3.264 20.65 19.44 1.21 10.71
Storm Tide(ft, NAVD88)(m, MLLW) (ft, MLLW)
Station Name Station ID Date & TimeGMT
Storm Surge/Residual (m)
Storm Tide(m, NAVD88)
Storm Surge/Residual (ft)
1 Sensor reached physical limit on measurements and did not record a maximum value. 2 Sensor was damaged or destroyed and likely did not record a maximum water level 3 Maximum recorded water level value exceeded historical maximum value.

NOAA NOS Hurricane Sandy Water Level & Meteorological Data Report 11
Table 2a: Maximum recorded wind speed, wind gusts and minimum barometric pressure in geographic order for Hurricane Sandy, October 2012.
Date & TimeGMT m/sec knots Date & Time
GMT m/sec knots Date & TimeGMT mbar
Key West, FL 8724580 n/a n/a n/a n/a n/a n/a 10/26/2012 09:54 1002.6Vaca Key, FL 8723970 10/25/2012 18:42 16.9 32.9 10/25/2012 18:42 21.0 40.8 10/26/2012 19:54 1002.0Virginia Key, FL 8723214 10/25/2012 17:06 14.1 27.4 10/25/2012 19:12 21.9 42.6 10/26/2012 19:30 997.4Lake Worth Pier, FL 8722670 10/26/2012 14:00 19.9 38.7 10/26/2012 09:30 25.0 48.6 10/27/2012 08:00 997.2Trident Pier, FL 8721604 10/26/2012 14:24 12.8 24.9 10/26/2012 14:24 18.1 35.2 10/27/2012 19:48 1000.2I-295 Bridge, St Johns River, FL 8720357 n/a n/a n/a n/a n/a n/a n/a n/aMayport (Bar Pilots Dock), FL 8720218 10/26/2012 16:24 13.7 26.6 10/26/2012 19:12 17.4 33.8 10/27/2012 10:00 1003.2Fernandina Beach, FL 8720030 10/27/2012 11:48 11.8 22.9 10/30/2012 18:24 15.0 29.2 10/27/2012 09:54 1001.0Fort Pulaski, GA 8670870 10/30/2012 02:06 14.7 28.6 10/29/2012 18:48 18.0 35.0 10/27/2012 19:24 1000.8Clarendon Plantation, SC 8667633 n/a n/a n/a n/a n/a n/a n/a n/aCharleston, SC 8665530 10/25/2012 19:06 11.2 21.8 10/28/2012 03:12 13.9 27.0 10/27/2012 19:54 999.2Oyster Landing (N. Inlet Estuary), SC 8662245 n/a n/a n/a n/a n/a n/a n/a n/aSpringmaid Pier, SC 8661070 10/27/2012 17:30 10.9 21.2 10/27/2012 09:00 17.1 33.2 10/29/2012 20:24 997.9Wrightsville Beach, NC 8658163 10/27/2012 22:54 16.3 31.7 10/27/2012 21:24 21.9 42.6 10/29/2012 21:00 994.6Wilmington, NC 8658120 n/a n/a n/a n/a n/a n/a 10/29/2012 20:48 995.6Beaufort, NC 8656483 10/28/2012 10:48 17.2 33.4 10/28/2012 12:54 23.6 45.8 10/28/2012 19:12 991.4USCG Station Hatteras, NC 8654467 10/29/2012 02:24 23.3 45.3 10/29/2012 02:12 28.9 56.2 10/29/2012 02:30 987.7Oregon Inlet Marina, NC 8652587 10/28/2012 13:24 18.8 36.5 10/29/2012 04:36 26.2 50.9 10/29/2012 18:30 986.6Duck, NC 8651370 10/28/2012 21:48 22.5 43.7 10/28/2012 21:24 27.0 52.5 10/29/2012 18:42 985.1Money Point, VA 8639348 10/29/2012 21:54 10.5 20.4 10/29/2012 21:54 20.5 39.8 10/29/2012 21:54 983.4Chesapeake Bay Bridge Tunnel, VA 8638863 10/29/2012 01:00 22.3 43.3 10/29/2012 01:00 26.8 52.1 10/29/2012 21:36 980.7Sewells Point, VA 8638610 n/a n/a n/a n/a n/a n/a 10/29/2012 21:54 982.3Yorktown USCG Training Center, VA 8637689 10/29/2012 01:00 18.2 35.4 10/29/2012 15:48 21.8 42.4 10/29/2012 22:30 980.0Windmill Point, VA 8636580 n/a n/a n/a n/a n/a n/a n/a n/aLewisetta, VA 8635750 10/29/2012 20:00 18.2 35.4 10/29/2012 21:24 23.5 45.7 10/30/2012 00:12 974.4Kiptopeke, VA 8632200 10/30/2012 01:30 21.7 42.2 10/29/2012 21:54 26.8 52.1 n/a n/aWachapreague, VA 8631044 10/27/2012 23:48 14.0 27.2 10/29/2012 21:30 19.6 38.1 10/29/2012 22:00 974.9Washington, DC 8594900 10/30/2012 01:18 16.5 32.1 10/30/2012 01:36 27.0 52.5 10/30/2012 02:30 968.8
Station Name Station IDMinimum Atmospheric PressureMaximum Wind Speed Maximum Wind Gusts

NOAA NOS Hurricane Sandy Water Level & Meteorological Data Report 12
Table 2b: Maximum recorded wind speed, wind gusts and minimum barometric pressure in geographic order for Hurricane Sandy, October 2012.
Date & TimeGMT m/sec knots Date & Time
GMT m/sec knots Date & TimeGMT mbar
Solomons Island, MD 8577330 n/a n/a n/a n/a n/a n/a n/a n/aAnnapolis, MD 8575512 n/a n/a n/a n/a n/a n/a 10/30/2012 01:24 964.4Baltimore, MD 8574680 10/29/2012 16:54 13.0 25.3 10/29/2012 21:12 24.0 46.7 10/30/2012 03:00 962.8Chesapeake City, MD 8573927 10/29/2012 21:48 13.6 26.4 10/29/2012 22:36 21.3 41.4 10/30/2012 02:00 956.3Tolchester Beach, MD 8573364 10/29/2012 23:24 21.1 41.0 10/29/2012 23:30 26.6 51.7 10/30/2012 02:18 960.9Cambridge, MD 8571892 10/29/2012 18:18 17.0 33.0 10/29/2012 21:18 24.9 48.4 10/30/2012 01:06 967.6Bishops Head, MD 8571421 10/29/2012 23:18 24.7 48.0 10/29/2012 20:24 30.2 58.7 10/30/2012 00:06 970.8Ocean City Inlet, MD 8570283 10/30/2012 03:00 18.8 36.5 10/29/2012 18:06 26.1 50.7 10/29/2012 21:06 962.7Lewes, DE 8557380 10/29/2012 21:12 23.6 45.9 10/29/2012 23:12 29.6 57.5 10/29/2012 22:06 959.0Brandywine Shoal Light, DE 8555889 10/29/2012 10:12 22.7 44.1 10/29/2012 11:54 27.9 54.2 10/29/2012 12:00 988.5Reedy Point, DE 8551910 n/a n/a n/a n/a n/a n/a 10/30/2012 01:30 954.5Delaware City, DE 8551762 10/29/2012 20:24 16.0 31.1 10/29/2012 21:00 22.9 44.5 10/30/2012 01:30 954.2Newbold, PA 8548989 10/30/2012 02:30 17.6 34.2 10/30/2012 02:30 26.4 51.3 10/30/2012 00:18 955.3Philadelphia, PA 8545240 n/a n/a n/a n/a n/a n/a 10/30/2012 01:24 952.0Marcus Hook, PA 8540433 n/a n/a n/a n/a n/a n/a 10/30/2012 01:48 951.9Burlington, Delaware River, NJ 8539094 10/30/2012 01:12 18.4 35.8 10/30/2012 01:12 25.7 50.0 10/30/2012 00:30 953.7Tacony-Palmyra Bridge, NJ 8538886 n/a n/a n/a n/a n/a n/a 10/30/2012 00:42 952.7Ship John Shoal, NJ 8537121 10/30/2012 04:18 26.2 50.9 10/30/2012 04:00 29.6 57.5 10/29/2012 23:30 953.0Cape May, NJ 8536110 10/30/2012 00:00 26.7 51.9 10/30/2012 00:00 33.6 65.3 10/29/2012 22:18 953.8Atlantic City, NJ 8534720 n/a n/a n/a n/a n/a n/a 10/29/2012 22:24 945.5Sandy Hook, NJ 8531680 10/29/2012 22:18 20.0 38.9 10/29/2012 22:42 30.8 59.9 10/29/2012 22:12 961.0Bergen Point West Reach, NY 8519483 10/29/2012 19:06 16.3 31.7 10/30/2012 00:36 24.5 47.6 10/29/2012 21:54 963.8The Battery, NY 8518750 n/a n/a n/a n/a n/a n/a 10/29/2012 21:42 964.1Kings Point, NY 8516945 10/29/2012 21:06 12.8 24.9 10/29/2012 17:42 21.3 41.4 10/29/2012 22:00 965.7Montauk, NY 8510560 n/a n/a n/a n/a n/a n/a 10/29/2012 20:00 974.4Bridgeport, CT 8467150 10/29/2012 21:06 18.9 36.7 10/29/2012 21:06 26.8 52.1 10/29/2012 20:54 972.5New Haven, CT 8465705 10/29/2012 21:36 15.3 29.7 10/29/2012 21:48 26.2 50.9 10/29/2012 20:36 973.9New London, CT 8461490 10/29/2012 20:42 16.8 32.7 10/29/2012 20:54 24.8 48.2 10/29/2012 20:12 976.9
Station Name Station IDMinimum Atmospheric PressureMaximum Wind Speed Maximum Wind Gusts

NOAA NOS Hurricane Sandy Water Level & Meteorological Data Report 13
Table 2c: Maximum recorded wind speed, wind gusts and minimum barometric pressure in geographic order for Hurricane Sandy, October 2012.
Date & TimeGMT m/sec knots Date & Time
GMT m/sec knots Date & TimeGMT mbar
Quonset Point, RI 8454049 10/29/2012 20:48 22.1 43.0 10/29/2012 20:12 28.3 55.0 10/29/2012 20:06 981.8Providence, RI 8454000 10/29/2012 20:30 17.7 34.4 10/29/2012 22:30 23.9 46.5 10/29/2012 20:12 983.1Conimicut Light, RI 8452944 10/29/2012 20:42 23.8 46.3 10/29/2012 19:24 31.6 61.4 10/29/2012 20:12 982.0Newport, RI 8452660 n/a n/a n/a n/a n/a n/a 10/29/2012 20:18 981.6Nantucket Island, MA 8449130 10/29/2012 19:36 20.5 39.8 10/29/2012 18:54 26.6 51.7 10/29/2012 19:06 984.0Woods Hole, MA 8447930 n/a n/a n/a n/a n/a n/a 10/29/2012 19:54 984.0Chatham, MA 8447435 n/a n/a n/a n/a n/a n/a Fall River, MA 8447386 n/a n/a n/a n/a n/a n/a 10/29/2012 19:48 983.6Boston, MA 8443970 n/a n/a n/a n/a n/a n/a 10/30/2012 00:42 989.5Fort Point, NH 8423898 n/a n/a n/a n/a n/a n/a Wells, ME 8419317 10/29/2012 21:30 17.5 34.0 10/29/2012 20:30 24.1 46.8 10/30/2012 02:24 994.0Portland, ME 8418150 n/a n/a n/a n/a n/a n/a 10/30/2012 03:06 997.7Bar Harbor, ME 8413320 10/30/2012 07:18 19.4 37.7 10/30/2012 06:30 24.7 48.0 10/31/2012 20:36 999.7Cutler Farris Wharf, ME 8411060 10/29/2012 19:36 8.5 16.5 10/29/2012 18:42 14.8 28.8 10/31/2012 21:30 1000.1Eastport, ME 8410140 10/29/2012 20:30 15.0 29.2 10/29/2012 23:12 20.0 38.9 10/31/2012 22:30 1000.0
Station Name Station IDMinimum Atmospheric PressureMaximum Wind Speed Maximum Wind Gusts

NOAA NOS Hurricane Sandy Water Level & Meteorological Data Report 13
Table 3a: Maximum recorded storm surge/residual levels ranked by amplitude for Hurricane Sandy, October 2012. Storm Surge/Residual represents the observed water level (storm tide) minus predicted astronomical tide levels.
in Meters in Feet3 Kings Point, NY 8516945 10/29/2012 23:00 3.855 12.653 Bridgeport, CT 8467150 10/30/2012 00:18 2.997 9.833 Bergen Point West Reach, NY 8519483 10/30/2012 01:48 2.913 9.563 The Battery, NY 8518750 10/30/2012 01:24 2.866 9.403 New Haven, CT 8465705 10/30/2012 00:06 2.786 9.142,3 Sandy Hook, NJ 8531680 10/29/2012 23:36 2.611 8.57New London, CT 8461490 10/29/2012 22:54 1.982 6.50Newbold, PA 8548989 10/30/2012 10:42 1.956 6.42Burlington, Delaware River, NJ 8539094 10/30/2012 10:24 1.917 6.293 Marcus Hook, PA 8540433 10/30/2012 08:00 1.907 6.26Providence, RI 8454000 10/29/2012 22:12 1.888 6.20Tacony-Palmyra Bridge, NJ 8538886 10/30/2012 09:48 1.861 6.113 Delaware City, DE 8551762 10/30/2012 06:54 1.826 5.993 Conimicut Light, RI 8452944 10/29/2012 22:12 1.795 5.89Montauk, NY 8510560 10/29/2012 22:12 1.794 5.893 Philadelphia, PA 8545240 10/30/2012 09:18 1.777 5.83Atlantic City, NJ 8534720 10/29/2012 20:42 1.773 5.82Reedy Point, DE 8551910 10/30/2012 07:06 1.769 5.803 Fall River, MA 8447386 10/29/2012 22:30 1.677 5.50Lewes, DE 8557380 10/29/2012 17:30 1.627 5.34Newport, RI 8452660 10/29/2012 22:18 1.627 5.343 Ship John Shoal, NJ 8537121 10/30/2012 05:42 1.615 5.303 Cape May, NJ 8536110 10/29/2012 18:00 1.574 5.161 Quonset Point, RI 8454049 10/29/2012 20:48 1.572 5.16Woods Hole, MA 8447930 10/29/2012 22:06 1.545 5.07Wachapreague, VA 8631044 10/29/2012 05:54 1.508 4.95Chesapeake City, MD 8573927 10/30/2012 10:18 1.486 4.88Money Point, VA 8639348 10/29/2012 07:54 1.460 4.79Sewells Point, VA 8638610 10/29/2012 07:24 1.394 4.57Boston, MA 8443970 10/29/2012 21:00 1.394 4.57Chesapeake Bay Bridge Tunnel, VA 8638863 10/29/2012 06:54 1.330 4.36Ocean City Inlet, MD 8570283 10/29/2012 16:48 1.321 4.33
Station NameStation Name Station IDDate & Time
GMT
Residual
1 Sensor reached physical limit on measurements and did not record a maximum value. 2 Sensor was damaged or destroyed and likely did not record a maximum water level. 3 Maximum recorded water level value exceeded historical maximum value.

NOAA NOS Hurricane Sandy Water Level & Meteorological Data Report 14
Table 3b: Maximum recorded storm surge/residual levels ranked by amplitude for Hurricane Sandy, October 2012. Storm Surge/Residual represents the observed water level (storm tide) minus predicted astronomical tide levels.
in Meters in Feet2 Brandywine Shoal Light, DE 8555889 10/29/2012 05:54 1.285 4.22Chatham, MA 8447435 10/29/2012 22:42 1.280 4.202 Duck, NC 8651370 10/29/2012 06:24 1.269 4.16Washington, DC 8594900 10/30/2012 21:42 1.228 4.033 USCG Station Hatteras, NC 8654467 10/29/2012 03:00 1.219 4.00Nantucket Island, MA 8449130 10/29/2012 22:42 1.188 3.90Yorktown USCG Training Center, VA 8637689 10/29/2012 07:54 1.176 3.86Kiptopeke, VA 8632200 10/29/2012 07:42 1.146 3.76Baltimore, MD 8574680 10/30/2012 14:18 1.124 3.69Oregon Inlet Marina, NC 8652587 10/29/2012 20:30 1.103 3.62Clarendon Plantation, SC 8667633 10/28/2012 18:00 1.083 3.55Tolchester Beach, MD 8573364 10/30/2012 09:48 1.078 3.54Wells, ME 8419317 10/29/2012 21:24 1.076 3.53Annapolis, MD 8575512 10/30/2012 14:18 1.021 3.35Fort Point, NH 8423898 10/29/2012 21:42 1.013 3.32Portland, ME 8418150 10/29/2012 22:06 0.996 3.27Cambridge, MD 8571892 10/30/2012 15:54 0.987 3.243 Bishops Head, MD 8571421 10/30/2012 01:54 0.944 3.10Fernandina Beach, FL 8720030 10/27/2012 16:18 0.900 2.95Oyster Landing (N. Inlet Estuary), SC 8662245 10/28/2012 04:48 0.887 2.91Fort Pulaski, GA 8670870 10/28/2012 03:42 0.882 2.89Windmill Point, VA 8636580 10/29/2012 14:00 0.844 2.771 Solomons Island, MD 8577330 10/30/2012 13:48 0.784 2.57Mayport (Bar Pilots Dock), FL 8720218 10/28/2012 04:12 0.772 2.53Cutler Farris Wharf, ME 8411060 10/29/2012 22:42 0.761 2.50Trident Pier, FL 8721604 10/28/2012 07:12 0.760 2.49Lewisetta, VA 8635750 10/29/2012 10:54 0.751 2.46Charleston, SC 8665530 10/28/2012 03:48 0.729 2.393 Lake Worth Pier, FL 8722670 10/28/2012 06:36 0.697 2.29Bar Harbor, ME 8413320 10/29/2012 22:36 0.688 2.26Wrightsville Beach, NC 8658163 10/28/2012 02:36 0.687 2.25Eastport, ME 8410140 10/30/2012 00:00 0.673 2.21
Station Name Station IDDate & Time
GMT
Residual
1 Sensor reached physical limit on measurements and did not record a maximum value. 2 Sensor was damaged or destroyed and likely did not record a maximum water level. 3 Maximum recorded water level value exceeded historical maximum value.

NOAA NOS Hurricane Sandy Water Level & Meteorological Data Report 15
Table 3c: Maximum recorded storm surge/residual levels ranked by amplitude for Hurricane Sandy, October 2012. Storm Surge/Residual represents the observed water level (storm tide) minus predicted astronomical tide levels.
in Meters in Feet
Springmaid Pier, SC 8661070 10/28/2012 02:54 0.616 2.02Beaufort, NC 8656483 10/29/2012 17:48 0.580 1.90I-295 Bridge, St Johns River, FL 8720357 10/28/2012 05:48 0.568 1.86Wilmington, NC 8658120 10/30/2012 10:42 0.561 1.84Vaca Key, FL 8723970 10/26/2012 13:36 0.518 1.70Virginia Key, FL 8723214 10/29/2012 22:18 0.491 1.61Key West, FL 8724580 10/30/2012 08:00 0.283 0.93
Station NameStation Name Station IDDate & Time
GMT
Residual
1 Sensor reached physical limit on measurements and did not record a maximum value. 2 Sensor was damaged or destroyed and likely did not record a maximum water level. 3 Maximum recorded water level value exceeded historical maximum value.

NOAA NOS Hurricane Sandy Water Level & Meteorological Data Report 17
Figure 3: Stations that exceeded historical recorded maximum water levels during Hurricane Sandy. The station at Sandy Hook, NJ was destroyed before recording a maximum water level, therefore the maximum water level of record will remain unchanged. While the station at USCG Station Hatteras, NC recorded a higher water level during Hurricane Irene in 2011 than during Sandy, the historical maximum water level was not superseded following Irene because the station did not record a full tide.

NOAA NOS Hurricane Sandy Water Level & Meteorological Data Report 18
Figure 4: Water levels above Mean Lower Low Water (MLLW) at Key West, FL. Lines denoting Highest Astronomical Tide (HAT) and Historical Maximum Water Level are displayed. Sandy made final landfall near Atlantic City, NJ on 10/30/2012 00:00 GMT as a Category 1 hurricane.
Figure 5: Water levels above Mean Lower Low Water (MLLW) at Vaca Key, FL. Lines denoting Highest Astronomical Tide (HAT) and Historical Maximum Water Level are displayed. Sandy made final landfall near Atlantic City, NJ on 10/30/2012 00:00 GMT as a Category 1 hurricane.

NOAA NOS Hurricane Sandy Water Level & Meteorological Data Report 19
Figure 6: Water levels above Mean Lower Low Water (MLLW) at Virginia Key, FL. Lines denoting Highest Astronomical Tide (HAT) and Historical Maximum Water Level are displayed. Sandy made final landfall near Atlantic City, NJ on 10/30/2012 00:00 GMT as a Category 1 hurricane.
Figure 7: Water levels above Mean Lower Low Water (MLLW) at Lake Worth Pier, FL. Lines denoting Highest Astronomical Tide (HAT) and Historical Maximum Water Level are displayed. Maximum recorded water level value exceeded the historical maximum value. Sandy made final landfall near Atlantic City, NJ on 10/30/2012 00:00 GMT as a Category 1 hurricane.

NOAA NOS Hurricane Sandy Water Level & Meteorological Data Report 20
Figure 8: Water levels above Mean Lower Low Water (MLLW) at Trident Pier, FL. Lines denoting Highest Astronomical Tide (HAT) and Historical Maximum Water Level are displayed. Sandy made final landfall near Atlantic City, NJ on 10/30/2012 00:00 GMT as a Category 1 hurricane.
Figure 9: Water levels above Mean Lower Low Water (MLLW) at I-295 Bridge, St. Johns River, FL. Lines denoting Highest Astronomical Tide (HAT) and Historical Maximum Water Level are displayed. Sandy made final landfall near Atlantic City, NJ on 10/30/2012 00:00 GMT as a Category 1 hurricane.

NOAA NOS Hurricane Sandy Water Level & Meteorological Data Report 21
Figure 10: Water levels above Mean Lower Low Water (MLLW) at Mayport (Bar Pilots Dock), FL. Lines denoting Highest Astronomical Tide (HAT) and Historical Maximum Water Level are displayed. Sandy made final landfall near Atlantic City, NJ on 10/30/2012 00:00 GMT as a Category 1 hurricane.
Figure 11: Water levels above Mean Lower Low Water (MLLW) at Fernandina Beach, FL. Lines denoting Highest Astronomical Tide (HAT) and Historical Maximum Water Level are displayed. Sandy made final landfall near Atlantic City, NJ on 10/30/2012 00:00 GMT as a Category 1 hurricane.

NOAA NOS Hurricane Sandy Water Level & Meteorological Data Report 22
Figure 12: Water levels above Mean Lower Low Water (MLLW) at Fort Pulaski, GA. Lines denoting Highest Astronomical Tide (HAT) and Historical Maximum Water Level are displayed. Sandy made final landfall near Atlantic City, NJ on 10/30/2012 00:00 GMT as a Category 1 hurricane.
Figure 13: Water levels above Mean Lower Low Water (MLLW) at Clarendon Plantation, SC. Lines denoting Highest Astronomical Tide (HAT) and Historical Maximum Water Level are displayed. Sandy made final landfall near Atlantic City, NJ on 10/30/2012 00:00 GMT as a Category 1 hurricane.

NOAA NOS Hurricane Sandy Water Level & Meteorological Data Report 23
Figure 14: Water levels above Mean Lower Low Water (MLLW) at Charleston, SC. Lines denoting Highest Astronomical Tide (HAT) and Historical Maximum Water Level are displayed. Sandy made final landfall near Atlantic City, NJ on 10/30/2012 00:00 GMT as a Category 1 hurricane.
Figure 15: Water levels above Mean Lower Low Water (MLLW) at Oyster Landing (N. Inlet Estuary), SC. Lines denoting Highest Astronomical Tide (HAT) and Historical Maximum Water Level are displayed. Sandy made final landfall near Atlantic City, NJ on 10/30/2012 00:00 GMT as a Category 1 hurricane.

NOAA NOS Hurricane Sandy Water Level & Meteorological Data Report 24
Figure 16: Water levels above Mean Lower Low Water (MLLW) at Springmaid Pier, SC. Lines denoting Highest Astronomical Tide (HAT) and Historical Maximum Water Level are displayed. Sandy made final landfall near Atlantic City, NJ on 10/30/2012 00:00 GMT as a Category 1 hurricane.
Figure 17: Water levels above Mean Lower Low Water (MLLW) at Wrightsville Beach, NC. Lines denoting Highest Astronomical Tide (HAT) and Historical Maximum Water Level are displayed. Sandy made final landfall near Atlantic City, NJ on 10/30/2012 00:00 GMT as a Category 1 hurricane.

NOAA NOS Hurricane Sandy Water Level & Meteorological Data Report 25
Figure 18: Water levels above Mean Lower Low Water (MLLW) at Wilmington, NC. Lines denoting Highest Astronomical Tide (HAT) and Historical Maximum Water Level are displayed. Sandy made final landfall near Atlantic City, NJ on 10/30/2012 00:00 GMT as a Category 1 hurricane.
Figure 19: Water levels above Mean Lower Low Water (MLLW) at Beaufort, NC. Lines denoting Highest Astronomical Tide (HAT) and Historical Maximum Water Level are displayed. Sandy made final landfall near Atlantic City, NJ on 10/30/2012 00:00 GMT as a Category 1 hurricane.
NOAA NOS Hurricane Sandy Water Level & Meteorological Data Report 26
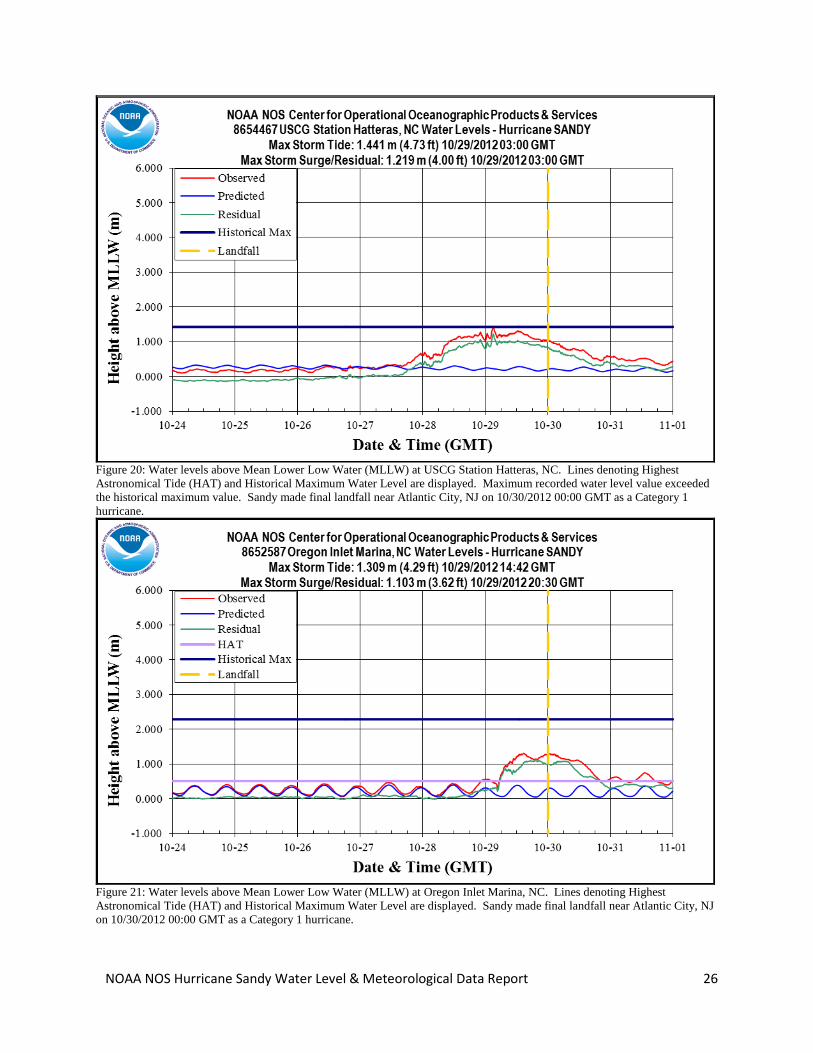
Figure 20: Water levels above Mean Lower Low Water (MLLW) at USCG Station Hatteras, NC. Lines denoting Highest Astronomical Tide (HAT) and Historical Maximum Water Level are displayed. Maximum recorded water level value exceeded the historical maximum value. Sandy made final landfall near Atlantic City, NJ on 10/30/2012 00:00 GMT as a Category 1 hurricane.
Figure 21: Water levels above Mean Lower Low Water (MLLW) at Oregon Inlet Marina, NC. Lines denoting Highest Astronomical Tide (HAT) and Historical Maximum Water Level are displayed. Sandy made final landfall near Atlantic City, NJ on 10/30/2012 00:00 GMT as a Category 1 hurricane.

NOAA NOS Hurricane Sandy Water Level & Meteorological Data Report 27
Figure 22: Water levels above Mean Lower Low Water (MLLW) at Duck, NC. Lines denoting Highest Astronomical Tide (HAT) and Historical Maximum Water Level are displayed. Sandy made final landfall near Atlantic City, NJ on 10/30/2012 00:00 GMT as a Category 1 hurricane. The sensor was damaged by the storm and likely did not record the maximum water level.
Figure 23: Water levels above Mean Lower Low Water (MLLW) at Money Point, VA. Lines denoting Highest Astronomical Tide (HAT) and Historical Maximum Water Level are displayed. Sandy made final landfall near Atlantic City, NJ on 10/30/2012 00:00 GMT as a Category 1 hurricane.

NOAA NOS Hurricane Sandy Water Level & Meteorological Data Report 28
Figure 24: Water levels above Mean Lower Low Water (MLLW) at Chesapeake Bay Bridge Tunnel, VA. Lines denoting Highest Astronomical Tide (HAT) and Historical Maximum Water Level are displayed. Sandy made final landfall near Atlantic City, NJ on 10/30/2012 00:00 GMT as a Category 1 hurricane.
Figure 25: Water levels above Mean Lower Low Water (MLLW) at Sewells Point, VA. Lines denoting Highest Astronomical Tide (HAT) and Historical Maximum Water Level are displayed. Sandy made final landfall near Atlantic City, NJ on 10/30/2012 00:00 GMT as a Category 1 hurricane.

NOAA NOS Hurricane Sandy Water Level & Meteorological Data Report 29
Figure 26: Water levels above Mean Lower Low Water (MLLW) at Yorktown USCG Training Center, VA. Lines denoting Highest Astronomical Tide (HAT) and Historical Maximum Water Level are displayed. Sandy made final landfall near Atlantic City, NJ on 10/30/2012 00:00 GMT as a Category 1 hurricane.
Figure 27: Water levels above Mean Lower Low Water (MLLW) at Windmill Point, VA. Lines denoting Highest Astronomical Tide (HAT) and Historical Maximum Water Level are displayed. Sandy made final landfall near Atlantic City, NJ on 10/30/2012 00:00 GMT as a Category 1 hurricane.

NOAA NOS Hurricane Sandy Water Level & Meteorological Data Report 30
Figure 28: Water levels above Mean Lower Low Water (MLLW) at Lewisetta, VA. Lines denoting Highest Astronomical Tide (HAT) and Historical Maximum Water Level are displayed. Sandy made final landfall near Atlantic City, NJ on 10/30/2012 00:00 GMT as a Category 1 hurricane.
Figure 29: Water levels above Mean Lower Low Water (MLLW) at Kiptopeke, VA. Lines denoting Highest Astronomical Tide (HAT) and Historical Maximum Water Level are displayed. Sandy made final landfall near Atlantic City, NJ on 10/30/2012 00:00 GMT as a Category 1 hurricane.

NOAA NOS Hurricane Sandy Water Level & Meteorological Data Report 31
Figure 30: Water levels above Mean Lower Low Water (MLLW) at Wachapreague, VA. Lines denoting Highest Astronomical Tide (HAT) and Historical Maximum Water Level are displayed. Sandy made final landfall near Atlantic City, NJ on 10/30/2012 00:00 GMT as a Category 1 hurricane.
Figure 31: Water levels above Mean Lower Low Water (MLLW) at Washington, DC. Lines denoting Highest Astronomical Tide (HAT) and Historical Maximum Water Level are displayed. Sandy made final landfall near Atlantic City, NJ on 10/30/2012 00:00 GMT as a Category 1 hurricane.

NOAA NOS Hurricane Sandy Water Level & Meteorological Data Report 32
Figure 32: Water levels above Mean Lower Low Water (MLLW) at Solomons Island, MD. Lines denoting Highest Astronomical Tide (HAT) and Historical Maximum Water Level are displayed. Sandy made final landfall near Atlantic City, NJ on 10/30/2012 00:00 GMT as a Category 1 hurricane. On multiple high tides, the sensor reached its physical limit and did not record a maximum water level.
Figure 33: Water levels above Mean Lower Low Water (MLLW) at Annapolis, MD. Lines denoting Highest Astronomical Tide (HAT) and Historical Maximum Water Level are displayed. Sandy made final landfall near Atlantic City, NJ on 10/30/2012 00:00 GMT as a Category 1 hurricane.

NOAA NOS Hurricane Sandy Water Level & Meteorological Data Report 33
Figure 34: Water levels above Mean Lower Low Water (MLLW) at Baltimore, MD. Lines denoting Highest Astronomical Tide (HAT) and Historical Maximum Water Level are displayed. Sandy made final landfall near Atlantic City, NJ on 10/30/2012 00:00 GMT as a Category 1 hurricane.
Figure 35: Water levels above Mean Lower Low Water (MLLW) at Chesapeake City, MD. Lines denoting Highest Astronomical Tide (HAT) and Historical Maximum Water Level are displayed. Sandy made final landfall near Atlantic City, NJ on 10/30/2012 00:00 GMT as a Category 1 hurricane.

NOAA NOS Hurricane Sandy Water Level & Meteorological Data Report 34
Figure 36: Water levels above Mean Lower Low Water (MLLW) at Tolchester Beach, MD. Lines denoting Highest Astronomical Tide (HAT) and Historical Maximum Water Level are displayed. Sandy made final landfall near Atlantic City, NJ on 10/30/2012 00:00 GMT as a Category 1 hurricane.
Figure 37: Water levels above Mean Lower Low Water (MLLW) at Cambridge, MD. Lines denoting Highest Astronomical Tide (HAT) and Historical Maximum Water Level are displayed. Sandy made final landfall near Atlantic City, NJ on 10/30/2012 00:00 GMT as a Category 1 hurricane.

NOAA NOS Hurricane Sandy Water Level & Meteorological Data Report 35
Figure 38: Water levels above Mean Lower Low Water (MLLW) at Bishops Head, MD. Lines denoting Highest Astronomical Tide (HAT) and Historical Maximum Water Level are displayed. Maximum recorded water level value exceeded the historical maximum value. Sandy made final landfall near Atlantic City, NJ on 10/30/2012 00:00 GMT as a Category 1 hurricane.
Figure 39: Water levels above Mean Lower Low Water (MLLW) at Ocean City Inlet, MD. Lines denoting Highest Astronomical Tide (HAT) and Historical Maximum Water Level are displayed. Sandy made final landfall near Atlantic City, NJ on 10/30/2012 00:00 GMT as a Category 1 hurricane.

NOAA NOS Hurricane Sandy Water Level & Meteorological Data Report 36
Figure 40: Water levels above Mean Lower Low Water (MLLW) at Lewes, DE. Lines denoting Highest Astronomical Tide (HAT) and Historical Maximum Water Level are displayed. Sandy made final landfall near Atlantic City, NJ on 10/30/2012 00:00 GMT as a Category 1 hurricane.
Figure 41: Water levels above Mean Lower Low Water (MLLW) at Brandywine Shoal Light, DE. Lines denoting Highest Astronomical Tide (HAT) and Historical Maximum Water Level are displayed. Sandy made final landfall near Atlantic City, NJ on 10/30/2012 00:00 GMT as a Category 1 hurricane. The sensor was damaged by the storm and did not record the maximum water level.

NOAA NOS Hurricane Sandy Water Level & Meteorological Data Report 37
Figure 42: Water levels above Mean Lower Low Water (MLLW) at Reedy Point, DE. Lines denoting Highest Astronomical Tide (HAT) and Historical Maximum Water Level are displayed. Sandy made final landfall near Atlantic City, NJ on 10/30/2012 00:00 GMT as a Category 1 hurricane.
Figure 43: Water levels above Mean Lower Low Water (MLLW) at Delaware City, DE. Lines denoting Highest Astronomical Tide (HAT) and Historical Maximum Water Level are displayed. Maximum recorded water level value exceeded the historical maximum value. Sandy made final landfall near Atlantic City, NJ on 10/30/2012 00:00 GMT as a Category 1 hurricane.

NOAA NOS Hurricane Sandy Water Level & Meteorological Data Report 38
Figure 44: Water levels above Mean Lower Low Water (MLLW) at Newbold, PA. Lines denoting Highest Astronomical Tide (HAT) and Historical Maximum Water Level are displayed. Sandy made final landfall near Atlantic City, NJ on 10/30/2012 00:00 GMT as a Category 1 hurricane.
Figure 45: Water levels above Mean Lower Low Water (MLLW) at Philadelphia, PA. Lines denoting Highest Astronomical Tide (HAT) and Historical Maximum Water Level are displayed. Maximum recorded water level value exceeded the historical maximum value. Sandy made final landfall near Atlantic City, NJ on 10/30/2012 00:00 GMT as a Category 1 hurricane.

NOAA NOS Hurricane Sandy Water Level & Meteorological Data Report 39
Figure 46: Water levels above Mean Lower Low Water (MLLW) at Marcus Hook, PA. Lines denoting Highest Astronomical Tide (HAT) and Historical Maximum Water Level are displayed. Maximum recorded water level value exceeded the historical maximum value. Sandy made final landfall near Atlantic City, NJ on 10/30/2012 00:00 GMT as a Category 1 hurricane.
Figure 47: Water levels above Mean Lower Low Water (MLLW) at Burlington, Delaware River, NJ. Lines denoting Highest Astronomical Tide (HAT) and Historical Maximum Water Level are displayed. Sandy made final landfall near Atlantic City, NJ on 10/30/2012 00:00 GMT as a Category 1 hurricane.

NOAA NOS Hurricane Sandy Water Level & Meteorological Data Report 40
Figure 48: Water levels above Mean Lower Low Water (MLLW) at Tacony-Palmyra Bridge, NJ. Lines denoting Highest Astronomical Tide (HAT) and Historical Maximum Water Level are displayed. Sandy made final landfall near Atlantic City, NJ on 10/30/2012 00:00 GMT as a Category 1 hurricane.
Figure 49: Water levels above Mean Lower Low Water (MLLW) at Ship John Shoal, NJ. Lines denoting Highest Astronomical Tide (HAT) and Historical Maximum Water Level are displayed. Maximum recorded water level value exceeded the historical maximum value. Sandy made final landfall near Atlantic City, NJ on 10/30/2012 00:00 GMT as a Category 1 hurricane.

NOAA NOS Hurricane Sandy Water Level & Meteorological Data Report 41
Figure 50: Water levels above Mean Lower Low Water (MLLW) at Cape May, NJ. Lines denoting Highest Astronomical Tide (HAT) and Historical Maximum Water Level are displayed. Maximum recorded water level value exceeded the historical maximum value. Sandy made final landfall near Atlantic City, NJ on 10/30/2012 00:00 GMT as a Category 1 hurricane.
Figure 51: Water levels above Mean Lower Low Water (MLLW) at Burlington, Atlantic City, NJ. Lines denoting Highest Astronomical Tide (HAT) and Historical Maximum Water Level are displayed. Sandy made final landfall near Atlantic City, NJ on 10/30/2012 00:00 GMT as a Category 1 hurricane.

NOAA NOS Hurricane Sandy Water Level & Meteorological Data Report 42
Figure 52: Water levels above Mean Lower Low Water (MLLW) at Sandy Hook, NJ. Lines denoting Highest Astronomical Tide (HAT) and Historical Maximum Water Level are displayed. Maximum recorded water level value exceeded the historical maximum value. Sandy made final landfall near Atlantic City, NJ on 10/30/2012 00:00 GMT as a Category 1 hurricane. The sensor was damaged by the storm and likely did not record the maximum water level during Sandy. Because the sensor did not record a full tide while exceeding the historical maximum water level, the record will not be superseded.
Figure 53: Water levels above Mean Lower Low Water (MLLW) at Bergen Point West Reach, NY. Lines denoting Highest Astronomical Tide (HAT) and Historical Maximum Water Level are displayed. Maximum recorded water level value exceeded the historical maximum value. Sandy made final landfall near Atlantic City, NJ on 10/30/2012 00:00 GMT as a Category 1 hurricane.

NOAA NOS Hurricane Sandy Water Level & Meteorological Data Report 43
Figure 54: Water levels above Mean Lower Low Water (MLLW) at The Battery, NY. Lines denoting Highest Astronomical Tide (HAT) and Historical Maximum Water Level are displayed. Maximum recorded water level value exceeded the historical maximum value. Sandy made final landfall near Atlantic City, NJ on 10/30/2012 00:00 GMT as a Category 1 hurricane.
Figure 55: Water levels above Mean Lower Low Water (MLLW) at Kings Point, NY. Lines denoting Highest Astronomical Tide (HAT) and Historical Maximum Water Level are displayed. Maximum recorded water level value exceeded the historical maximum value. Sandy made final landfall near Atlantic City, NJ on 10/30/2012 00:00 GMT as a Category 1 hurricane.

NOAA NOS Hurricane Sandy Water Level & Meteorological Data Report 44
Figure 56: Water levels above Mean Lower Low Water (MLLW) at Montauk, NY. Lines denoting Highest Astronomical Tide (HAT) and Historical Maximum Water Level are displayed. Sandy made final landfall near Atlantic City, NJ on 10/30/2012 00:00 GMT as a Category 1 hurricane.
Figure 57: Water levels above Mean Lower Low Water (MLLW) at Bridgeport, CT. Lines denoting Highest Astronomical Tide (HAT) and Historical Maximum Water Level are displayed. Maximum recorded water level value exceeded the historical maximum value. Sandy made final landfall near Atlantic City, NJ on 10/30/2012 00:00 GMT as a Category 1 hurricane.

NOAA NOS Hurricane Sandy Water Level & Meteorological Data Report 45
Figure 58: Water levels above Mean Lower Low Water (MLLW) at New Haven, CT. Lines denoting Highest Astronomical ide (HAT) and Historical Maximum Water Level are displayed. Maximum recorded water level value exceeded the historical maximum value. Sandy made final landfall near Atlantic City, NJ on 10/30/2012 00:00 GMT as a Category 1 hurricane.
Figure 59: Water levels above Mean Lower Low Water (MLLW) at New London, CT. Lines denoting Highest Astronomical Tide (HAT) and Historical Maximum Water Level are displayed. Sandy made final landfall near Atlantic City, NJ on 10/30/2012 00:00 GMT as a Category 1 hurricane.

NOAA NOS Hurricane Sandy Water Level & Meteorological Data Report 46
Figure 60: Water levels above Mean Lower Low Water (MLLW) at Quonset Point, RI. Lines denoting Highest Astronomical Tide (HAT) and Historical Maximum Water Level are displayed. Sandy made final landfall near Atlantic City, NJ on 10/30/2012 00:00 GMT as a Category 1 hurricane. Around the time of landfall, the sensor reached its physical limit and did not record a maximum water level.
Figure 61: Water levels above Mean Lower Low Water (MLLW) at Providence, RI. Lines denoting Highest Astronomical Tide (HAT) and Historical Maximum Water Level are displayed. Sandy made final landfall near Atlantic City, NJ on 10/30/2012 00:00 GMT as a Category 1 hurricane.

NOAA NOS Hurricane Sandy Water Level & Meteorological Data Report 47
Figure 62: Water levels above Mean Lower Low Water (MLLW) at Conimicut Light, RI. Lines denoting Highest Astronomical Tide (HAT) and Historical Maximum Water Level are displayed. Maximum recorded water level value exceeded the historical maximum value. Sandy made final landfall near Atlantic City, NJ on 10/30/2012 00:00 GMT as a Category 1 hurricane.
Figure 63: Water levels above Mean Lower Low Water (MLLW) at Newport, RI. Lines denoting Highest Astronomical Tide (HAT) and Historical Maximum Water Level are displayed. Sandy made final landfall near Atlantic City, NJ on 10/30/2012 00:00 GMT as a Category 1 hurricane.

NOAA NOS Hurricane Sandy Water Level & Meteorological Data Report 48
Figure 64: Water levels above Mean Lower Low Water (MLLW) at Nantucket Island, MA. Lines denoting Highest Astronomical Tide (HAT) and Historical Maximum Water Level are displayed. Sandy made final landfall near Atlantic City, NJ on 10/30/2012 00:00 GMT as a Category 1 hurricane.
Figure 65: Water levels above Mean Lower Low Water (MLLW) at Woods Hole, MA. Lines denoting Highest Astronomical Tide (HAT) and Historical Maximum Water Level are displayed. Sandy made final landfall near Atlantic City, NJ on 10/30/2012 00:00 GMT as a Category 1 hurricane.

NOAA NOS Hurricane Sandy Water Level & Meteorological Data Report 49
Figure 66: Water levels above Mean Lower Low Water (MLLW) at Chatham, MA. Lines denoting Highest Astronomical Tide (HAT) and Historical Maximum Water Level are displayed. Sandy made final landfall near Atlantic City, NJ on 10/30/2012 00:00 GMT as a Category 1 hurricane.
Figure 67: Water levels above Mean Lower Low Water (MLLW) at Fall River, MA. Lines denoting Highest Astronomical Tide (HAT) and Historical Maximum Water Level are displayed. Maximum recorded water level value exceeded the historical maximum value. Sandy made final landfall near Atlantic City, NJ on 10/30/2012 00:00 GMT as a Category 1 hurricane.

NOAA NOS Hurricane Sandy Water Level & Meteorological Data Report 50
Figure 68: Water levels above Mean Lower Low Water (MLLW) at Boston, MA. Lines denoting Highest Astronomical Tide (HAT) and Historical Maximum Water Level are displayed. Sandy made final landfall near Atlantic City, NJ on 10/30/2012 00:00 GMT as a Category 1 hurricane.
Figure 69: Water levels above Mean Lower Low Water (MLLW) at Fort Point, NH. Lines denoting Highest Astronomical Tide (HAT) and Historical Maximum Water Level are displayed. Sandy made final landfall near Atlantic City, NJ on 10/30/2012 00:00 GMT as a Category 1 hurricane.

NOAA NOS Hurricane Sandy Water Level & Meteorological Data Report 51
Figure 70: Water levels above Mean Lower Low Water (MLLW) at Wells, ME. Lines denoting Highest Astronomical Tide (HAT) and Historical Maximum Water Level are displayed. Sandy made final landfall near Atlantic City, NJ on 10/30/2012 00:00 GMT as a Category 1 hurricane.
Figure 71: Water levels above Mean Lower Low Water (MLLW) at Portland, ME. Lines denoting Highest Astronomical Tide (HAT) and Historical Maximum Water Level are displayed. Sandy made final landfall near Atlantic City, NJ on 10/30/2012 00:00 GMT as a Category 1 hurricane.

NOAA NOS Hurricane Sandy Water Level & Meteorological Data Report 52
Figure 72: Water levels above Mean Lower Low Water (MLLW) at Bar Harbor, ME. Lines denoting Highest Astronomical Tide (HAT) and Historical Maximum Water Level are displayed. Sandy made final landfall near Atlantic City, NJ on 10/30/2012 00:00 GMT as a Category 1 hurricane.
Figure 73: Water levels above Mean Lower Low Water (MLLW) at Cutler Farris Wharf, ME. Lines denoting Highest Astronomical Tide (HAT) and Historical Maximum Water Level are displayed. Sandy made final landfall near Atlantic City, NJ on 10/30/2012 00:00 GMT as a Category 1 hurricane.

NOAA NOS Hurricane Sandy Water Level & Meteorological Data Report 53
Figure 74: Water levels above Mean Lower Low Water (MLLW) at Eastport, ME. Lines denoting Highest Astronomical Tide (HAT) and Historical Maximum Water Level are displayed. Sandy made final landfall near Atlantic City, NJ on 10/30/2012 00:00 GMT as a Category 1 hurricane.

NOAA NOS Hurricane Sandy Water Level & Meteorological Data Report 54
Appendix 1: References and Contact Information NOAA, 2008. Center For Operational Oceanographic Products & Services Specifications and Deliverables for Installation, Operation, and Removal of Water Level Stations, NOAA/NOS, March 2008. NOAA, 1991. Next Generation Water Level Measurement System (NGWLMS) Site Design, Preparation, and Installation Manual, NOAA/NOS, January 1991. Center for Operational Oceanographic Products & Services Environmental Measurement Systems , Sensor Specifications and Measurement Algorithm, NOAA/NOS. For further information or updates on the Storm Technical Reports and Storm QuickLook product, contact: Storm QuickLook Center for Operational Oceanographic Products and Services (CO-OPS) 1305 East-West Highway Silver Spring, MD 20910-3281 Phone: (301) 713-2877 ext. 211 Fax: (301) 713-4437 E-mail: Storm QuickLook ([email protected])
NOAA NOS Hurricane Sandy Water Level & Meteorological Data Report 55
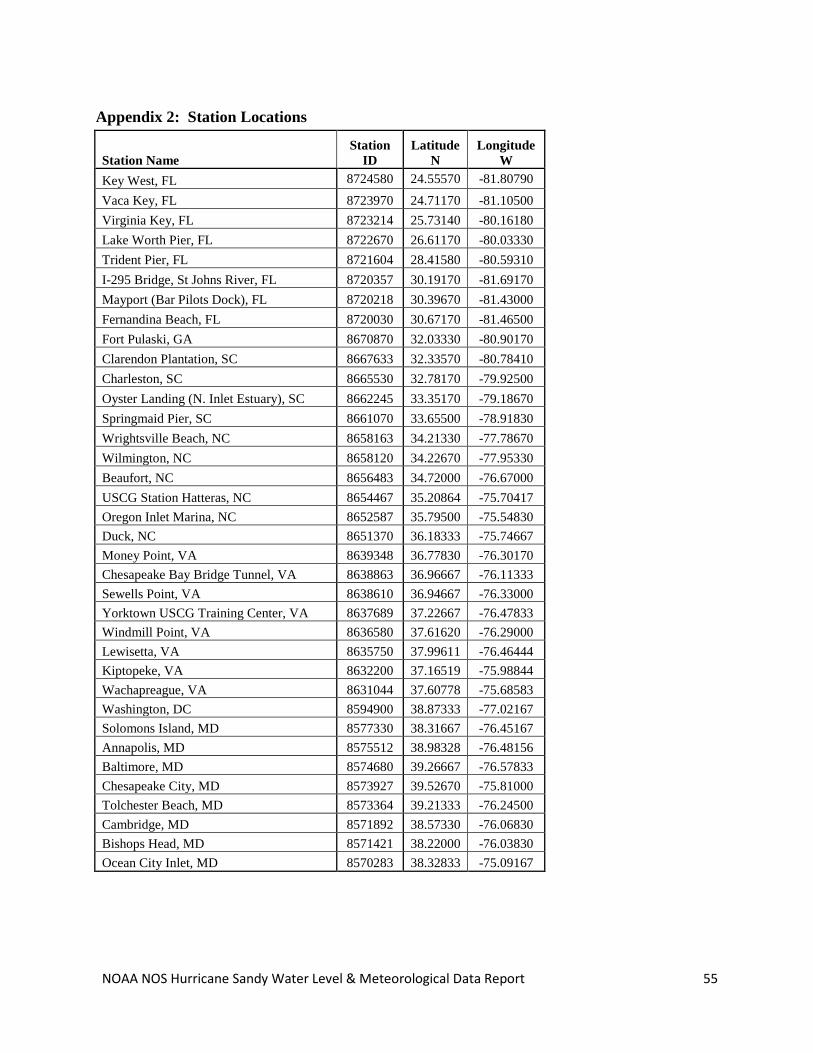
Appendix 2: Station Locations
Station Name Station
ID Latitude
N Longitude
W Key West, FL 8724580 24.55570 -81.80790 Vaca Key, FL 8723970 24.71170 -81.10500 Virginia Key, FL 8723214 25.73140 -80.16180 Lake Worth Pier, FL 8722670 26.61170 -80.03330 Trident Pier, FL 8721604 28.41580 -80.59310 I-295 Bridge, St Johns River, FL 8720357 30.19170 -81.69170 Mayport (Bar Pilots Dock), FL 8720218 30.39670 -81.43000 Fernandina Beach, FL 8720030 30.67170 -81.46500 Fort Pulaski, GA 8670870 32.03330 -80.90170 Clarendon Plantation, SC 8667633 32.33570 -80.78410 Charleston, SC 8665530 32.78170 -79.92500 Oyster Landing (N. Inlet Estuary), SC 8662245 33.35170 -79.18670 Springmaid Pier, SC 8661070 33.65500 -78.91830 Wrightsville Beach, NC 8658163 34.21330 -77.78670 Wilmington, NC 8658120 34.22670 -77.95330 Beaufort, NC 8656483 34.72000 -76.67000 USCG Station Hatteras, NC 8654467 35.20864 -75.70417 Oregon Inlet Marina, NC 8652587 35.79500 -75.54830 Duck, NC 8651370 36.18333 -75.74667 Money Point, VA 8639348 36.77830 -76.30170 Chesapeake Bay Bridge Tunnel, VA 8638863 36.96667 -76.11333 Sewells Point, VA 8638610 36.94667 -76.33000 Yorktown USCG Training Center, VA 8637689 37.22667 -76.47833 Windmill Point, VA 8636580 37.61620 -76.29000 Lewisetta, VA 8635750 37.99611 -76.46444 Kiptopeke, VA 8632200 37.16519 -75.98844 Wachapreague, VA 8631044 37.60778 -75.68583 Washington, DC 8594900 38.87333 -77.02167 Solomons Island, MD 8577330 38.31667 -76.45167 Annapolis, MD 8575512 38.98328 -76.48156 Baltimore, MD 8574680 39.26667 -76.57833 Chesapeake City, MD 8573927 39.52670 -75.81000 Tolchester Beach, MD 8573364 39.21333 -76.24500 Cambridge, MD 8571892 38.57330 -76.06830 Bishops Head, MD 8571421 38.22000 -76.03830 Ocean City Inlet, MD 8570283 38.32833 -75.09167

NOAA NOS Hurricane Sandy Water Level & Meteorological Data Report 56
Appendix 2: Station Locations (continued)
Station Name Station
ID Latitude
N Longitude
W Lewes, DE 8557380 38.78169 -75.12000 Brandywine Shoal Light, DE 8555889 38.98667 -75.11333 Reedy Point, DE 8551910 39.55831 -75.57331 Delaware City, DE 8551762 39.58170 -75.58830 Newbold, PA 8548989 40.13670 -74.75170 Philadelphia, PA 8545240 39.93333 -75.14167 Marcus Hook, PA 8540433 39.81170 -75.41000 Burlington, Delaware River, NJ 8539094 40.08170 -74.86970 Tacony-Palmyra Bridge, NJ 8538886 40.01194 -75.04300 Ship John Shoal, NJ 8537121 39.30500 -75.37500 Cape May, NJ 8536110 38.96833 -74.96000 Atlantic City, NJ 8534720 39.35500 -74.41830 Sandy Hook, NJ 8531680 40.46690 -74.00940 Bergen Point West Reach, NY 8519483 40.63670 -74.14170 The Battery, NY 8518750 40.70060 -74.01420 Kings Point, NY 8516945 40.81030 -73.76490 Montauk, NY 8510560 41.04830 -71.96000 Bridgeport, CT 8467150 41.17330 -73.18170 New Haven, CT 8465705 41.28330 -72.90830 New London, CT 8461490 41.36139 -72.08997 Quonset Point, RI 8454049 41.58680 -71.41100 Providence, RI 8454000 41.80710 -71.40120 Conimicut Light, RI 8452944 41.71670 -71.34330 Newport, RI 8452660 41.50500 -71.32670 Nantucket Island, MA 8449130 41.28500 -70.09670 Woods Hole, MA 8447930 41.52330 -70.67170 Chatham, MA 8447435 41.68847 -69.95108 Fall River, MA 8447386 41.70430 -71.16410 Boston, MA 8443970 42.35480 -71.05340 Fort Point, NH 8423898 43.07170 -70.71170 Wells, ME 8419317 43.32000 -70.56331 Portland, ME 8418150 43.65670 -70.24670 Bar Harbor, ME 8413320 44.39170 -68.20500 Cutler Farris Wharf, ME 8411060 44.65670 -67.21000 Eastport, ME 8410140 44.90460 -66.98290

NOAA NOS Hurricane Sandy Water Level & Meteorological Data Report 57
Appendix 3: Definitions Excerpts From: Tide and Current Glossary, NOAA National Ocean Service, Silver Spring, MD, 2000 (http://www.tidesandcurrents.noaa.gov/publications/glossary2.pdf), Tidal Datums homepage (http://www.tidesandcurrents.noaa.gov/datum_options.html) and the Storm QuickLook Frequently Asked Questions homepage (http://www.tidesandcurrents.noaa.gov/quicklook_faqs.shtml) Bench mark (BM): A fixed physical object or mark used as reference for a horizontal or vertical datum. A tidal bench mark is one near a tide station to which the tide staff and tidal datums are referred. A primary bench mark is the principal mark of a group of tidal bench marks to which the tide staff and tidal datums are referred. Chart datum: The datum to which soundings on a chart are referred. It is usually taken to correspond to a low-water elevation, and its depression below mean sea level is represented by the symbol Z. Since 1980, chart datum has been implemented to mean lower low water for all marine waters of the United States, its territories, Commonwealth of Puerto Rico, and Trust Territory of the Pacific Islands. Datum (vertical): For marine applications, a base elevation used as a reference from which to reckon heights or depths. It is called a tidal datum when defined in terms of a certain phase of the tide. Tidal datums are local datums and should not be extended into areas which have differing hydrographic char-acteristics without substantiating measurements. In order that they may be recovered when needed, such datums are referenced to fixed points known as bench marks. See chart datum and bench marks. Geodetic datum: The NOAA National Geodetic Survey defines a geodetic datum as: "A set of constants used for calculating the coordinates of points on the Earth." In surveying and geodesy, a datum is a reference point on the earth's surface against which position measurements are made, and an associated model of the shape of the earth for computing positions. Horizontal datums are used for describing a point on the earth's surface, in latitude and longitude. Vertical datums are used to measure elevations or underwater depths. Highest Astronomical Tide (HAT): The elevation of the highest predicted astronomical tide expected to occur at a specific tide station over the National Tidal Datum Epoch. Historical Recorded Maximum Tide Level: The maximum tide elevation measured by a water level station with a continuous time series throughout a high tide cycle. A complete cycle is required to calculate the maximum tide elevation, using a best fit curve of the observations. These historical records may not have included the highest water levels measured at a station during an event if a complete high tide cycle was not measured due to station/sensor damage. See storm tides. Mean Lower Low Water (MLLW): A tidal datum. The average of the lower low water height of each tidal day observed over the National Tidal Datum Epoch. See National Tidal Datum Epoch. For stations with shorter series, comparison of simultaneous observations with a control tide station is made in order to derive the equivalent datum of the National Tidal Datum Epoch. Mean Higher High Water (MHHW): A tidal datum. The average of the higher high water height of each tidal day observed over the National Tidal Datum Epoch. For stations with shorter series, comparison of simultaneous observations with a control tide station is made in order to derive the equivalent datum of the National Tidal Datum Epoch.

NOAA NOS Hurricane Sandy Water Level & Meteorological Data Report 58
Mean Sea Level (MSL): A tidal datum. The arithmetic mean of hourly heights observed over the National Tidal Datum Epoch. Shorter series are specified in the name; e.g. monthly mean sea level and yearly mean sea level. National Tidal Datum Epoch: The specific 19-year period adopted by the National Ocean Service as the official time segment over which tide observations are taken and reduced to obtain mean values (e.g., mean lower low water, etc.) for tidal datums. It is necessary for standardization because of periodic and apparent secular trends in sea level. The present National Tidal Datum Epoch is 1983 through 2001. It is reviewed annually for possible revision and must be actively considered for revision every 25 years. North American Vertical Datum of 1988 (NAVD 1988): A fixed reference for elevations determined by geodetic leveling. The datum was derived from a general adjustment of the first-order terrestrial leveling nets of the United States, Canada, and Mexico. In the adjustment, only the height of the primary tidal bench mark, referenced to the International Great Lakes Datum of 1985 (IGLD 1985) local mean sea level height value, at Father Point, Rimouski, Quebec, Canada was held fixed, thus providing minimum constraint. NAVD 1988 and IGLD 1985 are identical. However, NAVD 1988 bench mark values are given in Helmert orthometric height units while IGLD 1985 values are in dynamic heights. National Tidal Datum Epoch: The specific 19-year period adopted by the National Ocean Service as the official time segment over which tide observations are taken and reduced to obtain mean values (e.g., mean lower low water, etc.) for tidal datums. It is necessary for standardization because of periodic and apparent secular trends in sea level. The present NTDE is 1983 through 2001 and is actively considered for revision every 20-25 years. Tidal datums in certain regions with anomalous sea level changes (Alaska, Gulf of Mexico) are calculated on a Modified 5-Year Epoch. National Water Level Observation Network (NWLON): The network of tide and water level stations operated by the National Ocean Service along the marine and Great Lakes coasts and islands of the United States. Neap tides: Tides of decreased range occurring semimonthly as the result of the Moon being in quadrature (first or last quarters). Non-tidal: Water levels may be classified as tidal or non-tidal. Water bodies with little or no range in tide and where the rise and fall of the water surface can no longer be practically measured in a predictable rhythm due to masking of the tide by hydrologic, wind, or other effects are non-tidal. Range of tide: The difference in height between consecutive high and low waters. The mean range is the difference in height between mean high water and mean low water. The great diurnal range or diurnal range is the difference in height between mean higher high water and mean lower low water. For other ranges see spring, neap, perigean, apogean, and tropic tides; and tropic ranges. Tide: The periodic rise and fall of a body of water resulting from gravitational interactions between Sun, Moon, and Earth. The vertical component of the particulate motion of a tidal wave. Same as astronomic tide. Tide (water level) gauge: An instrument for measuring the rise and fall of the tide (water level). Water levels may be classified as tidal and non-tidal.

NOAA NOS Hurricane Sandy Water Level & Meteorological Data Report 59
Spring tides: Tides of increased range occurring semimonthly as the result of the Moon being new or full.
Storm Surge/Residual: The onshore rush of sea or lake water caused by the high wind and the low pressure centers associated with a landfalling hurricane or other intense storm. The amplitude of the storm surge at any given location is dependent upon the orientation of the coast line with the storm track, the intensity, size and speed of the storm, and the local bathymetry. In practice, storm surge is usually estimated by subtracting the normal or astronomical tide from the observed storm tide at tide stations. This difference between observed storm tides and astronomical tide can have other components such as regional elevated mean sea levels in the Gulf of Mexico due to the Loop Current, elevated sea levels on the West Coast due to El Niño Southern Oscillation (ENSO), or local elevated sea levels due to river runoff in tidal rivers.
Storm Tide: The maximum water level elevation measured by a water level station during storm events. Depending on location, the storm tide is the potential combination of storm surge, local astronomical tide, regional sea level variations and river runoff during storm events. Since wind generated waves ride on top of the storm surge (and are not included in the definition), the total instantaneous elevation may greatly exceed the predicted storm surge plus astronomical tide. It is potentially catastrophic, especially on low lying coasts with gently sloping offshore topography.

NOAA NOS Hurricane Sandy Water Level & Meteorological Data Report 60
Appendix 4: Saffir-Simpson Hurricane Wind Scale Classification
Category Wind speed (kt) Wind speed (mph) Pressure (mb) Tropical Depression 20-34 23-38 n/a Tropical Storm 35-63 39-73 n/a Category 1 64-82 74-95 > 980 Category 2 83-95 96-110 965-979 Category 3 96-113 111-130 945-964 Category 4 114-135 131-155 920-944 Category 5 > 135 > 155 < 920
National Hurricane Center: The Saffir-Simpson Hurricane Wind Scale is a 1-5 rating based on the hurricane's present intensity (http://www.nhc.noaa.gov/aboutsshs.shtml). The scale does not address the potential for other hurricane-related impacts, such as storm surge, rainfall-induced floods, and tornadoes. Note that all winds are using 1-minute averaged wind speeds at a 10-meter elevation with an unobstructed exposure.