Hurricane · PDF file · 2016-01-20national hurricane center tropical cyclone...
15
NATIONAL HURRICANE CENTER TROPICAL CYCLONE REPORT HURRICANE AMANDA (EP012014) 22 – 29 MAY 2014 Stacy R. Stewart National Hurricane Center 24 June 2014 1130 UTC 25 MAY 2014 GOES-15 INFRARED SATELLITE IMAGE AT THE TIME OF AMANDA’S PEAK INTENSITY OF 135 KT (IMAGE COURTESY OF NOAA) Amanda was a high-end, early-season category 4 hurricane (on the Saffir-Simpson Hurricane Wind Scale) that remained over the open Pacific ocean well offshore of the coast of southwestern Mexico during its entire lifetime. Amanda is the strongest eastern North Pacific basin hurricane ever to occur in the month of May during the satellite era.
Transcript of Hurricane · PDF file · 2016-01-20national hurricane center tropical cyclone...

NATIONAL HURRICANE CENTER TROPICAL CYCLONE REPORT
HURRICANE AMANDA (EP012014) 22 – 29 MAY 2014
Stacy R. Stewart National Hurricane Center
24 June 2014
1130 UTC 25 MAY 2014 GOES-15 INFRARED SATELLITE IMAGE AT THE TIME OF AMANDA’S PEAK INTENSITY OF 135 KT (IMAGE
COURTESY OF NOAA)
Amanda was a high-end, early-season category 4 hurricane (on the Saffir-Simpson
Hurricane Wind Scale) that remained over the open Pacific ocean well offshore of the coast of southwestern Mexico during its entire lifetime. Amanda is the strongest eastern North Pacific basin hurricane ever to occur in the month of May during the satellite era.
Hurricane Amanda 2
Hurricane Amanda 2 2 – 2 9 M AY 2 0 1 4
SYNOPTIC HISTORY
Amanda formed from a tropical wave that moved into the eastern North Pacific Ocean on 16 May. The wave moved steadily westward over the next few days and a broad surface low developed along the wave axis by 19 May about 500 n mi south of Acapulco, Mexico. Over the next 48 h, convection waxed and waned and the disturbance turned west-northwestward. By early on 22 May, satellite scatterometer data indicated that the low pressure system’s wind field had contracted and that a well-defined center had formed. Deep convection near the center of the low continued to increase and become better organized, and it is estimated that a tropical depression formed around 1800 UTC that day when the cyclone was located about 550 n mi south-southwest of Manzanillo, Mexico. The small cyclone continued its slow west-northwestward motion along the southern periphery of a subtropical ridge centered over central Mexico and gradually strengthened, becoming a tropical storm by 1800 UTC 23 May. The “best track” chart of Amanda’s path is given in Fig. 1, with the wind and pressure histories shown in Figs. 2 and 3, respectively. The best track positions and intensities are listed in Table 11.
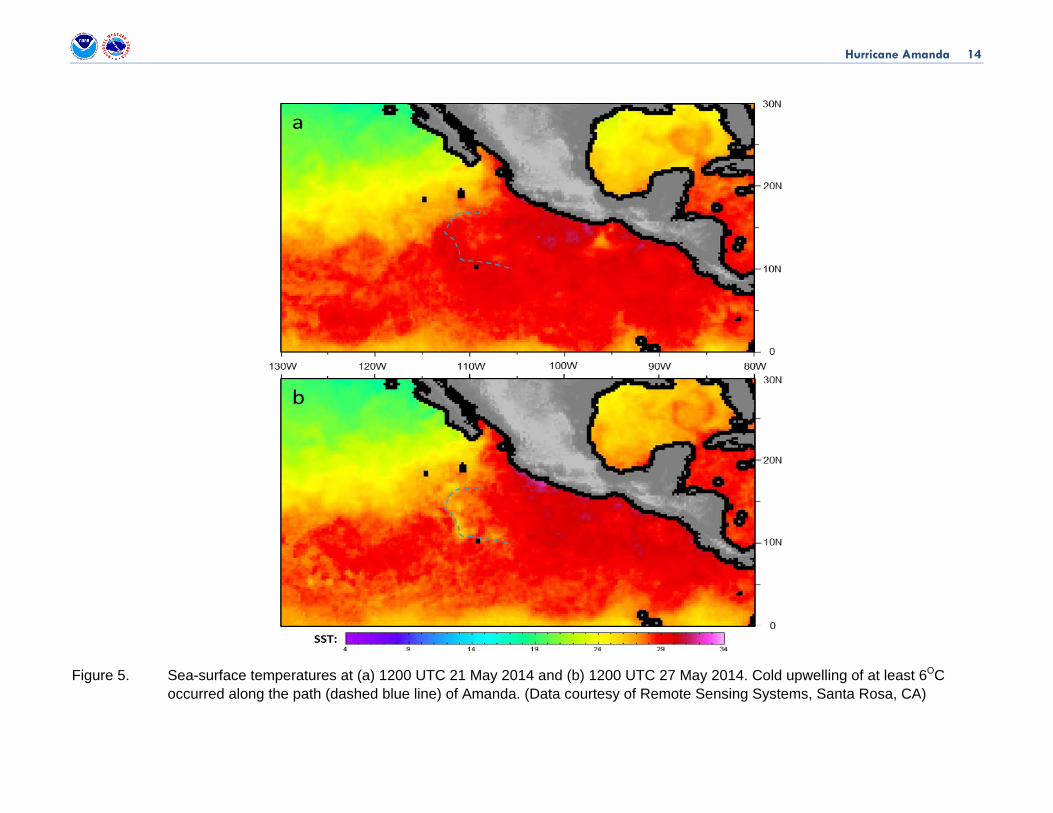
The combination of weak vertical wind shear, high moisture content in the middle troposphere, and very warm sea-surface temperatures near 30OC, plus the development of an eye and a small inner-core wind field (Fig. 4), resulted in a 42-h period of rapid intensification on 23-25 May. Amanda strengthened by 90 kt and reached its peak intensity of 135 kt around 1200 UTC 25 May when the cyclone was located about 670 n mi south of the southern tip of Baja California Sur, Mexico (cover page image). Although environmental conditions were still fairly conducive, sea-surface temperatures beneath the category 4 hurricane cooled by more than 6OC due to cold upwelling (Fig. 5) created by the intense inner-core wind field and the hurricane’s slow north-northwestward motion of only 2-3 kt. Amanda was able to maintain its peak intensity for only 6 h before gradual weakening began. By 1200 UTC 27 May, however, a more significant weakening trend ensued due to a combination of southerly vertical wind shear in excess of 20 kt and sea-surface temperatures less than 24OC. These adverse conditions resulted in erosion of the inner-core convection, causing Amanda to rapidly weaken between 1200 UTC 27 May and 1200 UTC 28 May – a decrease of 40 kt during that 24-h period.
As Tropical Storm Amanda moved slowly northeastward around the western periphery of the subtropical ridge, drier and more stable air to its north began to be ingested into the cyclone’s circulation, which further enhanced the weakening process. Amanda became a tropical depression by 1200 UTC 29 May when the cyclone was located about 400 n mi south of
1 A digital record of the complete best track, including wind radii, can be found on line at ftp://ftp.nhc.noaa.gov/atcf. Data for the current year’s storms are located in the btk directory, while previous years’ data are located in the archive directory.
Hurricane Amanda 3
the southern tip of Baja California, and dissipated shortly thereafter when the circulation became elongated and ill-defined.
METEOROLOGICAL STATISTICS
Observations in Amanda (Figs. 2 and 3) include subjective satellite-based Dvorak technique intensity estimates from the Tropical Analysis and Forecast Branch (TAFB) and the Satellite Analysis Branch (SAB), and objective Advanced Dvorak Technique (ADT) estimates from the Cooperative Institute for Meteorological Satellite Studies/University of Wisconsin-Madison. Data and imagery from NOAA polar-orbiting satellites including the Advanced Microwave Sounding Unit (AMSU), the NASA Tropical Rainfall Measuring Mission (TRMM) and Aqua satellites, the European Space Agency’s Advanced Scatterometer (ASCAT), and Defense Meteorological Satellite Program (DMSP) satellites, among others, were also useful in constructing the best track of Amanda.
There were no ship reports of tropical-storm-force winds associated with Amanda.
The 135-kt analyzed peak intensity of Amanda at 1200 UTC and 1800 UTC 25 May is based on a blend of satellite current intensity estimates of 7.0/140 kt from TAFB, 6.5/127 kt from SAB, and 6.6/130 kt and 6.9/137 kt from UW-CIMSS, respectively. The estimated minimum pressure of 932 mb, which was coincident with the peak intensity, is based on the Knaff-Zehr-Courtney (KZC) pressure-wind relationship estimate.
Amanda surpassed Hurricane Adolph of 2001 as the strongest hurricane ever in the month of May during the satellite era.
CASUALTY AND DAMAGE STATISTICS There were no reports of damage or casualties associated with Amanda.
FORECAST AND WARNING CRITIQUE
The genesis of Amanda was not forecast particularly well (Table 2). An area of disturbed weather was introduced into the Tropical Weather Outlook (TWO) with a 20% (low) chance of formation in 5 days at 1800 UTC 19 May, 72 h prior to genesis. The 48-h genesis probability was increased to the medium chance category (30-50%) only 6 h before the system was designated as a tropical cyclone, and a high probability of development for both the 120-h and 48-h outlook periods was never officially designated. Despite the low vertical wind shear

Hurricane Amanda 4
conditions and very warm sea-surface temperatures, the global models struggled with forecasting the initial development of Amanda, possibly due to the cyclone’s proximity to dry air in the mid-levels of the troposphere.
A verification of NHC official track forecasts for Amanda is given in Table 3a. Official forecast track errors were much lower than the mean official errors for the previous 5-yr period. A homogeneous comparison of the official track errors with selected guidance models is given in Table 3b. NHC official track forecast (OFCL) errors were significantly lower than the 5-yr average, ranging from 40% better at 24 h and 36 h to as much as 56% and 53% better at 96 h and 120 h, respectively. OFCL track forecasts outperformed most available model guidance at all times except for the Florida State University Superensemble (FSSE) model and the consensus model TVCE.
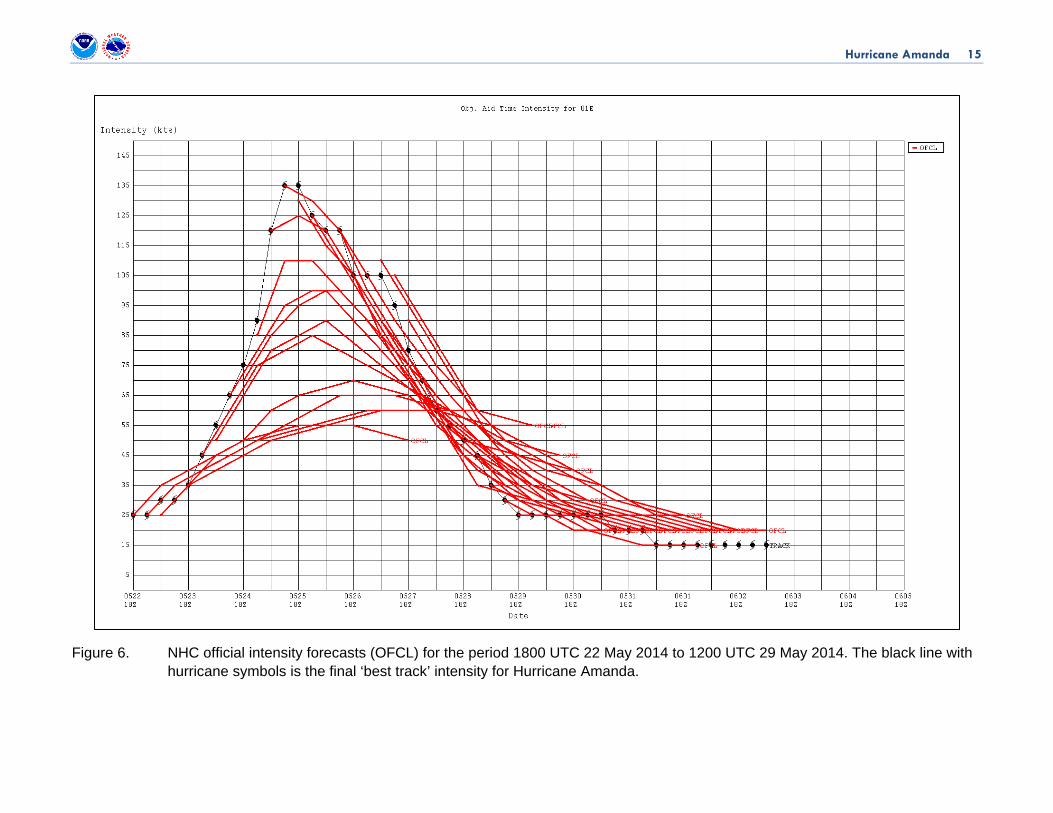
A verification of NHC official intensity forecasts for Amanda is given in Table 4a. A homogeneous comparison of the official intensity errors with selected guidance models is given in Table 4b. In contrast to the exceptional track forecast errors, NHC official intensity forecast errors were considerably worse than the 5-yr average except at 120 h. The cause of the large OFCL intensity forecast errors was due to failure to capture the rapid intensification phase (fig. 6). However, NHC official intensity forecasts handled the rapid weakening period quite well. Despite the larger than average errors, OFCL intensity forecasts still showed skill over all of the available intensity models through 48 h and also at 96 h. The official intensity forecasts were bested only by the GHMI, HWFI models, and LGEM models at 72 h, and by a larger group of aids at 120 h.
No coastal watches or warnings were required with Amanda.

Hurricane Amanda 5
Table 1. Best track for Hurricane Amanda, 22-29 May 2014.
Date/Time (UTC)
Latitude (°N)
Longitude (°W)
Pressure (mb)
Wind Speed (kt) Stage*
22 / 0600 10.1 106.4 1007 25 low
22 / 1200 10.2 106.8 1007 25 "
22 / 1800 10.3 107.2 1007 25 tropical depression
23 / 0000 10.5 107.6 1007 25 "
23 / 0600 10.7 108.0 1006 30 "
23 / 1200 10.8 108.3 1006 30 "
23 / 1800 10.9 108.6 1005 35 tropical storm
24 / 0000 11.0 109.0 1002 45 "
24 / 0600 11.1 109.4 996 55 "
24 / 1200 11.2 109.8 989 65 hurricane
24 / 1800 11.3 110.1 983 75 "
25 / 0000 11.5 110.5 973 90 "
25 / 0600 11.6 110.8 946 120 "
25 / 1200 11.7 111.1 932 135 "
25 / 1800 12.0 111.2 933 135 "
26 / 0000 12.3 111.3 941 125 "
26 / 0600 12.7 111.5 945 120 "
26 / 1200 12.9 111.6 949 115 "
26 / 1800 13.2 111.8 953 110 "
27 / 0000 13.5 111.9 958 105 "
27 / 0600 14.0 112.1 962 100 "
27 / 1200 14.2 112.4 966 95 "
27 / 1800 14.5 112.7 972 85 "
28 / 0000 14.5 112.6 983 75 "
28 / 0600 14.6 112.5 989 65 "

Hurricane Amanda 6
28 / 1200 14.9 112.2 996 55 tropical storm
28 / 1800 15.7 111.8 999 50 "
29 / 0000 16.1 111.5 1001 45 "
29 / 0600 16.3 110.9 1003 35 "
29 / 1200 16.2 110.2 1004 30 tropical depression
29 / 1800 dissipated
25 / 1200 11.7 111.1 932 135 minimum pressure
* NHC is conducting an in-house experiment in which track, intensity, and size forecasts are prepared for disturbances that are assessed to have a 60% or higher chance of genesis within 48 h. To support the verification of these forecasts, NHC is currently extending the best track back to the point where the first experimental forecast was made.

Hurricane Amanda 7
Table 2. Number of hours in advance of formation associated with the first NHC Tropical Weather Outlook forecast in the indicated likelihood category. Note that the timings for the “Low” category do not include forecasts of a 0% chance of genesis.
Hours Before Genesis
48-Hour Outlook 120-Hour Outlook
Low (<30%) 66 72
Medium (30%-50%) 6 54
High (>50%) 0 0
Table 3a. NHC official (OFCL) and climatology-persistence skill baseline (OCD5) track forecast errors (n mi) for Amanda. Mean errors for the previous 5-yr period are shown for comparison. Official errors that are smaller than the 5-yr means are shown in boldface type.
Forecast Period (h)
12 24 36 48 72 96 120
OFCL 20.0 24.9 33.2 39.4 61.1 58.9 79.0
OCD5 33.7 70.3 121.3 164.4 296.1 425.1 550.4
Forecasts 26 24 22 20 16 12 8
OFCL (2009-13) 25.7 41.4 55.0 68.6 97.8 134.2 167.1
OCD5 (2009-13) 37.2 74.8 118.0 162.5 249.4 332.6 413.3

Hurricane Amanda 8
Table 3b. Homogeneous comparison of selected track forecast guidance models (in n mi) for Amanda. Errors smaller than the NHC official forecast are shown in boldface type. The number of official forecasts shown here will generally be smaller than that shown in Table 3a due to the homogeneity requirement.
Model ID Forecast Period (h)
12 24 36 48 72 96 120
OFCL 18.9 27.3 33.6 43.5 59.1 48.8 70.4
OCD5 27.7 62.4 119.4 176.3 304.6 474.3 628.5
GFSI 25.3 45.9 65.4 84.7 98.5 120.9 121.2
AEMI 20.7 33.5 42.6 60.2 95.8 138.7 163.0
HWFI 36.4 62.7 76.4 92.5 102.7 199.1 298.8
GHMI 24.0 37.6 51.3 74.9 102.0 141.5 202.4
EMXI 21.9 27.7 32.8 46.5 65.2 64.6 69.1
UKMI 20.8 37.2 46.8 57.4 66.3 53.0 63.4
EGRI 20.8 37.2 46.8 57.4 66.3 53.0 81.2
CMCI 31.7 64.9 105.0 150.8 140.0 151.2 165.1
FSSE 18.7 27.2 30.0 41.6 66.4 50.3 78.2
TVCE 18.3 27.0 31.3 39.1 51.2 53.9 70.3
TCON 19.4 30.4 36.5 47.0 58.2 64.9 76.0
BAMD 50.3 95.4 142.1 189.0 299.1 467.8 705.5
BAMM 34.5 60.0 77.1 91.1 100.5 111.6 109.8
BAMD 50.3 95.4 142.1 189.0 299.1 467.8 705.5
LBAR 37.7 96.7 162.7 230.1 351.1 527.8 692.7
Forecasts 17 17 17 16 10 8 4
Hurricane Amanda 9
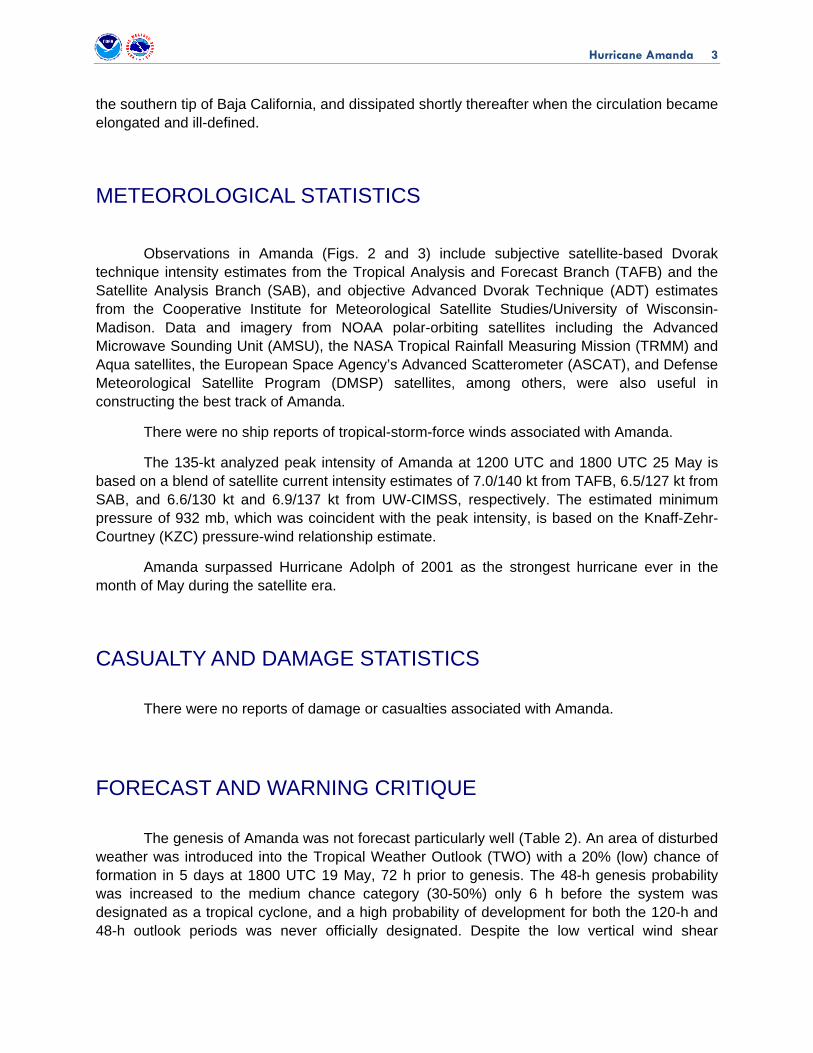
Table 4a. NHC official (OFCL) and climatology-persistence skill baseline (OCD5) intensity forecast errors (kt) for Amanda. Mean errors for the 5-yr period are shown for comparison. Official errors that are smaller than the 5-yr means are shown in boldface type.
Forecast Period (h)
12 24 36 48 72 96 120
OFCL 8.7 14.8 20.0 25.0 27.2 20.0 11.3
OCD5 12.3 21.0 27.0 32.7 39.1 29.8 15.0
Forecasts 26 24 22 20 16 12 8
OFCL (2009-13) 6.1 10.4 13.4 14.5 15.0 16.4 16.1
OCD5 (2009-13) 7.7 12.7 16.4 18.8 20.5 20.3 20.8
Table 4b. Homogeneous comparison of selected intensity forecast guidance models (in kt) for Amanda. Errors smaller than the NHC official forecast are shown in boldface type. The number of official forecasts shown here will generally be smaller than that shown in Table 4a due to the homogeneity requirement.
Model ID Forecast Period (h)
12 24 36 48 72 96 120
OFCL 11.2 17.1 19.7 17.8 15.5 8.8 7.5
OCD5 15.9 24.8 28.3 27.1 28.9 20.1 14.0
GHMI 14.6 22.7 28.5 19.7 12.6 14.6 8.0
HWFI 11.4 16.1 21.0 26.0 35.0 30.5 13.0
GFSI 17.0 25.2 33.4 37.1 39.6 33.0 5.3
EMXI 19.4 34.0 45.5 50.3 48.3 40.1 19.5
FSSE 11.6 17.6 19.9 19.5 20.0 9.4 4.0
DSHP 13.9 20.4 23.4 20.8 14.7 8.9 2.3
LGEM 13.2 19.6 21.9 19.7 15.2 9.9 7.3
IVCN 12.5 18.3 21.2 19.6 17.0 11.0 2.5
ICON 12.5 18.3 21.2 19.6 17.0 11.0 2.5
Forecasts 17 17 17 16 10 8 4

Hurricane Amanda 10
Figure 1. Best track positions for Hurricane Amanda, 22-29 May 2014.
Hurricane Amanda 11
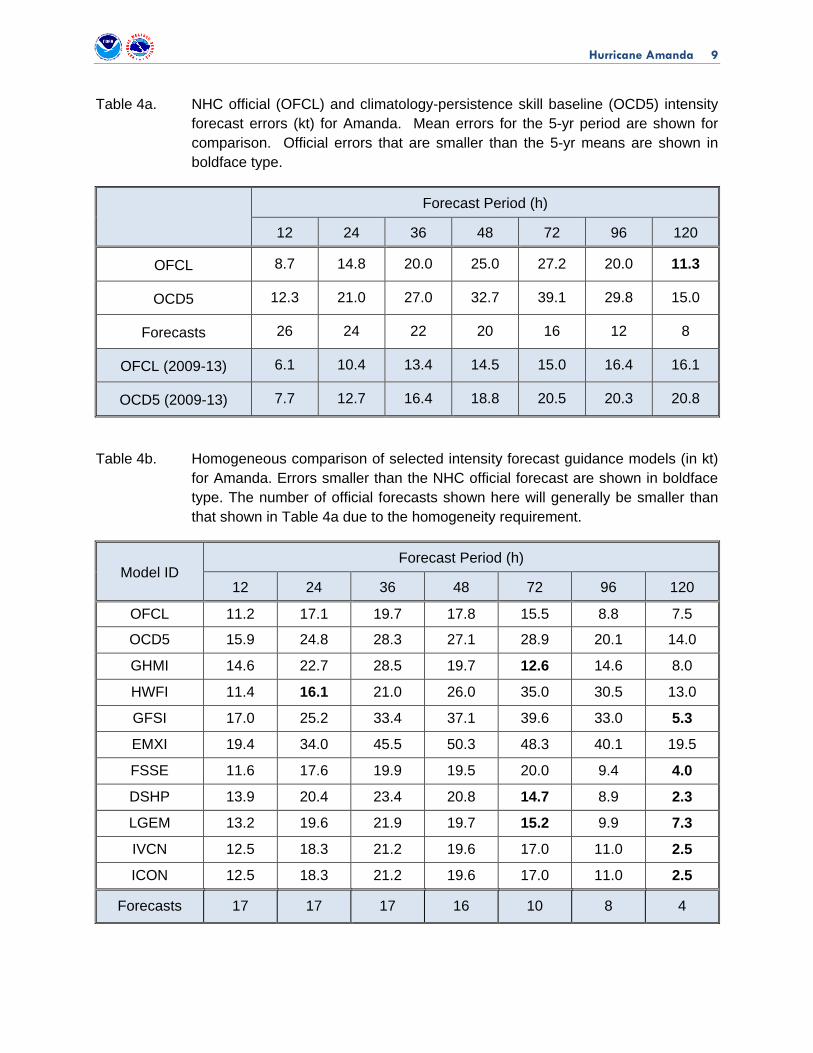
Figure 2. Selected wind observations and best track maximum sustained surface wind speed curve for Hurricane Amanda, 22-29 May 2014. Advanced Dvorak Technique estimates represent the Current Intensity at the nominal observation time. AMSU intensity estimates are from the Cooperative Institute for Meteorological Satellite Studies technique. Dashed vertical lines correspond to 0000 UTC.
102030405060708090
100110120130140150
5/21 5/23 5/25 5/27 5/29 5/31
BEST TRACK
Sat (TAFB)
Sat (SAB)
ADT
Scatterometer
Surface
AMSU
Win
d Sp
eed
(kt)
Date (Month/Day)
Hurricane Amanda22 - 29 May 2014

Hurricane Amanda 12
Figure 3. Selected pressure observations and best track minimum central pressure curve for Hurricane Amanda, 22-29 May 2014. Advanced Dvorak Technique estimates represent the Current Intensity at the nominal observation time. AMSU intensity estimates are from the Cooperative Institute for Meteorological Satellite Studies technique. KZC P-W refers to pressure estimates derived using the Knaff-Zehr-Courtney pressure-wind relationship. Dashed vertical lines correspond to 0000 UTC.
920
930
940
950
960
970
980
990
1000
1010
1020
5/21 5/23 5/25 5/27 5/29 5/31
BEST TRACKKZC P-WSat (TAFB)Sat (SAB)ADTAMSUSurface
Pres
sure
(mb)
Date (Month/Day)
Hurricane Amanda22 - 29 May 2014

Hurricane Amanda 13
Figure 4. 1200 UTC 24 May 2014 NASA TRMM Precipitation Radar (PR) image of Amanda when it reached hurricane status and possessed a symmetrical 10 n mi diameter eye. Amanda was also nearing the midpoint of its rapid intensification phase. (Image courtesy of the U.S. Navy Fleet Numerical Meteorology and Oceanography Command, Monterey, CA)
Hurricane Amanda 14
Figure 5. Sea-surface temperatures at (a) 1200 UTC 21 May 2014 and (b) 1200 UTC 27 May 2014. Cold upwelling of at least 6OC occurred along the path (dashed blue line) of Amanda. (Data courtesy of Remote Sensing Systems, Santa Rosa, CA)
Hurricane Amanda 15
Figure 6. NHC official intensity forecasts (OFCL) for the period 1800 UTC 22 May 2014 to 1200 UTC 29 May 2014. The black line with hurricane symbols is the final ‘best track’ intensity for Hurricane Amanda.