Cosmetic Dentist Huntington BeachCosmetic dentist huntington beach

May 2017 Southern California Association of Governments
Profile ofthe City of Huntington
BeachSouthern California Association of Governments’ (SCAG) Regional Council
includes 69 districts which represent 191 cities in the SCAG region
SCAG Regional Council District 64 includes only Huntington Beach Represented by: Hon. Erik Peterson
LOCAL PROFILES REPORT 2017 This profile report was prepared by the Southern California Association of Governments and shared with the City of Huntington Beach. SCAG provides local governments with a variety of benefits and services including, for example, data and information, GIS training, planning and technical assistance, and sustainability planning grants.


Table of Contents
I. INTRODUCTION ................................................................................................ 1
II. POPULATION ................................................................................................... 4
III. HOUSEHOLDS ................................................................................................. 9
IV. HOUSING ...................................................................................................... 12
V. TRANSPORTATION.......................................................................................... 18
VI. ACTIVE TRANSPORTATION ........................................................................... 20
VII. EMPLOYMENT .............................................................................................. 21
VIII. RETAIL SALES ............................................................................................ 29
IX. EDUCATION ................................................................................................... 30
X. PUBLIC HEALTH .............................................................................................. 33
XI. SCAG REGIONAL HIGHLIGHTS ...................................................................... 34
XII. DATA SOURCES ............................................................................................ 35
XIII. METHODOLOGY .......................................................................................... 36
XIV. ACKNOWLEDGMENTS .................................................................................. 41

2017 Local Profile City of Huntington Beach
This Page Intentionally Left Blank
2017 Local Profile City of Huntington Beach
Southern California Association of Governments
1
I. Introduction
The Southern California Association of Governments
The Southern California Association of Governments (SCAG) is the largest Metropolitan Planning Organization (MPO) in the nation, with nearly 19 million residents. The SCAG region includes six counties (Imperial, Los Angeles, Orange, Riverside, San Bernardino, and Ventura) and 191 incorporated cities. In addition, the SCAG region is a major hub of global economic activity, representing the 16th largest economy in the world and is considered the nation’s gateway for international trade, with two of the largest ports in the nation. SCAG is the also the most culturally diverse region in the nation, with no single ethnic group comprising a majority of the population. With a robust, diversified economy and a growing population substantially fueled by international immigration, the SCAG region is poised to continue its role as a primary metropolitan center on the Pacific Rim.
SCAG Activities
As the designated MPO, SCAG is mandated by federal law to research and develop a Regional Transportation Plan (RTP), which incorporates a Sustainable Communities Strategy (SCS) per California state law. Additionally, SCAG is pursuing a variety of innovative planning and policy initiatives to foster a more sustainable Southern California. In addition to conducting the formal planning activities required of an MPO, SCAG provides local governments with a wide variety of benefits and services including, for example, data and information, GIS training, planning and technical assistance, and support for sustainability planning grants.
The Local Profiles
In 2008, SCAG initiated the Local Profiles project as a part of a larger initiative to provide a variety of new services to its member cities and counties. Through extensive input from member jurisdictions, the inaugural Local Profiles Reports were released at the SCAG General Assembly in May 2009. The Profiles have since been updated every two years.
The Local Profiles reports provide a variety of demographic, economic, education, housing, and transportation information about each member jurisdiction including, but not limited to, the following:
How much growth in population has taken place since 2000? Has the local jurisdiction been growing faster or slower than the county or
regional average? Have there been more or fewer school-age children? Have homeownership rates been increasing or decreasing? How and where do residents travel to work? How has the local economy been changing in terms of employment share by
sector?
Answers to questions such as these provide a snapshot of the dynamic changes affecting each local jurisdiction.

2017 Local Profile City of Huntington Beach
Southern California Association of Governments
2
The purpose of this report is to provide current information and data for the City of Huntington Beach for planning and outreach efforts. Information on population, housing, transportation, employment, retail sales, and education can be utilized by the city to make well informed planning decisions. The report provides a portrait of the city and its changes since 2000, using average figures for Orange County as a comparative baseline. In addition, the most current data available for the region is also included in the Statistical Summary (page 3). This profile demonstrates current trends occurring in the City of Huntington Beach.
Factors Affecting Local Changes Reflected in the 2017 Report
Overall, member jurisdictions since 2000 have been impacted by a variety of factors at the national, regional, and local levels. For example, the vast majority of member jurisdictions included in the 2017 Local Profiles reflect national demographic trends toward an older and more diverse population. Evidence of continued progress toward economic recovery is also apparent through gradual increases in employment, retail sales, building permits, and home prices. Work destinations and commute times correlate with regional development patterns and the geographical location of local jurisdictions, particularly in relation to the regional transportation system.
Uses of the Local Profiles
Following release at the SCAG General Assembly, the Local Profiles are posted on the SCAG website and are used for a variety of purposes including, but not limited to, the following:
Data and communication resource for elected officials, businesses, and residents
Community planning and outreach Economic development Visioning initiatives Grant application support Performance monitoring
The primary user groups of the Local Profiles include member jurisdictions and state and federal legislative delegates of Southern California. This report is a SCAG member benefit and the use of the data contained within this report is voluntary.
Report Organization
This report includes three sections. The first section presents a statistical summary for the City of Huntington Beach. The second section provides detailed information organized by subject area and includes brief highlights of some of the trends identified by that information. The third section, Methodology, describes technical considerations related to data definitions, measurement, and sources.

2017 Local Profile City of Huntington Beach
Southern California Association of Governments
3
2016 STATISTICAL SUMMARY
Category Huntington Beach
Orange County
Huntington Beach Relative to Orange
County*
SCAG Region
2016 Total Population 195,212 3,183,011 [6.1%] 18,954,083
2016 Population Density (Persons per Square Mile)
7,298 4,055 3,243 489
2016 Median Age (Years) 42.0 37.5 4.5 36.0
2016 Hispanic 17.9% 34.7% -16.8% 46.8%
2016 Non-Hispanic White 65.3% 41.0% 24.3% 31.2%
2016 Non-Hispanic Asian 11.5% 19.3% -7.8% 12.7%
2016 Non-Hispanic Black 1.0% 1.6% -0.6% 6.3%
2016 Non-Hispanic American Indian
0.3% 0.2% 0.1% 0.3%
2016 All Other Non-Hispanic 4.1% 3.1% 1.0% 2.7%
2016 Number of Households 74,951 1,024,810 [7.3%] 6,132,938
2016 Average Household Size 2.6 3.1 -0.5 3.1
2016 Median Household Income
$83,771 $77,390 $6,381 $61,792
2016 Number of Housing Units 80,760 1,075,699 [7.5%] 6,629,879
2016 Homeownership Rate 60.7% 54.3% 6.4% 54.3%
2016 Median Existing Home Sales Price
$705,000 $645,000 $60,000 $466,000
2015 - 2016 Median Home Sales Price Change
4.3% 5.9% -1.6% 6.6%
2016 Drive Alone to Work 86.7% 82.4% 4.3% 78.8%
2016 Mean Travel Time to Work (minutes)
30.0 29.0 1.0 31.0
2015 Number of Jobs 79,420 1,615,214 [4.9%] 7,920,602
2014 - 2015 Total Jobs Change 696 23,037 [3%] 117,499
2015 Average Salary per Job $52,481 $58,120 -$5,639 $53,962
2016 K-12 Public School Student Enrollment
27,266 488,465 6% 2,961,726
Sources: U.S. Census Bureau American Community Survey, 2015; Nielsen Co.; California Department of Finance E-5, May 2016; CoreLogic/DataQuick; California Department of Education; and SCAG
* Numbers with [ ] represent Huntington Beach’s share of Orange County. The other numbers represent the difference between Huntington Beach and Orange County.
Mapped jurisdictional boundaries are as of July 1, 2016 and are for visual purposes only. Report data, however, are updated according to their respective sources.
2017 Local Profile City of Huntington Beach
Southern California Association of Governments
4
II. Population
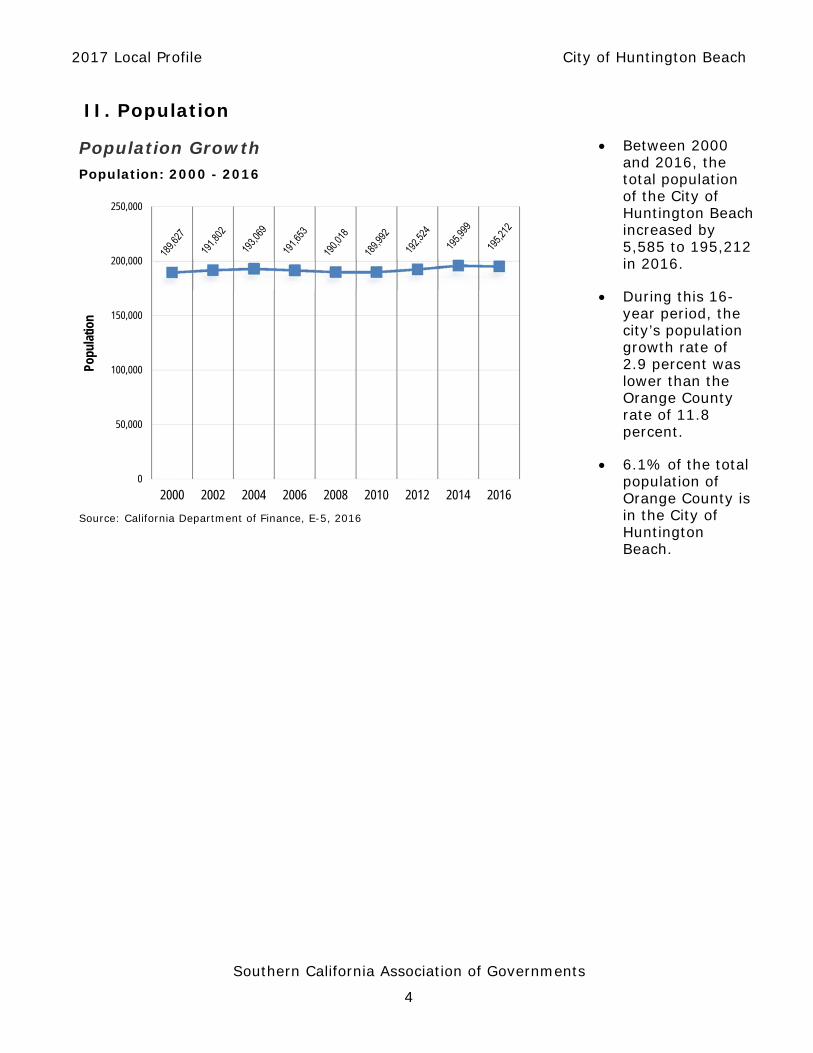
Population Growth Population: 2000 - 2016
Source: California Department of Finance, E-5, 2016
Between 2000 and 2016, the total population of the City of Huntington Beach increased by 5,585 to 195,212 in 2016.
During this 16-year period, the city’s population growth rate of 2.9 percent was lower than the Orange County rate of 11.8 percent.
6.1% of the total population of Orange County is in the City of Huntington Beach.
0
50,000
100,000
150,000
200,000
250,000
2000 2002 2004 2006 2008 2010 2012 2014 2016
Popu
latio
n
2017 Local Profile City of Huntington Beach
Southern California Association of Governments
5
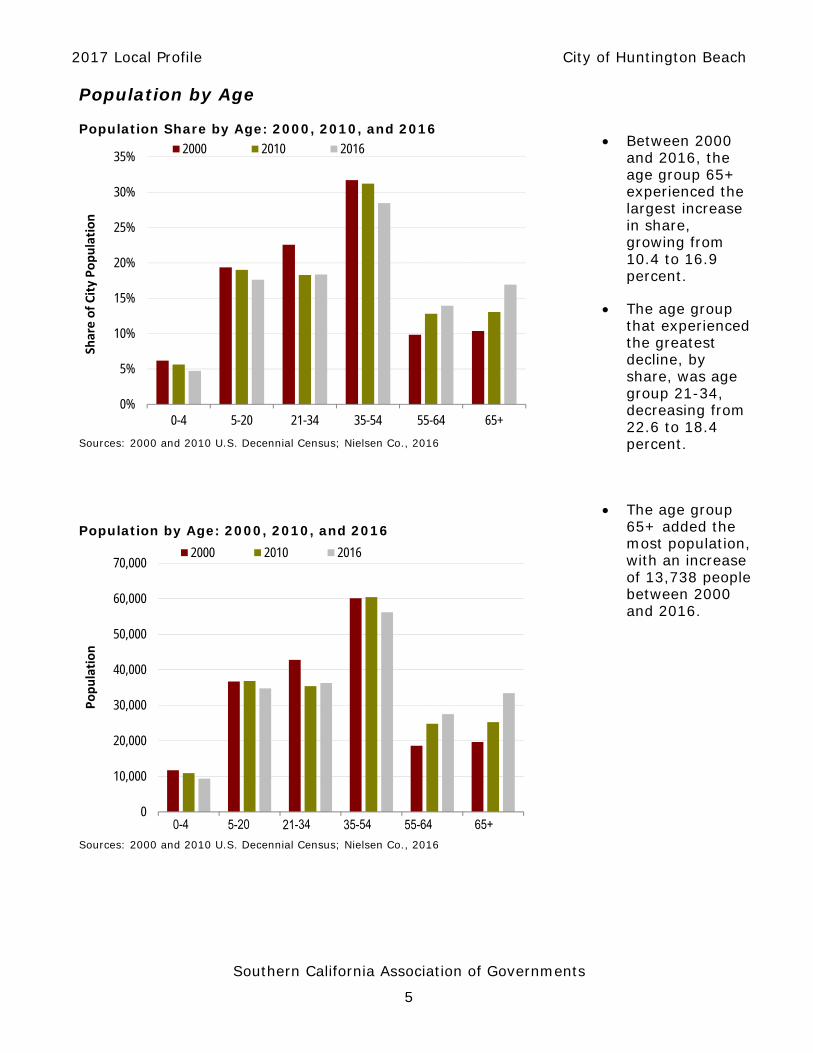
Population by Age Population Share by Age: 2000, 2010, and 2016
Sources: 2000 and 2010 U.S. Decennial Census; Nielsen Co., 2016
Between 2000 and 2016, the age group 65+ experienced the largest increase in share, growing from 10.4 to 16.9 percent.
The age group that experienced the greatest decline, by share, was age group 21-34, decreasing from 22.6 to 18.4 percent.
Population by Age: 2000, 2010, and 2016
Sources: 2000 and 2010 U.S. Decennial Census; Nielsen Co., 2016
The age group 65+ added the most population, with an increase of 13,738 people between 2000 and 2016.
0%
5%
10%
15%
20%
25%
30%
35%
0-4 5-20 21-34 35-54 55-64 65+
Share of City Population
2000 2010 2016
0
10,000
20,000
30,000
40,000
50,000
60,000
70,000
Population
2000 2010 2016

2017 Local Profile City of Huntington Beach
Southern California Association of Governments
6
Population by Race/Ethnicity Hispanic or Latino of Any Race: 2000, 2010, and 2016
Sources: 2000 and 2010 U.S. Decennial Census; Nielsen Co., 2016
Between 2000 and 2016, the share of Hispanic population in the city increased from 14.7 percent to 17.9 percent.
Non-Hispanic White: 2000, 2010, and 2016
Sources: 2000 and 2010 U.S. Decennial Census; Nielsen Co., 2016
Between 2000 and 2016, the share of Non-Hispanic White population in the city decreased from 71.9 percent to 65.3 percent.
Please refer to the Methodology section for definitions of the racial/ethnic categories.
14.7%
17.1%17.9%
0%
5%
10%
15%
20%
2000 2010 2016
Share of City Population
71.9%67.2% 65.3%
0%
10%
20%
30%
40%
50%
60%
70%
80%
2000 2010 2016
Share of City Population

2017 Local Profile City of Huntington Beach
Southern California Association of Governments
7
Non-Hispanic Asian: 2000, 2010, and 2016
Sources: 2000 and 2010 U.S. Decennial Census; Nielsen Co., 2016
Between 2000 and 2016, the share of Non-Hispanic Asian population in the city increased from 9.3 percent to 11.5 percent.
Non-Hispanic Black: 2000, 2010, and 2016
Sources: 2000 and 2010 U.S. Decennial Census; Nielsen Co., 2016
Between 2000 and 2016, the share of Non-Hispanic Black population in the city increased from 0.7 percent to 1.0 percent.
9.3%
10.9%11.5%
0%
2%
4%
6%
8%
10%
12%
14%
2000 2010 2016
Share of City Population
0.7%
0.9%
1.0%
0.0%
0.2%
0.4%
0.6%
0.8%
1.0%
1.2%
2000 2010 2016
Share of City Population

2017 Local Profile City of Huntington Beach
Southern California Association of Governments
8
Non-Hispanic American Indian: 2000, 2010, and 2016
Sources: 2000 and 2010 U.S. Decennial Census; Nielsen Co., 2016
Between 2000 and 2016, the share of Non-Hispanic American Indian population in the city decreased from 0.4 percent to 0.3 percent.
All Other Non-Hispanic: 2000, 2010, and 2016
Sources: 2000 and 2010 U.S. Decennial Census; Nielsen Co., 2016
Between 2000 and 2016, the share of All Other Non-Hispanic population group in the city increased from 3.1 percent to 4.1 percent.
0.4%
0.3%
0.3%
0.0%
0.1%
0.2%
0.3%
0.4%
0.5%
2000 2010 2016
Share of City Population
3.1%
3.7%
4.1%
0%
1%
2%
3%
4%
5%
2000 2010 2016
Share of City Population

2017 Local Profile City of Huntington Beach
Southern California Association of Governments
9
III. Households Number of Households (Occupied Housing Units) Number of Households: 2000 - 2016
Sources: 2000 and 2010 U.S. Decennial Census; California Department of Finance, E-5, 2016
Between 2000 and 2016, the total number of households in the City of Huntington Beach increased by 1,277 units, or 1.7 percent.
During this 16-year period, the city’s household growth rate of 1.7 percent was lower than the county growth rate of 9.6 percent.
7.3 percent of Orange County’s total number of households are in the City of Huntington Beach.
In 2016, the city’s average household size was 2.6, lower than the county average of 3.1.
Average Household Size: 2000 - 2016
Source: California Department of Finance, E-5, 2016
0
10,000
20,000
30,000
40,000
50,000
60,000
70,000
80,000
2000 2002 2004 2006 2008 2010 2012 2014 2016
Num
ber o
f Hou
seho
lds
0.0
0.5
1.0
1.5
2.0
2.5
3.0
3.5
2000 2002 2004 2006 2008 2010 2012 2014 2016
Ave
rage
Hou
seho
ld S
ize
Huntington Beach Orange County

2017 Local Profile City of Huntington Beach
Southern California Association of Governments
10
Households by Size
Percent of Households by Household Size: 2016
Source: Nielsen Co., 2016
In 2016, 76.8 percent of all city households had 3 people or fewer.
About 25 percent of the households were single-person households.
Approximately 9 percent of all households in the city had 5 people or more.
Households by Income
Percent of Households by Household Income: 2016
Source: Nielsen Co., 2016
In 2016, about 29 percent of households earned less than $50,000 annually.
Approximately 42 percent of households earned $100,000 or more.
25%
35%
17%14%
6%
2% 1%
0%
5%
10%
15%
20%
25%
30%
35%
40%
1 2 3 4 5 6 7 or More
Shar
e of
Hou
seho
lds
Number of Persons
7% 6% 7%
10%
16%
13%
19%
14%
6%
3%
0%
2%
4%
6%
8%
10%
12%
14%
16%
18%
20%
Shar
e of
Hou
seho
lds
2017 Local Profile City of Huntington Beach
Southern California Association of Governments
11
Household Income
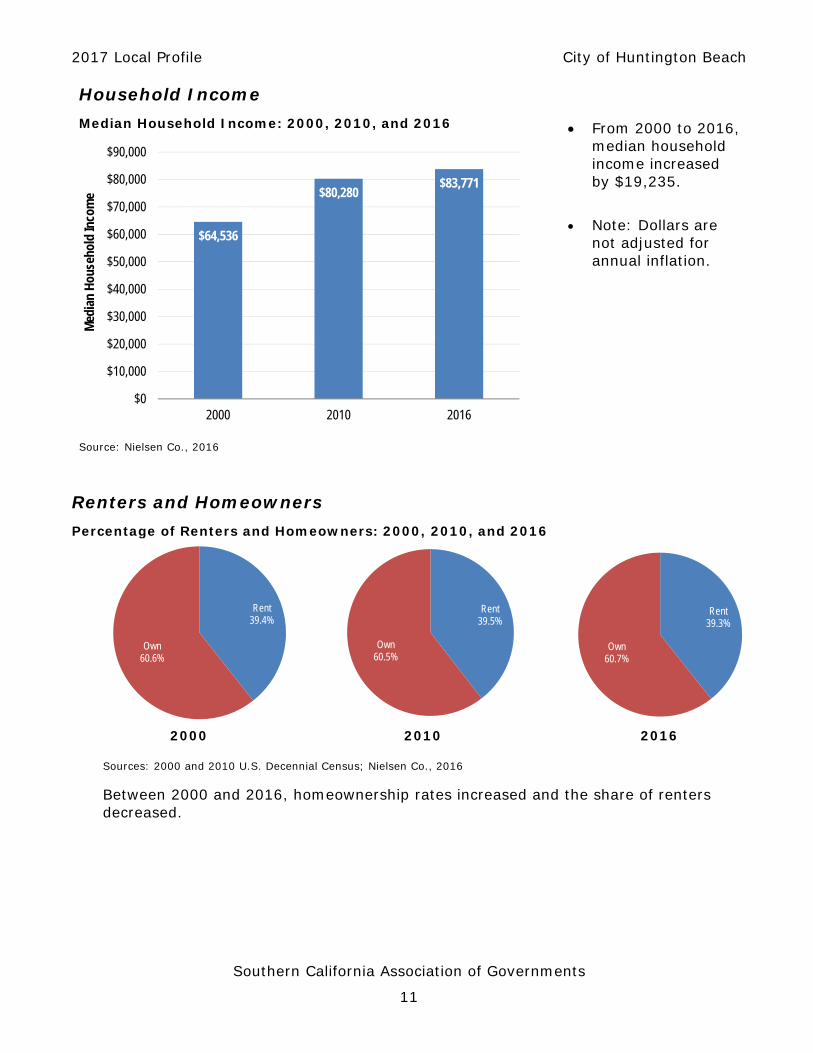
Median Household Income: 2000, 2010, and 2016
Source: Nielsen Co., 2016
From 2000 to 2016, median household income increased by $19,235.
Note: Dollars are not adjusted for annual inflation.
Renters and Homeowners Percentage of Renters and Homeowners: 2000, 2010, and 2016
2000 2010 2016
Sources: 2000 and 2010 U.S. Decennial Census; Nielsen Co., 2016 Between 2000 and 2016, homeownership rates increased and the share of renters decreased.
$64,536
$80,280$83,771
$0
$10,000
$20,000
$30,000
$40,000
$50,000
$60,000
$70,000
$80,000
$90,000
2000 2010 2016
Med
ian
Hou
seho
ld In
com
e
Rent39.4%
Own60.6%
Rent39.5%
Own60.5%
Rent39.3%
Own60.7%
2017 Local Profile City of Huntington Beach
Southern California Association of Governments
12
IV. Housing Total Housing Production
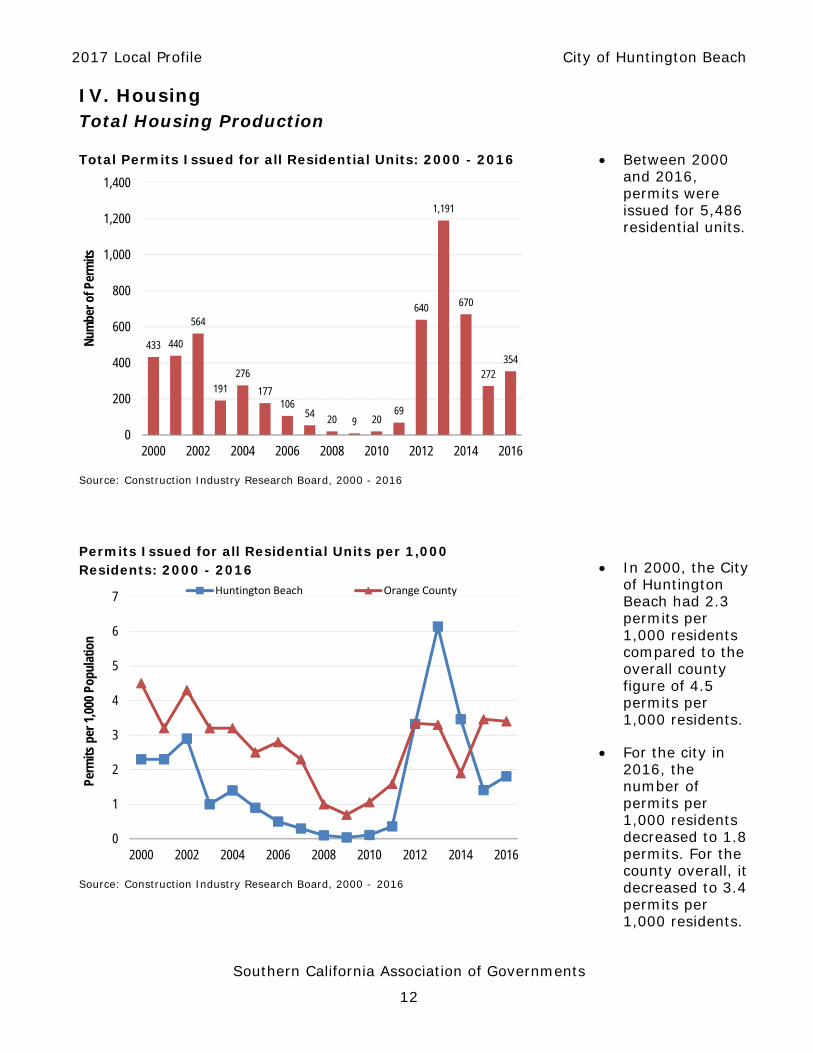
Total Permits Issued for all Residential Units: 2000 - 2016
Source: Construction Industry Research Board, 2000 - 2016
Between 2000 and 2016, permits were issued for 5,486 residential units.
Permits Issued for all Residential Units per 1,000 Residents: 2000 - 2016
Source: Construction Industry Research Board, 2000 - 2016
In 2000, the City of Huntington Beach had 2.3 permits per 1,000 residents compared to the overall county figure of 4.5 permits per 1,000 residents.
For the city in 2016, the number of permits per 1,000 residents decreased to 1.8 permits. For the county overall, it decreased to 3.4 permits per 1,000 residents.
433 440
564
191
276
177106
54 20 9 2069
640
1,191
670
272354
0
200
400
600
800
1,000
1,200
1,400
2000 2002 2004 2006 2008 2010 2012 2014 2016
Num
ber o
f Per
mits
0
1
2
3
4
5
6
7
2000 2002 2004 2006 2008 2010 2012 2014 2016
Perm
its p
er 1
,000
Pop
ulat
ion
Huntington Beach Orange County

2017 Local Profile City of Huntington Beach
Southern California Association of Governments
13
Single-Family Housing Production Permits Issued for Single-Family Units: 2000 - 2016
Source: Construction Industry Research Board, 2000 - 2016
Between 2000 and 2016, permits were issued for 2,010 single family homes.
11.4 percent of these were issued in the last 3 years.
Single-Family Permits Issued per 1,000 Residents: 2000 - 2016
Source: Construction Industry Research Board, 2000 - 2016
In 2000, the City of Huntington Beach issued 2.3 permits per 1,000 residents compared to the overall county figure of 2.4 permits per 1,000 residents.
For the city in 2016, the number of permits issued per 1,000 residents decreased to 0.3 permits. For the county overall, it decreased to 1.2 permits per 1,000 residents.
427
378
242
132
191
137
78
50
209 4
2438
50 54
125
51
0
50
100
150
200
250
300
350
400
450
2000 2002 2004 2006 2008 2010 2012 2014 2016
Number of Perm
its
0.0
0.5
1.0
1.5
2.0
2.5
3.0
2000 2002 2004 2006 2008 2010 2012 2014 2016
Perm
its per 1,000 Residents
Huntington Beach Orange County

2017 Local Profile City of Huntington Beach
Southern California Association of Governments
14
Multi-Family Housing Production
Permits Issued for Multi-Family Units: 2000 - 2016
Source: Construction Industry Research Board, 2000-2016
Between 2000 and 2016, there were permits issued for 3,448 multi-family residential units.
Multi-Family Permits Issued per 1,000 Residents: 2000 - 2016
Source: Construction Industry Research Board, 2000-2016
For the city in 2016, the number of permits per 1,000 residents increased to 1.6 permits. For the county overall, it increased to 2.2 permits per 1,000 residents.
662
322
59 8540
0 4 0 0 1645
602
1,141
616
147
303
0
200
400
600
800
1,000
1,200
2000 2002 2004 2006 2008 2010 2012 2014 2016
Number of Perm
its
0
1
2
3
4
5
6
7
2000 2002 2004 2006 2008 2010 2012 2014 2016
Perm
its p
er 1
,000
Pop
ulat
ion
Huntington Beach Orange County
2017 Local Profile City of Huntington Beach
Southern California Association of Governments
15
Home Sales Prices
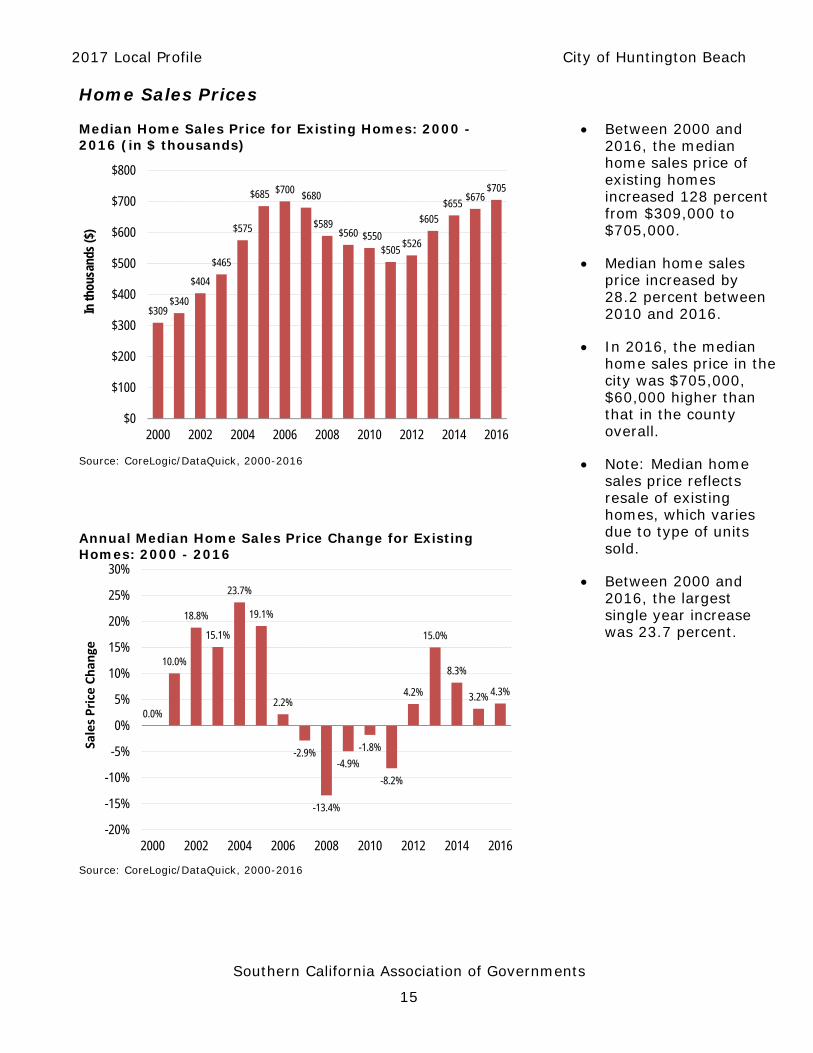
Median Home Sales Price for Existing Homes: 2000 - 2016 (in $ thousands)
Source: CoreLogic/DataQuick, 2000-2016
Annual Median Home Sales Price Change for Existing Homes: 2000 - 2016
Source: CoreLogic/DataQuick, 2000-2016
Between 2000 and 2016, the median home sales price of existing homes increased 128 percent from $309,000 to $705,000.
Median home sales price increased by 28.2 percent between 2010 and 2016.
In 2016, the median home sales price in the city was $705,000, $60,000 higher than that in the county overall.
Note: Median home sales price reflects resale of existing homes, which varies due to type of units sold.
Between 2000 and 2016, the largest single year increase was 23.7 percent.
$309$340
$404
$465
$575
$685 $700$680
$589$560 $550
$505$526
$605
$655$676
$705
$0
$100
$200
$300
$400
$500
$600
$700
$800
2000 2002 2004 2006 2008 2010 2012 2014 2016
In th
ousa
nds
($)
0.0%
10.0%
18.8%
15.1%
23.7%
19.1%
2.2%
-2.9%
-13.4%
-4.9%
-1.8%
-8.2%
4.2%
15.0%
8.3%
3.2% 4.3%
-20%
-15%
-10%
-5%
0%
5%
10%
15%
20%
25%
30%
2000 2002 2004 2006 2008 2010 2012 2014 2016
Sales Price Chan
ge
2017 Local Profile City of Huntington Beach
Southern California Association of Governments
16
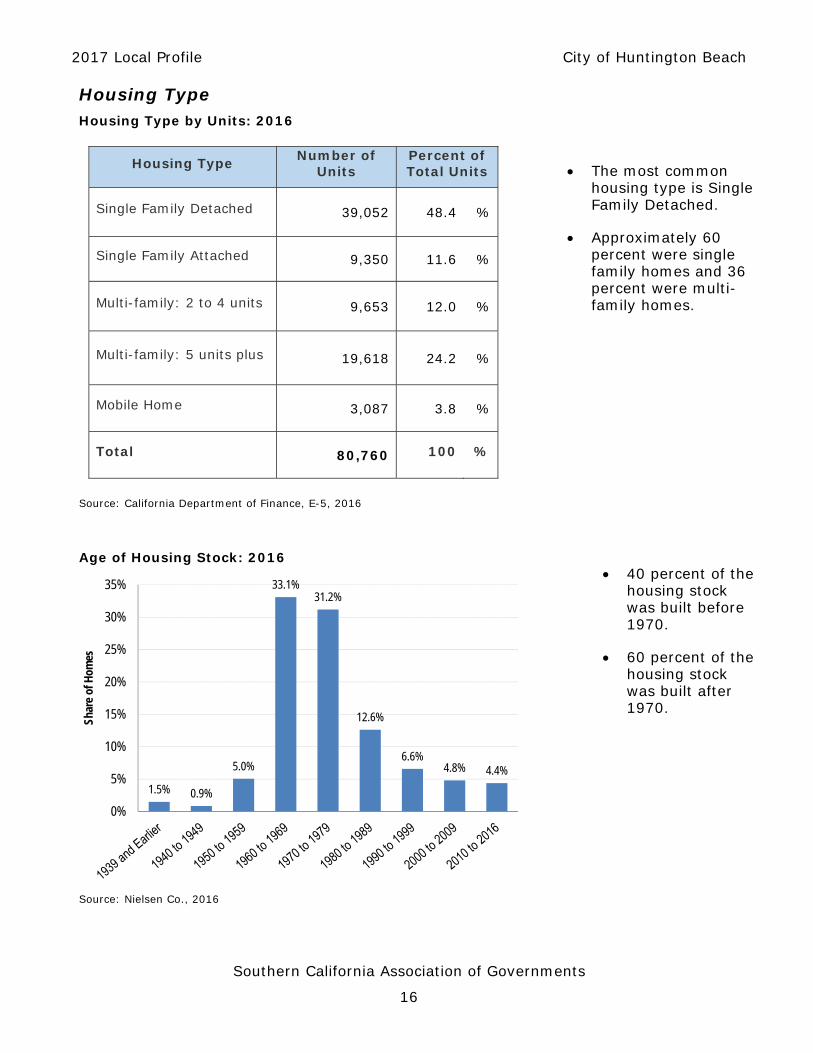
Housing Type Housing Type by Units: 2016
Housing Type Number of Units
Percent of Total Units
Single Family Detached 39,052 48.4 %
Single Family Attached 9,350 11.6 %
Multi-family: 2 to 4 units 9,653 12.0 %
Multi-family: 5 units plus 19,618 24.2 %
Mobile Home 3,087 3.8 %
Total 80,760 100 %
Source: California Department of Finance, E-5, 2016
The most common housing type is Single Family Detached.
Approximately 60 percent were single family homes and 36 percent were multi-family homes.
Age of Housing Stock: 2016
Source: Nielsen Co., 2016
40 percent of the housing stock was built before 1970.
60 percent of the housing stock was built after 1970.
1.5% 0.9%
5.0%
33.1%31.2%
12.6%
6.6%4.8% 4.4%
0%
5%
10%
15%
20%
25%
30%
35%
Shar
e of
Hom
es

2017 Local Profile City of Huntington Beach
Southern California Association of Governments
17
Foreclosures Number of Foreclosures: 2016
There were 40 foreclosures in 2016.
Between 2007 and 2016, there were 1,950 foreclosures.
Source: CoreLogic/DataQuick, 2002-2016
Housing Cost Share Percentage of Housing Cost for Renters and Homeowners: 2014
Housing costs
accounted for an average of 31.4 percent of total household income for renters.
Housing costs accounted for an average of 23.1 percent of total household income for homeowners.
Source: U.S. Census American Community Survey, 2015
15 9 7 820
134
356
315
340354
214
8367
47 40
0
50
100
150
200
250
300
350
400
2002 2004 2006 2008 2010 2012 2014 2016
Number of Foreclosures
31.4%
23.1%
0%
5%
10%
15%
20%
25%
30%
35%
Renters Homeowners
Housing Cost Share
2017 Local Profile City of Huntington Beach
Southern California Association of Governments
18
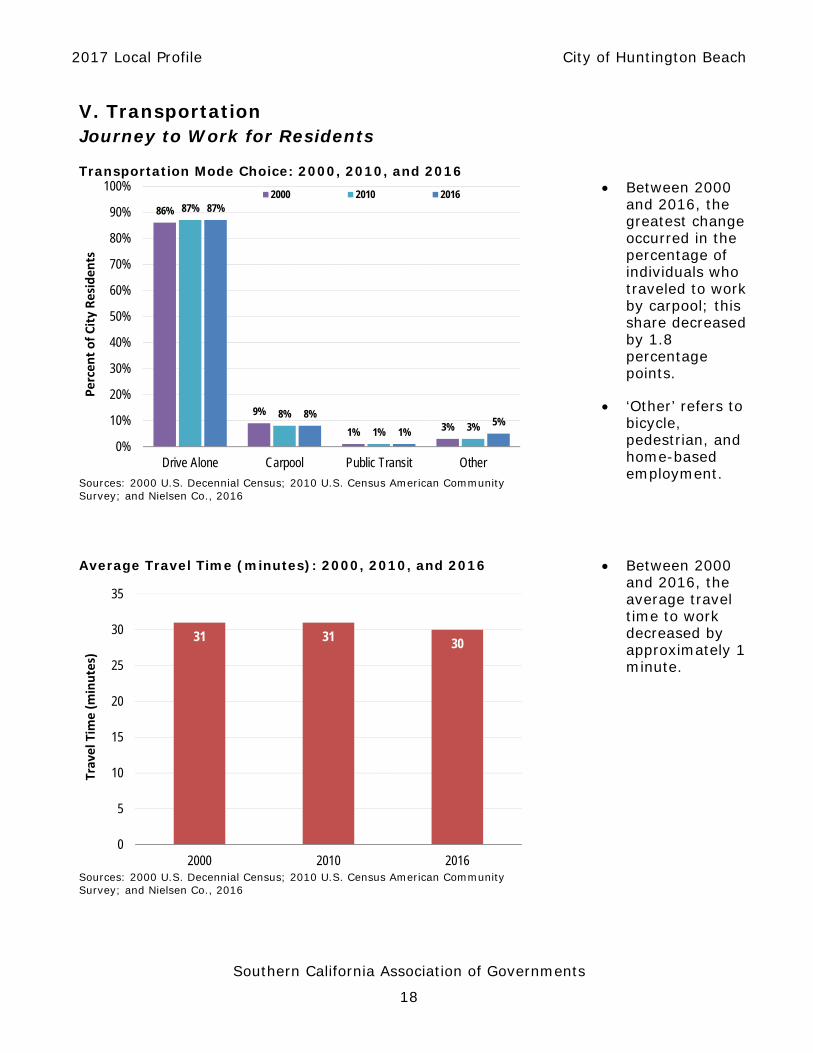
V. Transportation Journey to Work for Residents Transportation Mode Choice: 2000, 2010, and 2016
Sources: 2000 U.S. Decennial Census; 2010 U.S. Census American Community Survey; and Nielsen Co., 2016
Between 2000 and 2016, the greatest change occurred in the percentage of individuals who traveled to work by carpool; this share decreased by 1.8 percentage points.
‘Other’ refers to bicycle, pedestrian, and home-based employment.
Average Travel Time (minutes): 2000, 2010, and 2016
Sources: 2000 U.S. Decennial Census; 2010 U.S. Census American Community Survey; and Nielsen Co., 2016
Between 2000 and 2016, the average travel time to work decreased by approximately 1 minute.
86%
9%
1% 3%
87%
8%
1% 3%
87%
8%
1%5%
0%
10%
20%
30%
40%
50%
60%
70%
80%
90%
100%
Drive Alone Carpool Public Transit Other
Percent of City Residents
2000 2010 2016
31 31 30
0
5
10
15
20
25
30
35
2000 2010 2016
Travel Tim
e (minutes)
2017 Local Profile City of Huntington Beach
Southern California Association of Governments
19
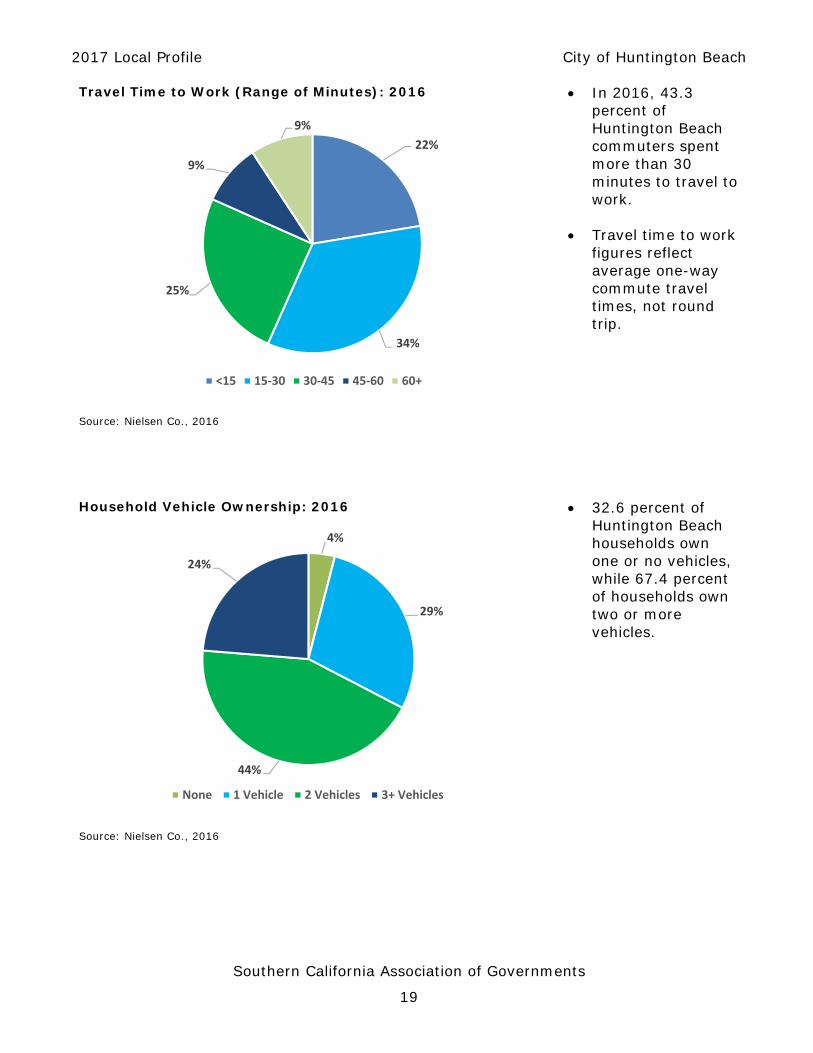
Travel Time to Work (Range of Minutes): 2016
In 2016, 43.3 percent of Huntington Beach commuters spent more than 30 minutes to travel to work.
Travel time to work figures reflect average one-way commute travel times, not round trip.
Source: Nielsen Co., 2016
Household Vehicle Ownership: 2016
32.6 percent of Huntington Beach households own one or no vehicles, while 67.4 percent of households own two or more vehicles.
Source: Nielsen Co., 2016
22%
34%
25%
9%
9%
<15 15‐30 30‐45 45‐60 60+
4%
29%
44%
24%
None 1 Vehicle 2 Vehicles 3+ Vehicles

2017 Local Profile City of Huntington Beach
Southern California Association of Governments
20
VI. Active Transportation
Over the course of the next 25 years, population growth and demographic shifts will continue to transform the character of the SCAG region and the demands placed on it for livability, mobility, and overall quality of life. Our future will be shaped by our response to this growth and the demands it places on our systems.
SCAG is responding to these challenges by embracing sustainable mobility options, including support for enhanced active transportation infrastructure. Providing appropriate facilities to help make walking and biking more attractive and safe transportation options will serve our region through reduction of traffic congestion, decreasing greenhouse gas emissions, improving public health, and enhancing community cohesion.
Beginning with the 2017 Local Profiles, SCAG will be providing information on the active transportation resources being implemented throughout our region. The 2017 Local Profiles initiates this enhanced active transportation element with a compilation of bicycle lane mileage by facility type at the county level. This data, provided by our County Transportation Commissions for the year 2012, will serve as a baseline to measure regional progress over subsequent years. It is expected that with each cycle of the Local Profiles, additional active transportation data resources will become available for inclusion in these reports at the local jurisdictional level. Information on rates of physical activity (walking) is available in the Public Health section of this report.
Bike Lane Mileage by Class: 2012
County Class 1 Class 2 Class 3 Class 4 Total Miles
Imperial 3 4 82 0 89
Los Angeles 302 659 519 2 1,482
Orange 259 706 87 0 1,052
Riverside 44 248 129 0 421
San Bernardino 77 276 150 0 503
Ventura 61 257 54 0 372
SCAG Region 746 2,150 1,021 2 3,919
Source: County Transportation Commissions, 2012
Class 1 (Bike Path): Separated off-road path for the exclusive use of bicycles and pedestrians.
Class 2 (Bike Lane): Striped on-road lane for bike travel along a roadway.
Class 3 (Bike Route): Roadway dedicated for shared use by pedestrians, bicyclists, and motor vehicles.
Class 4 (Separated Bikeway): Lane(s) separated from vehicle traffic by more than striping, with physical barriers such as grade separation, landscaping, or parking.
2017 Local Profile City of Huntington Beach
Southern California Association of Governments
21
VII. Employment Employment Centers
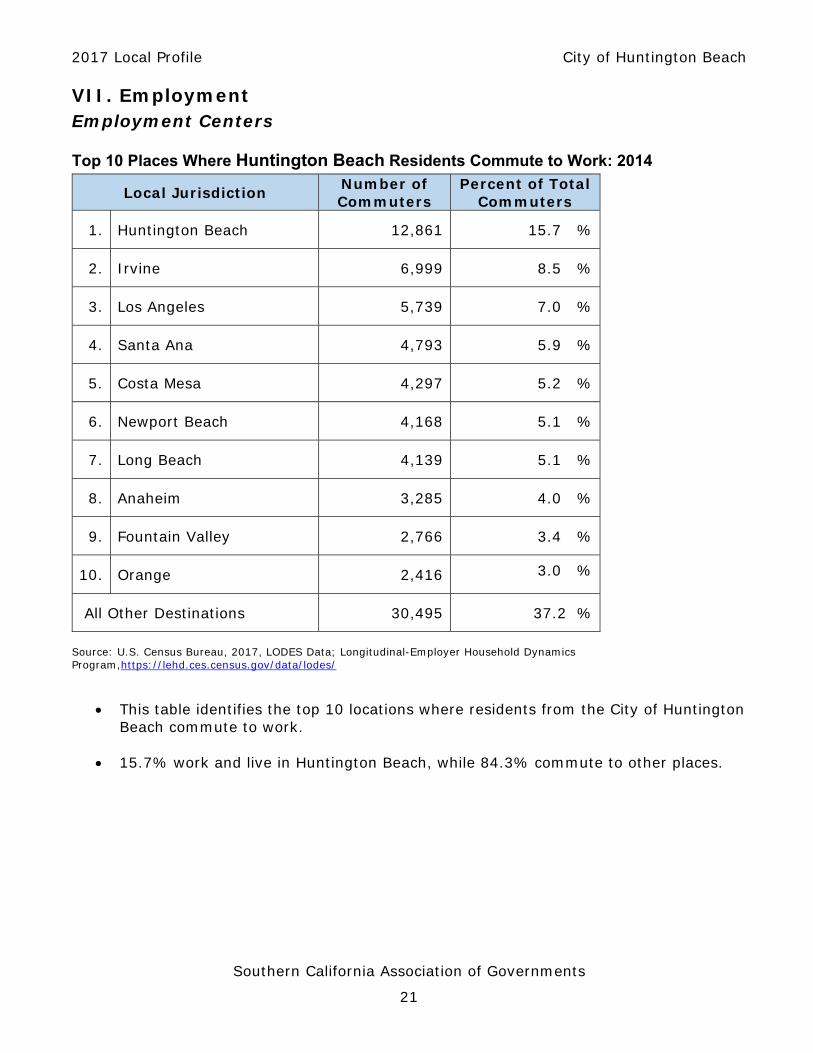
Top 10 Places Where Huntington Beach Residents Commute to Work: 2014
Local Jurisdiction Number of Commuters
Percent of Total Commuters
1. Huntington Beach 12,861 15.7 %
2. Irvine 6,999 8.5 %
3. Los Angeles 5,739 7.0 %
4. Santa Ana 4,793 5.9 %
5. Costa Mesa 4,297 5.2 %
6. Newport Beach 4,168 5.1 %
7. Long Beach 4,139 5.1 %
8. Anaheim 3,285 4.0 %
9. Fountain Valley 2,766 3.4 %
10. Orange 2,416 3.0 %
All Other Destinations 30,495 37.2 %
Source: U.S. Census Bureau, 2017, LODES Data; Longitudinal-Employer Household Dynamics Program,https://lehd.ces.census.gov/data/lodes/
This table identifies the top 10 locations where residents from the City of Huntington Beach commute to work.
15.7% work and live in Huntington Beach, while 84.3% commute to other places.

2017 Local Profile City of Huntington Beach
Southern California Association of Governments
22

2017 Local Profile City of Huntington Beach
Southern California Association of Governments
23

2017 Local Profile City of Huntington Beach
Southern California Association of Governments
24
Total Jobs Total Jobs: 2007 - 2015
Sources: California Employment Development Department, 2007 - 2015; InfoGroup; and SCAG
Total jobs include wage and salary jobs and jobs held by business owners and self-employed persons. The total job count does not include unpaid volunteers or family workers, and private household workers.
In 2015, total jobs in the City of Huntington Beach numbered 79,420, a decrease of 6.3 percent from 2007.
Jobs by Sector Jobs in Manufacturing: 2007 - 2015
Sources: California Employment Development Department, 2007 - 2015; InfoGroup; and SCAG
Manufacturing jobs include those employed in various sectors including food; apparel; metal; petroleum and coal; machinery; computer and electronic products; and transportation equipment.
Between 2007 and 2015, the number of manufacturing jobs in the city decreased by 15.6 percent.
84,778 82,760
76,306 75,138 76,002 75,841 78,028 78,724 79,420
0
10,000
20,000
30,000
40,000
50,000
60,000
70,000
80,000
90,000
2007 2008 2009 2010 2011 2012 2013 2014 2015
Num
ber o
f Job
s
11,08210,698
9,510 9,240 9,4388,994 8,976 9,246 9,349
0
2,000
4,000
6,000
8,000
10,000
12,000
2007 2008 2009 2010 2011 2012 2013 2014 2015
Num
ber o
f Job
s
2017 Local Profile City of Huntington Beach
Southern California Association of Governments
25
Jobs in Construction: 2007 - 2015
Sources: California Employment Development Department, 2007 - 2015; InfoGroup; and SCAG
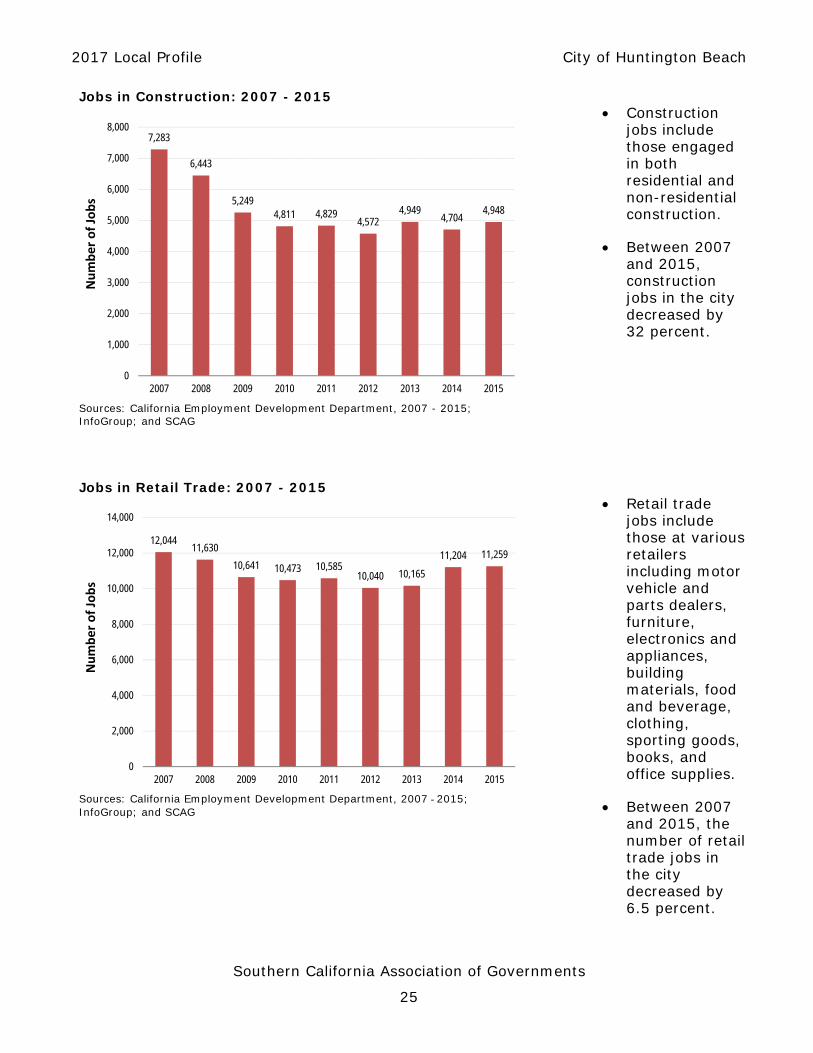
Construction jobs include those engaged in both residential and non-residential construction.
Between 2007 and 2015, construction jobs in the city decreased by 32 percent.
Jobs in Retail Trade: 2007 - 2015
Sources: California Employment Development Department, 2007 - 2015; InfoGroup; and SCAG
Retail trade jobs include those at various retailers including motor vehicle and parts dealers, furniture, electronics and appliances, building materials, food and beverage, clothing, sporting goods, books, and office supplies.
Between 2007 and 2015, the number of retail trade jobs in the city decreased by 6.5 percent.
7,283
6,443
5,2494,811 4,829
4,5724,949
4,7044,948
0
1,000
2,000
3,000
4,000
5,000
6,000
7,000
8,000
2007 2008 2009 2010 2011 2012 2013 2014 2015
Number of Jobs
12,04411,630
10,641 10,473 10,58510,040 10,165
11,204 11,259
0
2,000
4,000
6,000
8,000
10,000
12,000
14,000
2007 2008 2009 2010 2011 2012 2013 2014 2015
Number of Jobs

2017 Local Profile City of Huntington Beach
Southern California Association of Governments
26
Jobs in Professional and Management: 2007 - 2015
Sources: California Employment Development Department, 2007 - 2015; InfoGroup; and SCAG
Jobs in the professional and management sector include those employed in professional and technical services, management of companies, and administration and support.
Between 2007 and 2015, the number of professional and management jobs in the city decreased by 10.9 percent.
12,080 11,801
10,646 10,793 10,936
10,006 10,18310,725 10,758
0
2,000
4,000
6,000
8,000
10,000
12,000
14,000
2007 2008 2009 2010 2011 2012 2013 2014 2015
Num
ber o
f Job
s

2017 Local Profile City of Huntington Beach
Southern California Association of Governments
27
Jobs by Sector: 2007
Sources: California Employment Development Department, 2007; InfoGroup; and SCAG.
From 2007 to 2015, the share of Leisure jobs increased from 12.2 percent to 15.6 percent.
See Methodology Section for industry sector definitions.
Jobs by Sector: 2015
Sources: California Employment Development Department, 2016; InfoGroup; and SCAG.
In 2015, the Education sector was the largest job sector, accounting for 16.8 percent of total jobs in the city.
Other large sectors included Leisure (15.6 percent), Retail (14.1 percent), and Professional (13.4 percent).
Agriculture0.3%
Construction8.6%
Manufacturing13.1%
Wholesale7.6%
Retail14.2%
Transportation2.8%
Information1.4%
Finance6.4%
Professional14.3%
Education13.9%
Leisure12.2%
Other4.3%
Public1.0%
Agriculture0.2%
Construction6.2%
Manufacturing11.7%
Wholesale6.6%
Retail14.1%
Transportation3.1%
Information1.1%Finance
6.5%
Professional13.4%
Education16.8%
Leisure15.6%
Other3.8%
Public0.9%
2017 Local Profile City of Huntington Beach
Southern California Association of Governments
28
Average Salaries
Average Annual Salary: 2003, 2009, 2011, and 2015
Source: California Employment Development Department, 2003 - 2015
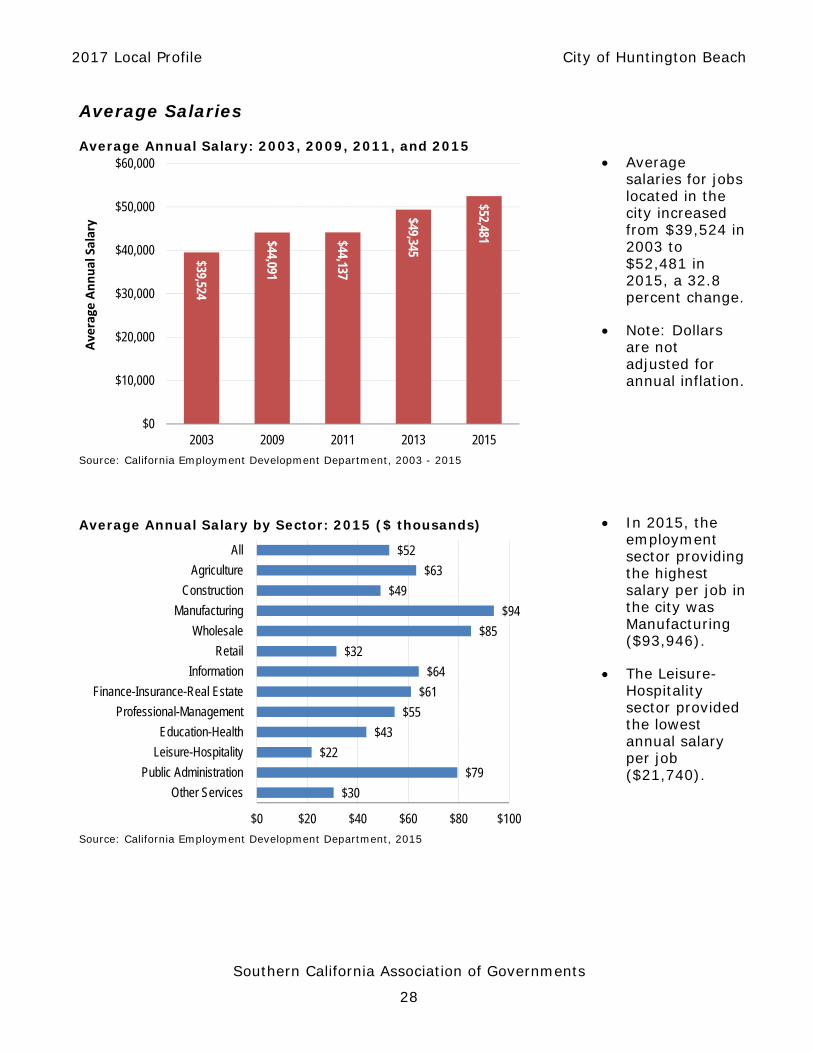
Average salaries for jobs located in the city increased from $39,524 in 2003 to $52,481 in 2015, a 32.8 percent change.
Note: Dollars are not adjusted for annual inflation.
Average Annual Salary by Sector: 2015 ($ thousands)
Source: California Employment Development Department, 2015
In 2015, the employment sector providing the highest salary per job in the city was Manufacturing ($93,946).
The Leisure-Hospitality sector provided the lowest annual salary per job ($21,740).
$39,524
$44,091
$44,137
$49,345
$52,481
$0
$10,000
$20,000
$30,000
$40,000
$50,000
$60,000
2003 2009 2011 2013 2015
Average
Annual Salary
$52
$63
$49
$94
$85
$32
$64
$61
$55
$43
$22
$79
$30
$0 $20 $40 $60 $80 $100
All
Agriculture
Construction
Manufacturing
Wholesale
Retail
Information
Finance-Insurance-Real Estate
Professional-Management
Education-Health
Leisure-Hospitality
Public Administration
Other Services

2017 Local Profile City of Huntington Beach
Southern California Association of Governments
29
VIII. Retail Sales
Real Retail Sales
Retail Sales (in 2015 $ millions): 2001 - 2015
Source: California Board of Equalization, 2001-2015
Real (inflation adjusted) retail sales in the City of Huntington Beach remained unchanged between 2005 and 2015.
Retail Sales per Person (in 2015 $ thousands): 2001 - 2015
Source: California Board of Equalization, 2001-2015
Between 2001 and 2015, retail sales per person for the city increased from $12,400 to $13,267.
$2,371 $2,396$2,461
$2,620$2,556 $2,575
$2,461
$2,174
$1,913$1,971
$2,173
$2,503$2,366 $2,412
$2,554
$0
$500
$1,000
$1,500
$2,000
$2,500
$3,000
2001 2003 2005 2007 2009 2011 2013 2015
Sale
s in
201
5 $
mill
ions
$0
$2
$4
$6
$8
$10
$12
$14
$16
$18
2001 2003 2005 2007 2009 2011 2013 2015
Sale
s in
201
5 $
thou
sand
s
Huntington Beach Orange County

2017 Local Profile City of Huntington Beach
Southern California Association of Governments
30
IX. Education
Total Student Enrollment
K-12 Public School Student Enrollment: 2000 - 2016
Source: California Department of Education, 2000 - 2016
Between 2000 and 2016, total K-12 public school enrollment for schools within the City of Huntington Beach increased by 399 students, or about 1.5 percent.
Student Enrollment by Grade
K-6 Public School Student Enrollment: 2000 - 2016
Source: California Department of Education, 2000 - 2016
Between 2000 and 2016, total public elementary school enrollment decreased by 741 students or 5.3 percent.
26,867 27,271 27,696 27,746 27,507 27,744 28,106 28,03427,266
0
5,000
10,000
15,000
20,000
25,000
30,000
2000 2002 2004 2006 2008 2010 2012 2014 2016
Number of Students
14,032 14,219 13,92513,398 13,112 13,479 13,785 13,724
13,291
0
2,000
4,000
6,000
8,000
10,000
12,000
14,000
16,000
2000 2002 2004 2006 2008 2010 2012 2014 2016
Number of Students
2017 Local Profile City of Huntington Beach
Southern California Association of Governments
31
Grades 7-9 Public School Student Enrollment: 2000 - 2016
Source: California Department of Education, 2000 - 2016
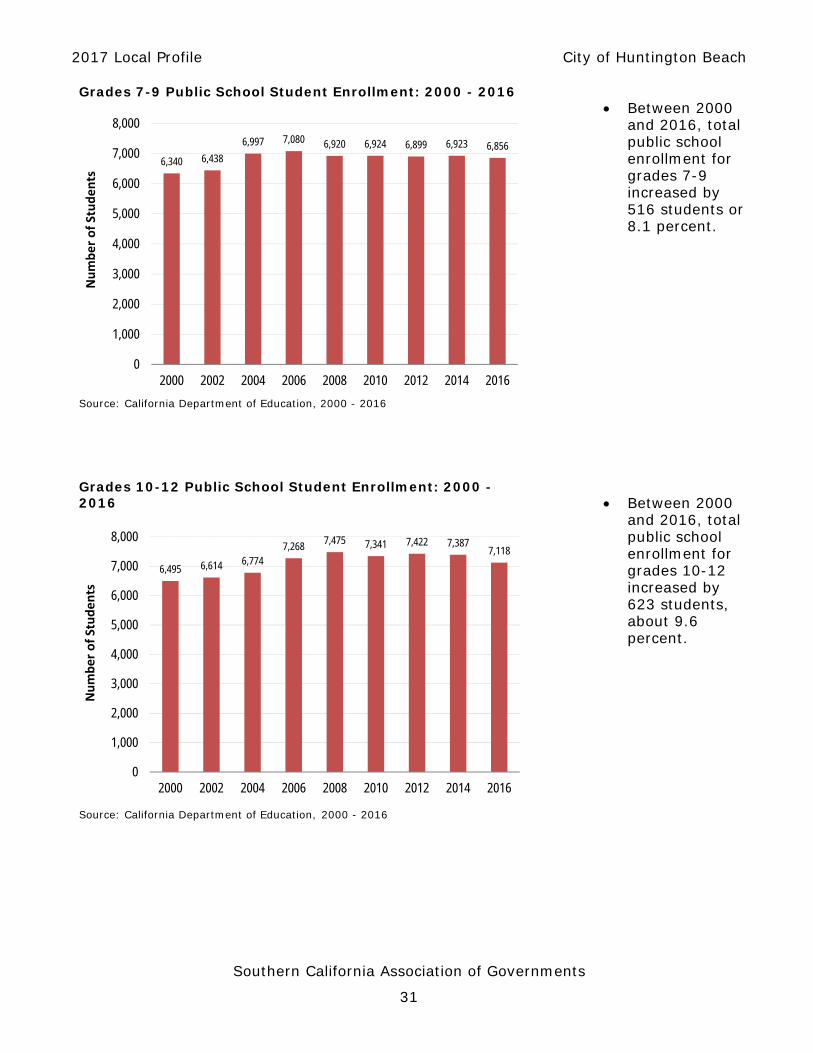
Between 2000 and 2016, total public school enrollment for grades 7-9 increased by 516 students or 8.1 percent.
Grades 10-12 Public School Student Enrollment: 2000 - 2016
Source: California Department of Education, 2000 - 2016
Between 2000 and 2016, total public school enrollment for grades 10-12 increased by 623 students, about 9.6 percent.
6,340 6,438
6,997 7,080 6,920 6,924 6,899 6,923 6,856
0
1,000
2,000
3,000
4,000
5,000
6,000
7,000
8,000
2000 2002 2004 2006 2008 2010 2012 2014 2016
Number of Students
6,495 6,614 6,7747,268 7,475 7,341 7,422 7,387
7,118
0
1,000
2,000
3,000
4,000
5,000
6,000
7,000
8,000
2000 2002 2004 2006 2008 2010 2012 2014 2016
Number of Students
2017 Local Profile City of Huntington Beach
Southern California Association of Governments
32
Percent of City Population 25 Years & Over Completing High School or Higher
Sources: 2000 and 2010 Census; Nielsen Co., 2016
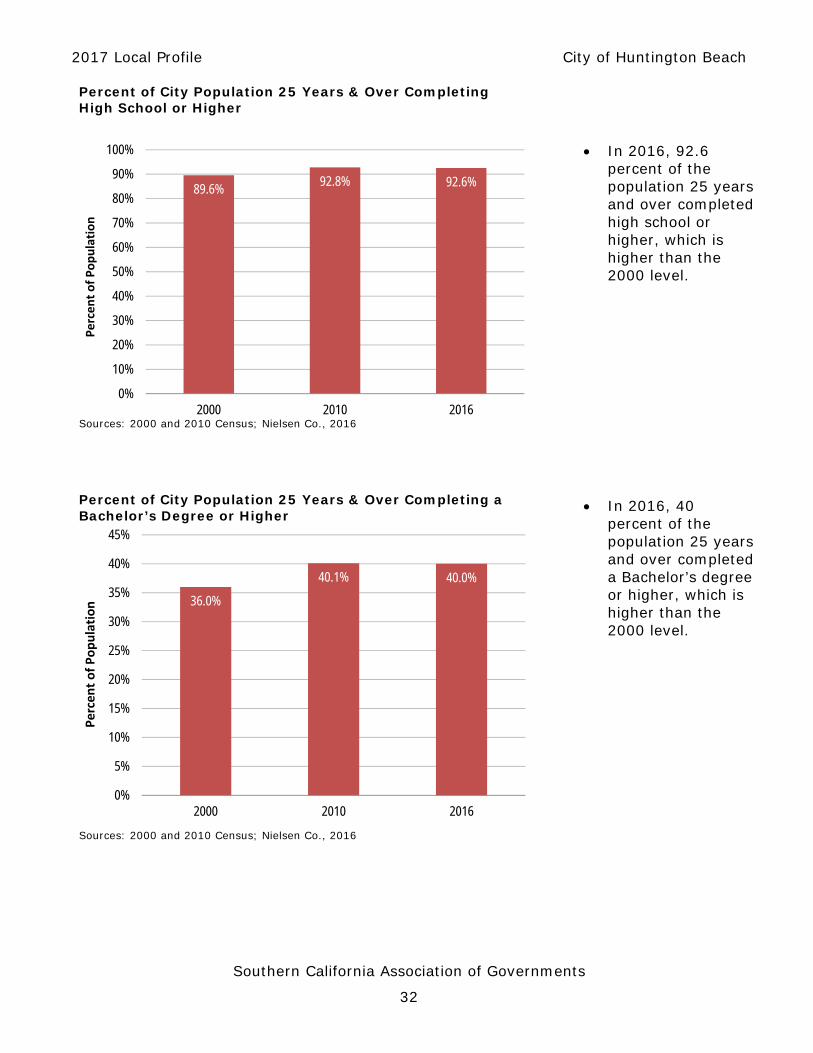
In 2016, 92.6
percent of the population 25 years and over completed high school or higher, which is higher than the 2000 level.
Percent of City Population 25 Years & Over Completing a Bachelor’s Degree or Higher
In 2016, 40 percent of the population 25 years and over completed a Bachelor’s degree or higher, which is higher than the 2000 level.
Sources: 2000 and 2010 Census; Nielsen Co., 2016
89.6%92.8% 92.6%
0%
10%
20%
30%
40%
50%
60%
70%
80%
90%
100%
2000 2010 2016
Percent of Population
36.0%
40.1% 40.0%
0%
5%
10%
15%
20%
25%
30%
35%
40%
45%
2000 2010 2016
Percent of Population

2017 Local Profile City of Huntington Beach
Southern California Association of Governments
33
X. Public Health
Beginning with the 2017 edition, the Local Profiles will be providing information on public health performance at the local jurisdictional level. Many adverse public health outcomes related to obesity and poor air quality may be reduced through the implementation of a more sustainable and integrated program of community and transportation planning at the regional and local levels. Evidence has shown that built environment factors play an important role in supporting healthy behavior and reducing rates of chronic diseases and obesity. For example, improved active transportation infrastructure, better accessibility to recreational open space, and the development of more walkable communities enhance opportunities for physical exercise and thereby result in a reduction of obesity rates, along with the chronic diseases associated with physical inactivity. Obesity/Physical Activity Rates (18 & Over): 2014
Source: California Health Interview Survey, 2016
The obesity rate in the City of Huntington Beach was 16.1 percent in 2014, which was lower than the County rate.
‘Obesity’ is defined as a Body Mass Index (BMI) of 30 or higher.
‘Physical Activity’ refers to walking a minimum of 150 minutes per week.
Chronic Disease Rate (18 Years & Over): 2014
Source: California Health Interview Survey, 2016
The share of population in the City of Huntington Beach who were ever diagnosed with asthma was 15.4 percent in 2014; for diabetes the rate was 6.3 percent; and for heart disease 5.9 percent.
16.1%
31.5%
18.4%
31.3%
0%
5%
10%
15%
20%
25%
30%
35%
Obesity Physical Activity
Share of Population
Huntington Beach Orange County
15.4%
6.3% 5.9%
14.3%
7.4%
5.6%
0%
2%
4%
6%
8%
10%
12%
14%
16%
18%
Asthma Diabetes Heart Disease
Share of Population
Huntington Beach Orange County

2017 Local Profile City of Huntington Beach
Southern California Association of Governments
34
XI. SCAG Regional Highlights
Regional Median Sales Price for Existing Homes: 2002 - 2016
Source: CoreLogic/DataQuick, 2002-2016
After reaching its peak in 2007, the median sales price for existing homes in the SCAG region dropped by almost half by 2009.
In 2016, the median sales price had rebounded by about 69 percent from the 2009 low to $466,000.
Median home sales price was calculated based on total existing home sales in the SCAG region.
Regional Retail Sales: 2005 - 2015
Source: California Board of Equalization, 2005-2015
Retail sales tend to follow closely with trends in personal income, employment rates, and consumer confidence.
Before 2005, real (inflation adjusted) retail sales increased steadily by 11 percent before dropping by about 25 percent between 2005 and 2009.
In 2015, total real retail sales in the SCAG region increased by about 29 percent since 2009.
$279,000
$330,000
$410,000
$491,000
$531,000
$552,000
$387,000 $276,000
$291,000
$280,000
$298,000
$372,000
$426,000
$437,000
$466,000
$0
$100,000
$200,000
$300,000
$400,000
$500,000
$600,000
2002 2004 2006 2008 2010 2012 2014 2016
Median Sales Price
$217,261
$216,331
$208,283
$184,918
$162,229
$170,205
$179,957
$188,947
$191,583
$201,621
$209,454
$0
$25,000
$50,000
$75,000
$100,000
$125,000
$150,000
$175,000
$200,000
$225,000
$250,000
2005 2007 2009 2011 2013 2015
In 2015 $ M
illions

2017 Local Profile City of Huntington Beach
Southern California Association of Governments
35
XII. Data Sources California Department of Education
California Department of Finance, Demographic Research Unit
California Employment Development Department, Labor Market Information Division
California State Board of Equalization
Construction Industry Research Board
InfoGroup
CoreLogic/DataQuick
Nielsen Company
U.S. Census Bureau
California Health Interview Survey

2017 Local Profile City of Huntington Beach
Southern California Association of Governments
36
XIII. Methodology SCAG’s Local Profiles utilize the most up-to-date information from a number of publicly available sources, including the U.S. Census Bureau, California Department of Finance, and the California Department of Education. In the event that public information is not available or is not the most recent, SCAG contracts with a number of private entities to obtain regional data. The following sections describe how each data source was compiled to produce the information displayed in this report.
Statistical Summary Table
In the Statistical Summary Table (page 3), the values in the field ‘Jurisdiction Relative to County/Region’ represent the difference between the jurisdiction’s value and the county/region value, except for the following categories which represent the jurisdiction’s value as a share of the county (or in the case of an entire county as a share of the region): Population, Number of Households, Number of Housing Units, Number of Jobs, Total Jobs Change, and K-12 Student Enrollment.
Median Age, Homeownership Rate, and Median Household Income are based on Nielsen Company data. Number of Housing Units is based on the 2010 Census and estimates from the California Department of Finance. Data for all other categories are referenced throughout the report.
Population Section
Where referenced, data from 2000 to 2016 was taken from the California Department of Finance’s (DOF) E-5 estimates, which were published in May 2016. This dataset was benchmarked to population figures from the 2000 and 2010 U.S. Decennial Censuses. Data relating to population by age group and by race/ethnicity was derived from the 2000 and 2010 U.S. Decennial Censuses, and Nielsen Co. The 2000 figure was based on U.S. Decennial Census figures for April 1, 2000 and the 2010 figure was based on U.S. Decennial Census figures for April 1, 2010. Below are definitions for race and ethnicity, as provided by the U.S. Census Bureau. The Hispanic or Latino origin category is: A person of Cuban, Mexican, Puerto Rican, South or Central American, or other Spanish
culture or origin, regardless of race.
The race categories are: American Indian or Alaska Native – A person having origins in any of the original peoples
of North and South America (including Central America), and who maintains tribal affiliation or community attachment.
Asian – A person having origins in any of the original peoples of the Far East, Southeast Asia, or the Indian subcontinent including, for example, Cambodia, China, India, Japan, Korea, Malaysia, Pakistan, the Philippine Islands, Thailand, and Vietnam.
Black or African American – A person having origins in any of the black racial groups of Africa, including those who consider themselves to be "Haitian."

2017 Local Profile City of Huntington Beach
Southern California Association of Governments
37
White – A person having origins in any of the original peoples of Europe, North Africa, or the Middle East.
Some other race – This category includes Native Hawaiian or Other Pacific Islander (a person having origins in any of the original peoples of Hawaii, Guam, Samoa, or other Pacific Islands) and all other responses not included in the "American Indian or Alaska Native," "Asian," "Black or African American," and "White" race categories described above.
Charts for population based on age were tabulated using 2000 and 2010 U.S. Decennial Census data and Nielsen Company data for 2016. Charts for race/ethnicity were tabulated using 2000 and 2010 U.S. Decennial Census data and Nielsen Company data for 2016.
Households Section
The 2000 figure was based on U.S. Decennial Census figures for April 1, 2000 and the 2010 figure was based on U.S. Decennial Census figures for April 1, 2010. Information for 2016 was supplied by the Nielsen Company. Average household size was developed using information from the California Department of Finance (DOF). Households by Size was calculated based on Nielsen Company data. Households refer to the number of occupied housing units.
Housing Section
Housing units are the total number of both vacant and occupied units. Housing units by housing type information was developed using data from the California Department of Finance (DOF). Age of housing stock information was provided by the Nielsen Company. The number of residential units with permits issued was obtained using Construction Industry Research Board data, which are collected by counties and are self-reported by individual jurisdictions. It represents both new single family and new multi-family housing units that were permitted to be built. Please note that SCAG opted to report the annual number of permits issued by each jurisdiction which may be different than the number of housing units completed or constructed annually. This was done using a single data source which provides consistent data for all jurisdictions. The Construction Industry Research Board defines “multi-family housing” to include duplexes, apartments, and condominiums in structures of more than one living unit.
The median home sales price, compiled from CoreLogic/DataQuick, was calculated based on total resales of existing homes in the jurisdiction, including single family units and condominiums. The median price does not reflect the entire universe of housing in the jurisdiction, only those that were sold within the calendar year.
Housing Cost Share refers to the percentage of household income that is devoted to housing expenses. Housing cost share information for homeowners and renters is provided by the U.S. Census American Community Survey.

2017 Local Profile City of Huntington Beach
Southern California Association of Governments
38
Transportation Section
The journey to work data for the year 2000 was obtained by using the 2000 U.S. Decennial Census Summary File 3. Data for 2010 is based on the 2010 U.S. Census American Community Survey. Information for 2016 was provided by the Nielsen Company.
Active Transportation Section
Data sources for county bike lane mileage by facility classification was provided by the six County Transportation Commissions in the SCAG region.
Employment Section
Data sources for estimating jurisdiction employment and wage information include the 2010 U.S. Census Bureau Local Employment Dynamics Survey, and information from the California Employment Development Department, InfoGroup, and SCAG for years 2007-2015. In many instances, employment totals from individual businesses were geocoded and aggregated to the jurisdictional level.
Employment information by industry type is defined by the North American Industry Classification System (NAICS). Although the NAICS provides a great level of detail on industry definitions for all types of businesses in North America, for the purposes of this report, this list of industries has been summarized into the following major areas: agriculture, construction, manufacturing, wholesale, retail, information, finance/insurance/ real estate, professional/management, education/health, leisure/hospitality, public administration, other services, and non-classified industries.
A brief description of each major industry area is provided below:
Agriculture: Includes crop production, animal production and aquaculture, forestry and logging, fishing hunting and trapping, and support activities for agriculture and forestry.
Construction: Includes activities involving the construction of buildings, heavy and civil engineering construction, and specialty trade contractors.
Manufacturing: Includes the processing of raw material into products for trade, such as food manufacturing, apparel manufacturing, wood product manufacturing, petroleum and coal products manufacturing, chemical manufacturing, plastics and rubber products manufacturing, nonmetallic mineral product manufacturing and primary metal manufacturing.
Wholesale: Includes activities that conduct business in the trade of raw materials and durable goods.
Retail: Includes activities engaged in the sale of durable goods directly to consumers.
Information: Includes activities that specialize in the distribution of content through a means of sources, including newspaper, internet, periodicals, books, software, motion pictures, sound recording, radio and television broadcasting, cable or
2017 Local Profile City of Huntington Beach
Southern California Association of Governments
39
subscription programming, telecommunications, data processing/hosting, and other information mediums.
Finance/Insurance/Real Estate: Includes businesses associated with banking, consumer lending, credit intermediation, securities brokerage, commodities exchanges, health/life/medical/title/property/casualty insurance agencies and brokerages, and real estate rental/leasing/sales.
Professional/Management: Includes activities that specialize in professional/ scientific/technical services, management of companies and enterprises, and administrative and support services. Establishment types may include law offices, accounting services, architectural/engineering firms, specialized design services, computer systems design and related services, management consulting firms, scientific research and development services, advertising firms, office administrative services, and facilities support services.
Education/Health: Organizations include elementary and secondary schools, junior colleges, universities, professional schools, technical and trade schools, medical offices, dental offices, outpatient care centers, medical and diagnostic laboratories, hospitals, nursing and residential care facilities, social assistance services, emergency relief services, vocational rehabilitation services, and child day care services.
Leisure/Hospitality: Includes activities involved in the performing arts, spectator sports, museums, amusement/recreation industries, traveler accommodations, and food and drink services.
Public Administration: Includes public sector organizations, such as legislative bodies, public finance institutions, executive and legislative offices, courts, police protection, parole offices, fire protection, correctional institutions, administration of governmental programs, space research and technology, and national security.
Other Services: Includes, for example, automotive repair and maintenance, personal and household goods repair and maintenance, personal laundry services, dry-cleaning and laundry services, religious services, social advocacy organizations, professional organizations, and private households
Non-Classified: All other work activities that are not included in the North American Industry Classification System.
Retail Sales Section
Retail sales data is obtained from the California Board of Equalization, which does not publish individual point-of-sale data. All data is adjusted for inflation.
Education Section Student enrollment data is based on public school campuses that are located within each jurisdiction’s respective boundary. Enrollment numbers by grade within a given jurisdiction are tabulated based upon data obtained from the California Department of Education.

2017 Local Profile City of Huntington Beach
Southern California Association of Governments
40
Enrollment year is based on the end date of the school year; for example, enrollment data for the year 2000 refers to the 1999-2000 school year. City boundaries used in the dataset for all years is based on data provided by the Local Agency Formation Commission for each county in the region.
Public Health Section
Data sources for city and county obesity rates (share of population with a BMI of 30 or higher) and rates of physical activity (share of population that walked a minimum of 150 minutes each day) for the year 2014 was obtained through the California Health Interview Survey (AskCHIS: Neighborhood Edition). Chronic disease incidence rates for 2014 were also obtained through the California Health Interview Survey.
Regional Highlights
Information for this section was developed through data from CoreLogic/DataQuick and the California Board of Equalization.
Data Sources Section
In choosing data sources for use in this report, the following factors were considered:
• Availability for all jurisdictions in the SCAG region • The most recognized source on the subject • Data sources available within the public domain • Data available on an annual basis
The same data sources are used for all Local Profiles (except where noted) to maintain overall reporting consistency. The jurisdictions are not constrained from using other data sources for their planning activities. The preparation of this report has been financed in part through grants from the Federal Highway Administration and Federal Transit Administration, U.S. Department of Transportation, under the Metropolitan Planning Program, Section 104(f) of Title 23, U.S. Code. The contents of this report do not necessarily reflect the official views or policy of the U.S. Department of Transportation. Additional assistance was provided by the California Department of Transportation.

2017 Local Profile City of Huntington Beach
Southern California Association of Governments
41
XIV. Acknowledgments
SCAG Management Hasan Ikhrata, Executive Director Darin Chidsey, Chief Operating Officer Debbie Dillon, Deputy Executive Director, Administration Joann Africa, Chief Counsel/Director, Legal Services Frank Wen, Acting Director, Land Use & Environmental Planning Naresh Amatya, Acting Director, Transportation Planning Basil Panas, Chief Financial Officer Catherine Kirschbaum, Chief Information Officer
Department Manager Ping Chang, Acting Manager, Compliance & Performance Monitoring
Project Manager Michael Gainor, Senior Regional Planner
Project Core Team Anita Au, Assistant Regional Planner John Cho, Associate Regional Planner Jung Seo, Regional Planner Specialist Manish Upadhyay, Senior Application Developer
Reproduction Pat Camacho, Office Services Specialist
Assistance from the following SCAG staff members is also recognized: Rye Baerg, Senior Regional Planner Deshawn Brown, SCAG Intern Diana Chamberlain, Senior Graphics Designer John Chen, SCAG Intern Xi Chen, SCAG Intern Regemralph Corpuz, SCAG Intern Oceann Hai, SCAG Intern Carolyn Hart, Lead Graphics Designer Sarah Jepson, Manager, Active Transportation Matt Kaufman, SCAG Intern Gurpreet Kaur, Programmer Analyst Dylan Lawrence, SCAG Intern Cheol-Ho Lee, Senior Regional Planner Jeff Liu, Manager, Media & Public Affairs Geneive Mendoza, SCAG Intern Tess Rey-Chaput, Clerk of the Board Arnold San Miguel, Public Affairs Officer IV Alan Thompson, Senior Regional Planner Tom Vo, Associate Regional Planner Qiaoyi Yu, SCAG Intern Feiyang Zhang, SCAG Intern Yue Zhau, SCAG Intern Ying Zhou, Program Manager II
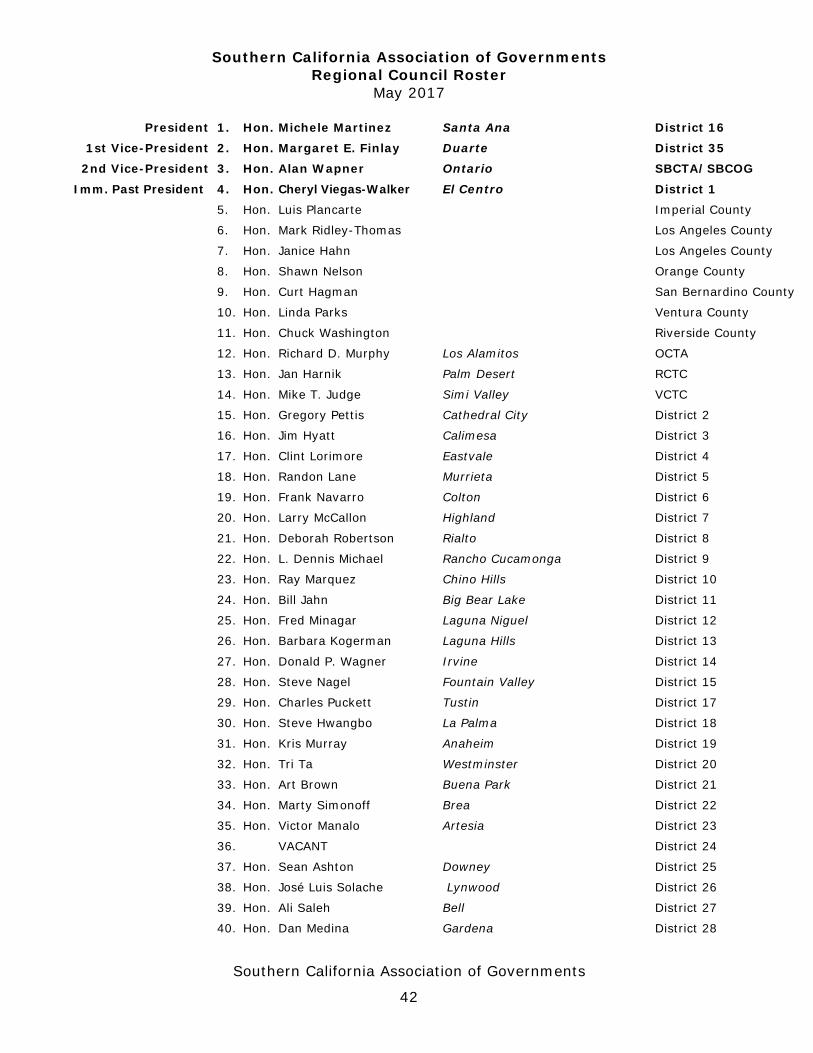
Southern California Association of Governments Regional Council Roster
May 2017
Southern California Association of Governments
42
President 1. Hon. Michele Martinez Santa Ana District 16 1st Vice-President 2. Hon. Margaret E. Finlay Duarte District 35
2nd Vice-President 3. Hon. Alan Wapner Ontario SBCTA/SBCOG
Imm. Past President 4. Hon. Cheryl Viegas-Walker El Centro District 1 5. Hon. Luis Plancarte Imperial County
6. Hon. Mark Ridley-Thomas Los Angeles County
7. Hon. Janice Hahn Los Angeles County
8. Hon. Shawn Nelson Orange County
9. Hon. Curt Hagman San Bernardino County
10. Hon. Linda Parks Ventura County
11. Hon. Chuck Washington Riverside County
12. Hon. Richard D. Murphy Los Alamitos OCTA
13. Hon. Jan Harnik Palm Desert RCTC
14. Hon. Mike T. Judge Simi Valley VCTC
15. Hon. Gregory Pettis Cathedral City District 2
16. Hon. Jim Hyatt Calimesa District 3
17. Hon. Clint Lorimore Eastvale District 4
18. Hon. Randon Lane Murrieta District 5
19. Hon. Frank Navarro Colton District 6
20. Hon. Larry McCallon Highland District 7
21. Hon. Deborah Robertson Rialto District 8
22. Hon. L. Dennis Michael Rancho Cucamonga District 9
23. Hon. Ray Marquez Chino Hills District 10
24. Hon. Bill Jahn Big Bear Lake District 11
25. Hon. Fred Minagar Laguna Niguel District 12
26. Hon. Barbara Kogerman Laguna Hills District 13
27. Hon. Donald P. Wagner Irvine District 14
28. Hon. Steve Nagel Fountain Valley District 15
29. Hon. Charles Puckett Tustin District 17
30. Hon. Steve Hwangbo La Palma District 18
31. Hon. Kris Murray Anaheim District 19
32. Hon. Tri Ta Westminster District 20
33. Hon. Art Brown Buena Park District 21
34. Hon. Marty Simonoff Brea District 22
35. Hon. Victor Manalo Artesia District 23
36. VACANT District 24
37. Hon. Sean Ashton Downey District 25
38. Hon. José Luis Solache Lynwood District 26
39. Hon. Ali Saleh Bell District 27
40. Hon. Dan Medina Gardena District 28

Southern California Association of Governments Regional Council Roster
May 2017
Southern California Association of Governments
43
41. Hon. Rex Richardson Long Beach District 29
42. Hon. Lena Gonzalez Long Beach District 30
43. Hon. Andrew Sarega La Mirada District 31
44. Hon. Margaret Clark Rosemead District 32
45. Hon. Peggy Delach Covina District 33
46. Hon. Barbara Messina Alhambra District 34
47. Hon. Jonathan Curtis La Cañada/Flintridge District 36
48. Hon. Carol Herrera Diamond Bar District 37
49. Hon. Sam Pedroza Claremont District 38
50. Hon. James Gazeley Lomita District 39
51. Hon. Judy Mitchell Rolling Hills Estates District 40
52. Hon. Pam O’Connor Santa Monica District 41
53. Hon. Vartan Gharpetian Glendale District 42
54. Hon. Steven Hofbauer Palmdale District 43
55. Hon. Laura Rosenthal Malibu District 44
56. Hon. Carmen Ramirez Oxnard District 45
57. Hon. Glen Becerra Simi Valley District 46
58. Hon. John Procter Santa Paula District 47
59. Hon. Gilbert Cedillo Los Angeles District 48
60. Hon. Paul Krekorian Los Angeles District 49
61. Hon. Bob Blumenfield Los Angeles District 50
62. Hon. David Ryu Los Angeles District 51
63. Hon. Paul Koretz Los Angeles District 52
64. Hon. Nury Martinez Los Angeles District 53
65. VACANT Los Angeles District 54
66. Hon. Marqueece Harris-Dawson Los Angeles District 55
67. Hon. Curren D. Price, Jr. Los Angeles District 56
68. Hon. Herb J. Wesson, Jr. Los Angeles District 57
69. Hon. Mike Bonin Los Angeles District 58
70. Hon. Mitchell Englander Los Angeles District 59
71. Hon. Mitch O’Farrell Los Angeles District 60
72. Hon. José Huizar Los Angeles District 61
73. Hon. Joe Buscaino Los Angeles District 62
74. Hon. Karen Spiegel Corona District 63
75. Hon. Erik Peterson Huntington Beach District 64
76. Hon. Barb Stanton Apple Valley District 65
77. Hon. Michael Wilson Indio District 66
78. Hon. Antonio Lopez San Fernando District 67
79. Hon. Rusty Bailey Riverside District 68
80. Hon. Jeffrey Giba Moreno Valley District 69

Southern California Association of Governments Regional Council Roster
May 2017
Southern California Association of Governments
44
81. Hon. Ben Benoit Wildomar Air District Representative
82. Hon. Ross Chun Aliso Viejo TCA Representative
83. Hon. Sabrina LeRoy San Manuel Band of Mission Indians
Tribal Government Representative
84. 85.
Mr. Hon.
Randall Lewis Eric Garcetti
Lewis Group of Companies Los Angeles
Business Representative(Member at Large)

Southern California Association of Governments
45
Notes:

SOUTHERN CALIFORNIA ASSOCIATION OF GOVERNMENTS 818 West 7th Street, 12th Floor Los Angeles, CA 90017 T: (213) 236-1800 F: (213) 236-1825 www.scag.ca.gov
REGIONAL OFFICES Imperial County 1405 North Imperial Avenue, Suite 1 El Centro, CA 92243 T: (760) 353-7800 F: (760) 353-1877 Orange County OCTA Building 600 South Main Street, Suite 1233 Orange, CA 92868 T: (714) 542-3687 F: (714) 560-5089 Riverside County 3403 10th Street, Suite 805 Riverside, CA 92501 T: (951) 784-1513 F: (951) 784-3925 San Bernardino County Santa Fe Depot 1170 West 3rd Street, Suite 140 San Bernardino, CA 92418 T: (909) 806-3556 F: (909) 806-3572 Ventura County 950 County Square Drive, Suite 101 Ventura, CA 93003 T: (805) 642-2800 F: (805) 642-2260